Article

Using the Box–Behnken Response Surface Method to Study Parametric Influence to Improve the Efficiency of Helical Gears

1
Department of Machine Design, Faculty of Mechanical Engineering, Ho Chi Minh City University of Technology (HCMUT), Ho Chi Minh City 700000, Vietnam
2
Viet Nam National University Ho Chi Minh City, Linh Trung Ward, Thu Duc District, Ho Chi Minh City 700000, Vietnam
*
Author to whom correspondence should be addressed.
Machines 2021, 9(11), 264; https://doi.org/10.3390/machines9110264
Submission received: 25 September 2021 / Revised: 24 October 2021 / Accepted: 26 October 2021 / Published: 30 October 2021
(This article belongs to the Section Machine Design and Theory)

Abstract

:
Studying gear power loss theoretically and determining the efficiency of a helical gear drive depend on many geometrical and working parameters, such as rotation speed, tooth number, gear ratio, helix angle, and torque, among others. In this paper, the Plackett–Burman screening design and the Box–Behnken response-surface method are used to consider how the above parameters influence gear drive efficiency, and experimental models are provided to evaluate these influences. The present results can be used to select the efficiency when calculating and designing gear transmissions and to choose the parameters for improving gear transmission efficiency.

1. Introduction

Gears are used extensively in many applications, such as automotive, drive trains, industrial gearboxes, and machine tools. They are designed to transmit power and rotation from an input shaft to an output shaft. In this process, some of the power is unavoidably lost because of friction in the system and oil churning. As prime movers, internal combustion engines were the main focus of efficiency improvement efforts in the past. However, now that most of the potential efficiency improvements for such engines have been understood and implemented, the focus on improving efficiency has shifted to the remaining elements of the drive train, such as the gear transmission. Because of continuously increasing petroleum prices, fuel economy is now an important demand. Furthermore, national regulations and environmental pressures have become stricter in terms of emission-related regulations.
For this reason, any improvement in gear transmission efficiency is very important and can reduce fuel consumption and air pollution significantly. As well as these main reasons, improving the efficiency of gear transmissions comes with other benefits. In this respect, because several types of gear failure (e.g., scoring and contact fatigue) are influenced by the heat generated inside the gearbox, more efficient gears would generate less heat, and so their performance in terms of failure resistance would improve. To calculate these losses, one must know the loads in every contributing machine element. A literature review [1,2,3,4,5] indicates that the sources of power loss are divided into load-dependent and load-independent components. The load-dependent power losses are the tooth friction and bearing friction, while the load-independent ones are the friction in the contact seals and the losses due to oil churning, windage, and oil squeezing during gear meshing.
Overall, the gear transmission efficiency is determined by individual components loss or, equally, the power losses of the individual components of the powertrain: gearing losses, bearing losses, sealing losses, synchronizing losses, clutch losses, torque converter losses, and auxiliary units. Gear power losses are strongly related to lubrication. Load-dependent losses are caused by the frictional effects in the lubricant film and load-independent losses are caused by squeezing, churning, and windage effects. In scientific publications, certain values of gear efficiency are often assumed [6]. These values are often based on calculations and simulations and are then used for other calculations. For example, Ref. [7] lists values of gear efficiency from 95–98%; the paper also mentions the values from 86–94% with load values of 5 Nm. Additionally, the paper also cites the thesis of Tehrani, who worked with gearbox efficiency values above 98% in some areas of speed and load. The losses associated with meshing gears are important in the design of many industrial, marine, and gas turbine applications. Gear efficiency varies from 98% to 99% for the best-designed, high-power applications.

2. Gear Power-Loss Analysis and Equations

The gear meshing, windage, and support bearings are the main sources of power loss in a spur–gear system. In the present analysis, it is assumed that the gears are made of steel and are jet lubricated. Furthermore, no oil-churning losses are considered because the gears do not come into contact with the oil in the sump, nor are any secondary losses (e.g., momentum transfer from oil hitting the gear teeth and noise generation) taken into account. The windage and bearing losses can be computed using approximation equations in a simple method.
The efficiency calculation approach used herein is detailed in [8] and is applied to spur gears of typical proportions. In the analysis, the following factors are considered: (i) the sliding losses caused by friction forces created as the teeth slide across each other, (ii) the rolling losses caused by the production of an elastohydrodynamic (EHD) film, and (iii) the windage losses of both gears spinning in an oily environment. By mathematically integrating the instantaneous values of these losses along the contact path, the sliding and rolling losses are computed. The friction coefficient used to quantify the sliding loss is derived from Benedict and Kelly’s disk machine data.
The data from roller test machines, where friction due to sliding and rolling has been observed under various operating conditions, are used to calculate the sliding and rolling power loss. The gear contact in the meshing cycle can be described as a continually changing roller contact, with the size, speed, and load derived from involute gear geometry under the required operating conditions. Many discrete EHD contacts are then used to mimic the gear meshing cycle. To derive an average gear contact power loss, the instantaneous rolling and sliding forces for each contact can be calculated and the results summed along the contact path for the entire meshing cycle.
The abscissa in Figure 1 represents the contact path and serves as a simple coordinate system for computing gear meshing losses. As three sequential pairs of gear teeth come into contact, Figure 1 shows the assumed immediate gear tooth loading. The sites where teeth enter or depart a meshing cycle are indicated by the coordinates on the route of contact. The instantaneous contact point between two mating gear teeth maps out the path of contact, which is actually a line in space with a set inclination (the pressure angle).
The load transmitted between the gears is generally borne by one or two teeth at a certain point during the meshing cycle. The contact ratio refers to the average number of teeth that are engaged in a bite. The tooth loading pattern used in this study is shown in Figure 1. For the majority of the contact route, two teeth share the load. With no profile adjustment, this gear meshing loading is based solely on involute gear geometry. Dynamic loading is not accounted for, but its impact on efficiency is thought to be minor.
The gearbox efficiency η is evaluated as [10]:
η = P o u t P i n = 1 P l o s s P i n ,
where Pout is the gearbox output power, Pin is the gearbox input power, and Ploss is the gearbox power loss. As mentioned above, the total power loss in a gearbox is represented by the sum of all the losses in each gearbox element. According to [6], the total power loss of a gearbox can be calculated as:
P l o s s = P S + P b + P d + P R + P w ,
where PS and PR are the sliding and rolling gear power losses, respectively, due to the friction between the gear flanks; Pd is the no-load gear power loss due to windage, oil churning, and oil squeezing during gear meshing; Pb is the bearing loss, and Pw is the auxiliary loss from other gearbox components (e.g., pumps, fans, heating, clutches and control systems).
The power loss comprises load-independent and load-dependent losses [9,11]. Windage losses [12], churning losses, bearing churning losses, and seal losses are all examples of load-independent losses [13], while the load-dependent losses are the sliding friction loss [10], rolling friction loss, and bearing loss. In the simplified method used in the present study, the following equations are used to calculate load-independent losses such as windage loss, churning loss, and bearing churning loss.

2.1. Windage Loss

The windage power loss can be expressed as [9]:
P w = C 2 ( 1 + 2.3 b R ) n 2.8 R 4.6 ( 0.028 μ 0 + C 3 ) 0.2 ,
where C2 = 2.82 × 10⁷, C3 = 0.019, b and R are the face width and pitch radius [m], n is the rotation speed [rpm], and μ0 is the dynamic viscosity [cP (centipoise)].

2.2. Bearing Churning Loss

The mechanical power loss of a bearing is defined as [14]:
P b = T b ω ,
where Tb is the bearing friction torque [N∙m] and ω is the angular speed [rad/s]. Without a seal, the bearing friction moment of a rolling element bearing can be written as [15]:
T b = T P + T L ,
T P = 0.5 f F d ,
T L = { 10 7 f L ( v n ) 2 / 3 D m 3 ,     v k n > 2000 , 1.6 × 10 5 f L D m 3 ,     v k n < 2000 ,
where Tp is the load-dependent moment in a loaded rolling contact due to rolling and sliding friction, TL is the viscous part of the bearing friction torque, d is the bearing bore diameter [mm], f is the bearing coefficient of friction, F is the bearing load [N], fL is a factor that varies based on the bearing type and lubrication method, n is the bearing speed [rpm], Dm is the bearing mean diameter [mm], and v is the lubricant kinematic viscosity [cm2/s].

2.3. Churning Loss

The expression for the churning loss Pd is divided into three parts as shown below [16]:
P d = P d t + P d b + P d r ,
where the churning loss Pdt for smooth outside diameters [16] is:
P d t = 7.37 f g v n 3 d 4.7 L A g 10 26 ,
The churning loss Pdb for smooth-sided discs [16] is:
P d b = 1.474 f g v n 3 d 5.7 A g 10 26 ,
The churning loss Pdr for tooth surfaces [16] is:
P d r = 7.37 f g v n 3 d 4.7 b ( R f t a n β ) A g 10 26 ,
where v is the kinematic viscosity at the operating temperature, Rf is a roughness factor, β is the gear helix angle, Ag = 0.2 is the arrangement factor, n is the rotation speed [rpm], L is the length of the element immersed in oil, and fg is the dip factor (fg = 0 if the gear is not dipped in oil; fg = 1 if it is fully dipped in oil).

2.4. Meshing Losses

Various approaches can be used to determine the sliding and rolling losses [10,11]. The meshing losses were computed by numerically integrating the sliding and rolling losses throughout the contact path in the following load-dependent loss calculation using the complex approach [8]:
{ P S = ( P S ( l 1 ) + P S ( l 2 ) ) l 3 + P S ( l 4 ) 2 l 5 l 6 , P R = ( P R ( l 1 ) + P R ( l 2 ) ) l 3 + P R ( X P ) l 5 l 6 ,
Calculating the sliding power loss PS and the rolling power loss PR requires six additional lengths along the contact path [8]:
{ l 1 = X 1 + X 2 2 , l 2 = X 3 + X 4 2 , l 3 = X 4 X 3 + X 2 X 1 , l 4 = X 2 , l 5 = X 3 X 2 , l 6 = X 4 X 1 ,
The instantaneous sliding and rolling power losses can be expressed as sliding and rolling power losses [8]:
{ P S ( x ) = C 3 V S ( x ) F S ( x ) ,     P R ( x ) = C 3 V T ( x ) F R ( x ) ,
where C3 = 103.
The instantaneous frictional force caused by two gear teeth sliding against each other is a sliding force [8]:
F S ( x ) = μ ( x ) F ( x ) ,
μ ( x ) = 0.0127 log C 1 F ( x ) b μ 0 V S ( x ) V T 2 ( x ) ,
where μ(x) is the friction coefficient used to quantify sliding loss and is derived from Benedict and Kelly’s disk machine data, and F(x) is the tooth normal load [N].
The instantaneous force due to the build-up of the EHD film is a rolling force [8]:
F R ( x ) = C 2 h ( x ) φ t ( x ) b ,
h ( x ) = 2.05 × 10 7 [ V T ( x ) μ 0 ] 0.67 [ F ( x ) ] 0.067 [ R e q ( x ) ] 0.464 ,
where C2 = 9 × 10⁷, h(x) is the gear contact film thickness calculated using the method of Hamrock and Dowson, φt(x) is a thermal reduction factor used to limit h(x) at high speeds, and Req(x) is two equivalent radii of curvature in contact, which can approximate the gear contact. The equivalent radius of curvature varies with the contact path and is calculated as [8]:
{ R 01 = d 2 sin α w 2 + | X X P | , R 02 = d 1 sin α w 2 | X X P | R e q ( x ) = R 01 R 02 R 01 + R 02 , ,

2.5. Rolling and Sliding Velocities

The difference in surface velocity between the two gears at the point of contact is the sliding velocity, which changes direction at the pitch point and varies along the contact route. We eliminated the change of the sign by obtaining the absolute value of XXp because we were only concerned about the magnitude of the sliding velocity.
The rolling and sliding velocities as defined in the Benedict and Kelley friction coefficient [8]:
{ V S ( x ) = 0.1047 ( 1 + u ) n | X X p | 10 3 u ,   V T ( x ) = 0.1047 n d 1 ( sin α | X X P | ( u 1 ) d 2 ) ,
where X is the path of contact and is a line drawn in space by the point of contact between two mesh gears. For the involute gear geometry, the contact route is a straight line from X1 to X4 and Xp, representing the following sequence of events: X1 is the start of the meshing cycle, when two teeth share the load, X2 is the start of single-tooth contact, X3 is the end of single-tooth contact, X4 is the end of the meshing cycle, and Xp is the pitch point [8]:
{ X A = d 1 + d 2 2 sin α w , X 1 = X A 0.5 d a 2 2 d b 2 2 , X 3 = X 1 + p b X 4 = 0.5 d a 1 2 d a 2 2 , X 2 = X 4 p b , X P = d 1 2 sin α w = X 4 d 2 2 sin α w ,
Consequently, we can calculate the gear efficiency using the above formulas. The geometrical and working parameters that influence gear efficiency are as follows:
  • the lubricant absolute viscosity η, dynamic viscosity μ, and kinematic viscosity v, which remain constant;
  • the geometrical parameters da1, da2, db1, db2, etc., calculated from the specified quantities;
  • the numbers z1 and z2 of teeth, the normal pressure angle α, the helix angle β, the gear ratio u, the module m, the normal force F exerted on the teeth, the torque T, and the rotation speed n, all of which are changeable parameters.
Of these parameters, it was found that (i) rotation speed n, (ii) tooth number z, (iii) gear ratio u, (iv) helix angle β, (v) pressure angle α, (vi) module m and (vii) torque T had significant effects on efficiency, and these seven factors were used for the subsequent research and optimization.

3. Design of Experiments

The gear efficiency is determined via the various geometrical and working parameters of the gears.

3.1. Screening Design

The Plackett–Burman design (PBD) is a saturated orthogonal experimental design built with all the experimental numbers N that are multiples of four, e.g., N = 8, 12, 16, 20, 24, 32, and 36. The corresponding maximum number of variable factors is 7, 11, 15, 19, 23, 31, and 35, respectively [17].
Herein, we use the PBD method with N = 12 to evaluate seven factors: (i) tooth number z1, (ii) gear ratio, (iii) helix angle, (iv) torque, (v) pressure angle, (vi) module, and (vii) rotation speed. The levels of these factors are given in Table 1, and the design matrix and experimental calculation results of the 12 experiments are given in Table 2.
After processing the experimental results in the Minitab software, we obtained the following regression equation in coded units:
µ = 95.996 − 0.053x1 + 0.430x2 + 0.294x3 + 0.466x4 + 0.111x5 − 0.247x6 + 0.500x7.
According to the PBD experiment, the most influential elements on gear efficiency μ were torque T (x7), helix angle β (x4), gear ratio u (x2), and tooth number z (x3). These parameters should be explored further using full fractional designs and more advanced methods such as response surface methods, if necessary. In the next stage of experimentation, one should analyze the interactions between the torque T, tooth number z, gear ratio u, and helix angle β, while setting the unimportant factors at their most economical levels.

3.2. Box–Behnken Design

Response surface methods are used when a precise description of the relationship between the objective function and the experimental parameters is required. Their goal is to increase the number of experimental points to create a quadratic model that describes the objective function. Practical experience shows that the quadratic function is sufficiently accurate to characterize the objective functions in optimization problems with narrow-bounded regions between the experimental levels.
The methods for quadratic experimental design include a face-centered, central composite design (FCCCD); Box–Wilson (rotatable central composite design—RCCD); Box–Hunter (central composite orthogonal design—CCOD), and Box–Behnken [18]. Herein, we use Box–Behnken, and the design matrix and experimental results are presented in Table 3. When analyzing an experiment, we fixed the rotation speed as n = 200 rpm, the normal pressure angle as αw = 20°, and the module as m = 2.5 mm.
The regression equation can be written as:
µ = 85.0307 + 2.3495 u + 0.5125 z 1 + 0.0298 β 0.0281 T 0.2895 u 2 0.0068 z 1 2 + 0.0007 β 2 0.0004 T 2 0.024 u z 1 0.0029 u β + 0.0028 u T 0.0011 z 1 β + 0.0016 z 1 T + 0.0002 β T ,
To test the regression fit, we used an analysis of variance (ANOVA) to calculate the significance of regression or the R-square (99.68%) (Table 4). With ANOVA, the regression model is assumed to fit well if the calculated value of the F-ratio of the developed model does not exceed the standard tabulated value of the F-ratio for a desired confidence level.

3.3. Highest and Lowest Gear Efficiencies

From the above results (Equation (23)), we find that the highest gear efficiency is 0.975252 when the ratio is u = 2.8182, the number of teeth is z1 = 30, the helix angle is β = 30°, and the torque is T = 32 N∙m; the lowest gear efficiency is 0.939146 when the ratio is u = 1, the number of teeth is z1 = 20, the helix angle is β = 0, and the torque is T = 32 N∙m.
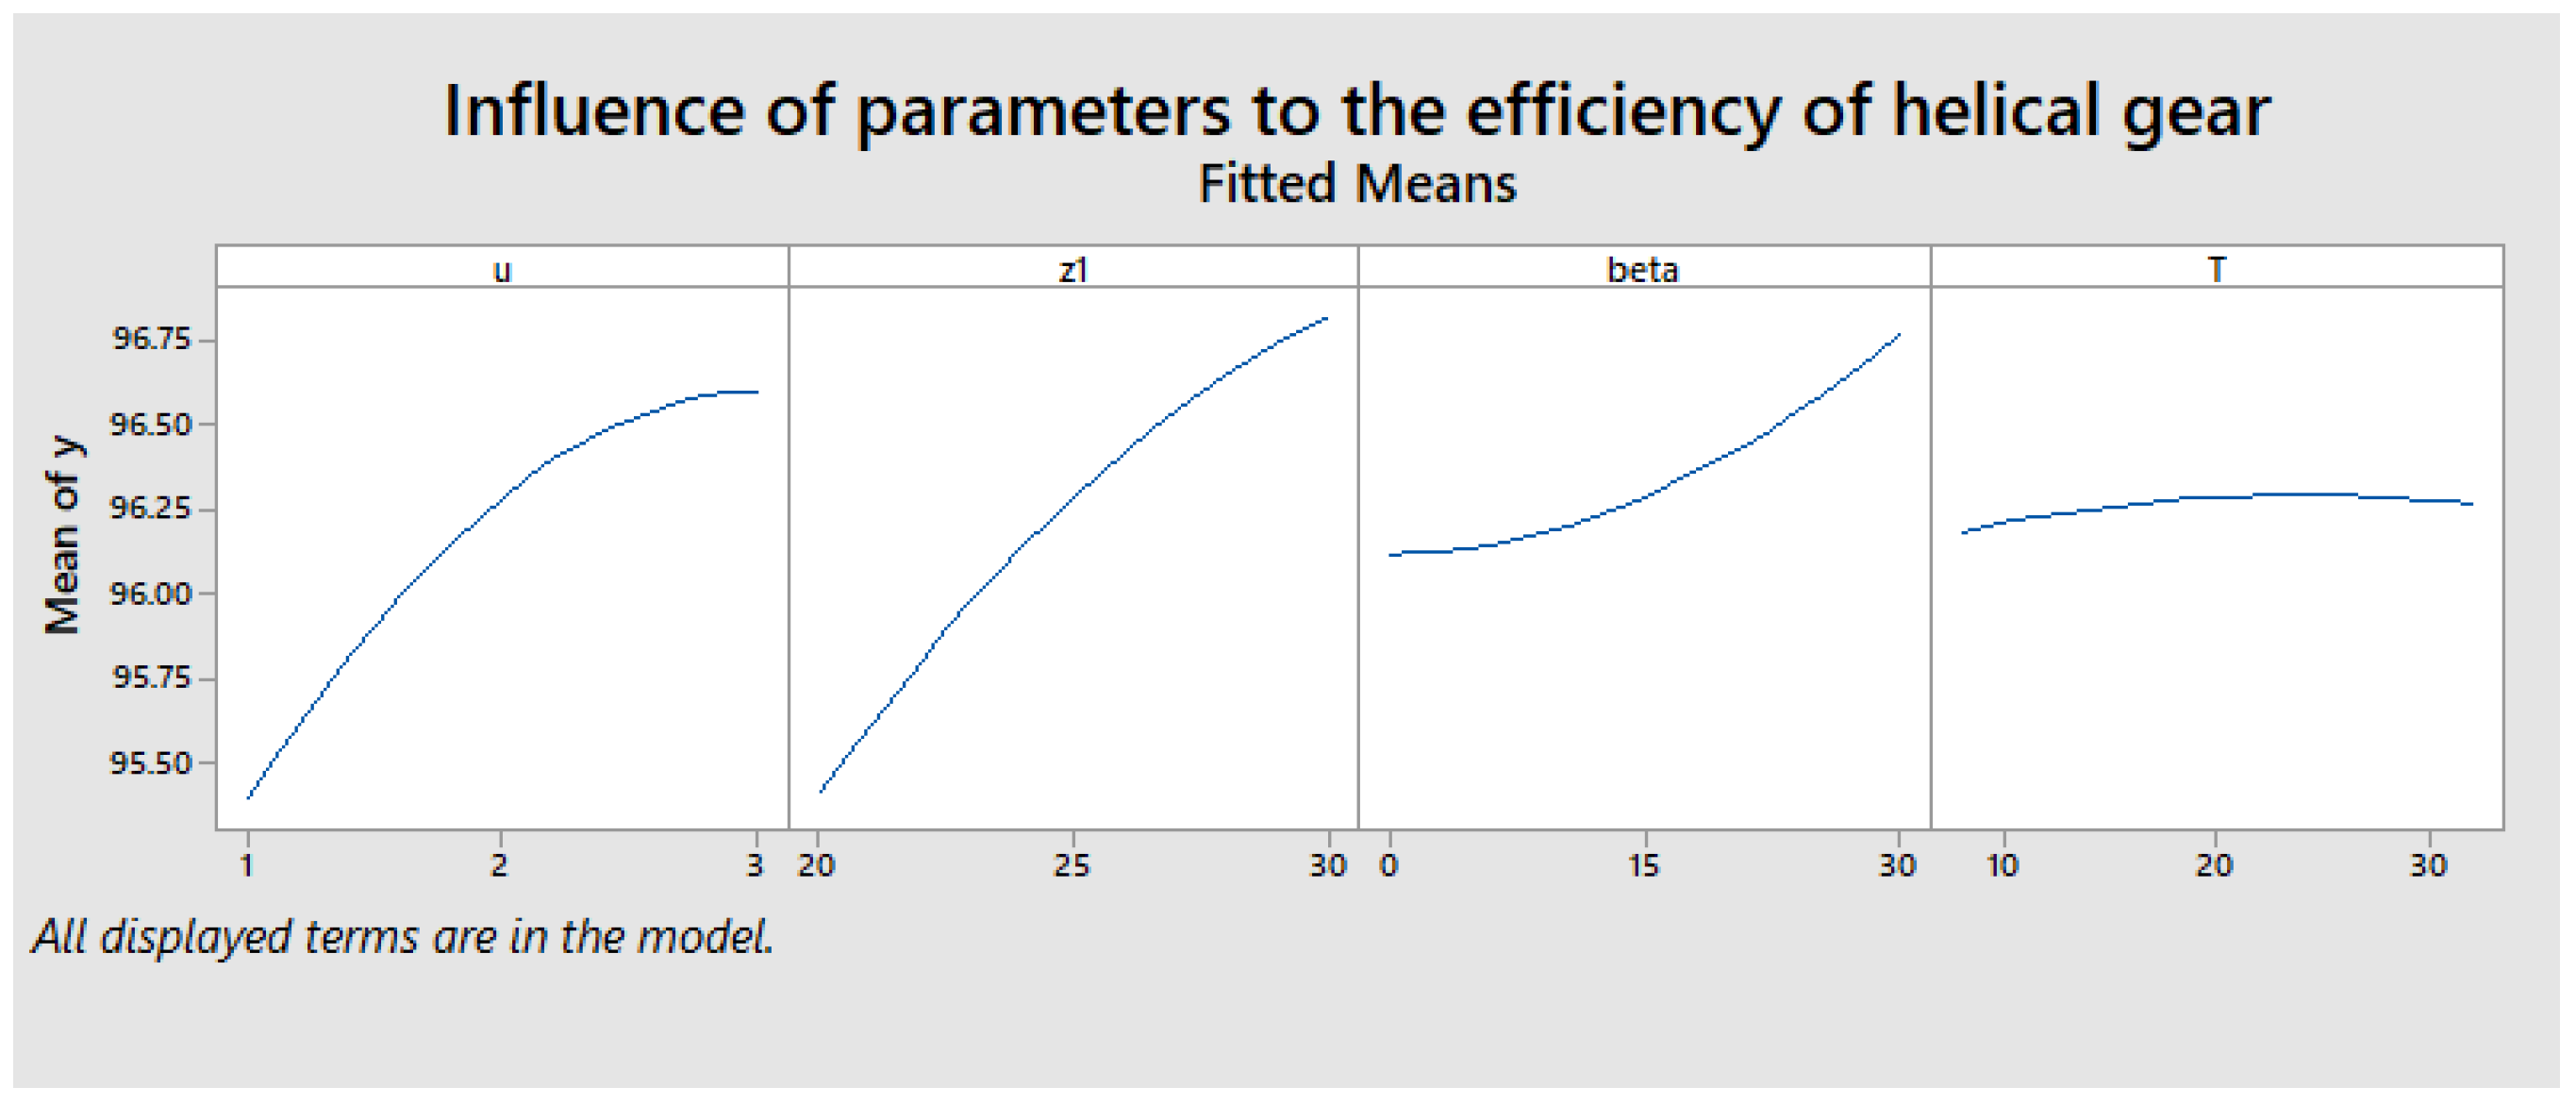
In Figure 2, the factors that most affect the efficiency of the helical gear drive are the ratio u, the number of teeth z1, followed by the helix angle β and the torque T that have little effect on efficiency.
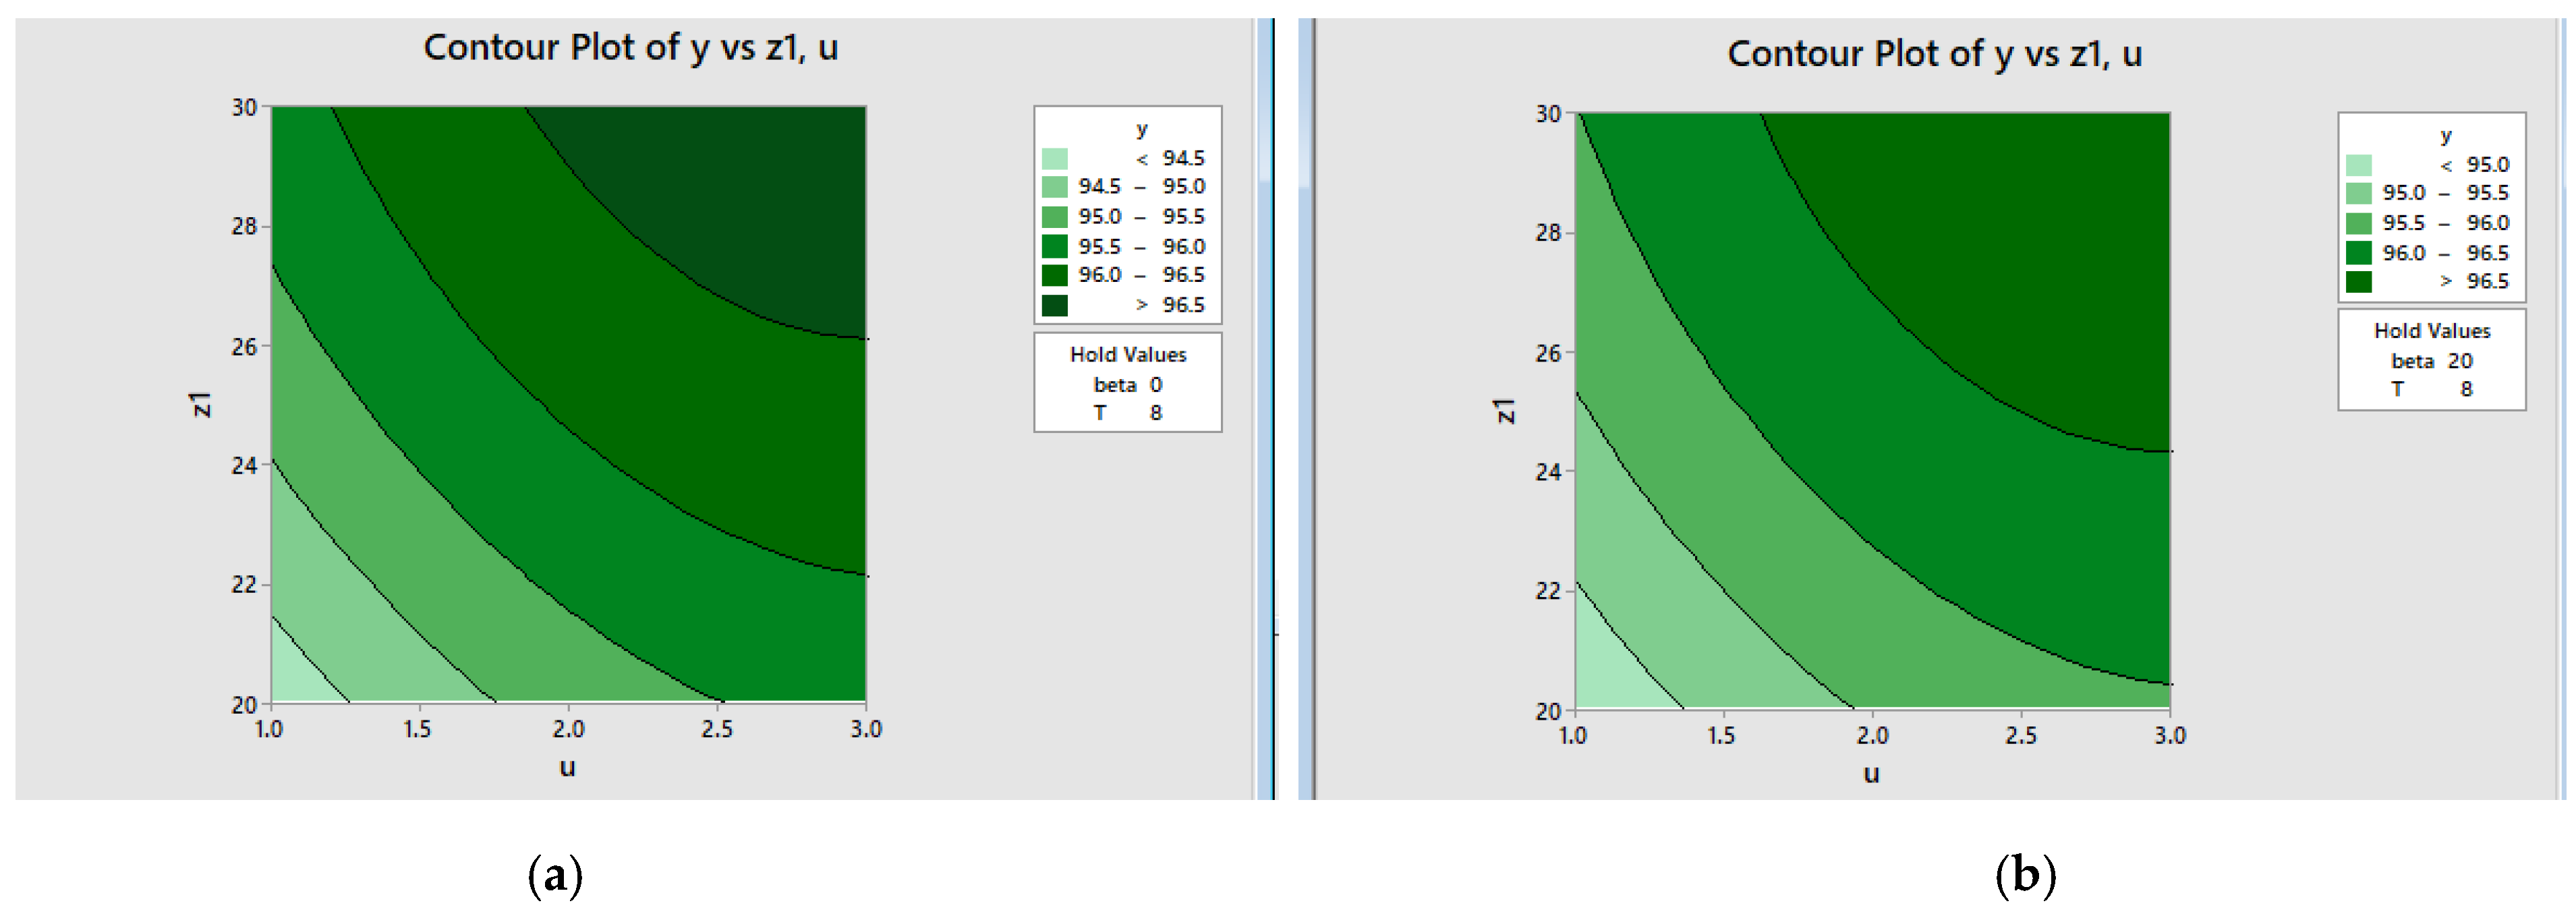
From Equation (23) we can draw contour plots (Figure 3) to select the values of factors such as the gear ratio u, the number of teeth z1, the helix angle so that the efficiency has the desired value.

4. Results and Discussion

4.1. Lookup Tables for Gear Ratio u and Gear Efficiency η

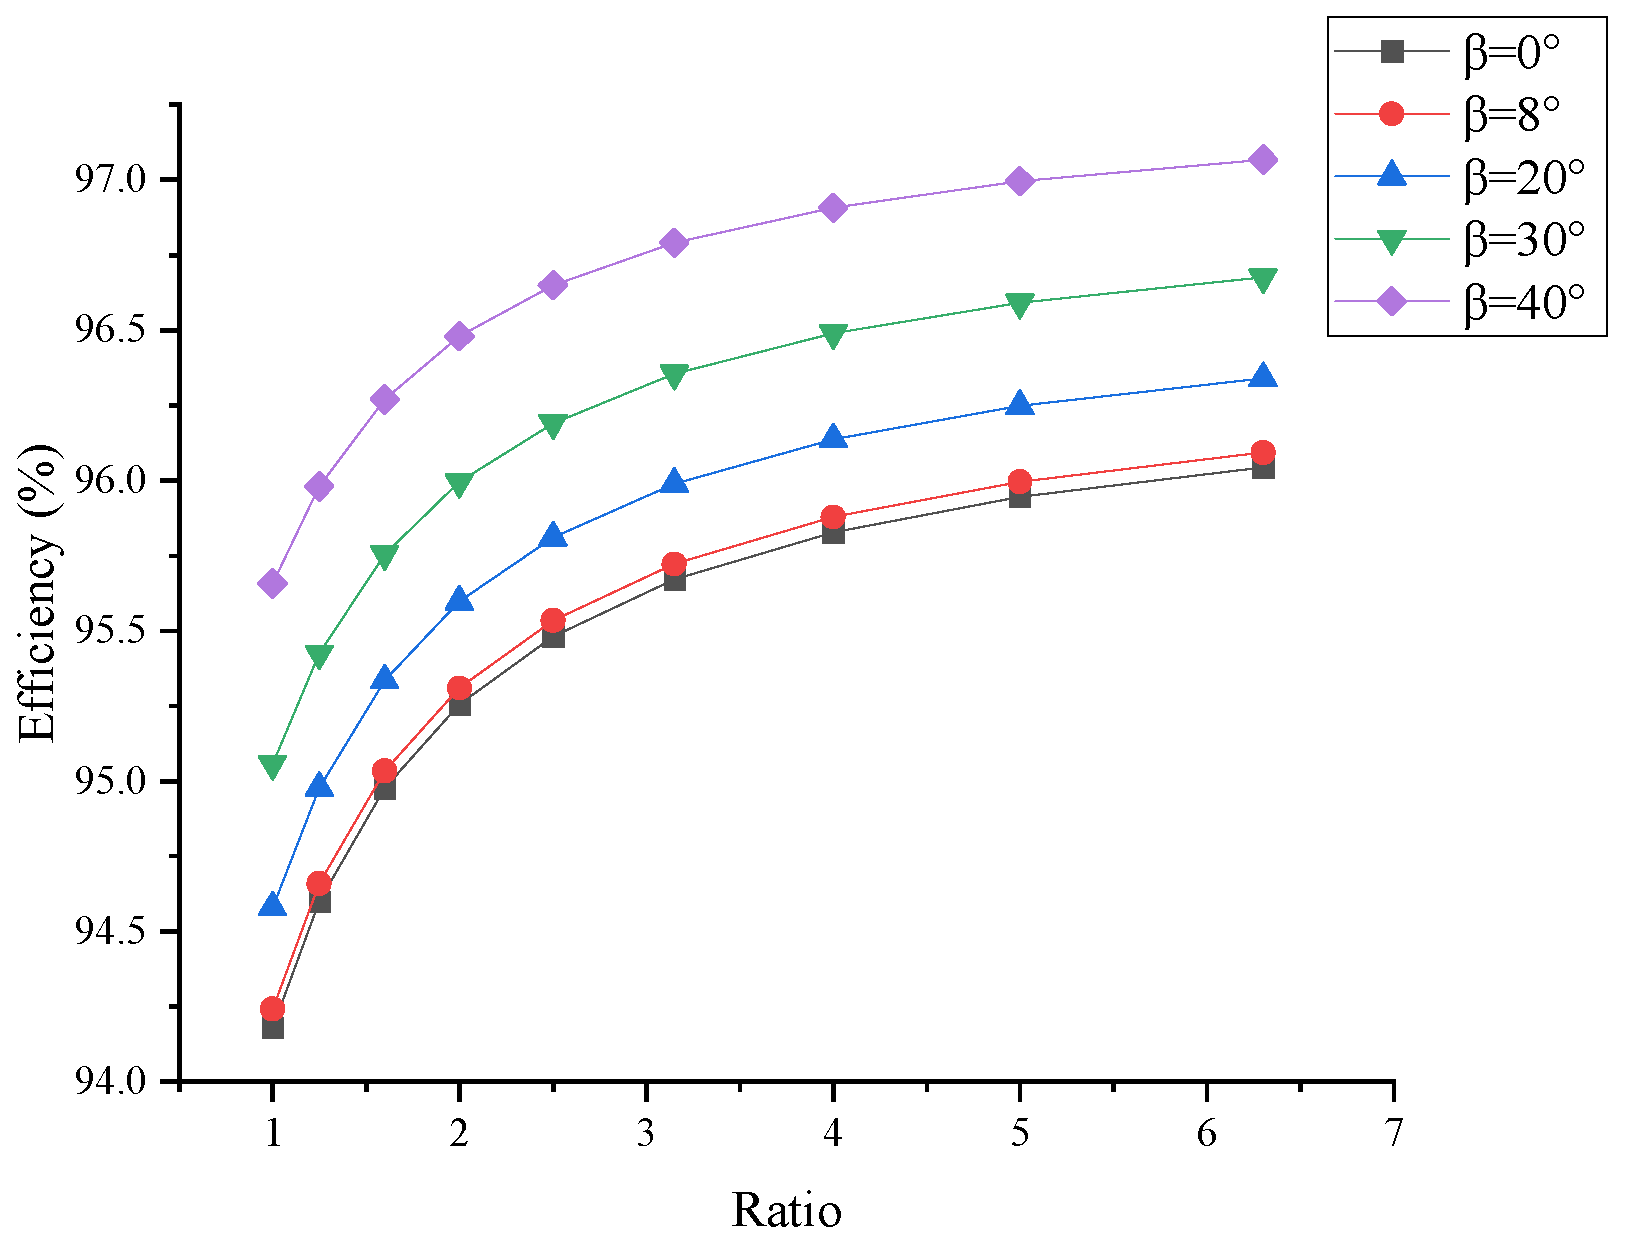
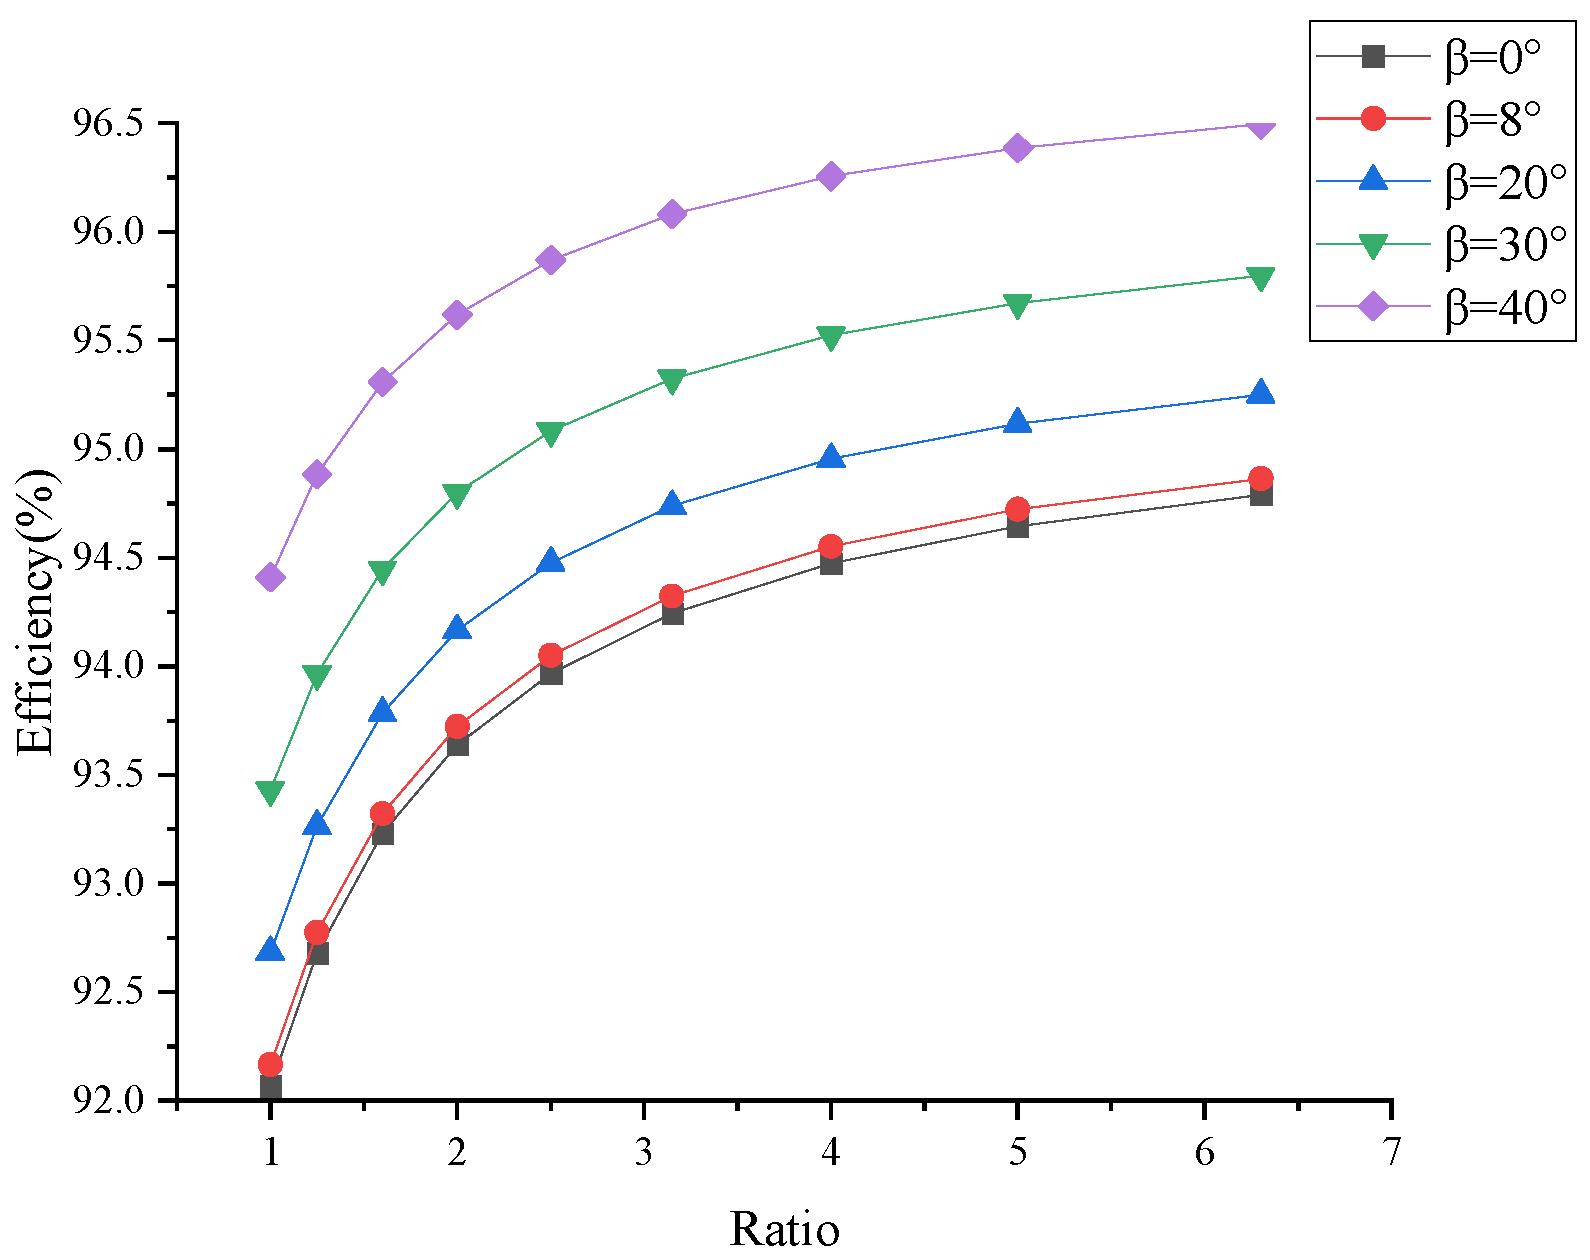
In the process of machine design, the gear drive efficiency η is chosen based on the gear ratio u. From the research results, lookup tables for the gear ratio u and gear efficiency η with a varying helix angle β are given in this section for both lubricated and non-lubricated gears (Table 5 and Table 6). The initial values of the parameters are a rotation speed of n = 200 rpm, a normal pressure angle of αw = 20°, a module of m = 2.5 mm, and a torque of T = 8 N∙m, Figure 4 and Figure 5.
Through the design of the experiment and optimization, we can determine the optimal set of parameters and their influences on gear efficiency. The goal of the PBD experiment was to establish which factors have the most influence on gear efficiency. The most important factors would then be investigated further using response-surface methods, such as the Box–Behnken design, to build a second-order regression equation in order to find the optimal set of parameters for gear efficiency.

4.2. Experimental Verification

We used the measurement model and instruments in Figure 6 for the experimental study. As illustrated, the model (1) consists of an electric motor, a torque sensor (3), gears and a coupling. The measurement model has two pairs of gears, a torque sensor is installed in the system’s input shaft, a variable-speed electric motor drives the entire system and digital indicator (2). In one of the couplings, the two gears are divided into two parts for coupling with no relative movement between the two halves when working.
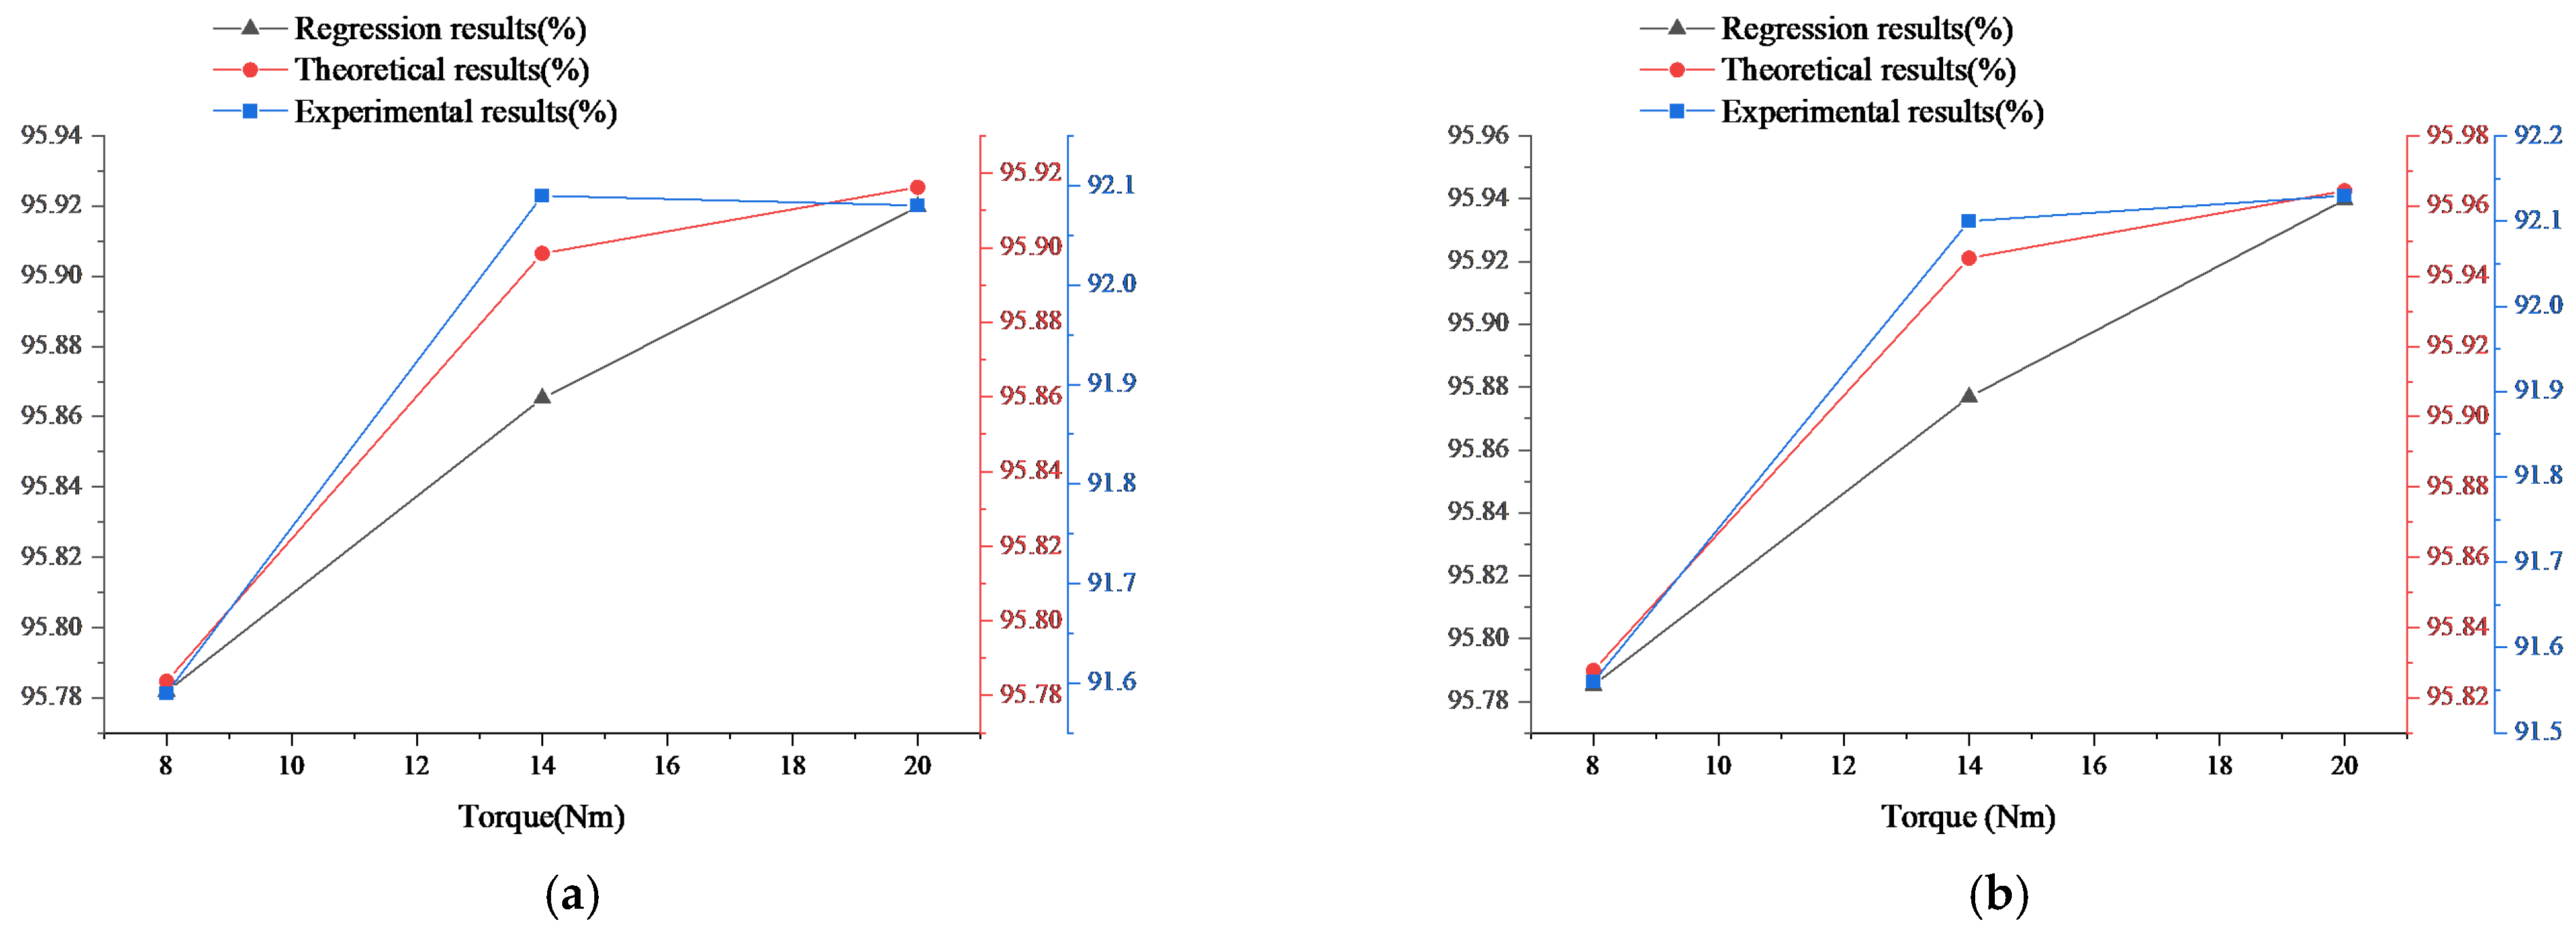
The experiments were performed with two different sets of gears, and three different load levels for each set of gears, and six rolling bearings and two sets of meshing gears contributed to the gear efficiency. The results of the experiments with n = 3 repetitions are given in Table 7 and Table 8 with three different columns, Figure 7.

4.3. Comparison of Experimental and Theoretical Regression Model Results

The experimental results contain errors when compared to the theoretical calculation results, and those errors are due to the following factors:
  • errors in size, parallelism, perpendicularity, concentricity, and other aspects during manufacturing;
  • assembly errors when putting parts together;
  • there are many calculation steps in the theoretical calculation process, and rounding at each step generates discrepancies in the theoretical calculation results;
  • the torque is generated by weights, and the torque value is inaccurate;
The experimental method entails numerous steps, the experimenter’s actions can lead to inaccuracies in the results.

5. Conclusions

In this paper, a theory on the efficiency of helical spur gears is studied, using the experimental planning method, PBD, to select the factors that most affect efficiency, then by using the experimental planning method, Box–Behnken, to determine the influence of factors on the efficiency and selecting the parameter value to achieve the highest efficiency. According to the PBD and BBD experiments, the most influential elements on gear efficiency μ are the ratio u, the number of teeth z1, followed by the helix angle β and the torque T, which have little effect on efficiency (Figure 2). The present results can potentially be an alternative to experimental verification with a scope to improve productivity, increase flexibility and decreasing capital expenses.
According to the tables of data on lubricating gear efficiency, the theoretical findings demonstrate a good correlation. The sliding friction losses are clearly load-dependent, increasing with the load. However, when the load increased, the rolling friction losses dropped marginally because of a reduction in the oil film thickness. The theoretical results for gears engaged in the air were compatible with the data from the open-gear lookup table, albeit with less than a 5% difference between the theoretical and experimental results due to manufacturing flaws.
To ensure maximum efficiency, the results of this study should be used to choose (i) the gear efficiency when designing the transmission system and machine and for (ii) selecting the reasonable parameters, gear ratio u, number of teeth z1 and helix angle, to increase gear efficiency.
Future studies should focus on the effect of the tooth profile on the efficiency and influence of the working and geometrical parameters of gear transmission vibration.

Author Contributions

H.L.N. and L.T.D. contributed equally to the conceptualization, methodology, and writing of the paper. All authors have read and agreed to the published version of the manuscript.

Funding

This research received no external funding.

Institutional Review Board Statement

Not applicable.

Informed Consent Statement

Not applicable.

Data Availability Statement

The data used to support the findings of this study are available from the corresponding author upon request.

Acknowledgments

We acknowledge the support of time and facilities from Ho Chi Minh City University of Technology (HCMUT), VNU-HCM for this study.

Conflicts of Interest

The authors declare that they have no conflict of interest.

References

  1. Dudley, D.W. Gear Handbook: The Design, Manufacture and Application of Gears, 1st ed.; McGraw-Hill Book Company: New York, NY, USA, 1962; pp. 14.1–14.52. [Google Scholar]
  2. Fernandes, C.M.C.G.; Marques, P.M.T.; Martins, R.C.; Seabra, J.H.O. Influence of gear loss factor on the power loss prediction. Mech. Sci. 2015, 6, 81–88. [Google Scholar] [CrossRef] [Green Version]
  3. Hohn, B.-R.; Michaelis, K.; Hinterstoisser, M. Influence factors on gearbox power loss. In Proceedings of the 3rd International Conference on Integrity, Reliability and Failure, Porto, Portugal, 20–24 July 2009. [Google Scholar]
  4. Anderson, M. An Experimental Investigation of Spur Gear Efficiency and Temperature. Ph.D. Thesis, Royal Institute of Technology, Stockholm, Sweden, 2017. [Google Scholar]
  5. Vaidyanathan, A. An Experimental Investigation of Helical Gear Efficiency. Master’s Thesis, Ohio State University, Columbus, OH, USA, 2009. [Google Scholar]
  6. Guan, D.; Jing, L.; Han, X.; Wang, L.; Gong, J. Theoretical modeling and numerical simulation of dynamic contact characteristics of a spherical pump with variable friction coefficient. Proc. Inst. Mech. Eng. Part. J J. Eng. Tribol. 2021, 2021, 13506501211016201. [Google Scholar]
  7. Bashta, O.; Nosko, P.; Nosko, P.; Boyko, G.; Golovin, A.; Stebeletska, N. Power losses of gear systems. Probl. Frict. Wear 2017, 4, 107–116. [Google Scholar]
  8. Anderson, N.E.; Loewenthal, S.H.; Black, J.D. Spur-Gear-System Efficiency at Part and Full Load; NASA Technical Paper; NASA: Washington DC, WA, USA, 1980. [Google Scholar]
  9. Ziegltrum, A.; Lohner, T.; Stahl, K. TEHL Simulation on the Influence of Lubricants on Load-Dependent Gear Losses. Tribiol. Int. 2016, 113, 252–261. [Google Scholar] [CrossRef]
  10. Wang, C.; Shi, Z. A dynamic calculation method of sliding friction losses for a helical gear pair. J. Braz. Soc. Mech. Sci. Eng. 2016, 39, 1521–1528. [Google Scholar] [CrossRef]
  11. Jurkschat, T.; Lohner, T.; Stahl, K. Improved calculation method for load-dependent gear losses. Forsch Ing. 2017, 81, 109–115. [Google Scholar] [CrossRef]
  12. Voeltzel, N.; Marchesse, Y.; Changenet, C.; Ville, F.; Velex, P. On the influence of helix angle and face width on gear windage losses. Proc. IMechE Part. C J. Mech. Eng. Sci. 2016, 230, 1101–1112. [Google Scholar] [CrossRef]
  13. Jurkschat, T.; Lohner, T.; Stahl, K. Improved calculation of load-dependent gear losses by consideration of so far disregarded influences. Proc. IMechE Part. J J. Eng. Tribol. 2018, 233, 509–519. [Google Scholar] [CrossRef]
  14. Zeng, Q.-L.; Sun, Z.Y.; Wan, L.R.; Yang, Y.; Dai, H.Z.; Yang, Z.K. Research and comparative analysis of flow field characteristics and load-independent power losses of internal and external gear pairs. Math. Probl. Eng. 2020, 2020, 8860588. [Google Scholar] [CrossRef]
  15. Kahraman, A.; Houser, D.R.; Xu, H. Development of a Generalized Mechanical Efficiency Prediction Methodology for Gear Pairs. Ph.D. Thesis, Ohio State University, Columbus, OH, USA, 2005. [Google Scholar]
  16. Heingartner, P.; Mba, D. Determining power losses in the helical gear mesh. Gear Technol. 2015, 22, 32–37. [Google Scholar]
  17. Nguyen, H.L. Design and Analysis of Experiments, 1st ed.; Publishing House, Vietnam National University: Ho Chi Minh City, Vietnam, 2020. [Google Scholar]
  18. Loc, N.H.; Hung, N.P. Utilizing response surface methods designs for optimization of technological parameters on the vibration amplitude of cnc router spindle. ASEAN Eng. J. 2021, 11, 34–44. [Google Scholar] [CrossRef]
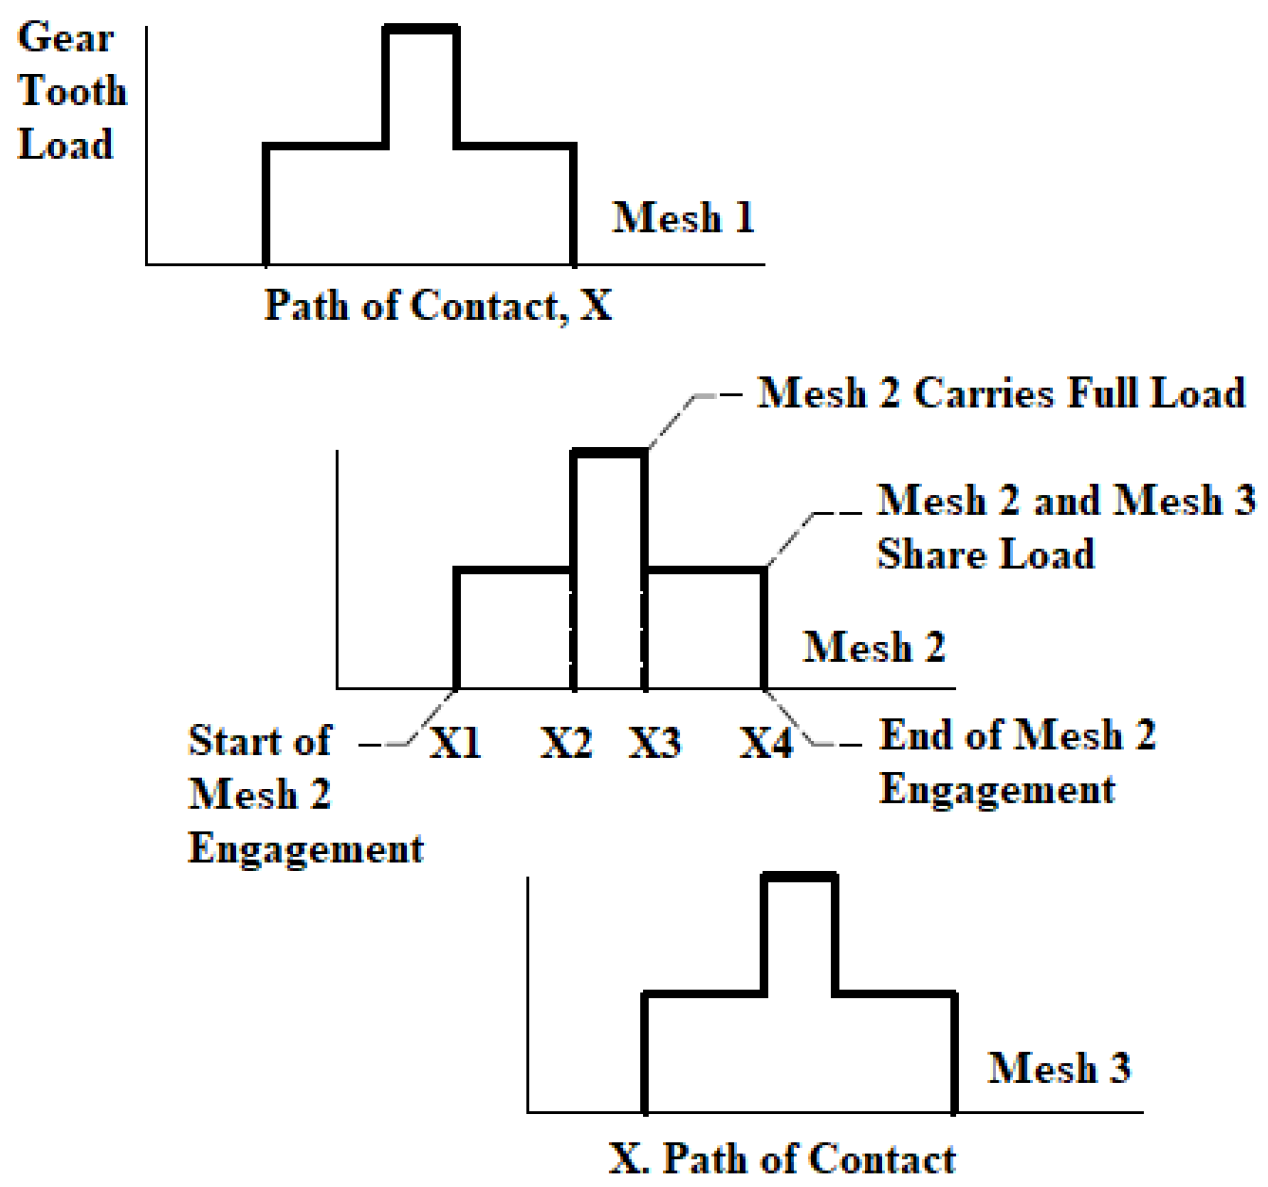
Figure 1. Tooth load-sharing diagram [9].
Machines 09 00264 g001
Figure 2. Influence of parameters to the efficiency of helical gear.
Machines 09 00264 g002
Figure 3. Contour plots of the efficiency of helical gear dependent on ratio u and number of teeth z1: (a) gear data: β = 0 and T = 8 N∙m; (b) gear data: β = 20° and T = 8 N∙m.
Machines 09 00264 g003
Figure 4. Gear efficiency versus gear ratio for lubricated gears.
Machines 09 00264 g004
Figure 5. Gear efficiency versus gear ratio for non-lubricated gears.
Machines 09 00264 g005
Figure 6. The measurement model and instruments: (1) General view of the test bench; (2) Digital Indicator DN–50W; (3) Torque sensor TCN.
Machines 09 00264 g006
Figure 7. Results and comparison with other methods: (a) gear data: z1 = 30, u = 1, αw = 20°, m = 2.5 mm, bw = 24 mm, n = 200 rpm, β = 0°, Ra = 1.6 µm.; (b) gear data: z1 = 20, u = 2, αw = 20°, m = 2.5 mm, bw = 24 mm, n = 200 rpm, β = 0°, Ra = 1.6 µm.
Machines 09 00264 g007
Table 1. Initial levels of factors influencing gear efficiency.
Level
NFactorUnitSymbolCode−10+1
1Rotation speedrpmnx1200400600
2Gear ratio-ux2123
3Tooth number-z1x3202530
4Helix angle°βx401530
5Normal pressure angle°αx5202530
6Modulemmmx622.53
7TorqueN∙mTx782032
Table 2. Design matrix of Plackett–Burman design.
CodedUncoded
Nx1x2x3x4x5x6x7nuz1βαmTEfficiency
1+1−1+1−1−1−1+160013002023296.2245
2+1+1−1+1−1−1−160032030202896.5375
3−1+1+1−1+1−1−12003300302896.9777
4+1−1+1+1−1+1−160013030203895.4477
5+1+1−1+1+1−1+1600320303023297.0477
6+1+1+1−1+1+1−16003300303894.7501
7−1+1+1+1−1+1+1200330302033297.5257
8−1−1+1+1+1−1+1200130303023296.8106
9−1−1−1+1+1+1−120012030303895.4031
10+1−1−1−1+1+1+160012003033295.6499
11−1+1−1−1−1+1+120032002033295.7151
12−1−1−1−1−1−1−12001200202893.8570
Table 3. Design matrix and experimental results.
CodeUncodeEfficiency
with
Lubrication
FITSRESI1
Nx1x2x3x4uz1βT
1−1−100120152094.295894.3992−0.103402
2+1−100320152095.796995.8505−0.053582
3−1+100130152096.075596.04180.033658
4+1+100330152097.097697.01410.083479
500−1−12250896.053096.0562−0.003234
600+1−122530896.572496.6252−0.052775
700−1+122503296.088596.05570.032851
800+1+1225303296.769196.7858−0.016690
9−100−112515895.357095.32300.033981
10+100−132515896.484796.46700.017758
11−100+1125153295.330395.3352−0.004909
12+100+1325153296.593796.6148−0.021132
130−1−1022002095.190495.16270.027651
140+1−1023002096.701096.7319−0.030912
150−1+10220302096.022195.97830.043762
160+1+10230302097.200697.2154−0.014802
17−10−1012502095.181695.17800.003620
18+10−1032502096.446996.4769−0.029977
19−10+10125302095.951795.91460.037051
20+10+10325302097.042897.03930.003454
210−10−122015895.449195.40770.041383
220+10−123015896.585096.6221−0.037114
230−10+1220153295.343295.29900.044188
240+10+1230153296.856696.8909−0.034309
250000225152096.285596.28550.000000
260000225152096.285596.28550.000000
270000225152096.285596.28550.000000
Table 4. Regression analysis results based on Box–Behnken design method.
TermCoef.SE Coef.TP
Constant85.03070.804593105.6820.000
u2.34960.18539112.6740.000
z10.51250.0527199.7220.000
β0.02980.0114222.6110.023
T−0.02810.014983−1.8720.086
u2−0.28950.025040−11.5610.000
z12−0.00680.001002−6.7720.000
β20.00070.0001116.2390.000
T2−0.00040.000174−2.4340.031
uz1−0.02400.005783−4.1420.001
−0.00290.001928−1.5060.158
uT0.00280.0024101.1730.264
z1β−0.00110.000386−2.8710.014
z1T0.00160.0004823.2630.007
βT0.00020.0001611.3940.189
Model summarySR-sq.R-sq. (adj.)R-sq. (pred.)
0.057828699.68%99.32%98.18%
Table 5. Lookup table for gear ratio and efficiency (with lubrication).
βRatio
11.251.622.53.15456.3
0094.1894.6094.9895.2695.4895.6795.8395.9596.04
8094.2494.6695.0395.3195.5395.7295.8896.0096.09
20094.5894.9895.3495.6095.8195.9996.1496.2596.34
30095.0695.4295.7596.0096.1996.3596.4996.5996.68
40095.6695.9896.2796.4896.6596.7996.9197.0097.07
Table 6. Lookup table for gear ratio and efficiency (without lubrication).
βRatio
11.251.622.53.15456.3
92.0792.6893.2393.6493.9794.2494.4794.6594.79
92.1792.7893.3293.7294.0594.3294.5594.7294.86
20°92.6993.2693.7894.1794.4894.7494.9595.1295.25
30°93.4393.9794.4594.8095.0895.3295.5295.6795.80
40°94.4194.8895.3195.6295.8796.0896.2696.3996.49
Table 7. Experimental results for first gear set.
Torque [N∙m]Experimental Results [N∙m]VariancesEfficiency [%]
1st2nd3rdAverage
80.6830.6610.6740.6730.000122591.59
141.1081.1201.0941.1070.000169592.09
201.6111.5831.5521.5830.000872592.08
Table 8. Experimental results for second gear set.
Torque [N∙m]Experimental Results [N∙m]VariancesEfficiency [%]
1st2nd3rdAverage
80.6790.6520.6950.6750.000472591.56
141.0931.1091.1171.1060.000149592.10
201.5331.6021.5871.5740.001317092.13
C test tests the null hypothesis (H0) and all variances are equal.
Publisher’s Note: MDPI stays neutral with regard to jurisdictional claims in published maps and institutional affiliations.