1. Introduction
Adaptive cruise control (ACC) is a basic longitudinal control function in advanced driver-assistance systems and intelligent vehicles. It regulates the speed and spacing of the host vehicle according to the motion state of the preceding vehicle. Therefore, its performance directly affects longitudinal safety, traffic efficiency, ride comfort, and driving stability. With the increasing deployment of intelligent and connected vehicles, ACC is no longer a simple speed-keeping or distance-maintaining function. It has become a multi-objective control problem involving safety, tracking accuracy, spacing regulation, comfort, traffic stability, and energy-related performance.
Many studies have improved ACC from the perspective of control strategy design. Wu et al. proposed a sensor-fusion-based ACC strategy with dynamic coordination to balance safety and comfort [
1]. Mehraban et al. combined fuzzy logic and model predictive control to adapt ACC behavior to dynamic traffic conditions [
2]. Zhao et al. introduced a safe reinforcement learning method to improve ACC decision-making under safety constraints [
3]. Other studies have focused on collision-risk avoidance, dynamic-weight model predictive control, and electric-vehicle-oriented ACC optimization [
4,
5,
6,
7]. These studies show that ACC performance is multi-objective and condition-dependent. However, most of them focus on controller design and control improvement. The independent problem of comprehensive ACC performance evaluation has received less attention.
The practical performance of an ACC system cannot be described by a single indicator. In steady-state car-following, the main concern is whether the host vehicle can maintain a stable speed and spacing. During preceding-vehicle acceleration or deceleration, the system should respond promptly while avoiding excessive longitudinal control intensity. During cut-in and cut-out events, target recognition, target confirmation, and control-mode transition become critical. Under safety-critical conditions, spacing compression and longitudinal safety margin are dominant concerns. In addition, acceleration variation and jerk are closely related to ride comfort and perceived naturalness.
Recent studies have also shown that ACC evaluation involves multiple performance dimensions. Das and Hasnine evaluated ACC car-following performance using commercial ACC datasets and considered safety, flow stability, comfort, and emissions [
8]. Pan et al. incorporated safety, tracking performance, comfort, and economy into an electric-vehicle ACC framework based on model predictive control [
6]. Jiang et al. considered collision-risk avoidance and longitudinal safety in ACC design [
4]. From the comfort perspective, Carlowitz et al. investigated comfortable deceleration profiles through test-track experiments [
9]. Peng et al. further analyzed how vehicle kinematic and proxemic factors affect user comfort and perceived naturalness [
10]. Liu et al. evaluated ACC systems according to human driving behavior characteristics and considered both safety and human-like performance, indicating that response naturalness and human-like longitudinal behavior are also important for ACC assessment [
11]. These studies indicate that safety, tracking accuracy, response intensity, comfort, and smoothness are all relevant to ACC performance. Nevertheless, these indicators are often analyzed separately. Their hierarchical relationships, relative importance, and scenario-specific scoring rules are not fully unified.
Scenario design is another key issue in ACC performance evaluation. The limitations of an ACC system may not be fully exposed under ideal steady-state following conditions. They often become evident during dynamic traffic events, such as preceding-vehicle acceleration, preceding-vehicle deceleration, lane change, cut-in, and cut-out. Among them, cut-in is a typical safety-critical scenario because it can suddenly reduce inter-vehicle spacing and increase rear-end collision risk. Li et al. established a theoretical framework to analyze the disturbance evolution and safety effects of ACC systems under cut-in scenarios [
12]. Li et al. generalized cut-in pre-crash scenarios from accident data and showed that cut-in events are representative high-risk test cases for automated vehicles [
13]. Chen et al. developed an ACC strategy for cut-in response based on model predictive control [
14]. Experimental studies on commercial automated driving systems also show that multi-vehicle interactions, lane-change disturbances, and freeway bottleneck conditions can significantly affect ACC car-following behavior and safety performance [
15,
16]. Therefore, ACC evaluation should be scenario-oriented rather than limited to a single nominal following condition.
Compared with simulation-only analysis, real-vehicle testing and trajectory data can reveal the actual behavior of commercial ACC systems more directly. Makridis et al. constructed the OpenACC database to provide commercial ACC car-following trajectories for empirical analysis [
17]. The OpenACC study also shows that empirical ACC datasets can support cross-vehicle and cross-campaign comparison of commercial ACC behavior under different driving conditions, which highlights the need for evaluation methods that can process measured longitudinal response data. Li et al. investigated the car-following behavior of ACC vehicles through empirical experiments and found that ACC response depends on operating conditions and system settings [
18]. Raju et al. conducted pilot field tests to analyze the car-following properties of a commercial ACC system [
19]. Zhou et al. provided a unified longitudinal trajectory dataset for automated-vehicle car-following studies [
20]. Xia et al. developed an automated driving data acquisition and analytics platform for raw data collection, trajectory extraction, reconstruction, and evaluation [
21]. These studies show that commercial ACC behavior is affected not only by the control algorithm but also by sensing, target confirmation, actuator response, parameter settings, and test conditions. Thus, an engineering-oriented ACC evaluation method should be applicable to both simulation outputs and real-vehicle test data.
In the broader field of automated driving and active safety evaluation, scenario-based testing has become an important research direction. Wang et al. reviewed scenario generation methods for automated vehicle testing and validation [
22]. Xie et al. summarized scenario-based test and evaluation methods and pointed out the limitations of traditional mileage-based tests [
23]. Zhou et al. developed a quantile-based scenario generation method for automated vehicle safety evaluation [
24]. Yan et al. evaluated automated driving safety metrics using logged trajectory data and showed that different metrics require systematic comparison [
25]. Chen et al. used a co-simulation platform to evaluate safety performance in freeway merging areas under autonomous-vehicle environments [
26]. Liu et al. constructed a comprehensive performance evaluation index model for autonomous emergency braking systems [
27]. These studies provide useful foundations for scenario generation, safety metric assessment, co-simulation analysis, and comprehensive performance evaluation.
The above studies can be grouped into several research streams, as summarized in
Table 1.
As summarized in
Table 1, existing studies provide important foundations for ACC, multi-objective performance analysis, scenario-based testing, real-vehicle experiments, and automated-driving evaluation. However, three limitations remain. First, the relationship between ACC functional objectives and typical operating scenarios is not always explicit. Second, measurable indicators such as response time, acceleration, relative speed, safety distance, and jerk are often processed separately, whereas their hierarchical relationships, relative importance, and scenario-specific scoring rules are not sufficiently unified. Third, simulation outputs and measured vehicle-test signals are not always processed through the same feature–score–diagnosis chain, which limits the traceability and engineering usability of evaluation results. Therefore, an ACC-specific evaluation model is needed to transform multi-scenario time-domain response data into quantitative, interpretable, and diagnostically useful performance scores.
It should also be noted that energy-aware and driver-adaptive longitudinal control is an important extension direction, especially for electric vehicles. For example, Ciravegna et al. proposed an eco-driving assistance framework using adaptive drivability maps and predictive driver modeling to improve energy efficiency while considering driver acceptance [
28]. However, energy consumption and driver-adaptive eco-driving indicators are not included in the present ACC-CPEIM and are left for future extension.
To address these issues, this study proposes a comprehensive performance evaluation index model for ACC systems, termed ACC-CPEIM. The model follows a “functional objective decomposition–typical scenario mapping–measurable indicator screening” procedure. The overall ACC performance objective is decomposed into five criterion-layer dimensions: steady-state control, dynamic response, target-transition adaptability, safety, and comfort. These dimensions are further mapped to six typical ACC scenarios, including preceding-vehicle start, constant-speed following, preceding-vehicle acceleration, preceding-vehicle deceleration, preceding-vehicle cut-out, and preceding-vehicle cut-in. For each scenario, measurable longitudinal indicators are selected according to physical relevance, measurability, and scenario sensitivity. These indicators include response time, longitudinal acceleration, relative speed, safety distance, and jerk. Hierarchical weights and scenario-specific scoring rules are then used to convert raw time-domain response data into scenario-level, criterion-level, and overall performance scores. In this way, the ACC-CPEIM provides both a comprehensive score and traceable diagnostic information for identifying weak performance dimensions and critical operating conditions.
To verify and demonstrate the proposed model, a co-simulation and vehicle-test application process is established. Six typical ACC scenarios are first evaluated in a CarSim/Simulink co-simulation environment. The co-simulation platform provides repeatable time-domain response data, including host-vehicle speed, target-vehicle speed, inter-vehicle spacing, longitudinal acceleration, relative speed, and jerk. These data are used to extract score-related features and calculate scenario-level, criterion-level, and comprehensive ACC performance scores. Furthermore, vehicle-test data covering the same six ACC scenarios are collected using a production ACC vehicle and an external dynamic performance measurement system. The measured longitudinal response data are processed through the same ACC-CPEIM feature extraction, score conversion, and aggregation procedure. Thus, the co-simulation tests provide repeatable full-scenario evaluation, while the vehicle-test application demonstrates the engineering usability of the proposed model for measured time-domain data.
The main contributions of this study are summarized as follows:
- (1)
A hierarchical ACC performance evaluation framework is constructed by explicitly linking functional objectives, typical operating scenarios, and scenario-sensitive measurable indicators.
- (2)
A weighted comprehensive scoring model is formulated to transform raw longitudinal response data into scenario-level, criterion-level, and overall performance scores, thereby supporting both quantitative evaluation and performance diagnosis.
- (3)
A co-simulation and vehicle-test application process is established. The CarSim/Simulink co-simulation provides repeatable full-scenario evaluation, while the vehicle-test application demonstrates that the ACC-CPEIM can process measured longitudinal response data and generate interpretable diagnostic results.
The proposed ACC-CPEIM can support comprehensive ACC performance evaluation and diagnostic analysis across different scenarios, performance criteria, and operating conditions.
2. Construction of the Comprehensive Performance Evaluation Index Model
2.1. Evaluation Hierarchy and Scenario–Indicator Mapping
This study develops a comprehensive performance evaluation index model for adaptive cruise control systems, termed ACC-CPEIM. The model is designed to transform multi-scenario longitudinal response data into quantitative and interpretable performance scores. It integrates functional objectives, typical operating scenarios, measurable indicators, hierarchical weights, scenario-specific feature extraction rules, and scoring criteria into a unified evaluation structure.
The ACC-CPEIM is constructed following the GQM (Goal–Question–Metric) logic [
29]:
where the goal denotes the overall evaluation objective, the question denotes the key performance questions derived from this objective, and the metric denotes the measurable indicators used to answer these questions.
The overall goal is to evaluate whether an ACC system can perform longitudinal car-following safely, promptly, stably, and smoothly under typical operating conditions. Based on this goal, five evaluation questions are formulated:
Q1: Can the system maintain stable speed and spacing during steady-state car-following?
Q2: Can the system respond properly when the preceding vehicle accelerates or decelerates?
Q3: Can the system adapt smoothly when the target vehicle appears or disappears?
Q4: Can the system maintain sufficient longitudinal safety margins under high-risk conditions?
Q5: Can the system provide acceptable ride comfort during longitudinal control?
Accordingly, five criterion-layer dimensions are defined: steady-state control, dynamic response, target-transition adaptability, safety, and comfort. Steady-state control describes the ability to maintain stable speed and spacing. Dynamic response reflects the response capability under target-vehicle speed changes. Target-transition adaptability evaluates the continuity of control when the target vehicle changes. Safety represents the ability to maintain longitudinal safety margins. Comfort reflects the smoothness of longitudinal motion.
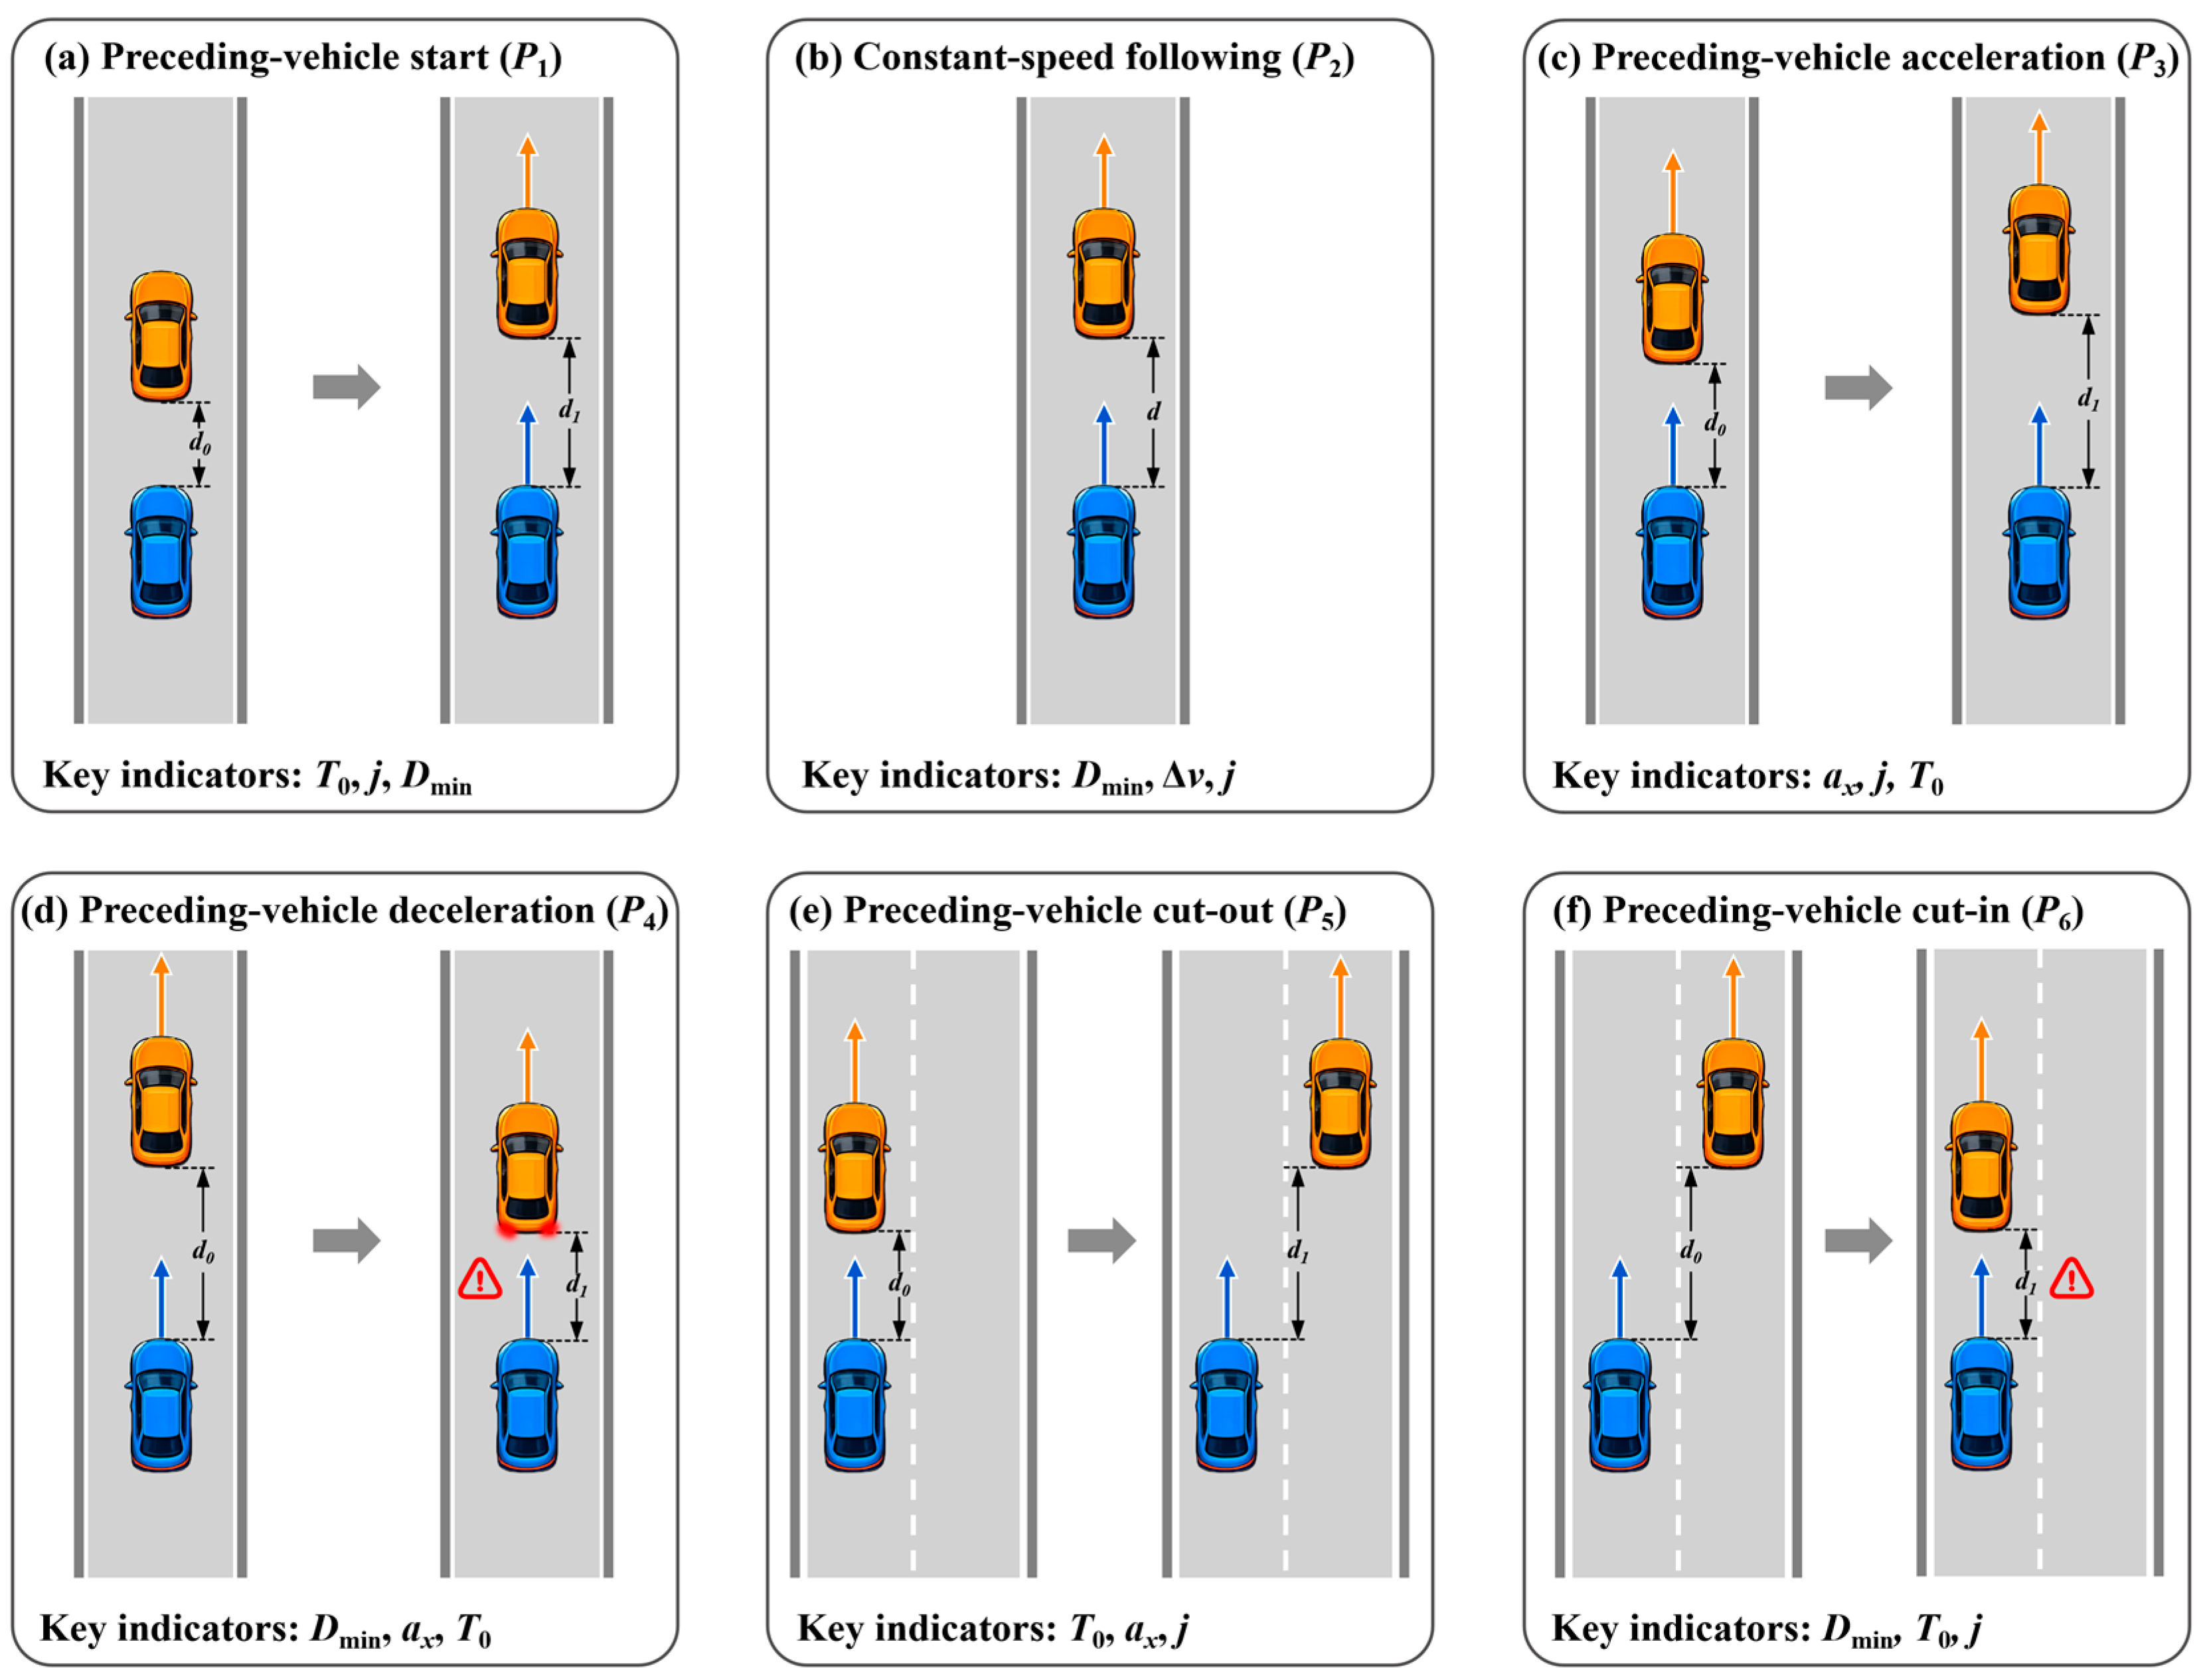
Six typical ACC scenarios are selected to cover the main longitudinal interactions encountered during car-following operation. These scenarios include preceding-vehicle start, constant-speed following, preceding-vehicle acceleration, preceding-vehicle deceleration, preceding-vehicle cut-out, and preceding-vehicle cut-in.
Figure 1 illustrates these scenarios and their scenario-sensitive indicators.
As shown in
Figure 1, different scenarios emphasize different aspects of ACC performance.
P1 and
P2 mainly reflect start-up response and steady-state following stability.
P3 and
P4 evaluate dynamic response under target-vehicle speed changes.
P5 and
P6 examine target-transition adaptability when the original target disappears or a new target appears. Therefore, the indicator subset for each scenario is selected according to its dominant control requirement.
In this study, P1–P6 denote the six typical ACC scenarios, and T1–T5 denote the five criterion-layer dimensions. The symbols d0 and d1 represent the inter-vehicle spacing before and after the target-vehicle state change, respectively. Dmin denotes the minimum actual inter-vehicle spacing within the evaluation window. T0 denotes the response time of the host vehicle after a target-vehicle state change. ax denotes the longitudinal acceleration of the host vehicle, Δv denotes the relative speed between the host vehicle and the target vehicle, and jrms denotes the root-mean-square value of jerk. The score variables XD, XT0, Xa, Xj, and XΔv denote the dimensionless scores converted from the corresponding raw features according to the scenario-specific scoring criteria.
The evaluation hierarchy of the ACC-CPEIM is summarized in
Table 2.
The scenario–indicator mapping follows three principles: physical relevance, measurability, and scenario sensitivity. Physical relevance requires that an indicator directly reflect the dominant control requirement of a scenario. Measurability requires that the indicator be capable of being extracted from co-simulation or vehicle-test data. Scenario sensitivity requires that the indicator vary clearly under the corresponding scenario, so that different ACC performance levels can be distinguished.
2.2. Indicator Definitions and Feature Extraction
To ensure that the ACC-CPEIM can be directly applied to time-domain simulation and vehicle-test data, each score variable is linked to a specific raw feature extraction rule. For a given scenario s and test case k, the evaluation window is denoted as Ωs,k. The raw time-domain signals include host-vehicle speed, target-vehicle speed, inter-vehicle spacing, longitudinal acceleration, and event time. Before RMS-based feature extraction, longitudinal acceleration and jerk can be filtered to reduce numerical noise.
Response time
T0 is defined as the time interval between the occurrence of a target-vehicle state change and the effective response of the host vehicle:
where
te is the event time, and
tr is the time when the host vehicle produces an effective response. The response detection rule depends on the scenario. For example, acceleration response can be detected by a positive acceleration threshold, braking response can be detected by a negative acceleration threshold, and target-transition response can be detected by target confirmation or control-mode switching.
The desired safety distance is calculated using a constant-time-headway policy:
where
D0 is the minimum static spacing,
Th is the desired time headway, and
ve is the host-vehicle speed.
The distance-related score is assigned according to the minimum actual inter-vehicle spacing in the evaluation window:
where
D(
t) is the actual spacing between the host vehicle and the target vehicle. A larger
Dmin indicates a larger spacing reserve during the corresponding scenario.
For safety diagnosis, the distance safety margin is also calculated as:
and its minimum value is:
A positive MD,min indicates that the actual spacing remains larger than the desired safety distance throughout the evaluation window. A non-positive value indicates insufficient longitudinal safety margin. In the ACC-CPEIM scoring process, Dmin is used for the distance-related score XD, while MD,min is retained as a diagnostic safety feature.
Relative speed is defined as:
where
vt is the target-vehicle speed. For an evaluation window with
N samples, the mean absolute relative speed error is calculated as:
This feature is used to evaluate speed-tracking deviation in the constant-speed following scenario.
Longitudinal acceleration
ax describes the longitudinal control intensity of the host vehicle. In the acceleration scenario, only positive acceleration is used to evaluate acceleration-following capability:
where
ax,f(
n) is the filtered longitudinal acceleration. In deceleration and transition scenarios, the RMS value of absolute acceleration is used to describe braking or transition intensity:
Jerk
j is used to evaluate the smoothness of longitudinal acceleration. For discrete data, jerk is calculated as:
where Δ
t is the sampling interval. The scoring feature for jerk is the RMS value of filtered jerk:
where
jf(
n) is the filtered jerk. Peak jerk is retained only as a diagnostic feature and is not directly used in the score aggregation.
Because the extracted indicators have different units and optimization directions, they cannot be directly aggregated. Each raw feature is converted into a dimensionless score according to scenario-specific scoring criteria. The score variables are denoted as:
where
XD is the distance-related score converted from
Dmin,
XT0 is the response-time score converted from
T0,
Xa is the acceleration-related score converted from the corresponding acceleration feature,
Xj is the jerk-related score converted from
jrms, and
XΔv is the relative-speed score converted from the mean absolute relative speed error. All score variables are dimensionless, and a larger value indicates better performance. The detailed conversion rules are provided in
Section 2.6.
2.3. Scenario-Specific Indicator Extraction Rules
The same physical variable may have different meanings in different scenarios. Therefore, the ACC-CPEIM uses scenario-specific extraction rules to convert raw time-domain data into scoring features.
Table 3 summarizes the extraction rules used for the six typical ACC scenarios.
For P1, T0 is detected from the start event to the first effective host response. For P2, the features are extracted within the steady-state window. For P3 and P4, T0 is calculated from the target speed-change event to the first effective host acceleration or braking response. For P5 and P6, T0 reflects the transition after target loss or new-target appearance. This design ensures that the score variables are directly traceable to measurable time-domain features. Thus, the same score variable may be extracted from different raw features depending on the dominant control requirement of each scenario.
2.4. Weight Determination and Consistency Check
After the evaluation hierarchy is established, the relative importance of elements in each layer is quantified using the analytic hierarchy process. Pairwise comparison matrices are constructed using the Saaty scale, where 1, 3, 5, 7, and 9 denote equal, moderate, strong, very strong, and extreme importance, respectively. The values 2, 4, 6, and 8 denote intermediate importance levels.
Let the judgment matrix be:
where
aij denotes the relative importance of the
i-th factor compared with the
j-th factor. The matrix satisfies:
The square-root method is used to calculate the weight vector. The geometric mean of each row is first calculated as:
The normalized weight coefficient is then obtained by:
The consistency of each judgment matrix is checked using the maximum eigenvalue:
The consistency index and consistency ratio are then calculated as:
where
RI is the random consistency index. A judgment matrix is considered acceptable when
CR < 0.10.
The pairwise comparison matrices were constructed according to the functional priority of ACC operation, the risk level of typical longitudinal scenarios, and engineering experience from ACC performance testing. In this study, safety was regarded as the primary requirement because insufficient longitudinal safety margin may directly lead to rear-end collision risk, especially during preceding-vehicle deceleration and cut-in events. Target-transition adaptability was assigned the second-highest priority because cut-in and cut-out scenarios involve target recognition, target confirmation, and control-mode switching, which are critical for the continuity of ACC operation. Dynamic response and comfort were considered important performance dimensions, but they mainly reflect response quality and ride smoothness after the basic safety requirement is satisfied. Steady-state control was also included because stable speed and spacing regulation are necessary in normal car-following; however, its risk exposure is generally lower than that of dynamic and target-transition scenarios. Therefore, the criterion-layer judgment matrix was designed to reflect a safety-first and scenario-risk-oriented evaluation logic rather than a purely mathematical preference.
For the criterion layer, the judgment matrix is constructed according to the functional priority of ACC systems. Longitudinal safety is treated as the primary requirement, followed by target-transition adaptability, dynamic response, comfort, and steady-state control. The criterion-layer judgment matrix is:
The resulting criterion-layer weight vector is:
The corresponding weights are listed in
Table 4.
The maximum eigenvalue is:
λmax = 5.0173. Thus,
For a five-order matrix,
RI = 1.12. Therefore,
The criterion-layer judgment matrix satisfies the consistency requirement.
For the scenario layer, two typical scenarios are assigned to each criterion. The corresponding scenario-layer weights are listed in
Table 5.
It should be noted that several scenarios appear under more than one criterion layer. This repeated use does not mean that the same score is simply counted repeatedly. Instead, the same scenario is interpreted from different performance objectives. For example, preceding-vehicle deceleration P4 is related to dynamic response because it reflects braking timeliness and control intensity, whereas it is also related to safety because it directly affects the minimum spacing reserve. Similarly, preceding-vehicle cut-out P5 reflects both steady-state recovery and target-transition adaptability. This design allows one physical scenario to provide diagnostic information for different ACC performance dimensions.
Because each criterion contains two scenarios, the scenario-layer judgment matrices are second-order matrices and naturally satisfy the consistency requirement.
For the indicator layer, three indicators are selected for each scenario. The indicator weights and consistency-check results are summarized in
Table 6.
All CR values are below 0.10, indicating that the indicator-layer judgment matrices are acceptable. In the start scenario, jerk has the largest weight because low-speed start-up comfort is strongly affected by acceleration abruptness. In the constant-speed following scenario, the distance-related score dominates because spacing maintenance is the key feature of steady-state control. In the acceleration scenario, longitudinal acceleration receives the largest weight because it directly reflects acceleration-following capability. In the deceleration and cut-in scenarios, the distance-related score is dominant because spacing compression is closely related to rear-end collision risk. In the cut-out scenario, response time receives the largest weight because target disappearance requires timely control-mode transition.
Although the consistency ratios indicate that the judgment matrices are internally coherent, the AHP-based weights still contain engineering judgment. Therefore, a sensitivity analysis was further conducted in
Section 3.5 to examine whether the main diagnostic conclusions depend strongly on the selected criterion-layer weights.
2.5. Comprehensive Score Formulation
First, scenario-case scores are calculated using the indicator weights. Second, scenario-level scores are obtained by averaging all test cases within the same scenario. Third, criterion-level scores are calculated using the scenario-layer weights. Finally, the overall ACC performance score is obtained using the criterion-layer weights.
For the
k-th case of scenario
Pi, the scenario-case scores are calculated as:
where
SPi,k denotes the score of the
k-th test case in scenario
Pi.
The scenario-level score is calculated as the mean value of all cases in the same scenario:
where
SPi denotes the averaged scenario-level score, and
Ki is the number of test cases for scenario
Pi.
The criterion-level scores are calculated as:
where
STi denotes the score of the
i-th criterion.
The comprehensive ACC performance score is calculated as:
A higher value of S indicates better overall ACC performance. This formulation also allows the evaluation result to be traced back to the criterion level, scenario level, and test-case level, which supports performance diagnosis.
The complete calculation chain is:
This chain allows the evaluation result to be traced from the overall score back to each scenario and each test case.
2.6. Scenario-Specific Scoring Criteria
The extracted features have different units and optimization directions. For example, a smaller response time indicates better timeliness, whereas a larger minimum spacing indicates better longitudinal safety. Therefore, raw features must be converted into dimensionless scores before aggregation.
Four valid performance levels are defined: excellent, good, general, and poor, corresponding to scores of 5, 4, 3, and 2, respectively. If target loss, control failure, significant collision risk, or invalid data occurs during a test, the corresponding score is set to 0.
For smaller-is-better indicators, such as T0, , jrms, and |ax|rms, a lower raw value receives a higher score. For larger-is-better indicators, such as Dmin and , a higher raw value receives a higher score.
The scoring thresholds in
Table 7 were established as engineering grading criteria for the designed ACC test scenarios. They were not intended to serve as universal legal limits or absolute safety boundaries. Instead, the thresholds were determined by considering four aspects: the functional requirements of ACC operation, commonly used longitudinal performance indicators in standards and published studies, engineering experience from ACC testing, and the value ranges observed in the co-simulation and vehicle-test datasets. Response time was used to describe the timeliness of host-vehicle reaction after a target-vehicle state change. Minimum spacing was used to reflect the direct longitudinal spacing reserve in each scenario. Longitudinal acceleration and jerk were used to describe control intensity and ride smoothness. Because the dominant control requirement differs among scenarios, the same raw variable may correspond to different scoring thresholds in different scenarios.
The thresholds were designed to support relative performance grading under the specified test conditions. For smaller-is-better indicators, such as response time, jerk, and RMS acceleration, lower values indicate quicker, smoother, or less aggressive longitudinal control. For larger-is-better indicators, such as minimum spacing and acceleration-following capability, higher values indicate better spacing reserve or stronger following response. Therefore, the threshold intervals in
Table 7 convert heterogeneous physical features into dimensionless scores with a consistent direction. To reduce the influence of threshold subjectivity on the final diagnosis, a threshold-sensitivity analysis was further conducted in
Section 3.5 by applying stricter and more relaxed threshold settings.
Through the above criteria, raw time-domain data from different scenarios can be converted into dimensionless score variables. These scores are then substituted into Equations (25)–(38) to obtain scenario-case scores, scenario-level scores, criterion-level scores, and the comprehensive ACC performance score.
3. Co-Simulation Testing and Evaluation of Typical ACC Scenarios
3.1. Co-Simulation Platform and Controller
To verify the proposed ACC-CPEIM under reproducible operating conditions, a closed-loop co-simulation platform was established using CarSim and Simulink. CarSim was used to model the vehicle dynamics and traffic interaction process. Simulink was used to implement the ACC controller and the longitudinal actuation logic. During co-simulation, the host-vehicle states, target-vehicle states, relative distance, and relative velocity were exchanged between the two platforms, forming a closed-loop perception–decision–execution process.
The upper-layer ACC controller generated the longitudinal acceleration command according to the set speed, relative distance, and relative velocity. The spacing error was defined as
where
d is the actual inter-vehicle spacing and
ddes is the desired spacing determined by the ACC spacing policy. The longitudinal acceleration command was constrained as
where
acmd is the commanded longitudinal acceleration, and
amin and
amax are the lower and upper acceleration limits, respectively. The lower-layer actuation module converted
acmd into throttle opening or brake pressure according to the required longitudinal control demand.
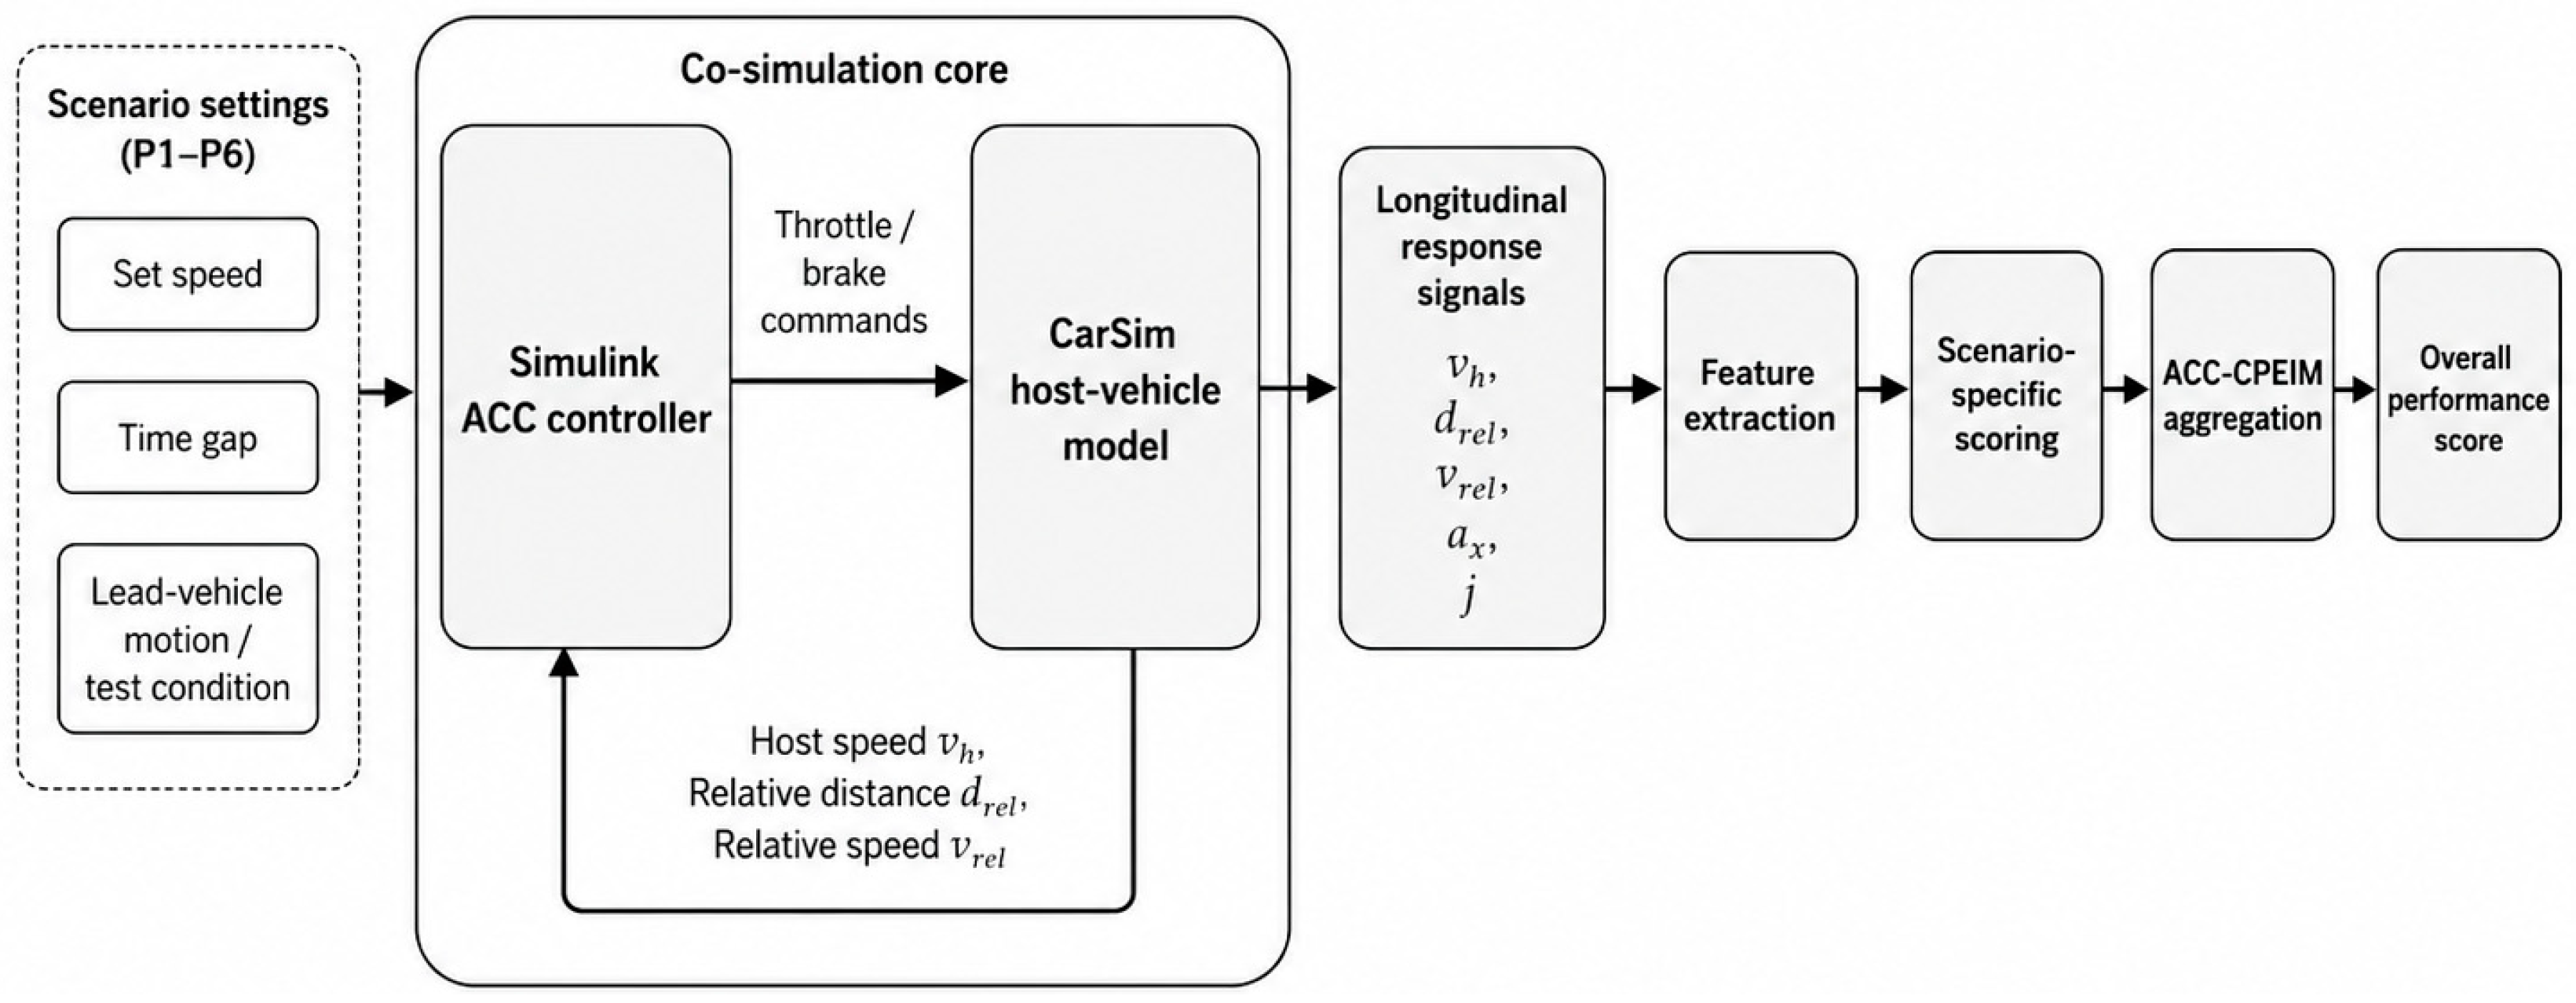
Figure 2 shows the overall co-simulation and evaluation workflow. CarSim provides the host-vehicle dynamics and traffic-interaction environment, while Simulink implements the ACC controller and longitudinal actuation logic. Scenario settings, including the set speed, time gap, and lead-vehicle motion condition, are used as the inputs of the co-simulation platform. The generated longitudinal response signals, including host speed, relative distance, relative speed, acceleration, and jerk, are subsequently processed through the ACC-CPEIM feature extraction, scoring, and aggregation procedure.
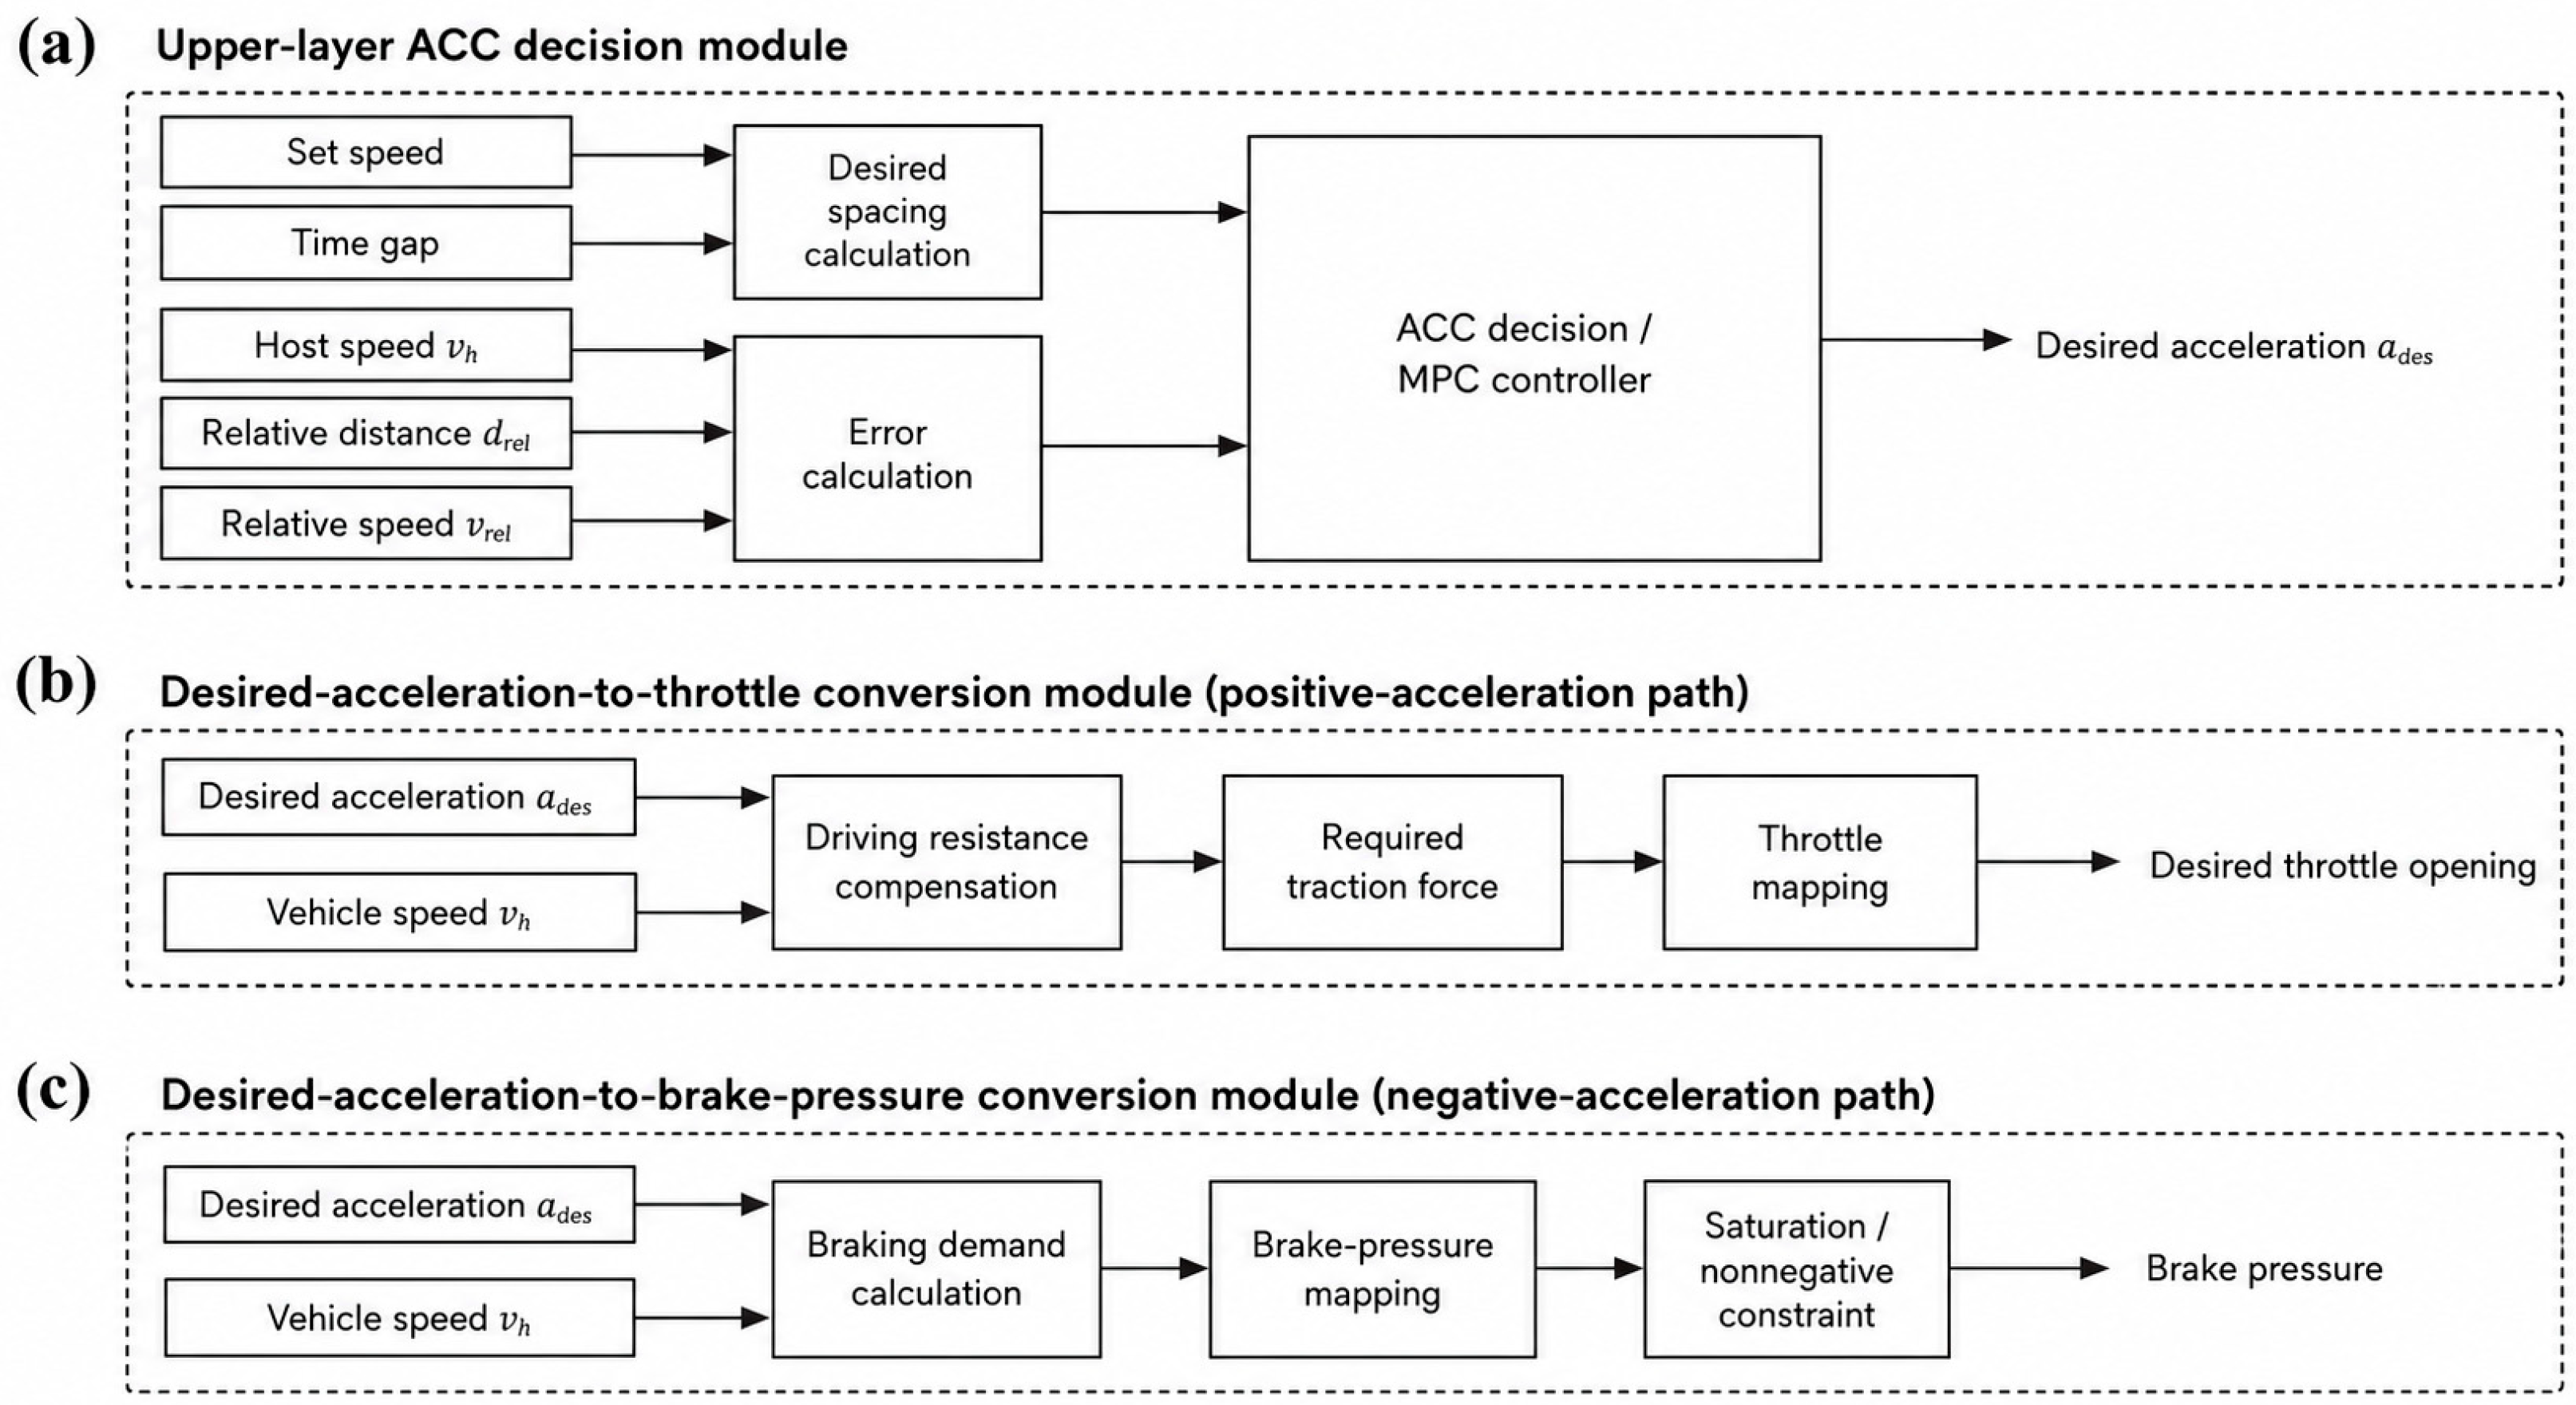
Figure 3 presents a simplified block diagram of the ACC longitudinal controller implemented in Simulink. To improve readability, the complete Simulink implementation details are replaced by the main functional blocks of the controller.
The upper-layer ACC decision module receives the set speed, time gap, host-vehicle speed, relative distance, and relative speed as inputs. It then calculates the desired spacing, spacing error, and relative-speed-related control demand, and finally outputs the desired longitudinal acceleration. The lower-layer modules convert the desired acceleration into actuator commands. When the desired acceleration is positive, the command is processed through the driving-resistance compensation, required-traction-force calculation, and throttle-mapping modules to obtain the desired throttle opening. When the desired acceleration is negative, the command is processed through the braking-demand calculation, brake-pressure mapping, and saturation module to obtain the brake-pressure command.
The outputs of the co-simulation platform were processed using the feature extraction and scoring rules defined in
Section 2. In this way, the time-domain responses could be converted into scenario-case scores, scenario-level scores, criterion-level scores, and the overall ACC performance score.
3.2. Scenario Design and Feature Extraction
Six typical ACC scenarios were designed in the co-simulation environment, corresponding to P1–P6 in the ACC-CPEIM. These scenarios include preceding-vehicle start, constant-speed following, preceding-vehicle acceleration, preceding-vehicle deceleration, preceding-vehicle cut-out, and preceding-vehicle cut-in.
For
P1, the initial spacing was set to 5, 6, 7, 8, and 9 m. For
P2–
P6, the tested speeds were 30, 60, 80, 100, and 120 km/h. For each test case, raw time-domain signals were processed to extract the score-related features defined in
Section 2. The corresponding scenario-case score
SPi,k was then calculated. The scenario-level score
SPi was obtained by averaging all test cases under the same scenario. The co-simulation scenarios and the corresponding score-related features are summarized in
Table 8.
The full speed set for P2–P6 was 30, 60, 80, 100, and 120 km/h. The initial spacing set for P1 was 5, 6, 7, 8, and 9 m. The same physical variable may have different evaluation meanings in different scenarios. For example, the acceleration score Xa in P3 is derived from , which reflects acceleration-following capability. In P4 and P5, Xa is derived from |ax|rms, which reflects braking or transition intensity. This scenario-specific extraction strategy ensures that the scoring variables are consistent with the dominant control requirement of each scenario.
3.3. Time-Domain Responses Under Typical Scenarios
3.3.1. Preceding-Vehicle Start and Constant-Speed Following
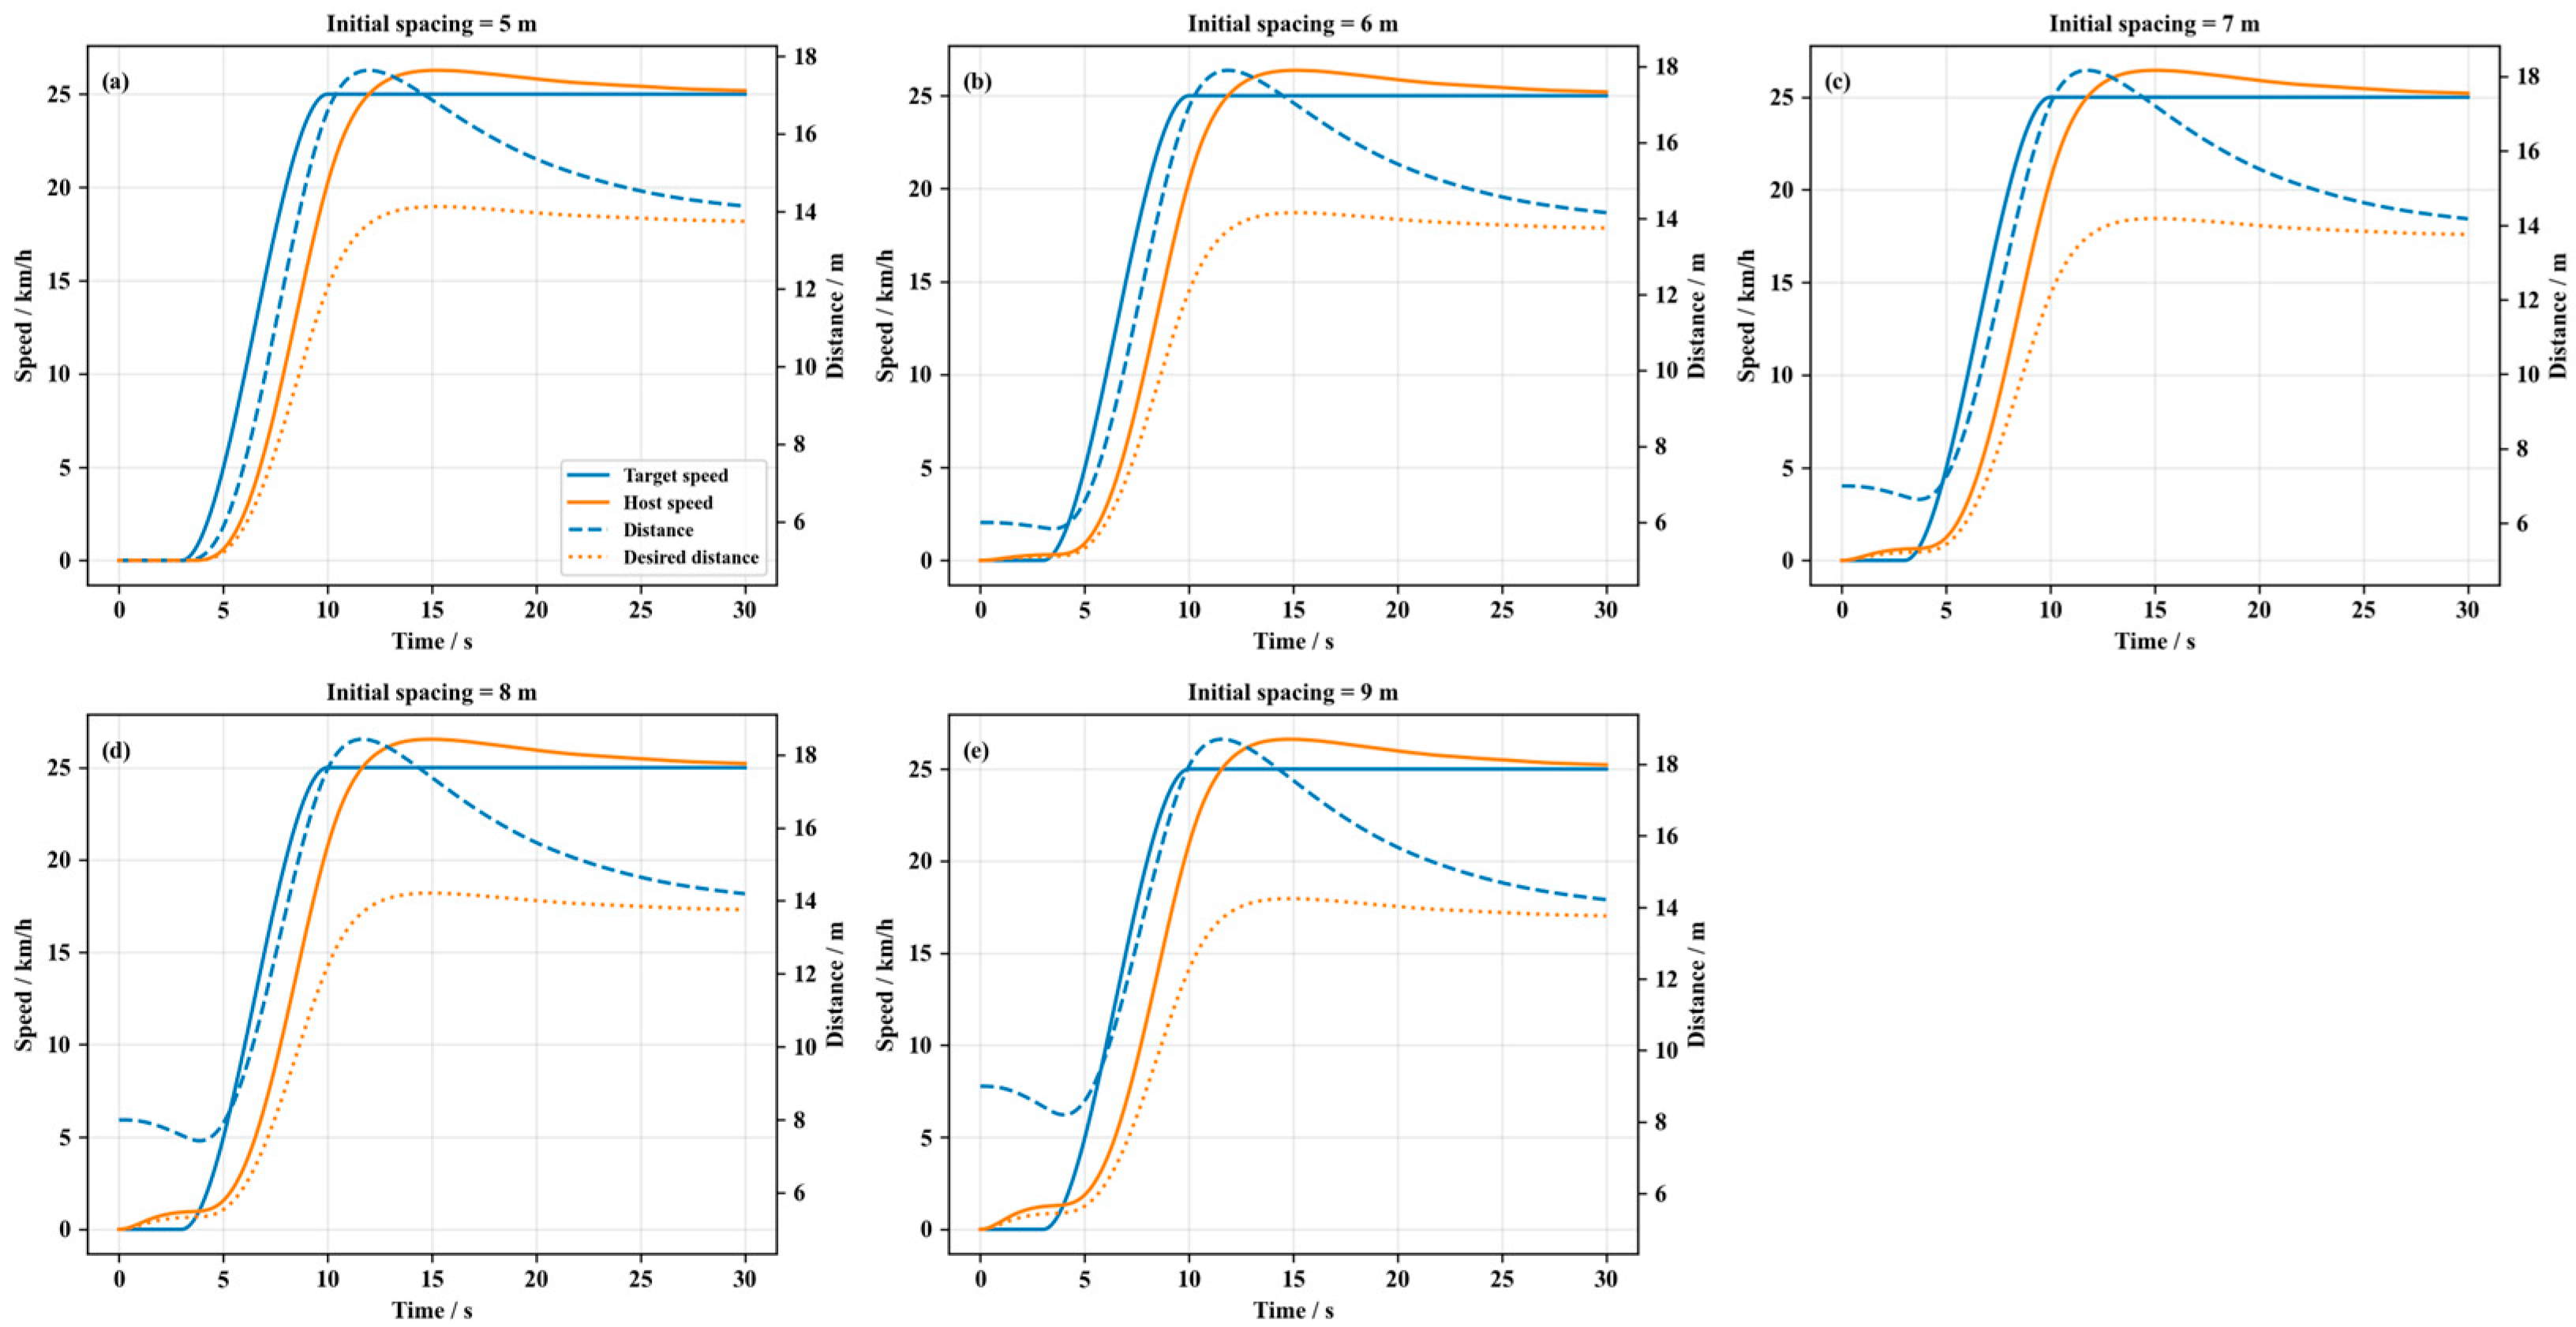
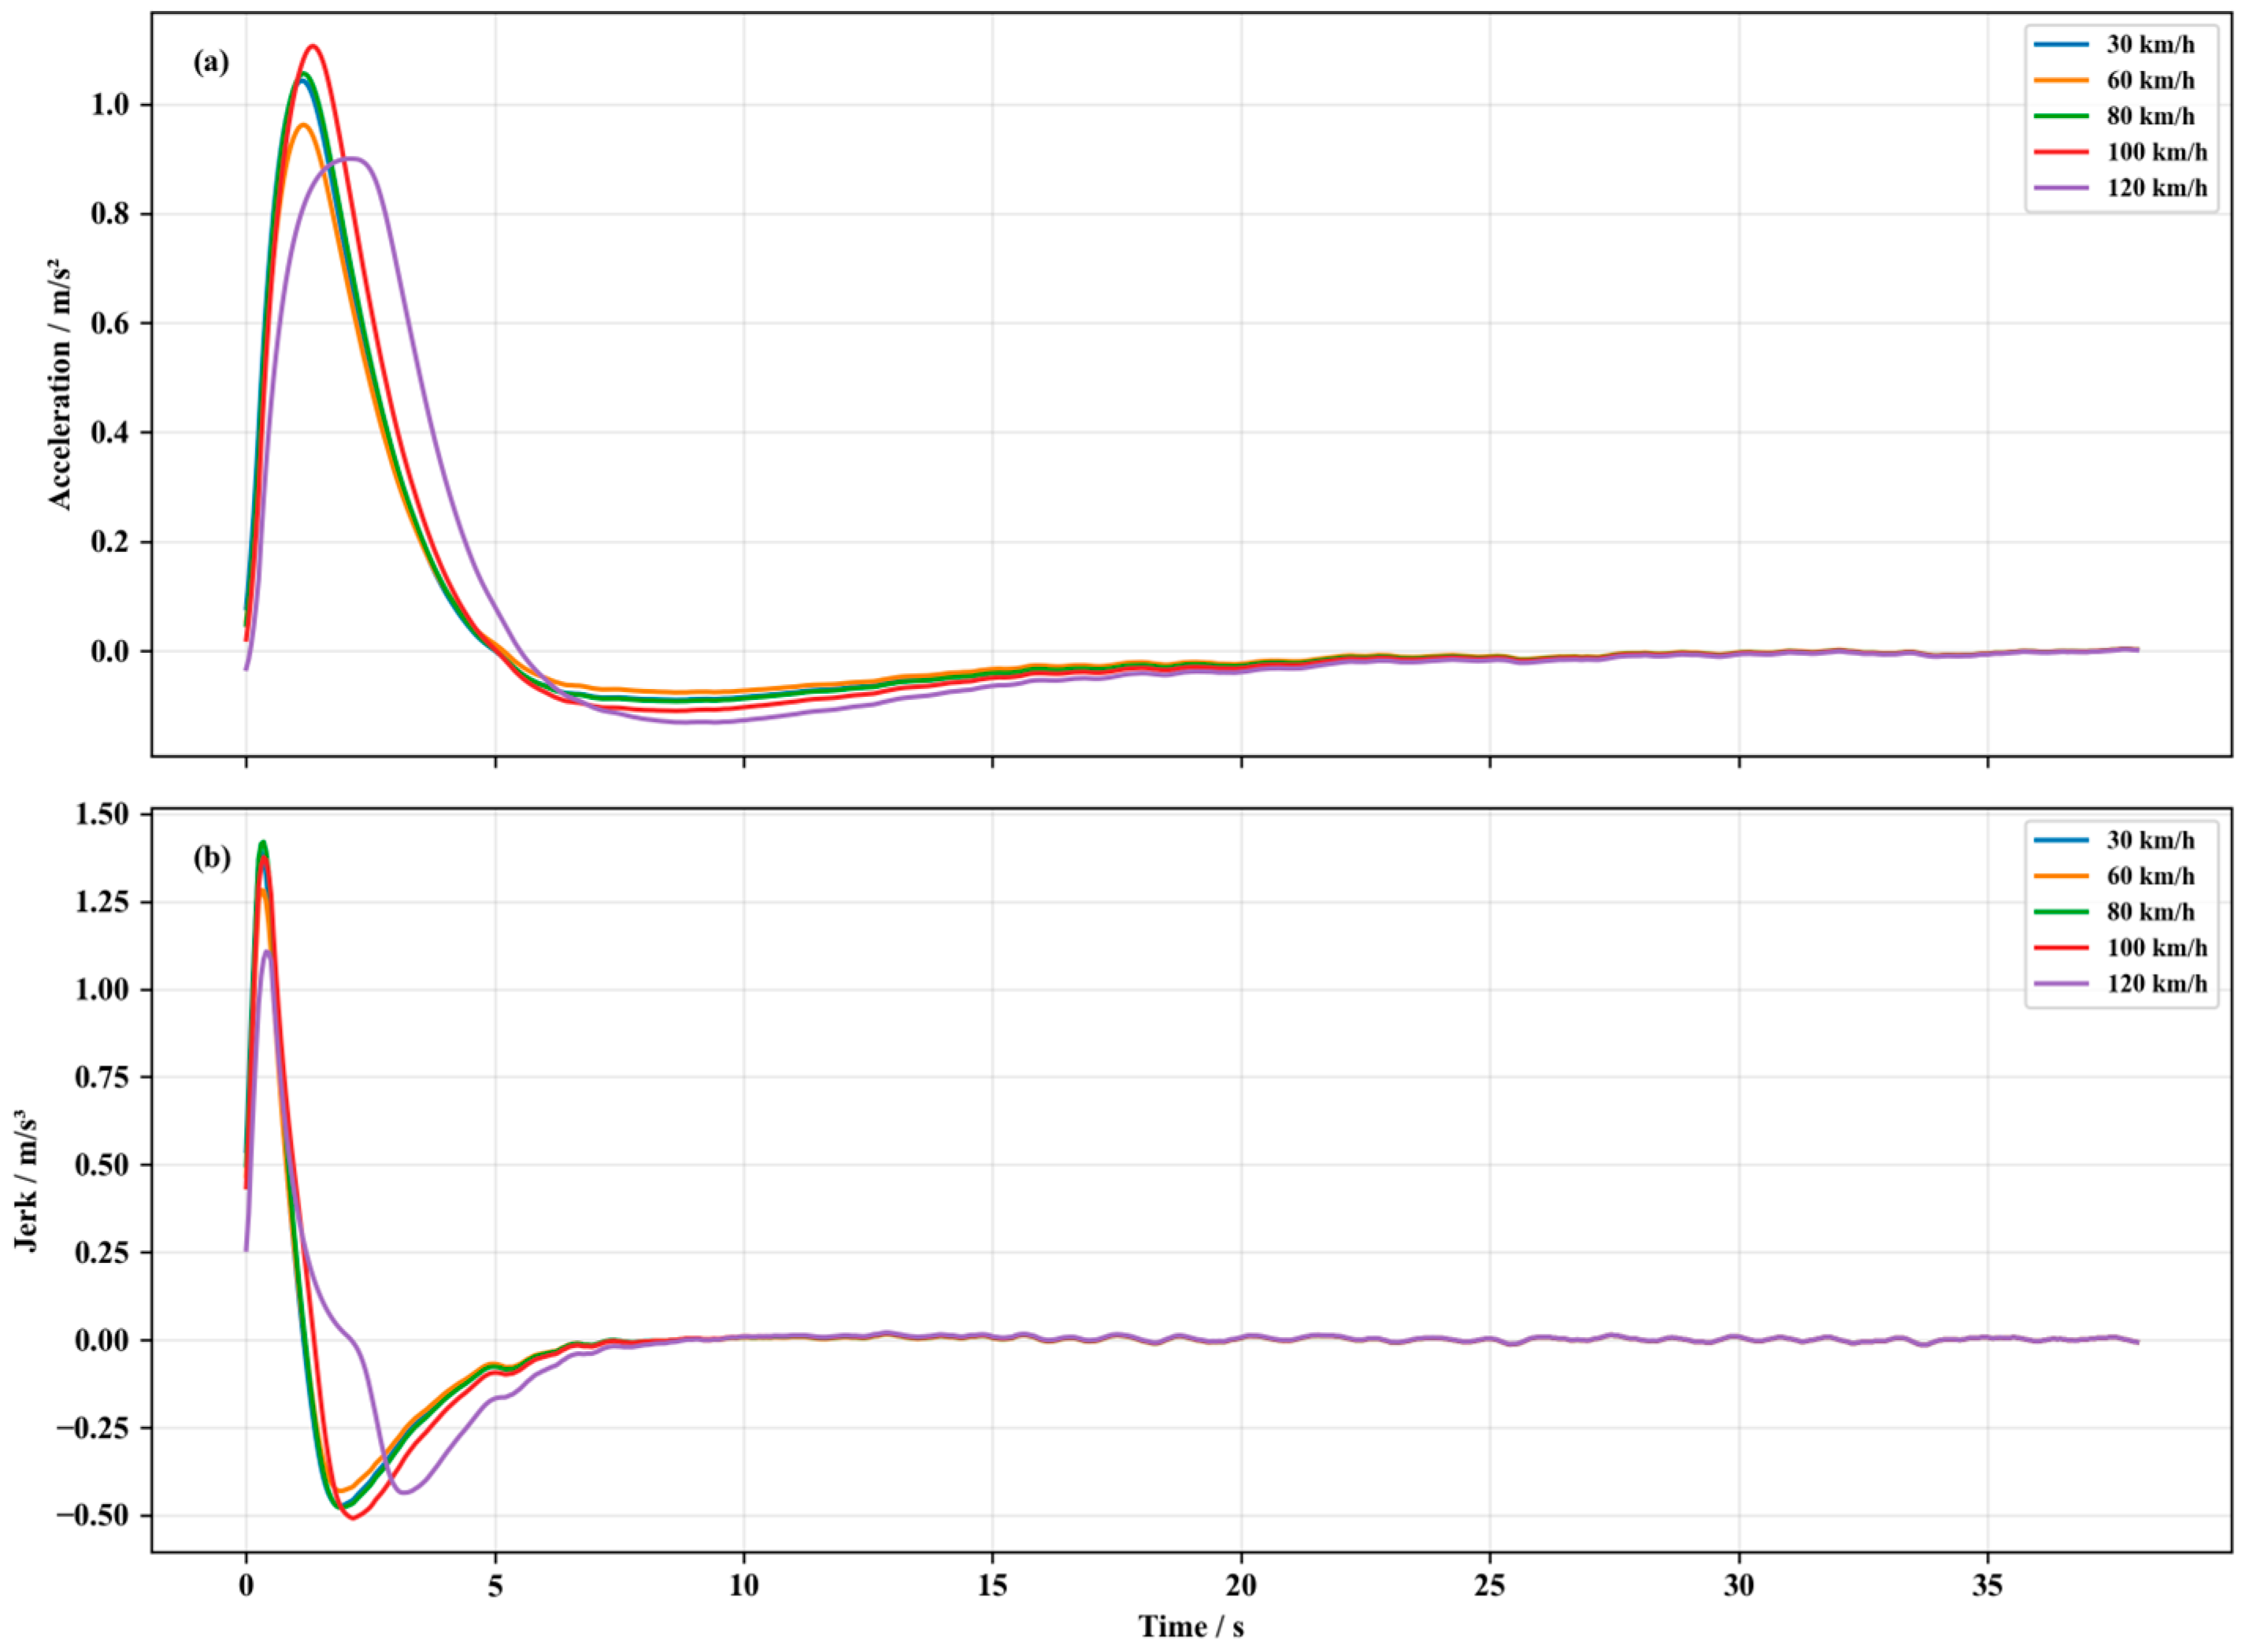
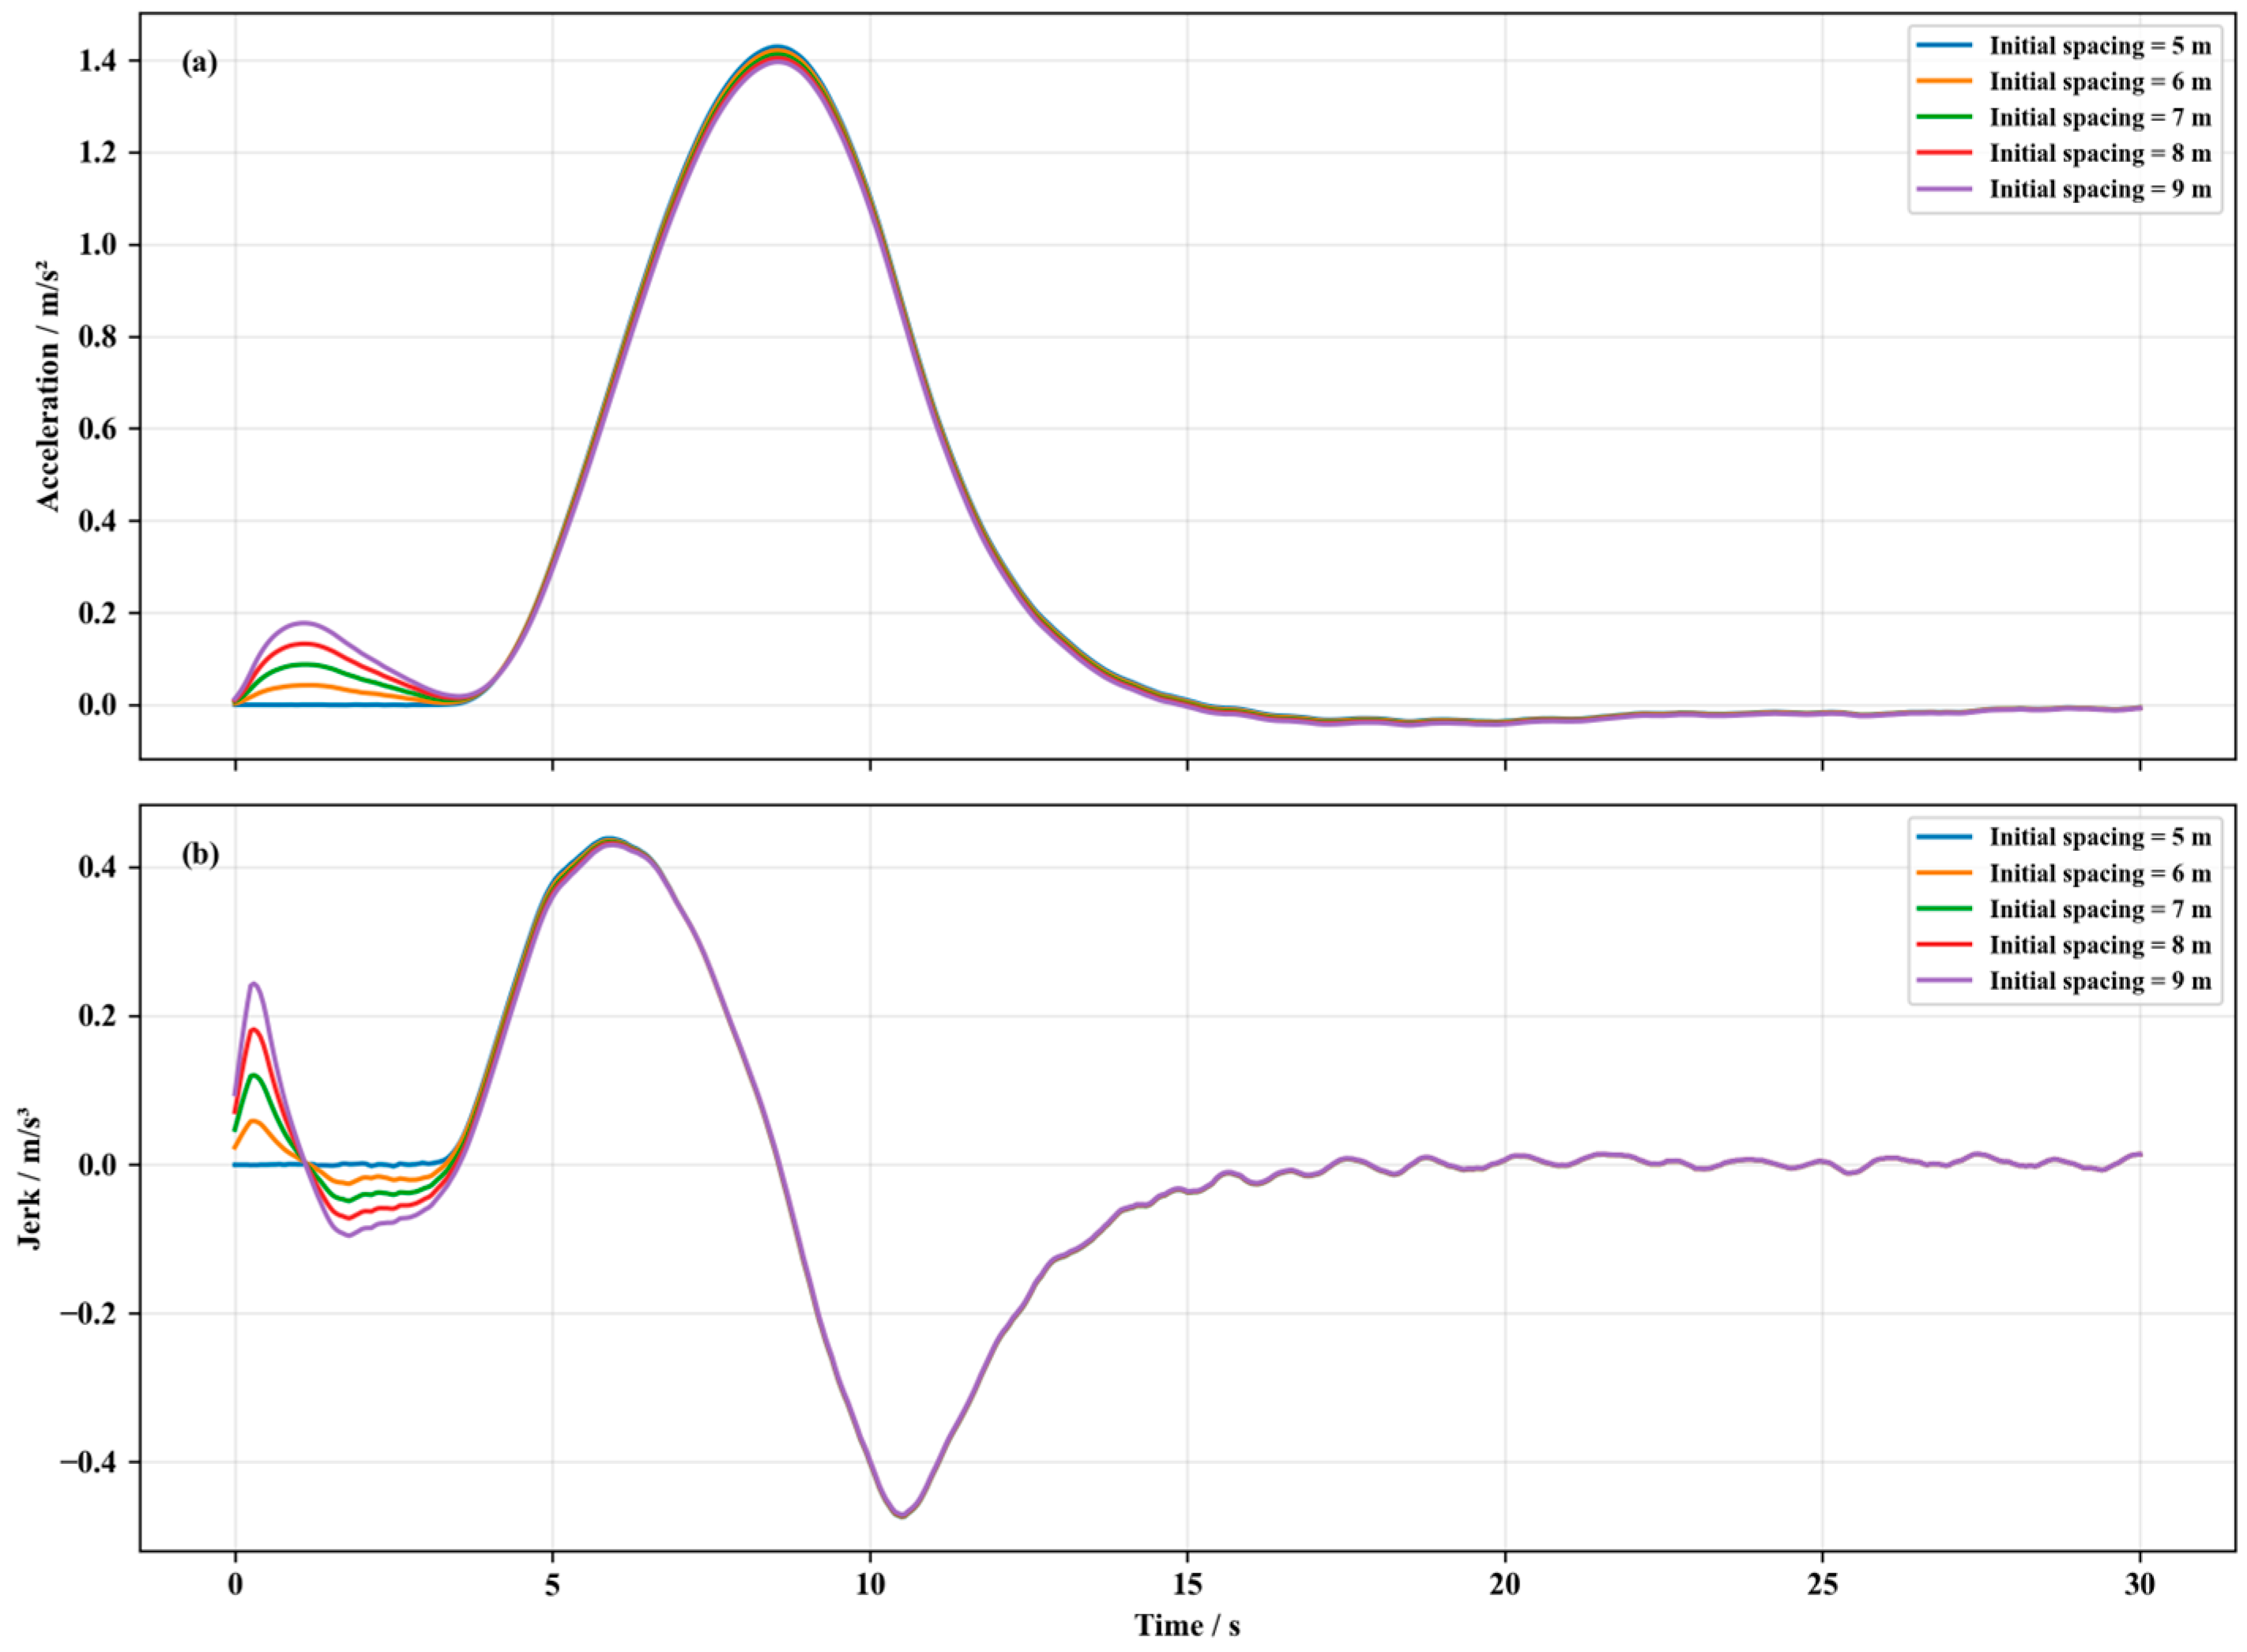
Figure 4 and
Figure 5 show the speed, distance, acceleration, and jerk responses of the preceding-vehicle start scenario
P1 under different initial spacings.
In all P1 cases, the host vehicle successfully followed the target vehicle and gradually entered a stable following state. When the initial spacing was 5 and 6 m, the response times were 1.35 and 1.10 s, respectively. When the initial spacing increased to 7–9 m, the response was detected at the event time under the adopted threshold, and the corresponding T0 was therefore recorded as 0 s. The minimum spacing also increased with the initial spacing. In addition, jrms remained low, ranging from 0.1846 to 0.1864 m/s3. These results indicate that the tested ACC system provides smooth start-up behavior. The average scenario-level score of P1 was 4.8334. The initial spacing mainly affected the minimum spacing and the detected response time. Its influence on the acceleration and jerk profiles was limited because the start-up controller adopted a smooth acceleration-limited following strategy. Therefore, the dynamic response curves under different initial spacings showed similar trends, whereas the score difference was mainly reflected in Dmin and T0.
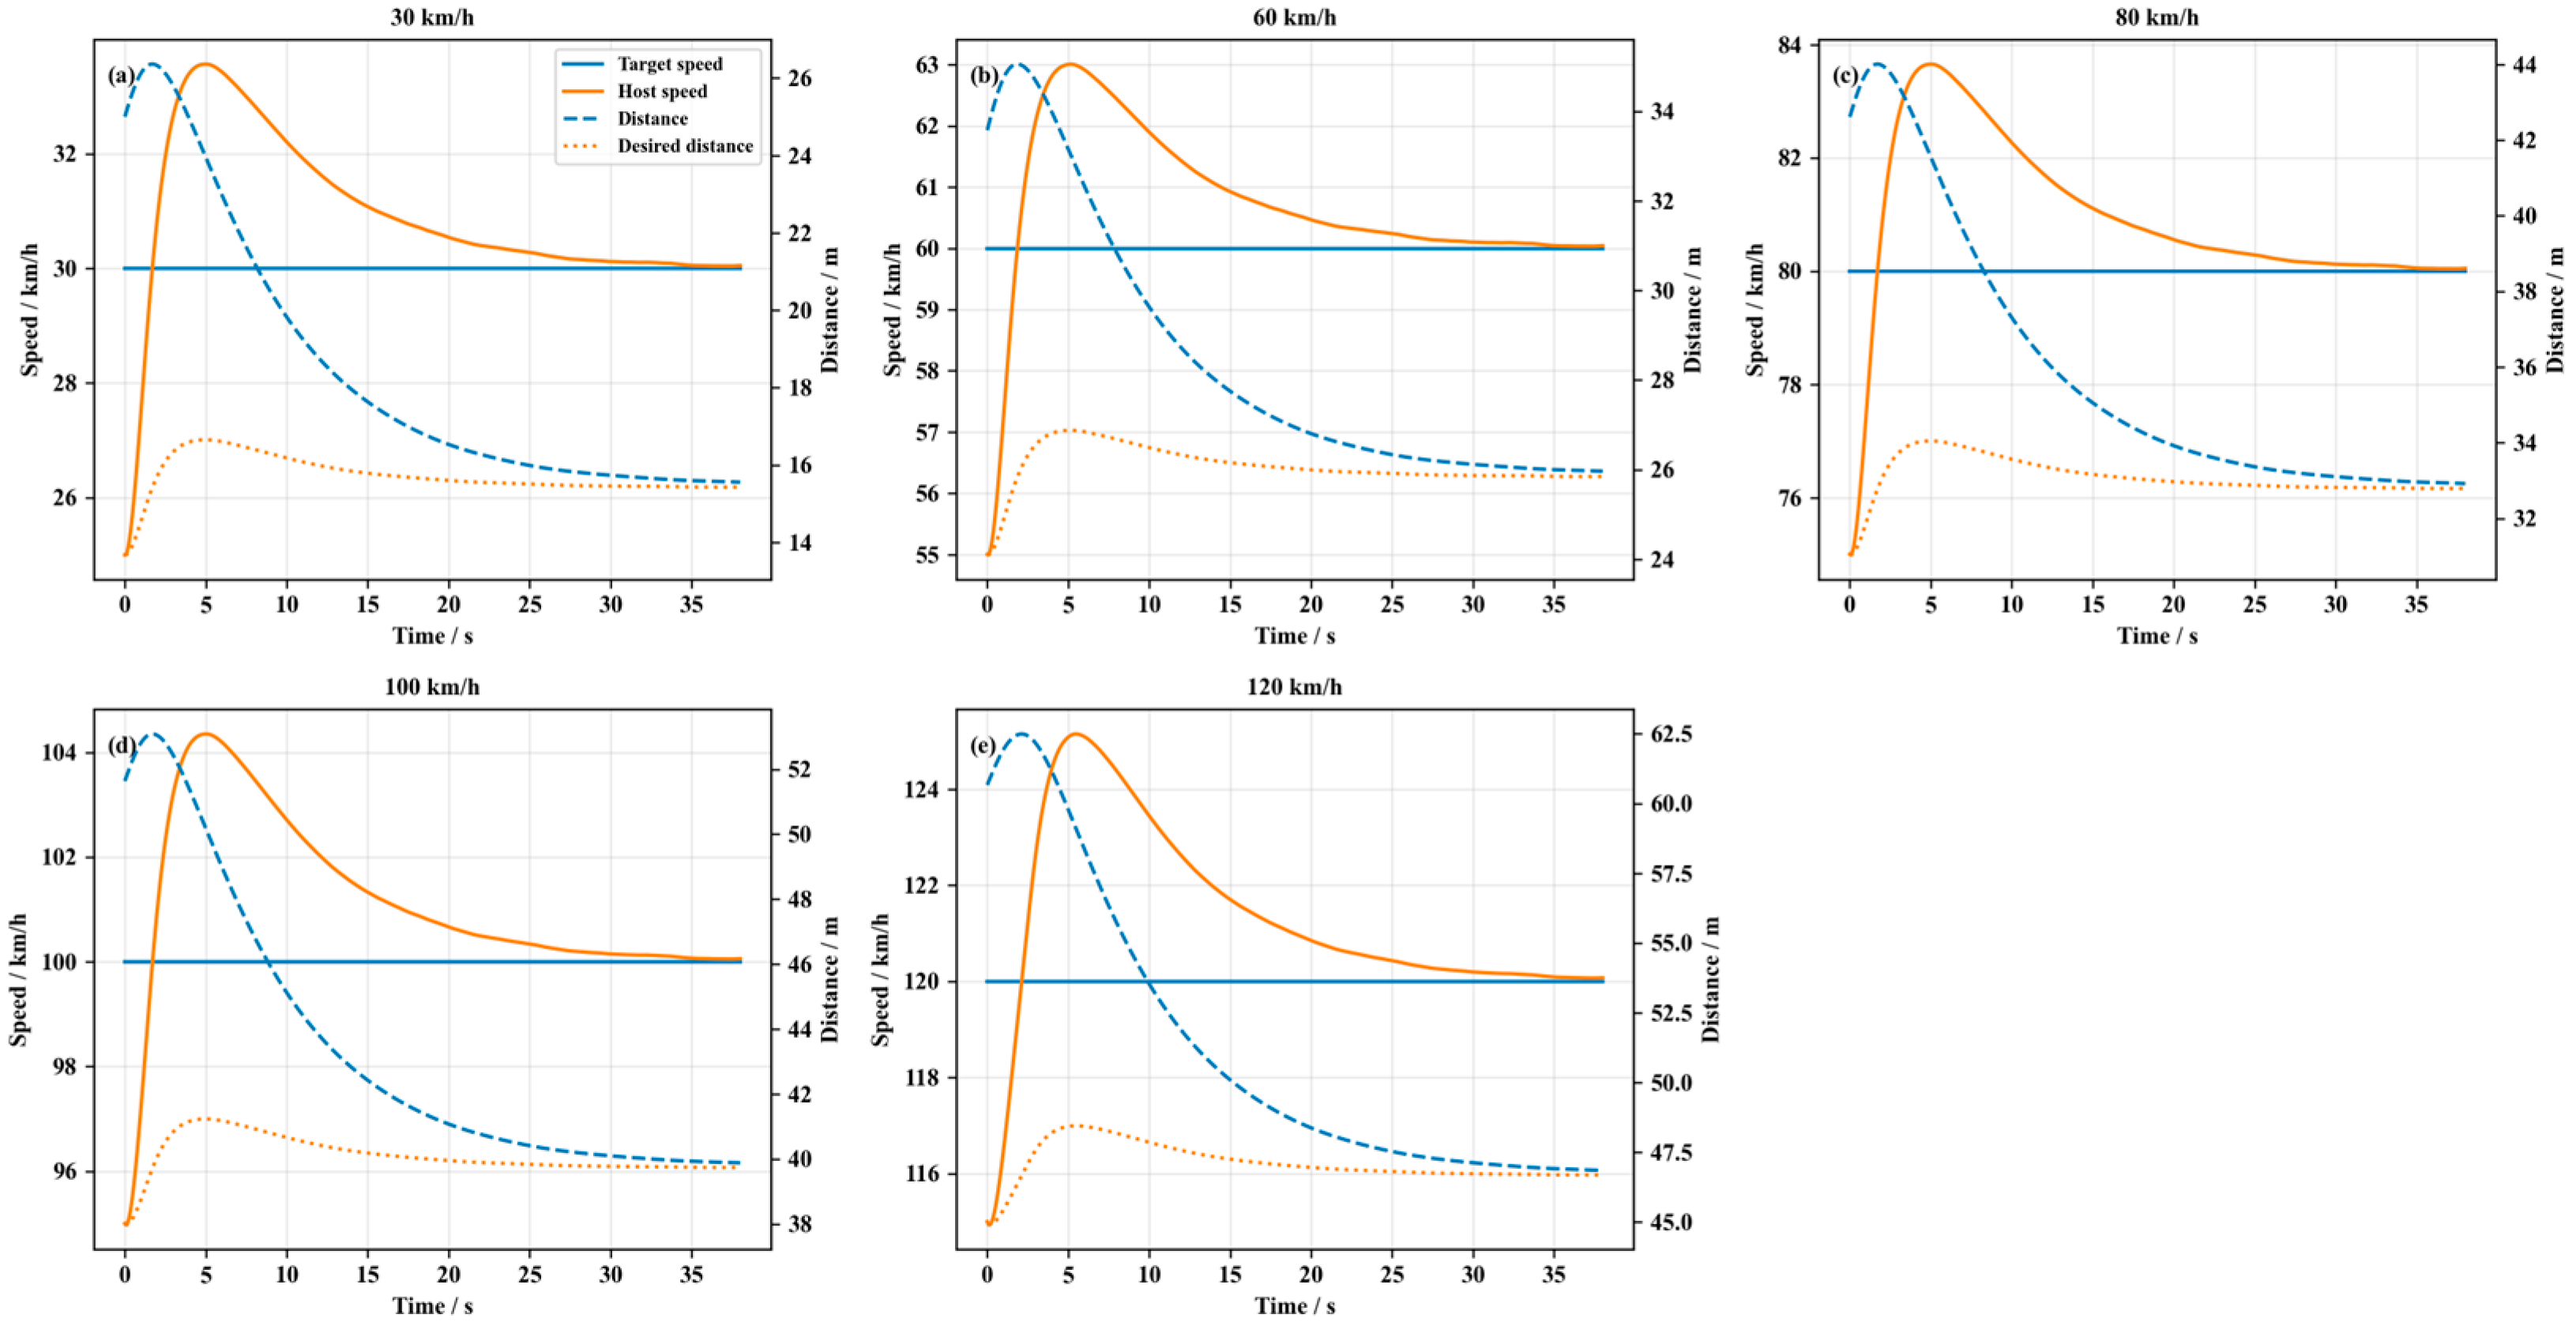
Figure 6 and
Figure 7 present the responses of the constant-speed following scenario
P2.
The host vehicle maintained stable speed tracking over the tested speed range. The mean absolute relative speed error remained within 0.1533–0.3081 m/s, and jrms remained within 0.0063–0.0083 m/s3. Therefore, the tested ACC system showed good speed-tracking accuracy and smoothness in steady following. However, the distance-related performance changed with speed. At 30–80 km/h, Dmin remained below 35 m, limiting the distance score. At 100 km/h, Dmin increased to 39.88 m. At 120 km/h, it further increased to 46.86 m. As a result, the P2 case score increased from 3.056 at 30–80 km/h to 3.704 at 100 km/h and 5.000 at 120 km/h. The average scenario-level score of P2 was 3.5744.
Overall, P1 and P2 show that the tested ACC system performs well in start-up smoothness and steady speed tracking. The main limitation in steady following is the relatively limited spacing reserve at low and medium speeds.
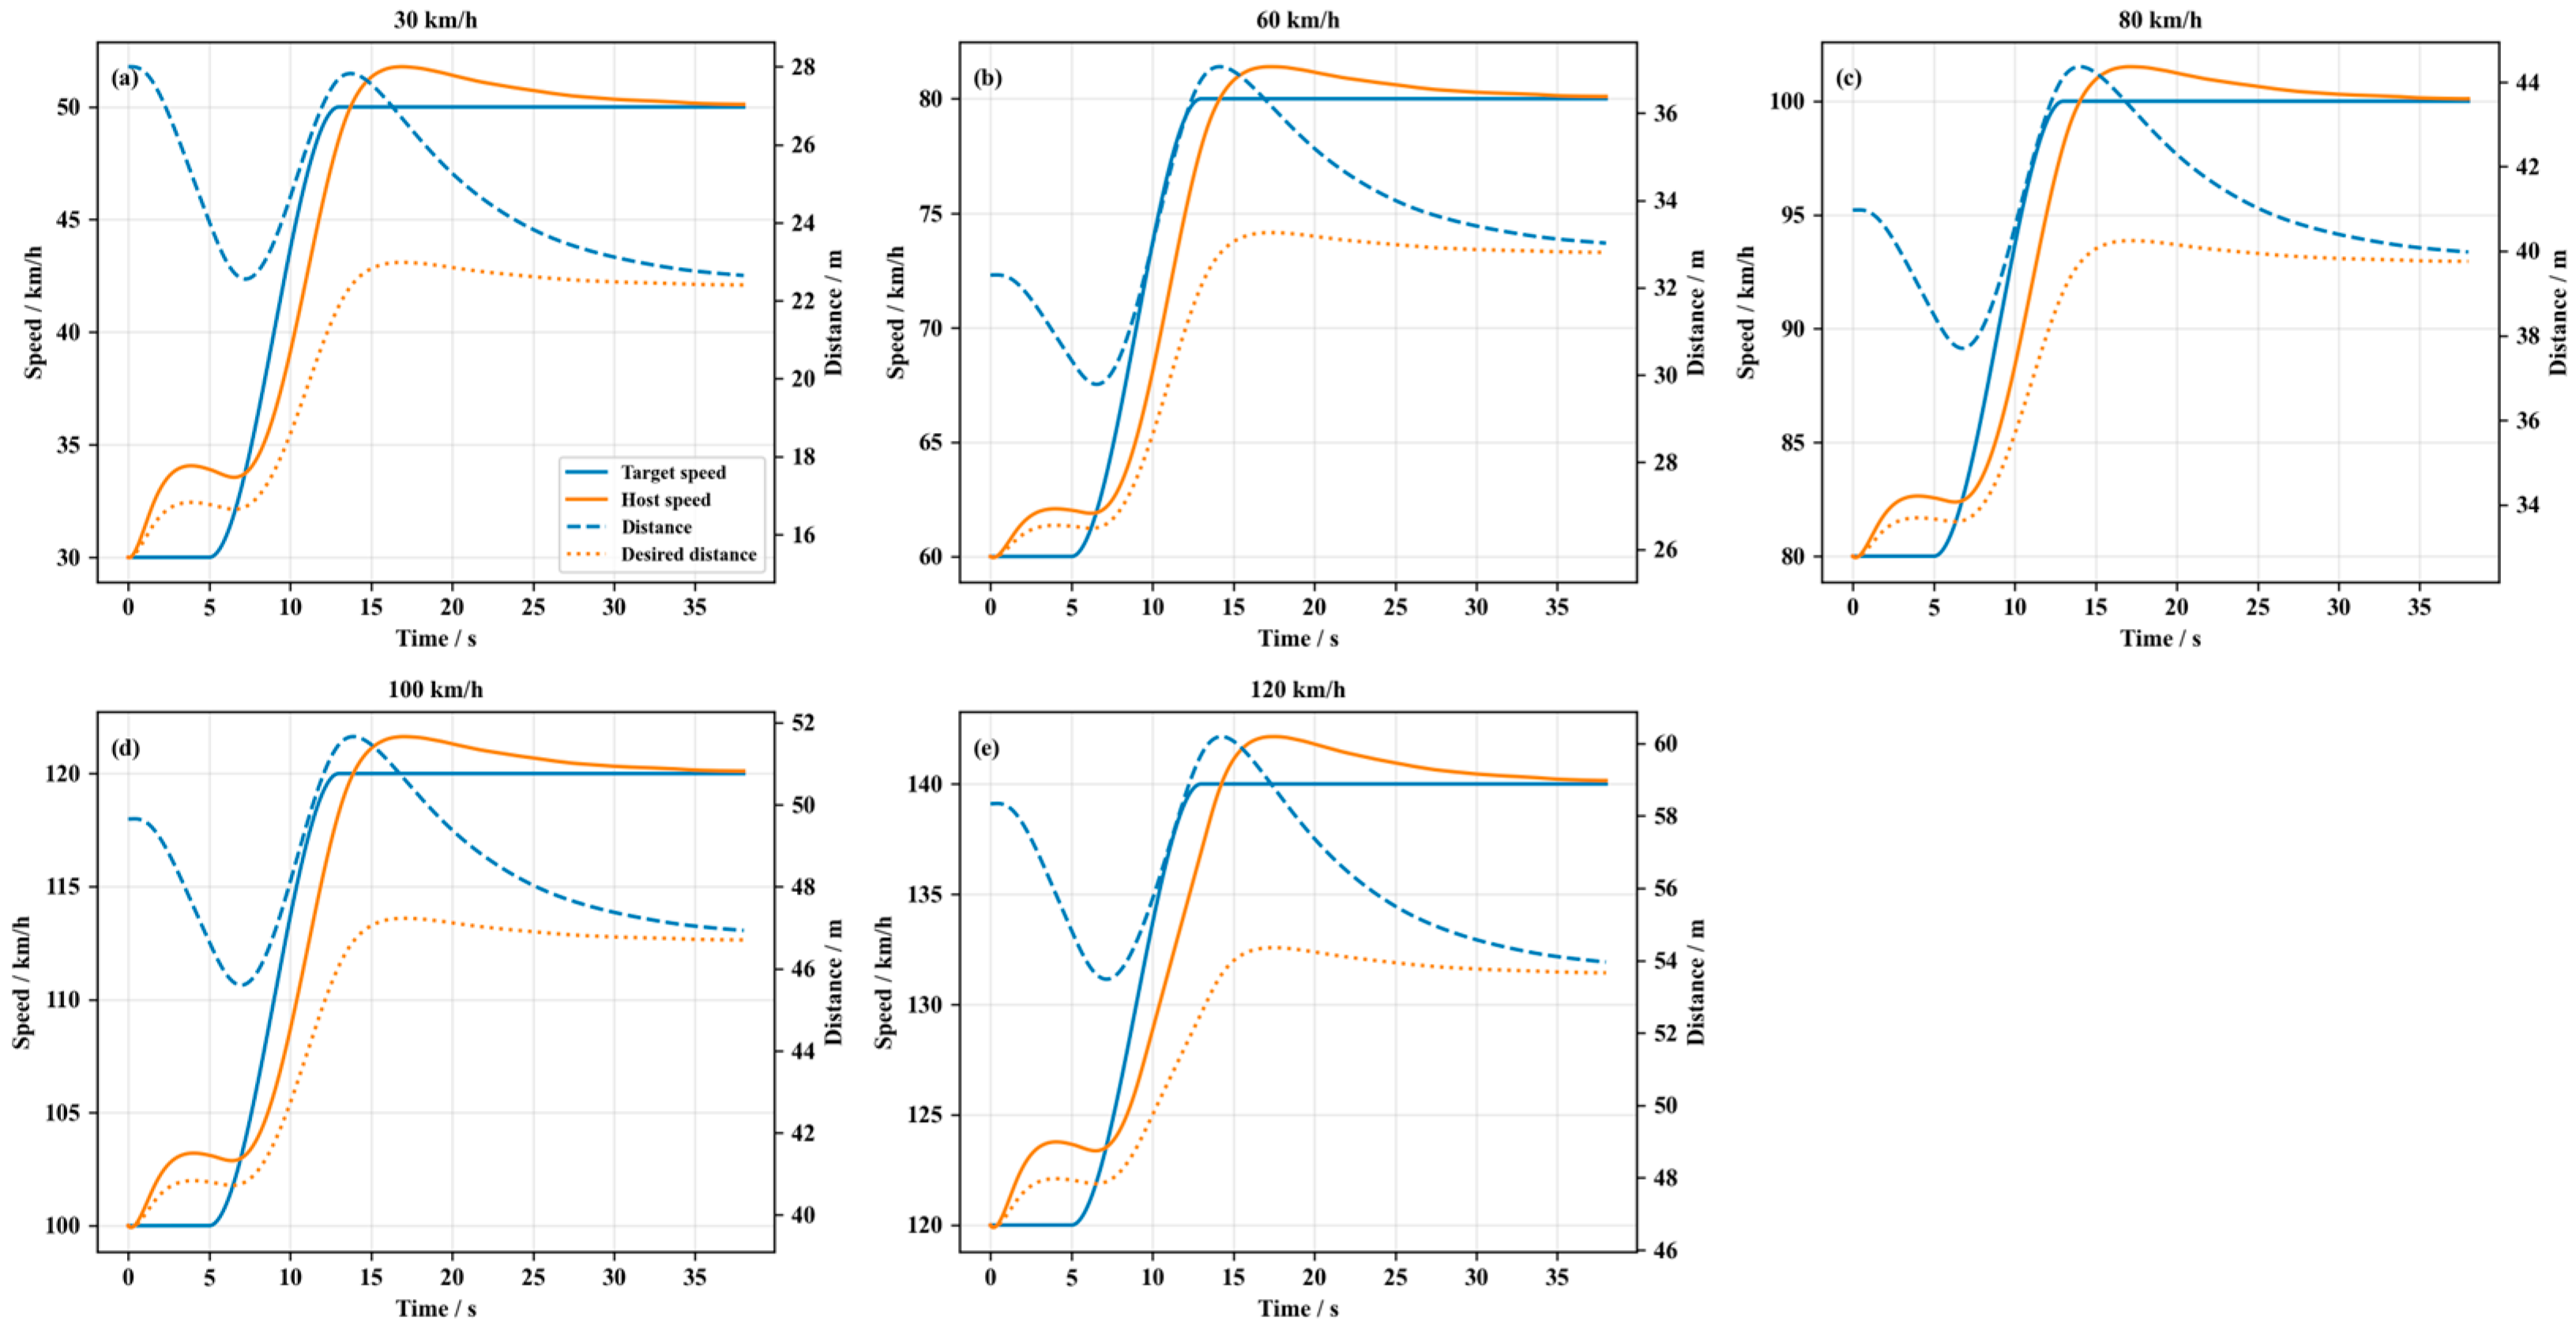
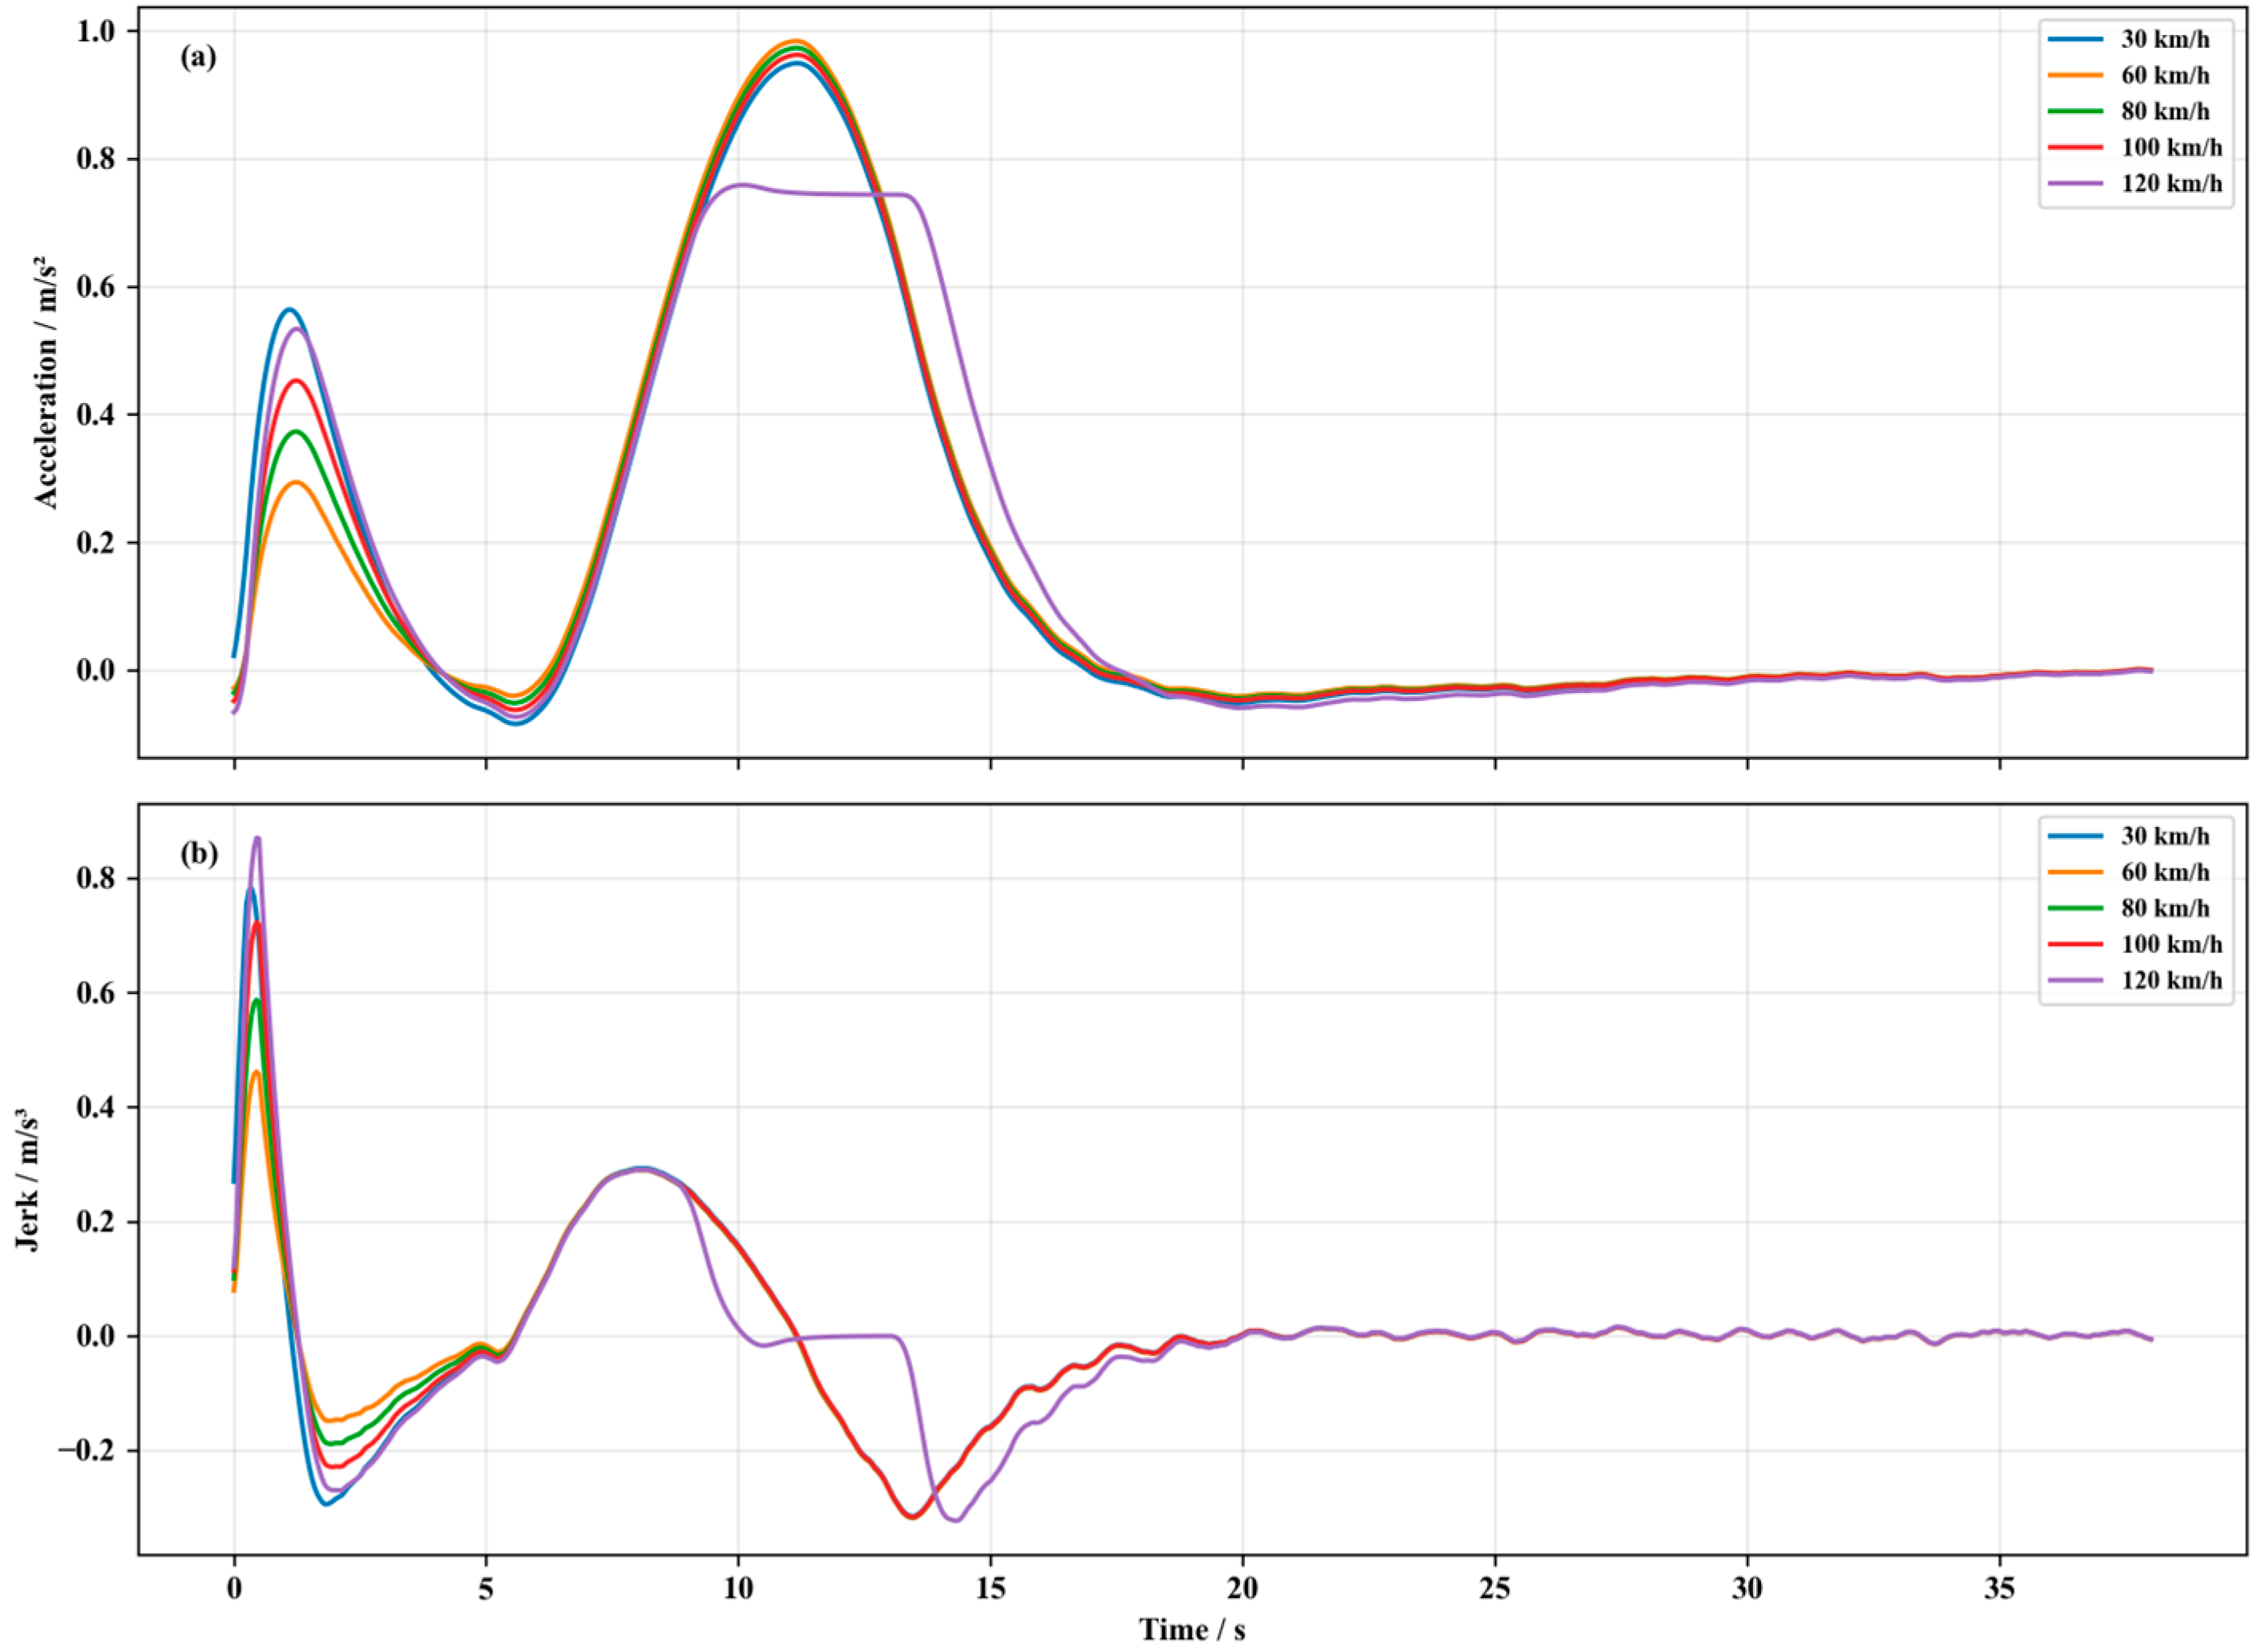
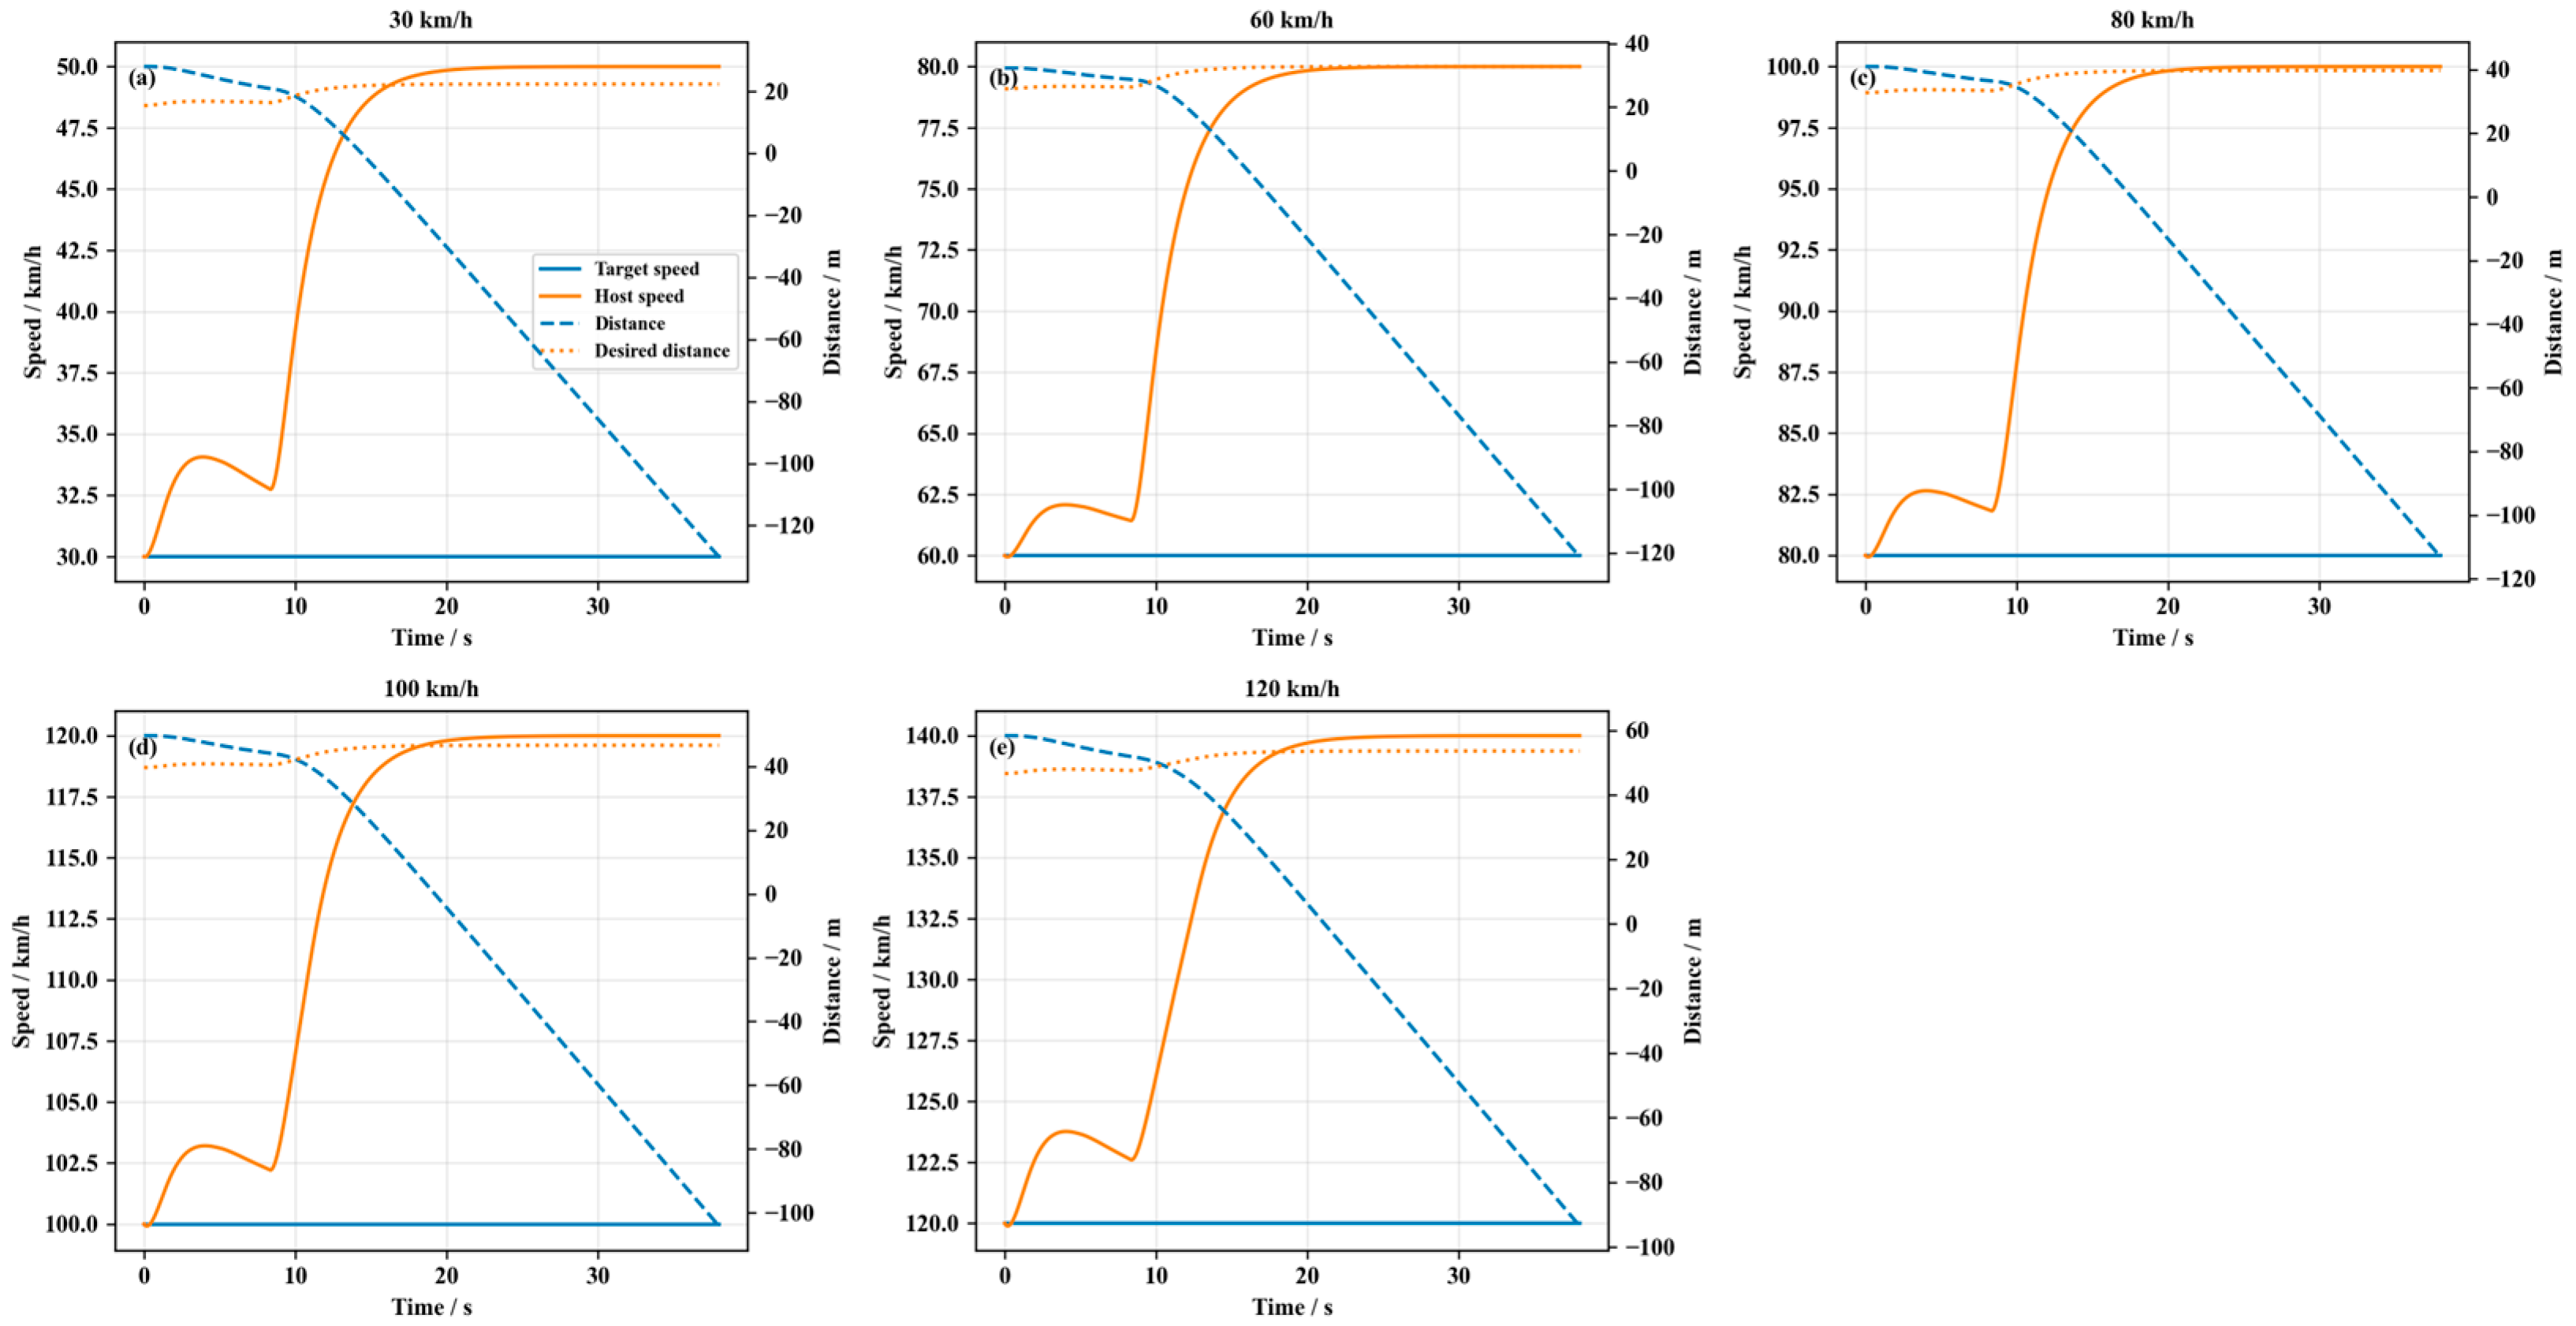
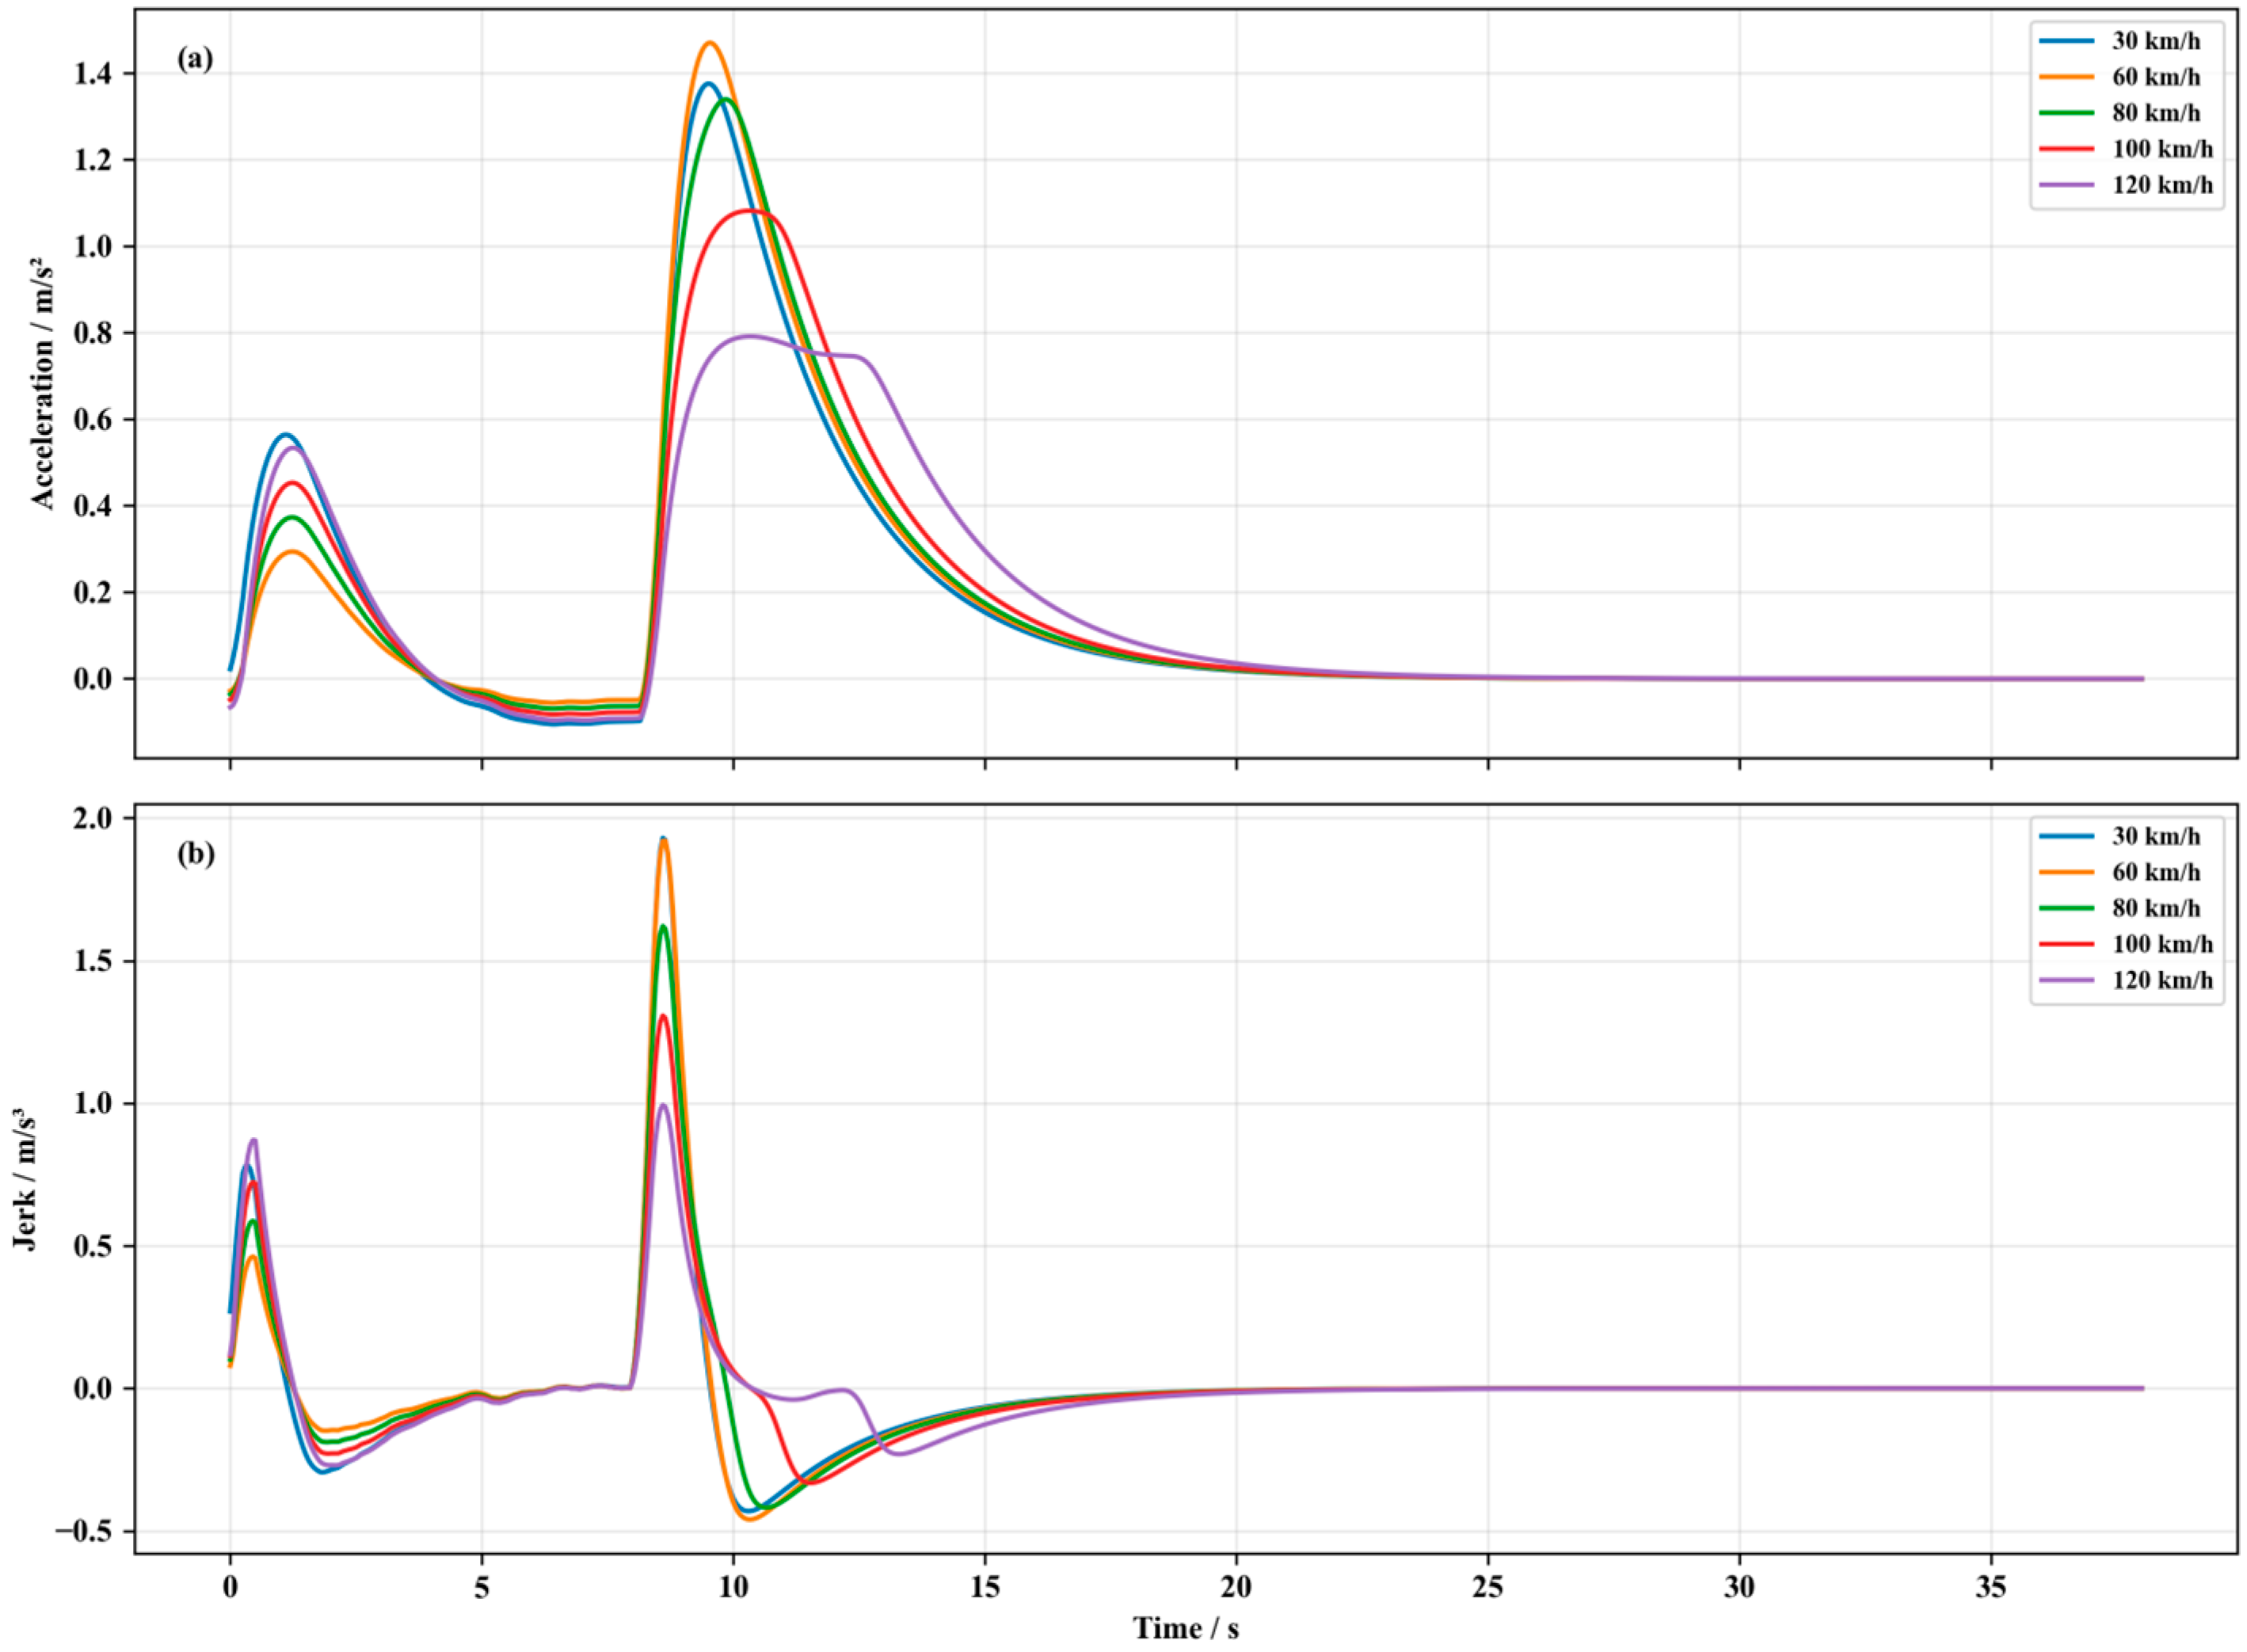
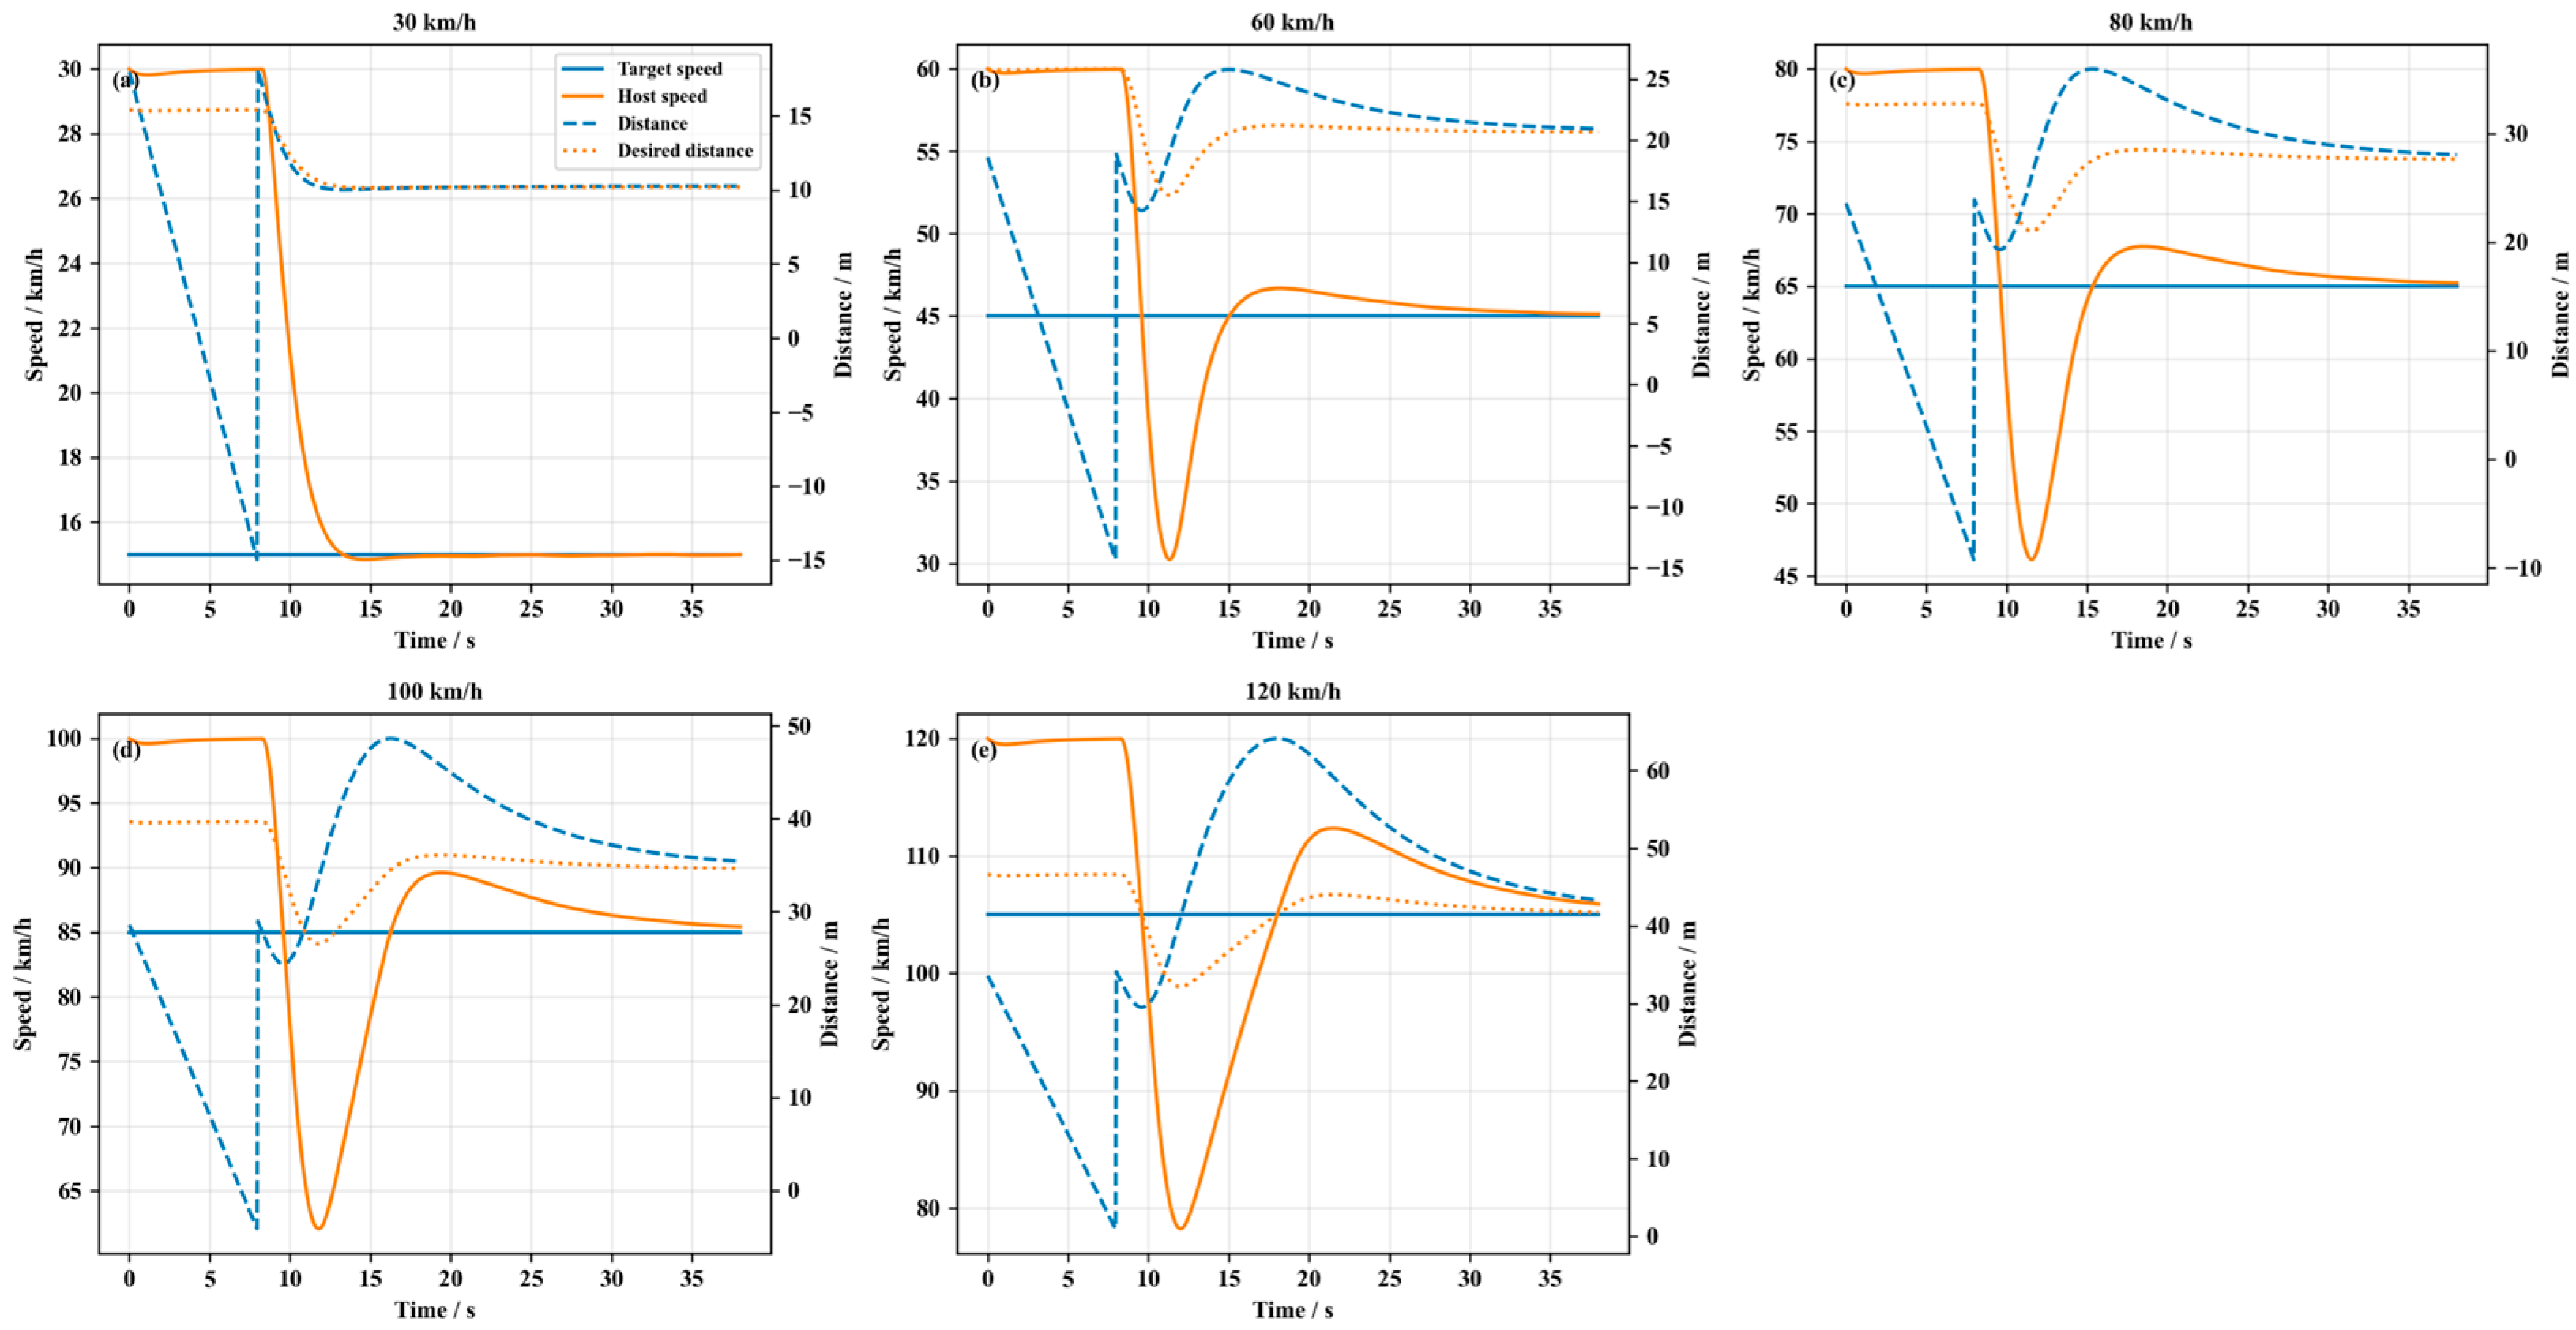
3.3.2. Preceding-Vehicle Acceleration and Deceleration
Figure 8 and
Figure 9 show the time-domain responses of the preceding-vehicle acceleration scenario
P3.
In P3, the host vehicle responded to the acceleration of the target vehicle, but the acceleration-following capability was limited. The positive acceleration RMS was only 0.3173–0.3463 m/s2. This indicates that the host vehicle did not provide a strong acceleration response after the target vehicle accelerated. The response time was also relatively long, ranging from 1.85 to 2.05 s. By contrast, the jerk response was smooth, with jrms remaining within 0.1050–0.1153 m/s3. Therefore, the main limitation of P3 was not ride smoothness, but insufficient acceleration response and delayed following. The scenario-case score was 2.774 for all five speeds, and the average P3 score was 2.7740. The response at 120 km/h was different from those at lower speeds. This difference was mainly related to the speed-dependent spacing policy and the acceleration-command constraint in the longitudinal controller. At higher speed, the desired spacing becomes larger, and the controller tends to generate a more conservative acceleration response to maintain longitudinal safety. Therefore, the 120 km/h case showed a different acceleration-response profile from the low- and medium-speed cases.
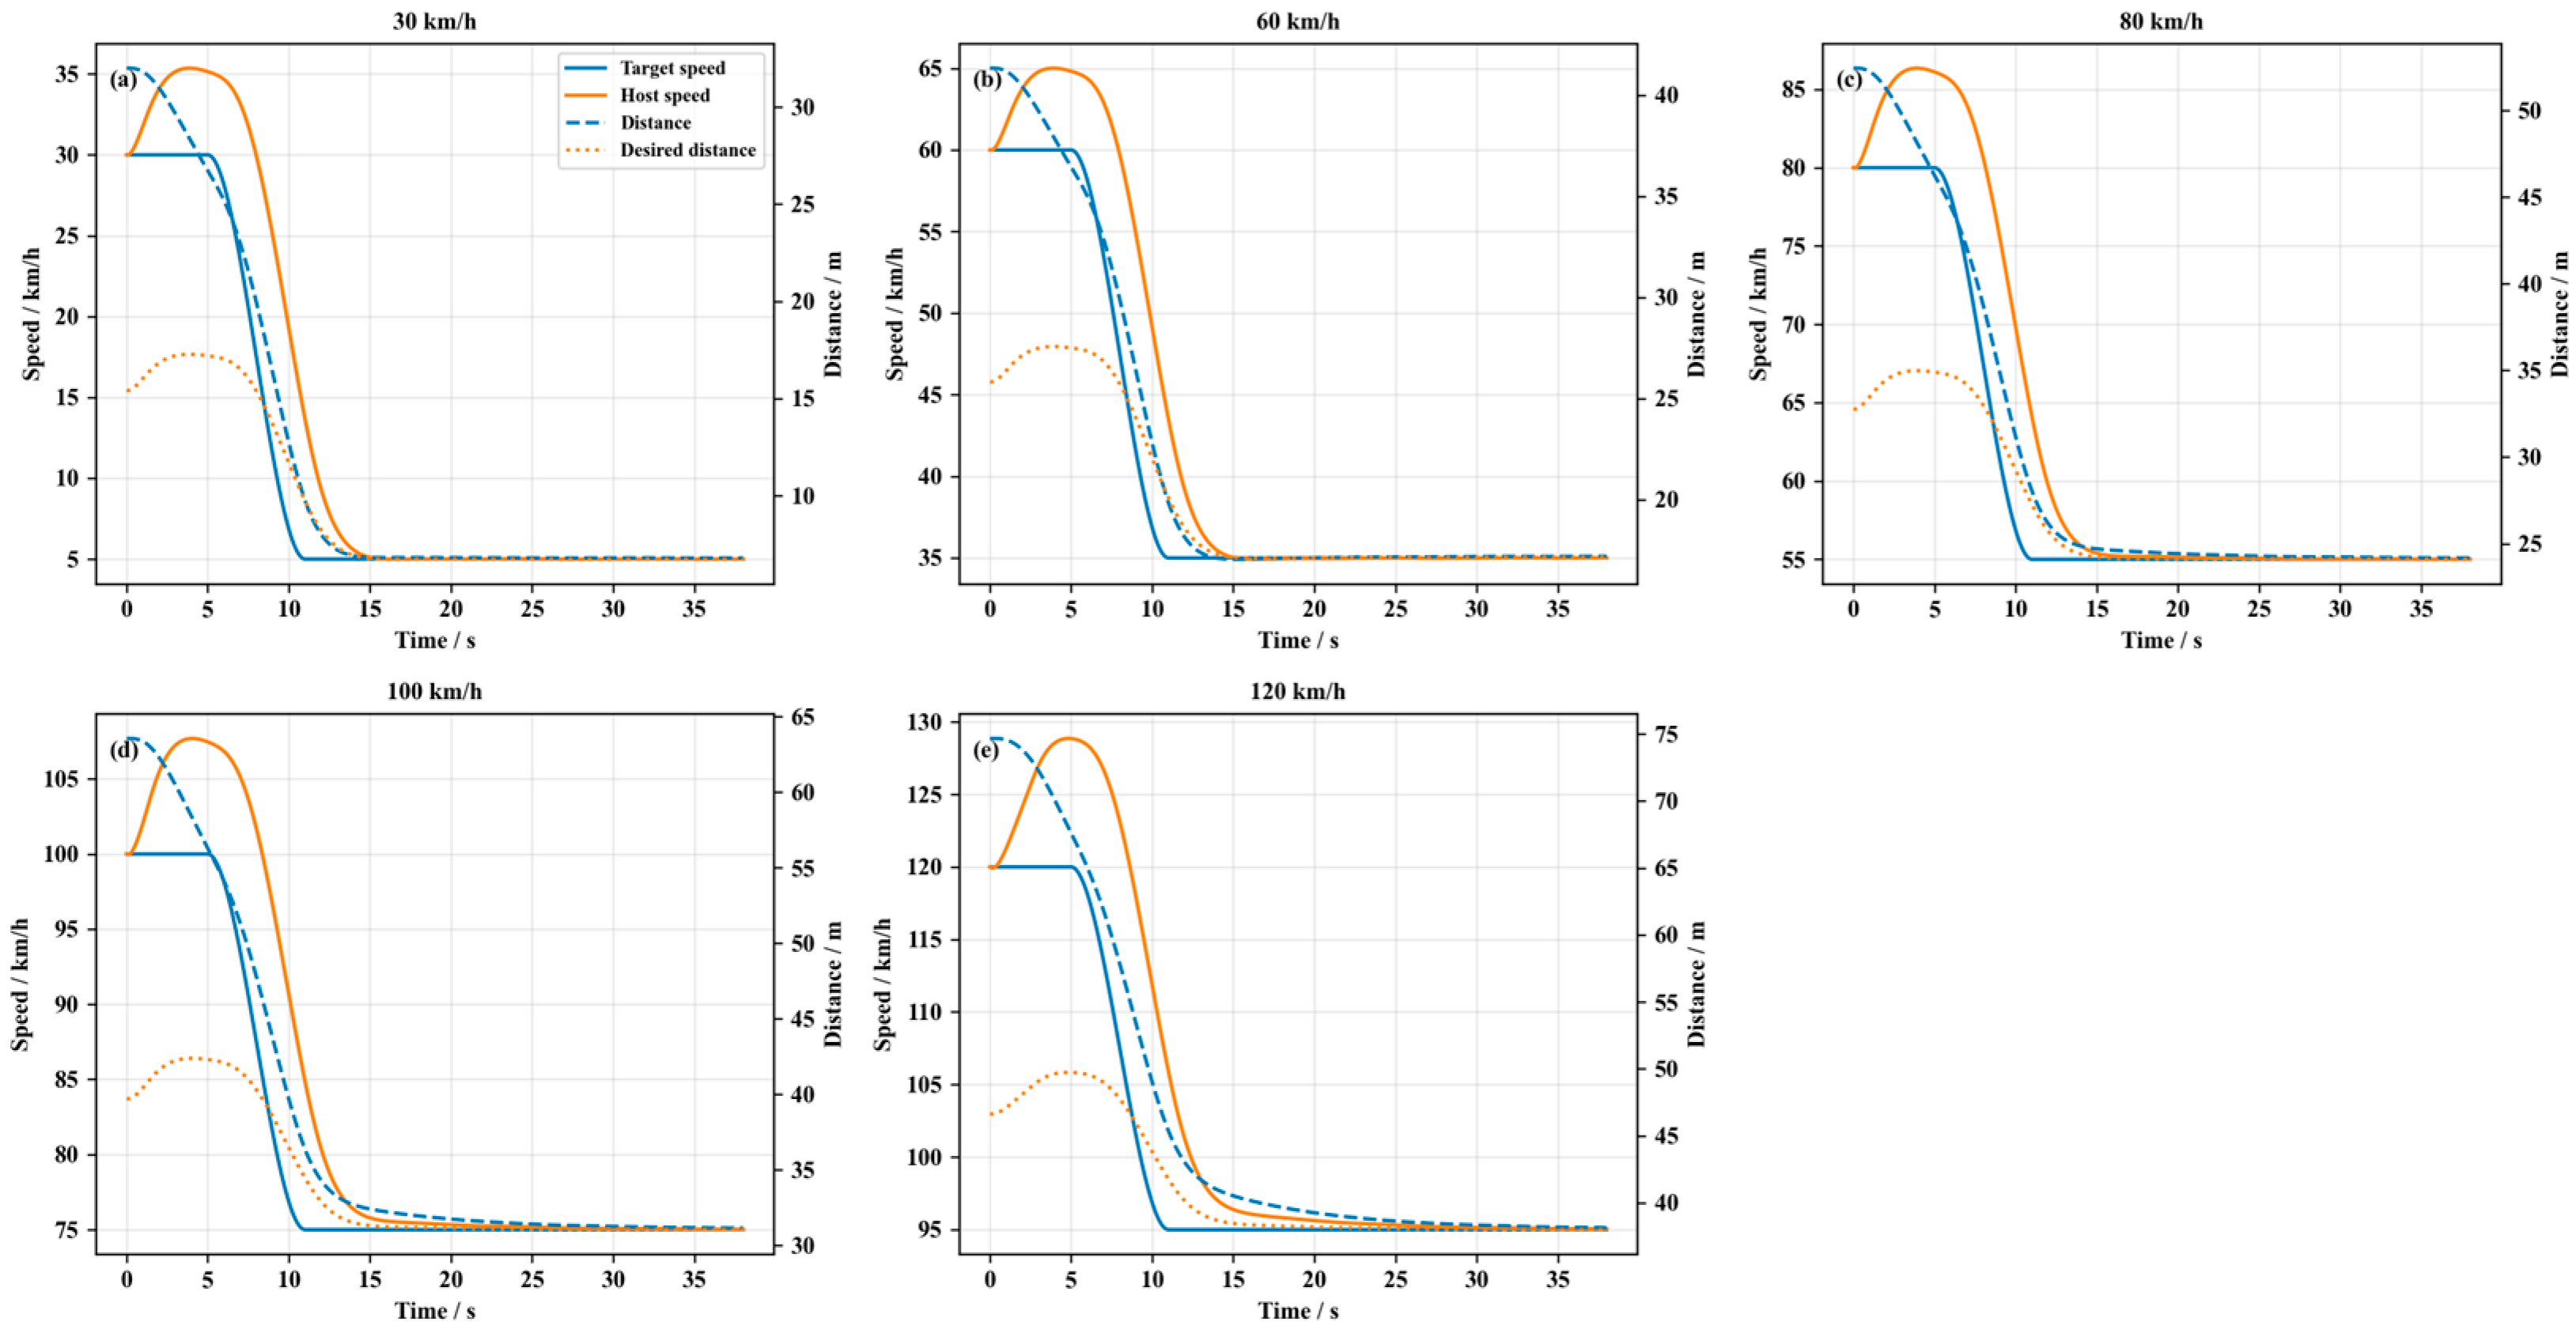
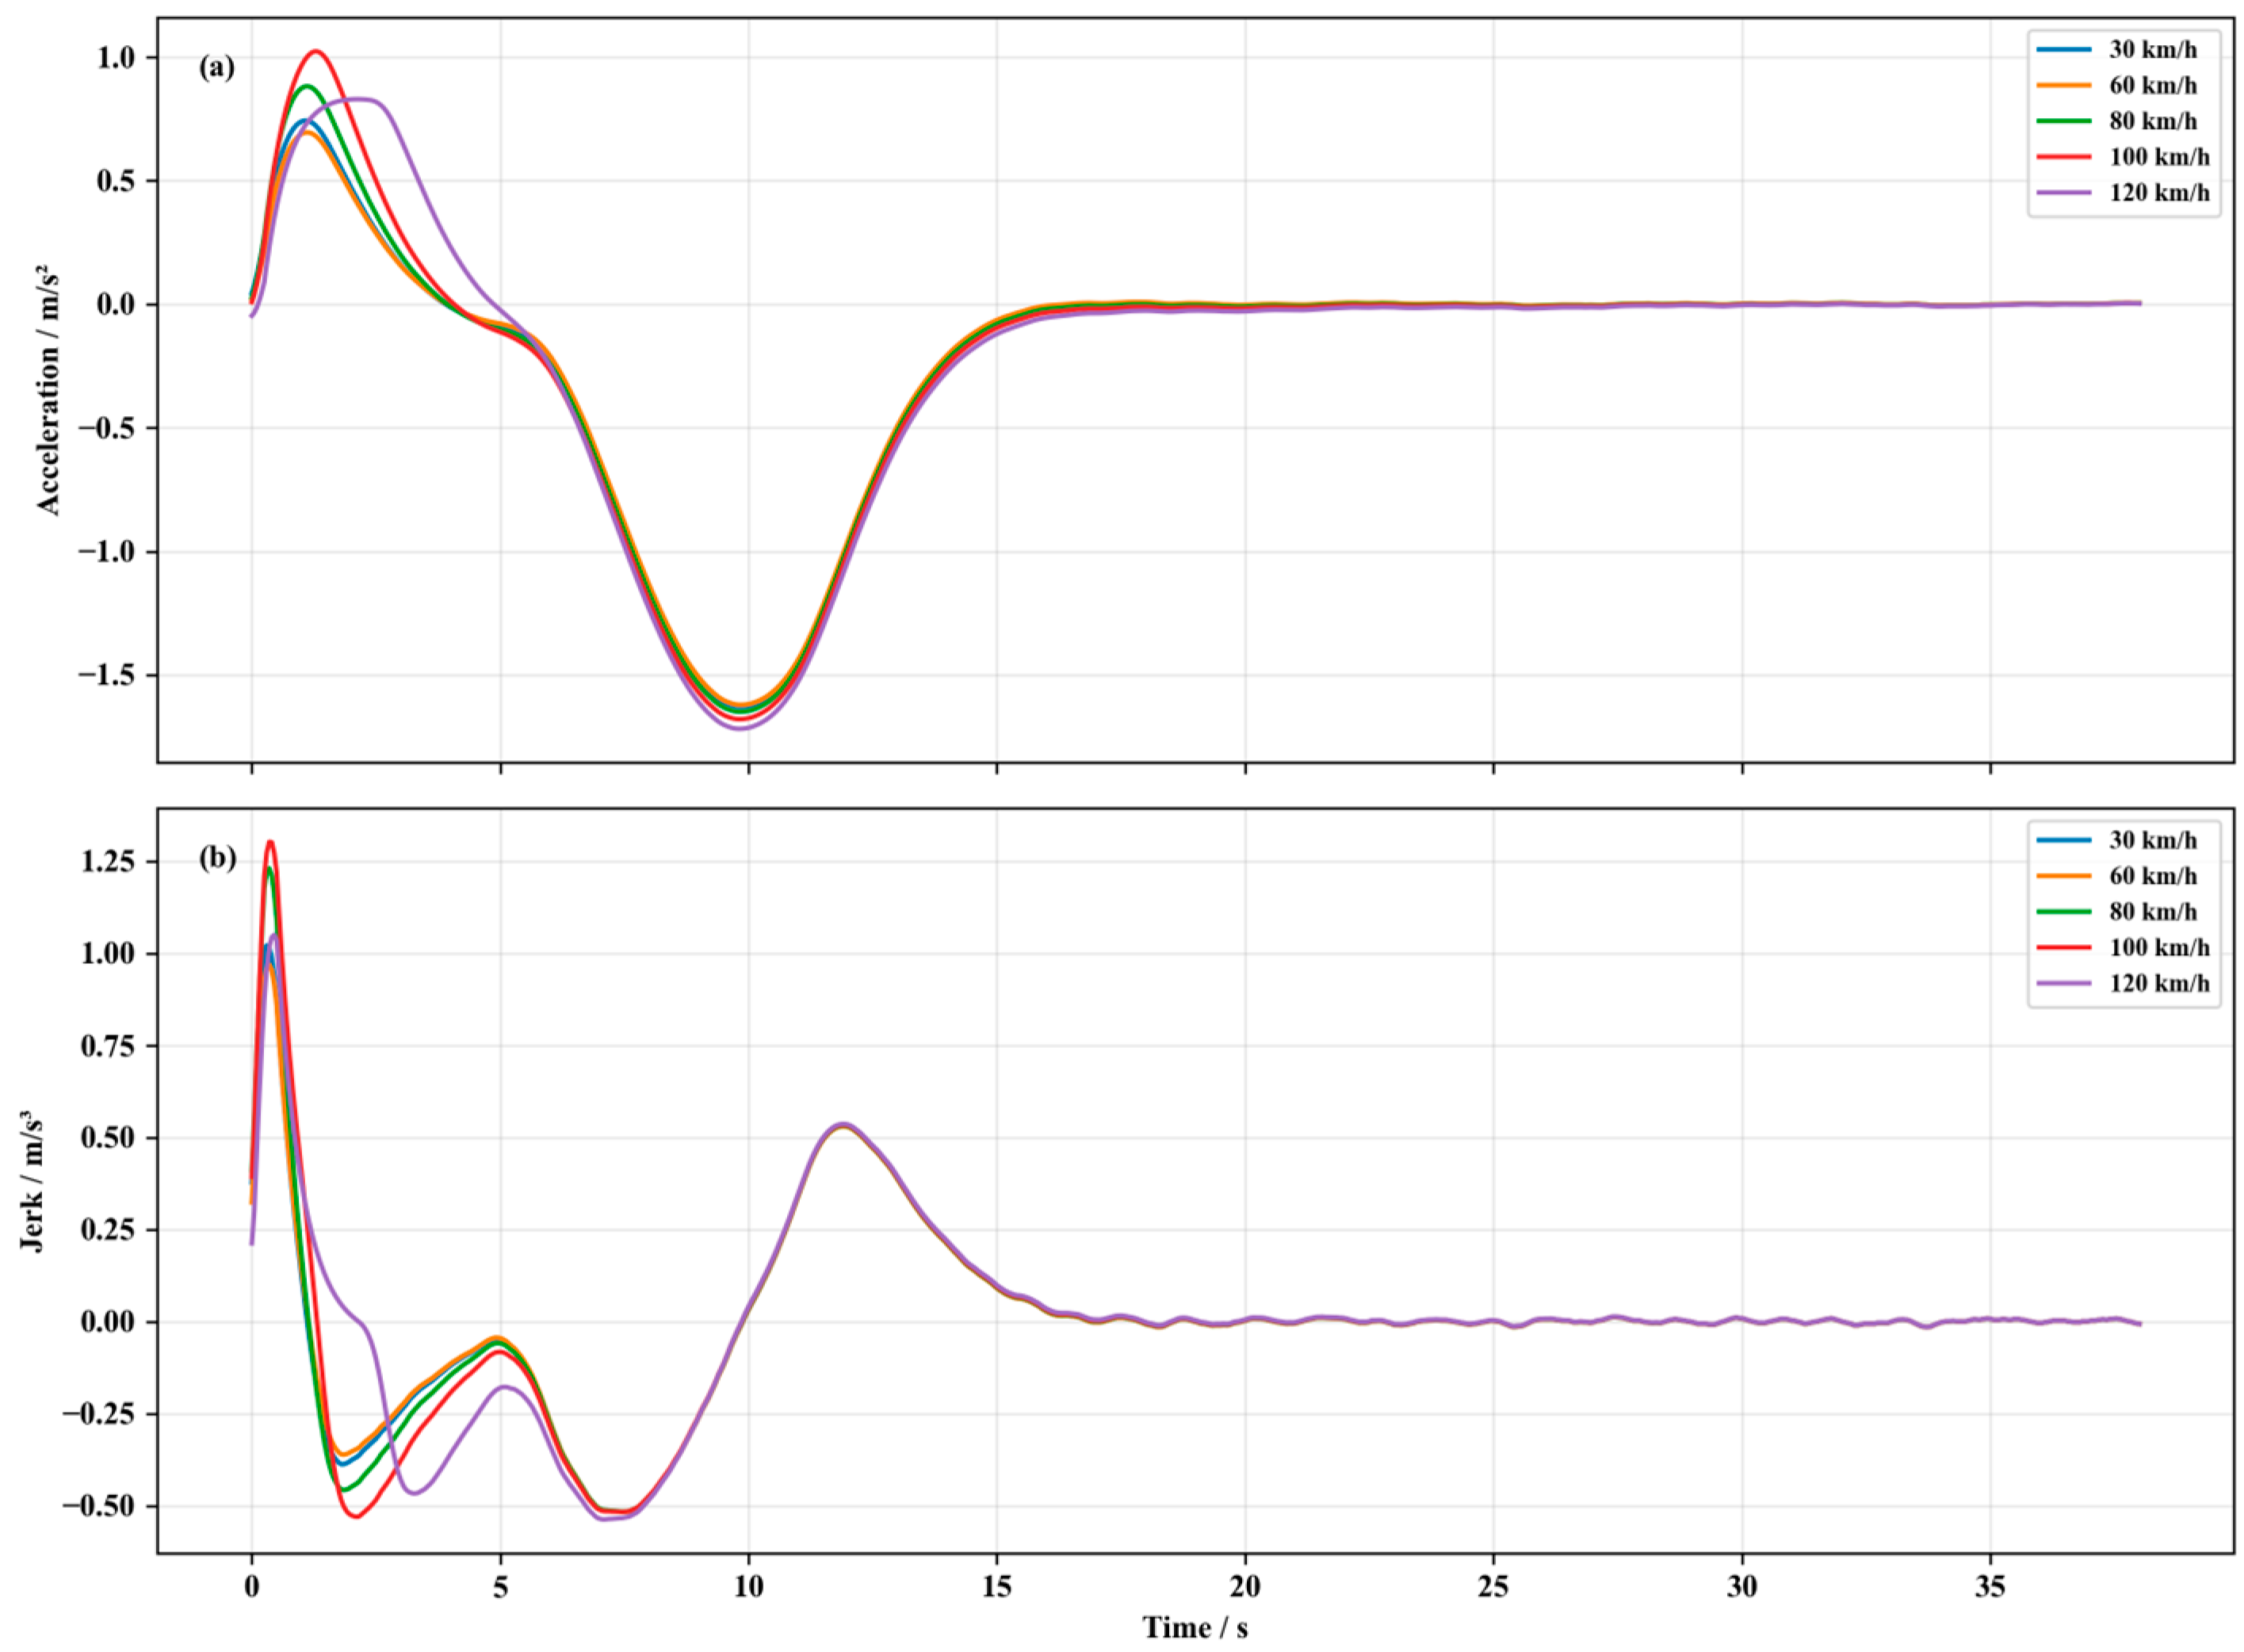
Figure 10 and
Figure 11 present the responses of the preceding-vehicle deceleration scenario
P4.
In P4, the host vehicle showed a prompt and smooth braking response. The response time ranged from 0 to 0.45 s, and |ax|rms remained within 0.5473–0.5885 m/s2. These results indicate that the braking action was not abrupt. However, the minimum spacing was insufficient in most cases. The Dmin values were 6.80, 17.06, 24.18, and 31.15 m at 30, 60, 80, and 100 km/h, respectively. These values were below the threshold for a higher distance score. At 120 km/h, Dmin increased to 38.14 m, and the scenario-case score increased to 3.426. The average P4 score was 2.9092.
The results of P3 and P4 indicate that dynamic response is a weak dimension of the tested ACC system. In acceleration following, the main issue is weak and delayed acceleration response. In deceleration following, the braking process is smooth and timely, but the spacing reserve is still insufficient.
3.3.3. Preceding-Vehicle Cut-Out and Cut-In
After the target vehicle cut out, the ACC system completed the control transition smoothly. The response time was 0.35 s in all five cases. The RMS absolute acceleration ranged from 0.3101 to 0.3938 m/s
2, and
jrms ranged from 0.1512 to 0.2871 m/s
3. These values all reached the highest scoring level according to the scoring criteria in
Section 2. Therefore, all five
P5 case scores were 5.000, and the average scenario-level score of
P5 was also 5.0000. This indicates that the tested ACC system has strong target-loss adaptability and good transition smoothness.
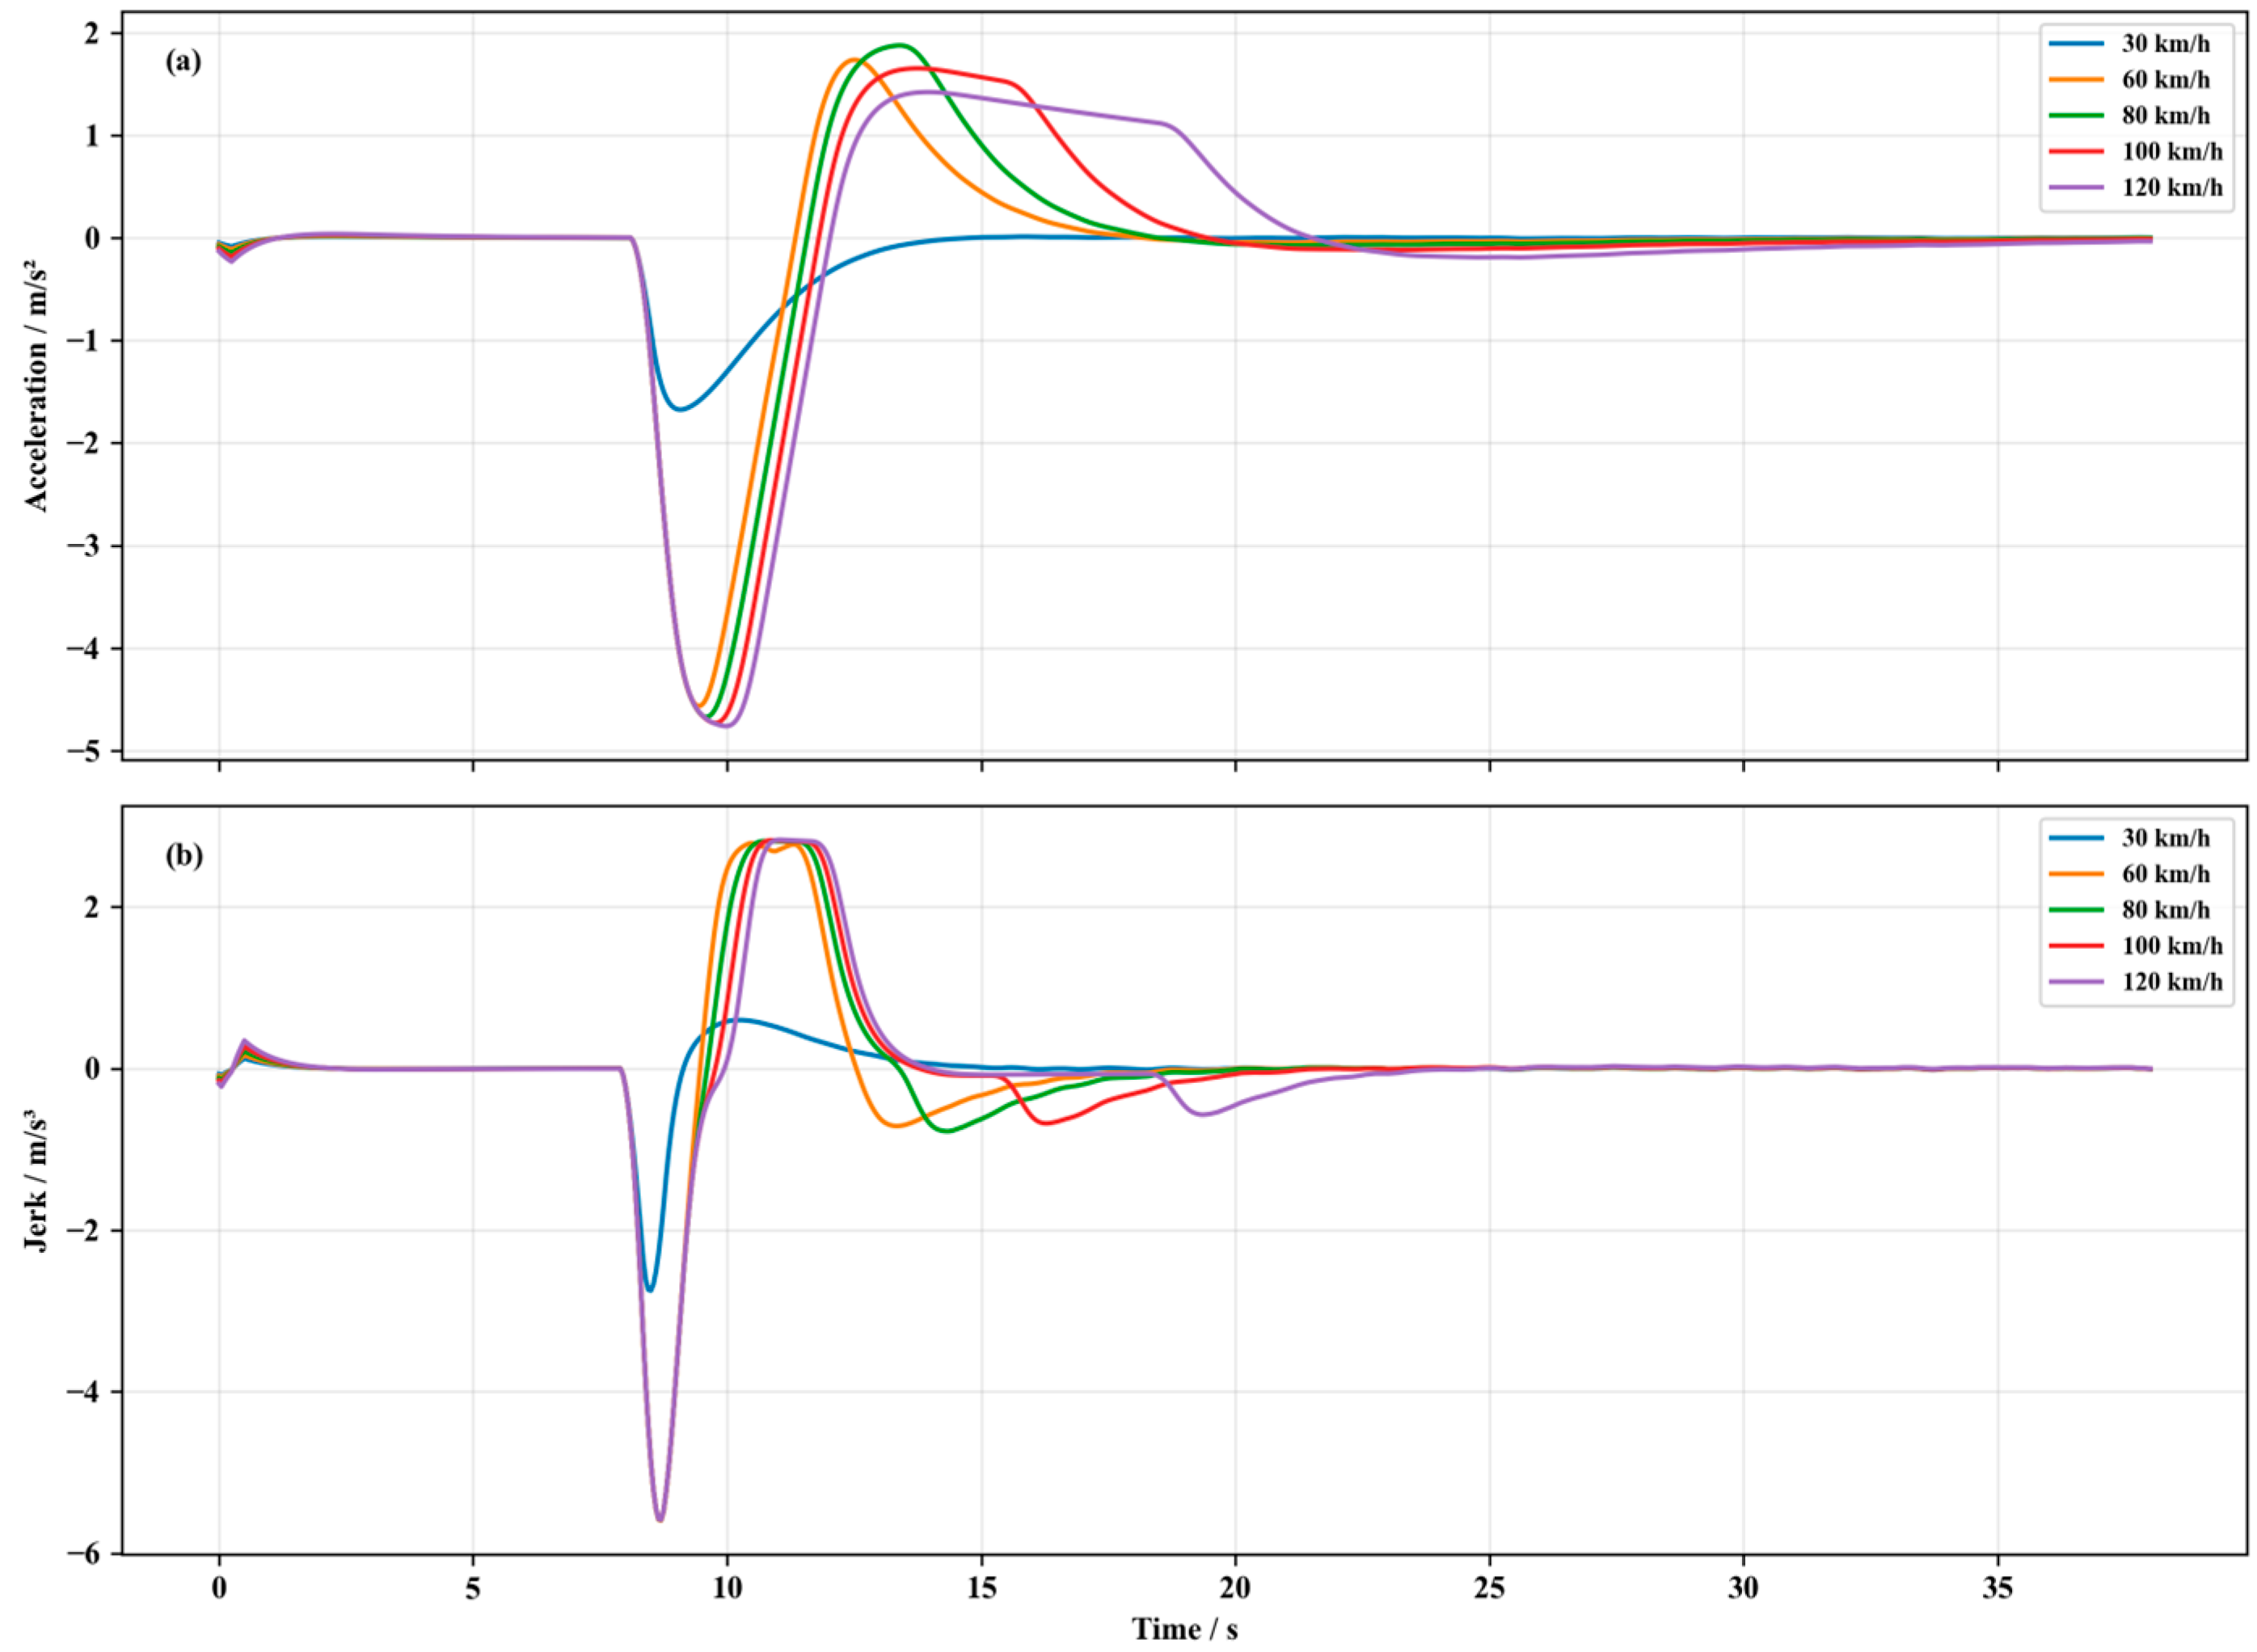
Figure 14 and
Figure 15 present the responses of the preceding-vehicle cut-in scenario
P6.
In P6, the ACC system reacted quickly after a new target vehicle appeared. The response time was 0.30 s for all five speeds. The jerk response was also acceptable. The value of jrms was 0.3672 m/s3 at 30 km/h and approximately 1.06–1.08 m/s3 at 60–120 km/h. However, the minimum spacing remained low. The Dmin values ranged from 10.04 to 29.54 m, which were all below the threshold for a higher distance score in the cut-in scenario. As a result, the P6 case score was 2.807 at 30 km/h and 2.726 at 60–120 km/h. The average P6 score was 2.7422.
The cut-out and cut-in results reveal an asymmetric target-transition behavior. The tested ACC system handled target disappearance well, but its safety margin after target insertion was limited. Therefore, cut-in handling is one of the main weak scenarios identified by the ACC-CPEIM.
3.4. Comprehensive Evaluation Results and Performance Diagnosis
After feature extraction and indicator scoring, the scenario-case scores were aggregated according to the ACC-CPEIM.
Table 9 summarizes the scenario-level evaluation results.
Table 9 shows not only the mean scenario-level scores, but also the case-level score ranges.
P5 obtained the highest and most stable score, with all five cases reaching 5.0000, indicating excellent target-loss transition in the co-simulation environment.
P1 also achieved a high mean score of 4.8334, although the 5 m and 6 m initial-spacing cases slightly reduced the lower bound.
P2 showed a wider range from 3.0560 to 5.0000, mainly because the distance-related score improved at higher speeds. By contrast,
P3,
P4, and P
6 remained the lowest-score scenarios.
P3 showed a constant low score of 2.7740 across all speeds, indicating a systematic limitation in acceleration-following response.
P4 and
P6 also remained low, mainly due to insufficient spacing reserve during deceleration and cut-in conditions.
The criterion-level scores were calculated from the scenario-level scores using the weights defined in
Section 2. The results are listed in
Table 10.
The overall ACC performance score was calculated as
The overall score indicates an acceptable but not excellent performance level. Among the five criteria, comfort achieved the highest score, ST5 = 4.5186. This result is mainly supported by the smooth start-up response in P1 and the low jerk in P2. Steady-state control also performed well, with ST1 = 4.0491, reflecting stable speed tracking and good cut-out transition performance.
By contrast, safety and dynamic response obtained lower scores. The safety score was ST4 = 2.8536, mainly because P4 and P6 both showed insufficient Dmin. The dynamic response score was ST2 = 2.8754, mainly due to the weak positive acceleration response and relatively long response time in P3. The target-transition adaptability score was ST3 = 3.4940. This medium-level score results from the large difference between P5 and P6: the cut-out transition was excellent, whereas the cut-in response was limited by the distance safety margin.
To further evaluate speed-dependent performance, the overall score was calculated under different speed conditions. The results are shown in
Table 11.
The speed-dependent scores remain close from 30 to 100 km/h, ranging from 3.2274 to 3.2812. At 120 km/h, the score increases to 3.6332. This increase is mainly caused by the improved distance-related scores in P2 and P4, where the larger spacing at high speed leads to better distance-score results under the current scoring criteria. However, this does not mean that the high-speed ACC response is free of risk. The cut-in scenario still shows limited spacing reserve, and P6 remains one of the weakest scenarios.
Because
Dmin is an absolute spacing feature, its score may increase at high speed when the controller adopts a larger spacing policy. Therefore, the higher score at 120 km/h should not be interpreted as a complete safety improvement. The distance safety margin
MD,min defined in
Section 2.2 was retained as a diagnostic feature, and future work will further incorporate speed-normalized risk indicators, such as time headway, time-to-collision, and required deceleration, into the scoring layer.
Overall, the co-simulation evaluation shows that the tested ACC system performs well in start-up comfort, steady following, and cut-out transition. Its main weaknesses are acceleration-following response, spacing reserve during deceleration, and cut-in safety margin. These results confirm that the ACC-CPEIM can provide not only a comprehensive numerical score but also interpretable diagnostic information at the criterion, scenario, and test-case levels.
3.5. Robustness and Comparative Analysis of the Evaluation Results
To further examine the robustness and diagnostic value of the proposed ACC-CPEIM, additional analyses were conducted based on the co-simulation results. The purpose of these analyses was not to replace the scenario-level evaluation in
Section 3.4, but to examine whether the main diagnostic conclusions were strongly dependent on a specific weight setting, scoring threshold, or aggregation scheme. Three analyses were performed. First, the criterion-layer weights were perturbed to evaluate the influence of the AHP-based weights. Second, the scoring thresholds were adjusted to evaluate the influence of the grading criteria in
Table 7. Third, the proposed ACC-CPEIM was compared with simplified alternative evaluation schemes to clarify its diagnostic advantage.
3.5.1. Sensitivity Analysis of Criterion-Layer Weights
Because the criterion-layer weights were obtained using the AHP, their influence on the final evaluation result was examined. The original AHP weights were used as the baseline. Then, the safety weight was increased and decreased by 10%, and the remaining criterion weights were renormalized. In addition, an equal-criterion-weight case was considered as a reference, in which the five criterion-layer dimensions were assigned the same weight. The criterion-level scores listed in
Table 10 were used for this analysis.
As shown in
Table 12, increasing or decreasing the safety weight by 10% produced only a small change in the overall score. When equal criterion weights were used, the overall score increased to 3.5581 because the high scores of steady-state control and comfort received larger relative influence. However, the low-score criteria were still dynamic response T2 and safety T4, and the weak scenarios remained P3, P4, and P6. Therefore, the main diagnostic conclusion was not determined by a single subjective criterion-weight setting. The original AHP-based weighting scheme produced a stricter result because it emphasized safety, which is consistent with the safety-first requirement of ACC evaluation.
3.5.2. Sensitivity Analysis of Scoring Thresholds
The scoring thresholds in
Table 7 directly affect the conversion from raw response features to dimensionless score variables. Therefore, a threshold-sensitivity analysis was conducted. The original thresholds were used as the baseline. Then, a relaxed-threshold case and a strict-threshold case were constructed. For smaller-is-better indicators, such as response time, jerk, and RMS acceleration, the relaxed case increased the threshold values by 10%, whereas the strict case decreased the threshold values by 10%. For larger-is-better indicators, such as minimum spacing and acceleration-following capability, the relaxed case decreased the threshold values by 10%, whereas the strict case increased the threshold values by 10%. The purpose of this analysis was to examine whether the weak-scenario diagnosis changed when the grading criteria were slightly modified.
As shown in
Table 13, the absolute overall score changed when the thresholds were relaxed or tightened. The relaxed-threshold case increased the overall score to 3.4226, whereas the strict-threshold case decreased the score to 3.2536. However, the weak scenarios remained P3, P4, and P6 in all cases. This result indicates that the weak-scenario diagnosis was mainly supported by the observed time-domain response characteristics, rather than being caused only by a specific set of threshold values. In particular, the low score of P3 was associated with weak acceleration-following capability and delayed response, the low score of P4 was associated with insufficient spacing reserve during deceleration, and the low score of P6 was associated with limited spacing margin after cut-in.
3.5.3. Comparison with Simplified Evaluation Schemes
To further clarify the diagnostic value of the proposed ACC-CPEIM, it was compared with simplified evaluation schemes using the same co-simulation results. The simplified schemes included single-indicator evaluation, unweighted scenario averaging, and equal-criterion-weight aggregation. These schemes represent common simplified ways of interpreting ACC performance, but they differ in the amount of diagnostic information that can be obtained.
As shown in
Table 14, the simplified aggregation schemes produced higher overall scores than the proposed ACC-CPEIM. This is mainly because the high scores in P1, P5, T1, and T5 received larger relative influence when scenario or criterion weights were treated equally. However, equal aggregation weakens the safety-first logic of ACC performance evaluation. The proposed ACC-CPEIM gives a lower but more conservative overall score because safety-related and target-transition-related dimensions have higher weights. More importantly, the ACC-CPEIM preserves the traceability of the result. The overall score can be traced back to criterion-level limitations, scenario-level weak points, and case-level score features. This diagnostic traceability is difficult to obtain from a single-indicator evaluation or a simple average score.
Overall, the robustness and comparative analyses indicate that the main conclusions of the co-simulation evaluation are stable. Although the absolute overall score changes when the weights, thresholds, or aggregation schemes are adjusted, the main weak points remain associated with acceleration-following response, deceleration spacing reserve, and cut-in spacing margin. Therefore, the proposed ACC-CPEIM should be interpreted not only as a method for generating a compact overall score, but also as a traceable diagnostic framework for identifying weak ACC performance dimensions and scenarios.
4. Vehicle-Test Application of the ACC-CPEIM
4.1. Vehicle-Test Platform and Scenario Coverage
To further examine the applicability of the proposed ACC-CPEIM under vehicle-test conditions, the measured longitudinal response data were processed using the feature extraction, score conversion, and aggregation rules defined in
Section 2. The vehicle-test dataset covered the six typical ACC scenarios, including preceding-vehicle start, constant-speed following, preceding-vehicle acceleration, preceding-vehicle deceleration, preceding-vehicle cut-out, and preceding-vehicle cut-in. For each scenario, the raw time-domain signals were converted into score-related features, scenario-level scores, criterion-level scores, and the overall vehicle-test score.
It should be noted that the vehicle-test section is not intended to directly validate the co-simulation controller. The co-simulation study and the vehicle-test application involve different ACC systems. In the co-simulation part, the ACC behavior was generated by the controller implemented in Simulink under controlled and repeatable test conditions. In the vehicle-test part, the evaluated system was the production ACC function of the host vehicle. Therefore, the role of the vehicle-test section is to examine whether the same ACC-CPEIM feature extraction, score conversion, and aggregation chain can be applied to measured vehicle-test data. In this sense, the co-simulation results provide a repeatable full-scenario evaluation example, whereas the vehicle-test results demonstrate the engineering applicability of the proposed evaluation framework to measured longitudinal response signals.
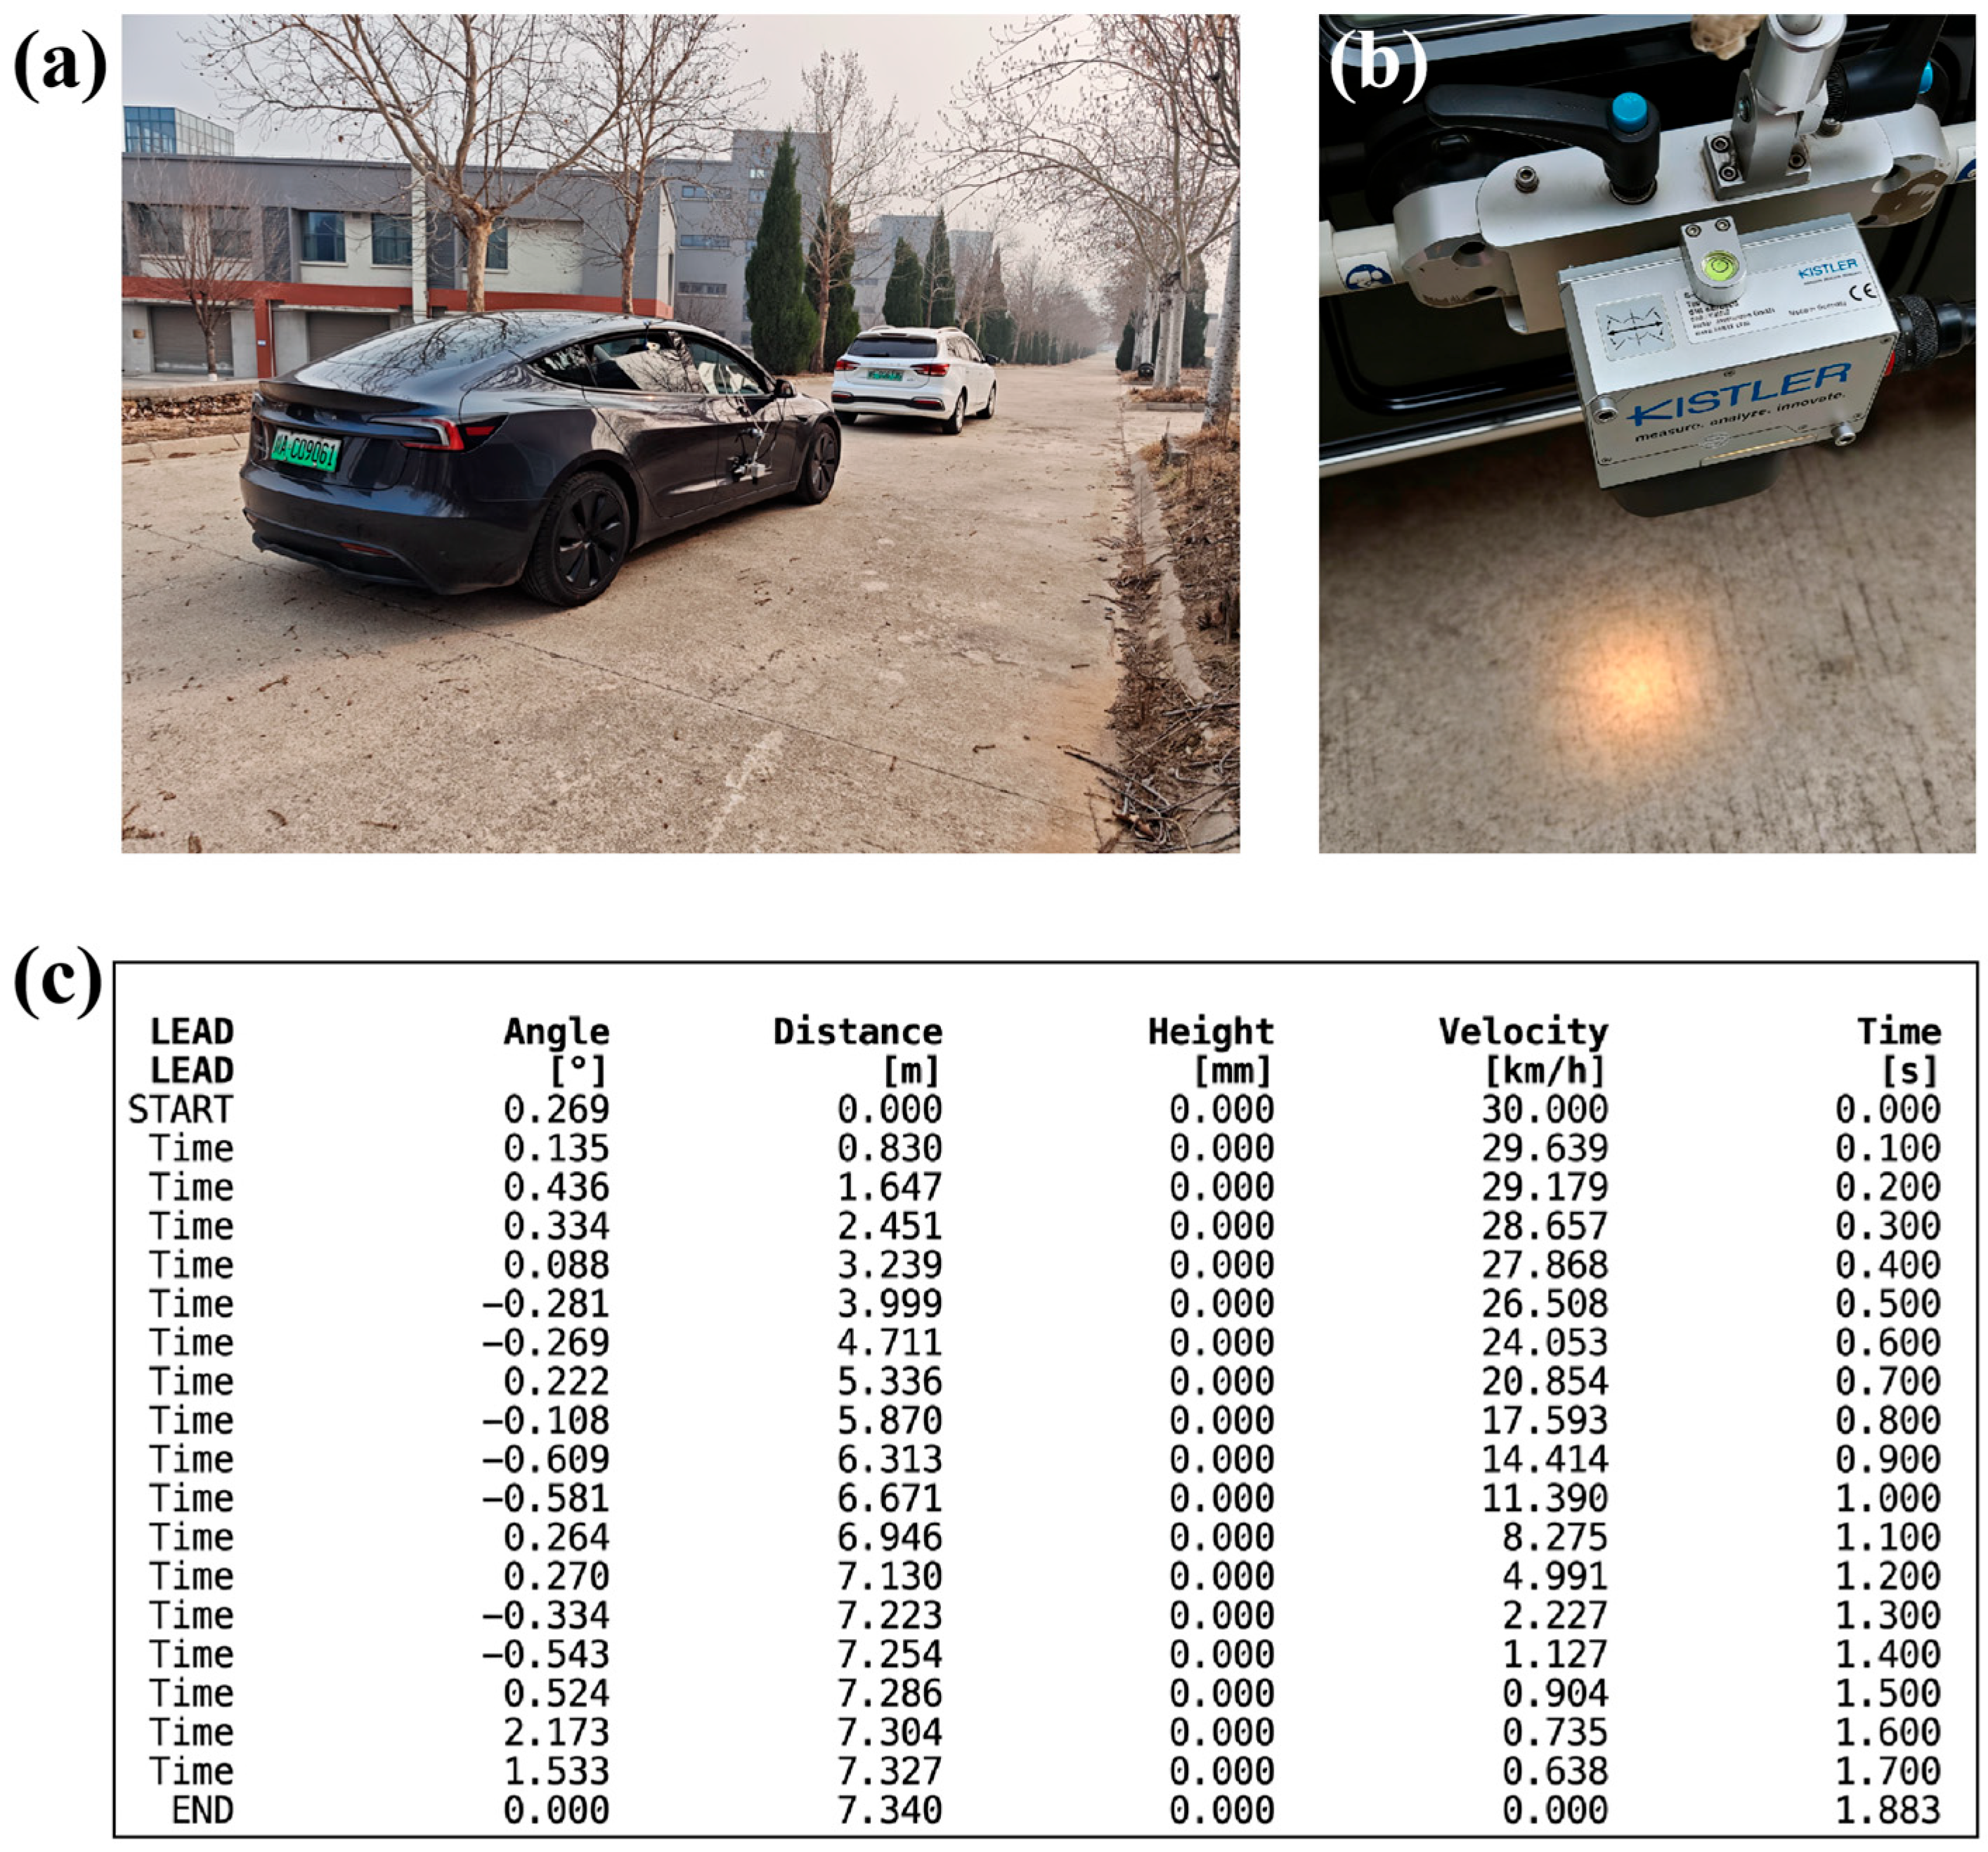
The vehicle-test platform consisted of a Tesla Model 3 as the host vehicle and a Roewe Ei5 as the target vehicle. The host vehicle was equipped with a production ACC function and was used as the evaluated vehicle. The target vehicle was used to generate the predefined longitudinal traffic events, including start, steady following, acceleration, deceleration, cut-out, and cut-in.
The vehicle-test data were collected using a Kistler automotive dynamic performance testing system. The system was mounted externally on the host vehicle. After calibration, it was connected to the data acquisition software through a USB interface. The software recorded host-vehicle speed, target-vehicle speed, inter-vehicle spacing, longitudinal acceleration, and time-history data. These signals provided the basis for extracting
T0,
Dmin,
,
, |
ax|
rms, and
jrms. The vehicle-test platform and data acquisition system are shown in
Figure 16.
The main specifications of the Kistler automotive dynamic performance testing system are summarized in
Table 15.
The vehicle-test scenarios were organized according to the six ACC scenarios in the ACC-CPEIM. For
P1, the initial spacing was set to 5, 6, 7, 8, and 9 m. For
P2–
P6, the tested speeds were 30, 60, 80, 100, and 120 km/h. The vehicle-test scenario coverage is summarized in
Table 16.
Table 16 shows that the vehicle-test cases covered all six scenarios required by the ACC-CPEIM. The same scenario-specific feature extraction and scoring rules were applied to all vehicle-test cases, allowing the measured signals to be evaluated consistently at the scenario, criterion, and overall-score levels.
4.2. Scenario-Level Evaluation Results from Vehicle Tests
The measured vehicle-test data were first processed to extract scenario-specific features. Each feature was converted into a dimensionless score according to the scoring criteria in
Section 2. Then, the scenario-case score
was calculated for each test case, and the scenario-level score
was obtained by averaging all cases within the same scenario. The scenario-level results are shown in
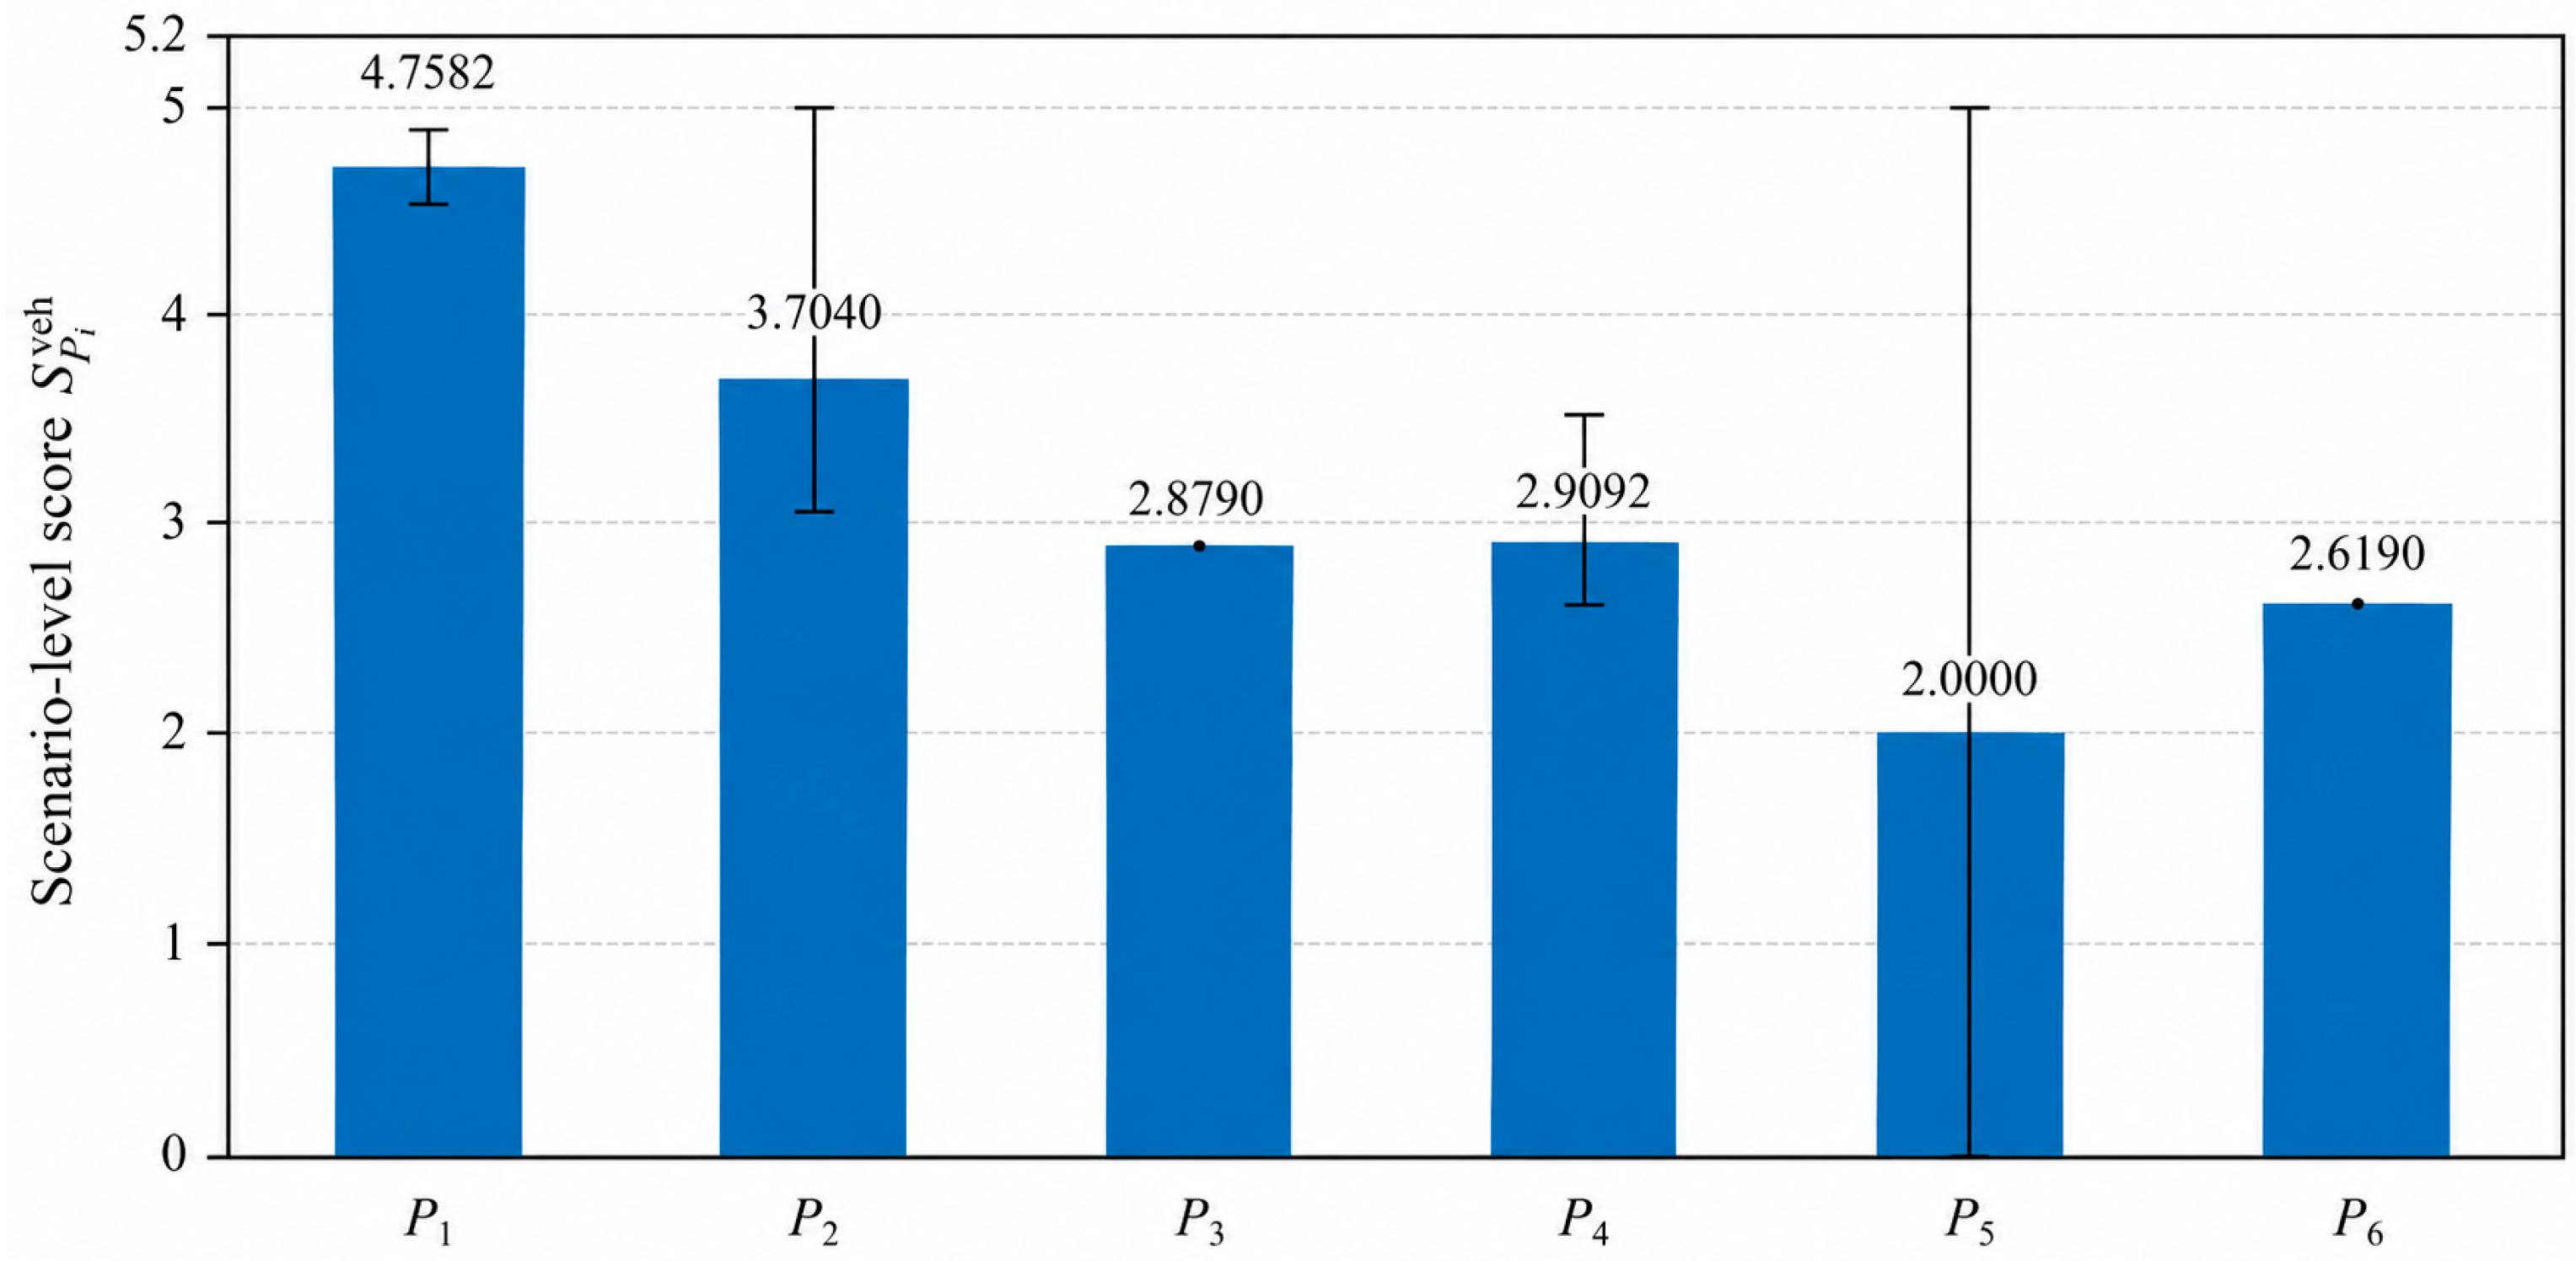
Figure 17.
Figure 17 and
Table 17 show the scenario-level vehicle-test scores with min–max ranges. The bars represent the mean scores of the five test cases in each scenario, while the error ranges indicate the minimum and maximum case scores.
P1 obtained the highest mean score,
= 4.7582, and showed a narrow range, indicating stable start-up performance.
P2 reached
= 3.7040, but its case-level range was wider, reflecting speed-dependent spacing variation.
P3 and
P6 showed nearly constant low scores across the tested speeds, indicating consistent limitations in acceleration-following capability and cut-in spacing margin.
P5 showed the largest range, from 0 to 5, because the low-speed cut-out cases triggered invalid-case penalties, whereas the high-speed cut-out cases obtained full scores.
The score of
P5 was
= 2.0000. This low mean score was mainly caused by invalid-case penalties in the low-speed cut-out cases, rather than by excessive acceleration or jerk. Specifically, the 30, 60, and 80 km/h cut-out cases received zero scores because invalid or failed target-transition conditions were triggered, whereas the 100 and 120 km/h cases obtained full scores. Therefore, the large range of
P5 in
Figure 17 reflects the coexistence of failed low-speed cut-out cases and valid high-speed cut-out cases.
This result should be interpreted differently from the P5 score in the co-simulation evaluation. In the co-simulation environment, the cut-out event was idealized, with a clearly defined target-loss moment, known controller state, and no sensing uncertainty or ACC activation-boundary effect. In contrast, the vehicle-test cut-out cases were affected by the practical operating logic of the production ACC system, especially under low-speed target-loss conditions. Thus, the P5 discrepancy between co-simulation and vehicle testing reveals the sensitivity of the production ACC system to low-speed target-loss events and shows that the ACC-CPEIM can distinguish invalid target-transition cases from ordinary comfort-related degradation.
Overall, the scenario-level results show that the tested ACC system performs well in start-up and steady following, whereas dynamic response, spacing reserve, and target-transition reliability remain the main limiting aspects.
4.3. Criterion-Level Evaluation and Overall Diagnosis
Based on the scenario-level scores, the criterion-level scores were calculated using the scenario-layer weights defined in
Section 2. The final vehicle-test overall score was obtained by aggregating the criterion-level scores using the criterion-layer weights. The criterion-level diagnostic results are shown in
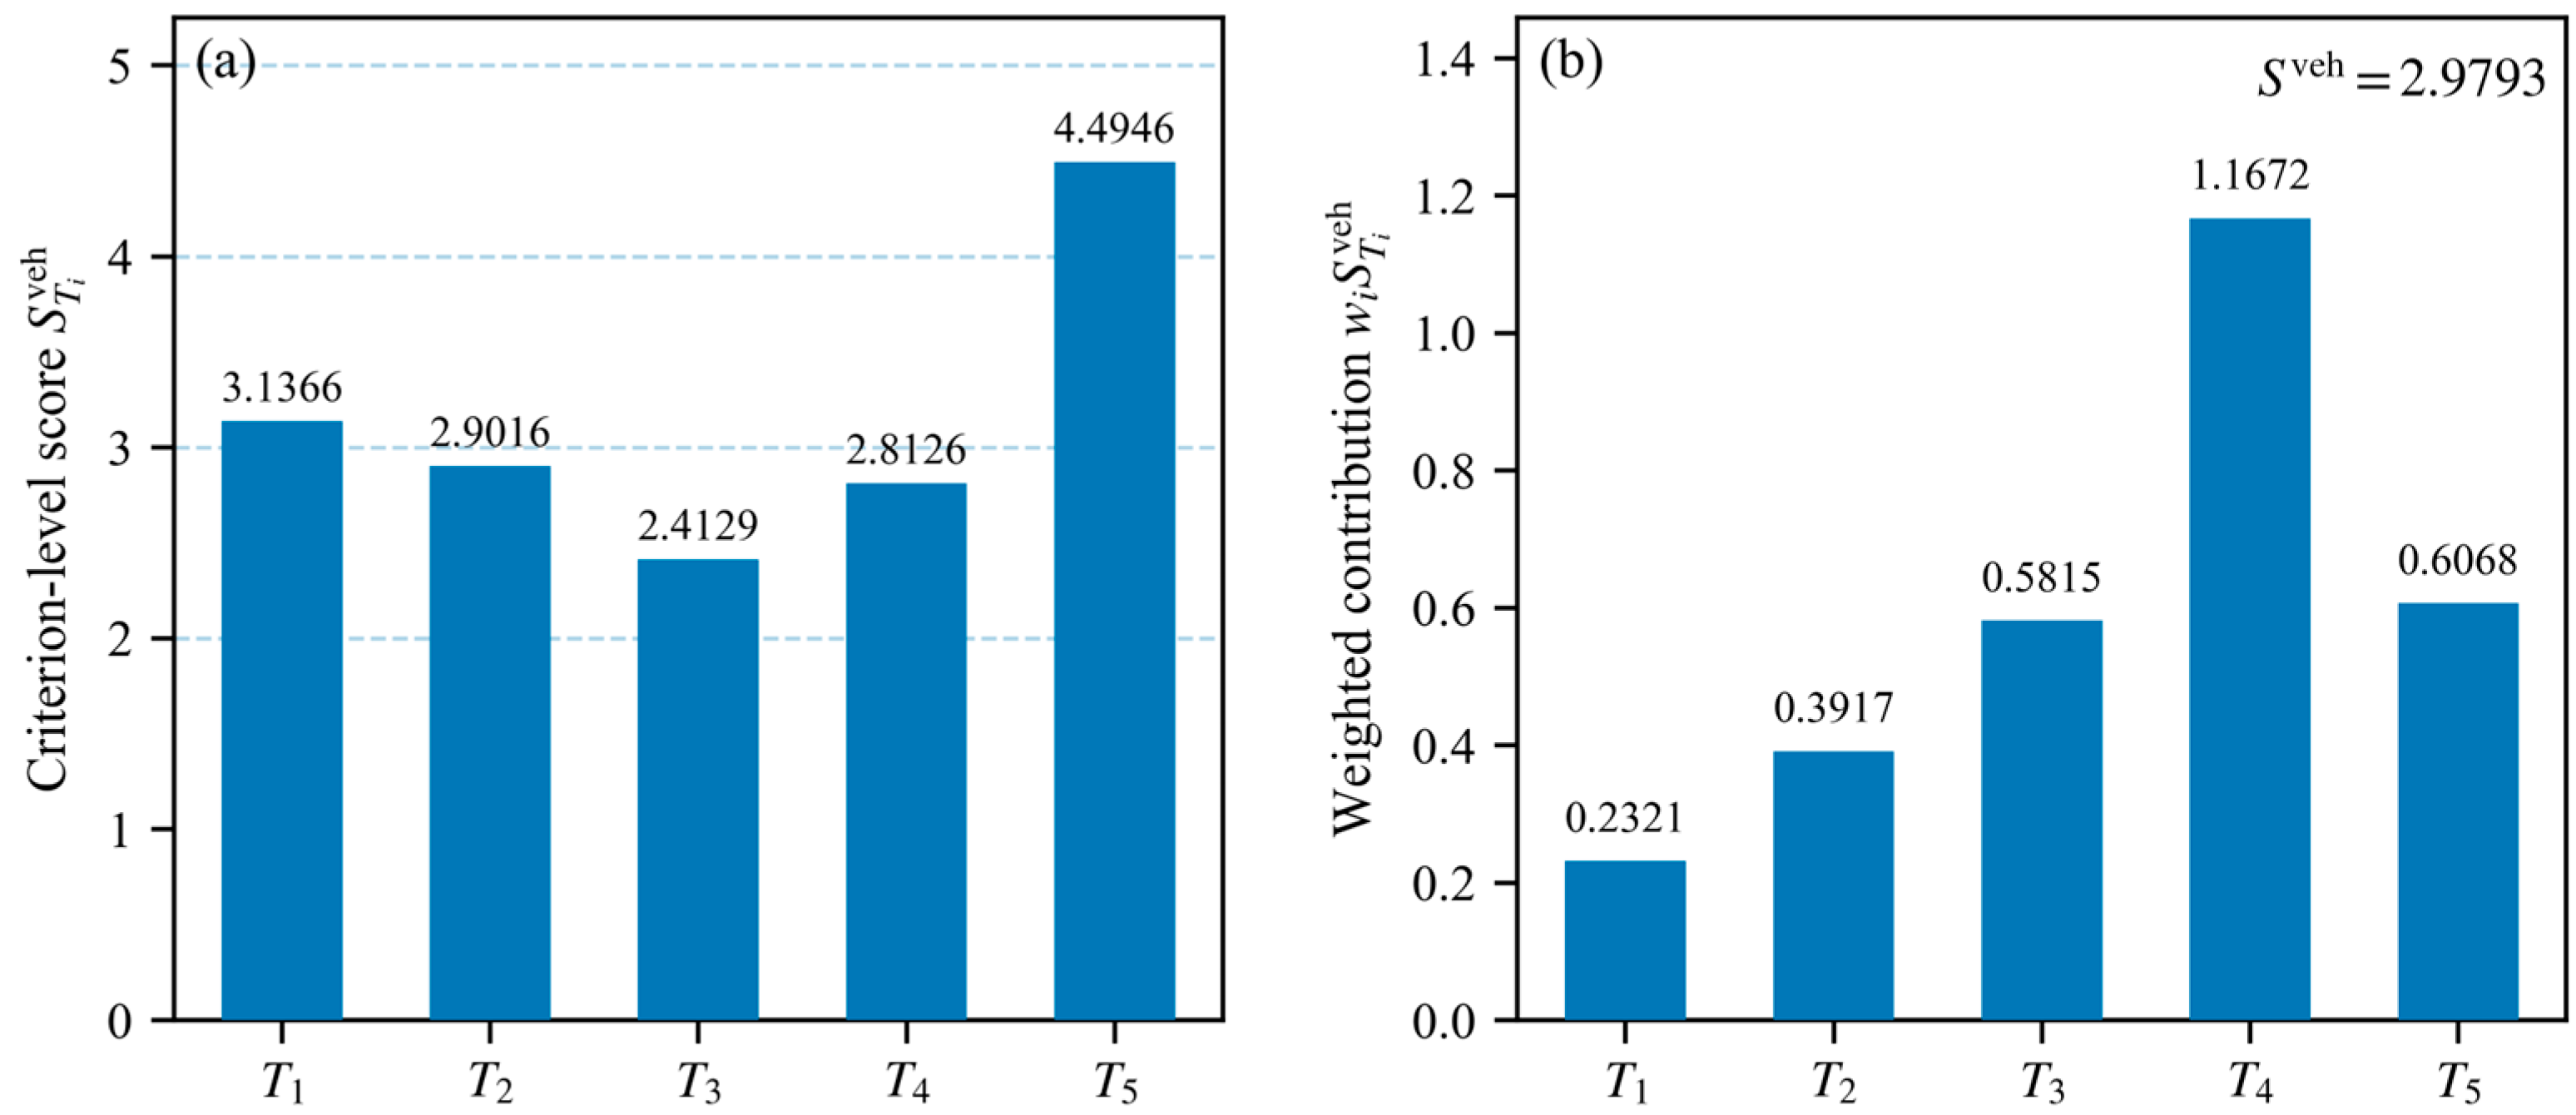
Figure 18.
The vehicle-test overall score was calculated as
Figure 18a shows that comfort obtains the highest criterion-level score, with
= 4.4946. This result is mainly supported by the good start-up response in
P1 and the stable following behavior in
P2. Steady-state control also remains acceptable, with
= 3.1366.
Target-transition adaptability, safety, and dynamic response show more evident limitations. The target-transition adaptability score is = 2.4129, mainly associated with invalid low-speed cut-out cases and insufficient cut-in spacing margin. The safety score is = 2.8126, which is constrained by distance-related features in P4 and P6. The dynamic response score is = 2.9016, reflecting the combined effects of limited acceleration-following response in P3 and insufficient spacing reserve in P4.
Figure 18b further shows the weighted contribution of each criterion to the overall score. Although
T5 has the highest criterion-level score, its contribution is limited by its criterion-layer weight. By contrast,
T4 provides the largest weighted contribution because safety has the highest weight in the ACC-CPEIM. The calculated overall vehicle-test score was
Sveh = 2.9793, approximately 2.98, indicating acceptable but still limited ACC performance under the tested vehicle-test dataset.
These results show that the ACC-CPEIM can transform measured vehicle-test signals into interpretable diagnostic information at the scenario, criterion, and overall-score levels. The vehicle-test application further indicates that the main performance limitations are related to target-transition adaptability, safety margin, and dynamic response, while comfort and steady-state control remain relatively stronger.
The vehicle-test application should therefore be regarded as an engineering application of the ACC-CPEIM to measured production-vehicle data, rather than as a direct simulation-to-vehicle validation of the same ACC controller. The results show that the proposed framework can process measured longitudinal response signals and generate traceable diagnostic information at the scenario, criterion, and overall-score levels. However, because only one production ACC vehicle was tested, the absolute score should not be interpreted as a universal benchmark for all ACC systems. Further tests with different production vehicles, ACC parameter settings, and traffic scenarios are still required to evaluate the general applicability and discriminative capability of the framework.
5. Conclusions
This study proposed an ACC comprehensive performance evaluation index model, termed ACC-CPEIM, for scenario-oriented testing and diagnosis of adaptive cruise control systems. The model links functional objectives, typical ACC scenarios, measurable longitudinal indicators, hierarchical weights, and scenario-specific scoring rules into a unified evaluation chain. In this way, time-domain response data can be transformed into scenario-level, criterion-level, and overall performance scores, while the final result remains traceable to specific weak scenarios and performance dimensions.
The CarSim/Simulink co-simulation results demonstrated the applicability of the proposed model under six typical ACC scenarios. The tested ACC system obtained an overall score of approximately 3.32, indicating acceptable but not excellent comprehensive performance. The results showed good performance in start-up response, steady following, and cut-out transition. However, weak acceleration-following response, insufficient spacing reserve during deceleration, and limited cut-in safety margin were identified as the main performance limitations. These findings indicate that the ACC-CPEIM can provide not only a compact overall score but also scenario-level diagnostic information.
The vehicle-test application further showed that the ACC-CPEIM can process measured longitudinal response data using the same feature extraction, scoring, and aggregation procedure. The overall vehicle-test score was approximately 2.98. Comfort and steady-state control were relatively stronger, whereas target-transition adaptability, safety margin, and dynamic response remained the main limiting dimensions. Overall, the proposed model provides a structured, interpretable, and engineering-oriented method for ACC performance evaluation. Because the current vehicle-test application was based on one production ACC vehicle, future work will extend the dataset to more vehicle platforms, ACC parameter settings, traffic events, speed-normalized safety indicators, and energy-aware driver-adaptive evaluation indicators.




 ,
,