Review

A Review of Electric Machine Stator Winding Insulation Diagnostic Signal Processing Methods and Metrics


Department of Electrical and Computer Engineering, Baylor University, Waco, TX 76798, USA
*
Author to whom correspondence should be addressed.
Machines 2026, 14(7), 751; https://doi.org/10.3390/machines14070751
Submission received: 14 May 2026 / Revised: 24 June 2026 / Accepted: 30 June 2026 / Published: 3 July 2026

Abstract

Stator winding insulation failure is a leading cause of electric machine failure. Early detection of winding insulation deterioration is essential to preventing catastrophic damage and ultimate electric machine failure. Various condition monitoring and diagnostic methods have been developed to assess insulation health while the machine is in operation. These diagnostic methods depend on different signal processing techniques that are used to extract insulation-sensitive information from measured signals. This paper presents a review of the diagnostic signal processing techniques that have been applied to stator winding insulation condition monitoring, spanning time-domain, frequency-domain, time–frequency-domain and data-driven approaches. Where appropriate, the underlying mathematical formulation of the reviewed technique is presented, the physical basis for its sensitivity to insulation condition monitoring is discussed, and the key strengths and limitations are identified. A comparative analysis with summary tables is provided to highlight the trade-offs between detection sensitivity, computational cost, hardware requirements and practical deployment considerations. The review shows that time- and frequency-domain methods are simple to implement, while time–frequency and data-driven methods generally offer higher performance, but require greater computation and validation. Also, the comparison shows that turn-to-turn and groundwall insulation monitoring have received more research attention, while phase-to-phase remains less developed. This review concludes by identifying the challenges and future research directions needed to advance this field from laboratory demonstrations toward industrial adoption.

1. Introduction

Electric machines are widely deployed in industrial, transportation and energy systems for various applications. The reliable operation of these machines depends on the integrity of the stator winding insulation system. The main function of the winding insulation is to prevent short circuits between winding turns, phases and between the windings and the grounded stator core [1,2]. The normal aging of insulation due to prolonged use and the adverse conditions caused by different types of stresses imposed on the insulation can both lead to its deterioration and failure, leading to ultimate electric machine failure.
The Institute of Electrical and Electronics Engineers (IEEE) Motor Reliability Working Group reported that stator-related faults account for approximately 28% of all induction motor failures, while the Electric Power Research Institute (EPRI) estimated this failure at 38% [3,4]. For high-voltage motors rated above 2000 kW in the petrochemical industry, stator winding failures have been reported to account for up to 60% of total motor failures [5]. Various causes of stator and rotor failures in three-phase squirrel cage induction motors were identified in [6], where it was noted that the destructive nature of most stator failures made the root-cause very difficult to identify. The majority of stator failures originate as inter-turn insulation faults, which, if undetected, can rapidly lead to phase-to-phase or phase-to-ground short circuits that cause catastrophic and irreversible damage [7,8,9]. The transition from an inter-turn fault to a complete winding failure can occur within seconds, making early detection very important [6,10].
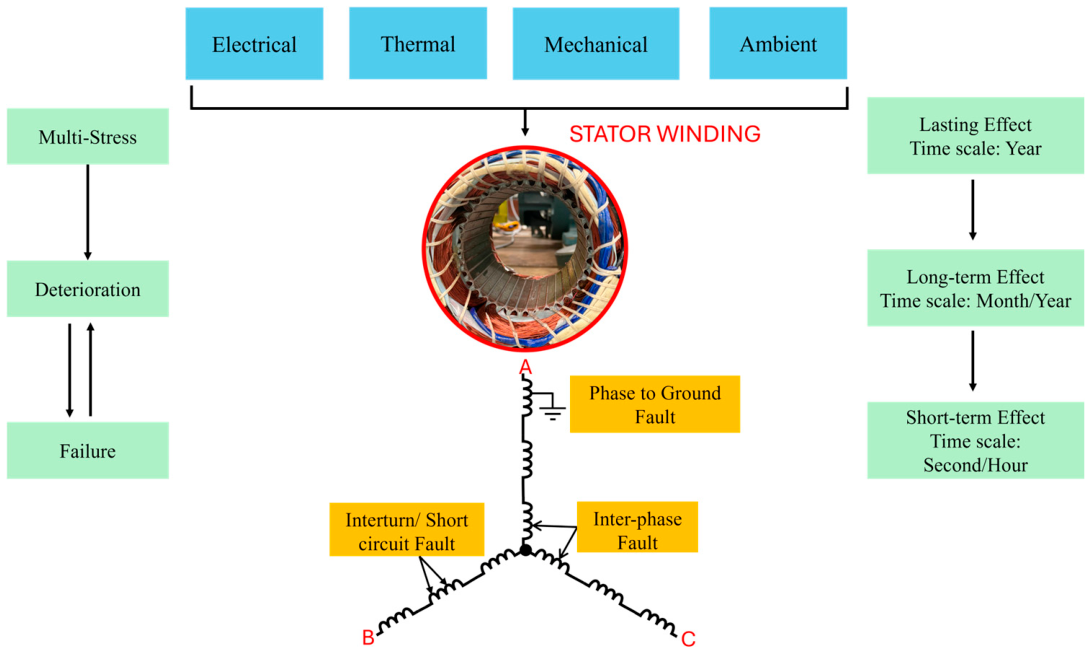
As shown in Figure 1, deterioration of stator winding insulation can be caused by a combination of four principal stress factors: thermal, electrical, ambient and mechanical, commonly referred to as the TEAM stresses [1]. Thermal stress arises from resistive losses, eddy current heating and external temperature fluctuations. It is well-recognized that an increase in temperature accelerates the aging process and significantly reduces the lifetime of the insulation, following the well-known Arrhenius relationship where the insulation lifetime approximately halves for every 10 °C increase above the rated thermal class. Electrical stress results from the dielectric field across the insulation, which can create partial discharges in voids and delamination when the local field exceeds the breakdown strength of the enclosed gas. Mechanical stress originates from the electromagnetic forces during transient events such as starting, short circuits and load changes, as well as from thermal expansion and contraction cycles. Environmental stress includes moisture, chemical contaminants and abrasive particles that come into contact with the insulation, affecting its integrity. In practice, these stresses do not act independently but interact together, to produce a cumulative degradation effect that is greater than the effect of each individual contribution [11,12,13].
Traditionally, the condition of stator winding insulation was assessed using offline testing methods that require the machine to be taken out of service. These methods include insulation resistance (IR) testing, polarization index (PI) measurement, dissipation factor (tan δ) and capacitance measurements [12]. The severest limitation of the offline methods is machine downtime. This limitation has motivated the development of online insulation condition monitoring methods that assess insulation health during normal machine operation, without requiring shutdown [12,13]. Online monitoring also enables insulation conditions to be captured under actual operating stresses to continuously track insulation degradation trends. This helps to provide early warning of incipient faults before catastrophic failure [13]. Over the years, a wide range of online monitoring techniques have been proposed, with each relying on signal processing techniques to extract insulation-sensitive features from the measured signals and convert them into insulation health indicators. The choice of diagnostic signal processing technique has a direct impact on the detection capability of an insulation monitoring method. Different signal processing techniques operate on different mathematical principles and are suited to different signal types and insulation degradation mechanisms. Thus, it can be said that the diagnostic signal processing technique is the lens through which the insulation condition is observed and the choice of lens determines what can be seen.
Over the past two decades, diagnostic signal processing techniques applied to stator insulation condition monitoring have expanded significantly, from time-domain parametric extraction of the switching transient waveform through classical FFT-based motor current signature analysis [14,15], norm-based spectral deviation indicators [14,16], time–frequency methods including the Short-Time Fourier Transform [17], wavelet transforms and Wavelet Packet Decomposition (WPD) [18,19,20], and Fractional Fourier Transform [21,22], to impedance spectroscopy via the empirical transfer function estimate (ETFE) [23,24,25,26], partial discharge signal processing under PWM excitation [27,28], and data-driven approaches that combine signal processing with machine learning and deep learning [17,29,30]. Each technique offers distinct advantages, but imposes specific requirements on hardware, sampling rate and computational resources. However, existing literature review does not provide unified coverage from a signal processing perspective. Previous papers have focused on measurement approaches and monitoring methods [12,31], degradation mechanisms [11], condition monitoring and fault detection broadly across all machine fault types [32,33,34], or specific signal domains such as partial discharge [35]. To the best of our knowledge, no single review currently exists that presents all major signal processing techniques as applied to stator winding insulation condition monitoring with mathematical formulations, a comparative analysis and the practical considerations needed to guide the selection of methods.
This paper addresses this gap by presenting a comprehensive review of signal processing techniques for stator winding insulation condition monitoring in electric machines. Where necessary for a technique, its mathematical formulation is presented and the physical basis for its sensitivity to insulation degradation is discussed along with its key strengths and limitations. This review is organized as follows: Section 2 discusses the stator winding insulation system. Section 3 provides a brief review of the traditional offline testing methods and their limitations. Section 4 covers the diagnostic signal acquisition methods and measured quantities. Section 5 provides the review methodology and categorization; Section 6, Section 7, Section 8 and Section 9 present widely deployed signal processing techniques. Section 10 provides a comparative discussion with summary tables. Section 11 concludes with challenges and future research directions.

2. Stator Winding Insulation System

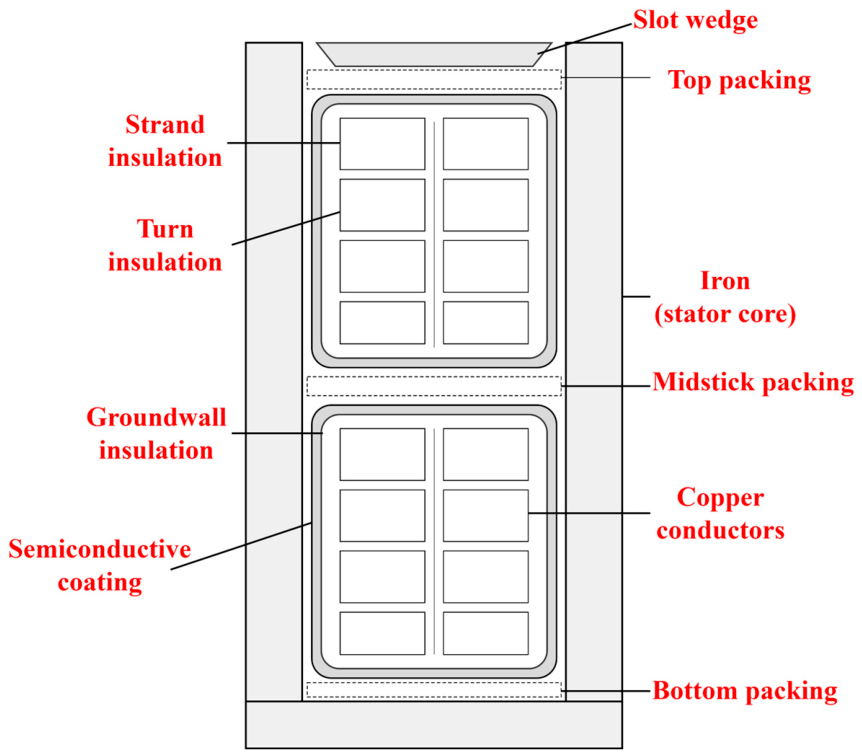
Figure 2 shows a cross-section of a form wound-stator slot, which shows the physical arrangement of the insulation layers. The insulation can be categorized into three types based on the location and function; these include turn-to-turn insulation, groundwall insulation, and phase-to-phase insulation [1,2]. Although Figure 2 relates to form-wound coils, the general insulation principle can be extended to random wound coils, which also have turn-to-turn, groundwall, and phase-to-phase insulation. From a condition monitoring perspective, each insulation type introduces unique parasitic capacitances into the stator winding’s electrical circuit, and the degradation of each type produces different changes in the winding’s high-frequency behavior. Thus, understanding these distinctions is important for interpreting the signal processing techniques which will be reviewed in the subsequent sections.

2.1. Turn-to-Turn Insulation

Turn-to-turn (TT) insulation separates the adjacent conductors within the same coil. In random wound low-voltage machines, this insulation is provided by the enamel coating applied directly to each wire during the manufacturing process. In form-wound machines, the individual turns are wrapped with additional turn insulation tape before being assembled in the coil [1]. The turn insulation is the thinnest and most vulnerable layer in the insulation system. Thus, the majority of stator winding failures are inter-turn insulation faults [6,7]. When the turn insulation fails, a low-impedance path is created between adjacent conductors, which results in a circulating fault current that generates localized heating and can rapidly propagate to a complete winding failure within seconds [6].

2.2. Groundwall Insulation

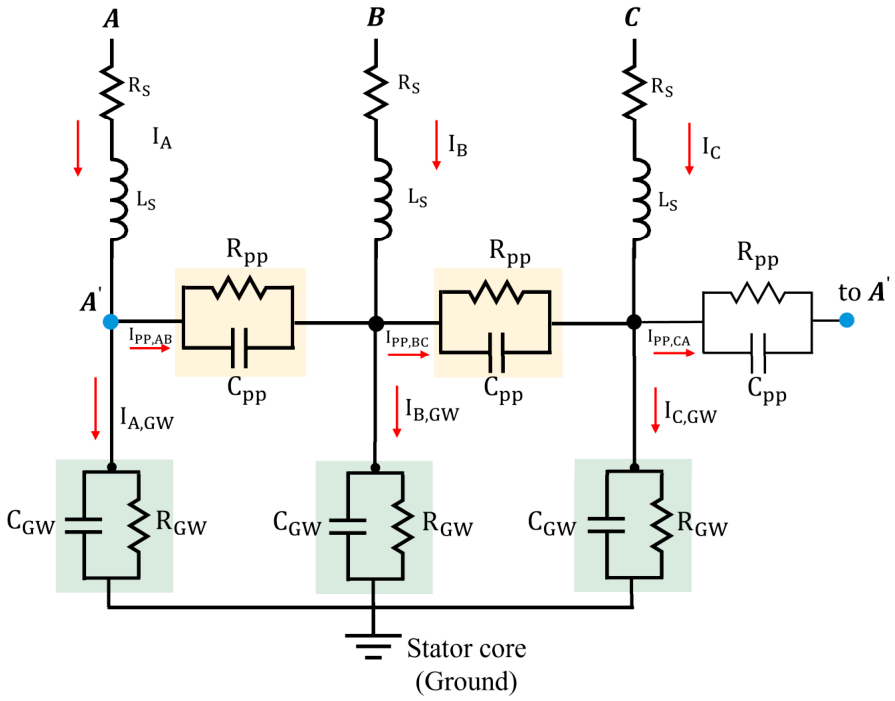
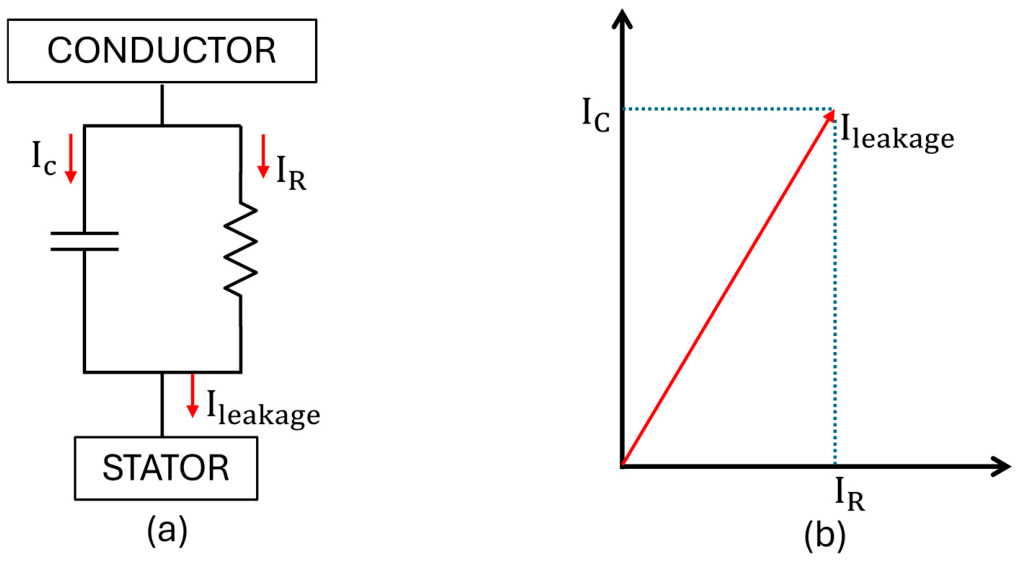
Groundwall (GW) insulation provides the primary dielectric barrier between the entire coil assembly and the grounded stator core. In random-wound machines, this is typically achieved using a slot liner placed between the coil and the slot wall. In form-wound machines used in medium- and high-voltage applications, groundwall insulation consists of multiple layers of mica tape impregnated with epoxy or polyester resin, wrapped around the complete coil and cured to form a solid dielectric barrier [1]. In machines rated 6 kV and above, a semiconductive coating is applied to the outer surface of the groundwall insulation to ensure electrical contact with the stator core and prevent slot discharge activity [1,37]. When groundwall insulation degrades, through delamination, void formation, moisture absorption, or thermal deterioration, the insulation capacitance increases and the insulation resistance decreases [11,13]. The leakage current that flows through the groundwall insulation is determined by the groundwall capacitance CGW and resistance RGW, shown in the equivalent circuit in Figure 3, and can also be represented as the resistive and capacitive currents seen in Figure 4a,b.

2.3. Phase-to-Phase Insulation

Phase-to-phase (PP) insulation separates the windings of different phases that share the same stator slot or are adjacent in the end winding. In form-wound machines, this is provided by a phase separator which is placed between the two coil sides in a double-layer winding, as shown in Figure 2. In random wound-wound machines, a combination of slot liner and phase insulation paper provides this separation. Phase-to-phase insulation failure results in a short circuit between two phases, which produces high fault currents and can typically cause catastrophic damage.

2.4. Electrical Equivalent Representation

The combination of parasitic capacitances with the series resistance and inductance of each conductor forms a distributed RLC network that governs the high-frequency impedance behavior of the stator winding [14,24]. Figure 3 shows a simplified three-phase insulation equivalent circuit model inspired by [38], where each phase winding is coupled to ground through C G W in parallel with R G W , coupled with adjacent phases through C P P . The relationship between these parameters can be expressed in the following manner. Considering Phases A and C in a balanced system, with line voltage VAC, assuming zero voltage drop across each phase, the leakage current of phase A, for example, is as follows:
I A , G W = V A C · 1 Z G W , A + 1 Z P P , A B + 1 Z P P , C A
The phase-to-phase insulation current from phase A to phase C can be expressed as
I P P , A C = V A V C   Z P P , A C
The groundwall impedance for any phase, assuming they are equal, is a parallel combination of the respective resistance and capacitive reactance:
Z G W = R G W / / ( 1 ( j ω C G W ) )  
The phase-to-phase impedance for any phase is also a parallel combination of the respective resistance and capacitive reactance:
Z P P = R P P / / 1 j ω C P P

3. Traditional Offline Condition Monitoring Methods

Before the development of online condition monitoring techniques, the assessment of stator winding insulation relied on a set of well-established offline testing methods. These methods required the machine to be taken out of service and disconnected from the power supply before any measurement can be performed [1,2]. Although these methods remain widely used in industry for commissioning and periodic maintenance, disconnecting machines imposed significant limitations that have motivated the development of online approaches. This section provides a brief overview of the principal offline techniques and their limitations.

3.1. Insulation Resistance Testing

Insulation resistance (IR) testing is the most fundamental and widely used offline test for stator winding insulation [1]. The test involves applying a DC voltage, typically between 500 V and 10 kV, depending on the machine rating, between the winding conductor and the grounded stator core, and measuring the resulting leakage current after a specified time interval. The insulation resistance is then calculated from the ratio of the applied voltage to the measured leakage current. The IEEE standard 43 recommends minimum acceptable IR values based on the machine’s rated voltage and winding temperature [1,2]. While the test is straightforward to perform using a megohmmeter, the measured resistance is highly sensitive to temperature, humidity and surface contamination, which can make interpretation difficult if these conditions are not controlled [1,39].

3.2. Polarization Index

Polarization index (PI) is an extension of the IR test. It is defined as the ratio of the insulation resistance measured after 10 min to the insulation resistance measured after 1 min of continuous DC voltage application [1,2]. The PI provides an indication of how the insulation absorbs and retains electric charge over time, which is related to the condition of the bulk insulation material. A healthy insulation system typically exhibits a PI value greater than 2 for the Class B and F insulation, while a low PI value suggests that the insulation is contaminated or severely degraded [1]. The advantage of the PI over a single IR reading is that, as a ratio, it is less sensitive to temperature variations, since both the numerator and denominator are affected similarly [39].

3.3. Dissipation Factor

The dissipation factor (tan δ) test, also called the power factor test, measures the dielectric losses within the insulation system [1,2]. When an AC voltage is applied across the insulation, the resulting current has both a capacitive component (due to the insulation acting as a dielectric) and a resistive component (due to losses in the insulation). The dissipation factor is the ratio of the resistive current to the capacitive current, and an increase in tan δ indicates increased dielectric losses associated with moisture absorption, contamination, void formation or thermal degradation [1]. The capacitance of the insulation system is typically measured alongside the dissipation factor, and changes in capacitance can indicate degrading of the insulation [13].

3.4. Surge Test

The surge test is the primary offline method for assessing turn-to-turn insulation integrity [1,2]. In this test, a high-voltage, fast-rise-time pulse is applied to the winding, and the resulting oscillatory voltage waveform is recorded. In a healthy winding, the surge waveform reflects the characteristic impedance of the winding. If a turn-to-turn insulation weakness exists, the voltage across the weakened turn exceeds its dielectric strength during the surge, causing a momentary breakdown that alters the effective inductance of the winding and produces a detectable change in the oscillation frequency and decay pattern [1]. The surge test is effective at detecting existing turn-to-turn faults but it has been a subject of debate because the high-voltage pulse itself can further stress the insulation and, in some cases, cause damage in windings that are deteriorating [2].

3.5. Partial Discharge

Offline Partial Discharge (PD) testing is the most established diagnostic method for high-voltage machines rated 6 kV and above [1,27,37]. A high AC voltage is applied to the winding while PD sensors detect the electromagnetic pulses generated by localized dielectric breakdowns within the insulation [37]. The phase-resolved PD (PRPD) pattern, which plots the PD magnitude against the phase angle of the applied voltage, is used to classify the type and severity of the insulation defect according to established standards [27]. However, offline PD testing is performed under sinusoidal AC voltage excitation, which does not represent the conditions experienced by the insulation in inverter-fed machines, where the PWM voltage waveform produces repetitive steep-fronted pulses that can trigger PD events at lower voltage levels than the sinusoidal partial discharge inception voltage (PDIV) [27,37].

4. Diagnostic Signal Acquisition and Measured Quantities

The effectiveness of any stator insulation condition monitoring method depends on the information content being carried by the measured signal. Some of these signals could be raw signals or processed signals derived from these raw signals. Table 1 describes the main diagnostic signal sources used in stator insulation condition monitoring and the physical basis for their sensitivity to insulation degradation.
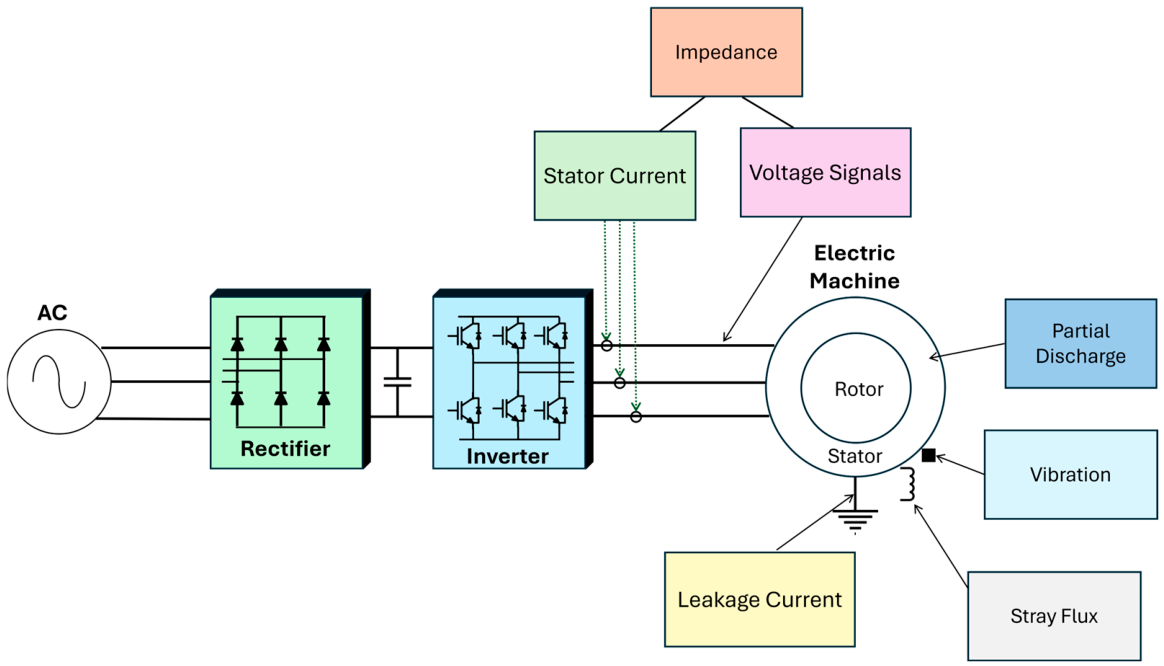
Figure 5 shows the main measured and derived signal acquisition quantities for stator insulation condition monitoring in an inverter-fed machine drive system, which includes stator phase current, leakage current, common-mode voltage, high-frequency impedance, partial discharge pulses, vibration, and stray flux.

5. Review Methodology and Article Categorization

The literature reviewed in this paper was selected to provide an overview of the diagnostic signal processing methods for stator winding insulation condition monitoring in electric machines. The articles were included based on at least one or more of the following criteria:
  • A diagnostic signal processing method for stator winding insulation is proposed or experimentally validated.
  • Mathematical formulations and diagnostic features related to insulation degradation are provided.
  • Signal processing methods for stator winding fault detection are provided.
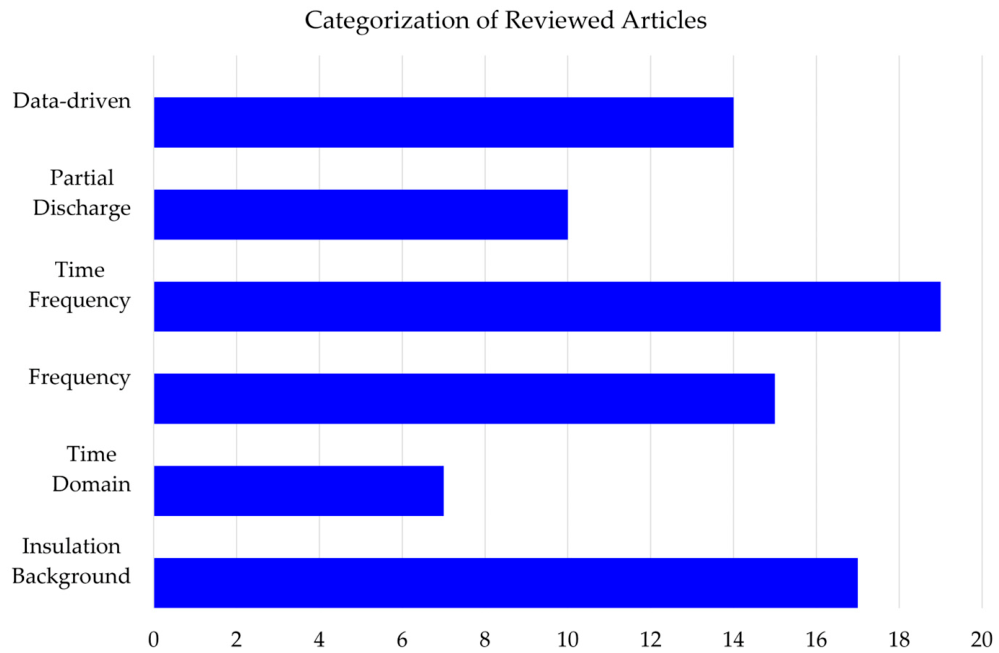
The reviews were categorized according to their methods and contributions. Articles focused on mechanical faults, rotor faults and transformer insulation and general machine learning applications were excluded in this review. The categories include time-domain, frequency-domain, time–frequency-domain, and data-driven methods. Figure 6 shows a bar chart which categorizes all the references in this paper.
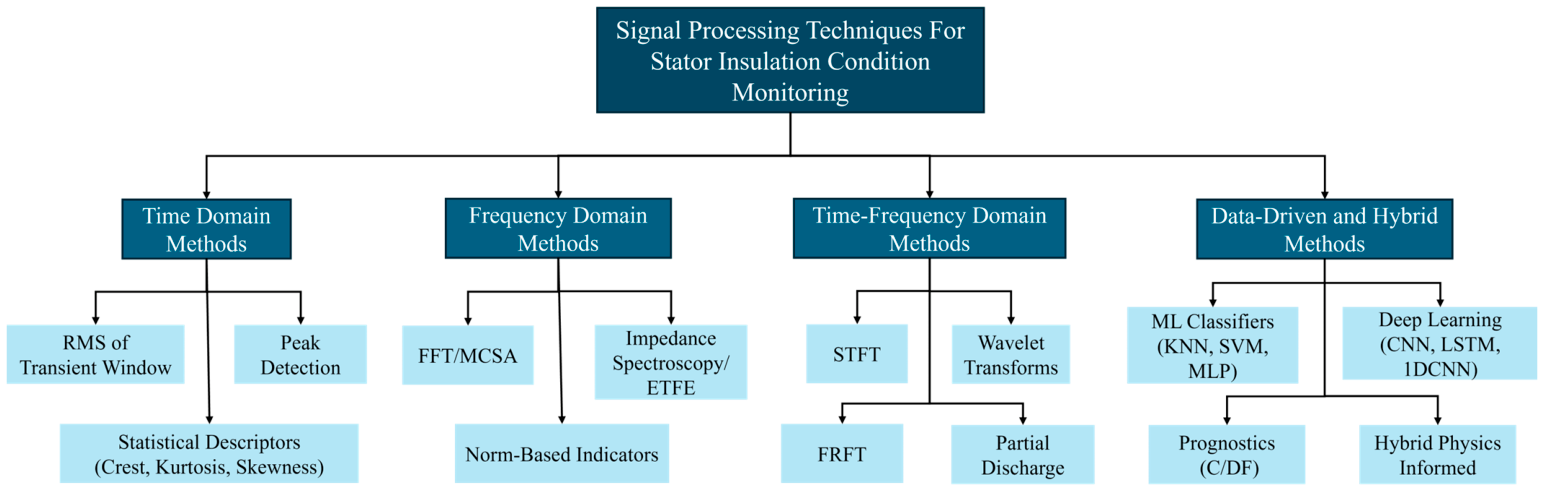
Figure 7 also presents a hierarchical classification of the diagnostic signal processing techniques, organized into four categories based on their domain of operation: time-domain, frequency-domain, time–frequency-domain, and data-driven and hybrid methods. The structure progresses from computationally simple techniques on the left to more complex and data-intensive approaches on the right, reflecting the practical trade-off between implementation simplicity and detection capability.

6. Time-Domain Diagnostic Signal Processing Methods

Time-domain methods provide the basic measured metrics such as peak, peak-to-peak, RMS, rise time, decay rate and transient ringing behavior. These metrics are useful, but may not provide enough information on the insulation condition of a stator. Thus, many diagnostic methods begin with time-domain signal processing as a first step, followed by other methods, such as frequency analysis and time–frequency analysis or statistical feature extraction. A few metrics and measures relating to time-domain signals are defined in the following.

6.1. RMS of Transient Window

The root mean square (RMS) value of the transient current within a defined observation window can be expressed as
I R M S k = 1 N n = 1 N >∣ i t r a n s ( n , k ) >∣ 2
where i t r a n s ( n , k ) is a transient current sample at index n for measurement window k, and N is the number of samples in the window.

6.2. Peak Value of Transient Current

This metric is used to identify the maximum absolute amplitude within a defined observation window after the switching transition. The peak value of a stator current can generally be expressed as
I p e a k k = V p e a k Z i m p e d a n c e
where V p e a k is the peak voltage and Z i m p e d a n c e is the imepdance of the electric machine. In [40], a metric based on the current ringing peaks of the leakage current was proposed to monitor the insulation state of a machine. The equation can be expressed as follows [41]:
p e a k =   i p e a k a i p e a k b
where i p e a k a is the peak value as the motor is aging and i p e a k b is the baseline peak in the motor.

6.3. Statistical Descriptors

Statistical descriptors computed directly from the time-domain transient waveform provide a set of general-purpose features that characterize the shape, spread, and impulsiveness of the oscillation. The descriptors that are mostly applied are as follows.
The crest factor, defined as the ratio of the peak value to the RMS value. The crest factor shows how spiky a waveform is. A higher value can indicate stronger transient peaks or more severe switching or ringing events, which may be linked to insulation stress. It can be expressed as
C r e s t   F a c t o r   k = I p e a k k I R M S k
The kurtosis, which measures the “tailedness” of the amplitude distribution, shows how much the signal contains rare extreme amplitudes. It can generally be expressed as
K u r t o s i s   k = 1 N n = 1 N ( i t r a n s ( n , k ) i - ) 4 1 N n = 1 N ( i t r a n s ( n , k ) i - ) 2 2
The skewness, which measures the asymmetry of the distribution, shows whether the amplitude distribution is biased to one side. It can be expressed as
S k e w n e s s   k = 1 N n = 1 N ( i t r a n s ( n , k ) i - ) 3 1 N n = 1 N ( i t r a n s ( n , k ) i - ) 2 3 / 2
where i - is the mean of the signal within the observation window.

6.4. Applications and Fundamental Limitations

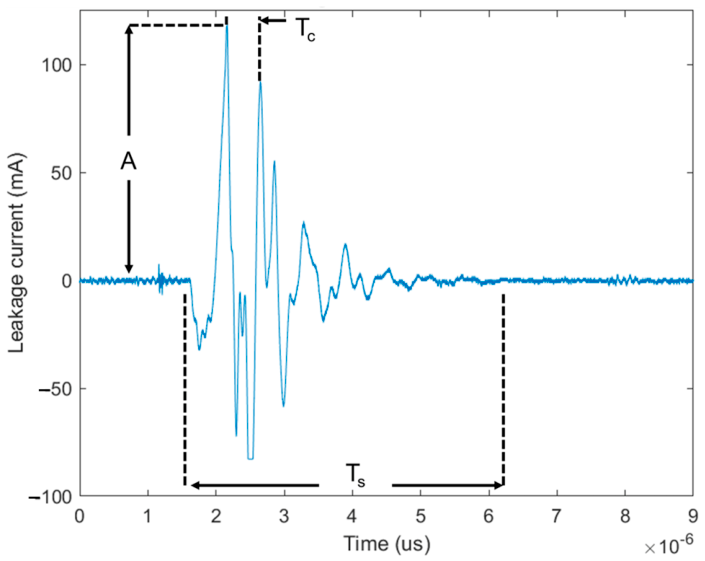
In inverter-fed machines, the applied voltage pulses excite the stator winding’s high-frequency parasitic network, which produces damped oscillations in the current response [15]. Prior work has shown that insulation degradation can modify this transient response; thus, the period, amplitude and time can be tracked relative to a healthy baseline [42]. Features such as transient amplitude A , oscillation period T c , and settling time T s   from switching transient waveforms can easily be tracked over time relative to a healthy baseline and used for insulation condition assessment. Figure 8 shows an example of a measured leakage current switching transient with time-domain features used for insulation assessment.
Several papers have used the transient characteristics of the leakage current for GW insulation monitoring [42,43], including the use of the high-frequency ringing of the stator current after a PWM switching event [40], and the overshoot of the leakage current transient response [44]. For instance, a method using the transient characteristics of leakage current to identify Groundwall Insulation degradation in a 3 kW permanent magnet synchronous motor (PMSM) was proposed in [42]. An equivalent circuit model was developed, and the leakage current oscillations were extracted to monitor the GW insulation. The reported experimental results demonstrated that CM and DM harmonics from the leakage current are affected by degradation.
In most of the applications, some common limitations can be identified for the time-domain methods:
  • Time-domain methods are usually difficult to interpret because insulation degradation produces weak signals [42]. Therefore, time-domain statistical descriptors are more effective when further processed and used as input features for machine learning techniques rather than as standalone diagnostic indicators.
  • Sensors which have high bandwidths that obey the Shannon sampling theorem (the sampling frequency has to be greater than or equal to the maximum desired frequency) are required to accurately capture these signals [42,43].
  • The signals being measured tend to be susceptible to inverter switching noise, hence the need for high bandwidth sensors.

7. Frequency-Domain Diagnostic Signal Processing Methods

7.1. Fast Fourier Transform

The Fourier Transform is a foundational spectral analysis method used for insulation condition monitoring. Nearly all methods discussed in this review either use the Fast Fourier Transform as a basis or they are benchmarked against it. The Discrete Fourier Transform (DFT) of a discrete-time signal x[n] of length N is defined as
X k = n = 0 N 1 x n ·   e ( j 2 π k n / N )     k = 0 ,   1 ,   ,   N 1
where X[k] is the complex-valued spectral coefficient at frequency bin k, N is the total number of samples. The frequency resolution of the FFT is determined by the ratio of the sampling frequency to the number of samples, expressed as f = f s / N . This means that a longer acquisition window is required to resolve closely spaced frequency components.
The most common application of the FFT signal processing in electric machine condition monitoring is Motor Current Signature Analysis (MCSA) [45,46,47,48]. The principle of MCSA is that faults in the machine produce characteristic changes in the air-gap magnetic flux, which in turn induce additional harmonic components in the stator current that are not present in a healthy machine. These fault-related harmonics appear at specific frequencies in the FFT spectrum, and their amplitudes can be tracked over time as indicators of fault severity [7,46]. It is important to note that MCSA has mostly been utilized for rotor fault detection and its application to stator insulation faults is limited because the spectral signatures of insulation degradation are not as clearly defined or universally agreed upon as those for rotor faults.
Despite being the most widely validated technique, the FFT has several well-known limitations when applied to insulation condition monitoring:
  • The FFT assumes that the signal is stationary over the analysis window, which means that any time-varying spectral content is averaged and cannot be resolved in time. This makes the FFT unsuitable for analyzing transient conditions where fault-related harmonics may shift in frequency.
  • The fixed frequency resolution determined by the window length means that there is a fundamental trade-off between frequency resolution and the temporal responsiveness of the analysis.
  • The harmonic components can also be produced by supply voltage unbalance and magnetic saturation in the machine, which makes it difficult to distinguish an incipient winding fault from these other sources using FFT alone
These limitations have motivated the development of the norm-based deviation approaches discussed in the following subsection and the time–frequency methods discussed in Section 8.

7.2. Norm-Based Methods

Norm-based deviation indicators have been widely employed throughout the literature for the assessment of both groundwall and turn-to-turn insulation degradation in inverter-fed electric machines [21,44,49,50]. These methods operate on the principle that insulation degradation alters the parasitic capacitances of the stator winding, which in turn modifies the high-frequency behavior of the machine. This change is observable in the frequency spectrum of signals such as the line current or the leakage current, specifically in the transient response. A key advantage of this approach in a motor-drive is that the inverter itself provides excitation through its normal switching operation, and the existing current sensors of the drive can provide the measurement, meaning no additional hardware is required.
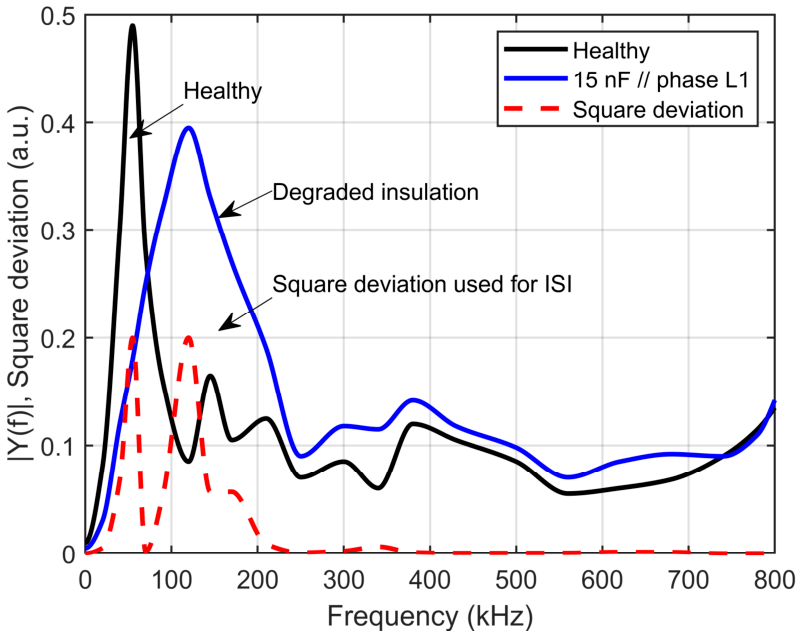
The root mean square error (RMSE) norm deviation was first proposed in [49] and identified as the Insulation State Indicator (ISI). As illustrated in Figure 9, the ISI quantifies the deviation between the amplitude spectrum obtained at the start (the healthy reference) and the amplitude spectrum obtained at a later point during operation. ISI is computed over a defined frequency range determined by the sampling frequency and the FFT window length, and can be expressed as follows [44]:
I S I p , k = g = n l o w n h i g h Y r e f , p ( g ) Y c o n , p , k ( g ) 2 n h i g h n l o w
where Y r e f is the FFT magnitude spectrum of the reference current, Y c o n is the later FFT magnitude spectrum of the measured current, p is the phase of the current, m is the indices number of measurement repetitions, and n h i g h ,   l o w is the frequency range defined by the FFT window and sampling frequency.
Following the publication of the RMSE-based ISI, subsequent work by other researchers proposed the mean absolute error (MAE) norm as an alternative metric for spectral deviation. An example is the State Estimation Factor (SEF) introduced in [22], which employed the MAE between the frequency-domain representation of the current response and the healthy baseline.
The SEF can be expressed as follows [22,51,52]:
M A E = 1 M i = 1 m x * i x i   s . t . p v a r i e d = 0,1
S E F M A E = M A E % = M A E M A E h e a l t h y × 100 %
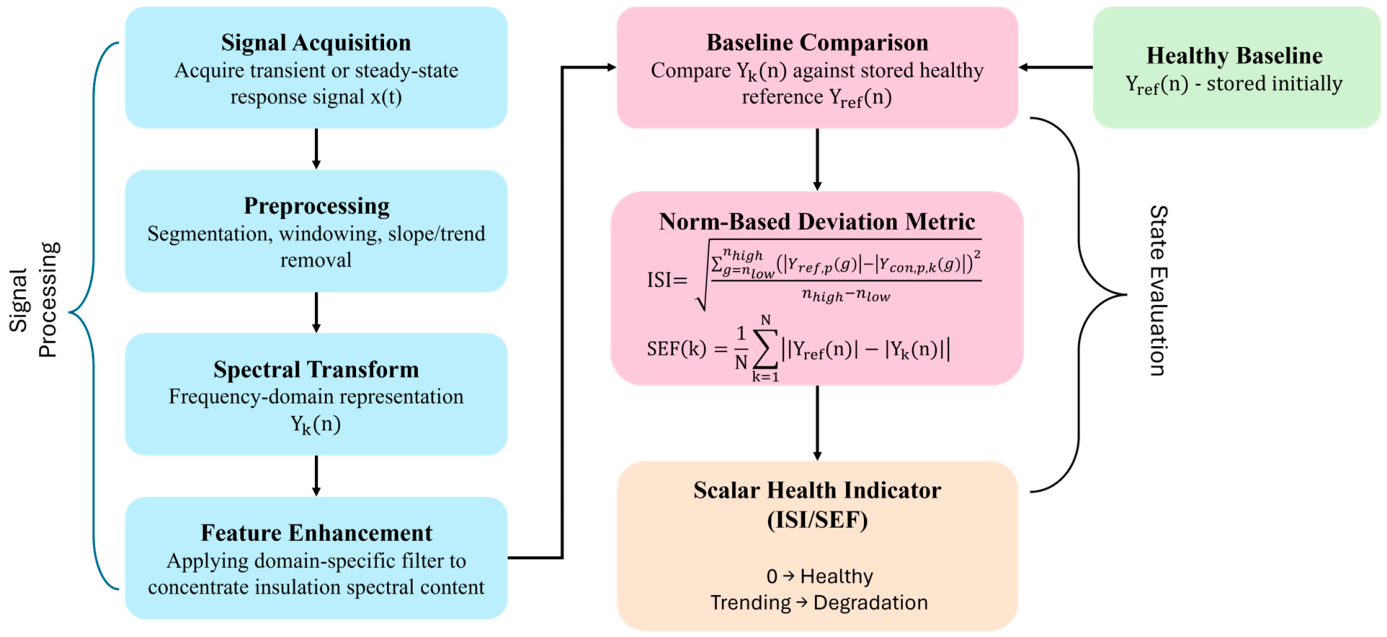
where x * i is the initial FFT spectra, x i is the FFT spectra of multiple degraded cases and m is the total number of counts. S E F M A E is the normalized version of MAE, which quantifies the relative change as a percentage of the healthy spectra value. The generalized methodology of the norm-based deviation framework is illustrated in Figure 10, showing the signal flow from acquisition through to the scalar health indicator metric.
The norm-based deviation concept has also been extended to the impedance domain, where the same metrics are applied to the high-frequency impedance spectrum of the machine, measured or estimated at different stages of insulation life. This approach was used in [23,50] to investigate the effects of electrical aging on the high-frequency characteristics of electrical machines used in high-speed drives. For the impedance-based approach, obtaining the impedance spectrum online is more involved. It requires either signal injection methods [24] or the extraction of impedance from the switching transients using techniques such as empirical transfer function estimation (ETFE) [26].
Once the impedance spectrum is obtained, the same formulations can be applied, substituting the current spectrum with the impedance magnitude spectrum [23]:
d z , j   = 1 n k = 1 n w ( k ) · Z 0 k Z j k 2
where Z 0 k is the healthy state impedance, Z j k is the impedance after j aging cycles, w(k) is a weighting function between 0 and 1, and n is the number of measurement points.

7.3. Impedance Response (ETFE)

The impedance response of an electric machine can be obtained from the voltage and current measurements as the ratio of their Fourier transforms [25,26,53]. For a linear time-invariant system, the Empirical Transfer Function Estimate (ETFE) provides a non-parametric estimate of the frequency-dependent impedance from a broadband signal expressed as [25]
G ω = Y ω U ω
where Y ω is the Fourier transform of the output (voltage), U ω is the Fourier transform of the input (current), and G ω is the estimated impedance at the angular frequency ω . Longer-duration pulses provide better resolution at lower frequencies while shorter pulses provide greater resolution at higher frequencies. Also, the accuracy of the ETFE can be increased by capturing more data and averaging them out [25]. ETFE is closely related to a broader framework of Frequency Response Analysis (FRA) applied to rotating machines. In [34], the per-turn equivalent circuit, instrumentation requirements, and the sensitivity of broadband impedance features to different insulation fault types were reviewed. The impedance expression is like that of the ETFE, and it is expressed as
Y d B = 20 l o g 10 V i n V o
where Y d B is the admittance of the signal. The admittance is the inverse of the impedance; thus, we can say that the above equation has a relation to the ETFE if V o is measured across a resistor R s . We can further express it in the following form:
Y d B = I V i n = V o ( w ) R s V i n ( w )
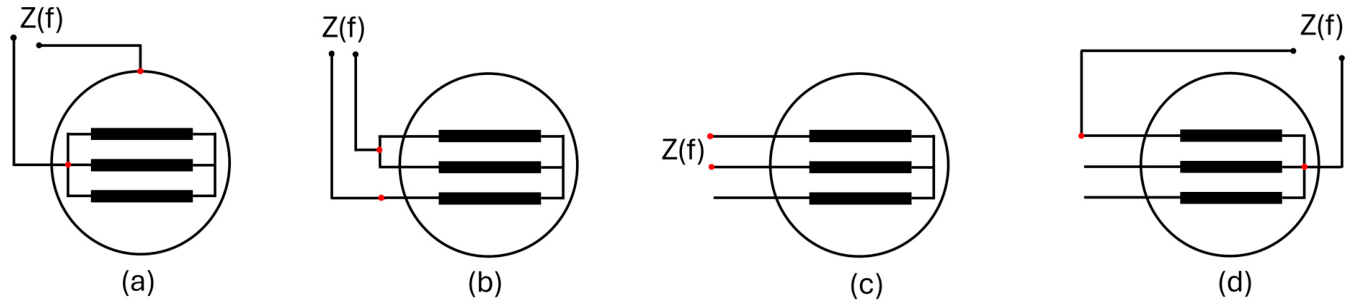
Figure 11 shows the various ways in which the impedance measurements can be taken to compute the ETFE. Figure 11a,b, which show the Common Mode Impedance and Differential Mode Impedance, respectively, are more commonly used. Figure 11c,d allow one to investigate faults in the winding between two phases. An online high-frequency impedance identification method for stator health monitoring of traction machines was proposed in [24]. The voltage and current signals were measured during steady-state machine operation using wideband probes, and the FFT was applied to extract their frequency spectra. The impedance was then computed via the ETFE over a range up to several MHz, and the evolution of the resonance frequencies was tracked as an insulation aging indicator. The range and accuracy of the characterization were shown to depend on the supply voltage level and the bandwidth of the measurement probes. It must be noted that although [24] did not use the term ETFE, the approach used is similar to the ETFE technique described in other publications.
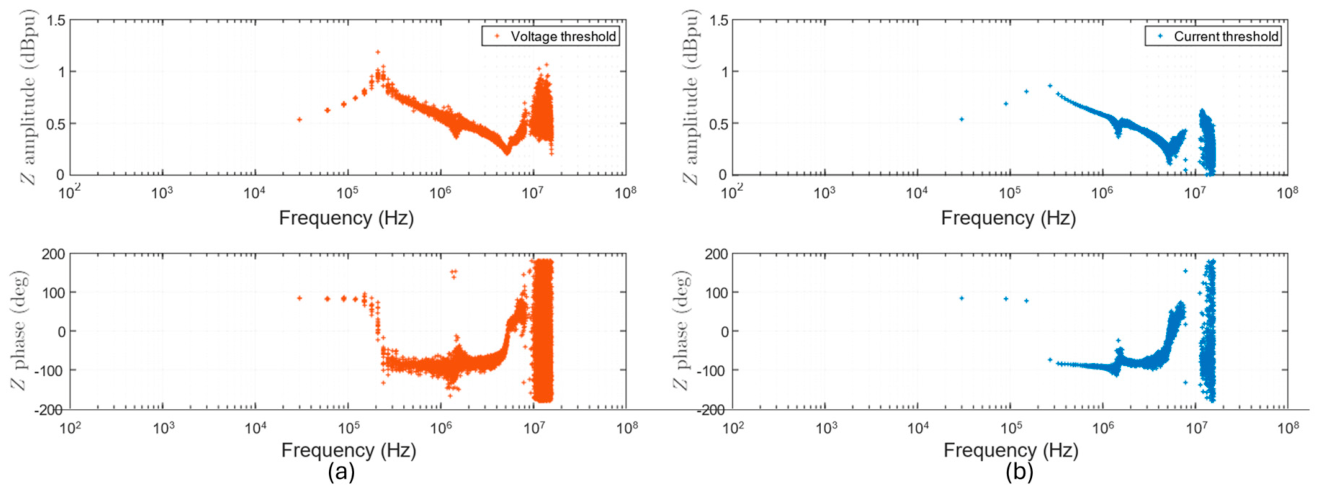
Figure 12 shows an example of the raw common-mode impedance characterization obtained using two different measurement thresholds of voltage and current. The impedance magnitude and phase are plotted over a frequency range from 102 to 108 Hz, revealing the resonance and antiresonance features of the stator winding that are directly linked to the parasitic capacitances of the insulation system. The scattered data points at lower frequencies and the increased noise density above 107 Hz illustrate the inherent limitation of the ETFE technique, where the spectral resolution depends on the supply voltage level and the bandwidth of the measurement probes, and combining impedance responses at different frequencies to extend the characterization range introduces noise at higher frequency ranges [24].
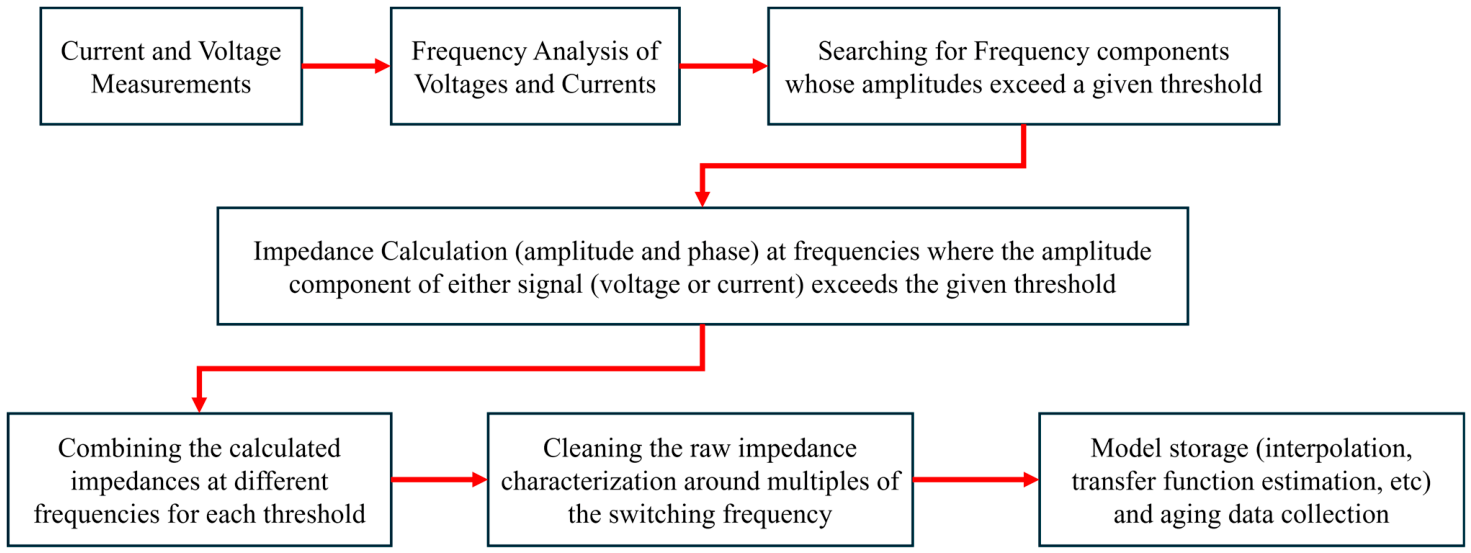
Figure 13 presents a flowchart of the impedance characterization method adapted from [24], showing the steps from signal acquisition through FFT computation to the final impedance response.
A detailed modeling approach where the ETFE was used to validate a Multi-Conductor Transmission Line (MCTL) model of form-wound motor coils on a 10 kV SiC testbed was presented in [53]. A finite element model (FEM) of the motor coil was first developed in COMSOL and used to determine parameters for the MCTL electrical model. The ETFE was then employed to measure the experimental impedance response of the coil under test, and the comparison between the model and ETFE measurement was used to validate the model’s accuracy. The validated model was used to analyze the impact of insulation delamination and voids, and to implement an insulation state-of-health metric for both healthy and damaged coils. This approach applied the ETFE as a model validation tool rather than a standalone monitoring method, but the underlying principle that the impedance response changes measurably with insulation degradation is the same.

7.4. Key Findings

  • Frequency-domain methods show that insulation alters the spectral content of stator and leakage current, and impedance response.
  • FFT based methods are easy to apply but are limited when fault components are weak or mixed with harmonics.
  • Norm-based methods provide an easier approach to tracking insulation aging using the spectral content of the signals over time.

8. Time–Frequency-Domain Diagnostic Signal Processing Methods

8.1. STFT

The FFT, while having high resolution, does not work well for analyzing non-stationary signals due to its inability to pinpoint the precise timing of specific frequencies in the spectrum [54]. Short-Time Fourier Transform (STFT), which is a time–frequency technique, was developed to address this limitation. The STFT works by segmenting the input signal into narrow time intervals then takes the Fourier transform of each segment, thereby providing both time and frequency information [17,55]. The STFT of a signal can be expressed by the following equation [55]:
S T F T f u t ,   u =   f t   W ( t t )   e j 2 π u t   d t
where t is the time of the signal, u is frequency, f(t) is the input signal and W is the windowing function. Due to the segmentation of the STFT, the windowing function and the frequency resolution being used are critical for accurate frequency localization. According to [55], the transform turns into FT if the window function is too long, since it provides a good frequency localization but at the expense of the time resolution. There are several windowing functions which are used for STFT. Common windowing functions include the Hanning, Hamming, rectangular, triangular and Bartlett functions [17]. Table 2 summarizes the main parameters that govern the STFT computation and directly influence its time–frequency resolution.
In [17] the STFT was applied to three diagnostic signals, including the phase current, its envelope (which was extracted using Hilbert Transform), and the stator current space vector module for online Inter-Turn Short Circuit (ITSC) detection in a 2.5 kW PMSM. It was shown that the STFT of the current envelope was able to reveal the amplitude increase in the 2 f s component caused by inter-turn faults, which was otherwise not clearly visible in the raw FFT spectrum.
In [54], an STFT-based MCSA method was implemented online in LabVIEW, using a 0.1s acquisition window with 10,000 samples to continuously track the amplitude evolution of fault-related harmonics in real time. A comparison with the zero-sequence voltage analysis found that while STFT-based MCSA could detect ITSC, the zero-sequence voltage method was more robust to load variations and unbalanced supply voltage conditions.
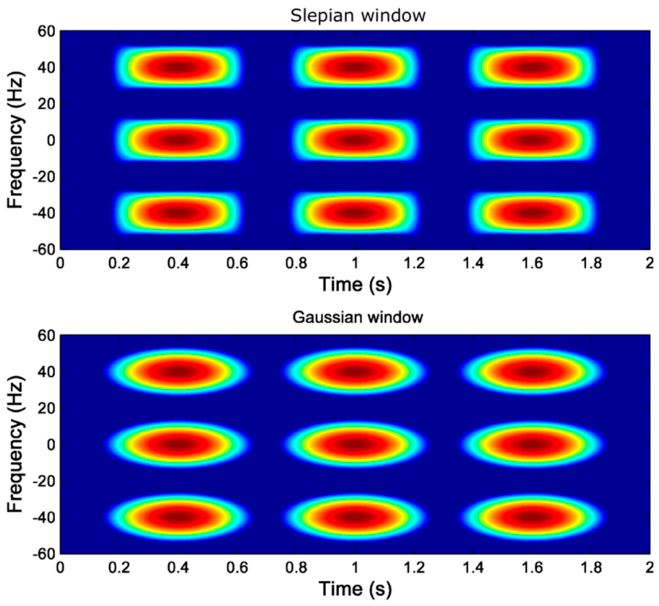
In [56], the use of an optimized Slepian window, which maximizes energy concentration for a given window length, was proposed to improve the time–frequency resolution of STFT. An experimental validation on a 3.15 MW induction motor with broken rotor bars during start-up demonstrated that the Slepian window significantly reduced spectral leakage compared to the standard Gaussian window, as seen in Figure 14. The use of the optimized Slepian window in the STFT produced cleaner spectrograms with better separation between the fault-related lower sideband harmonic and the fundamental component.

8.2. Fractional Fourier Transform

Fractional Fourier Transform is an extension of the Fast Fourier Transform which operates within the time–frequency region. The FRFT can be expressed as [57]
f a ξ = F a ξ = + K a ( ξ ,   x )   f x   d x
where K a ( ξ , x ) is the transform kernel, defined with α = a π / 2 ,
K a ξ , x = C α   exp - i π 2 x ξ sin α x 2 + ξ 2   cot   α
C α = 1 i cot α
where f(x) represents the acquired transient signal, ξ is the transformed domain variable and α is the rotation angle that controls the degree of decomposition between the time and frequency domains. When α =   π / 2 , the FrFt reduces to the standard Fourier Transform (FFT). The key advantage of the FrFT for insulation diagnostics is that by optimizing α , the transform can be tuned to maximize the energy concentration of insulation-sensitive spectral components, which may be spread across both time and frequency. This makes the FrFT suited for analyzing non-stationary transient responses in inverter-fed machines.
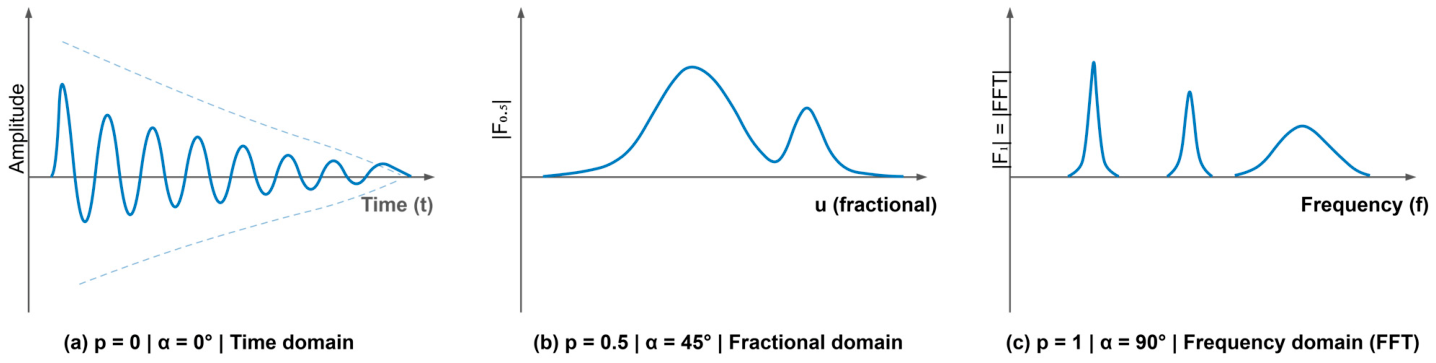
Figure 15 shows the three main FrFT orders, spanning from 0 to 1, with 0 being the time domain, and p = 1 being the frequency domain. The FrFT order can be varied between 0 and 1. The application of the FrFT to electrical machine fault diagnosis was demonstrated in [58] through the transient motor current signature analysis (TMCSA) of induction motors with broken rotor bars. This application is analogous to how stationary harmonics appear as peaks in conventional FFT. The optimal rotation angle α o p t was determined by sweeping across fractional orders and identifying the angle at which the signal energy was maximally concentrated, effectively converting a fault signature into a spectral line.
In [21], an FrFT-Mel (Fractional Fourier Transform combined with Mel-scale filtering) method was proposed for turn insulation state prediction in a 3 kW Permanent Magnet Motor (PMSM). The FrFT was applied to the high-frequency switching oscillation current at an optimized fractional order (p = 0.88), followed by feature extraction using a customized Mel filter bank with center frequency aligned with the parallel resonance point of the machine’s common-mode impedance. The MAE between the healthy and degraded spectral state was adopted as an evaluation index, realizing an increase in the sensitivity of turn insulation state detection by more than seven-fold compared to traditional FFT. Table 3 presents a sensitivity comparison across four methods at the different emulated turn-to-turn capacitance, Cf, levels reported in [21]. The results show that the FrFT-Mel method consistently achieved the highest percentage change across all capacitance values, with the sensitivity gap widening significantly at higher degradation levels.

8.3. Wavelet Transforms

The wavelet transform (WT) provides a multi-resolution analysis of signals by decomposing them into scaled versions of a mother wavelet function. Unlike FFT which provides only frequency information, or the FrFT which rotates the time–frequency axis using a rotational order, wavelets offer localization in both time and frequency [18,55]. This makes them suited for analyzing non-stationary transient responses in inverter-fed machines, where faults may be localized to specific time intervals within the switching oscillations. The different wavelet transforms are discussed below.

8.3.1. Continuous Wavelet Transform (CWT)

The continuous wavelet transform of a signal x(t) is defined as [20]
C W T τ , α = x t ψ α , τ * t d t
where x(t) is the input signal and the scaled and translated wavelet is given by
ψ α , τ t = 1 a ψ t τ α
where a is the scale factor, τ is the translation in time, ψ t is the mother wavelet and ψ * is the complex conjugate. CWT analysis of the stator phase current symmetrical components was applied for condition monitoring and fault diagnosis of PMSM stator windings in [20]. The complex generalized Morse wavelet was used as the mother wavelet, and the CWT coefficient amplitude at the fundamental frequency was identified as a highly sensitive indicator of interturn short circuits. The Morse wavelet was shown to provide the greatest sensitivity to incipient faults compared to Morlet and bump wavelets. The value of C W T i 2 ( f s , t ) increased significantly even for a single shorted turn (0.4% of total turns), and the indicator remained robust across varying load torque and supply frequency conditions. The CWT coefficients extracted were used as input features for machine learning classifiers, achieving an effectiveness above 99% during offline testing and above 95% during online operation.
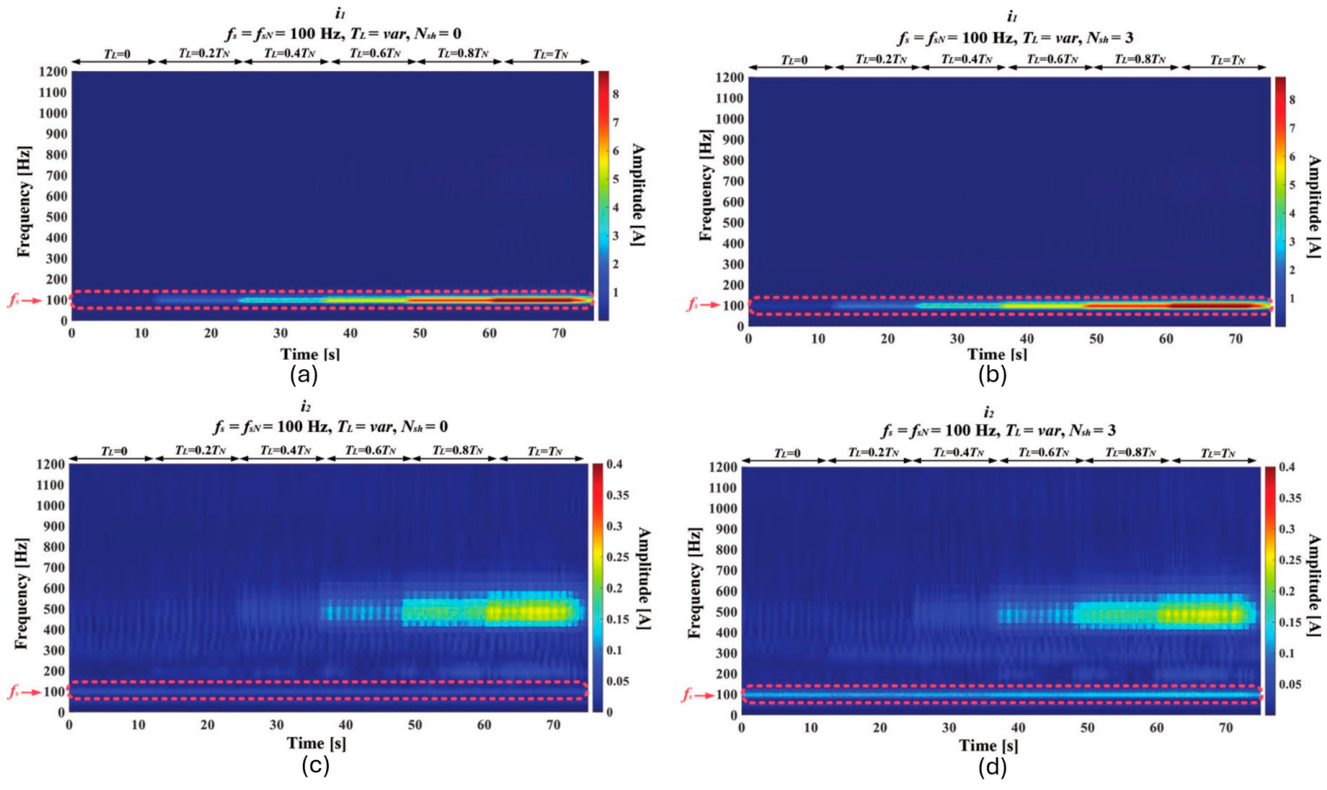
Figure 16 shows the CWT scalograms of the stator phase current for undamaged and damaged winding conditions under varying load torque. The scalograms of the positive-sequence current i 1 (top row) and negative-sequence current i 2 (bottom row) reveal that the fault-induced spectral content becomes clearly visible in the negative-sequence component, particularly in the 400–600 Hz range, which confirms the sensitivity of the CWT-based approach to ITSC faults.

8.3.2. Discrete Wavelet Transform (DWT)

For a discrete-time signal x t   R N , the approximation and detail coefficients are defined as [18]
d j , k = t = 1 N x t   ψ j , k t ,   a j , k = t = 1 N x t   ϕ j , k t ,
where d j , k is the detail coefficient, a j , k is the approximation coefficient, ψ j , k t is the wavelet function at decomposition level j and translation index k, ϕ j , k t is the corresponding scaling function, and N is the signal length. These are the most important equations in DWT. Quantitative fault indicators based on DWT and wavelet packet coefficients were proposed in [18] for broken rotor bar detection in induction motors during startup transients. The discrete Meyer wavelet (‘dmeyer’) was selected for its favorable frequency localization properties, and the DWT was applied at level 9 decomposition corresponding to the 9–20 Hz frequency band, where the left-side harmonic of the broken bar fault is most prominent. Although the paper used the stator current for DWT analysis, it is centered on rotor fault detection, which is outside the scope of this review. However, the approach used is a standard approach that can be applied to stator insulation condition monitoring.

8.3.3. Wavelet Packet Transform/Wavelet Packet Decomposition (WPT/WPD)

In Ref. [59], a novel WPD-based insulation condition monitoring technique that can simultaneously detect and classify both turn-to-turn (TT) and groundwall (GW) insulation degradation from the HF line current was proposed. The HF line current was expressed by Equation (26) [59]:
i l i n e t =   i t r a n s t +   1 L M 0 t V P W M t d t
where L M is the magnetizing inductance of the machine and V P W M is the PWM voltage, and i t r a n s ( t ) is expressed as follows:
i t r a n s t =   i l i n e t   p 1   t     p 0
where p1 (slope) and p0 (intercept) are obtained through least squares fitting. The transient current itrans isolates the high-frequency oscillation. The WPD construction is also expressed as
w l , k t = n   h * t 2 n w l + 1,2 k t + g * t 2 n w l + 1,2 k + 1 t
where h * ( n ) is the reconstruction low-pass filter and g * ( n ) is the reconstruction high-pass filter. The key insight of this work is that the dominant oscillations in the transient current i t r a n s correspond to the first and second antiresonance frequencies ( f C M _ a r 1 and f C M _ a r 2 ) of the common-mode impedance, and that TT and GW degradation affect these frequencies differently. GW degradation causes significant shifts in f C M _ a r 1 while TT degradation primarily affects f C M _ a r 2 . Simulation results showed that S O H G W   increased with GW degradation severity while remaining stable under TT-only degradation, and vice versa for S O H T T . Experimental validation on a stator winding with SiC inverter excitation confirmed these trends at 10% and 20% degradation severities. The following subsections are important considerations for the effective implementation of the WPD technique.

8.3.4. Wavelet Basis Selection

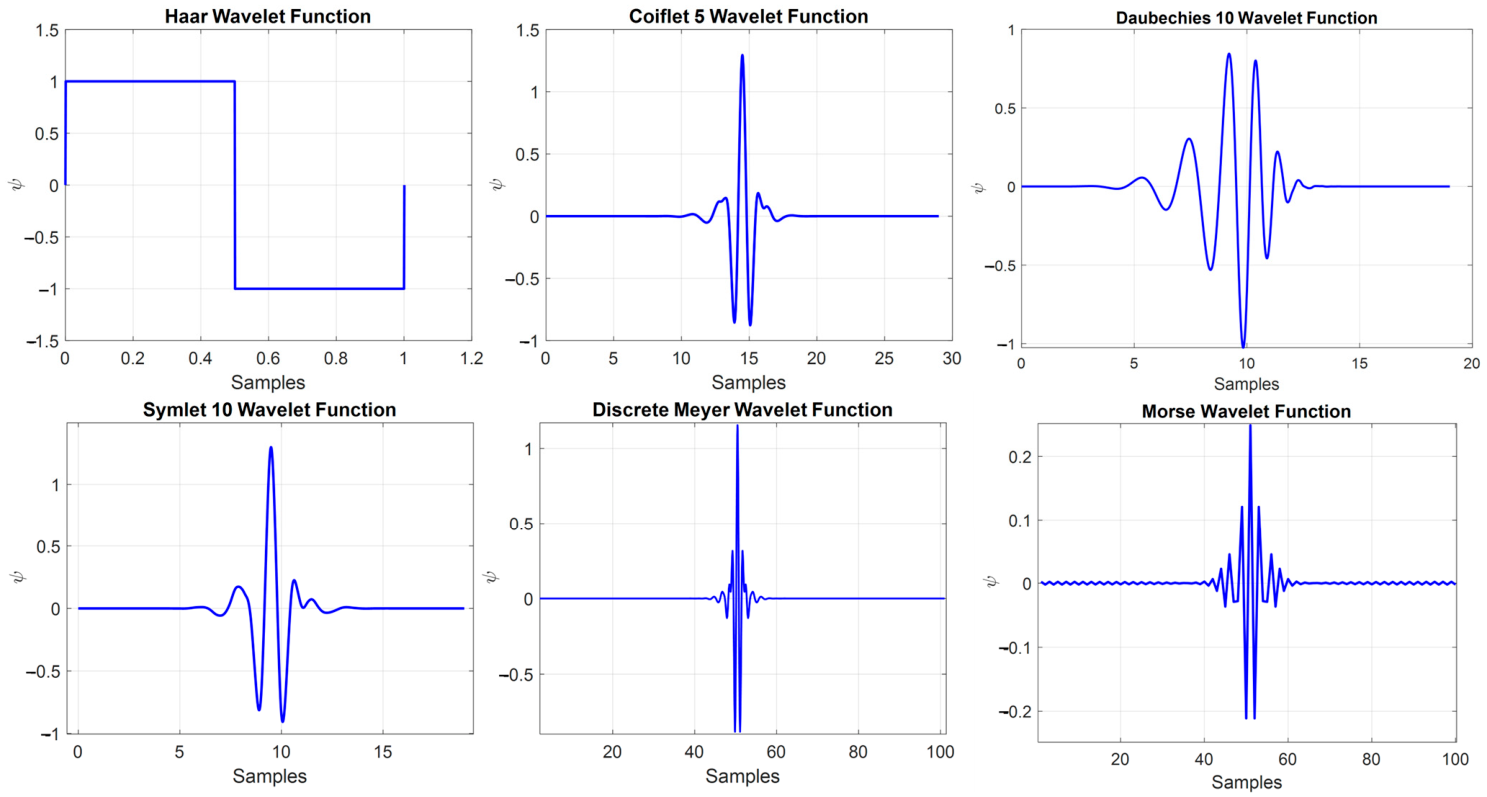
The selection of the mother wavelet is a critical decision that significantly affects the performance of wavelet-based insulation condition monitoring. It is required to know and understand the signal for which WPD will be used. Figure 17 shows representative wavelet functions from commonly used families, including Haar, Daubechies, Symlet, Coiflet, Discrete Meyer, and Morse. In Ref. [18], it was shown that the discrete Meyer wavelet (dmeyer) consistently provided superior frequency localization for motor fault diagnosis applications, while [60] found that the Daubechies family offered good balance between energy concentration and entropy minimization for insulation applications. A comparison of five wavelet families (Haar, Daubechies, Symlet, Coiflet, and Discrete Meyer) for induction motor fault diagnosis using WPT combined with SVM, presented in [61], indicated that while all five families could achieve acceptable classification accuracy, the discrete Meyer wavelet consistently provided the most favorable result due to its superior frequency localization properties. This finding is consistent with [18], which also identified ‘dmeyer’ as the preferred wavelet for startup transient analysis. However, as [62] showed through a multi-criteria investigation, there is no universally optimal wavelet and the best choice depends on the specific signal characteristics and the objective of the analysis.
Table 4 summarizes the key strengths and limitations of the wavelet families that have been used for insulation condition monitoring and motor fault diagnosis in the literature. The summary shows that no single wavelet family is optimal, and the choice depends on the trade-off between frequency localization, computational cost and phase distortion for the specific application.

8.3.5. Wavelet Selection Criteria

The following selection criteria for the appropriate mother wavelet have been proposed in the literature:
  • The Maximum Energy Criterion
The simplest approach selects the wavelet that maximizes the energy captured in the wavelet coefficients of the packet of interest. The energy of a wavelet packet W P j for a candidate wavelet ψ w   is computed as [59]
E W P j ψ w = i = 1 y   w W P j , i ψ w 2
The wavelet that yields the highest energy is selected on the basis that it best captures the dominant signal content in the frequency band of interest. This criterion is straightforward to implement but does not account for the distribution of energy [59,62].
2.
Shannon Entropy
Shannon entropy quantifies the spread of energy across the wavelet coefficients. The entropy of a wavelet packet is defined as [59]
H W P j = i = 1 y w W P j , i 2 E W P j   l o g   w W P j , i 2 E W P j
Lower entropy indicates that the signal energy is concentrated into fewer coefficients, implying a more compact and informative representation. This criterion was used in [61] for selecting the complex Morlet wavelet for roller bearing fault detection.
3.
Energy-to-Shannon Entropy Ratio (ESER)
The ESER criterion combines both energy and entropy into a single metric by maximizing their ratio [59]:
E S E R W P j   =   E W P j ( ψ ω ) H W P j ( ψ ω )
A high ESER indicates that the wavelet captures significant signal energy with minimal spread across coefficients. This criterion was proposed in [65] for gearbox fault detection under varying speed conditions. A modified version that maximizes the sum of normalized ESER values from two distinct wavelet packets was used in [59] for insulation condition monitoring.
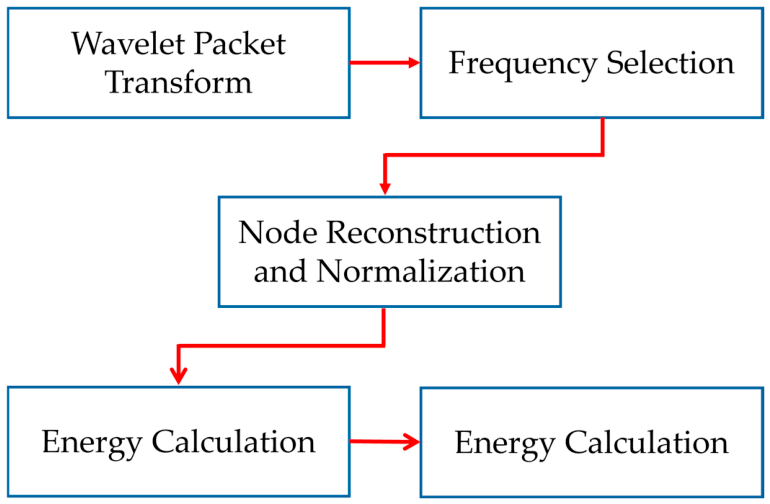
Figure 18 summarizes the general algorithm steps for WPD-based insulation condition monitoring, from signal acquisition and slope removal through wavelet packet decomposition and packet selection to the computation of the SOH indicators.

8.3.6. Decomposition Level Selection

The selection of decomposition level is critical for effective insulation monitoring. The level must be chosen such that the frequencies of interest are isolated within separate wavelet packets, satisfying
k i 2 l + 1 f s < F < k i + 1 2 l + 1 f s
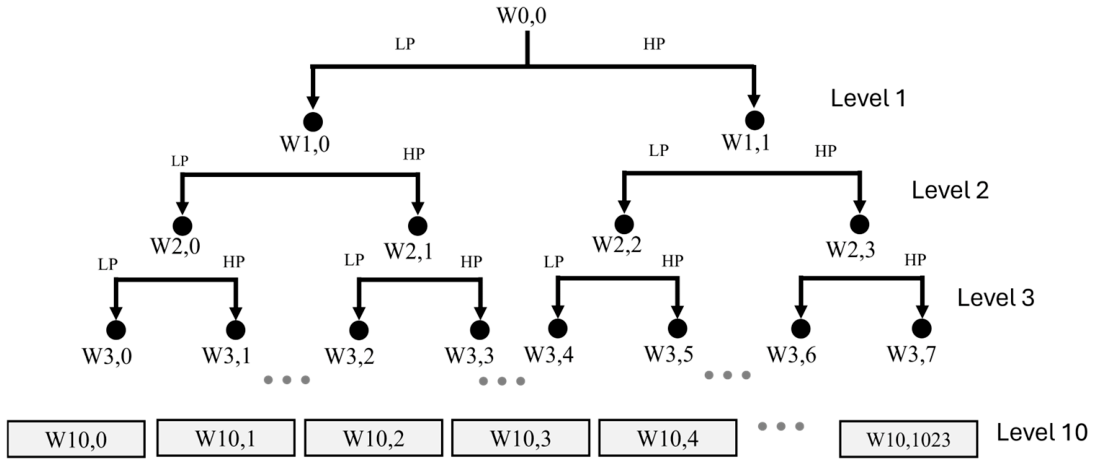
where k i is the packet index, l is the decomposition level, f s is the sampling frequency, and F is the target antiresonance frequency to be isolated. A higher decomposition level produces narrower frequency bands, which improves the separation between the first and second antiresonance regions but increases the computational cost and the number of wavelet coefficients. In practice, the decomposition level must be high enough that the frequencies of interest fall into distinct packets, but not so high that the signal energy in each packet becomes too sparse for reliable SOH computation. A decomposition level of 5 for sampling rates in the MHz range provided frequency band widths in the order of tens of kHz, which were sufficient to isolate the frequency regions for the machines tested in [19]. The appropriate decomposition level is machine-specific and must be determined. Figure 19 illustrates the wavelet packet tree structure at a decomposition level of 10, showing how the frequency axis is partitioned into individual packets that can be selected to isolate the antiresonance frequency bands of interest.

8.4. Partial Discharge Signal Processing Approaches

Partial discharge (PD) is a localized dielectric breakdown that occurs within voids, delamination or at surfaces of the insulation system when the local electric field exceeds the breakdown strength of the gas within the defect [27,28,37]. A comprehensive discussion on the four categories of PD, such as internal discharges, end winding surface discharges, discharges due to conductive particles and slot discharges, is provided in the literature [28]. In stator windings rated 6 kV and above, PD activity is a well-known cause of insulation aging and is routinely monitored as a primary diagnostic indicator [28,37]. The processing of these events is generally in this order: conditioning raw data, isolating individual discharge events, extractive features and identifying the PD patterns. These processes will be discussed in this section. A more comprehensive review of advanced PD signal processing methods can be found in [35].
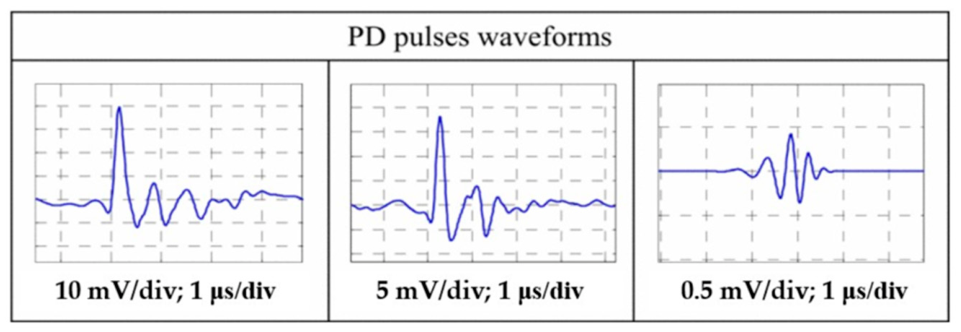
The central signal processing challenge in online PD monitoring is separating the PD pulses from noise components, which overlap in both the time and frequency domains. The signal-to-noise ratio (SNR) is typically very low, particularly in inverter-fed machines where the switching noise can be orders of magnitude larger than the PD pulses [66]. Figure 20 shows typical PD pulse current waveforms at different measurement sensitivities, illustrating the short-duration oscillatory nature of PD events.
Filtering is the first stage and helps to target frequency components which are separable from the PD pulse. The FFT is typically the standard tool for analyzing the frequency spectrum. However, because it discards time information, it cannot, on its own, localize the PD pulses. Thus, time–frequency techniques including STFT or wavelet analysis are required to separate the PD pulses from interference sources [35,67]. Wavelet transform (WT) is the most widely applied method. As discussed in Section 8.3, the performance of WT depends on the choice of mother wavelet, the decomposition level and the threshold function. A novel wavelet shrinkage scheme for the PD signal denoising of large generators was applied in [68]. Other methods such as empirical mode decomposition (EMD) and singular value decomposition (SVD) have also been used in the literature.
The most widely used framework for PD classification is phase-resolved partial discharge (PRPD) analysis. These are patterns which are formed by the counts of pulses in a time window, expressed as a function of voltage and phase angle of the PD pulse [28]. An expert and specialized equipment are usually required to diagnose the output of a PD to classify it into a specific type. ML is increasingly being used for classification [69,70]. However, the main barriers to deploying ML for PD classification have been highlighted in [35]. The barriers are largely due to the absence of large public PRPD datasets, limited generalization across machines and operating conditions, and the lack of interpretability of the ML models.

9. Data-Driven and Hybrid Approaches

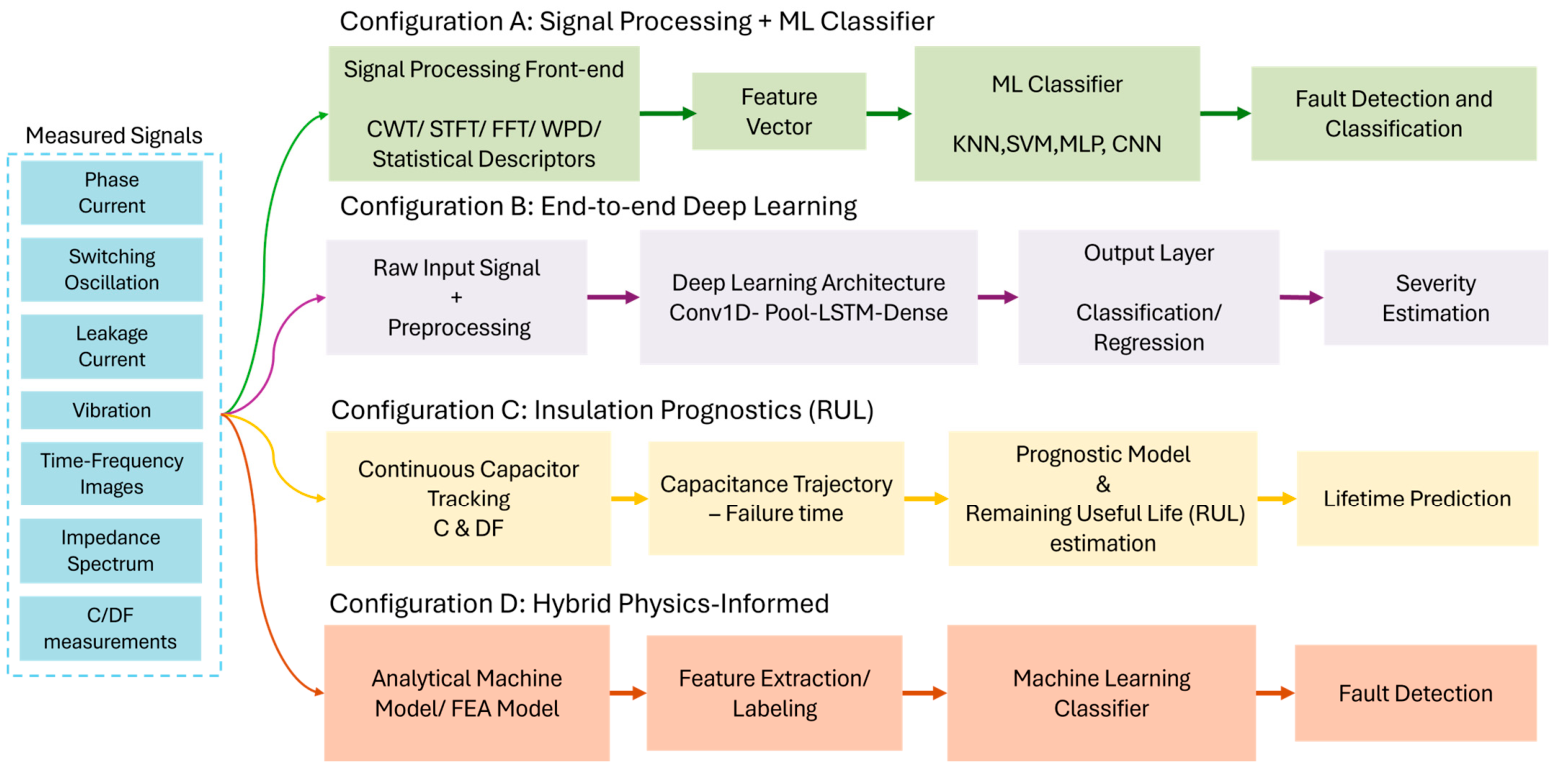
The stator insulation diagnostic signal processing techniques discussed, which include the time-domain, frequency-domain and time–frequency-domain techniques, all rely on domain knowledge to define the spectral features, frequency bands or deviation metrics. Many of these signal processing techniques can be deployed with ML models in a data-driven framework. The data-driven methods reviewed in this paper can be grouped into four categories for easier understanding, as seen in Figure 21. These are as follows:
  • Feature-Engineered Machine learning—Category 1.
  • Deep Learning—Category 2.
  • Prognostics and Remaining Useful Life—Category 3.
  • Hybrid Physics-Informed—Category 4.

9.1. Signal Processing Front-End with ML Classifier

This is the most common configuration that combines a conventional signal processing front-end with an ML classifier. This approach follows the classical machine learning procedure, where the signal processing techniques reviewed in the previous sections (FFT, FrFT, STFT, WPD) are used to convert the measured signals into useful features, which are fed into ML algorithms such as SVM, KNN, Decision Trees and Random Forest. The predicted output is used for fault identification and/or severity classification. Based on the papers reviewed, this category has further been divided into the types of signals and/or techniques used for the machine learning classification.
In Refs. [20,71,72], Wavelet analysis using the stator line current was applied with a ML approach for fault detection and classification. In [71], Wavelet Scattering Transform (WST) was used for the feature extraction on the transient phase current while in [20], CWT with a Morse wavelet was applied to the negative sequence component of the stator phase current to extract input features. Three classifiers, KNN, SVM and MLP, were compared, with KNN achieving a classification effectiveness of 99.75% across different load torque levels and with ITSC severities of one to three shorted turns.
Both line current and leakage current can be used as source of features for data-driven feature extraction. In the case of leakage current, more sensitive measuring instruments, such as high-sensitivity current sensors, are required. In Ref. [73], a high-sensitivity current transformer was used to measure the differential leakage current in each phase and a technique for the online assessment of low- and medium-voltage insulation was proposed and an artificial neural network (ANN) was used to identify stress agents responsible for insulation degradation. The stress agents investigated included temperature, oil and moisture.
PD has also benefited from ML classification. The performance of SVM and KNN for classification of different types of PD faults was investigated in [74]. Different features of PD were extracted using Discrete Wavelet Transform (DWT) and statistical parameters. These results demonstrated the feasibility of the application of wavelet analysis to PD signals for feature extraction. The PD signals investigated were corona discharge, surface discharge and internal discharge. On the basis of performance criteria such as prediction accuracy and training time, SVM outperformed all types of KNN models.
Besides PD signals, PD images have been deployed in feature engineering. A machine learning approach for the classification of different partial discharge patterns represented as images and recorded on electric machines was presented in [69]. The CNN model was trained on the augmented data and used for fault detection and classification. The CNN model achieved a high accuracy in predicting the different PD patterns, including slot, internal discharges and discharges in end-windings.

9.2. End-to-End Deep Learning

A more recent direction reduces the signal processing stage and uses deep learning architectures to learn the mapping between raw or lightly preprocessed signals with insulation health indicators. The motivation is that manual feature engineering may not capture the most distinct signal characteristics, and the features may differ across machine types and operating conditions. It has been reported in [75] that FFT- and STFT-based current signature analysis could not distinguish certain stator winding fault conditions from the healthy case in a simulated induction motor, but a Long Short-Term Memory (LSTM) network trained directly on the time-series current data achieved 97% classification accuracy, showing that recurrent architectures can extract temporal fault signatures that are missed by the conventional frequency domain analysis.
In Ref. [29], a data-driven method for monitoring terminal insulation degradation of inverter-fed machines based on enhanced switching oscillation signals was proposed. A one-dimensional convolutional neural network (1DCNN) regression model was trained to predict the terminal insulation capacitance directly from the enhanced signals, achieving a capacitance estimation accuracy at the Pico Farad (pF) level. In the proposed approach, wavelet packet analysis was first used to reconstruct the switching oscillation signal for insulation sensitive feature enhancement prior to model training. Another example along the same lines can be found in [76], which used higher-order spectral analysis, where the bispectrum of the stator phase current was computed and the resulting two-dimensional bispectrum images were fed into a convolutional neural network (CNN) for ITSC detection.

9.3. Insulation Prognostics Signal Processing Approach

This subsection briefly discusses the signal processing approach for the remaining useful life (RUL) estimation of the stator insulation system, which requires the continuous tracking of insulation parameters and indicators from commissioning through to failure. Different indicators have been tracked and translated into RUL in the literature, for example, capacitance, dissipation factor (DF), leakage current, or partial discharge trends.
A method based on multi-frequency measurement of equivalent groundwall insulation capacitance and DF was proposed in [13]. The capacitance and DF were tracked continuously through the accelerated aging of four stator samples until failure. This work established a link between capacitance progression trajectory and the final failure time, enabling prediction of the remaining time to insulation failure from the current capacitance value and its rate of change. The recent methods in [77,78,79] tended to track leakage current features. An online method to predict the RUL by monitoring the magnitude of the transient response overshoot in leakage current was proposed in [77,79], where a peak detector circuit was developed to extract the leakage current peaks instead of sampling it at a high frequency. An extended-Kalman filter (EKF) algorithm was applied to predict the leakage current trend, demonstrating that it is possible to estimate RUL online using leakage current transient overshoot.
Additionally, hybrid RUL approaches combine a physical or analytical machine model, which could be a stator winding electric or equivalent circuit model, finite element simulation or an HF analysis with data-driven approaches to estimate RUL. For example, a prognostic method to assess and predict the RUL of stator winding insulation reported in [80] can be summarized in three stages: First, a finite element analysis (FEA) was used to develop a slot geometry, and degradation was simulated using changes in permittivity and conductivity. The RUL prediction is based on the leakage current decay. The final stage uses a stator equivalent circuit model to verify the multiple levels of degradation. The experimental results reported showed that the method is effective in assessing the condition of stator insulation.

9.4. Challenges and Proposed Solution Trends for Data-Driven Approaches

The major challenges for data-driven approaches include:
  • Limited labeled data;
  • Limited training data (data scarcity);
  • Data privacy constraints;
  • Poor generalization;
  • Computational complexity and lack of interpretability.
To overcome these challenges, advanced ML techniques have been developed, such as transfer learning (TL), self-supervised learning (SSL) and federated learning (FL) techniques. TL method allows a model to learn features from unlabeled data based on its own learning objectives. This tackles the issue of limited labeled data. The SSL method allows a model to learn features from unlabeled data based on its own learning objectives. This tackles the issue of limited labeled data. FL is a collaborative framework where individual participants train a global model without sharing data, thereby helping to address the issue of limited training data and data privacy.
Most studies on these advanced ML methods have been reported to show promising results, especially for rotor fault diagnosis. However, limited studies have been reported for the condition assessment of stator insulation, which highlights a growing area of research.

10. Discussion

The preceding sections presented a review of the diagnostic signal processing techniques that have been applied to stator winding insulation condition monitoring in electric machines. Selecting the appropriate technique for a given application requires consideration of multiple factors, which makes direct comparison across methods necessary but challenging. To summarize the findings from this review into a form that is useful for both researchers and practitioners, Table 5 presents a condensed comparative summary of the techniques reviewed. For each technique, the table identifies its main findings, its limitations, and the key practical considerations for its implementation. To complement Table 5, Table 6 maps each signal processing technique to the three principal insulation fault types, turn-to-turn (TT), groundwall (GW) and phase-to-phase (PP), showing whether they are validated with supporting references. It is important to note that no single technique addresses all monitoring requirements. The optimal approach depends on the specific application constraints, the computational resource, and whether the objective is fault detection, severity classification, or RUL prediction.
Several observations can be drawn from the comparison. For practitioners limited to the existing current sensors in a standard inverter drive with no additional hardware, the norm-based methods and the time-domain methods are the most realistic options for deployment. For applications where distinguishing between turn-to-turn and groundwall degradation is important, WPD and ETFE are the only approaches that have demonstrated this capability. Where maximum detection sensitivity is the priority and computational cost is not a constraint, the FrFT method offers the highest reported sensitivity improvement over conventional FFT. Partial discharge analysis remains the only technique that provides direct evidence of active insulation breakdown, but its hardware requirements and low SNR under PWM switching make it the most challenging to implement online. Data-driven methods offer the highest classification accuracy but are currently limited to the specific machines on which models were trained. Table 6 shows that TT fault detection is the most extensively studied category, with almost all techniques showing some capability. GW fault detection is also well covered through leakage current, WPD and PD based methods. However, PP fault detection remains a significant gap in the literature, with very limited techniques having been validated for this fault type.

11. Conclusions, Limitations and Future Directions

This review provides diagnostic signal processing techniques applied to the monitoring of stator winding insulation in electric machines. The methods were organized according to their signal-processing domain, including time-domain, frequency-domain, time–frequency-domain and data-driven approaches. Each method discussed the basic operating principle, the measured signal, the insulation feature extracted from the signal and the practical requirements for implementation. It can be said that no single technique addresses all monitoring requirements, and the optimal approach depends on the sensing hardware, the insulation layer of interest, the computational resource, and whether the objective is detection, classification, or lifetime prediction.
The main contribution of this review is the organization of stator winding insulation monitoring from a diagnostic signal processing perspective. This provides researchers with a clearer basis for comparing diagnostic methods. The insulation fault mapping presented in this review shows where the current methods are well-developed and where further work is still needed. Turn-to turn is the most extensively studied. However, phase-to-phase insulation condition monitoring still needs more studies.
The review also brings together the main trade-offs that affect the different methods. Simpler methods, including time-domain indicators and FFT-based analysis are easier to implement, but may have limited sensitivity to weak or non-stationary signals. More advanced methods, including wavelet transforms, FrFT and ML, can improve sensitivity and classification but may often require higher sampling rates and more computational resources. This comparison can help researchers choose suitable methods for specific monitoring objectives and develop improved diagnostic approaches for online insulation condition monitoring.
Several limitations identified from this review include the following:
  • The gap between laboratory implementations and deployment of commercial drive controllers with limited computational resources still remains the most significant barrier to industrial adoption of advanced signal processing techniques for online insulation monitoring.
  • Progress in data-driven insulation monitoring is limited by the lack of standard fault datasets, common testing procedures, and shared benchmarks. Different studies use different voltage levels, aging methods, sensors, signal processing techniques, and fault definitions. This makes it difficult to compare methods fairly.
  • Many studies emulate insulation degradation using external capacitance. While these approaches are useful for controlled testing, they may not fully represent the behavior of naturally aged or failed stator windings.
Some future directions include:
  • Developing standard aging protocols, benchmarks, signal acquisition schemes and evaluation metrics.
  • Validating proposed methods using naturally aged stators and failed machines.
  • Developing methods to narrow frequency bands for groundwall, turn-to-turn and phase-to-phase insulation fault localization not detection.
  • More focus on using and understanding the inverter as a diagnostic tool and not merely a source of voltage stress.
  • More studies focused on applying transfer learning, federation learning and self-supervised learning to stator insulation condition monitoring.

Author Contributions

Conceptualization, E.A.; methodology, D.A.; software, D.A.; validation, D.A. and EA.; formal analysis, D.A.; investigation, D.A. resources, E.A.; data curation, D.A.; writing—original draft preparation, D.A.; writing—review and editing, D.A., E.A.; supervision, E.A.; project administration, E.A.; funding acquisition, E.A. All authors have read and agreed to the published version of the manuscript.

Funding

This research received no external funding.

Data Availability Statement

Data is contained within the article.

Conflicts of Interest

The authors declare no conflict of interest.

References

  1. Stone, G.; Boulter, E.A.; Culbert, I.; Dhirani, H. Electrical Insulation for Rotating Machines; IEEE PRESS Series on Power Engineering; John Wiley & Sons: Hoboken, NJ, USA, 2004. [Google Scholar]
  2. Hemmati, R.; Wu, F.; El-Refaie, A. Survey of Insulation Systems in Electrical Machines. In Proceedings of the 2019 IEEE International Electric Machines & Drives Conference (IEMDC); IEEE: New York, NY, USA, 2019; pp. 2069–2076. [Google Scholar]
  3. IEEE Motor Reliability Working Group. Report of Large Motor Reliability Survey of Industrial and Commercial Installations, Part I. IEEE Trans. Ind. Appl. 1985, IA-21, 853–864. [Google Scholar] [CrossRef]
  4. IEEE Motor Reliability Working Group. Report of Large Motor Reliability Survey of Industrial and Commercial Installations, Part II. IEEE Trans. Ind. Appl. 1985, IA-21, 865–872. [Google Scholar] [CrossRef]
  5. Pinto, C.; NStrickler, R.; Anand, V. A Case Study on Lifetime Assessment of Stator Windings in Large Machines That Can Be a Critical and Effective Tool in a Predictive Maintenance Plan. In Proceedings of the 2022 IEEE IAS Petroleum and Chemical Industry Technical Conference (PCIC); IEEE: New York, NY, USA, 2022; pp. 513–520. [Google Scholar]
  6. Bonnett, A.H.; Soukup, G.C. Cause and Analysis of Stator and Rotor Failures in Three-Phase Squirrel-Cage Induction Motors. IEEE Trans. Ind. Appl. 1992, 28, 921–937. [Google Scholar] [CrossRef]
  7. Nandi, S.; Toliyat, H.A.; Li, X. Condition Monitoring and Fault Diagnosis of Electrical Motors—A Review. IEEE Trans. Energy Convers. 2005, 20, 719–729. [Google Scholar] [CrossRef]
  8. Tallam, R.M.; Lee, S.B.; Stone, G.C.; Kliman, G.B.; Yoo, J.; Habetler, T.G.; Harley, R.G. A Survey of Methods for Detection of Stator-Related Faults in Induction Machines. IEEE Trans. Ind. Appl. 2007, 43, 920–933. [Google Scholar] [CrossRef]
  9. Siddique, A.; Yadava, G.S.; Singh, B. A Review of Stator Fault Monitoring Techniques of Induction Motors. IEEE Trans. Energy Convers. 2005, 20, 106–114. [Google Scholar] [CrossRef]
  10. Benbouzid, M.E.H. Bibliography on Induction Motors Faults Detection and Diagnosis. IEEE Trans. Energy Convers. 1999, 14, 1065–1074. [Google Scholar] [CrossRef]
  11. Zou, Z.; Liu, S.; Kang, J. Degradation Mechanism and Online Electrical Monitoring Techniques of Stator Winding Insulation in Inverter-Fed Machines: A Review. World Electr. Veh. J. 2024, 15, 444. [Google Scholar] [CrossRef]
  12. Grubic, S.; Aller, J.M.; Lu, B.; Habetler, T.G. A Survey on Testing and Monitoring Methods for Stator Insulation Systems of Low-Voltage Induction Machines Focusing on Turn Insulation Problems. IEEE Trans. Ind. Electron. 2008, 55, 4127–4136. [Google Scholar] [CrossRef]
  13. Tsyokhla, I.; Griffo, A.; Wang, J. Online Condition Monitoring for Diagnosis and Prognosis of Insulation Degradation of Inverter-Fed Machines. IEEE Trans. Ind. Electron. 2019, 66, 8126–8135. [Google Scholar] [CrossRef]
  14. Nussbaumer, P.; Vogelsberger, M.A.; Wolbank, T.M. Induction Machine Insulation Health State Monitoring Based on Online Switching Transient Exploitation. IEEE Trans. Ind. Electron. 2015, 62, 1835–1845. [Google Scholar] [CrossRef]
  15. Saeed, M.; Fernández, D.; Guerrero, J.M.; Díaz, I.; Briz, F. Insulation Condition Assessment in Inverter-Fed Motors Using the High-Frequency Common Mode Current: A Case Study. Energies 2024, 17, 470. [Google Scholar] [CrossRef]
  16. Nussbaumer, P.; Mitteregger, A.; Wolbank, T.M. Online Detection of Insulation Degradation in Inverter Fed Drive Systems Based on High Frequency Current Sampling. In Proceedings of the IECON 2011—37th Annual Conference of the IEEE Industrial Electronics Society; IEEE: New York, NY, USA, 2011; pp. 1954–1959. [Google Scholar]
  17. Pietrzak, P.; Wolkiewicz, M. Stator Winding Fault Detection of Permanent Magnet Synchronous Motors Based on the Short-Time Fourier Transform. Power Electron. Drives 2022, 7, 112–133. [Google Scholar] [CrossRef]
  18. Antonino-Daviu, J.A.; Martínez-Giménez, F.; Peris, A.; Ramezanzadeh, N.; Rodenas, F. Accurate Criteria for Broken Bar Detection in Induction Motors Based on the Wavelet (Packet) Transform. Mathematics 2024, 12, 1057. [Google Scholar] [CrossRef]
  19. Patel, A.; Lai, C.; Iyer, K.L.V. A Novel Approach towards Detection and Classification of Electric Machines’ Stator Winding Insulation Degradation Using Wavelet Decomposition. In Proceedings of the 2023 IEEE International Electric Machines & Drives Conference (IEMDC); IEEE: New York, NY, USA, 2023; pp. 1–6. [Google Scholar]
  20. Pietrzak, P.; Wolkiewicz, M. Condition Monitoring and Fault Diagnosis of Permanent Magnet Synchronous Motor Stator Winding Using the Continuous Wavelet Transform and Machine Learning. Power Electron. Drives 2024, 9, 106–121. [Google Scholar] [CrossRef]
  21. Fan, R.; Lei, X.; Jia, T.; Qin, M.; Li, H.; Xiang, D. High-Sensitive State Perception Method for Inverter-Fed Machine Turn Insulation Based on FrFT-Mel. Glob. Energy Interconnect. 2024, 7, 155–165. [Google Scholar] [CrossRef]
  22. Sardar, M.U.; Vaimann, T.; Kütt, L.; Asad, B.; Kallaste, A.; Raja, H.A. Wideband Frequency Diagnosis for High-Sensitivity Turn-Insulation Degradation Estimation in Inverter-Fed Machines. In Proceedings of the 2025 IEEE Symposium on Diagnostics for Electric Machines, Power Electronics and Drives (SDEMPED); IEEE: New York, NY, USA, 2025; pp. 1–7. [Google Scholar]
  23. Leuzzi, R.; Monopoli, V.G.; Rovere, L.; Cupertino, F.; Zanchetta, P. Analysis and Detection of Electrical Aging Effects on High-Speed Motor Insulation. IEEE Trans. Ind. Appl. 2019, 55, 6018–6025. [Google Scholar] [CrossRef]
  24. Creux, J.; Haje Obeid, N.; Boileau, T.; Meibody-Tabar, F. Online High Frequency Impedance Identification Method of Inverter-Fed Electrical Machines for Stator Health Monitoring. Appl. Sci. 2024, 14, 10911. [Google Scholar] [CrossRef]
  25. Saathoff, E.K.; Shaw, S.R.; Leeb, S.B. Line Impedance Estimation. IEEE Trans. Instrum. Meas. 2021, 70, 6501810. [Google Scholar] [CrossRef]
  26. Mota, D.D.S. Estimating the Frequency Response of an Excitation System and Synchronous Generator: Sinusoidal Disturbances Versus Empirical Transfer Function Estimate. IEEE Power Energy Technol. Syst. J. 2018, 5, 27–34. [Google Scholar] [CrossRef]
  27. Vala, S.S.; Mirza, A.B.; Emon, A.I.; Luo, F. A Review of Partial Discharge in Stator Winding of Rotating Machines Fed by Voltage Source PWM Motor Drives. IEEE Trans. Ind. Appl. 2024, 60, 3790–3807. [Google Scholar] [CrossRef]
  28. Cruz, J.D.S.; Fruett, F.; Lopes, R.D.R.; Takaki, F.L.; Tambascia, C.D.A.; Lima, E.R.D.; Giesbrecht, M. Partial Discharges Monitoring for Electric Machines Diagnosis: A Review. Energies 2022, 15, 7966. [Google Scholar] [CrossRef]
  29. Yu, J.; Li, H.; Cheng, R.; Liu, J.; Li, Y. Data-Driven Condition Monitoring of Stator Winding Terminal Insulation for Inverter-Fed Machine Using Enhanced Switching Oscillation Signals. IEICE Electron. Express 2022, 19, 20220435. [Google Scholar] [CrossRef]
  30. Szamel, L.; Oloo, J. Monitoring of Stator Winding Insulation Degradation through Estimation of Stator Winding Temperature and Leakage Current. Machines 2024, 12, 220. [Google Scholar] [CrossRef]
  31. Sirizzotti, B.; Addae, D.; Agamloh, E.; Von Jouanne, A.; Yokochi, A. A Review of Stator Insulation State-of-Health Monitoring Methods. Energies 2025, 18, 3758. [Google Scholar] [CrossRef]
  32. Bellini, A.; Filippetti, F.; Tassoni, C.; Capolino, G.-A. Advances in Diagnostic Techniques for Induction Machines. IEEE Trans. Ind. Electron. 2008, 55, 4109–4126. [Google Scholar] [CrossRef]
  33. Riera-Guasp, M.; Antonino-Daviu, J.A.; Capolino, G.-A. Advances in Electrical Machine, Power Electronic, and Drive Condition Monitoring and Fault Detection: State of the Art. IEEE Trans. Ind. Electron. 2015, 62, 1746–1759. [Google Scholar] [CrossRef]
  34. Ruiz-Sarrio, J.E.; Antonino-Daviu, J.A.; Navarro-Navarro, A.; Biot-Monterde, V. A Review of Broadband Frequency Techniques for Insulation Monitoring and Diagnosis in Rotating Electrical Machines. IEEE Trans. Ind. Appl. 2024, 60, 6092–6102. [Google Scholar] [CrossRef]
  35. Wen, H.; Abu Talip, M.S.; Othman, M.; Azam, S.M.K.; Mohamad, M.; Ibrahim, M.F.; Arof, H.; Ababneh, A. Advanced Signal Processing Methods for Partial Discharge Analysis: A Review. Sensors 2025, 25, 7318. [Google Scholar] [CrossRef] [PubMed]
  36. Stone, G. Condition Monitoring and Diagnostics of Motor and Stator Windings—A Review. IEEE Trans. Dielectr. Electr. Insul. 2013, 20, 2073–2080. [Google Scholar] [CrossRef]
  37. Stone, G.C.; Sedding, H.G.; Chan, C. Experience with Online Partial-Discharge Measurement in High-Voltage Inverter-Fed Motors. IEEE Trans. Ind. Appl. 2018, 54, 866–872. [Google Scholar] [CrossRef]
  38. Lee, S.B.; Yang, J.; Younsi, K.; Bharadwaj, R.M. An Online Groundwall and Phase-to-Phase Insulation Quality Assessment Technique for AC-Machine Stator Windings. IEEE Trans. Ind. Appl. 2006, 42, 946–957. [Google Scholar] [CrossRef]
  39. Tavner, P.; Li, R.; Penman, J.; Sedding, H. Condition Monitoring of Rotating Electrical Machines; Institution of Engineering and Technology: Edison, NJ, USA, 2008. [Google Scholar]
  40. Zanuso, G.; Peretti, L. Evaluation of High-Frequency Current Ringing Measurements for Insulation Health Monitoring in Electrical Machines. IEEE Trans. Energy Convers. 2022, 37, 2637–2644. [Google Scholar] [CrossRef]
  41. Zanuso, G.; Peretti, L. Accelerated Aging Procedure and Online Method for Stator Insulation Monitoring of Induction Motors. IEEE Trans. Energy Convers. 2023, 38, 685–692. [Google Scholar] [CrossRef]
  42. Huang, S.; Zhang, P.; Liu, L.; Niu, F.; Sun, Q.; Li, K.; Cao, Y.; Fang, Y. Diversified Assessment of Ground-Wall Insulation in Inverter-Fed Motors by Using Transient Characteristics of Leakage Current. IEEE Trans. Power Electron. 2024, 39, 13783–13794. [Google Scholar] [CrossRef]
  43. Niu, F.; Wang, Y.; Huang, S.; Wu, L.; Huang, X.; Fang, Y.; Yang, T. An Online Groundwall Insulation Monitoring Method Based on Transient Characteristics of Leakage Current for Inverter-Fed Motors. IEEE Trans. Power Electron. 2022, 37, 9745–9753. [Google Scholar] [CrossRef]
  44. Zoeller, C.; Vogelsberger, M.A.; Wolbank, T.M.; Ertl, H. Impact of SiC Semiconductors Switching Transition Speed on Insulation Health State Monitoring of Traction Machines. IET Power Electron. 2016, 9, 2769–2775. [Google Scholar] [CrossRef]
  45. Thomson, W.T.; Fenger, M. Current Signature Analysis to Detect Induction Motor Faults. IEEE Ind. Appl. Mag. 2001, 7, 26–34. [Google Scholar] [CrossRef]
  46. El Hachemi Benbouzid, M. A Review of Induction Motors Signature Analysis as a Medium for Faults Detection. IEEE Trans. Ind. Electron. 2000, 47, 984–993. [Google Scholar] [CrossRef]
  47. Lee, S.B.; Hyun, D.; Kang, T.; Yang, C.; Shin, S.; Kim, H.; Park, S.; Kong, T.-S.; Kim, H.-D. Identification of False Rotor Fault Indications Produced by Online MCSA for Medium-Voltage Induction Machines. IEEE Trans. Ind. Appl. 2016, 52, 729–739. [Google Scholar] [CrossRef]
  48. Ghanbari, T.; Mehraban, A. Stator Winding Fault Detection of Induction Motors Using Fast Fourier Transform on Rotor Slot Harmonics and Least Square Analysis of the Park’s Vectors. IET Electr. Power Appl. 2024, 18, 356–366. [Google Scholar] [CrossRef]
  49. Vogelsberger, M.A.; Zöller, C.; Nussbaumer, P.; Votzi, H.; Ertl, H.; Wolbank, T.M. Online Insulation Condition Monitoring of Ac Machines Using Ultra-Fast Inverter Switching Transition Based on New Semi-Conductor Materials. In Proceedings of the International Exhibition and Conference for Power Electronics, Intelligent Motion, Renewable Energy and Energy Management, Nuremberg, Germany, 20–22 May 2014. [Google Scholar]
  50. Leuzzi, R.; Monopoli, V.G.; Rovere, L.; Cupertino, F.; Zanchetta, P. Effects of Electrical Ageing on Winding Insulation in High-Speed Motors: Analysis and Modelling. In Proceedings of the 2018 IEEE Energy Conversion Congress and Exposition (ECCE); IEEE: New York, NY, USA, 2018; pp. 6886–6892. [Google Scholar]
  51. Sardar, M.U.; Vaimann, T.; Kütt, L.; Asad, B.; Kallaste, A. Switching Oscillation-Based Fractional-Domain High-Sensitive Diagnosis of Machine Turn Insulation Degradation. Eng. Sci. Technol. Int. J. 2025, 72, 102224. [Google Scholar] [CrossRef]
  52. Sardar, M.U.; Vaimann, T.; Kütt, L.; Asad, B.; Kallaste, A.; Land, R. Wideband Frequency Response Analysis for Sensitive Condition Estimation of Machine’s Turn Insulation Degradation Faults. In Proceedings of the 2025 IEEE Workshop on Electrical Machines Design, Control and Diagnosis (WEMDCD); IEEE: New York, NY, USA, 2025; pp. 1–6. [Google Scholar]
  53. Sirizzotti, B.; Agamloh, E.; Von Jouanne, A.; Yokochi, A. Modeling and Experimental Analysis of SiC-Driven Form Wound Coil Insulation with Defects. In Proceedings of the 2024 IEEE Energy Conversion Congress and Exposition (ECCE); IEEE: New York, NY, USA, 2024; pp. 5316–5323. [Google Scholar]
  54. Houili, M.; Sahraoui, M.; Cardoso, A.J.M.; Alloui, A. Zero-Sequence Voltage Outperforms MCSA-STFT for a Robust Inter-Turn Short-Circuit Fault Diagnosis in Three-Phase Induction Motors: A Comparative Study. Machines 2025, 13, 501. [Google Scholar] [CrossRef]
  55. Borisagar, K.R.; Thanki, R.M.; Sedani, B.S. Fourier Transform, Short-Time Fourier Transform, and Wavelet Transform. In Speech Enhancement Techniques for Digital Hearing Aids; Springer International Publishing: Cham, Switzerland, 2019; pp. 63–74. [Google Scholar]
  56. Burriel-Valencia, J.; Puche-Panadero, R.; Martinez-Roman, J.; Sapena-Bano, A.; Pineda-Sanchez, M. Fault Diagnosis of Induction Machines in a Transient Regime Using Current Sensors with an Optimized Slepian Window. Sensors 2018, 18, 146. [Google Scholar] [CrossRef] [PubMed]
  57. Bultheel, A.; Martínez Sulbaran, H.E. Computation of the Fractional Fourier Transform. Appl. Comput. Harmon. Anal. 2004, 16, 182–202. [Google Scholar] [CrossRef]
  58. Pineda-Sanchez, M.; Riera-Guasp, M.; Antonino-Daviu, J.A.; Roger-Folch, J.; Perez-Cruz, J.; Puche-Panadero, R. Diagnosis of Induction Motor Faults in the Fractional Fourier Domain. IEEE Trans. Instrum. Meas. 2010, 59, 2065–2075. [Google Scholar] [CrossRef]
  59. Patel, A.; Lai, C.; Iyer, K.L.V. Wavelet Packet Decomposition Based Detection and Classification of Stator Winding Insulation Degradation for Electric Machines. IEEE Trans. Ind. Appl. 2025, 61, 3037–3050. [Google Scholar] [CrossRef]
  60. Georgaki, N.S.; Tzanetos, A.; Karampotsis, E.; Dounias, G. Wavelet Entropy Methods to Enhance Machine Learning Models in Fault Diagnosis of Motor Bearing. In Proceedings of the 13th Hellenic Conference on Artificial Intelligence; ACM: New York, NY, USA, 2024; pp. 1–5. [Google Scholar]
  61. Gangsar, P.; Tiwari, R. Multifault Diagnosis of Induction Motor at Intermediate Operating Conditions Using Wavelet Packet Transform and Support Vector Machine. J. Dyn. Syst. Meas. Control 2018, 140, 081014. [Google Scholar] [CrossRef]
  62. Kulkarni, P.G.; Sahasrabudhe, A.D. Investigations on Mother Wavelet Selection for Health Assessment of Lathe Bearings. Int. J. Adv. Manuf. Technol. 2017, 90, 3317–3331. [Google Scholar] [CrossRef]
  63. Guo, T.; Zhang, T.; Lim, E.; Lopez-Benitez, M.; Ma, F.; Yu, L. A Review of Wavelet Analysis and Its Applications: Challenges and Opportunities. IEEE Access 2022, 10, 58869–58903. [Google Scholar] [CrossRef]
  64. Pothisarn, C.; Klomjit, J.; Ngaopitakkul, A.; Jettanasen, C.; Asfani, D.A.; Negara, I.M.Y. Comparison of Various Mother Wavelets for Fault Classification in Electrical Systems. Appl. Sci. 2020, 10, 1203. [Google Scholar] [CrossRef]
  65. Bafroui, H.H.; Ohadi, A. Application of Wavelet Energy and Shannon Entropy for Feature Extraction in Gearbox Fault Detection under Varying Speed Conditions. Neurocomputing 2014, 133, 437–445. [Google Scholar] [CrossRef]
  66. Wang, P.; Li, P.; Akram, S.; Meng, P.; Zhu, G.; Montanari, G.C. Considering the Parameters of Pulse Width Modulation Voltage to Improve the Signal-to-Noise Ratio of Partial Discharge Tests for Inverter-Fed Motors. IEEE Trans. Ind. Electron. 2022, 69, 4545–4554. [Google Scholar] [CrossRef]
  67. Yan, Y.; Trinchero, R.; Stievano, I.S.; Li, H.; Xie, Y.-Z. An Automatic Tool for Partial Discharge De-Noising via Short-Time Fourier Transform and Matrix Factorization. IEEE Trans. Instrum. Meas. 2022, 71, 3528512. [Google Scholar] [CrossRef]
  68. Li, Y.; Li, Z. Application of a Novel Wavelet Shrinkage Scheme to Partial Discharge Signal Denoising of Large Generators. Appl. Sci. 2020, 10, 2162. [Google Scholar] [CrossRef]
  69. Lengsfeld, S.; Rehwald, F.; Ast, H.; Schroder, O. Classification of Partial Discharge Patterns in Rotating Electrical Machines Using Machine Learning. In Proceedings of the 2022 International Conference on Electrical Machines (ICEM); IEEE: New York, NY, USA, 2022; pp. 1576–1581. [Google Scholar]
  70. Priananda, C.W.; Illias, H.A.B.; Hechifa, A.; Raymond, W.J.K.; Negara, I.M.Y. Machine Learning-Based Phase Resolved Partial Discharge Pattern Classification Using HOG and PCA. In Proceedings of the 2024 IEEE 22nd Student Conference on Research and Development (SCOReD); IEEE: New York, NY, USA, 2024; pp. 7–12. [Google Scholar]
  71. Patel, A.; Lai, C.; Iyer, K.L.V. A Machine Learning Based Approach for Detection and Quantification of Insulation Degradations in Machines’ Stator Winding. In Proceedings of the 2023 IEEE International Conference on Power Electronics, Smart Grid, and Renewable Energy (PESGRE); IEEE: New York, NY, USA, 2023; pp. 1–6. [Google Scholar]
  72. Devi, N.R.; Sarma, D.V.S.S.S.; Rao, P.V.R. Diagnosis and Classification of Stator Winding Insulation Faults on a Three-Phase Induction Motor Using Wavelet and MNN. IEEE Trans. Dielectr. Electr. Insul. 2016, 23, 2543–2555. [Google Scholar] [CrossRef]
  73. Guedes, A.S.; Silva, S.M. Insulation Protection and Online Stress Agent Identification for Electric Machines Using Artificial Intelligence. IET Electr. Power Appl. 2019, 13, 559–570. [Google Scholar] [CrossRef]
  74. Kumar, H.; Shafiq, M.; Hussain, G.A.; Kauhaniemi, K. Comparison of Machine Learning Algorithms for Classification of Partial Discharge Signals in Medium Voltage Components. In Proceedings of the 2021 IEEE PES Innovative Smart Grid Technologies Europe (ISGT Europe); IEEE: New York, NY, USA, 2021; pp. 1–6. [Google Scholar]
  75. Hussain, M. Stator Winding Fault Detection and Classification in Three-Phase Induction Motor. Intell. Autom. Soft Comput. 2021, 29, 869–883. [Google Scholar] [CrossRef]
  76. Pietrzak, P.; Wolkiewicz, M.; Orlowska-Kowalska, T. PMSM Stator Winding Fault Detection and Classification Based on Bispectrum Analysis and Convolutional Neural Network. IEEE Trans. Ind. Electron. 2023, 70, 5192–5202. [Google Scholar] [CrossRef]
  77. Jensen, W.R.; Strangas, E.G.; Foster, S.N. Online Estimation of Remaining Useful Life of Stator Insulation. In Proceedings of the 2017 IEEE 11th International Symposium on Diagnostics for Electrical Machines, Power Electronics and Drives (SDEMPED); IEEE: New York, NY, USA, 2017; pp. 635–641. [Google Scholar]
  78. Jensen, W.R.; Strangas, E.G.; Foster, S.N. A More Robust Stator Insulation Failure Prognosis for Inverter-Driven Machines. In Proceedings of the 2019 IEEE International Electric Machines & Drives Conference (IEMDC); IEEE: New York, NY, USA, 2019; pp. 203–209. [Google Scholar]
  79. Jensen, W.R.; Strangas, E.G.; Foster, S.N. A Method for Online Stator Insulation Prognosis for Inverter-Driven Machines. IEEE Trans. Ind. Appl. 2018, 54, 5897–5906. [Google Scholar] [CrossRef]
  80. Babel, A.S.; Strangas, E.G. Condition-Based Monitoring and Prognostic Health Management of Electric Machine Stator Winding Insulation. In Proceedings of the 2014 International Conference on Electrical Machines (ICEM); IEEE: New York, NY, USA, 2014; pp. 1855–1861. [Google Scholar]
  81. Pacha, F.Z.H.; Herizi, A.; Fezai, N.; Amor, A.B. FFT Tool for Stator Winding Fault Detection: Application to a Permanent Magnet Synchronous Motor. In Proceedings of the 2023 IEEE International Conference on Advanced Systems and Emergent Technologies (IC_ASET); IEEE: New York, NY, USA, 2023; pp. 1–6. [Google Scholar]
Figure 1. Stator winding insulation aging process adapted from [11].
Machines 14 00751 g001
Figure 2. Stator slot showing insulation, adapted from [36].
Machines 14 00751 g002
Figure 3. Simplified three-phase winding circuit showing parasitic insulation elements.
Machines 14 00751 g003
Figure 4. (a) Equivalent circuit; (b) phasor diagram of groundwall insulation.
Machines 14 00751 g004
Figure 5. Signal Acquisition Overview for Stator Insulation Condition Monitoring.
Machines 14 00751 g005
Figure 6. Categorization of the reviewed references by methodology.
Machines 14 00751 g006
Figure 7. Classification of Signal Processing Techniques.
Machines 14 00751 g007
Figure 8. Experimental leakage current transient showing amplitude A, oscillation period T c , and settling time T s .
Machines 14 00751 g008
Figure 9. Conceptual redraw of healthy and degraded insulation spectra with the corresponding square deviation for ISI illustration, adapted from [49].
Machines 14 00751 g009
Figure 10. Generalized norm-based deviation framework.
Machines 14 00751 g010
Figure 11. Three-phase star-connected impedance connection measurement circuits for (a) CM, (b) DM, (c) phase-to-phase, and (d) phase-to-neutral.
Machines 14 00751 g011
Figure 12. (a) Magnitude and phase impedance response of voltage and (b) current [24].
Machines 14 00751 g012
Figure 13. Flowchart of impedance characterization method adapted from [24].
Machines 14 00751 g013
Figure 14. Slepian window vs. Gaussian window STFT comparison [56].
Machines 14 00751 g014
Figure 15. Different FrFT orders with time and frequency domains.
Machines 14 00751 g015
Figure 16. CWT scalograms of (a,b) undamaged stator winding; (c,d) damaged stator windings from [20].
Machines 14 00751 g016
Figure 17. Representative wavelet functions for selected mother wavelet families.
Machines 14 00751 g017
Figure 18. WPD general algorithm steps.
Machines 14 00751 g018
Figure 19. WPD with a decomposition level of 10.
Machines 14 00751 g019
Figure 20. Partial discharge pulse current waveform captured using measurement system taken from [35].
Machines 14 00751 g020
Figure 21. Generalized framework of data-driven and hybrid approaches for stator insulation condition monitoring.
Machines 14 00751 g021
Table 1. Diagnostic Signals and Common Measuring Methods.
Diagnostic Signal Typical Features ExtractedCommon Measuring Methods
Leakage CurrentRMS and peak leakage current, transient leakage response, current ringingCurrent transformer (CT), Hall sensors, high-bandwidth current probes, Shunt + isolated amplifier
Stator
Current
RMS current, harmonic sidebands, negative sequence current, current ringingHall effect sensor, current transformer, high-bandwidth current probes
ImpedanceInsulation resistance, capacitance, impedance magnitude and phase angle, dissipation factor (DF), frequency responseImpedance analyzer, LCR meter, FRA setup, ETFE
Voltagedv/dt, peak voltage, rise time, transient decay, overshoot ringing frequencyHigh-voltage differential probe, scope probe,
Partial
Discharge
PD magnitude, repetition rate, phase-resolved PD pattern, pulse count, PD Inception Voltage (PDIV)Capacitive coupler, UHF antenna/sensor, HFCT clamp, Rogowski coils
VibrationRMS vibration, spectral peaks, sidebands, kurtosis, time–frequency features, envelope spectrumVelocity sensor, displacement probes, accelerometer
Stray FluxFlux harmonics, sidebands, axial/radial flux variation, frequency domain fault componentsSearch coil, flux coil, Hall flux sensor, magnetometer, flux sensor
Table 2. Main parameters for STFT [17].
Name of the ParameterSymbol Description
Sampling Frequency f P Sampling frequency affects the time and frequency resolution of the STFT output. Higher f P results in better time and frequency resolution and vice versa.
Number of Input Samples N S Total number of samples of the input stator phase current signal on which the windowing function is applied
Type of Window Functionw(n)Hanning, Hamming, Bartlett, Gaussian, and Slepian.
Window Size HResponsible for STFT output resolution in time domain.
Table 3. Sensitivity comparison of different methods to the change in turn insulation state [21].
C f , pFFFTFrFTLowpass FilterFrFT-Mel
2200.41%0.71%1.31%3.16%
3300.74%1.12%3.38%3.59%
6802.55%4.09%5.76%11.73%
10007.98%9.05%8.64%24.31%
Table 4. Comparison of wavelet families for stator insulation condition monitoring.
Wavelet FamilyStrengthsDrawbacksReferences
Haar Simplest and lowest in computational cost.Poor frequency localization.
Produces blocky approximations.
Insufficient for resolving closely spaced resonances.
[18,61,63]
DaubechiesGood balance between time and frequency localization.Can introduce phase distortion; higher orders increase computational cost and filter length.[18,59,61,63]
Discrete MeyerSuperior frequency localization; symmetric. No phase distortion.Longer filter length than Daubechies.
Higher computational cost than Haar and Daubechies.
[18,61]
Symlets More symmetric than Daubechies while retaining similar properties; good frequency localization; effective for fault classification in power systems.Performance very similar to Daubechies; marginal improvement in symmetry may not justify switching.[59,63,64]
Coiflets Most vanishing moments per filter length. Excellent for capturing polynomial trends.Longest filter length for given number of vanishing moments; highest computational overhead among orthogonal families.[61,62]
Biorthogonal Perfect symmetry. Good in signal reconstruction.Not orthogonal. Energy not perfectly preserved during decomposition.
Two separate filter pairs add complexity.
[62,63,64]
MorseBest time–frequency localization among CWT wavelets for motor current analysis.Continuous only. Not suitable for DWT/WPD.
Requires careful parameter tuning.
[20]
Table 5. Comparison of signal processing techniques.
TechniqueMain FindingLimitationPractical Consideration
Time-
Domain
Computationally simple.
Extracts peak value, damping and RMS directly from the waveform without any spectral transform.
Limited sensitivity. Lowest computational cost.
Requires a high sampling rate.
Suitable for embedded implementation.
FFTProvides spectral changes in signals.No time localization.Very low computational cost.
Needs adequate bandwidth.
STFTAdds time localization to FFT.Fixed time–frequency resolution.Low computational cost.
Implementable for real-time monitoring.
CWTCaptures transient event with multi-resolution analysis.High computational costMedium-high computational cost
Best suited for offline analysis
DWTExtracts transient events with lower computation than CWT.Depends on wavelet and decomposition level.Low computational cost.
Suitable for embedded monitoring.
WPDIsolates fault-sensitive frequency bands.Requires prior knowledge of target frequencies.Medium computational cost.
Useful for TT and GW monitoring.
FrFT Higher sensitivity compared to FFT.Requires optimization of fractional orderMedium computational cost
Needs further practical validation
Norm-Based
Deviation
Simple scalar health indicator.
Requires no additional hardware beyond existing drive sensors.
Requires a healthy baseline.Very low computational cost.
Useful for trend monitoring.
ETFEDecoupled from the excitation waveform.
Can separate TT and GW.
Requires wideband voltage and current probes.Higher computation but physically informative.
Partial Discharge Provides direct evidence of active insulation breakdown.
Only method that confirms discharges are occurring.
Very low SNR under PWM switching noise.High hardware cost and complexity.
PD denoising essential.
Best balance for online monitoring.
Data-Driven/HybridImproves classification and pattern recognition.Requires reliable training data.High training cost.
Transferability is a challenge.
Prognostic IndicatorsTracks long-term degradation trends.Requires long-term aging data.Useful for maintenance planning.
Table 6. Signal Processing Technique Applicability by Insulation Fault Type.
TechniqueTurn-to-Turn (TT)Groundwall (GW)Phase-to-Phase (PP)
Time-Domain (Peak, RMS, Statistics)Not validated.Validated. Transient leakage characteristics tied to GW insulation [42,43].Validated [38].
FFT/MCSAWidely validated for TT fault detection [7,45,81].Indirect. Provides spectral computation for norm base indicators but no GW specific harmonics identified.Not validated.
Norm-Based ISI (RMSE)Validated.
Demonstrated at MW scale [14,44,49].
Validated. Tracks broadband spectral deviation from GW capacitance increase [15,49].Not validated.
Norm-Based SEF (MAE)Validated. SEF applied to switching oscillation current for TT degradation estimation FrFT [51].Applicable in principle but no GW-specific validation reported.Not validated
ETFEValidated [24,53].Validated. GW degradation shifts the first CM impedance resonance frequency [24].Theoretically capable. Via phase-to-phase configuration but no experimental validation [24]
STFTValidated [17,54].Not validated. Applied to ITSC harmonic tracking.Not validated
CWTValidated [20].Not validated [20].Not validated.
DWTNot validated.Not validated. Studies focused on rotor faults and startup transients.Not validated
WPDValidated. SOH indicators tracks frequency sensitive to TT degradation [19,59].Validated.
Only method with simultaneous TT/GW classification [19,59].
Not validated.
FrFT Validated [21,22].Not validated. Not validated.
Partial Discharge AnalysisIndirect. PD activity in TT insulation voids indicates degradation, but classifies defect type not insulation layer [27,37].Validated.
PRPD patterns classify GW defects [1,27,37].
Indirect. PD can occur in PP insulation regions, but no PP specific classification shown
Data-Driven/MLValidated [29,75,76].Limited. ML classifiers have trained primarily on ITSC datasets, no dedicated GW study shown.Not validated.
Prognostics Not validated.Validated. GW capacitance and dissipation factor tracked through aging failure. Leakage current also used for RUL [13,79].Not validated.
Disclaimer/Publisher’s Note: The statements, opinions and data contained in all publications are solely those of the individual author(s) and contributor(s) and not of MDPI and/or the editor(s). MDPI and/or the editor(s) disclaim responsibility for any injury to people or property resulting from any ideas, methods, instructions or products referred to in the content.