Article

Hydrogen Injection Pressure as a Control Parameter for Combustion, Efficiency, and Emissions in a Spark-Ignition Engine


by
Saugirdas Pukalskas
1,*,
Alfredas Rimkus
1,
Gabrielius Mejeras
1,
Donatas Kriaučiūnas
2,
Saulius Stravinskas
1,2,
Tadas Vipartas
2 and
Andrius Ušinskas
1
1
Department of Automobile Engineering, Faculty of Transport Engineering, Vilnius Gediminas Technical University, Plytinės Str. 25, 10105 Vilnius, Lithuania
2
Department of Transport Engineering, Faculty of Technics, Vilniaus Kolegija/Higher Education Institution, Olandų Str. 16, 01100 Vilnius, Lithuania
*
Author to whom correspondence should be addressed.
Machines 2026, 14(6), 661; https://doi.org/10.3390/machines14060661
Submission received: 8 May 2026 / Revised: 30 May 2026 / Accepted: 4 June 2026 / Published: 7 June 2026
(This article belongs to the Special Issue Advances in Combustion Science for Future IC Engines, 2nd Edition)

Abstract

This study investigates the effect of hydrogen injection pressure on combustion, energy, and emission characteristics of a spark-ignition engine under stoichiometric operating conditions. Experiments were performed on a four-cylinder Nissan HR16DE engine at 2500 rpm and 0.48 MPa brake mean effective pressure using gasoline and hydrogen-enriched blends containing 10%, 20%, and 30% hydrogen by mass. Hydrogen was injected into the intake manifold at pressures of 1.2, 1.4, 1.6, and 1.9 bar, while spark timing was adjusted to maintain peak in-cylinder pressure at 14–15 CAD after top dead center. Results showed that hydrogen mass fraction had a much stronger influence on engine performance than injection pressure. Increasing hydrogen content intensified combustion, shortened ignition delay, increased heat release rate and in-cylinder temperature, and reduced brake-specific fuel consumption by up to 36% compared with pure gasoline. Hydrogen enrichment also reduced HC and CO2 emissions, but increased NOx emissions. Effect of injection pressure was secondary and depended on hydrogen concentration. Under the investigated conditions, the lowest tested pressure, 1.2 bar, was generally the most favorable, especially at lower hydrogen fractions. Overall, hydrogen injection pressure acted mainly as a mixture formation control parameter, while hydrogen mass fraction remained the dominant factor determining engine behavior.

1. Introduction

Conventional spark-ignition (SI) engines fueled by fossil fuels face challenges due to increasingly stringent international emission standards and the global goal of reducing greenhouse gas (GHG) emissions in the transportation sector [1]. Although gasoline engines are characterized by high reliability and highly developed manufacturing technologies, they remain significant contributors to urban air pollution due to exhaust emissions of incomplete combustion products like carbon monoxide (CO) and hydrocarbons (HC), along with nitrogen oxides (NOx) and a direct driver of climate change, carbon dioxide (CO2) [2].
In order to ensure a smooth transition to more sustainable transport, integration of alternative fuels into existing internal combustion engine (ICE) systems is becoming a subject of scientific research [3,4]. Hydrogen is considered a promising alternative due to its exceptional physical and chemical properties, characterized by a high flame propagation speed and wide flammability limits [5]. The use of the hydrogen additive together with traditional fuels improves the engine’s brake thermal efficiency (BTE), which can increase to ~48% with a lean mixture (λ ≈ 1.4–2.2) and also reduces CO, CO2 and HC emissions [6,7,8,9].
Use of gasoline and hydrogen mixtures in SI engines changes the combustion kinetics of the mixture and the dynamics of the engine operating cycle. The increased overall hydrogen to carbon (H/C) ratio in the fuel leads to faster flame propagation speed and a shorter ignition delay period. Due to these properties, the total combustion duration is reduced, a larger part of the heat is released closer to the top dead center (TDC) and therefore the BTE of the engine increases [10,11].
Based on the results of previous studies, the recommended proportion of hydrogen in the mixture is 20–40% by mass, as this range allows for an optimal balance between engine power, efficiency and emissions [12]. The participation of hydrogen molecules in combustion reactions changes the dynamics of free radicals (especially OH) and leads to a more stable combustion process [13]. Therefore, the coefficient of variation in the indicated mean effective pressure (COVIMEP) decreases, which indicates an increase in combustion stability. It has been found that hydrogen addition significantly expands the limits of lean combustion: according to some studies, at a hydrogen mass fraction of 36%, the lean limit is expanded from ~1.6 to ~2.2, while in other systems, after reaching a threshold of ~14% hydrogen mass fraction, stable combustion is maintained even up to λ = 2.6 [14,15,16].
Use of the hydrogen additive has a dual effect on the engine’s environmental performance. As the hydrogen concentration in the fuel mixture increases, the carbon content decreases proportionally, resulting in lower CO and CO2 emissions [17,18]. The amount of unburned HC is also significantly reduced due to a faster and more complete combustion process in the cylinder, but leads to a more intense formation of nitrogen oxide emissions due to higher pressure and maximum combustion temperature in the cylinder [19,20]. Such conditions are favorable for the formation of thermal NOx, which is sensitive to high temperature peaks and oxygen concentration, especially when the engine is operating at stoichiometric point (λ = 1) [21,22]. NOx emissions increase significantly as the highest combustion temperatures are reached unless additional strategies for fuel composition, injection and ignition control are applied. For example, using water injection, NOx can be reduced by up to 97% [23,24,25,26].
In order to reduce NOx growth and optimize engine operation with hydrogen-gasoline mixtures in stoichiometric point, the combustible mixture preparation process is important [27,28]. Although high-pressure (5–6 MPa) direct hydrogen injection, which allows for precise dosing of fuel into the combustion chamber [29], is widely studied in modern scientific literature, its supply to the intake manifold remains relevant due to the relatively simple adaptation of the gas system to commercial engines. The operating pressure and injection duration of hydrogen injectors have a direct impact on the homogeneity of the mixture and the volumetric efficiency. It has been found that early injection (105–130 °CAD before TDC) increases power, but elevates NOx formation, therefore optimal selection of injection parameters is necessary to avoid hydrogen accumulation in the intake manifold and the air displacement effect, which leads to reduced volumetric efficiency [30,31].
Scientific research emphasizes that hydrogen injection pressure is an important parameter that determines the balance between engine efficiency and environmental performance. Increasing the injection pressure improves mixture formation and engine power output, but excessively high pressure can disrupt flow aerodynamics, increase the risk of engine knock and form localized hot spots, leading to higher NOx emissions [32]. On the other hand, lower injection pressure or improper injection timing leads to greater mixture stratification, which accelerates NOx formation due to the extremely rapid combustion of hydrogen [33,34,35].
In the scientific literature, there is a greater focus on direct injection systems and specific lean combustion (λ > 1) regimes aimed at minimizing NOx formation [36,37], but there is still a lack of more detailed studies analyzing the supply of hydrogen to the intake manifold when the engine is operating at stoichiometric point (λ = 1), the control of which requires specific optimization strategies. During initial tests with hydrogen injection into the manifold, an unexpected phenomenon was observed: even minor variations in injection pressure altered the engine’s operating parameters, particularly its emission characteristics. Therefore, the aim of the present study was to evaluate whether low-pressure hydrogen supply into the intake manifold could be used as an additional calibration parameter influencing injection duration, combustible mixture formation, and the available mixing time before intake valve closing. It was expected that higher H2 injection pressure (pH2) could improve jet penetration and air–hydrogen mixture homogeneity when larger amounts of H2 are supplied, whereas lower pH2 could extend the injection duration and mixing time at lower H2 fractions. Consequently, a more comprehensive analysis was performed to deeply evaluate the effects of relatively low hydrogen injection pressures (ranging from 1.2 to 1.9 bar) at different hydrogen mass fractions (up to 30%). In this context, bench tests conducted on the HR16DE SI engine provide new scientific insights in this area, identifying the impact of variable low-pressure injection on energy and environmental performance.

2. Materials and Methods

The experimental tests were performed on a NISSAN HR16DE (Nissan Motor Co., Ltd., Yokohama, Japan), an in-line four-cylinder spark-ignition engine, the primary specifications of which are detailed in Table 1. Hydrogen (H2) was injected into the system via an additional injector mounted in the engine’s intake manifold. The H2 supply was sourced from high-pressure cylinders (200 bar), with the pressure initially reduced to 5 bar using a high-pressure regulator. Further precise control of the hydrogen pressure before the injector was achieved through a low-pressure regulator, and four pressures were selected: 1.2 bar, 1.4 bar, 1.6 bar, and 1.9 bar. The engine was controlled by a programmable MoTeC M800 ECU (MoTeC, Melbourne, VIC, Australia), which replaced the factory unit. This modification allowed for discrete adjustments of the spark timing (ST) and independent calibration of the injection trim for both petrol and hydrogen injectors.
To ensure synchronized dual-fuel delivery, the injection timing for both petrol and hydrogen was fully sequential and fixed at a constant 320 crank angle degrees (CAD) before top dead center (BTDC) across all operating conditions. For the hydrogen line, a dedicated Hana Engineering injector (homologation E4 67R-010213 and E11 110R-004686) (HANA EMS Co., Ltd., Hwaseong-si, Republic of Korea) was installed. The injector pulse widths were adjusted via the ECU master scaling (IJPU) set to 24 ms, and the resulting commanded base map control parameters are summarized in Table 2.
For the baseline stoichiometric operation on petrol (E10H0), the ECU maintained a constant primary injection control parameter of 9.2 ms to satisfy the targeted medium engine load. Upon the introduction of the dual-fuel supply, the control matrix dynamically adjusted the pulse width scaling factors for both the primary petrol and secondary hydrogen injectors to preserve strict stoichiometric conditions and a constant energy output.
A Bosch LSU 4.9 wideband oxygen sensor (BOSCH, Stuttgart, Germany) was integrated into the exhaust system to ensure continuous monitoring of the air-fuel ratio. Furthermore, to guarantee consistent engine thermal conditions throughout the experimental duration, a plate heat exchanger was incorporated into the cooling circuit, maintaining a stable operating temperature across all tests.
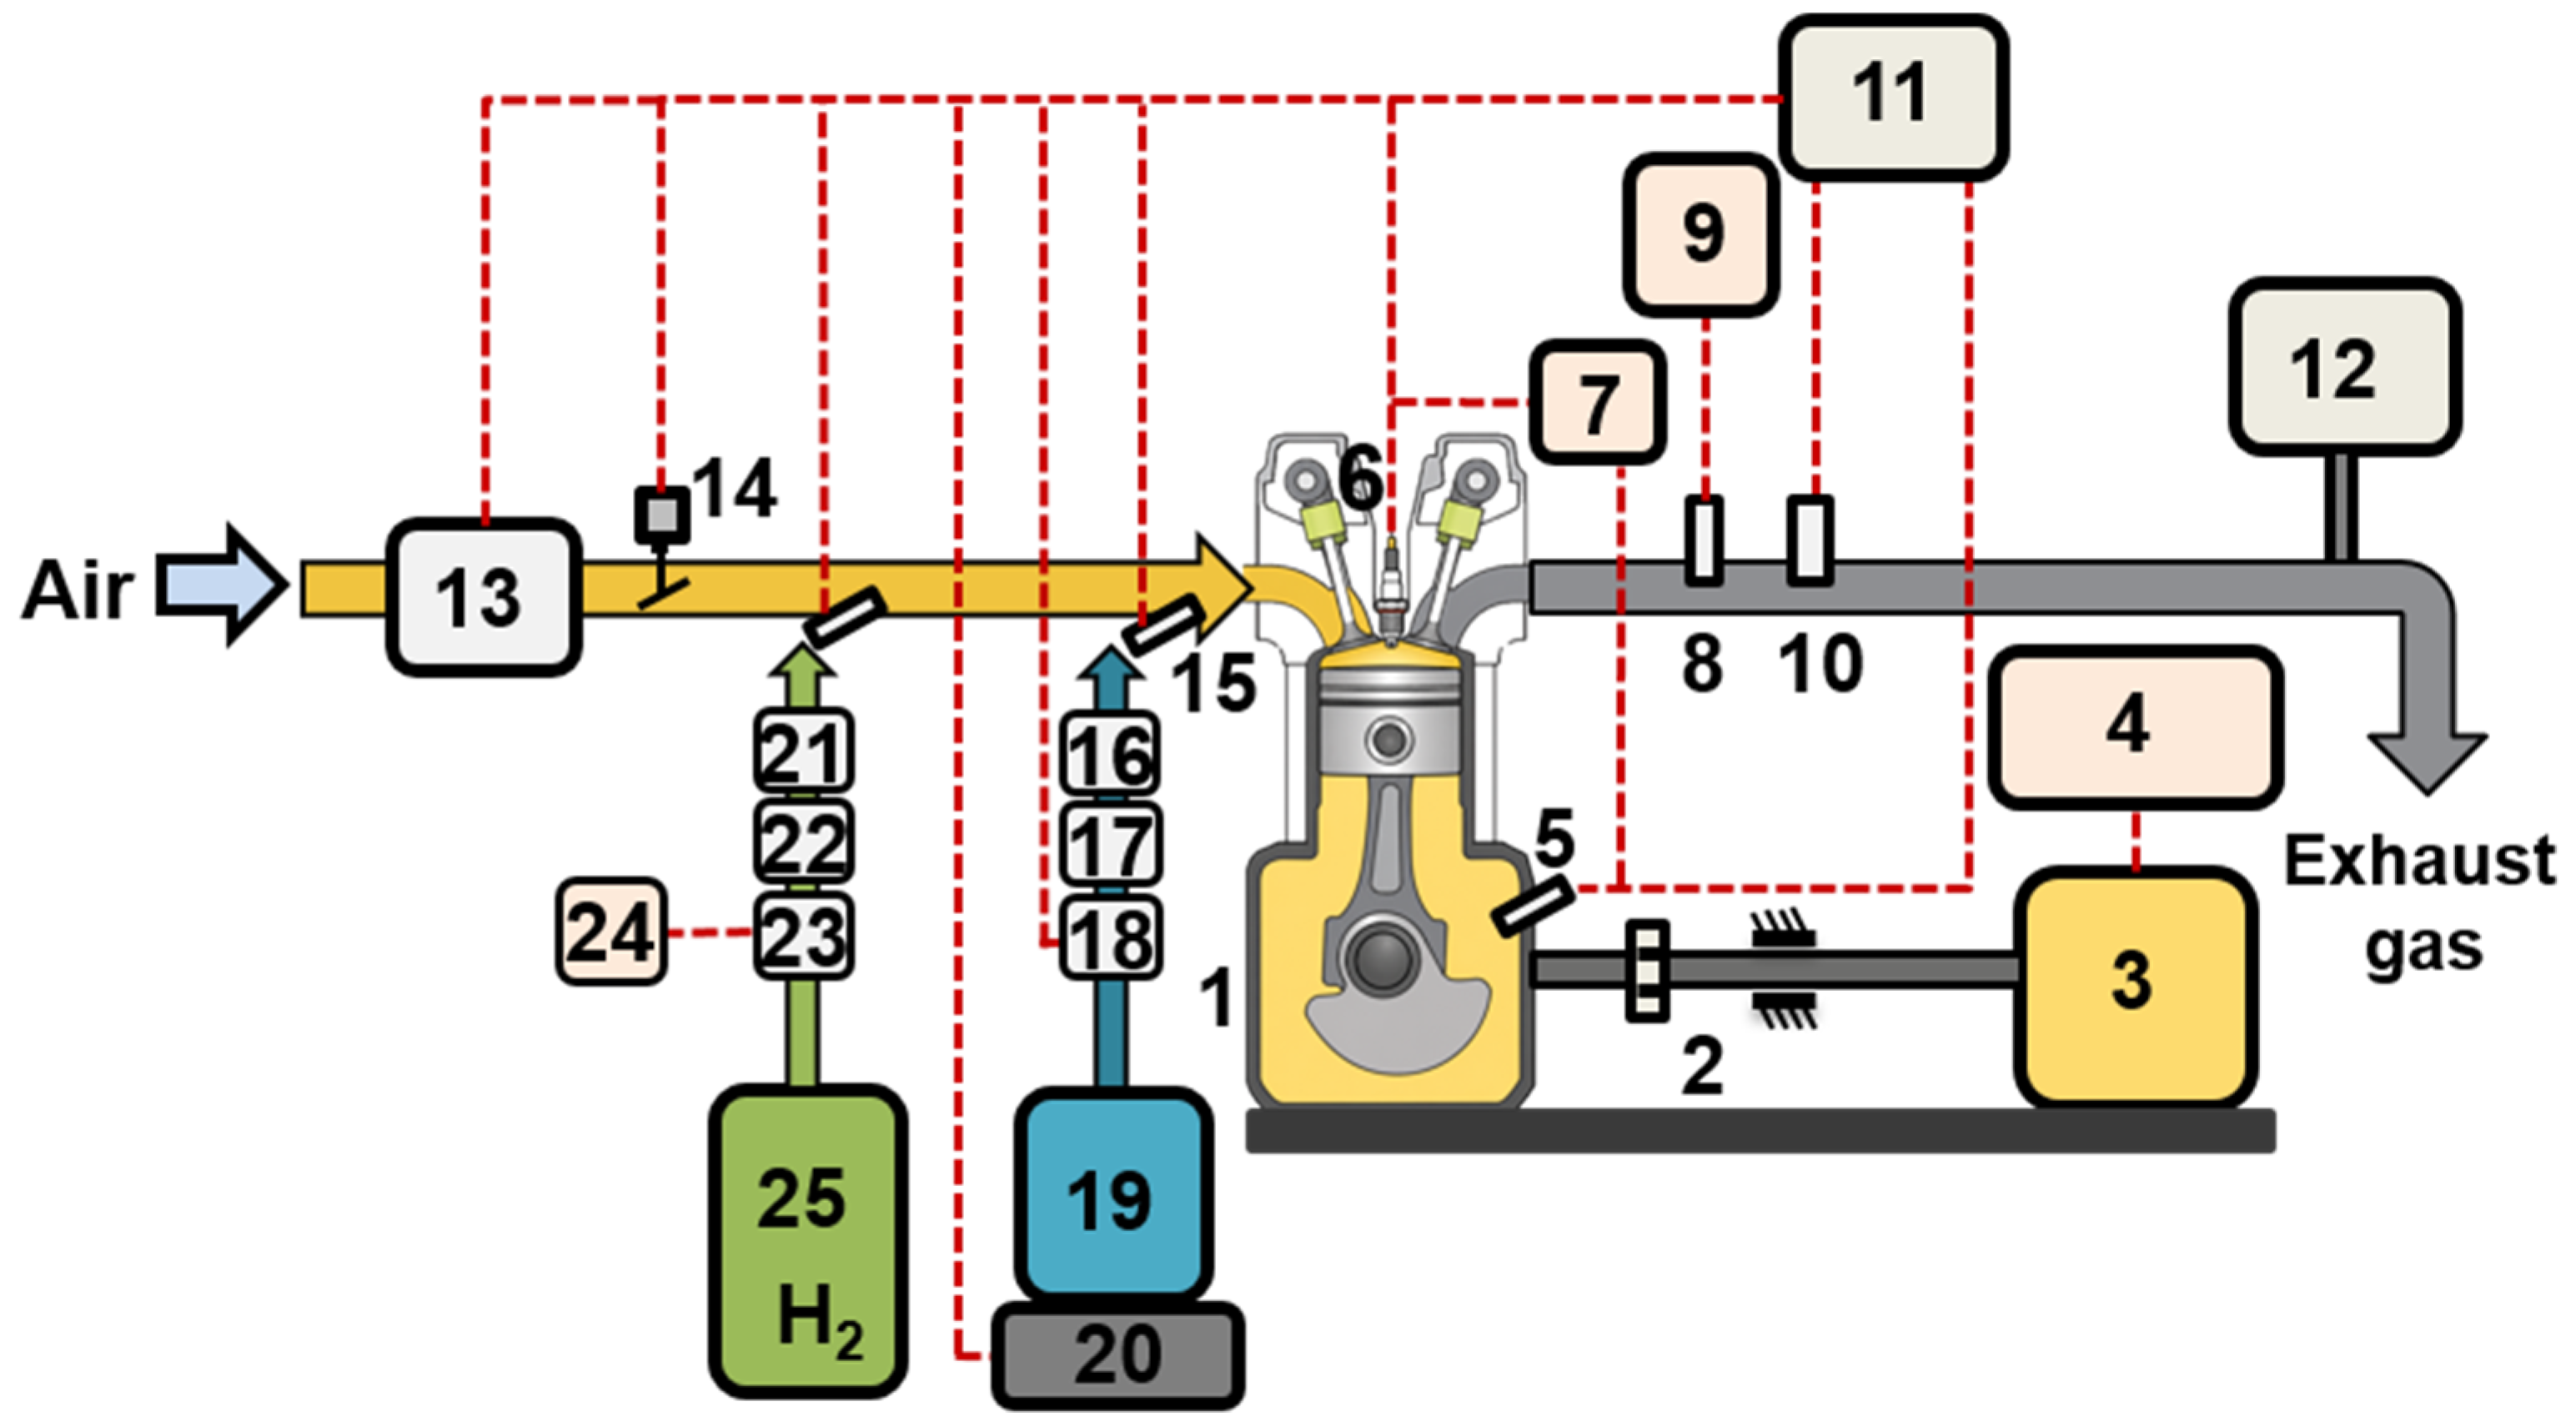
The engine load and crankshaft rotational speed were regulated using an AMX200/100 engine dynamometer (Automex, Gdansk, Poland), which provides a torque measurement precision of 0.9 Nm. For precise monitoring of the intake air mass, a BOSCH HFM 5 sensor (BOSCH, Stuttgart, Germany) was used, maintaining an accuracy within 2%. The mass fuel consumption of H2 was measured using a Coriolis-type RHEONIK RHM 015 mass flow meter (RHEONIK, Odelzhausen, Germany). This high-precision instrument, operating within a range of 0.004–0.6 kg/min with an accuracy of ±0.10%. Comprehensive arrangement of the experimental setup, including the engine test bench and the integrated measurement equipment, is schematically illustrated in Figure 1.
In-cylinder pressure data were collected using an AVL ZI31_Y7S pressure sensor (AVL List GmbH, Graz, Austria) mounted in the spark plug, with a sensitivity of 12 pC/bar and an operating range of 0–200 bar. The signal generated by the in-cylinder pressure sensor was amplified using an AVL DiTEST DPM 800 unit (AVL DiTEST, Graz, Austria) and recorded by means of a LabVIEW Real-Time data acquisition system. At each test condition, 100 consecutive engine cycles were recorded, and the average in-cylinder pressure trace was calculated to ensure representative combustion analysis. To additionally evaluate combustion stability and cycle-to-cycle variation, the coefficient of variation (COV) of the combustion process was determined from the recorded in-cylinder pressure data. Under all investigated operating conditions, the obtained COV values remained below 2%, indicating stable combustion and good repeatability of the combustion process. Exhaust emissions were sampled directly from the engine exhaust upstream of the catalytic converter and analyzed using an AVL DiCom 4000 gas analyzer (AVL DiTEST, Graz, Austria), whose operating ranges and measurement accuracies are summarized in Table 3. The tests were repeated at least five times to ensure limited data variation under steady-state engine operating conditions.
In experiments, four different fuel mixtures were used. As a baseline for comparison we chose petrol with 10% ethanol, marked as E10H0. Three different H2 mass fractions were added to petrol to form three mixtures with 10%, 20% and 30% H2 by mass. These were accordingly marked as E10H10, E10H20 and E10H30. In all experiments, the air–fuel (A/F) ratio was set to be stoichiometric, engine speed was set to 2500 RPM, and brake mean effective Pressure (BMEP) was set to 0.48 MPa. For all fuel mixtures, ST was adjusted to maintain peak in-cylinder pressure in the range of 14–15 CAD ATDC. The used fuel composition, lower heating value, and ST are presented in Table 4.
For experiment data analysis, AVL BOOST software utility BURN (version 2024 R1) was used to evaluate combustion parameters using collected air and fuel consumption data, as well as in-cylinder pressure. Additional information was also used, including the physicochemical properties of the fuels, the parameters of the engine crank mechanism and cylinder, and other relevant engine data.

3. Results and Discussion

3.1. In-Cylinder Pressure and Combustion

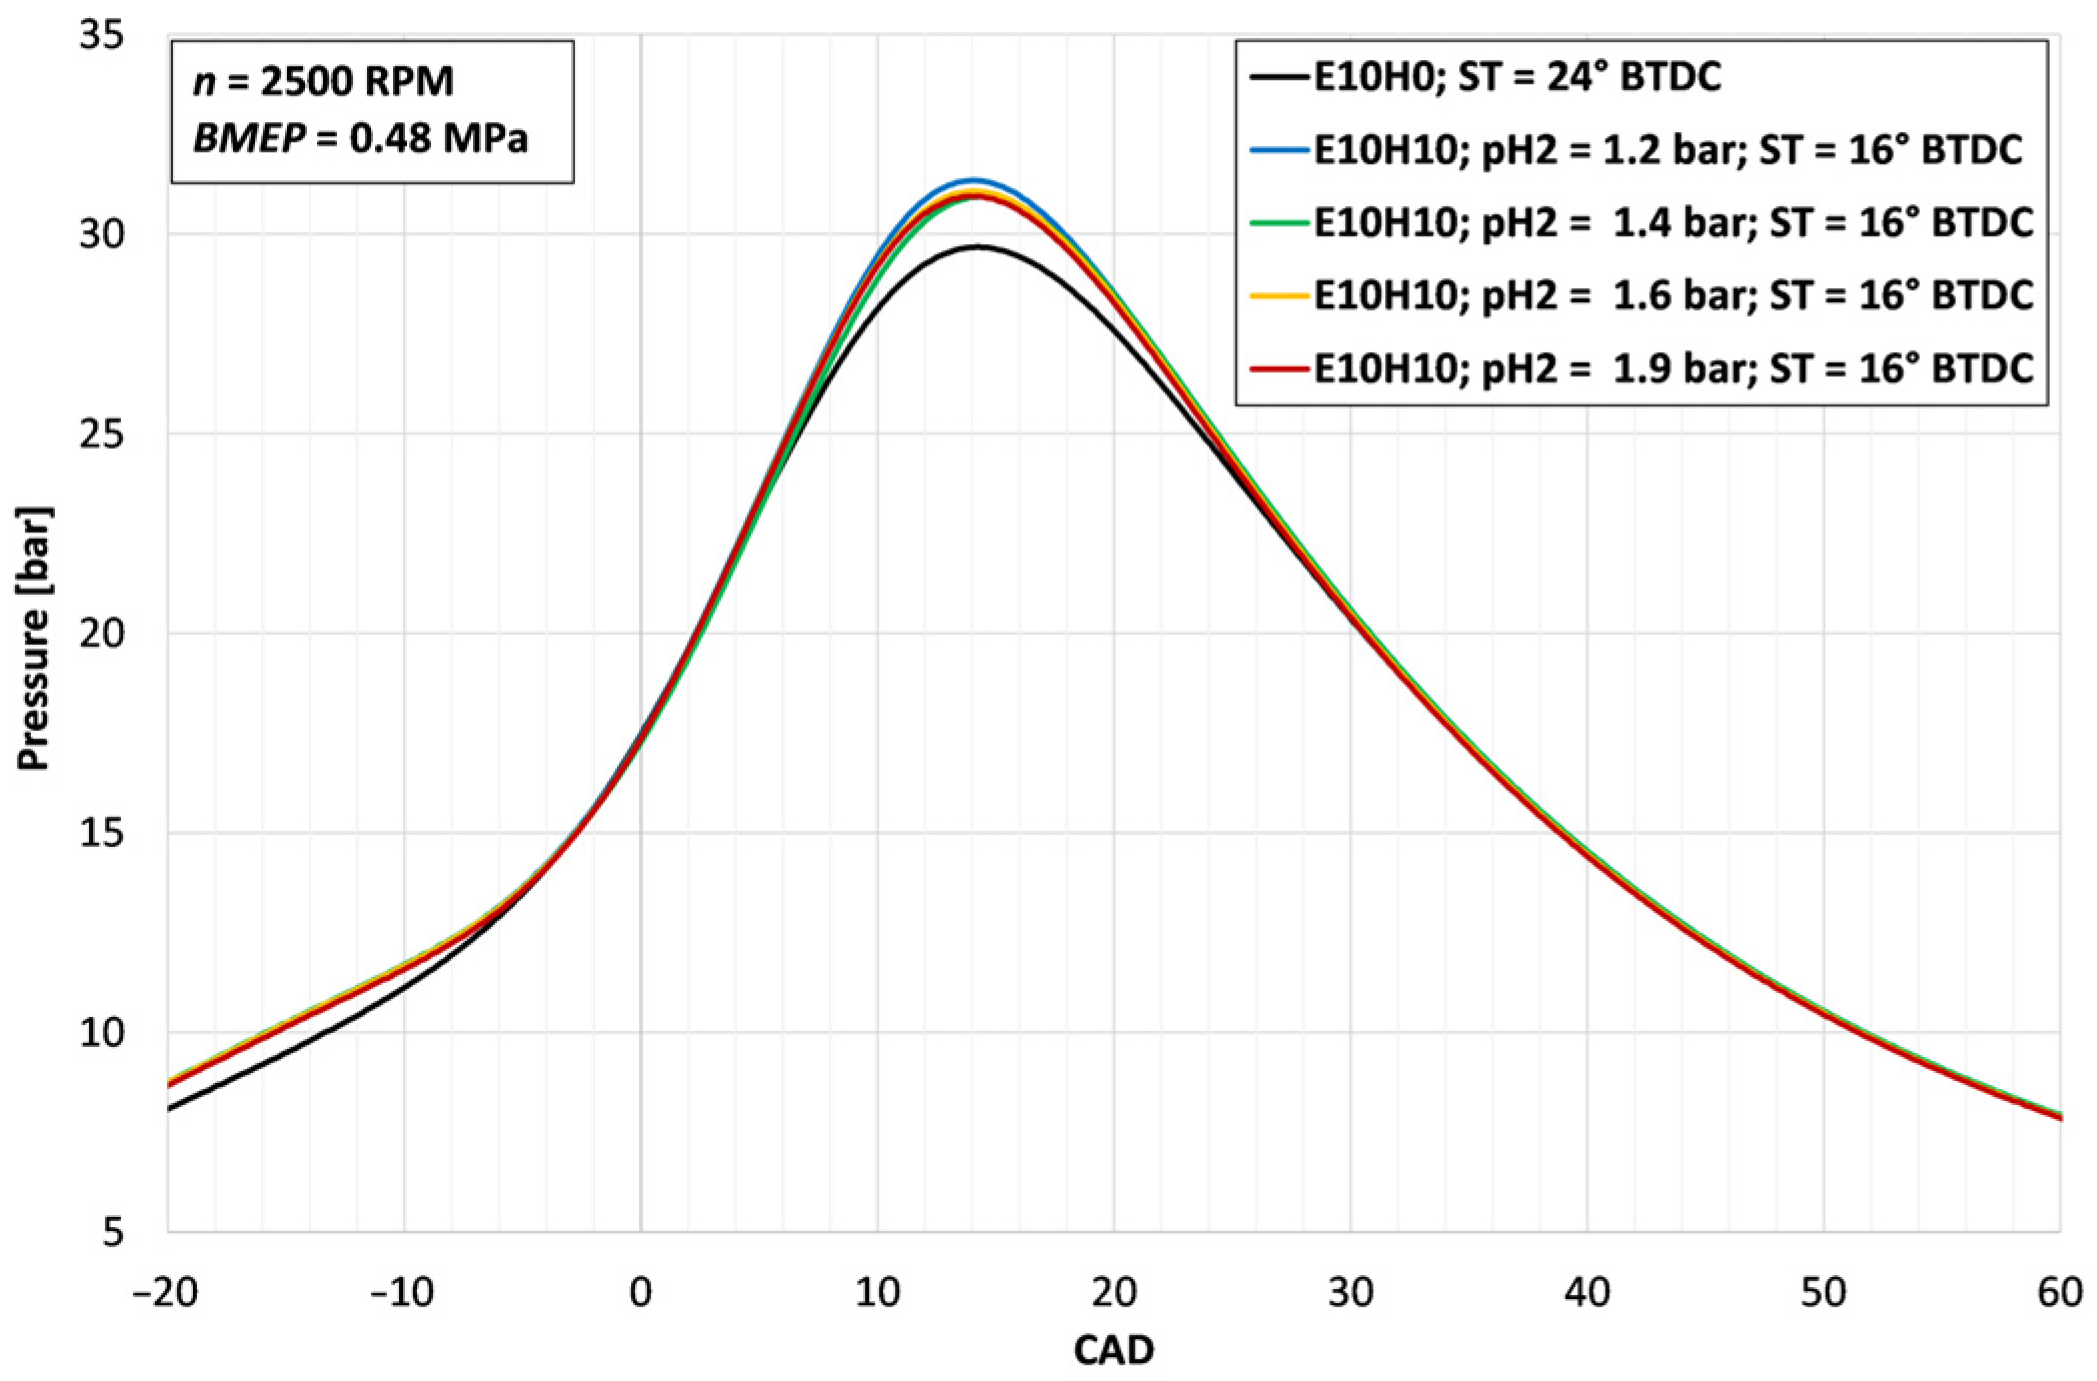
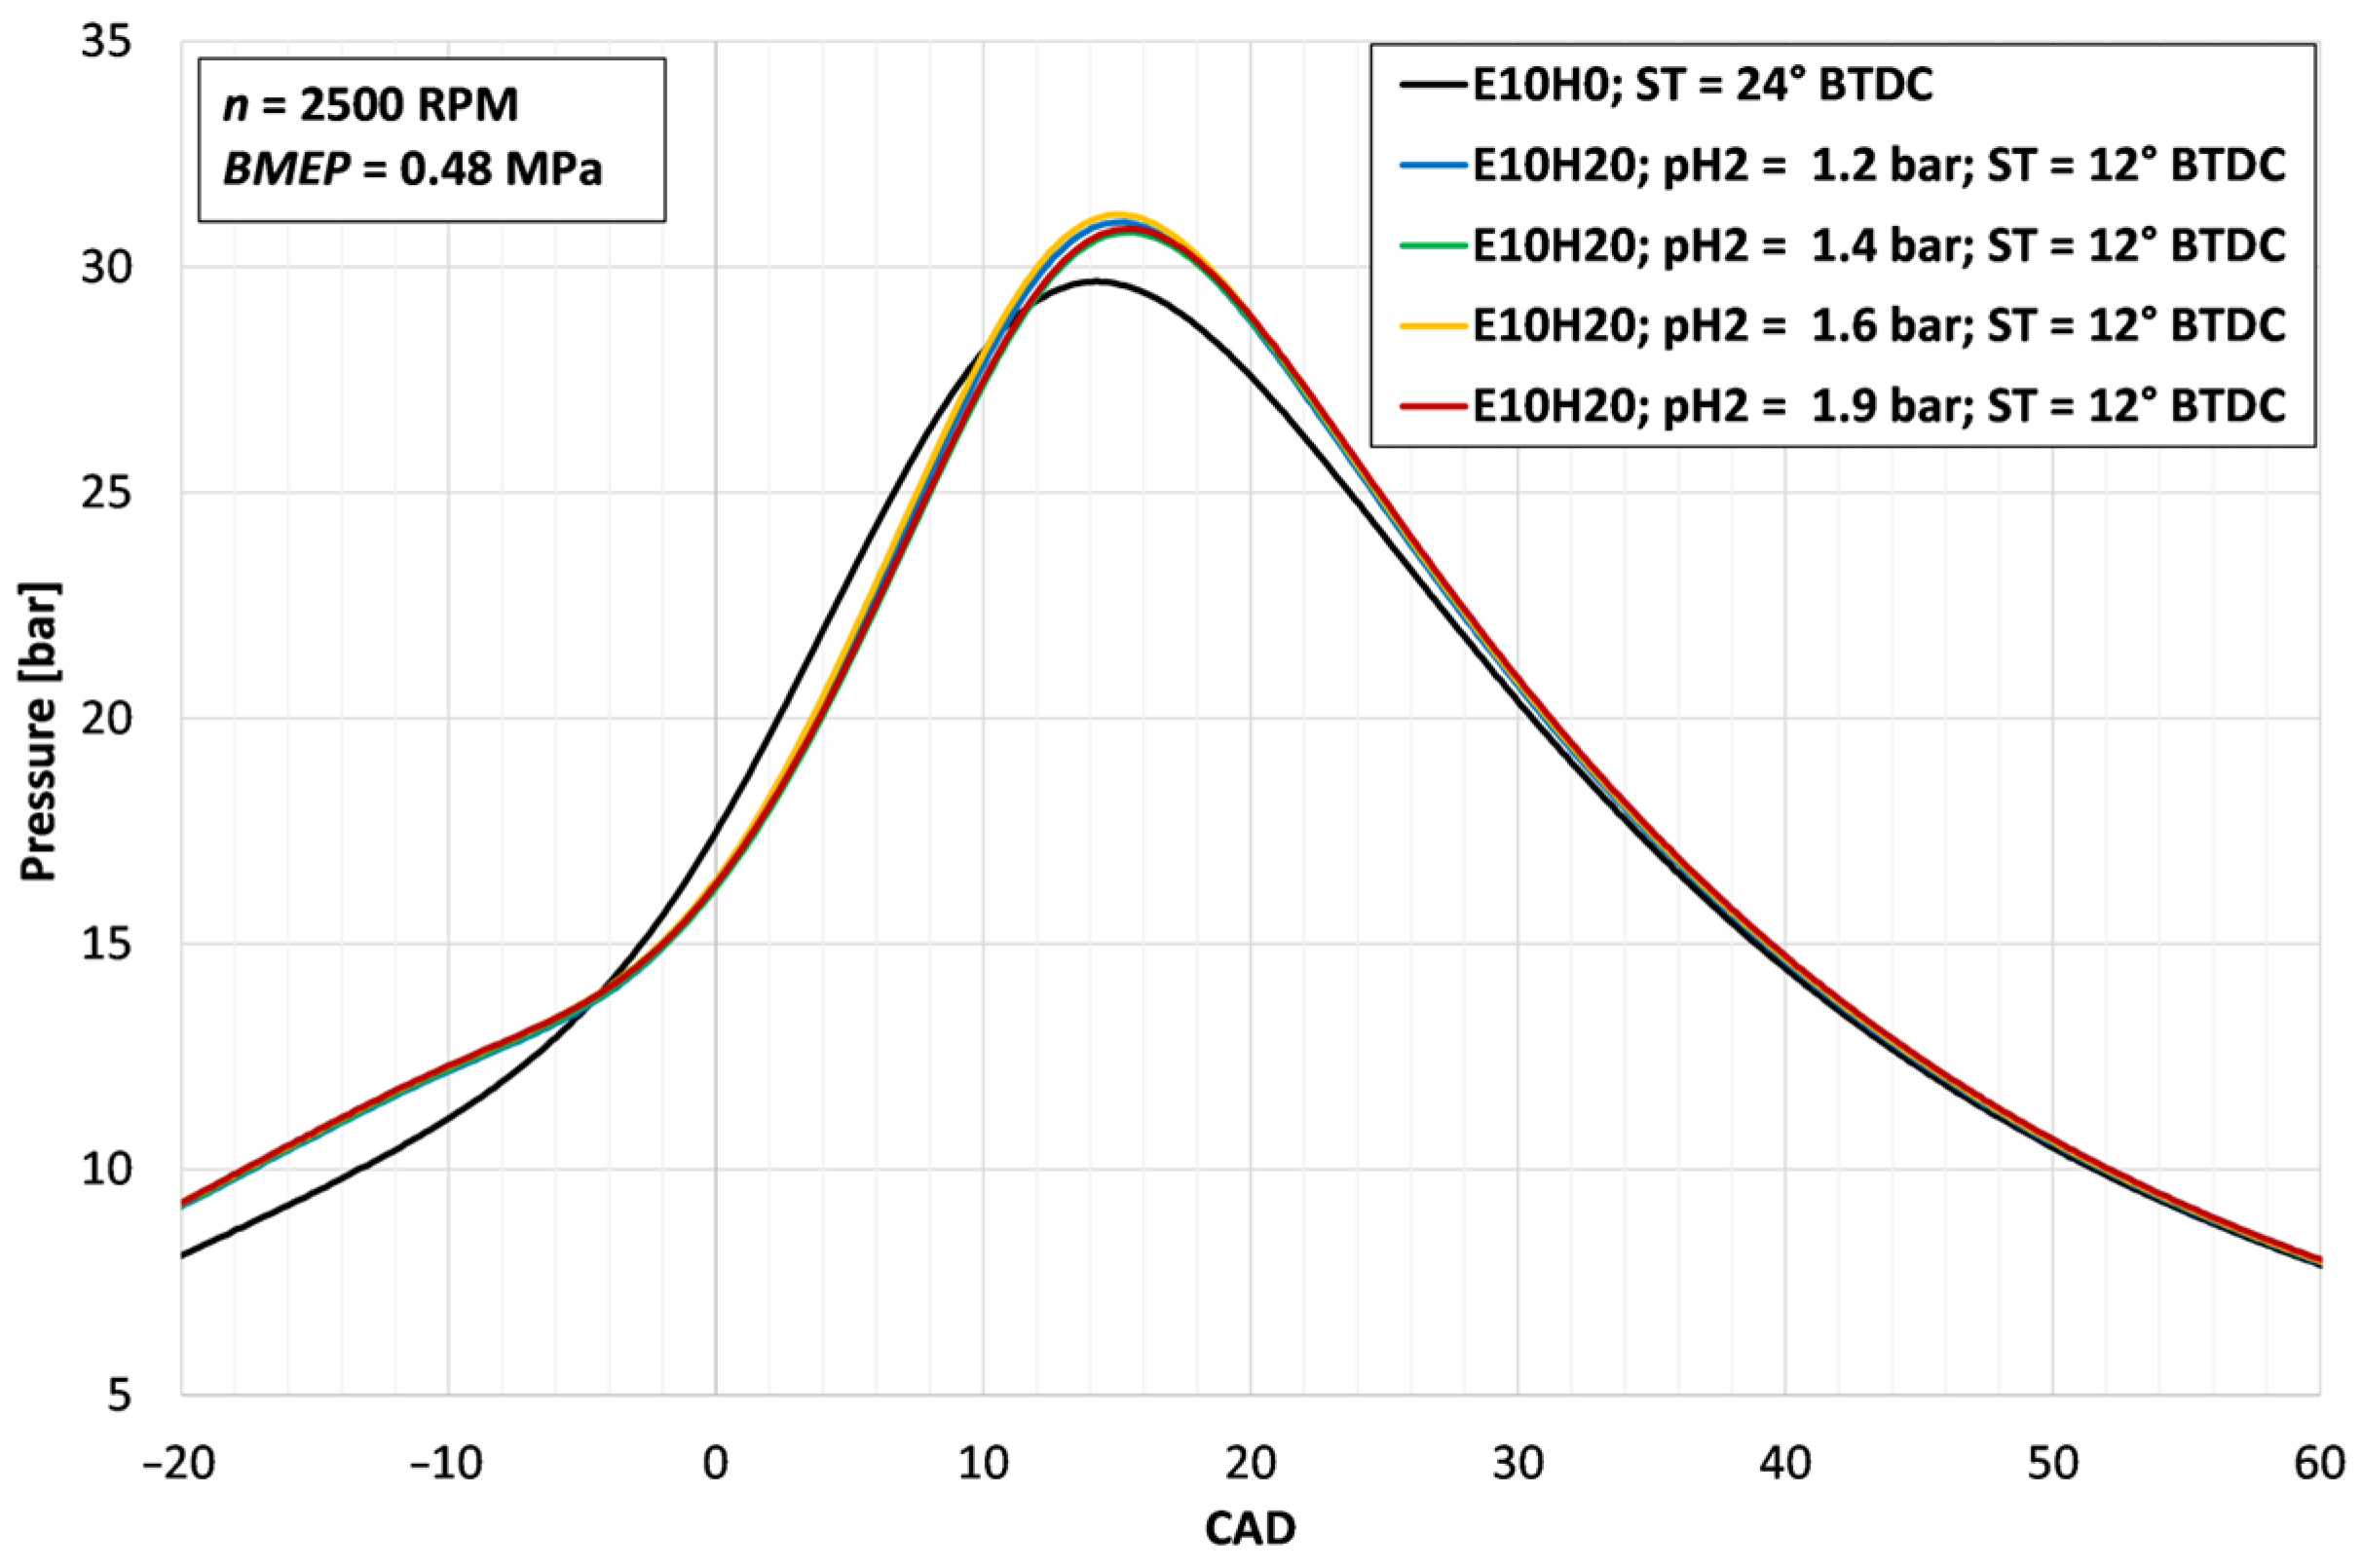
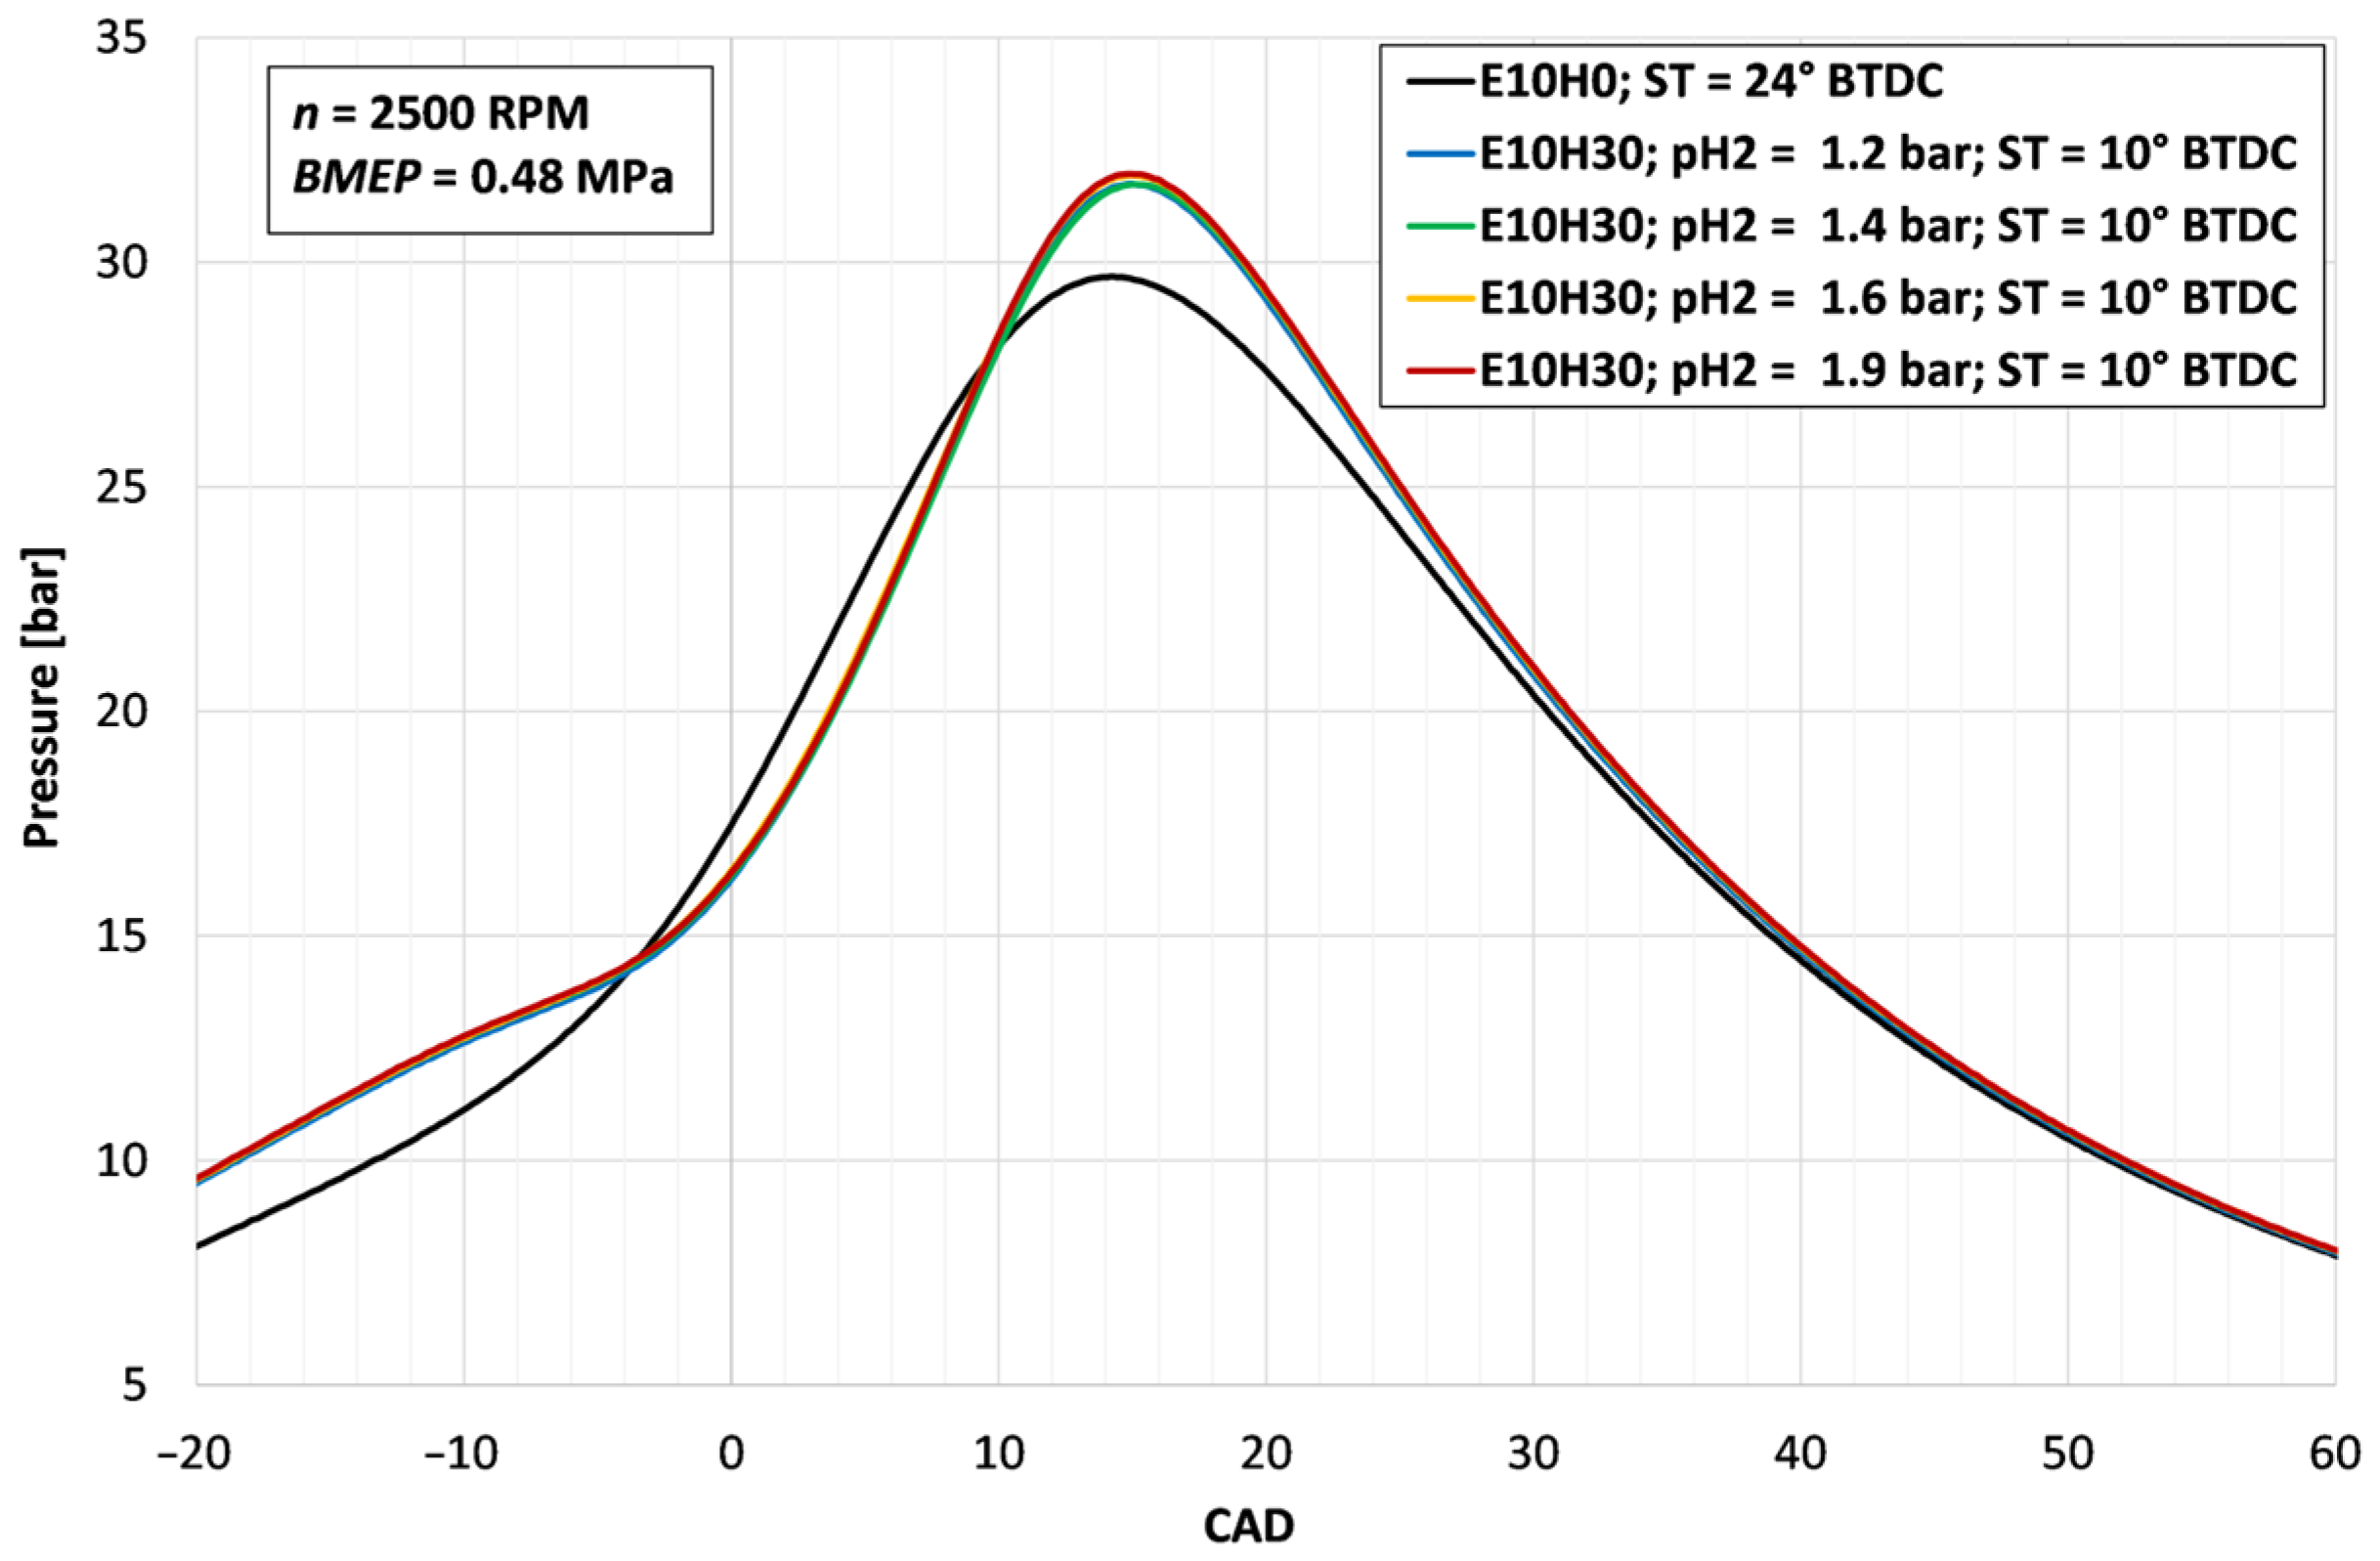
A clear trend is observed across all H2-containing fuel mixtures. Pressure curves show a higher peak cylinder pressure (pmax) than that of E10H0, with higher H2 mass fractions resulting in increased pressure, even when the ST was retarded to maintain stable combustion phasing and to avoid knock-like behavior observed during preliminary adjustment and to ensure that the maximum pressure is reached at 14–15 CAD after TDC (Figure 2, Figure 3 and Figure 4). This aligns with physical logic. H2 enhances the reactivity and burning speed of the mixture, thereby intensifying actual heat release rate.
The main focus of this research is to analyze the effect of H2 injection pressure (pH2) on the energy and environmental parameters of a spark ignition engine. The minimum pressure before injectors was 1.2 bar and maximum up to 1.9 bar (pH2 = 1.2; 1.4; 1.6; 1.9 bar). When evaluating the curves for a fixed H2 mass fraction (10%, 20%, or 30%), it is observed that in the case of 10% H2, a slight increase in pmax is visible as the injection pressure decreases from pH2 = 1.4 bar to pH2 = 1.2 bar, the difference in pmax reaches approximately 0.4 bar. It is likely that at lower H2 injection pressures, the longer injection duration allows the hydrogen to warm up more effectively and mix better with the air, leading to more efficient combustion (Figure 2). Increasing the hydrogen mass fraction to 20% renders the effect of hydrogen injection pressure in the pH2 = 1.2–1.9 bar range on both the reduction in pmax and the curve shape negligible (Figure 3). This is because the H2 injection duration is longer, making the variations in injection pressure less impactful. At an H2 mass fraction of 30%, increasing the H2 injection pressure from 1.2 to 1.9 bar results in an increase in pmax of up to 0.2 bar (Figure 4). This effect is likely associated with the more uniform delivery of a larger amount of H2 during the intake stroke.
Within the investigated hydrogen injection pressure range (1.2–1.9 bar), pH2 alters the H2 injection and mixing dynamics mostly at the lower hydrogen concentration (10% by mass). The combustion phases are essentially fixed by the selected spark timing and the constant engine load conditions. Although the peak in-cylinder pressure increases significantly with higher H2 concentrations, the influence of pH2 on this parameter remains minor. The relatively small differences observed in the averaged in-cylinder pressure traces suggest that the effect of hydrogen injection pressure on combustion phasing remained of secondary importance under the investigated operating conditions. Therefore, combustion stability was additionally assessed using the coefficient of variation (COV), presented in Table 5. The obtained COV values remained below 2% for all investigated fuel mixtures and injection pressures, confirming stable combustion operation and indicating that the observed pressure trace variations were within the expected cycle-to-cycle variability range. This suggests that at moderate engine loads, the chemical properties and mass fraction of hydrogen have a far more substantial impact on the combustion characteristics than the kinetic energy of the fuel jet provided by the injection pressure. During preliminary adjustment, knock-like combustion was observed at some combinations of hydrogen fraction and spark timing, which was indicated by abnormal engine sound and sharp irregular features in the measured in-cylinder pressure trace. These operating points were immediately stopped and corrected by retarding spark timing or reducing hydrogen fraction. Only stable points without knock-like pressure oscillations were included in the final analysis.
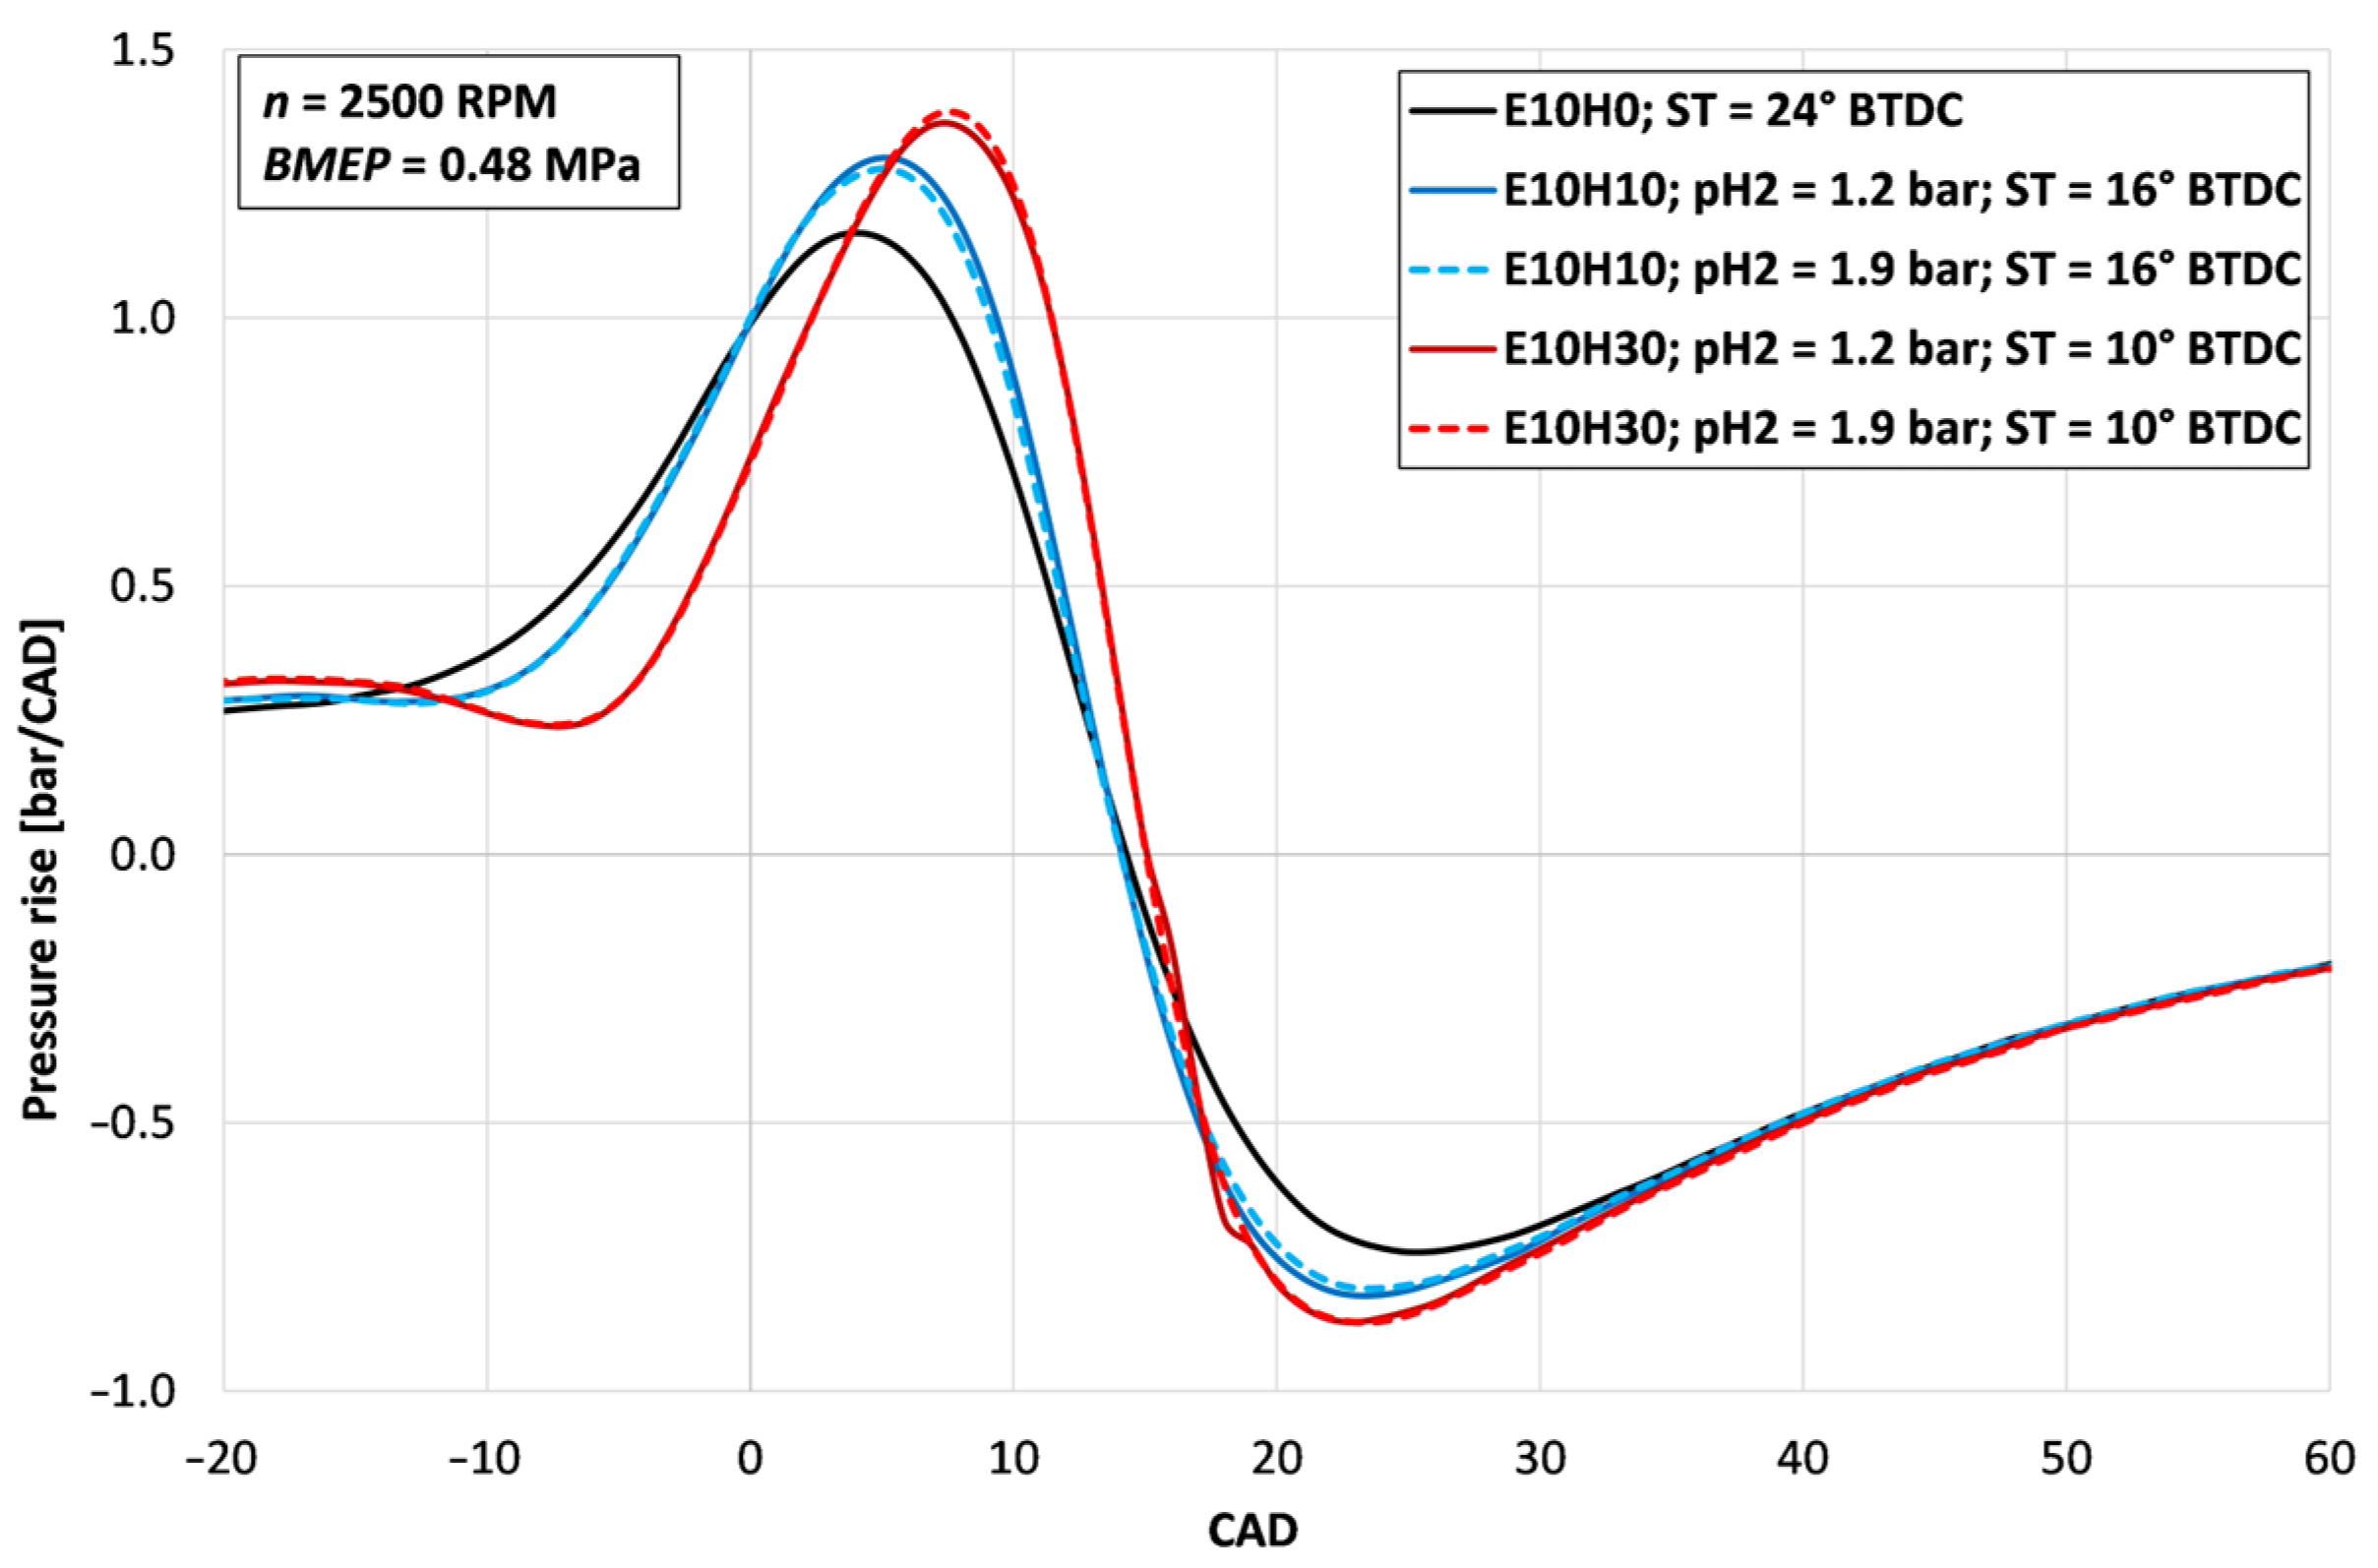
The combustion indicators were investigated using the AVL BOOST sub-program BURN, focusing on the boundary conditions of hydrogen injection pressure pH2 = 1.2 bar and pH2 = 1.9 bar for three fuel mixtures: E10H0, E10H10, and E10H30. The analysis of the in-cylinder pressure rise (Figure 5) shows differences in start of combustion pressure rise and peak pressure values depending on the fuel mixtures. These differences are primarily caused by the adjusted ST and variation in ignition delay (ID) phases for different fuel mixture. To maintain a consistent combustion phasing, the ST was retarded as the hydrogen concentration increased, aiming to reach the peak in-cylinder pressure at approximately 14–15 °CAD ATDC. For the baseline E10H0, the ST was at its earliest (24 °CAD BTDC), resulting in the earliest pressure rise peak at 4 °CAD ATDC; however, it reached the lowest maximum pressure rise at 1.18 bar/CAD. With the addition of hydrogen (E10H10 and E10H30), the maximum pressure rise increased to approximately 1.30 bar/CAD at 5 °CAD ATDC and 1.36 bar/CAD at 7 °CAD ATDC, respectively, due to the higher laminar flame speed of hydrogen, which promotes a more rapid and concentrated energy release.
Increasing the H2 injection pressure resulted in different trends depending on the H2 concentration in the fuel blend. In the E10H10 case, a slightly higher rate of pressure rise was obtained at pH2 =1.2 bar, whereas in the E10H30 case, it was obtained at pH2 =1.9 bar. The likely reason for these differences is that more homogeneous mixture preparation is achieved at the lower H2 concentration of 10% when hydrogen is injected at 1.2 bar, and at the higher H2 concentration of 30% when injected at 1.9 bar.
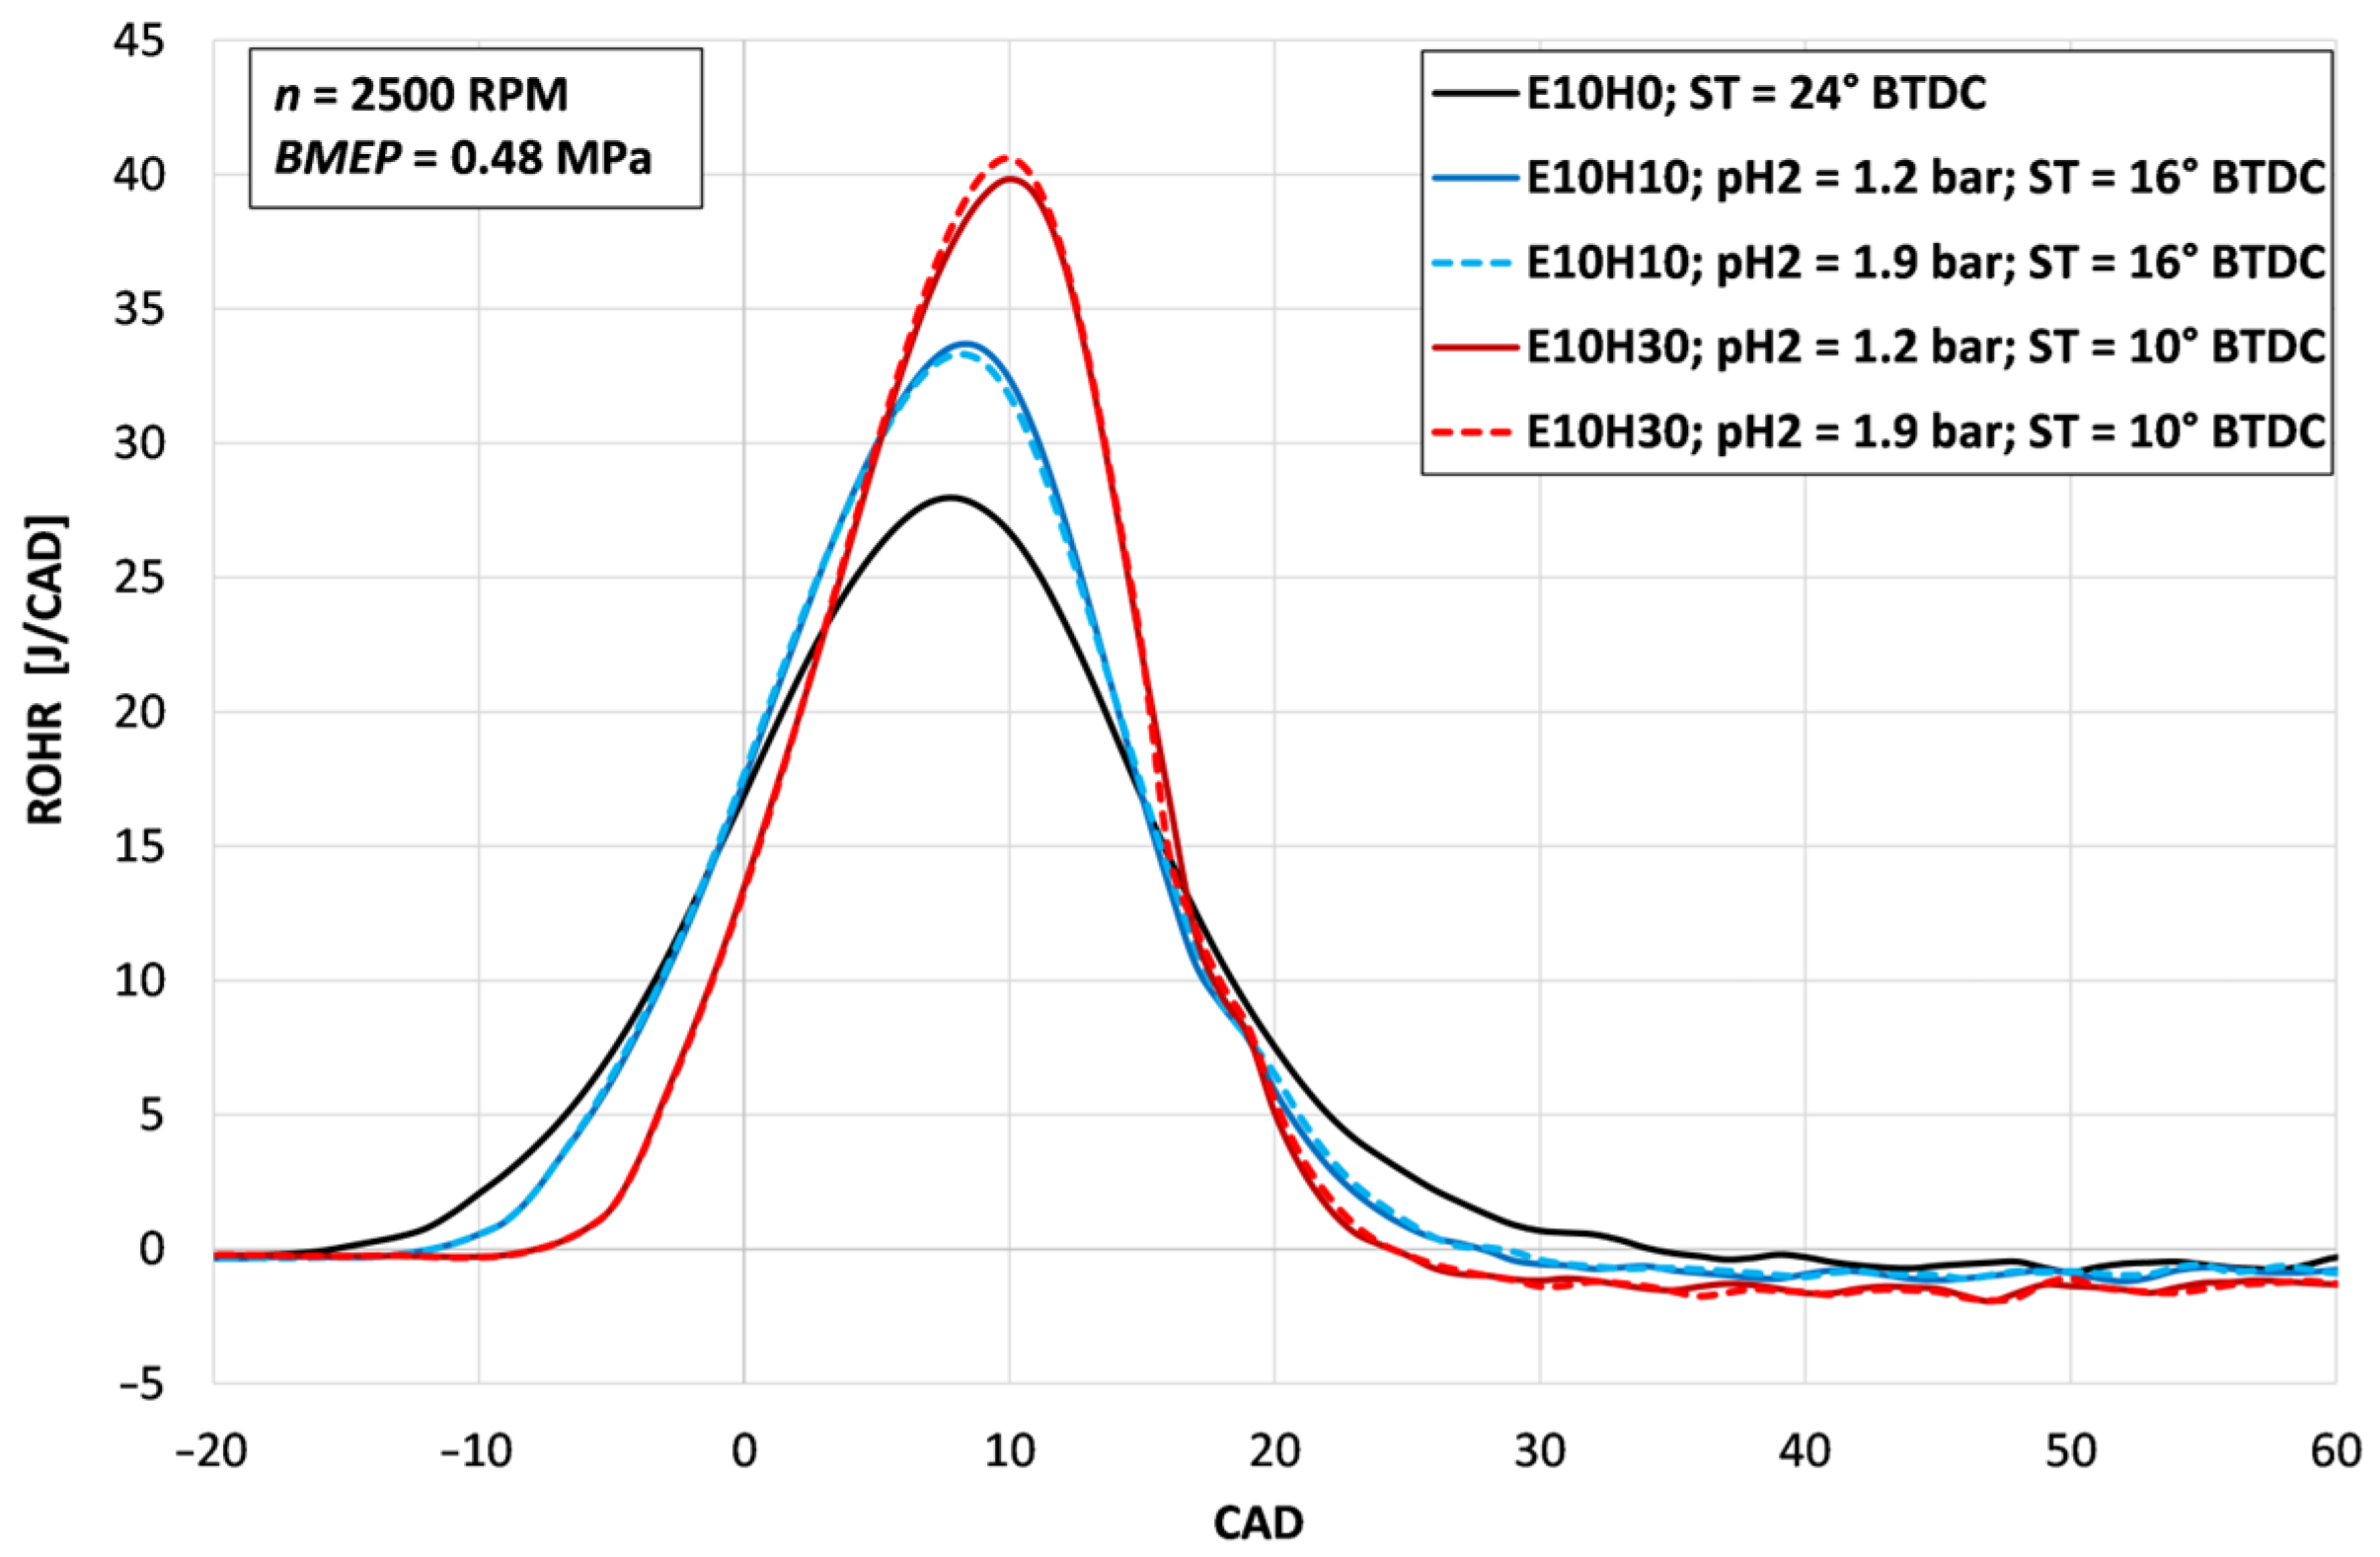
Higher combustion speed is further evidenced by the Rate of Heat Release (ROHR) shown in Figure 6. The higher peak values of ROHR for hydrogen-enriched mixtures confirm that H2 addition significantly shortens the initial stages of combustion. As detailed in Table 5, the ID decreased from 6.7 CAD for E10H0 to 2.0–2.3 CAD for the E10H30 mixture. The impact of pH2 on the Start of Combustion (SOC) and Mass Burn Fraction (MBF) indicators was minimal. For E10H10, increasing the injection pressure from 1.2 bar to 1.9 bar resulted in a slight increase in ID (0.3 CAD), whereas for E10H30, a minor decrease (−0.3 CAD) was observed. This suggests that while pH2 has a secondary effect on mixture homogeneity, the effects of hydrogen concentration remain the dominant factor influencing the combustion indicators.
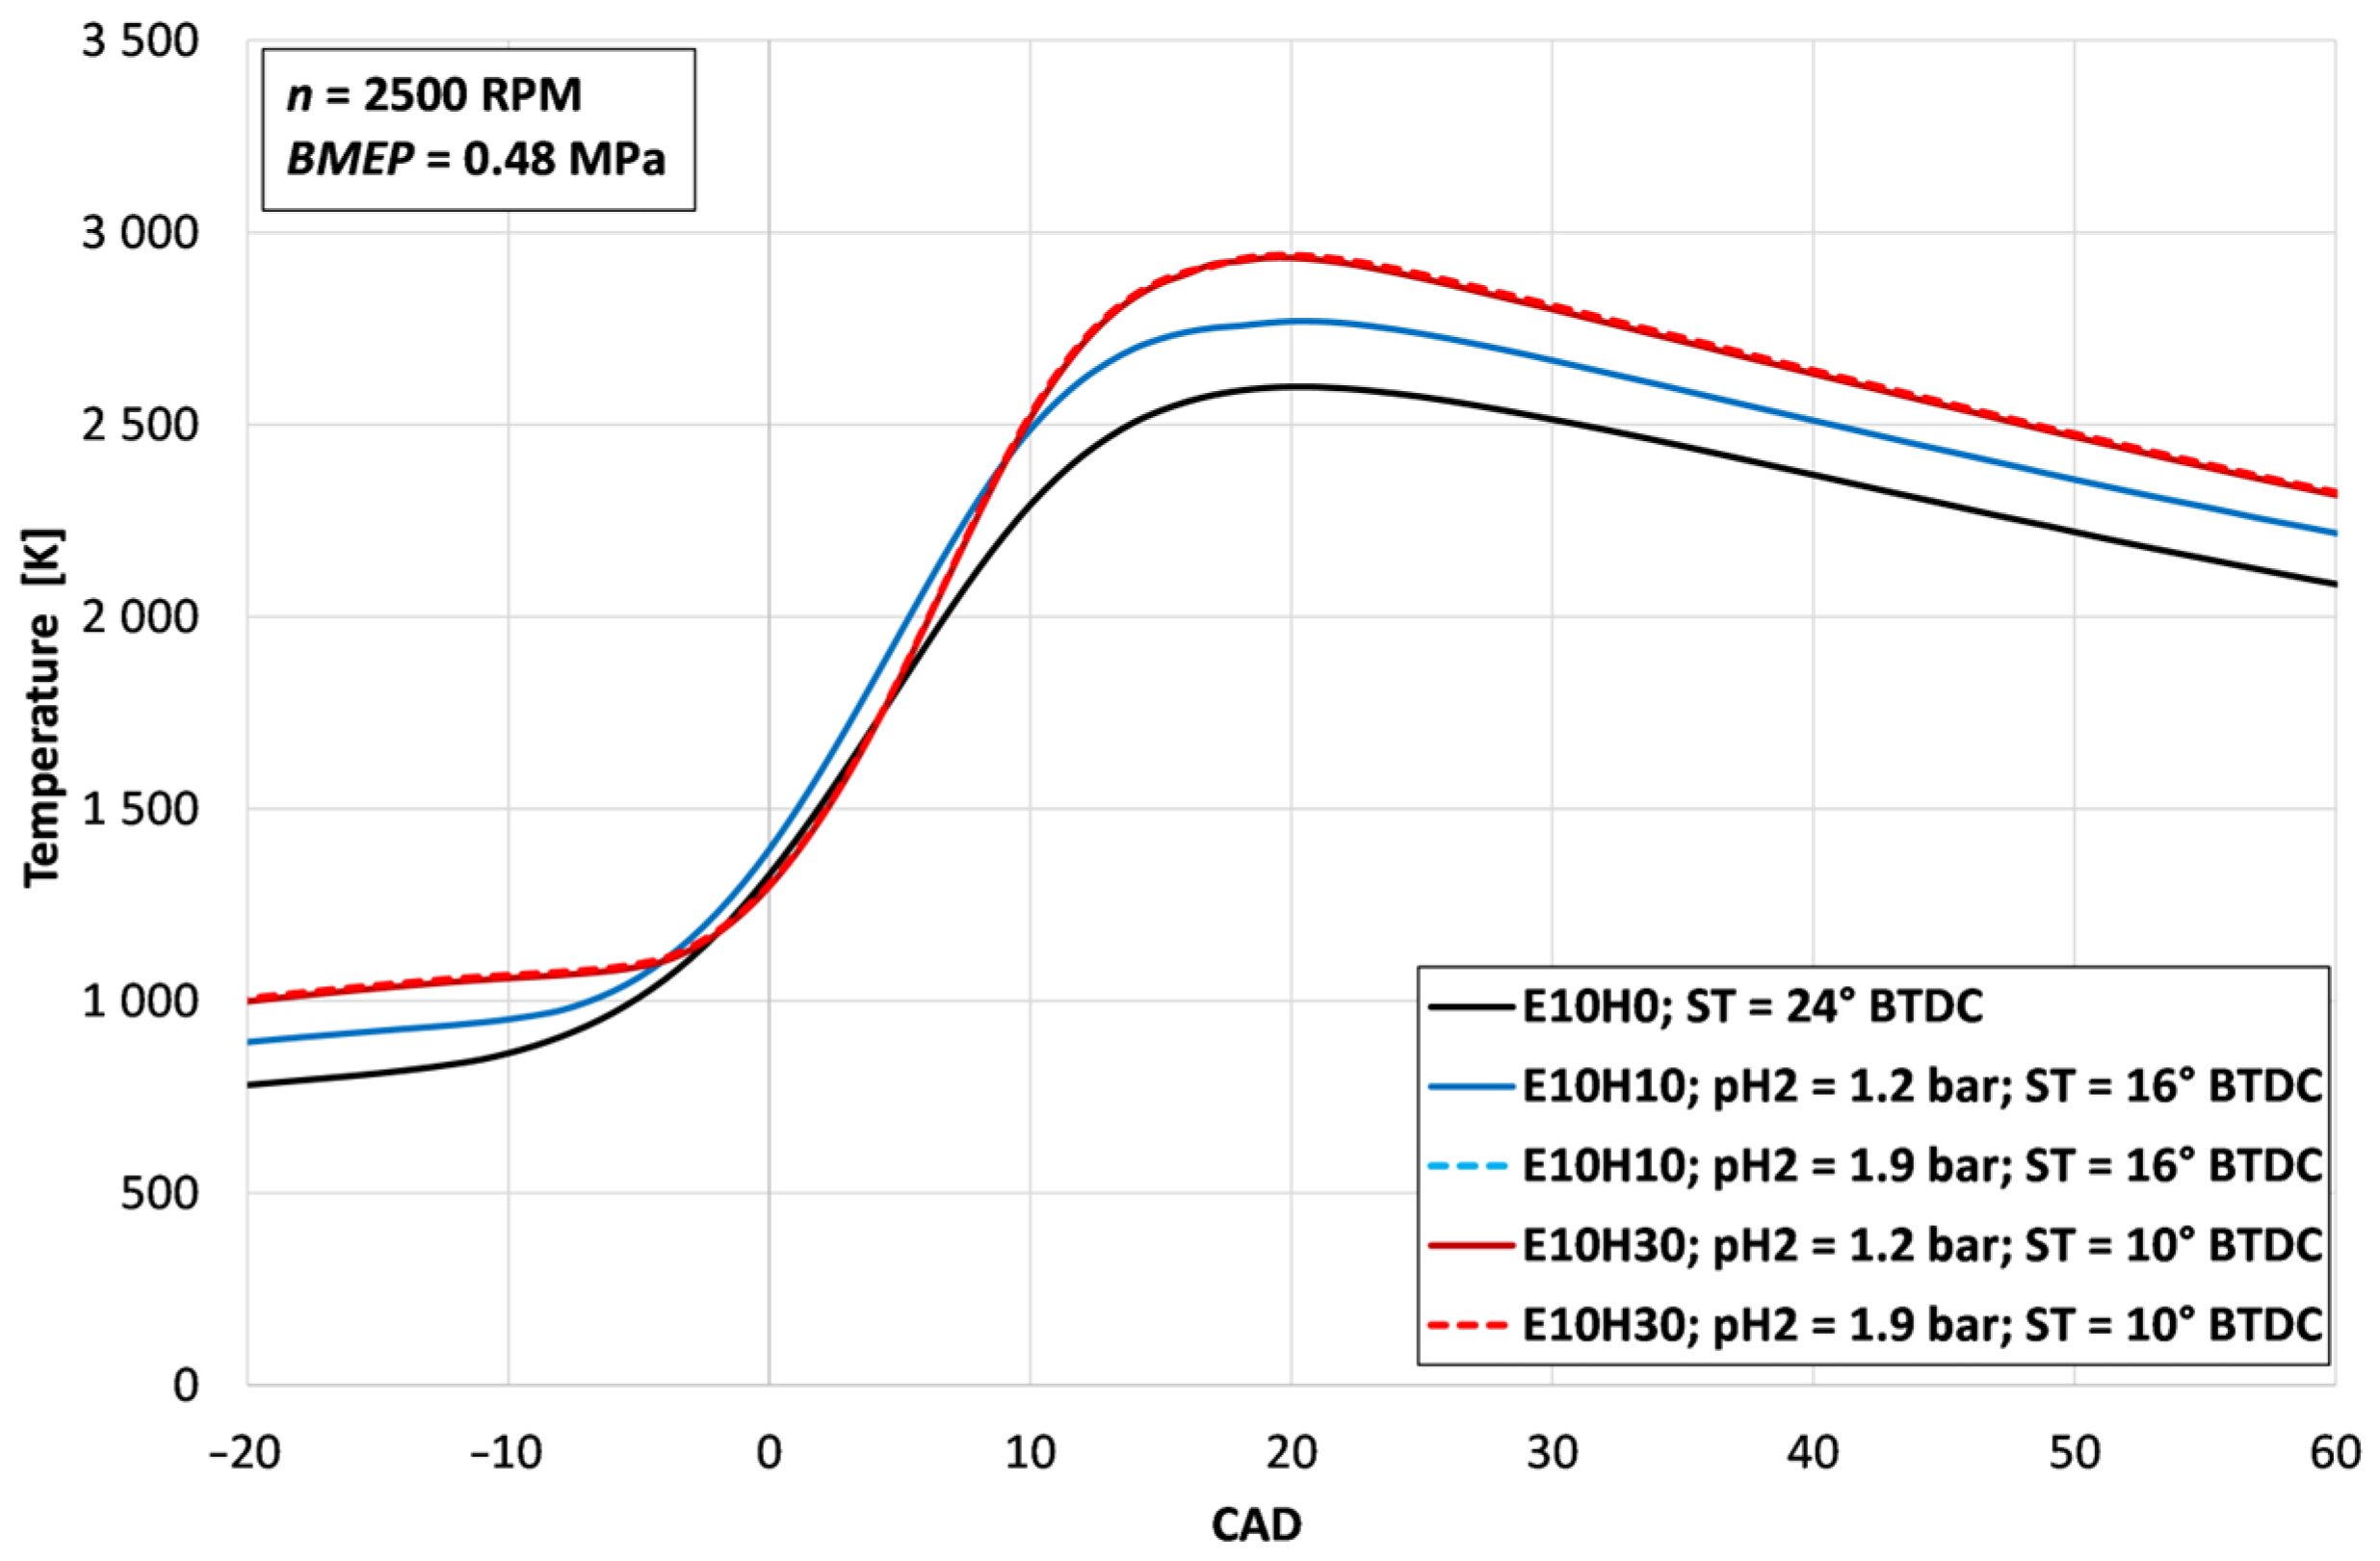
The intensified combustion and higher lower heating value (LHV) of hydrogen also resulted in significantly higher in-cylinder temperatures (Figure 7). After applying the previously described ST corrections, the maximum temperature was reached at a very similar crank-angle position, approximately 20 °CAD ATDC, for the 0%, 10%, and 30% H2 cases. However, the peak temperature values differed. In the E10H0 case, the in-cylinder temperature reached 2598 K, increasing to 2758 K for E10H10 and to 2934 K for E10H30.
The peak temperatures rose from approximately 2600 K for E10H0 to nearly 2950 K for the E10H30 mixture. These elevated temperatures directly correlate with the increase in NOx emissions. The adjustment of hydrogen injection pressure had a relatively small effect on the maximum in-cylinder temperature during combustion. It was calculated that, in the E10H10 case, increasing the H2 injection pressure from 1.5 to 1.9 bar reduced the in-cylinder temperature by 10 K, whereas in the E10H30 case it increased by 7 K. The combustion temperature exceeded the lower threshold for thermal NOx formation, and even minor changes in the in-cylinder temperature can influence NOx formation.

3.2. Economic-Energy Indicators

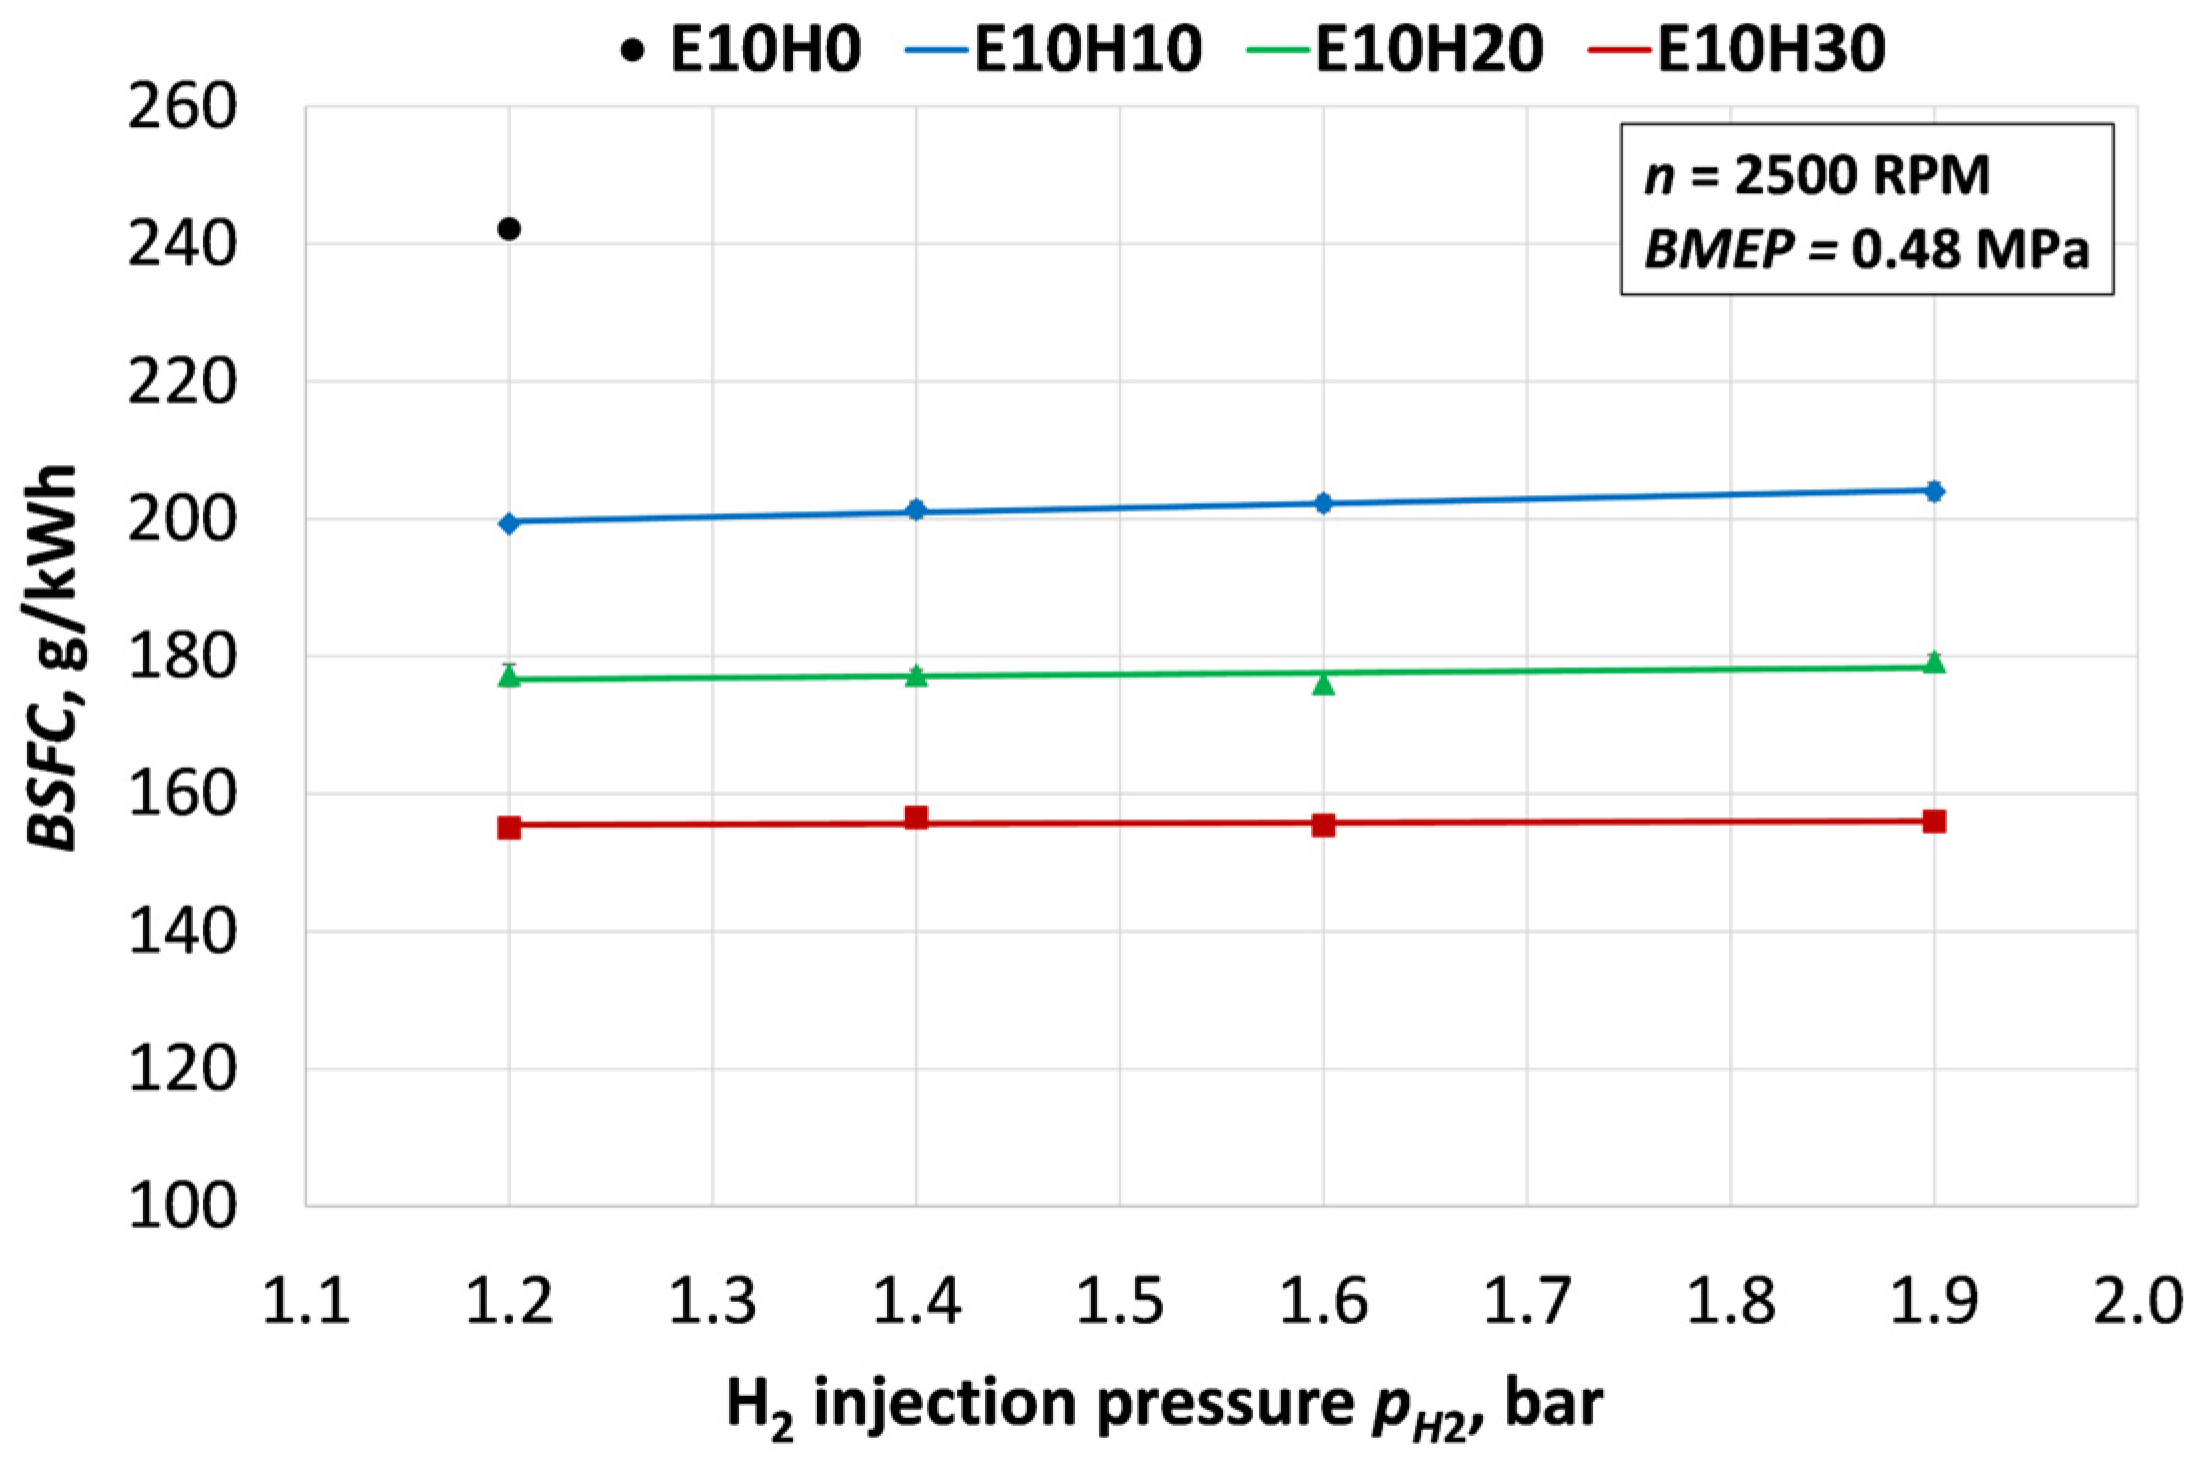
The analysis of the Brake Specific Fuel Consumption (BSFC) reveals a decrease in fuel consumption with an increasing hydrogen mass fraction compared to the baseline E10H0 fuel, for which the BSFC is approximately 242 g/kWh, as shown in Figure 8. For the E10H10 mixture, the BSFC values range between 199 g/kWh and 204 g/kWh, with a slightly greater reduction of up to 2.4% observed at the lower injection pressure of pH2 = 1.2 bar. This correlates with enhanced combustion efficiency, as supported by the previously recorded higher peak in-cylinder pressure (Figure 2, Figure 3 and Figure 4) and faster combustion. As the hydrogen mass fraction is further increased to E10H20, the BSFC decreases to 176–179 g/kWh across the entire injection pressure range, and for E10H30, it reaches approximately 155–158 g/kWh. This reduction was mainly caused by the increased LHV of the fuel mixtures. LHV increases from 41.8 MJ/kg for E10H0 to 49.7 MJ/kg (18.9%), 57.5 MJ/kg (37.5%), and 65.3 MJ/kg (56.2%) for the E10H10, E10H20, and E10H30 mixtures, respectively. A higher hydrogen fraction in the fuel increases both the mixture combustion speed and the LHV, resulting in a decreased fuel mass required for the engine to operate at a constant load. Consequently, the BSFC decreases even when the engine’s thermal efficiency remains relatively stable. Furthermore, at these higher mass fractions, the impact of pH2 on BSFC becomes minimal, with the curves exhibiting a nearly horizontal trend, indicating that the combustion process becomes less sensitive to injection pressure variations within the tested range.
BSFC depends on the lower heating value of the fuel; therefore, it is not sufficient for assessing energy-use efficiency and mainly reflects mass-based fuel consumption. In contrast, brake-specific energy consumption (BSEC) provides a more appropriate evaluation of the engine energy efficiency. However, the BSEC results indicate that the improvement in energy-use efficiency with increasing H2 concentration was only marginal. For E10H0, the BSEC was 10.13 MJ/kWh, while in the 10% H2 case it decreased to 9.89 MJ/kWh. However, for the higher H2 fractions, the improvement was less pronounced, with BSEC values of approximately 10.12 MJ/kWh. For all H2 concentrations, increasing the hydrogen injection pressure resulted in higher BSEC, most likely due to poorer combustible-mixture preparation and less efficient combustion.
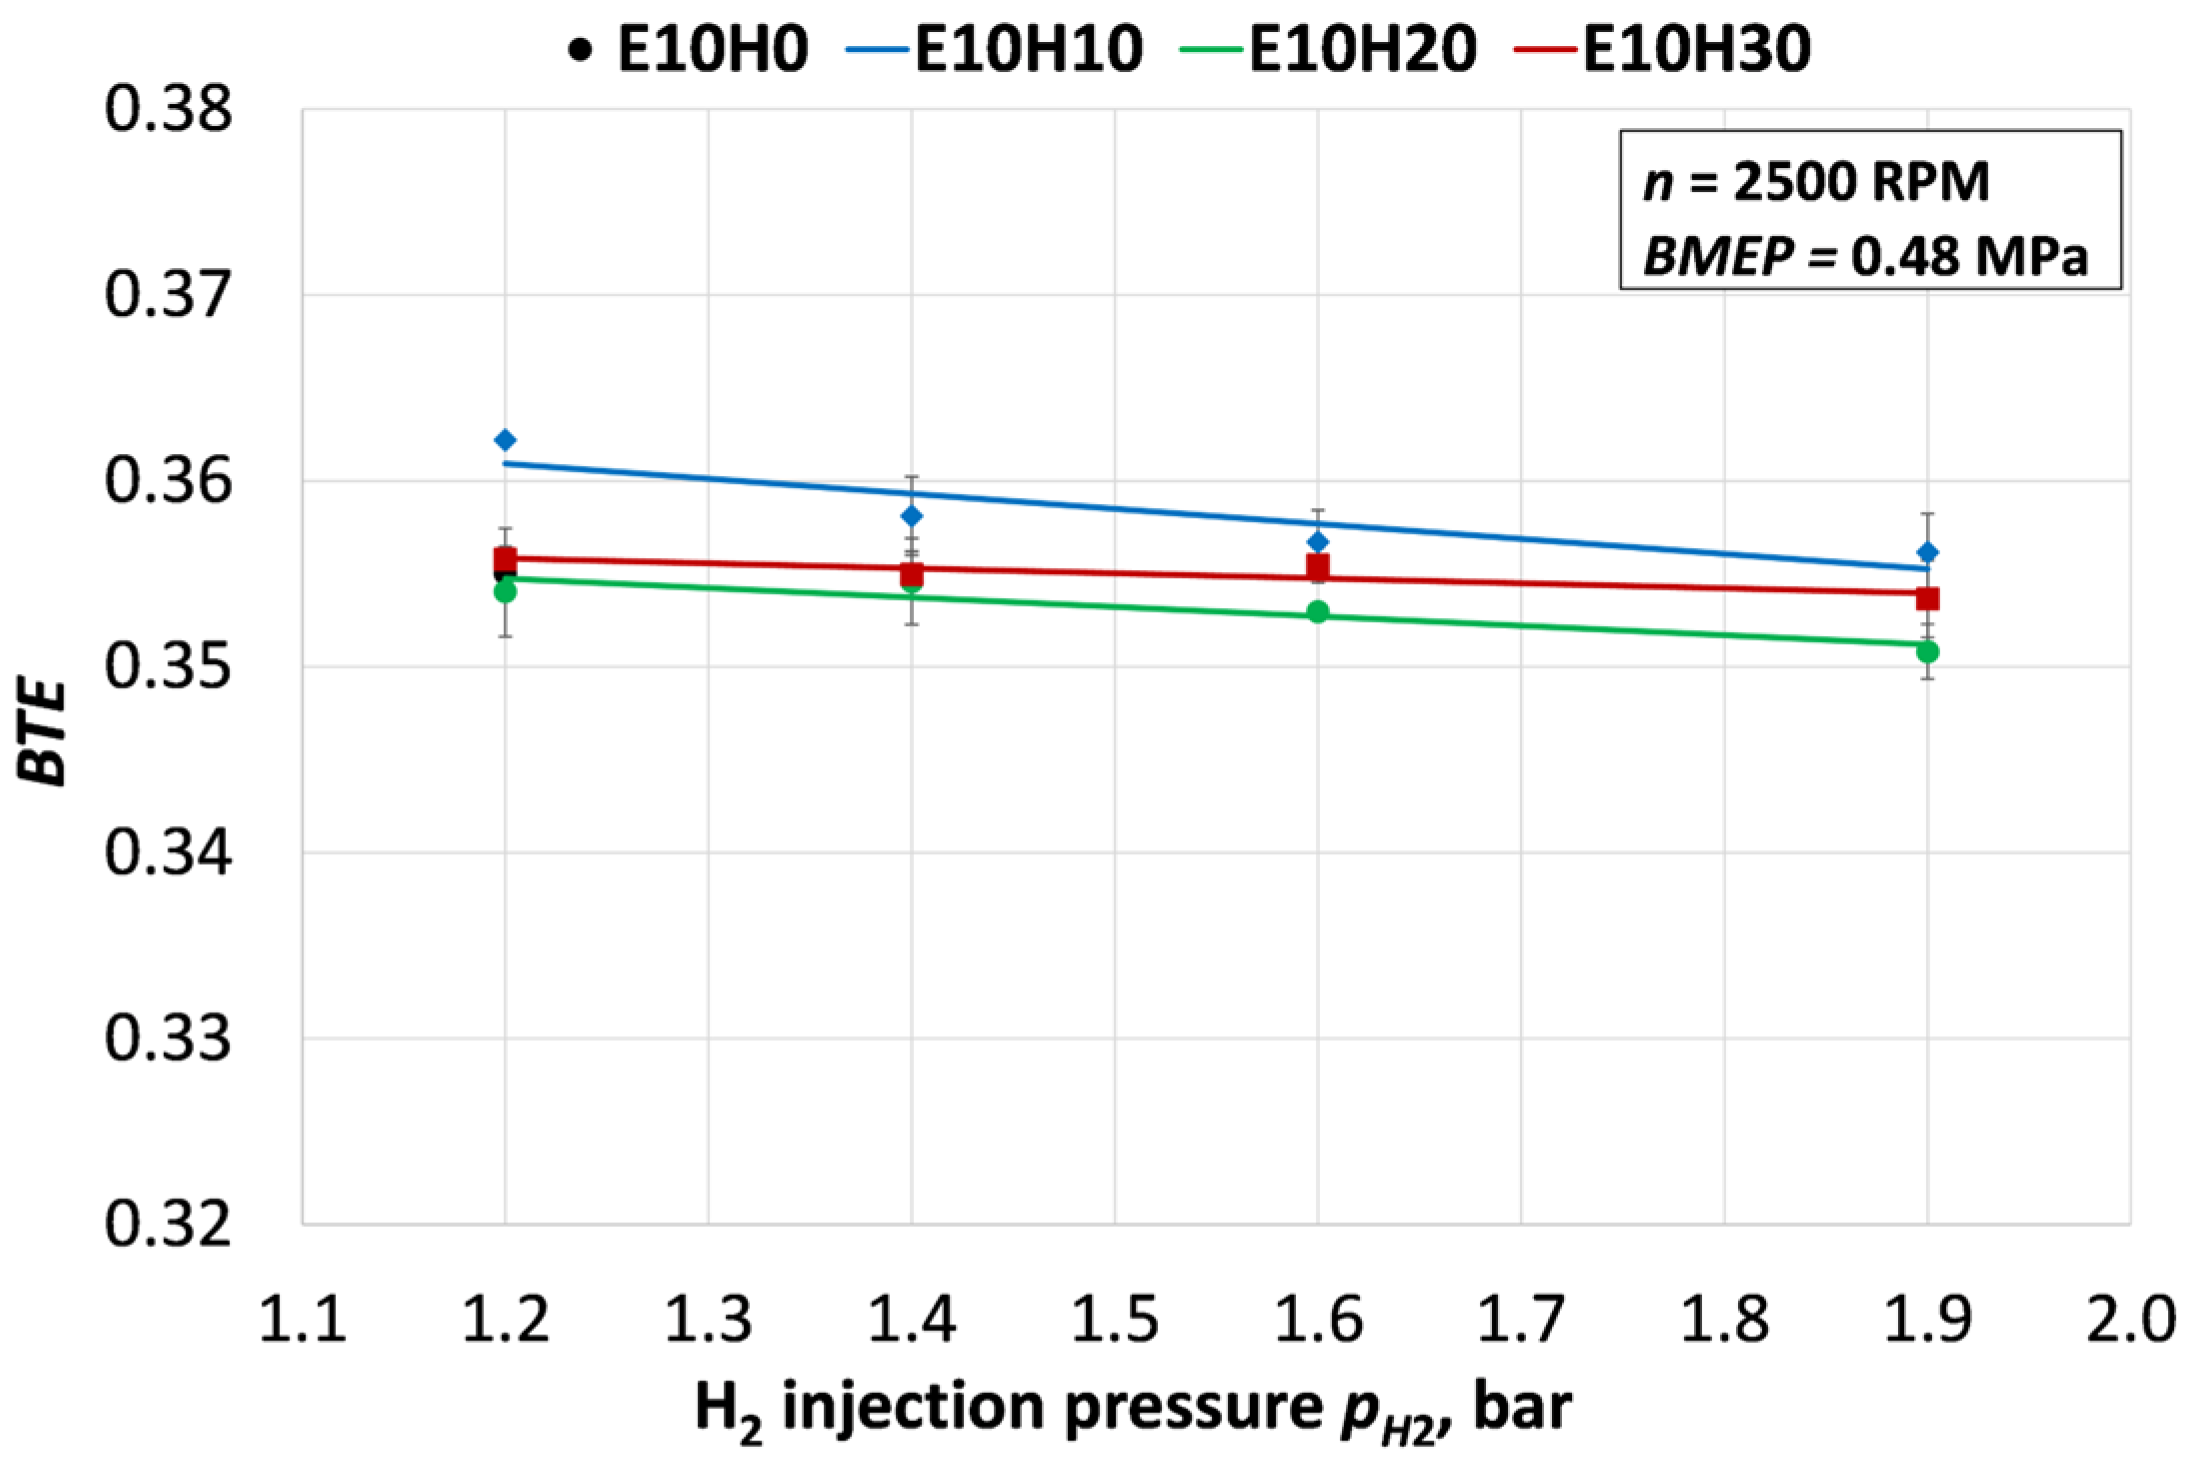
The variation in the Brake Thermal Efficiency (BTE) remains within a narrow range, from approximately 0.351 to 0.362 across the entire test spectrum (Figure 9). This limited variation in efficiency is attributed to the constant engine speed and load conditions, as well as the optimized ST, which was adjusted to ensure the peak in-cylinder pressure occurred at approximately 14–15 CAD after ATDC, where the pressure is most effectively converted into mechanical work and safe combustion is achieved while avoiding knocking. The highest BTE is achieved with an E10H10 fuel mixture and reaches a maximum value of ~0.362 at pH2 = 1.2 bar. This improvement is likely influenced by the slightly higher combustion rate and pressure increase observed in diagrams, indicating more efficient combustion compared to the baseline E10H0, which recorded a BTE of 0.355. Increasing pH2 to 1.9 bar resulted in a decreasing trend in BTE, with a reduction of up to 1.6%, primarily attributed to mixture formation dynamics. Higher injection pressure significantly shortened the injection duration required to deliver a given mass of H2, thereby reducing the available time for hydrogen-air mixing in the intake manifold. Consequently, a more stratified and less homogeneous mixture likely entered the cylinder, leading to localized rich and lean zones that ultimately degraded the overall combustion efficiency compared to the more continuous hydrogen delivery at 1.2 bar. For E10H20 and E10H30, increasing pH2 from 1.2 to 1.9 bar also reduced BTE, as observed for E10H0; however, the decrease in efficiency was smaller, reaching 0.9% and 0.6%, respectively. This suggests that, at higher H2 fractions, the larger amount of hydrogen is more likely to mix homogeneously with air when injected at a higher pressure.
In summary, since ST was retarded to achieve the presumed maximum efficiency, it is possible that a portion of the theoretical potential for hydrogen efficiency was not fully utilized because the ST did not reach the absolute optimal timing for these specific mixtures. Furthermore, the results indicate that increasing the pH2 within the investigated range is not an effective measure for enhancing engine efficiency. This is attributed to the fact that higher injection pressures result in a shorter injection duration, which leads to a less homogeneous mixture formation within the intake manifold compared to lower pressure injection strategies.

3.3. Ecological Indicators

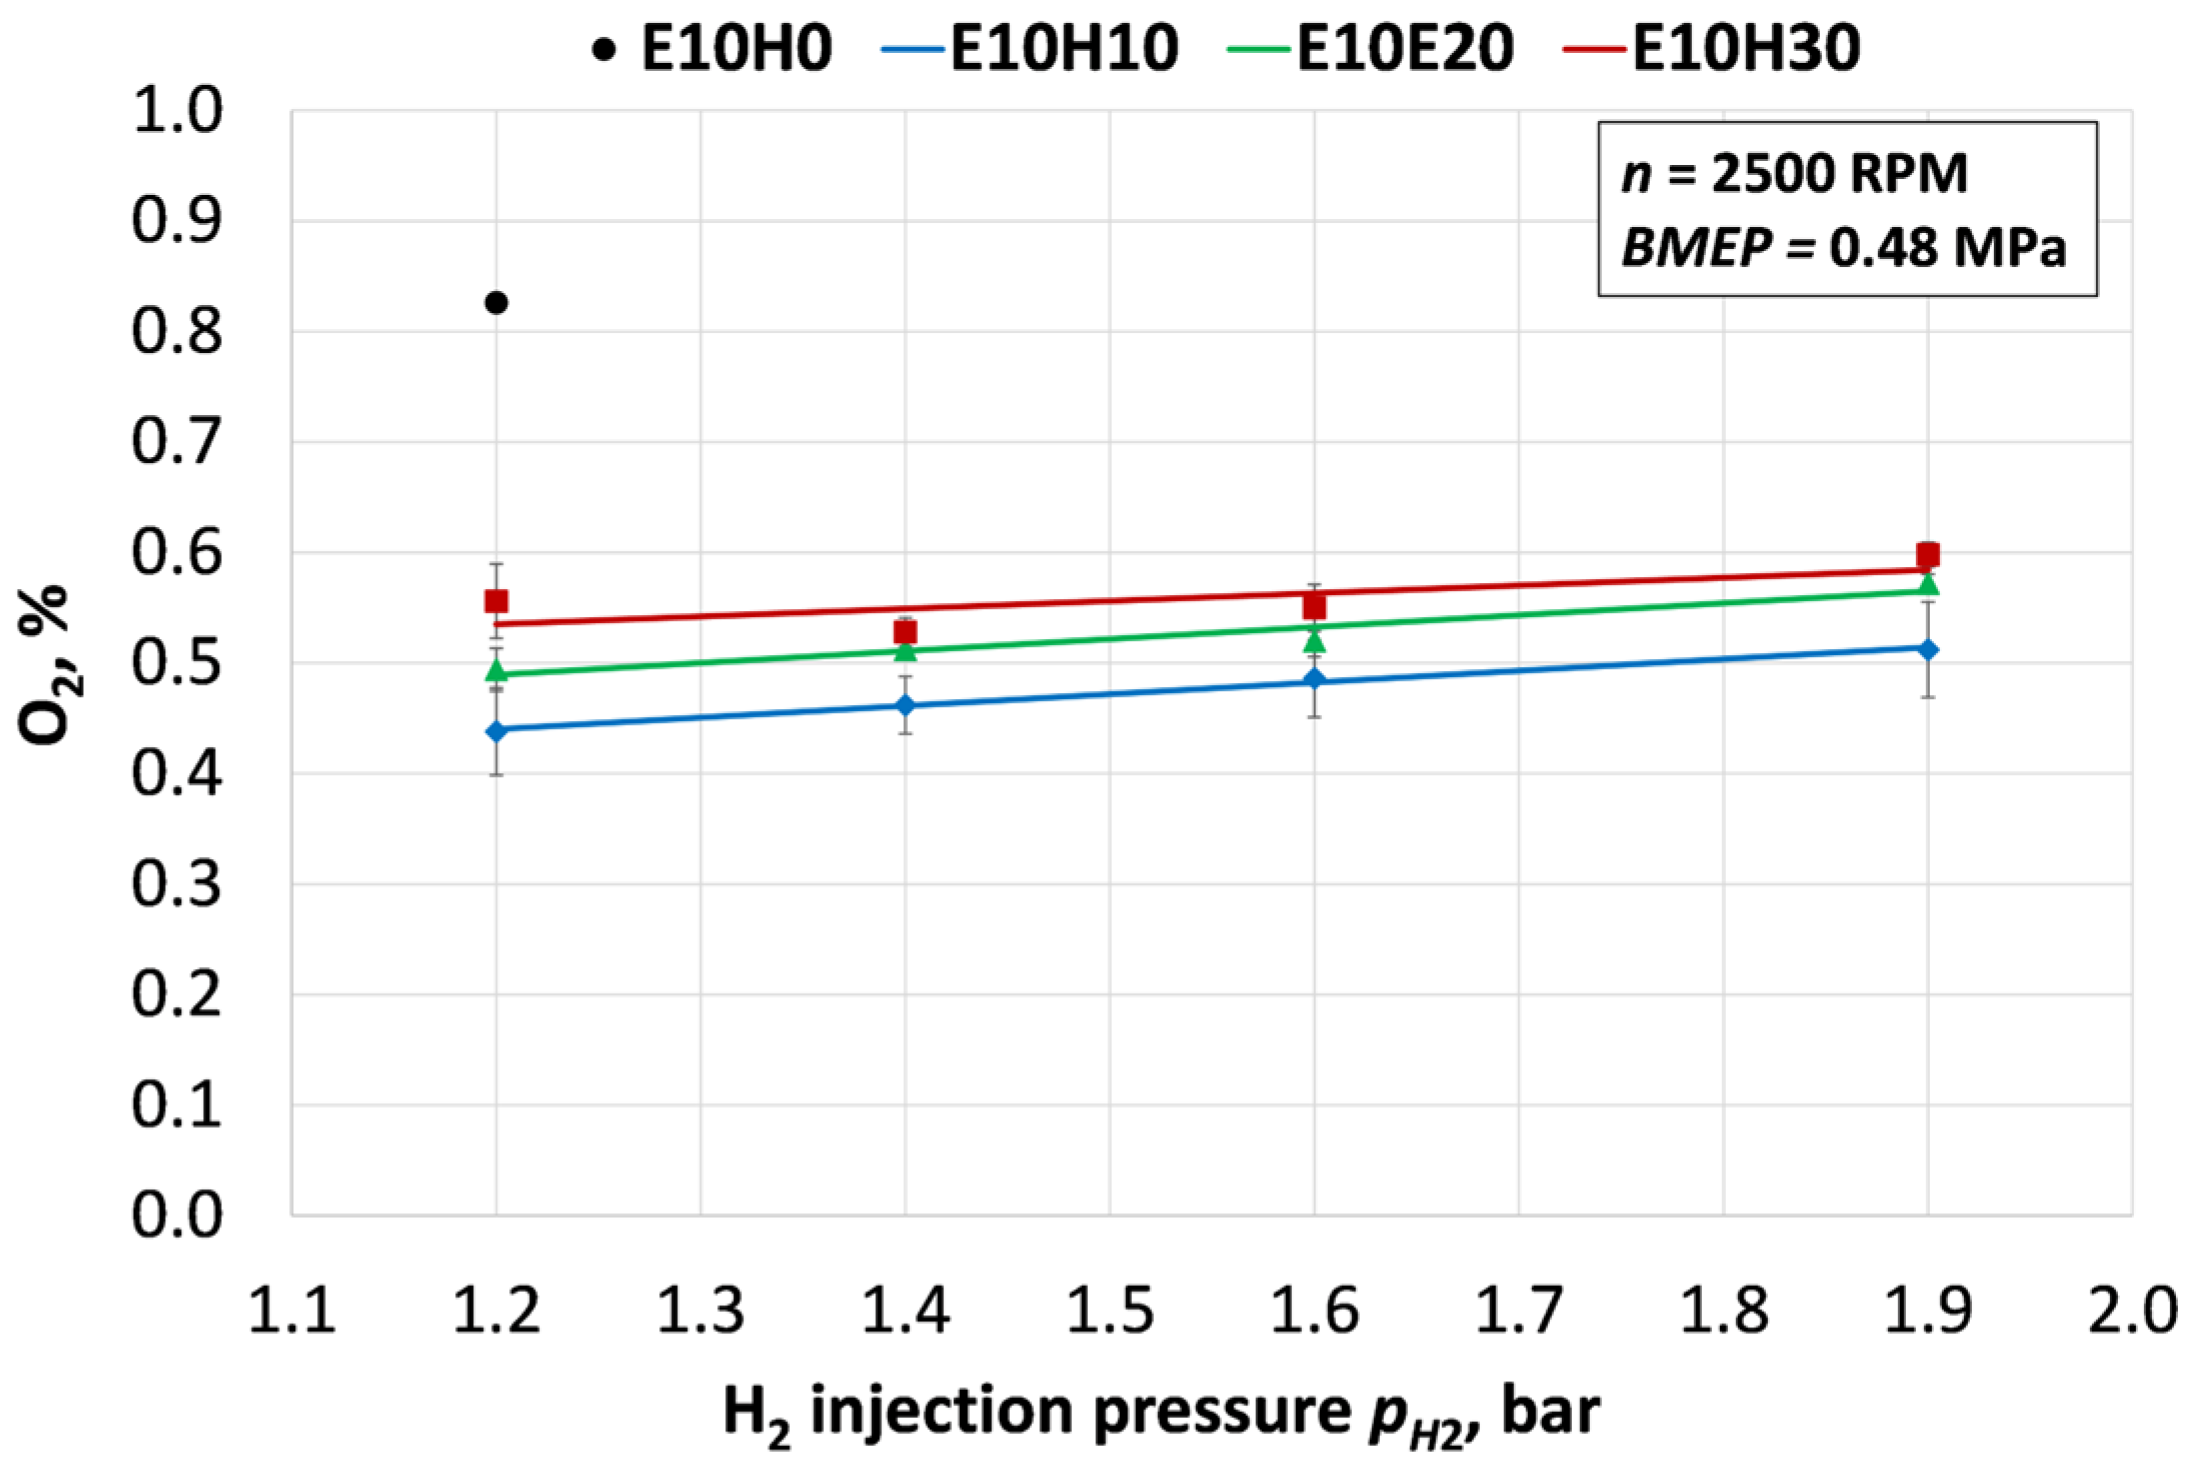
The oxygen (O2) concentration in the exhaust gas serves as an indicator for mixture formation and combustion quality. Throughout all research tests air-fuel mixture remained within the limits of a stoichiometric mixture, λ = 1. However, a noticeable decrease in O2 concentration is observed with the addition of H2 (Figure 10). Specifically, for the baseline E10H0, the O2 concentration is approximately 0.83%, whereas, with fuel mixtures with 10% H2, it drops to approximately 0.44%.
This indicates improved oxygen utilization, likely due to more homogeneous fuel–air mixture and better combustion quality resulting from the addition of 10% hydrogen by mass. However, in the E10H10 case, increasing the H2 injection pressure from 1.2 bar to 1.9 bar increased the exhaust O2 concentration from 0.44% to 0.52%, indicating a deterioration in combustion quality, probably due to reduced mixture homogeneity caused by excessively rapid hydrogen injection. At H2 mass fractions of 20% and 30%, the O2 concentration increased again to approximately 0.50–0.55%. This indicates less homogeneous mixture formation and the presence of locally lean regions, where part of the oxygen remained unconsumed. At the same time, oxygen deficiency may occur in locally rich combustion zones, while the overall mixture remains close to stoichiometric conditions. Similarly, increasing pH2 from 1.2 to 1.9 bar further increased the exhaust O2 concentration, reaching 0.6% in the H30 case. This effect is likely associated with the shorter H2 injection duration at higher injection pressure, which probably limits mixture homogenization in the intake manifold. Therefore, the observed increase in O2 concentration at higher injection pressure indicates poorer oxygen utilization and may explain the simultaneous increase in CO and HC emissions, together with the decreasing tendency in NOx emissions.
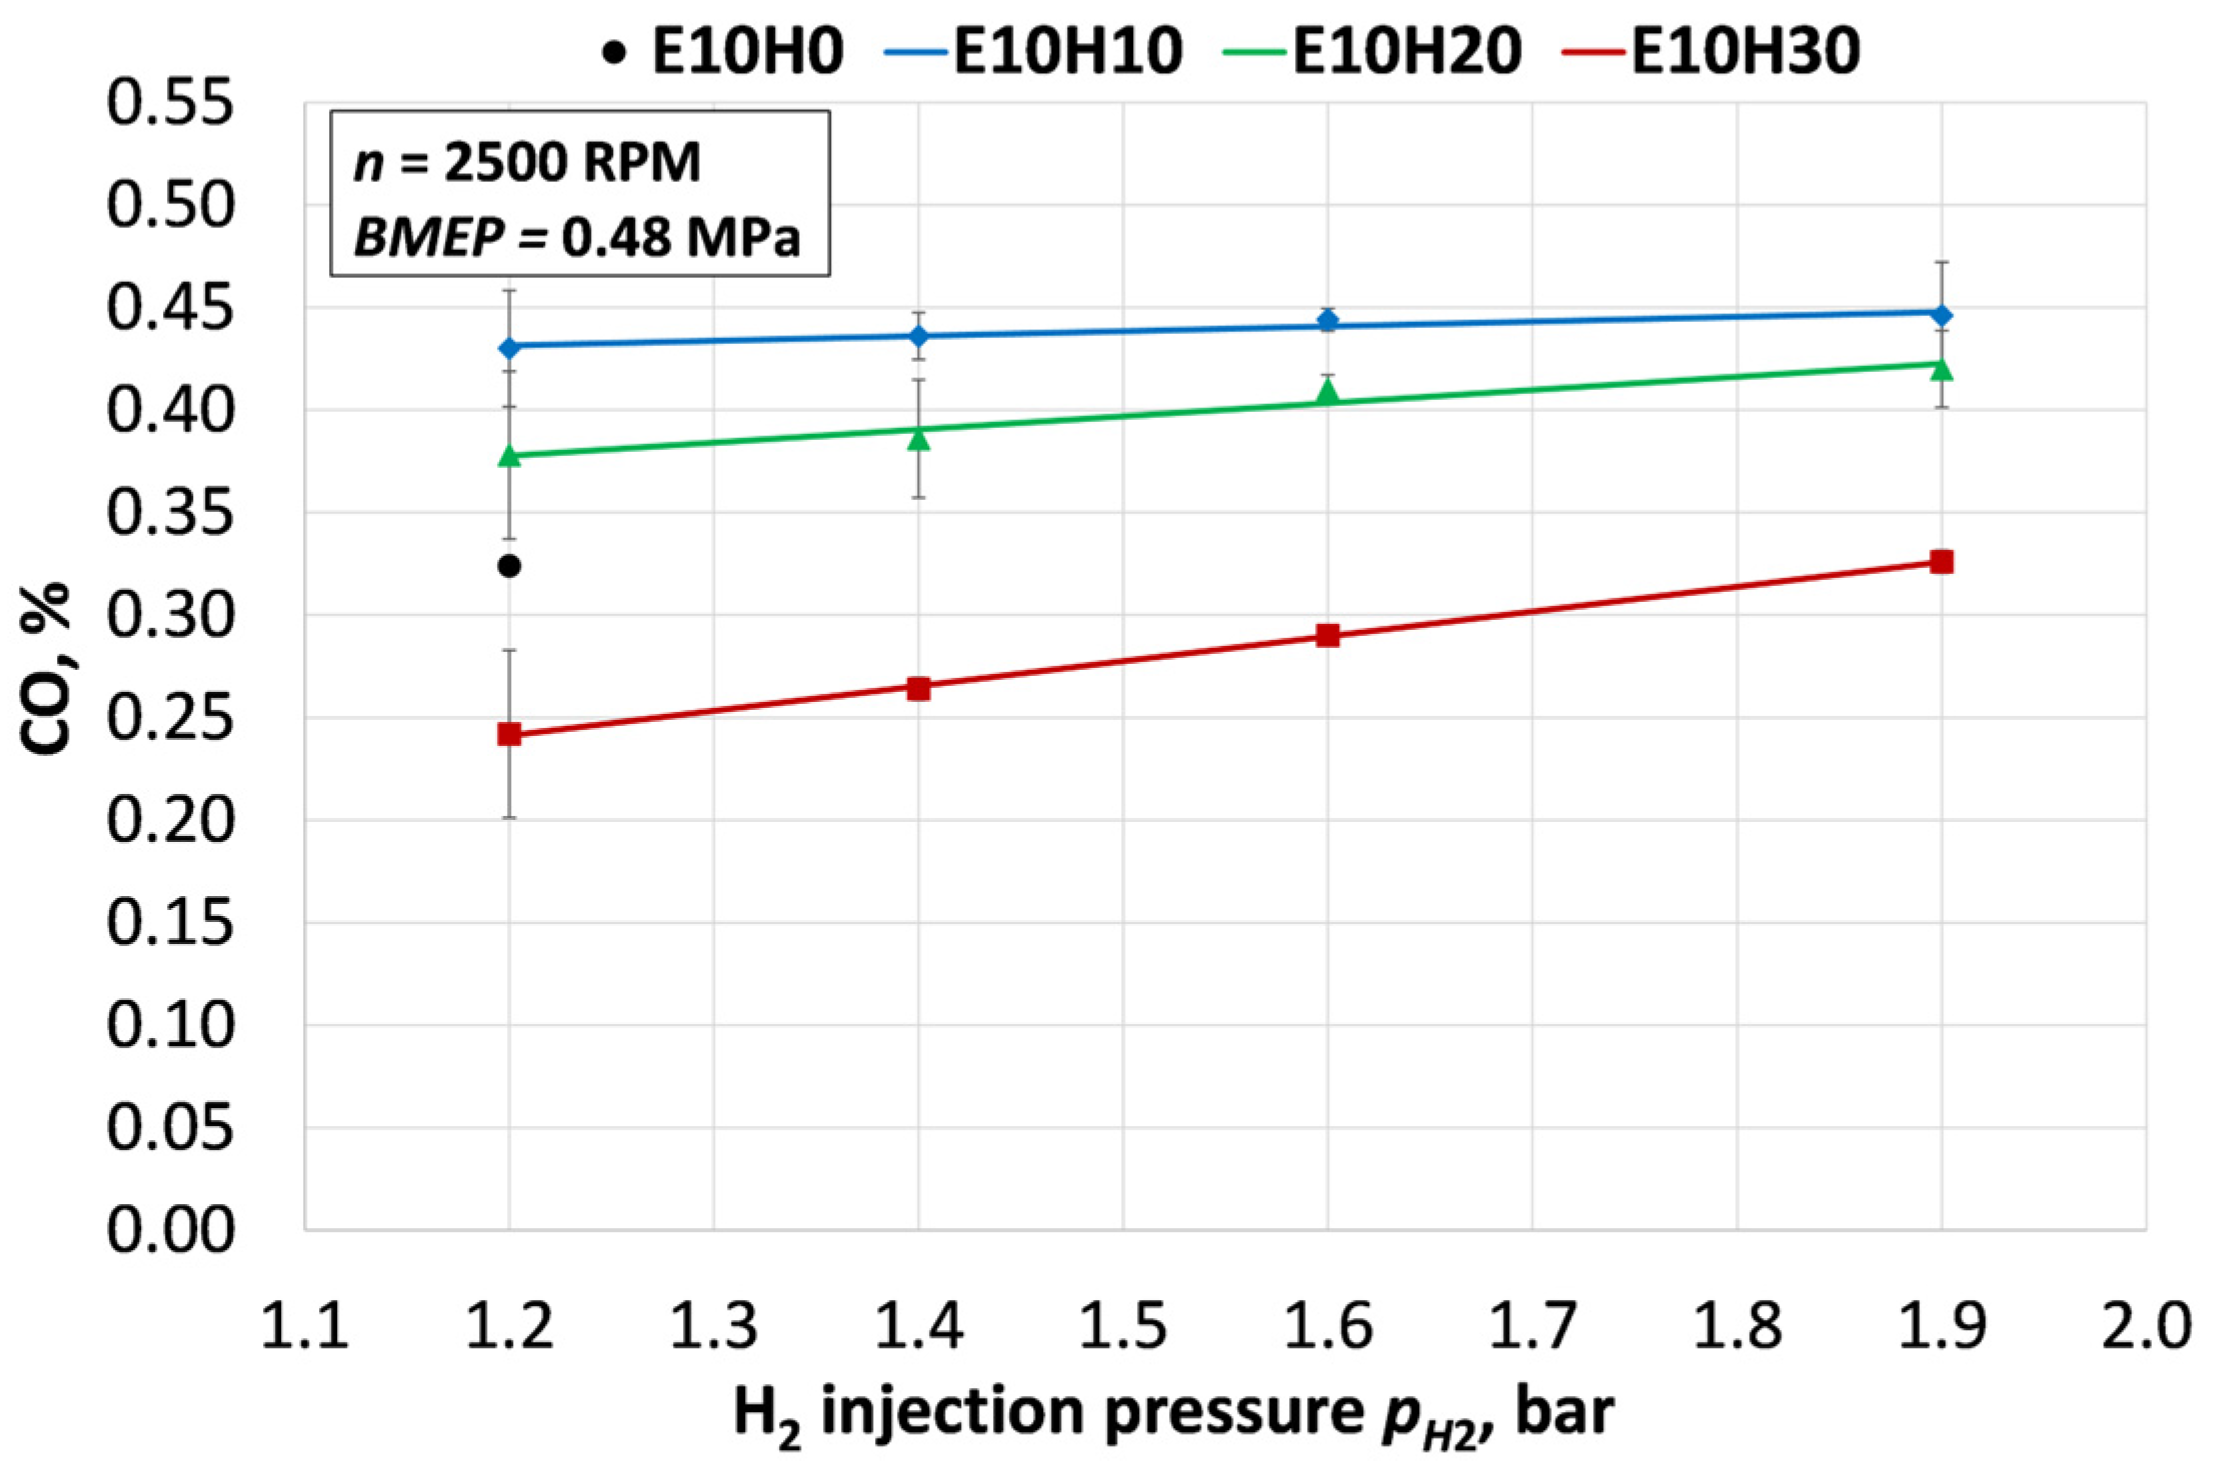
The carbon monoxide (CO) concentration in the exhaust gases, at 10% and 20% hydrogen mass fractions, exceeds the emissions of the engine operating on E10H0 (~0.32%) due to retarded ST and subsequent delayed oxidation during the expansion stroke. However, as the hydrogen mass fraction is further increased from 10% to 30%, CO emissions decrease (Figure 11). At high H2 concentrations, this reduction is primarily driven by the lower carbon-to-hydrogen (C/H) ratio of the fuel blend and the higher flame temperature of hydrogen, which promotes more intense combustion and oxidation of CO into CO2.
The influence of hydrogen injection pressure shows a trend, where increasing the pressure leads to a rise in CO concentration across all tested mixtures. For the E10H10 mixture, CO increases from ~0.43% to ~0.45% with rising pH2, for E10H20, it increases from ~0.38% to ~0.42%, and for E10H30, it rises from ~0.24% to ~0.33%. This increase is likely caused by the shorter injection duration at higher pressures, which impairs fuel-air mixing and leads to a decreased rate of complete oxidation of carbon molecules. CO emission levels remain highly sensitive to spark timing, combustion temperature, and the MBF during the expansion phase.
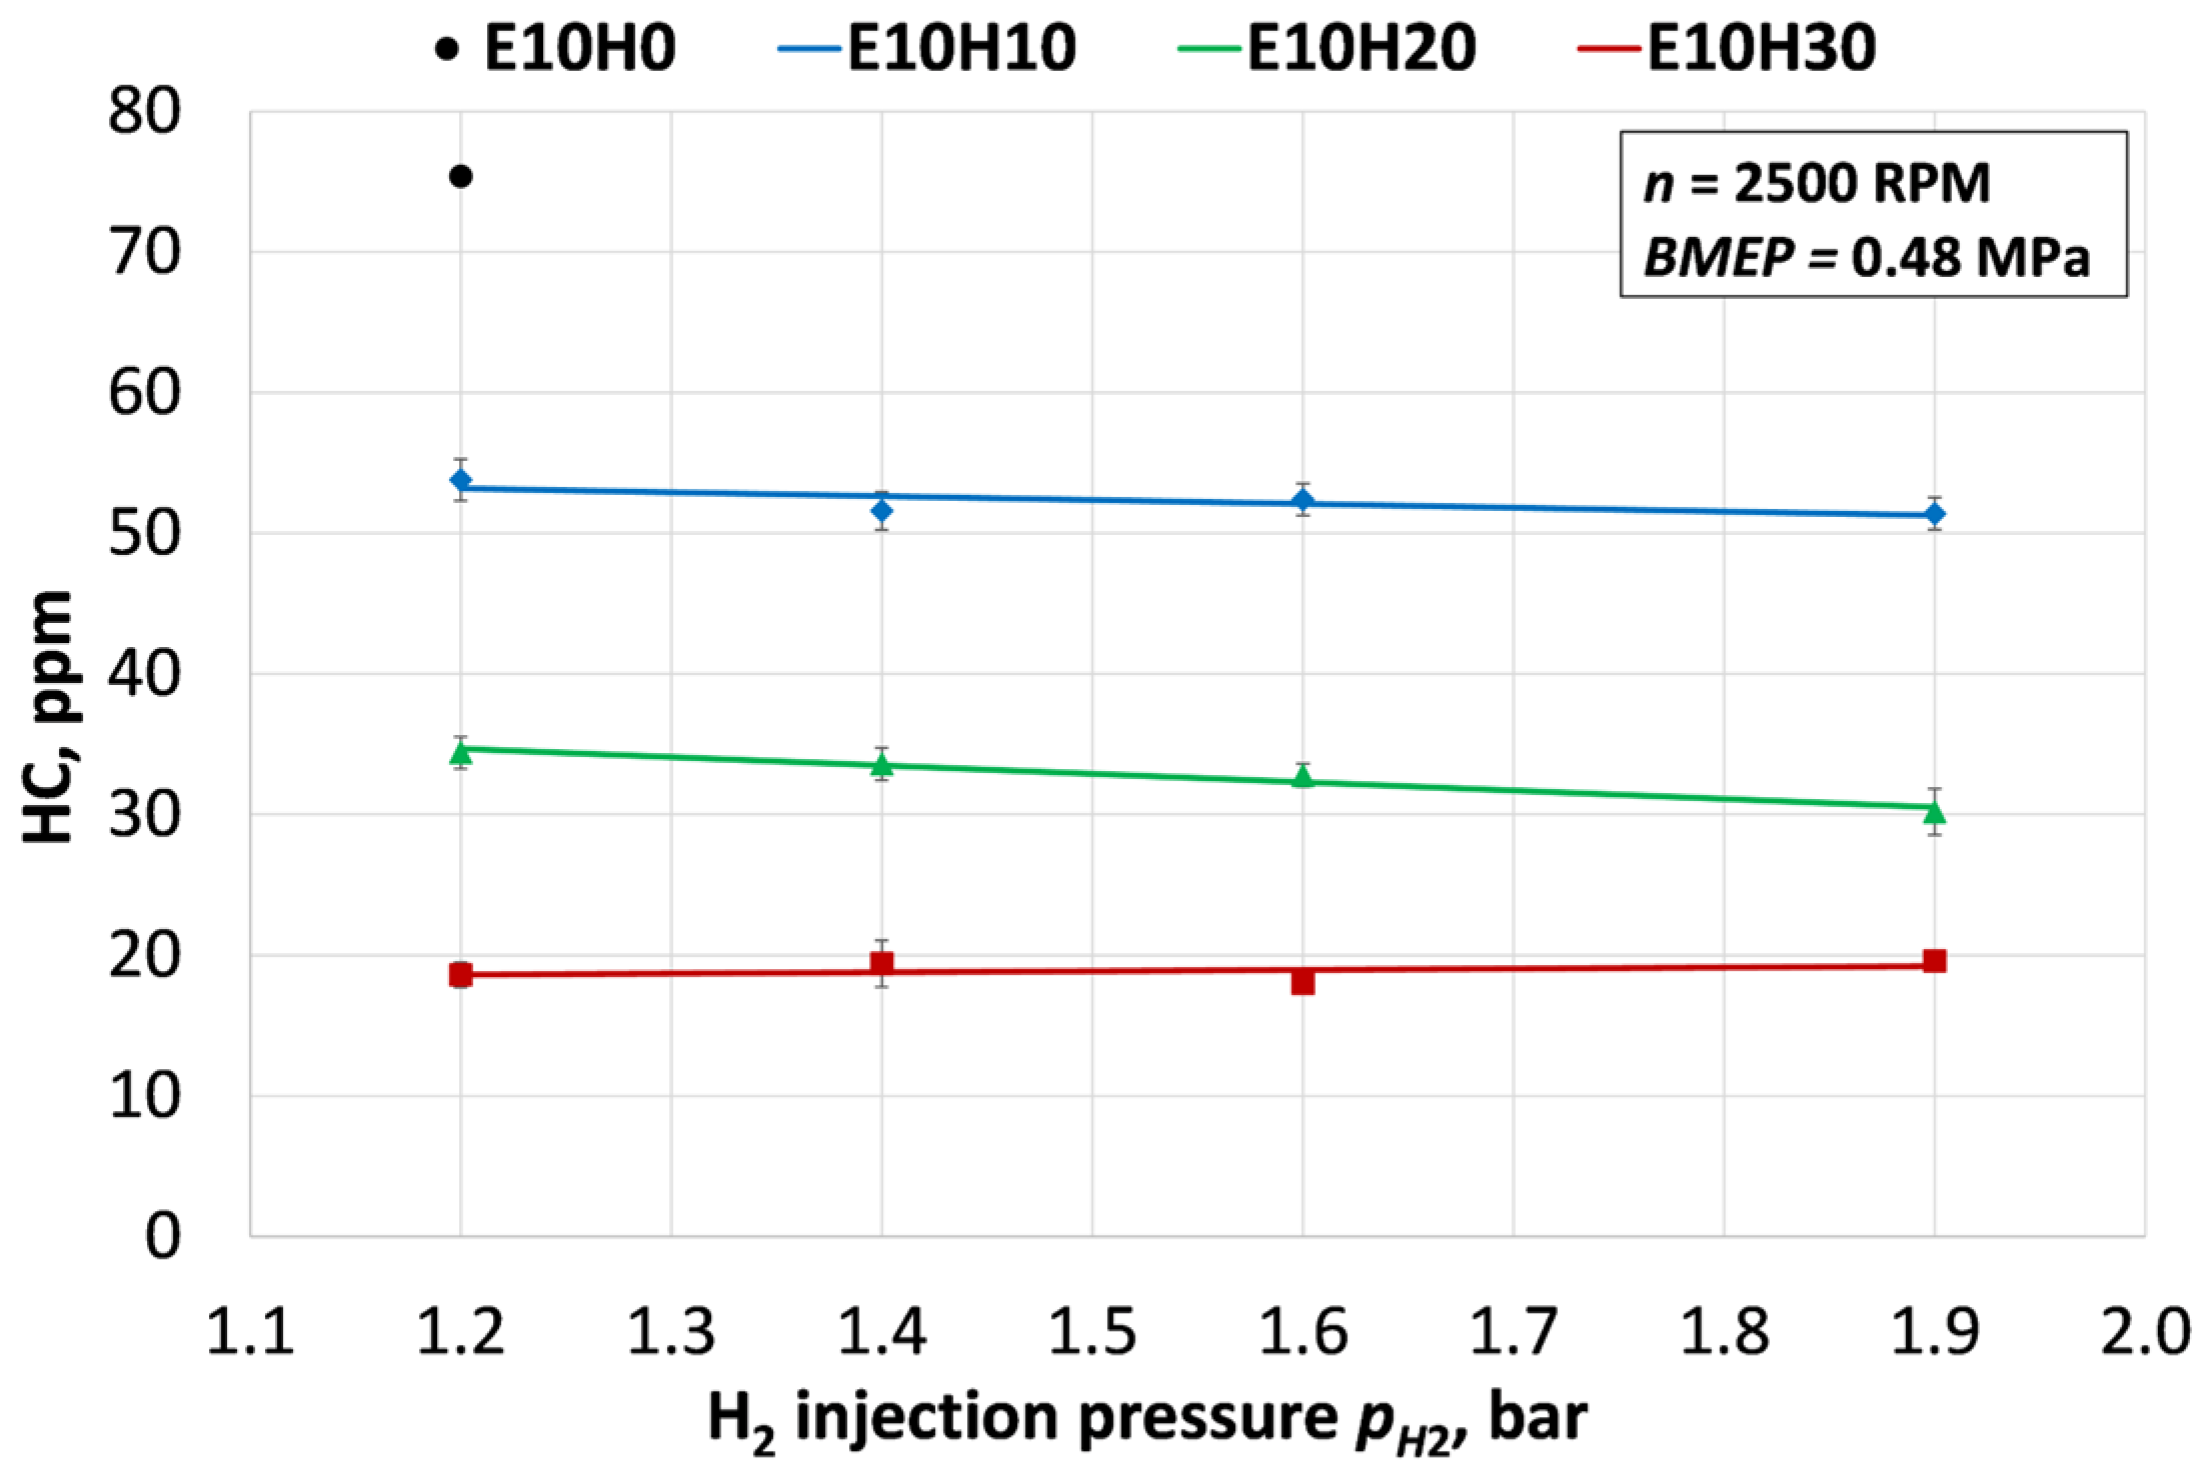
The influence of hydrogen concentration on the reduction in unburned hydrocarbon (HC) emissions is consistent across the tested range, as illustrated in Figure 12. This downward trend is primarily driven by the simpler molecular structure of the fuel blend and the higher combustion temperatures associated with hydrogen enrichment, where HC emissions for the baseline E10H0 of approximately 75 ppm decrease to 54–51 ppm for E10H10, 34–30 ppm for E10H20, and reach a minimum of 19–21 ppm for the E10H30 mixture. Unlike the tendency observed for CO or O2 emissions, an increase in the hydrogen injection pressure has a less significant impact on HC concentration, indicating that the chemical kinetics of hydrogen-enhanced combustion dominate over the minor variations in mixture homogeneity likely caused by the injection pressure within the investigated range. However, as the H2 injection pressure increases from 1.2 to 1.9 bar, a decreasing tendency in HC emissions is observed for the 10% H2 case, whereas an increasing tendency is observed for the 30% H2 case. This suggests that, at low H2 concentration, higher injection pressure may slightly improve mixture preparation and HC oxidation. In contrast, at high H2 concentration, the shorter injection duration and potentially less homogeneous mixture formation may lead to locally unfavorable combustion zones, causing a slight increase in HC emissions despite the overall strong HC reduction achieved through hydrogen enrichment.
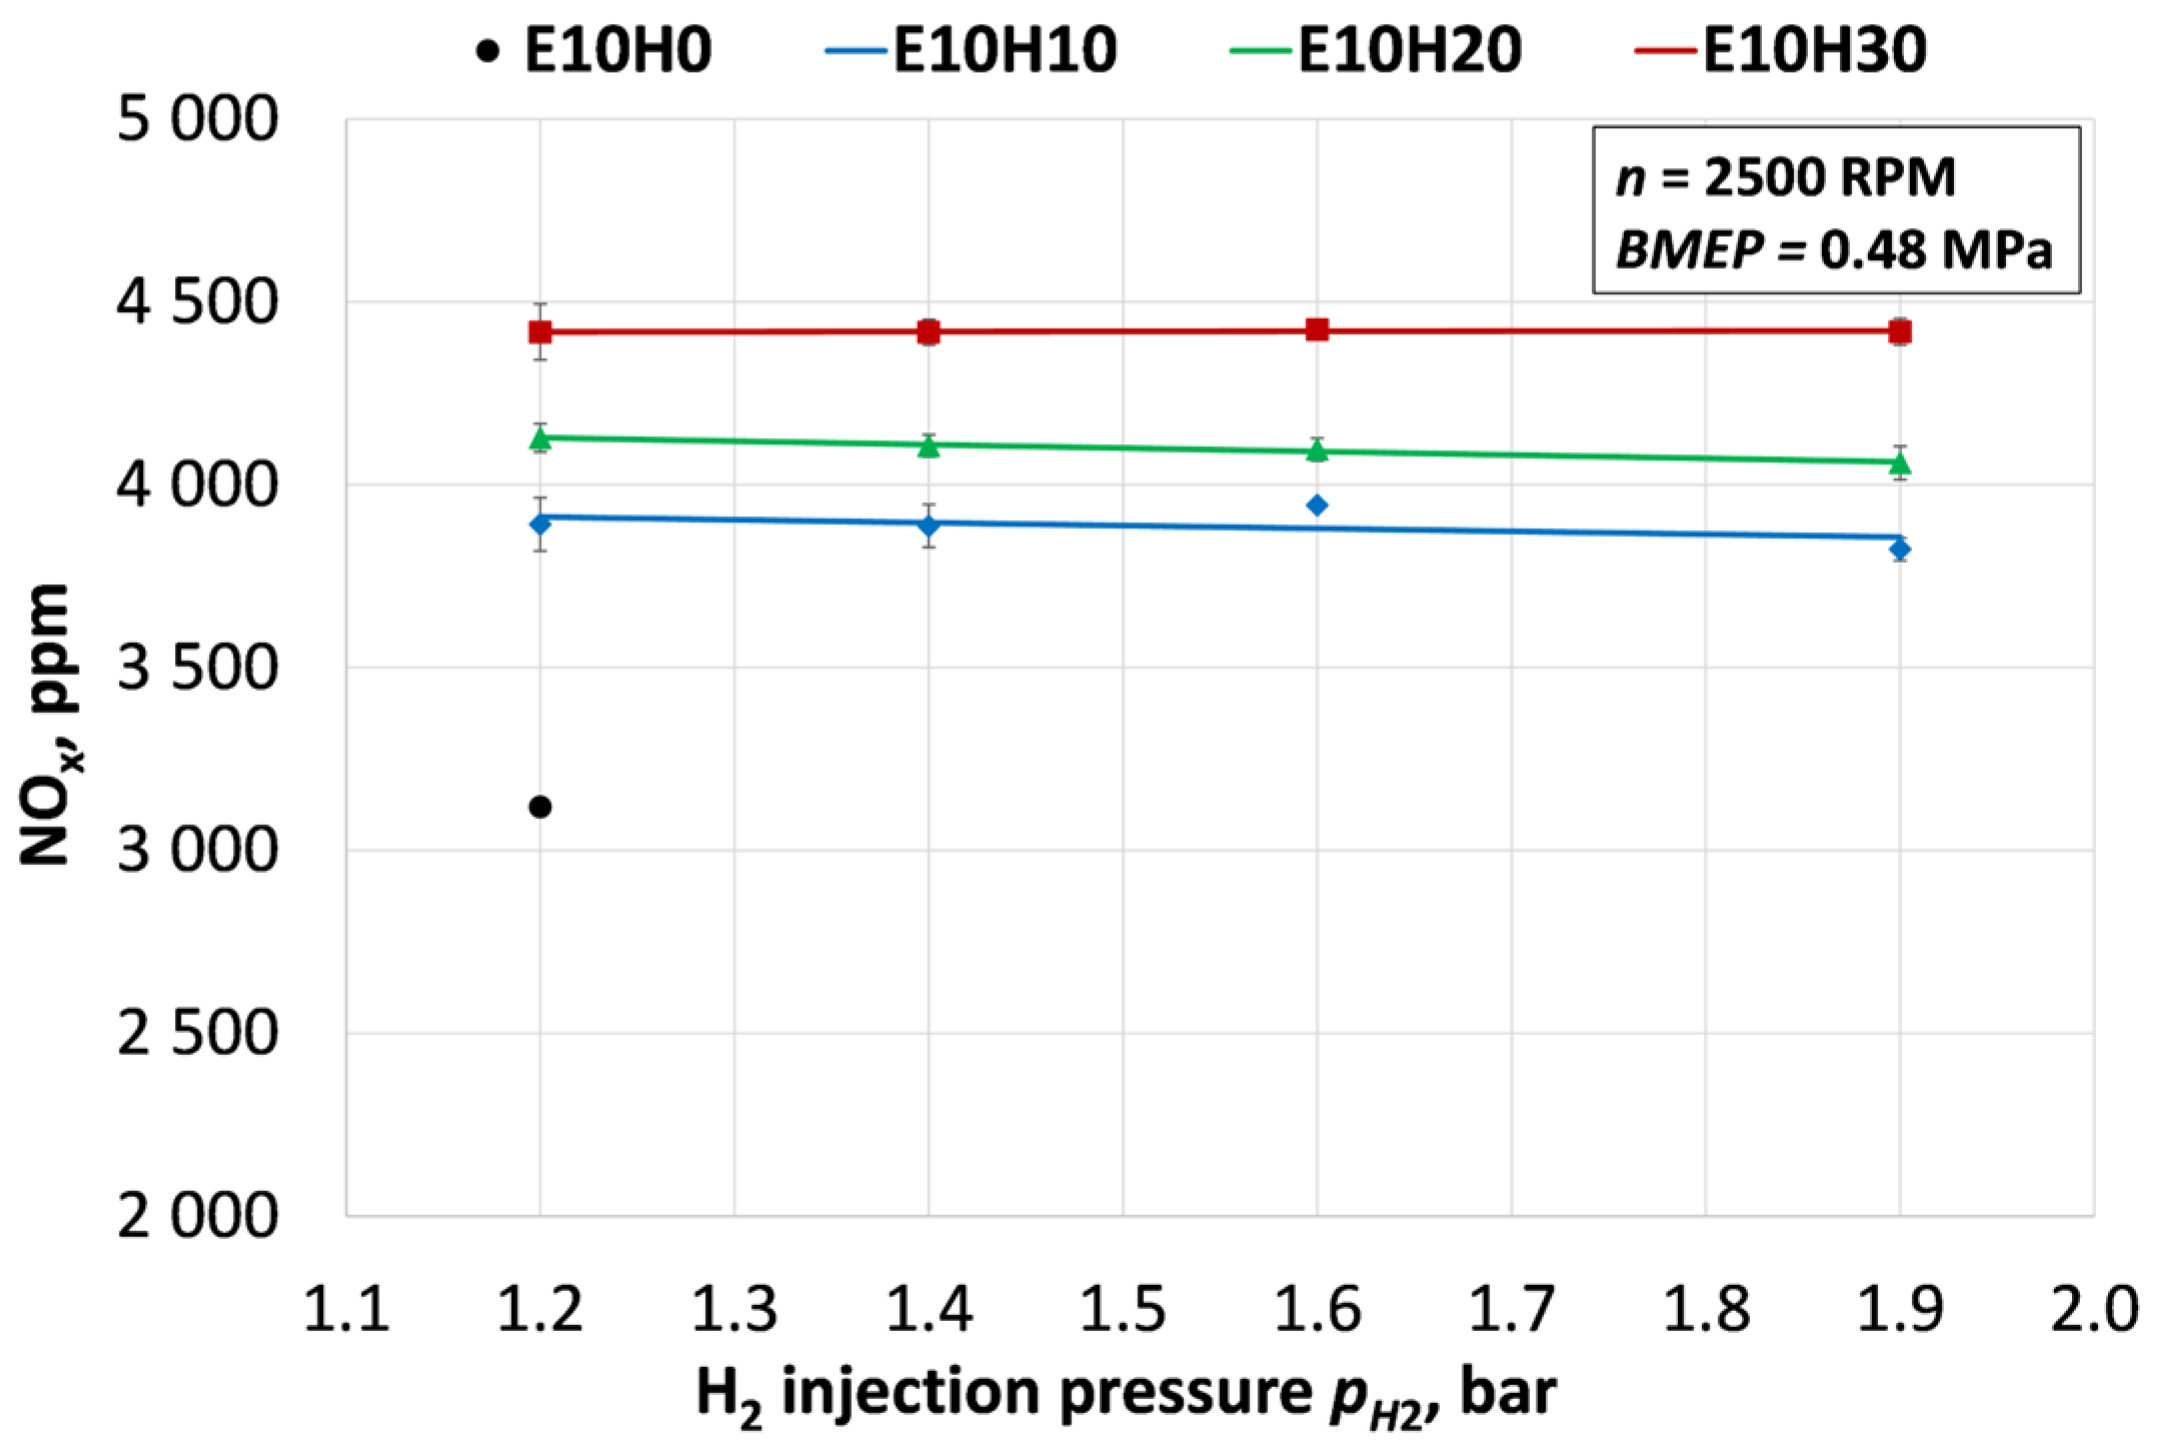
The concentration of nitrogen oxides (NOx) in the exhaust gases increases with higher hydrogen mass fractions, as shown in Figure 13. This is because hydrogen increases combustion temperatures and intensifies heat release rates, which promote NOx formation even under retarded spark timing conditions. For the baseline E10H0, NOx emissions are approximately 3120 ppm, whereas the values rise to 3944–3824 ppm for E10H10, 4123–4060 ppm for E10H20, and reach 4438–4239 ppm for the E10H30 mixture. This increase is consistent with the thermal NOx formation mechanism, where the presence of hydrogen accelerates the chemical kinetics and leads to higher localized peak temperatures within the cylinder.
Interestingly, as the hydrogen injection pressure increases from 1.2 bar to 1.9 bar, a slight downward trend in NOx concentration is observed at H2 mass fractions of 10% and 20%. This decline aligns with the hypothesis of decreasing combustion quality at higher injection pressures, when the hydrogen concentration is relatively low. This interpretation is further supported by the previously noted increases in O2 and CO concentrations and the slight reduction in brake thermal efficiency. The reduced NOx levels at higher pH2 likely result from decreased peak combustion temperatures caused by less optimal mixture preparation and a shorter injection duration, which leads to a higher degree of mixture stratification. Consequently, while higher hydrogen content inherently increases thermal NOx production, the variations in pH2 introduce secondary effects that slightly mitigate this trend due to less efficient oxidation and lower overall cycle temperatures. However, at an H2 mass fraction of 30%, increasing pH2 has no noticeable effect on NOx concentration. In this case, the larger amount of injected hydrogen may promote more effective mixture formation even at higher injection pressure, thereby maintaining or slightly improving combustion quality.
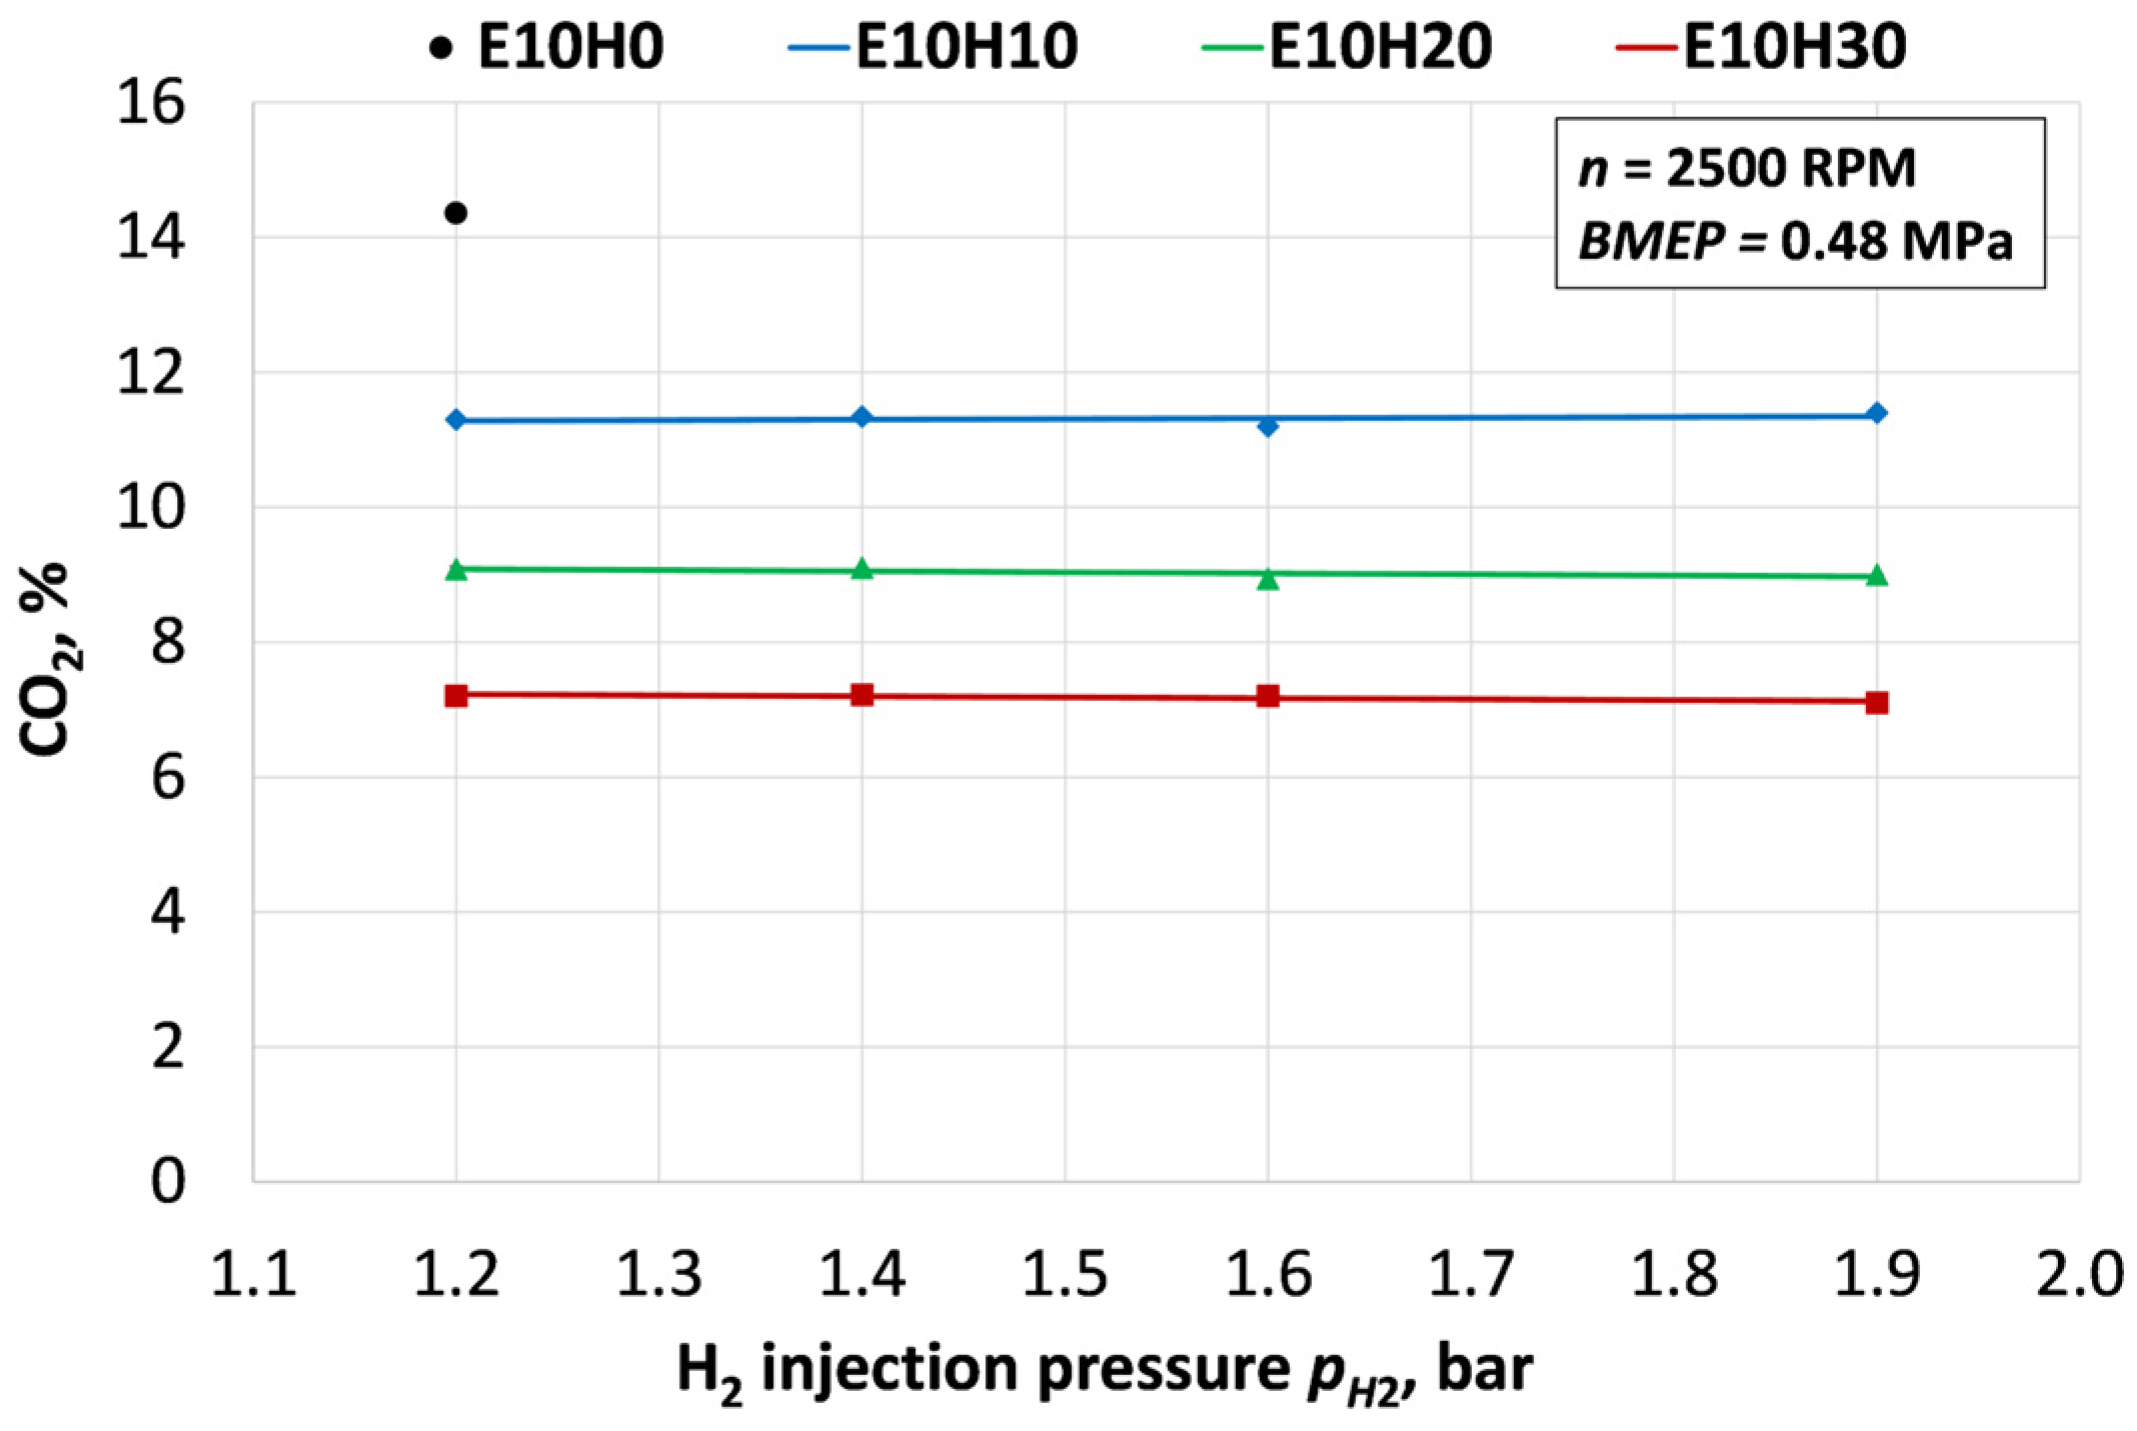
The reduction of carbon dioxide (CO2) concentration in the exhaust gases is due to increased hydrogen mass fraction and reduced overall carbon content of the fuel blend (Figure 14). For the baseline E10H0, the CO2 concentration is approximately 14.4%, whereas it decreases relatively by 21% for E10H10, 37% for E10H20, and reaches a reduction of 50% for the E10H30 mixture. This downward trend is primarily attributed to the displacement of carbon-containing gasoline molecules with hydrogen, which results in a lower C/H ratio and, consequently, reduced CO2 formation during the combustion process. As the pH2 increases, the CO2 concentration remains relatively stable. Any potential increase in CO2 resulting from the marginal rise in fuel consumption and slight decrease in efficiency is offset by the marginally deteriorating combustion quality observed at higher injection pressures.
Under the investigated engine operating conditions (n = 2500 RPM, BMEP = 0.48 MPa), increasing the hydrogen injection pressure beyond 1.2 bar is not advantageous, particularly at lower H2 concentrations. However, it is probable that at higher engine speeds and loads, where larger quantities of hydrogen must be delivered within shorter timeframes, an increase in pH2 would be necessary to ensure the effective injection of the required fuel mass into the intake air. Across different operating regimes and varying hydrogen mass fractions, and within the context of systematic ST retardation and mixture formation strategies, adjusting pH2 can serve as a critical tool for finding an optimal compromise between competing performance indicators, specifically the trade-offs among incomplete combustion products, such as CO and HC, thermal NOx emissions, greenhouse CO2 emissions, and brake thermal efficiency.
A limitation of the present study is that the local homogeneity of the hydrogen–air–gasoline mixture was not directly measured using optical imaging, gas sampling, or computational fluid dynamics (CFD) analysis. Therefore, the discussion of mixture preparation is based on indirect indicators, including injection duration, combustion phasing, ROHR, MBF, BTE, and the trends in exhaust O2, CO, HC, and NOx emissions. In future work, experimental tests of an engine operating with hydrogen enrichment are planned to be combined with CFD analysis in order to quantitatively assess the local distribution of H2 and its relationship with combustion stability and emissions.

4. Conclusions

This study showed that, under medium-load and medium-speed spark-ignition engine operation, and within the investigated hydrogen injection pressure range of pH2 = 1.2–1.9 bar, the H2 mass fraction had the dominant influence on combustion, energy, and emission indicators, whereas H2 injection pressure acted mainly as a secondary parameter affecting mixture formation.
Increasing the H2 mass fraction intensified the combustion process. The ignition delay was shortened, the maximum rate of pressure rise increased by approximately 10% for E10H10 and 17% for E10H30, while the maximum ROHR increased by approximately 20% and 42%, respectively. These changes were mainly caused by the higher reactivity of hydrogen and its faster flame propagation, which were partially controlled by spark timing retardation. The maximum in-cylinder temperature increased from 2598 K for E10H0 to 2758 K for E10H10 and 2934 K for E10H30. Although the spark timing was retarded to avoid knocking and to maintain the maximum in-cylinder pressure at approximately 14–15 CAD ATDC, the higher H2 fraction still increased the heat release intensity and thermal load.
The effect of H2 injection pressure depended on the H2 mass fraction; however, its overall influence was minor. At 10% H2, the lower injection pressure of 1.2 bar was more favorable, as the longer injection duration likely promoted better mixture homogenization and faster combustion; MFB50 was shortened by approximately 0.4 CAD compared with the 1.9 bar case. At 30% H2, the higher injection pressure of 1.9 bar became more favorable, reducing MFB50 by approximately 0.3 CAD, most likely due to more effective delivery of the larger hydrogen amount during the intake stroke.
Hydrogen enrichment reduced BSFC, primarily due to the higher lower heating value of hydrogen-containing fuel blends. However, BTE varied only within a narrow range of 0.351–0.362, with the highest value obtained for the 10% H2 case. Increasing pH2 from 1.2 to 1.9 bar generally reduced BTE, with the largest decrease of approximately 1.6% observed at 10% H2, while the decrease was smaller at higher H2 fractions. This indicates that the efficiency was affected by the combined influence of H2 quantity, injection pressure and duration, mixture homogeneity, and oxygen utilization. Nevertheless, increasing the injection pressure did not have a positive effect, especially at the low H2 concentration of 10%.
Increasing the H2 mass fraction reduced carbon-related emissions. HC emissions decreased by up to approximately 73% at 30% H2, while CO2 concentration decreased by up to approximately 50% compared with E10H0. These reductions were mainly caused by the lower carbon content of the fuel blend and more intensive oxidation in the hydrogen-enriched mixture. However, at 10% and 20% H2, CO concentration increased compared with the baseline case, indicating that the shorter mixture preparation time and retarded combustion phase could outweigh the positive effect of hydrogen on CO oxidation. Increasing pH2 had only a minor effect on HC emissions, whereas CO emissions tended to increase, most likely due to less homogeneous mixture formation and poorer oxygen utilization.
The main negative effect of hydrogen enrichment was the increase in NOx emissions. NOx concentration increased from approximately 3120 ppm for E10H0 by about 25% for E10H10 and up to about 40% for E10H30. This was associated with higher in-cylinder temperatures and more intensive heat release. However, at lower H2 fractions, increasing pH2 slightly reduced NOx, likely because less homogeneous mixture formation and lower local peak temperatures suppressed thermal NOx formation.
Overall, under the investigated operating conditions, increasing pH2 above 1.2 bar was not advantageous, particularly at the lower tested H2 fraction of 10%. Further studies over a wider range of engine speeds, loads, hydrogen fractions, injection pressures, and CFD-based analysis are required to more accurately predict the role of H2 injection pressure. To achieve an optimal compromise between faster and thermally efficient combustion, reduced CO, HC, and CO2 emissions, and controlled NOx formation, H2 mass fraction, injection pressure, and spark timing must be optimized in future comprehensive studies over an extended operating range.

Author Contributions

Conceptualization, S.P. and A.R.; methodology, D.K. and S.S.; software, A.R. and A.U.; validation, A.R., A.U. and T.V.; formal analysis, S.P.; investigation, S.P., G.M., D.K. and S.S.; resources, S.P.; data curation, A.R. and A.U.; writing—original draft preparation, A.R., T.V. and D.K.; writing—review and editing, S.P., G.M. and S.S.; visualization, A.R., G.M. and D.K.; supervision, S.P.; project administration, S.P.; funding acquisition, S.P. All authors have read and agreed to the published version of the manuscript.

Funding

Research was conducted as part of the execution of Project “Mission-driven Implementation of Science and Innovation Programmes” (No. 02-002-P-0001), funded by the Economic Revitalization and Resilience Enhancement Plan “New Generation Lithuania”.

Data Availability Statement

The data presented in this study are available on request from the corresponding author.

Acknowledgments

A part of the results included in this study have been obtained using internal engine simulation software AVL BOOST™ acquired by signing a Cooperation Agreement between AVL Advanced Simulation Technologies and the Faculty of Transport Engineering of Vilnius Gediminas Technical University.

Conflicts of Interest

The authors declare no conflicts of interest.

Abbreviations

The following abbreviations are used in this manuscript:
ABDCAfter bottom dead center
ATDCAfter top dead center
BBDCBefore bottom dead center
BMEPBrake mean effective pressure
BSECBrake specific energy consumption
BSFCBrake-specific fuel consumption
BTDCBefore top dead center
BTEBrake thermal efficiency
CADCrank angle degree
CFDComputational fluid dynamics
C/HCarbon-to-hydrogen ratio
COCarbon monoxide
CO2Carbon dioxide
E10H0Petrol blend containing 10% ethanol and 0% hydrogen by mass
E10H10Petrol blend containing 10% ethanol and 10% hydrogen by mass
E10H20Petrol blend containing 10% ethanol and 20% hydrogen by mass
E10H30Petrol blend containing 10% ethanol and 30% hydrogen by mass
H2Hydrogen
HCUnburned hydrocarbons
IDIgnition delay
LHVLower heating value
MFBMass fraction burned
MFB50Crank angle at which 50% of the fuel mass is burned
MFB90Crank angle at which 90% of the fuel mass is burned
NOxNitrogen oxides
O2Oxygen
pH2Hydrogen injection pressure
ROHRRate of heat release
SOCStart of combustion
STSpark timing

References

  1. Kluge, K.; Pehlivanlar, B.; Wenzel, H.; Günther, M.; Pischinger, S.; Abel, D. Reduced Order Model with Non-Linear Parameter Optimization for Hydrogen Combustion Engine Control. In Proceedings of the 2023 IEEE Conference on Control Technology and Applications (CCTA); IEEE: Bridgetown, Barbados, 2023; pp. 287–294. [Google Scholar]
  2. Guido, C.; De Simio, L.; Napolitano, P.; Cerbone, D. Use of Natural Gas/Hydrogen Blends in Heavy-Duty Spark Ignition Engines: Outcomes from an Experimental Campaign and Methodologies for on-Board H2 Blending Ratio Determination. Appl. Therm. Eng. 2025, 280, 128118. [Google Scholar] [CrossRef] [Scilit]
  3. Zhang, W.; Cui, M.; Fu, J.; Qiu, S.; Li, X.; Nour, M.; Xu, M. Comprehensive Experimental Study on Spray Dynamics, Combustion Performance, and Emission Profiles of Ethanol-Gasoline and Butanol-Gasoline Mixtures in a Constant Volume Combustion Chamber under Cold Start GDI Conditions. Renew. Energy 2026, 264, 125561. [Google Scholar] [CrossRef] [Scilit]
  4. Nour, M.; Zhang, W.; Cui, M.; Li, X.; Xu, M.; Qiu, S. Flash Boiling Impact on Spray, Flame, Emissions, and Soot of Gasoline-Acetone-Butanol-Ethanol Blend at Simulated Cold-Start GDI Operation Using a CVCC. In Proceedings of the AE 2024 Vehicle Powertrain Diversification Technology Forum, Xi’an, China, 6 December 2024. [Google Scholar]
  5. Kim, Y.; Park, C.; Choi, Y.; Oh, J.; Lee, J. Effects of Varying Excess Air Ratios on a Hydrogen-Fueled Spark Ignition Engine with PFI and DI Systems under Low-Load Conditions. Int. J. Automot. Technol. 2023, 24, 1531–1542. [Google Scholar] [CrossRef] [Scilit]
  6. Lee, J.; Park, C.; Bae, J.; Kim, Y.; Choi, Y.; Lim, B. Effect of Different Excess Air Ratio Values and Spark Advance Timing on Combustion and Emission Characteristics of Hydrogen-Fueled Spark Ignition Engine. Int. J. Hydrogen Energy 2019, 44, 25021–25030. [Google Scholar] [CrossRef] [Scilit]
  7. Ji, C.; Wang, S. Experimental Study on Combustion and Emissions Characteristics of a Spark Ignition Engine Fueled with Gasoline−Hydrogen Blends. Energy Fuels 2009, 23, 2930–2936. [Google Scholar] [CrossRef] [Scilit]
  8. Dhyani, V.; Subramanian, K.A. Control of Backfire and NOx Emission Reduction in a Hydrogen Fueled Multi-Cylinder Spark Ignition Engine Using Cooled EGR and Water Injection Strategies. Int. J. Hydrogen Energy 2019, 44, 6287–6298. [Google Scholar] [CrossRef] [Scilit]
  9. Jabbr, A.I.; Vaz, W.S.; Khairallah, H.A.; Koylu, U.O. Multi-Objective Optimization of Operating Parameters for Hydrogen-Fueled Spark-Ignition Engines. Int. J. Hydrogen Energy 2016, 41, 18291–18299. [Google Scholar] [CrossRef] [Scilit]
  10. Tairu, O.O.; Ajide, O.O.; Ismail, O.S.; Oyewola, O.M. Hydrogen Gas Blending in Gasoline GDI Engines: Combustion Analysis and Emission Control. Thermo 2025, 5, 19. [Google Scholar] [CrossRef] [Scilit]
  11. Moreno, F.; Arroyo, J.; Muñoz, M.; Monné, C. Combustion Analysis of a Spark Ignition Engine Fueled with Gaseous Blends Containing Hydrogen. Int. J. Hydrogen Energy 2012, 37, 13564–13573. [Google Scholar] [CrossRef] [Scilit]
  12. Zhu, T.; Fan, Y.; Zhu, L.; Huang, Z. Effects of Excess Air Ratio and Fuel Ratios in a PODE Assisted Ammonia-Hydrogen Spark-Integrated Auto-Ignition Engine. Fuel 2026, 421, 139037. [Google Scholar] [CrossRef] [Scilit]
  13. Goto, J.; Ueno, Y.; Kobashi, Y.; Shibata, G.; Ogawa, H.; Kojima, K. Effects of Hydrogen Addition on Spark Knock Suppression under High Engine Speed and Boosted Conditions. In Proceedings of the 2024 Small Powertrains and Energy Systems Technology Conference, Bangkok, Thailand, 4 November 2024. [Google Scholar]
  14. Puškár, M.; Kopas, M. Hydrogen Energy Share Threshold for Stable Ultra-Lean Combustion in Hydrogen–Gasoline Spark-Ignition Engines. Fuel Process. Technol. 2026, 286, 108446. [Google Scholar] [CrossRef] [Scilit]
  15. Yu, X.; Guo, Z.; He, L.; Dong, W.; Sun, P.; Du, Y.; Li, Z.; Yang, H.; Wang, S.; Wu, H. Experimental Study on Lean-Burn Characteristics of an SI Engine with Hydrogen/Gasoline Combined Injection and EGR. Int. J. Hydrogen Energy 2019, 44, 13988–13998. [Google Scholar] [CrossRef] [Scilit]
  16. Kim, J.; Chun, K.M.; Song, S.; Baek, H.-K.; Lee, S.W. Hydrogen Effects on the Combustion Stability, Performance and Emissions of a Turbo Gasoline Direct Injection Engine in Various Air/Fuel Ratios. Appl. Energy 2018, 228, 1353–1361. [Google Scholar] [CrossRef] [Scilit]
  17. Rimkus, A.; Kozłowski, E.; Matijošius, J.; Zimakowska-Laskowska, M.; Cieplak, T. Ignition-Timing-Dependent Efficiency and Emission Trade-Offs of HHO-Assisted Gasoline–Bioethanol Blends in a Spark-Ignition Engine under Lean Operation. Int. J. Hydrogen Energy 2026, 215, 153853. [Google Scholar] [CrossRef] [Scilit]
  18. Navarro, E.; Leo, T.J.; Corral, R. CO2 Emissions from a Spark Ignition Engine Operating on Natural Gas–Hydrogen Blends (HCNG). Appl. Energy 2013, 101, 112–120. [Google Scholar] [CrossRef] [Scilit]
  19. Novella, R.; Pastor, J.; Gomez-Soriano, J.; Sánchez-Bayona, J. Numerical Study on the Use of Ammonia/Hydrogen Fuel Blends for Automotive Spark-Ignition Engines. Fuel 2023, 351, 128945. [Google Scholar] [CrossRef] [Scilit]
  20. Elumalai, P.V.; Senthur, N.S.; Parthasarathy, M.; Das, S.K.; Samuel, O.D.; Sreenivasa Reddy, M.; Saravana, A.; Anjanidevi, S.; Ssm Sitaramamurty, A.; Anusha, M.; et al. Hydrogen in Spark Ignition Engines. In Application of Clean Fuels in Combustion Engines; Di Blasio, G., Agarwal, A.K., Belgiorno, G., Shukla, P.C., Eds.; Energy, Environment, and Sustainability; Springer Nature: Singapore, 2022; pp. 195–213. ISBN 978-981-16-8750-1. [Google Scholar]
  21. Singh, P.; Sahoo, S.; Kumbhakarna, N.; Singh, P. Hydrogen-Fueled Spark Ignition Engines: Understanding NOx Formation and Mitigation Through Engine Design Innovations. In Ammonia and Hydrogen for Green Energy Transition; Kumar, S., Agarwal, A.K., Khandelwal, B., Singh, P., Eds.; Energy, Environment, and Sustainability; Springer Nature: Singapore, 2024; pp. 371–392. ISBN 978-981-97-0506-1. [Google Scholar]
  22. Shivaprasad, K.V.; Chitragar, P.R.; Kumar, G.N. Experimental Investigation of Variations in Spark Timing Using a Spark-Ignition Engine with Hydrogen-Blended Gasoline. Energy Technol. 2015, 3, 1174–1182. [Google Scholar] [CrossRef] [Scilit]
  23. Ilbas, M.; Kumuk, O.; Karyeyen, S. Modelling of the Gas-Turbine Colorless Distributed Combustion: An Application to Hydrogen Enriched—Kerosene Fuel. Int. J. Hydrogen Energy 2022, 47, 12354–12364. [Google Scholar] [CrossRef] [Scilit]
  24. Pukalskas, S.; Korsakas, V.; Stankevičius, T.; Kriaučiūnas, D.; Mikaliūnas, Š. Effect of Water Injection on Combustion and Emissions Parameters of SI Engine Fuelled by Hydrogen–Natural Gas Blends. Energies 2024, 17, 2132. [Google Scholar] [CrossRef] [Scilit]
  25. Fedyanov, E.A.; Zakharov, E.A.; Prikhodkov, K.V.; Levin, Y.V. Modelling of Flame Propagation in the Gasoline Fuelled Wankel Rotary Engine with Hydrogen Additives. IOP Conf. Ser. Mater. Sci. Eng. 2017, 177, 012076. [Google Scholar] [CrossRef] [Scilit]
  26. Amrouche, F.; Erickson, P.A.; Park, J.W.; Varnhagen, S. Extending the Lean Operation Limit of a Gasoline Wankel Rotary Engine Using Hydrogen Enrichment. Int. J. Hydrogen Energy 2016, 41, 14261–14271. [Google Scholar] [CrossRef] [Scilit]
  27. Du, J.; Wu, G.; Chen, H.; Sun, F.; Xie, F.; Li, Y.; Sun, Y.; Qi, H.; Li, Y. Effects of Injection Timing and Pressure on Combustion Performance and Emissions in Hydrogen Direct Injection Engine. In Proceedings of the WCX SAE World Congress Experience, Detroit, MI, USA, 8 April 2025. [Google Scholar]
  28. Naganuma, K.; Honda, T.; Yamane, K.; Takagi, Y.; Kawamura, A.; Yanai, T.; Sato, Y. Efficiency and Emissions-Optimized Operating Strategy of a High-Pressure Direct Injection Hydrogen Engine for Heavy-Duty Trucks. SAE Int. J. Engines 2009, 2, 132–140. [Google Scholar] [CrossRef] [Scilit]
  29. Taib, N.M.; Hameed, M.S.S.; Köten, H.; Mansor, M.R.A. Optimizing Hydrogen Direct Injection and NOx Emissions via Injection-Ignition Timing Strategies in Spark-Ignition. IOP Conf. Ser. Earth Environ. Sci. 2026, 1587, 012046. [Google Scholar] [CrossRef] [Scilit]
  30. Huang, H.; Xing, K.; Lu, H.; Wang, Y.; Tu, Z.; Qin, Y.; Lin, T.; Huang, H. Study on the Potential of Injection Strategies to Suppress Knock Combustion in Direct-Injection Hydrogen Engines under High Compression Ratio. Fuel 2026, 417, 138632. [Google Scholar] [CrossRef] [Scilit]
  31. Anaclerio, G.; Capurso, T.; Torresi, M.; Camporeale, S. Influence of the Injection Timing on the Mixture Formation Process in a Spark-Ignition Hydrogen Fuelled ICE. In Proceedings of the 16th International Conference on Engines & Vehicles, Capri, Italy, 10 September 2023. [Google Scholar]
  32. Abdelhalim, A.; Abdelhafez, A.; Nemitallah, M.A. Combined Effect of Hydrogen-Enrichment and Stratification on the Stability and Structure of Premixed Swirl-Stabilized CH4/Air Flames. In Proceedings of the Volume 10: Heat Transfer and Thermal Engineering; American Society of Mechanical Engineers: New Orleans, Louisiana, USA, 29 October 2023; American Society of Mechanical Engineers: New York, NY, USA, 2023; p. V010T11A009. [Google Scholar]
  33. Fichtner, J.; Ninow, J.; Kapischke, J. Simultaneous Reductions in NOx Emissions, Combustion Instability, and Efficiency Loss in a Lean-Burn CHP Engine via Hydrogen-Enriched Natural Gas. Energies 2025, 18, 4339. [Google Scholar] [CrossRef] [Scilit]
  34. Huang, Z.; Yuan, S.; Wei, H.; Zhong, L.; Hu, Z.; Liu, Z.; Liu, C.; Wei, H.; Zhou, L. Effects of Hydrogen Injection Timing and Injection Pressure on Mixture Formation and Combustion Characteristics of a Hydrogen Direct Injection Engine. Fuel 2024, 363, 130966. [Google Scholar] [CrossRef] [Scilit]
  35. Lou, D.; Rao, X.; Zhang, Y.; Fang, L.; Tan, P.; Hu, Z. Investigation of Impacts of Hydrogen Injection and Spark Strategy on Knock in Hydrogen Engine. Int. J. Hydrogen Energy 2024, 82, 1252–1262. [Google Scholar] [CrossRef] [Scilit]
  36. Novella, R.; Gomez-Soriano, J.; Barbery, I.; Alcarria-Laserna, G. Computational Analysis of the In-Cylinder Mixture Formation in a Direct Injection Hydrogen Spark-Ignition Engine. Int. J. Hydrogen Energy 2025, 154, 150059. [Google Scholar] [CrossRef] [Scilit]
  37. Irimescu, A.; Merola, S.S.; Vaglieco, B.M. Conversion of a Small-Size Passenger Car to Hydrogen Fueling: Evaluation of Boosting Potential and Peak Performance During Lean Operation. Energies 2025, 18, 2943. [Google Scholar] [CrossRef] [Scilit]
Figure 1. Layout of the experimental setup: 1—HR16DE SI engine; 2—connecting shaft; 3—dynamometer; 4—dynamometer control unit with display; 5—crankshaft position sensor; 6—spark plug integrated with a pressure sensor; 7—in-cylinder pressure acquisition system; 8—exhaust gas temperature sensor; 9—exhaust gas temperature display unit; 10—wideband oxygen sensor; 11—reprogrammable engine control unit; 12—exhaust gas analyzer; 13—air mass flow meter; 14—throttle actuator servo motor; 15—petrol injector; 16—petrol system pressure regulator; 17—petrol filter; 18—petrol pump; 19—petrol tank; 20—gravimetric scale for petrol tank; 21—low-pressure H2 regulator; 22—high-pressure H2 regulator; 23—H2 mass flow meter; 24—H2 mass flow meter display; 25—H2 cylinder.
Machines 14 00661 g001
Figure 2. In-cylinder pressure when the engine is running on pure petrol and additionally injected with H2 (10% by mass) at various pressures.
Machines 14 00661 g002
Figure 3. In-cylinder pressure when the engine is running on pure petrol and additionally injected with H2 (20% by mass) at various pressures.
Machines 14 00661 g003
Figure 4. In-cylinder pressure when the engine is running on pure petrol and additionally injected with H2 (30% by mass) at various pressures.
Machines 14 00661 g004
Figure 5. In-cylinder pressure rise when the engine is running on gasoline and additionally injected with H2 (10% and 30% by mass) at various pressures (1.2 bar and 1.9 bar).
Machines 14 00661 g005
Figure 6. ROHR when the engine is running on gasoline and additionally injected with H2 (10% and 30% by mass) at various pressures (1.2 bar and 1.9 bar).
Machines 14 00661 g006
Figure 7. Temperature rise when the engine is running on gasoline and additionally injected with H2 (10% and 30% by mass) at various pressures (1.2 bar and 1.9 bar).
Machines 14 00661 g007
Figure 8. Brake Specific Fuel Consumption when the engine is running on gasoline and additionally injected with H2 at various pressures (10%, 20% and 30% by mass).
Machines 14 00661 g008
Figure 9. Brake Thermal Efficiency (BTE) when the engine is running on gasoline and additionally injected with H2 at various pressures (10%, 20%, and 30% by mass).
Machines 14 00661 g009
Figure 10. O2 concentration in the exhaust gas when the engine is running on gasoline and additionally injected with H2 at various pressures (10%, 20%, and 30% by mass).
Machines 14 00661 g010
Figure 11. CO concentration in the exhaust gas when the engine is running on gasoline and additionally injected with H2 at various pressures (10%, 20%, and 30% by mass).
Machines 14 00661 g011
Figure 12. HC concentration in the exhaust gas when the engine is running on gasoline and additionally injected with H2 at various pressures (10%, 20%, and 30% by mass).
Machines 14 00661 g012
Figure 13. NOx concentration in the exhaust gas when the engine is running on gasoline and additionally injected with H2 at various pressures (10%, 20%, and 30% by mass).
Machines 14 00661 g013
Figure 14. CO2 concentration in the exhaust gas when the engine is running on gasoline and additionally injected with H2 at various pressures (10%, 20%, and 30% by mass).
Machines 14 00661 g014
Table 1. Main specifications of spark-ignition engine used in the experimental study.
ParameterValue
Number of cylindersInline 4-cylinder
Total displacement1.598 [dm3]
Cylinder bore78.0 [mm]
Piston stroke86.6 [mm]
Max. power84 at 6000 RPM [kW]
Max. torque156 at 4400 RPM [Nm]
Compression ratio10.7
Intake valves opening24 [CAD BTDC 1]
Intake valves closing72 [CAD ABDC 2]
Exhaust valves opening24 [CAD BBDC 3]
Exhaust valves closing10 [CAD ATDC 4]
1 Crank angle degrees before top dead center. 2 Crank angle degrees after bottom dead center. 3 Crank angle degrees before bottom dead center. 4 Crank angle degrees after top dead center.
Table 2. Commanded base map injector control parameters scaled to a 24 ms reference width.
FuelH2 Injection Pressure, BarPetrol Injector Control Parameter, msH2 Injector Control Parameter, ms
E10H0-9.20
E10H101.212.212.6
1.411.912.8
1.611.813.0
1.911.613.2
E10H201.213.78.4
1.413.48.5
1.613.08.7
1.912.39.4
E10H301.214.65.8
1.413.96.2
1.613.26.5
1.912.69.7
Table 3. Measurement ranges and accuracy of the exhaust gas analyzer.
ComponentMeasuring RangeAccuracy
NOx0 … 5000 ppm, by vol.±1 ppm
CO0 … 10%, by vol.±0.01%
CO20 … 20%, by vol.±0.1%
HC0 … 20,000 ppm, by vol.±1 ppm
O20 … 25%, by vol.±0.01%
Table 4. Fuel mixtures properties and ST.
H2, Mass%Petrol, Mass%LHV, MJ/kgStoichiometric A/F RatioMarkingH2 Pressure, BarST, CAD BTDC
010041.8714.20E10H0024
109049.6916.26E10H101.216
1.416
1.616
1.916
208057.5018.32E10H201.212
1.412
1.612
1.912
307065.3220.37E10H301.210
1.410
1.610
1.910
Table 5. Combustion indicators.
IndicatorsSOC
[CAD]
ID
[CAD]
MBF 50% [CAD]MBF 90% [CAD]COVIMEP,
[%]
E10H0; IT = 24° BTDC−17.36.77.717.81.49
E10H10; pH2 = 1.2 bar; ST = 16 °CAD BTDC−12.33.77.415.61.49
E10H10; pH2 = 1.9 bar; ST = 16 °CAD BTDC−12.04.07.816.01.36
Change between 1.2 bar and 1.9 bar0.30.30.40.40.13
E10H30; pH2 = 1.2 bar; ST = 10 °CAD BTDC−7.72.38.915.71.34
E10H30; pH2= 1.9 bar; ST = 10 °CAD BTDC−8.02.08.515.31.44
Change between 1.2 bar and 1.9 bar−0.3−0.3−0.4−0.4−0.1
Disclaimer/Publisher’s Note: The statements, opinions and data contained in all publications are solely those of the individual author(s) and contributor(s) and not of MDPI and/or the editor(s). MDPI and/or the editor(s) disclaim responsibility for any injury to people or property resulting from any ideas, methods, instructions or products referred to in the content.