Article

Highly Sensitive Measuring System for Rail Width and Point-Related Hydrodynamic Pressure in Linear Sliding Guideways of Machine Tools


1
Professorship for Production Systems and Processes, Chemnitz University of Technology, Reichenhainer Straße 70, 09126 Chemnitz, Germany
2
Fraunhofer Institute for Machine Tools and Forming Technology IWU, Reichenhainer Straße 88, 09126 Chemnitz, Germany
*
Author to whom correspondence should be addressed.
Machines 2026, 14(6), 609; https://doi.org/10.3390/machines14060609
Submission received: 2 April 2026 / Revised: 21 May 2026 / Accepted: 22 May 2026 / Published: 28 May 2026
(This article belongs to the Section Friction and Tribology)

Abstract

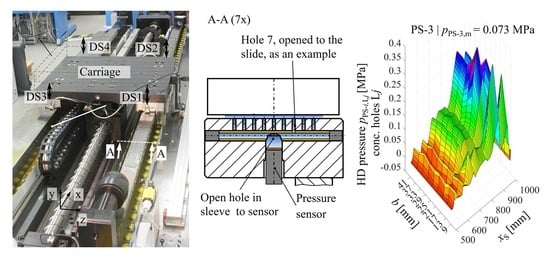
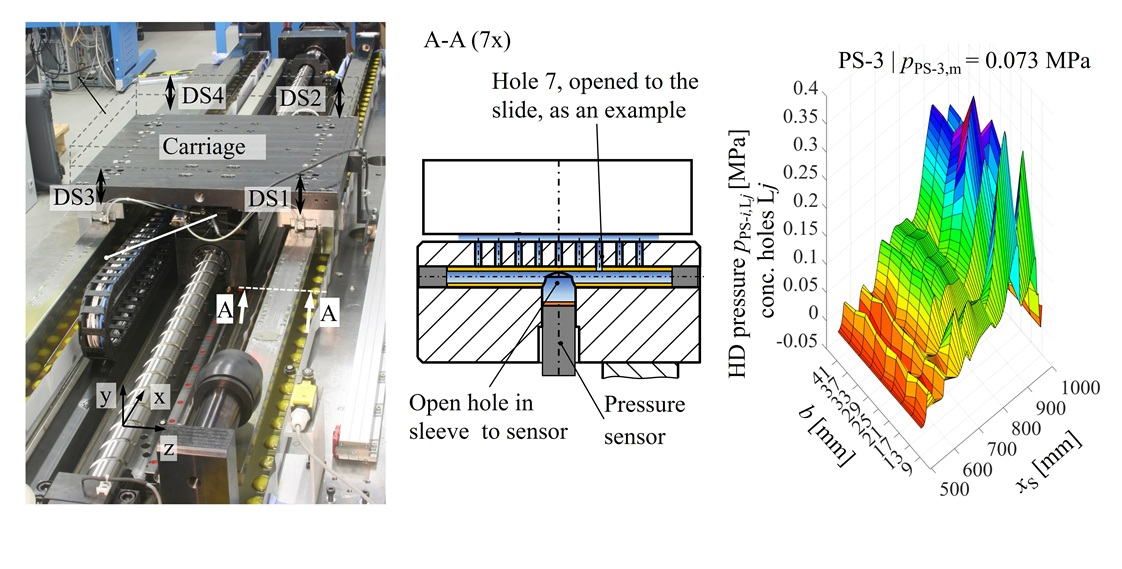
Due to their high damping and the associated low dynamic excitation of the machine tool, hydrodynamic guideways are necessary for precision machines such as grinding machines. This article summarizes the development of the measuring system that was integrated into the guiding rail of a linear hydrodynamic bearing and presents the experimental evaluation. The measuring system is aimed at providing a better understanding of the actual transient hydrodynamic pressure and lubrication condition during the reversing sliding motion in the liquid friction range. The system was checked for its frequency response to ensure that the expected pressure rise during the stroke motion can be measured both in relation to the rail width and to the point. The evaluation is based on Reynolds’ analytical hydrodynamic theory, as numerical calculation approaches themselves are also subject to considerable uncertainties, particularly with regard to the actual geometry of the lubrication gap. The novelty of the results lies in the possibility of analyzing the instationary behavior of a reversing linear bearing of a carriage in machine tools at very low pressures as a quasi-2D and 3D pressure curve. Finally, the new possibilities are demonstrated by analyzing the behavior of a carriage with concave sliding surfaces.

Graphical Abstract

1. Introduction

Hydrodynamic linear guideways (HDG) are not only used successfully in large machines but also in medium-sized machines [1]. Due to their high robustness, load capacity and high damping, this type of guideway is still necessary in the feed axes of many machine tools [2]. Depending on the application, a static surface pressure of approx. p s t a t = 0.5 MPa corresponding to the weight load F s t a t is recommended for the bearing surfaces of the guideways [3]. However, significantly lower values are used for higher dynamics of the feed axis ( p s t a t < 0.2 MPa or lower), e.g., in grinding machines [4,5]. For this load range, the article focuses on guiding systems with a feed rate of v S = 10 to 70 m/min. Due to this low pressure and the resulting inclination of the moving machine component, which is as low as possible but necessary, the linear bearings in machine tools differ significantly from sliding elements, e.g., in axial rotary trust plain bearings, which are more concerned with an optimum inclination of the sliding surfaces. The most striking difference to the bearings mentioned above, however, is the mainly reversing and unsteady operation of the linear bearings, so that no stationary state of hydrodynamic (HD) pressure and floating can be achieved. For competitive drive dynamics (feed rate up to v S = 50 m/min and accelerations up to a S = 3 m/s2), the HDG must be predominantly operated in the fluid friction range and must therefore be adequately lubricated. While mixed friction occurs with insufficient lubrication and the coefficient of friction consequently increases, overlubrication can lead to inaccuracies due to excessive floating and tilting of the moving components. The associated oil consumption is also high. The lubrication conditions immediately before and during start-up, the time of transition from the mixed friction state to the liquid friction state and the time-dependent pressure build-up have not yet been sufficiently determinable neither mathematically nor experimentally. Hence, there are corresponding uncertainties when operating the HDG with changing parameters (rapid traverse rate versus process feed rate).

2. Objective

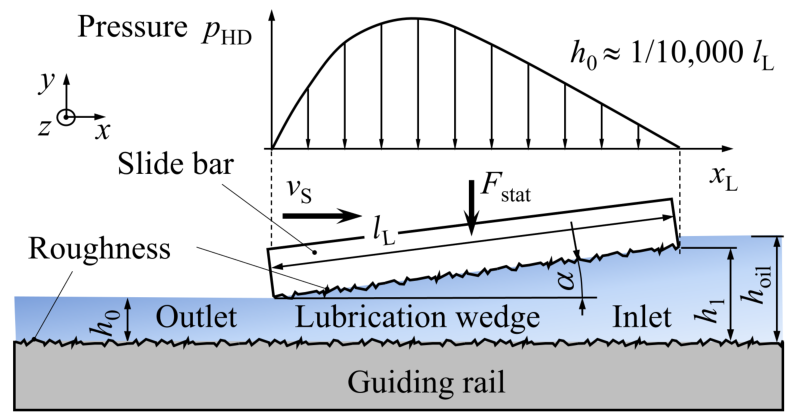
Figure 1 shows the theoretical stationary HD pressure curve p H D in the lubrication gap in a linear bearing according to Reynolds [6] with the specific proportions for machine tools (outlet floating height h 0 , total length of the slide bar l L , static weight load F s t a t , length coordinate of slide bar x L , lubrication wedge angle α ). It is necessary that the lubricating oil film height h O i l is always greater than the inlet floating height h 1 . The sensor system used here, which is installed near the surface of the stationary part of the sliding pair (guiding rail), is intended to measure the real hydrodynamic pressure distribution in the lubrication gap and thus provide information on the transient lubrication condition. The aim of the work presented here is to verify the sensor system. While individual aspects of the design of the measurement method can be evaluated based on simulation, the verification of the measurement method involves two challenges due to the transient conditions: Firstly, since direct reference measurements for the developed sensor system are not possible, other (metrological) comparison options must be found. Secondly, the approaches for mathematical verification, which only reflect the real conditions in the lubrication gap with limited accuracy, must be checked and used, for example, to estimate expected values. This comparison of the theoretical and experimental analyses are necessary in order to be able to use the sensor method for monitoring and improve the lubrication in HDG in the future.

3. State of the Art

3.1. Measuring the Hydrodynamic Pressure in the Lubrication Gap

To our knowledge, there is only one very short published study on pressure measurement in the lubrication gap of an HDG: In [7], capillary tubes are used to measure the hydrodynamic pressure. These were first formed into a U-shape and then guided to the guiding rail with fine through-holes. The dynamics of the principle are very limited with a feed rate of v S = 3 m/min. Work on pressure measurement in rotating plain bearings is therefore an important source, even if there are relevant differences (operating with high relative speeds, level of pressure to be measured is far more than 50 times higher). Consequently, the effects of this quantitative difference in the measured variable on the necessary sensitivity and measurement dynamics must be examined.
The first method uses a cylindrical pressure sensor that is integrated into the sliding surface and directly measures the pressure in the lubrication gap vertically to the direction of flow [8]. However, it is advantageous if the sensor is positioned on the stationary side of the sliding pair, as the value of the transient velocity profile of the lubricating oil is theoretically zero there and has no negative influence. Measurements in which the sensor is not in direct contact with the oil (e.g., [9,10]) have the disadvantage that the pressure is also used for deformation of the encapsulation of the sensors. This principle seems unsuitable for the low HD pressure of an HDG, even if the separation of the sensor from the flow of lubricating oil is advantageous.
Despite the reversing motion of linear plain bearings, the sensor integration must ensure that air inclusions, cavitation and boundary layer phenomena as well as insufficient lubrication have as little influence as possible on the measurements. In the work [11], for instance, the diaphragm surface of the pressure sensor is therefore not in direct contact with the lubricating oil. Instead, a perforated cover is placed in front of the sensor. The resulting cavity is filled with silicone oil as an incompressible medium. The rate at which the pressure rises is not specified in this work.
The disturbing influence of the flow on the pressure measurement in the lubrication gap can be avoided with thin-film technology as a second essential approach. In [12,13,14,15,16] different aspects of thin-film sensors were discussed, consisting of thin layers of material with a total thickness of 6 μm, which are used on the sliding surface of bearings to measure the oil film pressure in plain bearings. Two facts prevent the application in the focused HDG. Firstly, the measuring range of these sensors is significantly higher than the pressure peaks usually expected in HDG. Secondly, the actual size and shape of the hardened rails prevent the highly complex application of the sensor technology to their surface. This approach is currently not being pursued, particularly for reasons of the incorrect measuring range.

3.2. Limitations of Measurement Validation Using Hydrodynamic Pressure Calculation

The floating behavior of HDG results from a transient relationship between the HD pressure curve p H D on the one hand and the floating heights of the inlet and outlet edges of the lubrication gap h 1 and h 0 on the other hand. It is based on the solution of Reynolds’ differential equation (RDE), which is derived from the Navier–Stokes equation. The solution for the infinitely wide lubrication gap of HDG is given in [17] or [18]. Using the gap narrowing
m = h 1 h 0 1
By deriving Equation (2) and multiplying the distance x by the velocity v S , the time-dependent pressure rise p ˙ ( t ) is obtained. For the design of the sensor system, only the maximum positive increase at time t = 0 (respectively x = 0 ) is of interest. The value results in
p ˙ H D ( x = 0 ) = 6 η v S 2 h 0 2 m 1 ( 1 + m ) 2 + 1 2 + m
The distance x L , p m a x of the pressure maximum is obtained by differentiating Equation (2), then setting it to zero and numerically solving the equation for x:
x L , p m a x = l L m + 1 m + 2
The maximum HD pressure is thus
p H D ( x L , p m a x ) = 6 η v S l L h 0 2 m 4 ( 1 + m ) ( 2 + m )
By deriving Equation (2) and multiplying the distance x by the velocity v S , the time-dependent pressure rise p ˙ ( t ) is obtained. For the design of the sensor system, only the maximum positive increase at time t = 0 (respectively x = 0 ) is of interest. The value results in
p ˙ H D ( x = 0 ) = 6 η v S 2 h 0 2 m 1 ( 1 + m ) 2 + 1 2 + m
The average pressure p H D , m can be calculated via a numerical integration of Equation (2), since the table with auxiliary values in [17] does not contain any values for the gap narrowing m of typical guideways in machine tools. Equations (1) to (5) are applied to the infinitely wide gap (width b) and assume an ideal lubrication gap completely filled with oil, which is not the case as described in [19]. To take the lateral leakage losses into account, experiment-based correction value ψ is used, which also depends on the width/length ratio b / l L of the slide bar and the gap narrowing m [17].
The approaches in [18,20] take into account the finite width b of the slide bar and thus also the side leakage losses. In addition to the numerical solutions for the HD pressure, the following equations for calculating the average HD pressure p H D , b , m are given in [18]:
p H D , b , m ( x ) = 5 η v S l L h 0 2 m 2 1 + a l L b 2 · ln 1 + m m 2 2 + 2 m
with m = 1 m and a = 10 ( 1 + 2 m ) 2 · ( m + m 2 ) 2 + 1 2 ( m + m 2 ) 12 ( 1 + 2 m ) ln 1 + m m 2
The approaches also assume a stationary state of the HD pressure, which is generally not achieved during a stroke and the principle-related reversing relative motion in HDG of machine tools. This also means that the floating heights h 1 and h 0 for Equation (2) are not known in advance. The measurements in [19] show this steadily increasing floating and the changes in inclination of the carriage over several hundred strokes. Realistically calculating the behavior of the oil in the lubrication gap according to the lubrication conditions is described as a challenge in [21,22], but without suggesting a solution. The real motion of the oil film in the lubrication gap and the challenge of an adequate oil supply to fill the gap is qualitatively described in [19].
The following calculation approaches aim to modify (i.e., to reduce) the pressure p H D ( x ) based on RDE. In [5], experience-based assumptions are made for the course of the height of the inlet edge h 1 ( x ) after the starting time that has not yet been sufficiently explained. In [23], the optimum gap shape is determined numerically with regard to the load behavior. However, a large number of correction factors are used and the reversing movement of slides in machine tools was not considered. Like the recent work in [24], the real width/length ratio b / l L of the slide bar of a HDG in machine tools is not taken into account. In the finite difference approach of [25], the correction factor R 1 takes into account the 3D/2D reduction while the factor R 2 includes the side leakage losses in the calculation. A major uncertainty in theoretical models is the consideration of the flatness deviation of the slide bar and guiding rail, which is partly stochastic in nature and which has a very sensitive effect on the floating [4]. In [26], (time-consuming) measured geometric deviations of sliding surfaces, i.e., the exact shape of the lubrication gap, were taken into account with the help of the finite difference approach. The convex lubrication gap in the longitudinal direction leads to a counter-rotating inclination of the slide bars. In [4], the law of conservation of mass was integrated into the dynamic model to take into account the formation of the lubricating film. Although the unstable floating behavior at high speeds could be explained with the model approach, it could not be verified in our own laboratory tests. In [25], cavitation is also integrated with a simple model approach according to [27], which further improves the calculation models.
However, the above-mentioned approaches still require calibration with experimentally determined floating heights.
The use of computational fluid dynamics simulation (CFD) provides further possibilities as it uses the full Navier–Stokes equation, which takes into account the effects of fluid inertia, complicated gap shapes, air entrapment inside the lubrication gap and turbulent flow. It allows for the simulation of two-phase flows, capturing phenomena such as cavitation that are difficult to model using RDE. Various commercial software packages are available. However, a disadvantage of using CFD is the long calculation time of models. With the narrow lubrication gap of HDG in machine tools, the influence of boundary layer phenomena increases. Compared to the overview in [28], the CFD considers the real behavior of the boundary layers only partially. Therefore, ref. [29] presents a substitute partial model with software (Ansys Fluent) to evaluate the effects of different forms of lubrication grooves on the HD pressure in the subsequent lubrication gap only. It should also be noted that in the very narrow lubrication gaps of linear guideways of machine tools, boundary layer phenomena are becoming increasingly important and are only taken into account to a very limited extent. In addition, no truly transient calculation of the floating is possible, only the pressure curve in a lubrication gap with a fixed geometry. The pressure curve can only be calculated in 2D or 3D if experimentally determined floating heights h 1 and h 0 are used and the correction factors R 1 and R 2 acc. to [25] are applied at the same time. This is too time-consuming for a pure approximate calculation. Current calculations with commercial software (Ansys Fluent) of the entire lubrication gap with grooves (see Figure 2b) according to typical input values show no improvement in the situation. The result of the 2D pressure calculation is similar to the calculation with RDE (Equation (2)) if no lubrication grooves are taken into account; i.e., the pressure is calculated significantly too high. In the 3D model with consideration of the lateral leakage losses, the pressure only appears to be calculated correctly in qualitative terms. The calculated maximum pressure is clearly too low. The correction factor ψ would be significantly smaller than that specified in [17].
In summary, it can be said that the required effort yields a relatively uncertain result. The reason for this is that the macro- and microgeometry of the oil gap changes as the slide bars move during the stroke. Therefore, comparing it to the static load pressure of the floating slide bars might be a rather rough but very robust approach.

3.3. Operating Conditions of the Test Stand for HD Guideways

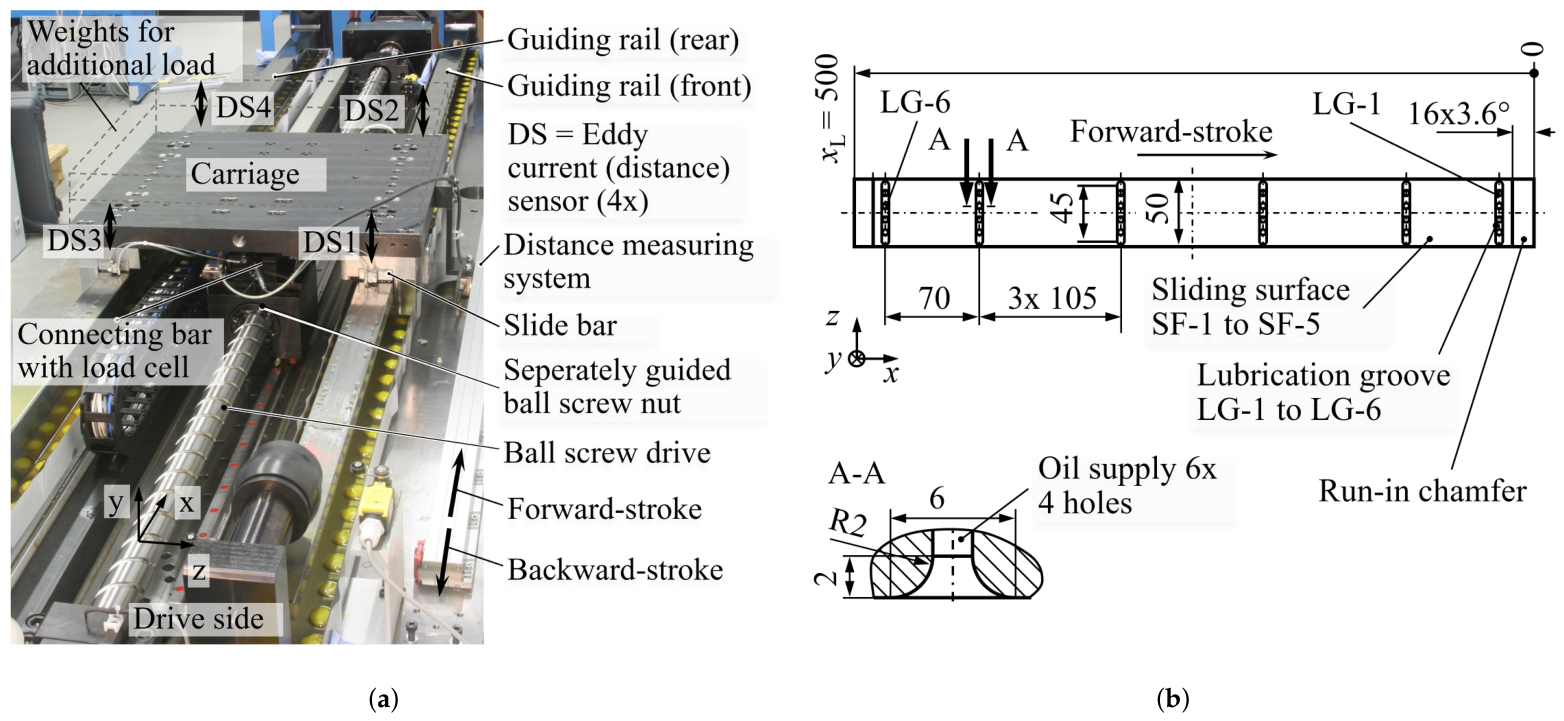
Figure 2a shows the principal set-up of the test stand with one slide bar per guiding rail. The interchangeable slide bars have an effective width b = 50mm and length l L = 500 mm. The design can be found in typical surface grinding machines. The width/length ratio of the whole slide bar b / L L = 0.1 as well as for the partial sliding surfaces b / L S F , 1 / 6 = 0.7 and b / L L , 2 5 = 0.49 is typical for machine tools and is not in the focus of research projects. The effective partial lengths l S F , i of the sliding surfaces (SF) divided by the lubricating grooves (LG) are shown in Figure 2b. This means that the slide bar tilts as a whole, and each partial sliding surface tilts by the same lubrication wedge angle α ( x S ) . However, with regard to the calculation described in Section 3.2, each partial sliding surface has different characteristic values, such as the gap narrowing m . This represents a significant difference from thrust bearings, whose sub-surfaces theoretically behave identically.
The slide bars are made entirely of steel but also coating with epoxy resin by casting is possible [25]. The carriage is adjusted laterally by slide bars without clearance and has no grip slide bars. Due to the hinged connection to the guided screw, the carriage is not restricted from floating and complicated boundary conditions such as clamping are prevented.
The feed force is measured directly on the separately guided ball screw nut using a load cell, so that instantaneous friction values can be calculated [26]. As further measured variables, the floating heights at the inlet edge h 1 and at the outlet edge h 0 are measured using (eddy current) inductive sensors for each rail [25,26]. However, only a relative floating height can be measured with these sensors, as the mounting tolerance (distance to the guide rail) is significantly greater than the measurement tolerance of the sensors. For this reason, the measurement signals are set to zero at the start of each measurement cycle. The evaluation is then carried out relative to these switch-on values. The sensors were not switched off between the individual measurement series. These series of measurements usually included several feed rates.
The flatness deviations of the carriage during a stroke, which result for the heights of the leading and trailing edges, are recorded as systematic position-dependent offset values by a calibration run with feed rate v S = 0.6 m/min. The static surface load p s t a t during the measurements results from the weight load F s t a t of the carriage. Lubrication is always carried out with oil with a viscosity grade (kinematic viscosity) of v k i n = 68 m2/s and a density of ρ = 879 kg/m3; i.e., the dynamic viscosity is η = 59 mPas at 40 °C (Shell Tonna S-68, Milano, Italy). During the test cycles in the air-conditioned room, the temperature of the lubrication oil was 22 ± 1 °C regardless of the forward speeds applied, and a maximum temperature rise of only 1 K was measured on the guiding rails and slide bars. This means that isothermal conditions are present. The sampling rate of the floating and pressure measurements on the test bench is 600 Hz. Results are based on the average of five subsequent forward and return strokes.
Lubrication is supplied in an adjustable cycle either in the feed direction in front of and behind the slide bars or through the lubrication grooves themselves. Lubrication cycles were described in preliminary works [26,30,31], which ensure the same lubrication conditions within the scope of a study. According to [5], the critical height of the lubrication gap for fluid friction in HDG results from the RMS roughness σ i of the sliding partners at
h m i n = 3 σ 1 2 + σ 2 2
A critical lubrication gap height of h m i n = 5 to 10 μm can be assumed for the test stand, whereby the arithmetic mean roughness R a is less than 0.5 μm for the guiding rails and less than 1.2 μm for the slide bars. Due to the low static surface pressure p s t a t , the Sommerfeld number S o is so small despite these low floating heights that it does not represent a limit criterion with regard to the transition to mixed friction [20]. Due to the low static load, no edge pressure that would lead to elastohydrodynamic contact conditions is to be expected, even when the slide touches down on the outlet edge h 0 during acceleration [6].

4. Design and Verification of the Measurement Method

4.1. Requirements

The starting point for the rough determination of the measuring range is Equation (2), which can be used to draw inverse conclusions about the hydrodynamic pressure curve at each sliding surface from existing measured values and the assumption of stationary conditions. In several tests at a feed rate of v S = 30 m/min with a static pressure p s t a t = 0.07 MPa, the floating heights at the inlet edge of approx. h 1 = 60 μm and at the outlet edge of approx. h 0 = 25 μm were measured at the position of x S = 900 mm. The values of the partial surfaces are calculated from this. To ensure that the system is not undersized, no correction factor ψ concerning the side leakage [17] is used. The maximum pressure according to RDE (Equation (4)) occurs at the sliding surface SF-4 and is p H D , m a x , 4 = 0.419 MPa. The highest pressure rise occurs with these test values on the partial surface SF-5 and is p ˙ H D , m a x , 5 = 8.76 MPa/s.

4.2. Basic Designs and Pre-Test (2D) Pressure Measurement in Relation to Rail Width

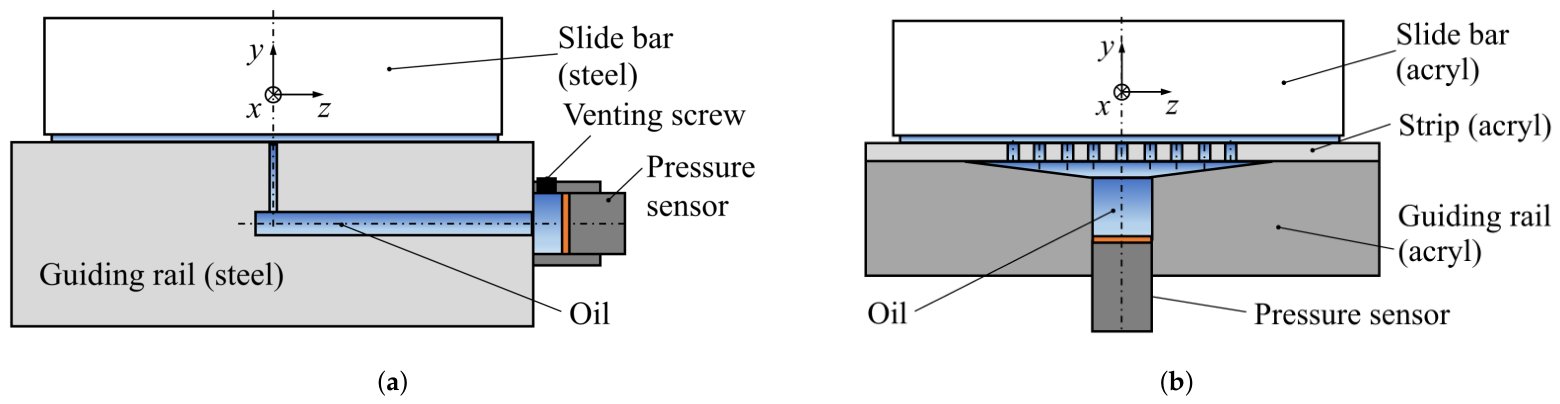
In the preliminary test, a small hole in the hardened guiding rail led to a larger oil volume, which was designed as a cross bore from the side, and a pressure sensor was placed at the side end (Figure 3a). In principle, however, it was possible to measure the pressure curve during strokes of the carriage if no air entrapment or insufficient lubrication occurred. After initial testing, two requirements were defined for further development. Firstly, a certain volume of oil had to be present in front of the actual measuring point to allow degassing of the lubricating oil. Secondly, the aim was to decouple the measuring point from the influences of the sliding flow and the associated interface effects without the measuring distance to the lubrication gap becoming too large. The variant depicted in Figure 3b had shown the best measurement behavior [32]. It is used further although the pressure is not measured with pinpoint accuracy. Instead, the common measurement of several measuring points arranged in a line and across the feed direction is favored as a variant. The measuring points in the form of small holes in the guiding rail are connected by an oil chamber inside the guiding rail, in which the pressure sensor is placed. It is postulated here that a pressure is measured with respect to the slide bar width b, which lies between an average pressure and the maximum pressure at the middle of guiding rail.
The method for the experimental verification of the measuring principle has already been presented in detail in [32]. The first step was to check how a certain volume of oil can dynamically transfer pressure and how the sensor (Kyowa 70KD M2) measures this pressure (reference sensor Burster 8210). In the second step—based on [34,35]—the sensor was installed in an identical rail made of acrylic glass in terms of easier fabrication and also to be able to observe the oil or trapped air [32]. For calibration, the guiding rail was covered oil-tight at the measuring point with a steel block. The lower contact surface of the steel block has a cavity as an oil chamber to which the test pressure is applied. In the subsequent third step, the executed variant was verified during the stroke motions.
The geometry of the preferred variant was subjected to further calculations and experimental variation. In the experiments, the holes with a diameter of 1.2 mm and a certain distance to the sensor showed the most favorable overall behavior. This result was described in detail and discussed in [30].

4.3. System Integration in a Steel Rail and Verification of Pressure Measurement in Relation to Rail Width

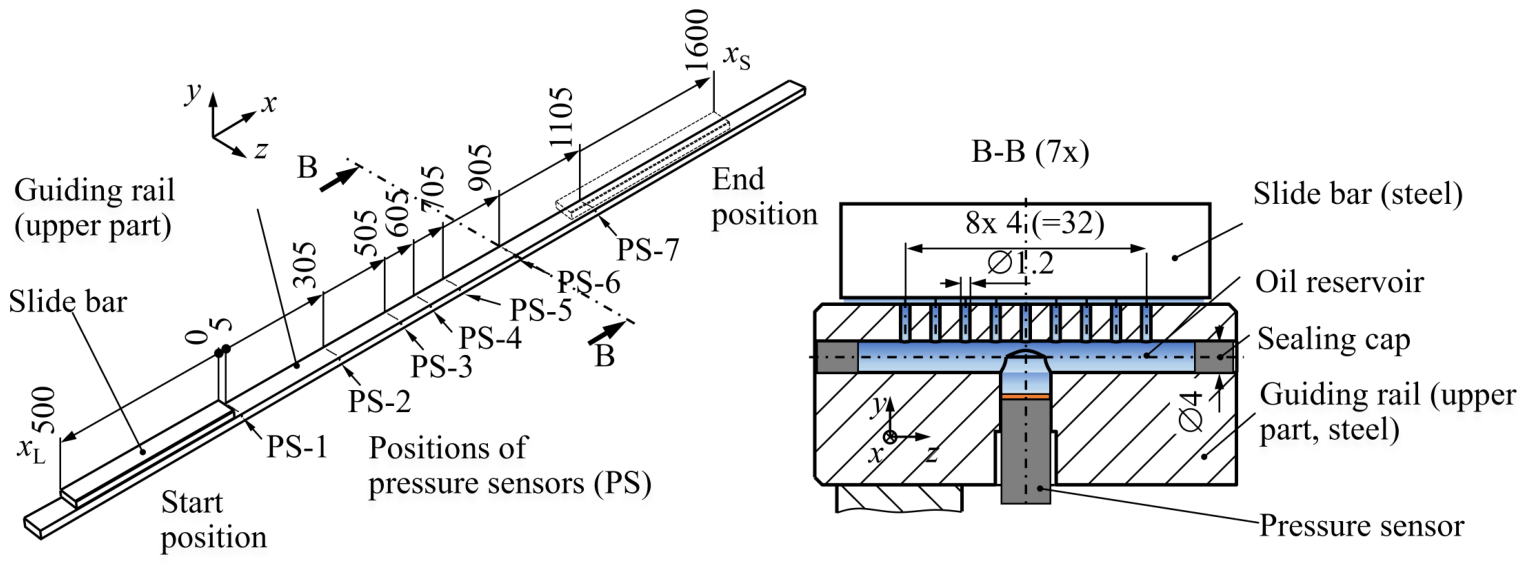
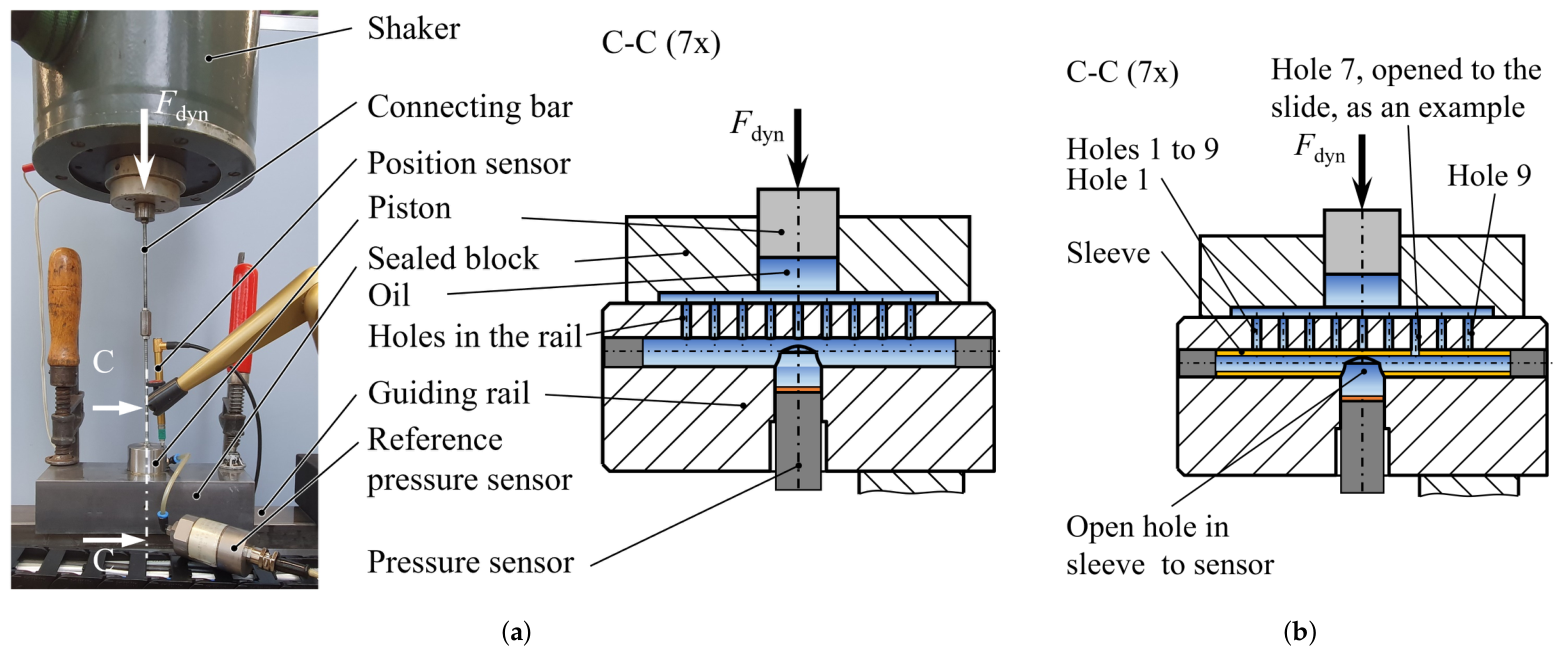
The design of the cavity in the guiding rail to hold the pressure sensor is based on the manufacturing possibilities and therefore consists of holes [36]. For the integration of the pressure sensor (Figure 4), one of the guiding rails is replaced by a two-part assembly, in contrast to Figure 2a. In this way, only the upper part with the guiding surfaces needs to be hardened. In order to enable the production of the row of very fine bores and the oil reservoir, the guiding rail is not through-hardened, but gas-nitrided after machining. This change in the technological route has not shown any influence on the surface roughness. There were no disadvantages in the tests. In total, the sensors are integrated into the rail at seven positions x P S , i ( x ) (PS-1 to PS-7), whereas the sensor PS-7 is not completely overrun by the slide bar. Each individual measuring point is calibrated (Figure 5).
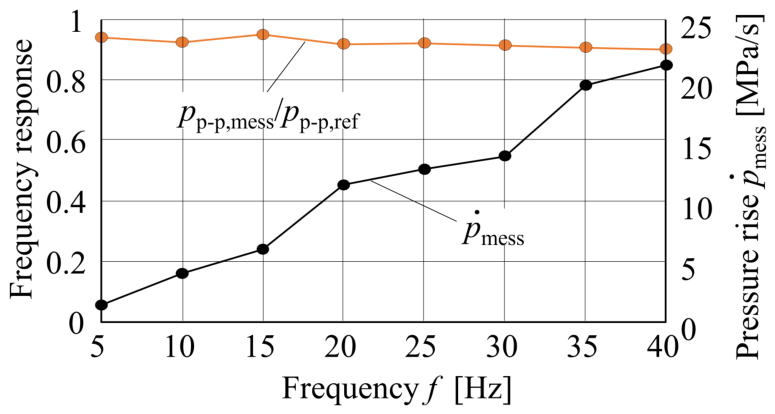
During dynamic calibration, the shaker is controlled in such a way that a pressure of ± 0.05 MPa is generated in the oil volume at 1 Hz. The control frequency is then increased. The transmission behavior of the integrated sensor to the reference sensor is evaluated using the peak-to-peak pressure values. Figure 6 shows the result of a typical calibration for one sensor position. With increasing frequency, the ratio between the measured pressure at bottom of the oil volume and measured reference pressure p p-p , m e s s / p p-p , r e f decreases by only a few percent. The level of measurable pressure rise is derived from the measured time curves of the pressure p m e s s ( t ) . At 40 Hz, the derived pressure rise p ˙ m e s s ( f = 40 H z ) = 21.4 M P a / s is greater than the required pressure rise calculated in Section 4.1. The first application of the measurement system to analyze the sink behavior of the carriage was described in [31].

4.4. Design and Verification of Point-Based Pressure Measurement

After successfully verifying the system with nine holes between the lubrication gap and the oil reservoir, the question arose whether the design of the oil reservoir would also allow for precise measurement with just a single hole (similar to Figure 3a). For these tests, a sleeve was inserted into the hole in the oil reservoir (Figure 5b). The sleeves are made from plastic tubing. Each has a radial opening to the pressure sensor and, on the opposite side, a borehole aligned with a borehole to slide in the rail. This means that a total of nine different sleeves are required per measuring position PS-1 to 7 (see Figure 4) for nine measurement runs, with corresponding modifications to the test stand. Typical verifications at measuring position PS-3 showed that the dynamic behavior with only one hole open in the rail closely corresponds to the behavior described in Section 4.3/Figure 6. The result is also independent of which of the holes 1 to 9 is open. A complete verification according to Section 4.3 at (theoretically) 54 measuring points was not carried out. However, a shortened procedure was established to check the correct installation of the sleeves before test runs.

5. Width-Related (2D) Pressure Measurement During Carriage Motion

5.1. Qualitative Evaluation of the Pressure Distribution

Figure 4 depicts the test stand with the position of the measuring points, which are marked relative to the starting position of the carriage for the forward stroke. With the acceleration a S = 3 m/s2 set in the measuring cycle and a maximum speed up to v S = 80 m/min, the sensors PS-2 to PS-6 lie in the constant speed range. The sensors PS-1 and PS-7 lie partly in the acceleration and deceleration range.
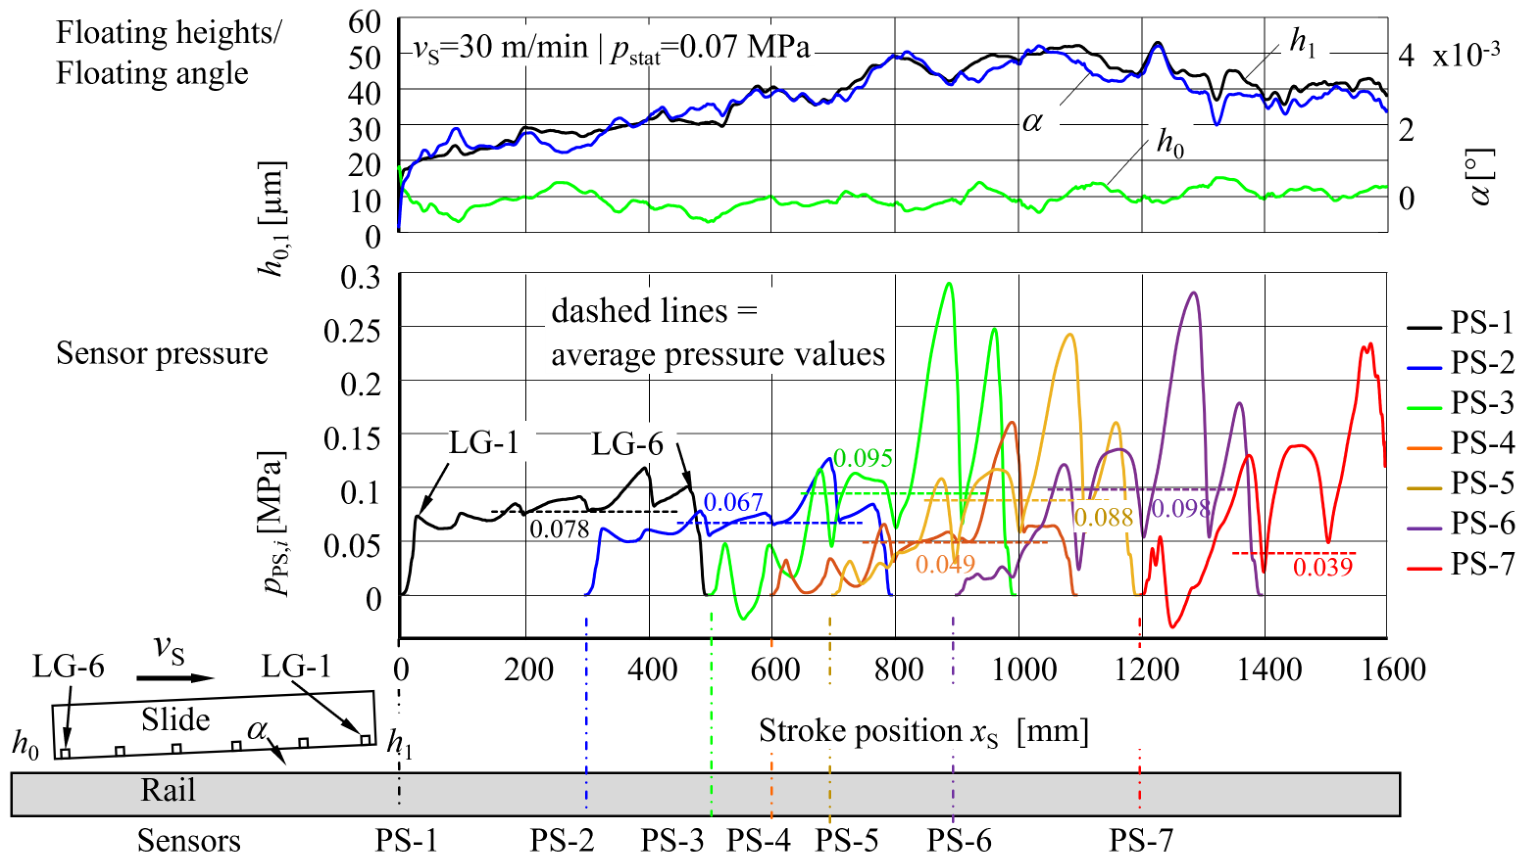
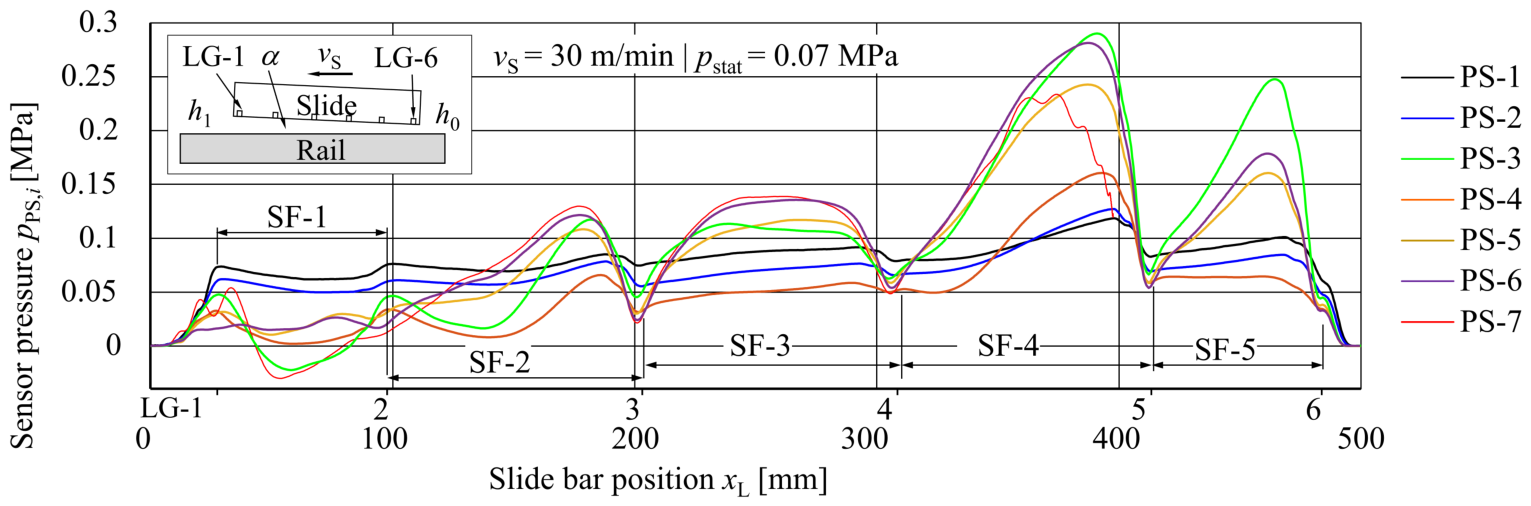
The typical measurement results in Figure 7 were derived at a feed rate v S = 30 m/min and a static pressure p s t a t = 0.07 MPa. In the upper part, in parallel to the relative floating heights h 0 ( x S ) and h 1 ( x S ) , the resulting floating angle α ( x S ) is shown. Due to the geometric deviations in the micrometer range, the lubricating oil flows unevenly out of the lubrication gap after the initial lubrication, resulting in deviations between the floating heights. In this specific case, the movement starts 5 s after lubrication with h 0 > h 1 . This initial behavior is systematically repeated for each series of measurements after the carriage has been reassembled. After a few millimeters of stroke, the expected floating behavior and the regular tilting of the carriage is achieved. Figure 7 also shows below the measured pressure curves p P S , i ( x L ) but related to the stroke position x S . Each of them starts at the sensor position x P S , i .
In this way, time-invariant slide-related pressure curves p S F , i ( x L ) are successively derived from the time-variant pressure curve for each sensor position. However, this results in a pressure curve mirroring that of Figure 1. This error-prone but pragmatic approach is a compromise between location-based and time-based representation. The effect of the following lubrication grooves can be clearly seen. The pressure peaks were numbered and assigned to the lubrication grooves LG-1 and LG-6, causing the results at sensor PS-1.
For a better interpretation of the pressure curves, the relative floating behavior parameters of the carriage h 0 / h 1 and angle α are also shown in the upper part of Figure 7 as a function of stroke, whereas the angle is derived from the measured floating heights.
The HD pressure peaks then increases continuously at pressure sensors PS-1 to PS-3, as a result of which the angle α and the floating height h 0 also increase. From a stroke of approx. x S = 1000 mm, the HD pressure drops also due to the increased lubrication gap. The HD pressure and the floating stay almost constant for the remaining stroke (PS-4 to PS-7). In Figure 8, the same measured pressure curves are overlaid and aligned to the length x L of the slide bar. It is clearly visible that all pressure curves show qualitatively similar curves especially for the position of the peaks. But of course the effects of the inclination of the carriage can also be seen in the pressure curve. This shows as an important result that deviations from the ideal geometrical conditions of the lubrication gap at different stroke positions have similar effects on the HD pressure curve, which can be detected very sensitively with the measuring method. The theoretical shape of the HD pressure curve acc. to Equation (2) can only be measured approximately on the sliding surface SF-3. As a result, however, it also shows that the pressure at the lubrication grooves does not drop to zero. There is a smoothing out of the actual sharp-ending pressure curves, so that the lubrication gap as a whole generates the HD pressure. The small area with negative pressure shows that the suction effect within the lubrication gap can also be measured.

5.2. Quantitative Evaluation of the Pressure Measurement

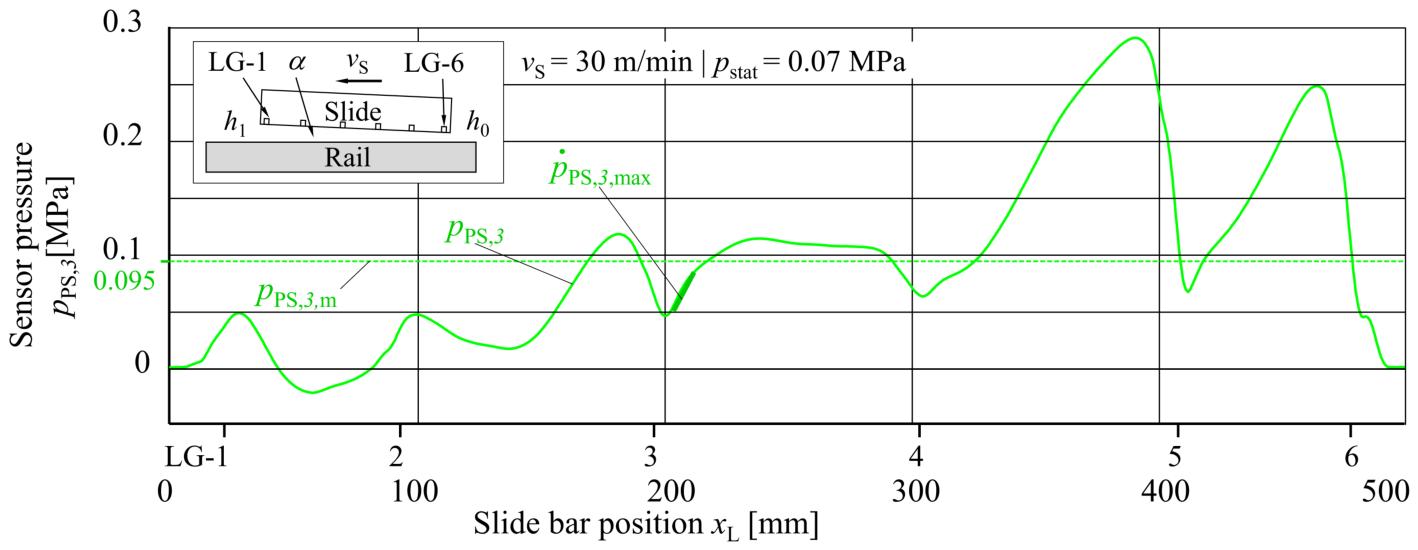
Beside the pressure peaks, the average pressure value p m is also important for the evaluation of the condition of a guideway. In the example measurement in Figure 7, the average pressure values are in a relatively narrow range of 0.049 < p m , i < 0.098 MPa (Figure 7). That means that the average measured pressure is clearly in the range of the static load of p s t a t = 0.07 MPa. Figure 9, in contrast, shows an enlarged example of the experimental values for pressure sensor PS-3 relative to the slide bar. It must of course be considered that the carriage of the test stand can float freely. The reaction force can only be in the range of the weight load. With the existing static load of p s t a t = 0.07 MPa, there is therefore an additional floating force of approx. 531 N , which is reflected in the shown high floating values. Even if the average values p P S , i , m derived from the pressure curves of sensors PS-1 to 6 (PS-7 not fully overrun) are used to form an average value p P S , m = 0.079 MPa over the stroke of the carriage, the result is a value that is greater than the static load p s t a t . Further analysis is required to draw more precise conclusions, particularly with regard to the character of the measured mean pressure values.
The maximum measured pressure rise at SF-3 is p ˙ P S , 3 , m a x = 2.9 MPa/s. This means that there is a clear reserve for use at higher feed rates.

6. Measurement of the Three-Dimensional Pressure Curve of the Hydrodynamic Linear Guideway

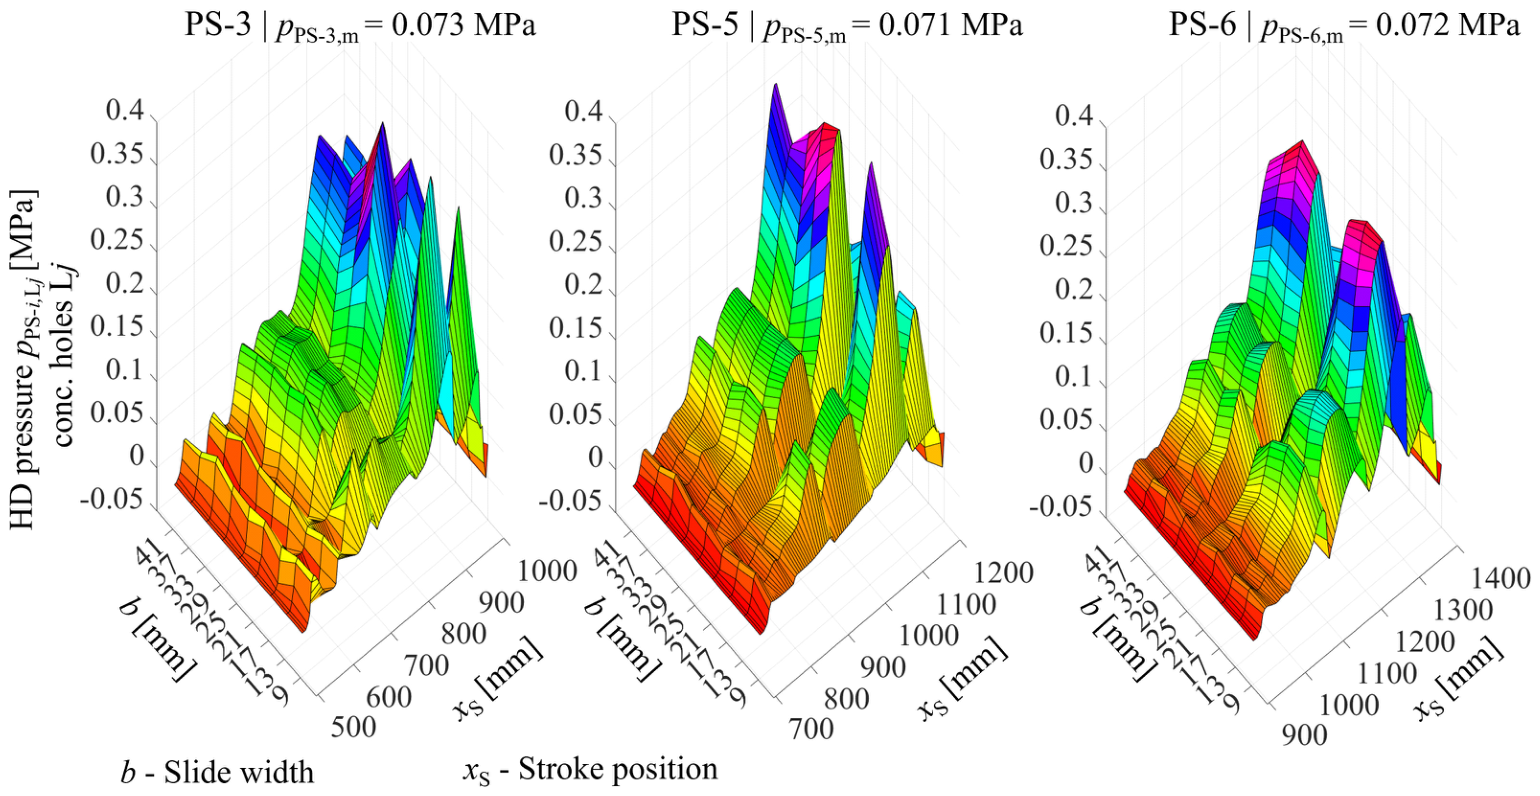
The spatial measurement curve of the pressure peak per measurement position PS-1 to PS-7 consists of nine lines, each of which is determined with one of the boreholes L1 to L9, while the remaining boreholes are closed (see Figure 5b). In addition, a comparative measurement with nine open boreholes is also performed for each test setup. In order to limit the experimental preparation and calibration effort, only measuring positions PS-3, PS-5, and PS-6 were selected for Figure 10. For the measurements again with a feed rate of v S = 30 m/min, the carriage was equipped with the plane slide bars shown in Figure 2b and test conditions remained unchanged. Figure 10 clearly shows that as the stroke increases, the pressure in the middle in the lateral direction of the slide bar collapses. One of the reasons for this can be found in the lubrication gap geometry. There is also asymmetry (cf. pressure at width b = 9 mm and 41 mm). For each measuring point PS-3, PS-5, and PS-6 the average pressure value p PS-i , m was calculated from the curves and in relation to the total area of the sliding bars. The area formed by the nine holes and the stroke of the slide is used for this purpose. The edge areas on the longitudinal edges of the slide bar are not used. Although theoretically the HD pressure is zero at the longitudinal edge, there remains some uncertainty regarding the curve over 9 mm to the side edge. But this means that the pressure caused by the static load p s t a t is not reached at the feed rate v S = 30 m/min demonstrated here. Comparative calculations resulted in an average pressure value p PS-i , m that is approx. 5% (@ v S = 1 m/min) to 12% (@ v S = 100 m/min) lower than p s t a t . Since sufficient floatation was measured, it can be assumed that fluid friction is present.
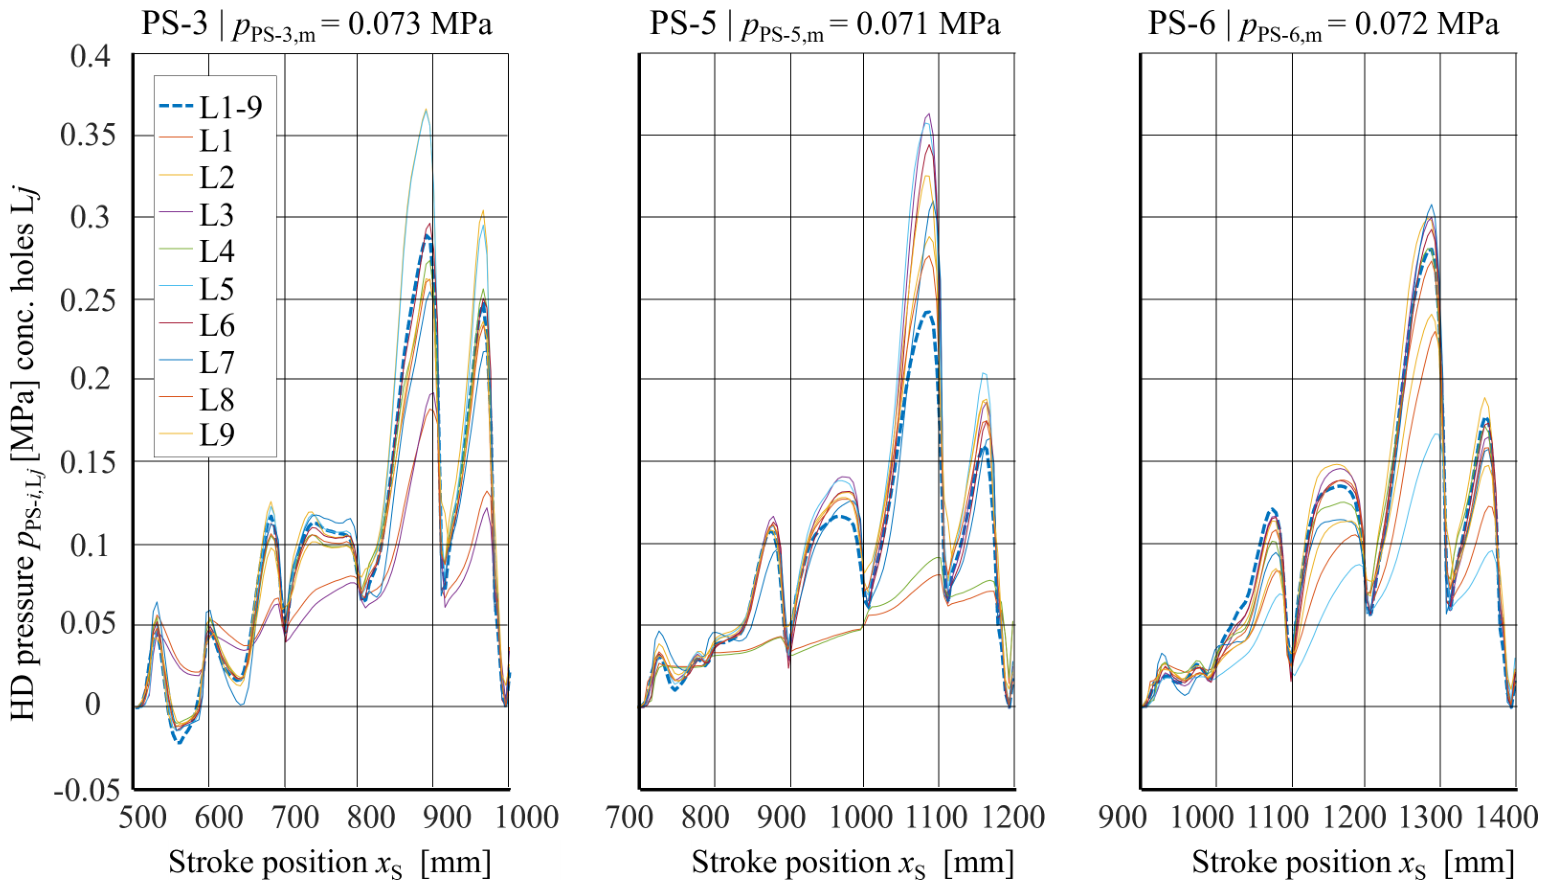
For the practical operation of a slide guidance system, it is not possible to measure simultaneously at the nine measuring points of a single measuring position PS-i. This raises the question of how the pressure measurement value pPS-i,m relates to the individual values pPS-i,Lj when there are nine open bores. Figure 11 shows that the average value is represented quite well and that pressure peaks at individual bores do not have a dominant influence on this value.

7. Example of an Analysis of a Hydrodynamic Slide Guidance System with Concave Slide Rails

In addition to varying the arrangement of the lubrication grooves, the design of the gap geometry is another way of positively influencing the behavior of the HD guidance. The idea of a concave sliding surface goes back to [4]. However, the literature review in [33] shows that only very low feed rates were considered in the state of the art at that time. Therefore, the idea of concave sliding rails was re-examined in [33]. In [33], the manufacture and design of the laterally concave sliding bars is described in detail. In contrast to Figure 2b, however, the concave sliding bars have only two lubrication grooves, which are located at the inlet and outlet edges. Friction and inclination are measured for feed rates up to v S = 100 m/min and compared with the behavior when using plane sliding bars. However, the cause of the reduction in friction and inclination can only be partially explained in [33].
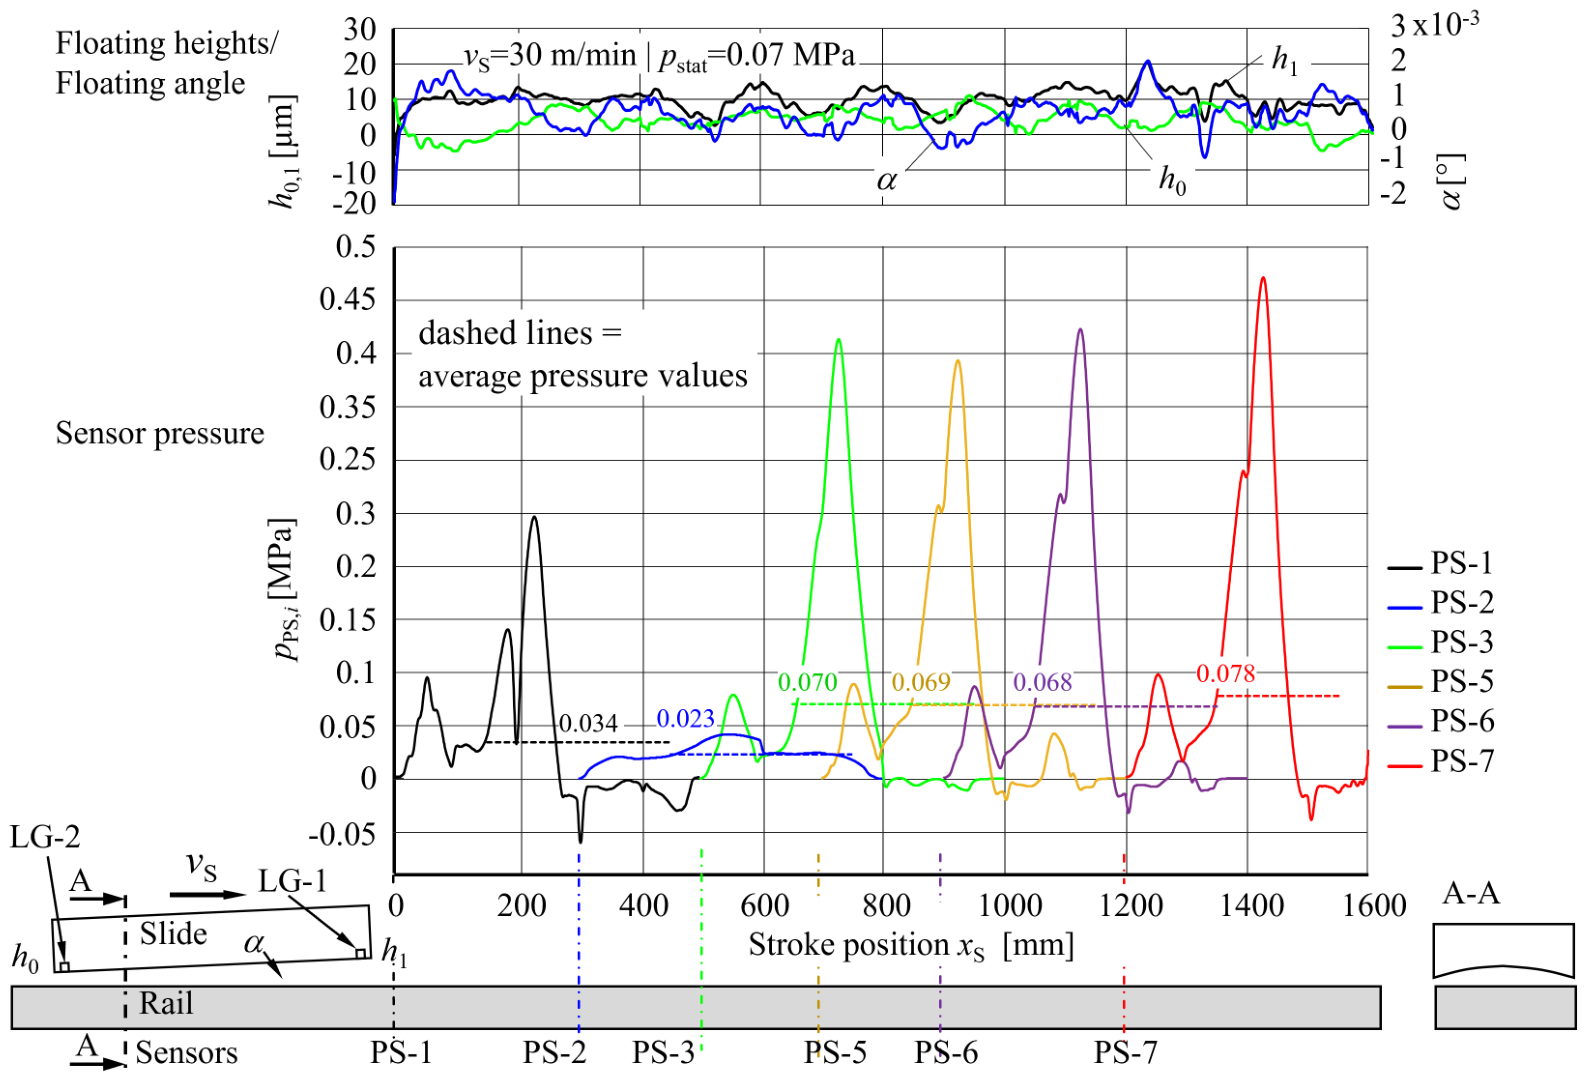
Continuing the work of [33], the behavior of the slide with concave slide bars was analyzed with regard to pressure curve. The concavity of the slide bar in the lateral direction is approximately 10 μm. To remain consistent, only the feed rate of v S = 30 m/min is discussed here, even though the overall investigation range was between v S = 10 and 100 m/min. Figure 12 shows the simple (2D) pressure curves in comparison to the floating heights h 0 ( x S ) and h 1 ( x S ) and lubrication wedge angle α ( x S ) . (The pressure sensor PS-4 could not be used for this measurement.) The biggest difference between plane and concave slide rails is the steep sinking directly after a lubrication cycle. Despite a very short waiting time after lubrication, the slide drops. Between the stroke positions x S = 300 and 600 mm, the HD pressure collapses and only builds up again after approx. 700 mm. The two pressure peaks are very distinctive for the concave slide rails. It can be assumed that the oil builds up in the lubrication gap and tries to flow off to the side. In contrast to the plain slide bars, the larger and more dominant of the two pressure peaks builds up approximately in the middle of the slide bar.
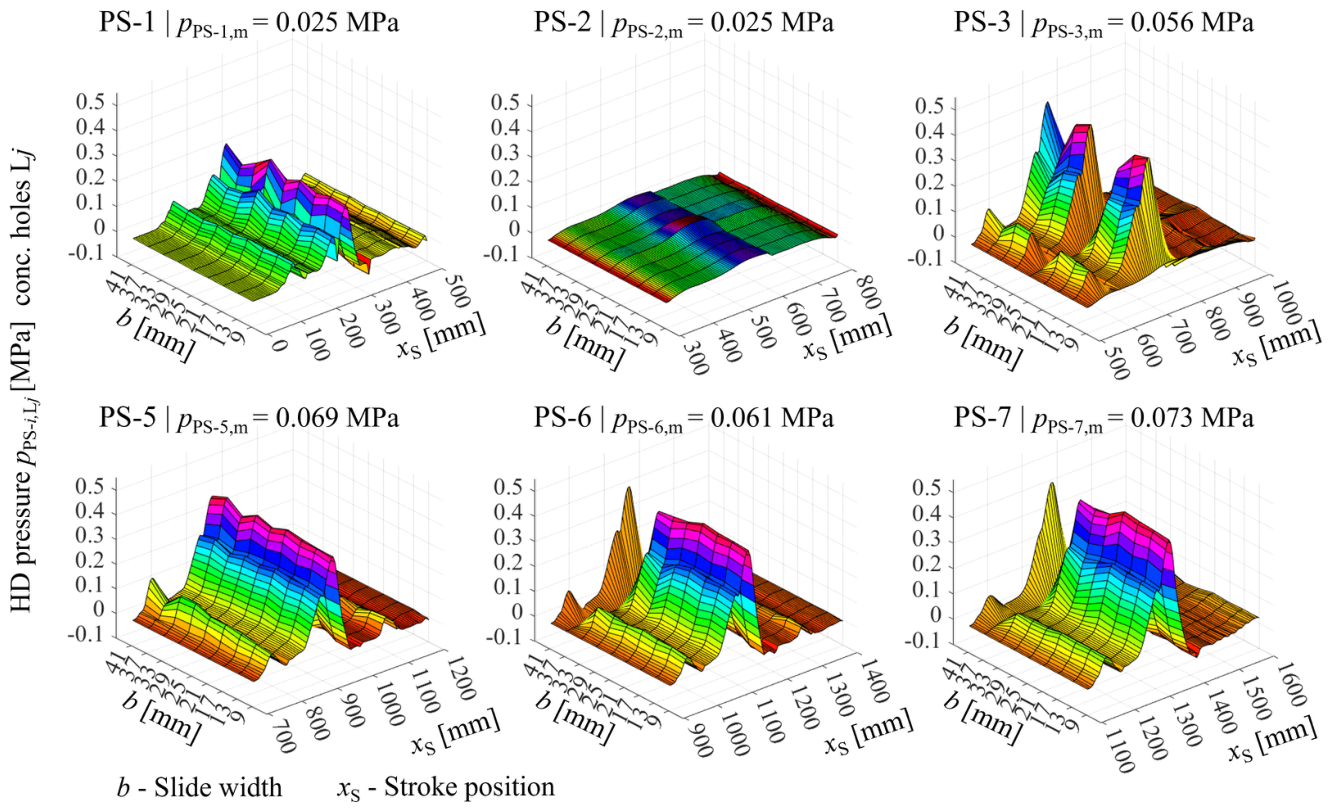
All measurements with feed rates between v S = 10 and 100 m/min showed that the average pressure pPS-i,L1–9, measured when all nine holes at the measuring points are open, is lower than the static pressure p s t a t up to approx. 50 m/min. At feed rates v S > 50 m/min, the average pressure pPS-i,L1–9 is higher than the static pressure p s t a t . This means that the deviations must be assessed individually for the concave sliding bar. These peaks are less steep at the long sides of the slide bar than with plane slide bars, so that the differences between a total measurement of pPS-i,L1–9 and the measurements with the individual holes L1 to L9 are not that considerable. The pressure peaks (Figure 13) explain why the floatation heights h 0 ( x S ) and h 1 ( x S ) oscillate and why the lubrication wedge angle α ( x S ) even changes in the opposite direction in some cases. In contrast to the plane bars, there are more areas of the stroke in which the sensors measure negative pressure, i.e., suction. However, this also indicates that there is sufficient oil in the lubrication gap, which is important for diagnostic purposes.
However, Figure 12 and Figure 13 also clearly show that, as with the plane slide bar, partial pressure drops can occur. The expected low coefficient of friction was again verified. The lower value is only achieved from the feed rate v S = 30 m/min upwards and only in the constant speed range. Overall, it must be concluded that the benefits of the concave slide bar are limited in relation to the manufacturing effort required.

8. Conclusions and Outlook

With the measuring system, installed for the first time in a steel rail of a linear guiding system, it is possible to measure the transient pressure curve relatively sensitively over the entire stroke. The results can be summarized as follows:
  • The measuring system was verified both by means of individual static and dynamic laboratory tests and in the installed state in the test stand under real operating conditions.
  • With the developed measuring system, a stroke-dependent hydrodynamic pressure can be measured both in relation to the rail width, which represents a kind of average value, and to the point.
  • The qualitative curves of the pressure curves at different stroke positions are very comparable with each other. This means that although the sensor systems measure different pressure levels, they take into account the real lubrication gap geometry in the same very sensitive way.
  • Direct quantitative comparison of measurements with calculation is not possible due to insufficient consideration of side leakage losses, geometric tolerances and throttling losses within the sensor system. However, the indirect comparison via the average pressure leads to significantly smaller differences between the two values.
The results shown are based on typical laboratory measurements in which sufficient oil with a lubrication gap was supplied. The system and the measurement evaluation must be further developed with regard to real reversing operation in machine tools, where air pockets can easily form and falsify the measurement result. In addition, the number of sensors must be reduced. In the future, it is planned to use the pressure sensors to monitor the lubrication condition of the linear guides of machine tools without measuring the floating heights in order to realize an improved, resource-saving but reliable lubrication system for the linear guideways.

Author Contributions

Conceptualization, V.W.; methodology, V.W.; software, B.I. and V.W.; validation, V.W.; formal analysis, V.W.; investigation, V.W. and B.I.; resources, V.W.; data curation, V.W. and B.I.; writing—original draft preparation, V.W.; writing—review and editing, V.W. and M.D.; visualization, V.W.; supervision M.D.; project administration, V.W.; funding acquisition, V.W. All authors have read and agreed to the published version of the manuscript.

Funding

This work was funded by the Deutsche Forschungsgemeinschaft (DFG, German Research Foundation)—Project-ID 285064832 (WI 4053/9-2). The authors thank them for their support.

Data Availability Statement

The original contributions presented in the study are included in the article; further inquiries can be directed to the corresponding author.

Conflicts of Interest

I “Volker Wittstock” and all other authors declare that the research was conducted in the absence of any commercial or financial relationship that could be construed as a potential conflict of interest.

Abbreviations

The following abbreviations and symbols are used in this manuscript:
H D Hydrodynamic
H D G HD linear guideways
LBore hole
L G Lubricating groove
P S Pressure sensor
R D E Reynolds’ differential equation
S F Partial sliding surface
Nomenclature and Acronyms
α in °Lubrication wedge angle
η in mPasDynamic viscosity of lubricant
ρ in kg/m3Density of lubrication oil
σ i in μmRMS roughness of sliding surfaces
ψ -Correction factor conc. p H D
a-Coefficient concerning p H D , b , m
a S in m/s2Axis acceleration
bin mmTotal width of the slide bar
fin HzExcitation frequency in tests
F stat in NStatic weight load
F d y n in NDynamic load
h 0 in μmOutlet floating height (measured)
h 1 in μmInlet floating height (measured)
h m i n in μmMinimum floating height for liquid friction
h o i l in μmLubricating oil film height
i-Index concerning LG/SF
l L in mmTotal length of the slide bar
l S F , i in mmPartial lengths of SF-i
m -Gap narrowing
m-Reciprocal of m
m-Index for average values
max -Index for maximum values
mess -Index for measured values
pin MPaPressure
p H D in MPaHD pressure in theory with infinite width b
p H D , b , m in MPaAverage pressure in theory with finite width
p P S , i in MPaMeasured pressure of PS-i
p P S , i , m in MPaAverage of p P S , i
p P S , m in MPaAverage pressure over stroke
p S F , i in MPaMeasured pressure at SF-i
p s t a t in MPaStatic surface pressure
p p-p , m e s s in MPaMeasured pressure peak-to-peak
p p-p , r e f in MPaMeasured ref. pressure peak-to-peak
p ˙ in MPa/sPressure rise
p ˙ H D in MPa/sHD pressure rise in theory
p ˙ P S , 3 , m a x in MPa/sMeasured p ˙ of sensor PS-3
R 1 , 2 -Correction factors acc. to [25]
R a μmMeasured roughness of SF
S o -Sommerfeld number
tin sTime
v S in m/minFeed rate of carriage
v k i n in m2/sKinematic viscosity
xin mmGeneral x-coordinate
x L in mmLength coordinate of slide bar
x L , p m a x in mmPosition of maximum pressure
x P S , i in mmPosition of PS-i
x S in mmLength coordinate of forward stroke of carriage
y, zin mmGeneral y and z-coordinate

References

  1. Uriarte, L.; Zatarain, M.; Axinte, D.; Yagué-Fabra, J.; Ihlenfeldt, S.; Eguia, J.; Olarra, A. Machine tools for large parts. CIRP Ann. 2013, 62, 731–750. [Google Scholar] [CrossRef]
  2. Hirsch, A.; Zhu, B. Hydrodynamische Gleitführungen in Werkzeugmaschinen—Ein Auslaufmodell? (Hydrodynamic Sliding Guideways in Machine Tools—A Discontinued Model?). Konstruktion 2011, 63, 67–72. [Google Scholar]
  3. Brecher, C.; Weck, M. Machine Tools Production Systems 2: Design, Calculation and Metrological Assessment; Springer Vieweg: Berlin, Germany, 2021; pp. 226–253. [Google Scholar] [CrossRef]
  4. Shiozaki, S.; Nakano, Y. Fluctuation of lubricant film thickness at table slideways of surface grinding machines. Bull. JSME 1969, 12, 1212–1222. [Google Scholar] [CrossRef][Green Version]
  5. Lakawathana, P.; Matsubara, T.; Nakamura, T. Mechanism of hydrodynamic load capacity generation on a slideway. JSME Int. J. Ser. C Mech. Syst. Mach. Elem. Manuf. 1998, 41, 125–133. [Google Scholar]
  6. Grote, K.; Antonsson, E.K. Springer Handbook of Mechanical Engineering; Springer: New York, NY, USA, 2009; pp. 307–313. [Google Scholar]
  7. Parvaz, H.; Nategh, M.J. Modeling the Hydrodynamic Lubrication Function of Scrapings in Machine Tool Slideways. Adv. Mater. Res. 2012, 445, 1035–1040. [Google Scholar]
  8. Sinanoğlu, C.; Nair, F.; Karamiş, M.B. Effects of shaft surface texture on journal bearing pressure distribution. J. Mater. Process. Technol. 2005, 168, 344–353. [Google Scholar] [CrossRef]
  9. Graf, G. Druckaufbau im Schmierfilm Statisch und Dynamisch Belasteter Radialgleitlager, Experimentelle Untersuchung. Ph.D. Thesis, TH Karlsruhe, Karlsruhe, Germany, 1971. [Google Scholar]
  10. Spies, K.H. Druckaufbau im Statisch Belasteten Gleitlager: Experimentelle Untersuchung. Ph.D. Thesis, TH Karlsruhe, Karlsruhe, Germany, 1975. [Google Scholar]
  11. Zargari, P. Einfluss der Makrogeometrie auf Tragfähigkeit und Betriebssicherheit von Gleitlagern. Ph.D. Thesis, RWTH Aachen, Aachen, Germany, 1980. [Google Scholar]
  12. Mihara, Y.; Hayashi, T.; Nakamura, M.; Someya, T. Development of measuring method for oil film pressure of engine main bearing by thin film sensor. JSAE Rev. 1995, 16, 125–130. [Google Scholar] [CrossRef]
  13. Mihara, Y.; Kajiwara, M.; Fukamatsu, T.; Someya, T. Study on the measurement of oil-film pressure of engine main bearing by thin-film sensor. The influence of bearing deformation on pressure sensor output under engine operation. JSAE Rev. 1996, 17, 281–286. [Google Scholar] [CrossRef]
  14. Mihara, Y.; Someya, T. Measurement of Oil-Film Pressure in Engine Bearings Using a Thin-Film Sensor. Tribol. Trans. 2002, 45, 11–20. [Google Scholar] [CrossRef]
  15. Someya, T.; Mihara, Y. New thin film sensors for engine bearings. In Proceedings of the CIMAC Congress, Kyoto, Japan, 7–11 June 2004. Paper No. 91. [Google Scholar]
  16. Iwata, T.; Oikawa, M.; Owashi, M.; Mihara, Y.; Ito, K.; Ninomiya, Y.; Kato, Y.; Kubota, S. The Verification of Engine Analysis Model Accuracy by Measuring Oil Film Pressure in the Main Bearings of a Motorcycle High-Speed Engine Using a Thin-Film Sensor. Lubricants 2022, 10, 314. [Google Scholar] [CrossRef]
  17. Fuller, D.D. Theory and Practice of Lubrication for Engineers, 2nd ed.; Wiley: New York, NY, USA, 1984. [Google Scholar] [CrossRef]
  18. Lang, R.; Steinhilper, W. Gleitlager; Springer: Berlin/Heidelberg, Germany, 1978. [Google Scholar]
  19. Kortendieck, W. Ölverteilung in Werkzeugmaschinen-Gleitführungen Aufbau des Schmierfilms in hydrodynamischen Gleitführungen und Einfluss der Schlittenbewegungen auf den Schmierzustand. Maschinenmarkt 1969, 75, 2095–2100. [Google Scholar]
  20. Wächter, K.; Fleischer, G. Konstruktionslehre für Maschineningenieure, Grundlagen, Konstruktions- und Antriebselemente, 2nd ed.; Verlag Technik: Berlin, Germany, 1989; pp. 664–673. [Google Scholar]
  21. van Ostayen, R. Film height optimization of dynamically loaded hydrodynamic slider bearings. Tribol. Int. 2010, 43, 1786–1793. [Google Scholar] [CrossRef]
  22. Saito, T. Development of Machine Tool’s Guideways—Dynamically Pressurized, Statically Pressurized and Partially Floated Guideways. JTEKT Eng. J. Engl. Ed. 2012, 1001E, 57–64. [Google Scholar]
  23. Bagci, C.; Singh, A.P. Hydrodynamic Lubrication of Finite Slider Bearings: Effect of One Dimensional Film Shape, and Their Computer Aided Optimum Designs. J. Lubr. Technol. 1983, 105, 48–63. [Google Scholar] [CrossRef]
  24. Alyaqout, S.F.; Elsharkawy, A.A. Optimal film shape for two-dimensional slider bearings lubricated with couple stress fluids. Tribol. Int. 2011, 44, 36–342. [Google Scholar] [CrossRef]
  25. Zhang, Y.; Wittstock, V.; Putz, M. Simulation for instable floating of hydrodynamic guides during acceleration and at constant velocity. J. Mach. Eng. 2018, 3, 5–15. [Google Scholar] [CrossRef]
  26. Gläser, M.; Wittstock, V.; Hirsch, A.; Putz, M. Simulation method for the floating of hydrodynamic guides. Procedia CIRP 2017, 62, 346–350. [Google Scholar] [CrossRef]
  27. Wegmann, R. Schmiertheorie Durch Einbeziehung des Unterdruckgebietes in die Berechnung Instationär Belasteter Gleitlager. Ph.D. Thesis, Universität Rostock, Rostock, Germany, 1974. Reprint 2009. Available online: http://www.rolandwegmann.de/downloads/dissertation_rw/sonstige/downloads.htm (accessed on 20 September 2024).
  28. Shu, J.-J.; Teo, B.M.; Chan, K.W. Fluid Velocity Slip and Temperature Jump at a Solid Surface. ASME. Appl. Mech. 2017, 69, 020801. [Google Scholar] [CrossRef]
  29. Neugebauer, R.; Hirsch, A.; Kolouch, M.; Zhu, B. Optimierung der Schmiernutenform in hydrodynamischen Gleitführungen. Konstruktion 2012, 63, 71–74. [Google Scholar]
  30. Ibrar, B.; Wittstock, V.; Regel, J.; Dix, M. Integration and Verification of Miniature Fluid Film Pressure Sensors in Hydrodynamic Linear Guides. J. Mach. Eng. 2023, 23, 38–55. [Google Scholar] [CrossRef]
  31. Ibrar, B.; Wittstock, V.; Regel, J.; Dix, M. Influence of Lubrication Cycle Parameters on Hydrodynamic Linear Guides through Simultaneous Monitoring of Oil Film Pressure and Floating Heights. Lubricants 2024, 12, 287. [Google Scholar] [CrossRef]
  32. Ibrar, B.; Wittstock, V.; Regel, J.; Dix, M. Development of the sensor to measure the pressure distribution in the lubrication gap for linear hydrodynamic guides. In Production at the Leading Edge of Technology; WGP 2022. Lecture Notes in Production Engineering; Springer: Cham, Switzerland, 2023; pp. 276–287. [Google Scholar] [CrossRef]
  33. Zhang, Y. Beitrag Zur Modellierung Des Aufschwimmverhaltens Hydrodynamischer Gleitführungen. Ph.D. Thesis, TU Chemnitz, Verlag Wissenschaftliche Scripten, Auerbach, Germany, 2025. Available online: https://nbn-resolving.org/urn:nbn:de:bsz:ch1-qucosa2-994716 (accessed on 20 January 2026).
  34. Drews, K. Über Untersuchungen der Reibungs- und Bewegungsverhältnisse an Werkzeugmaschinen-Flachführungen im Grenzreibungsgebiet. Ph.D. Thesis, TH Darmstadt, Darmstadt, Germany, 1967. [Google Scholar]
  35. Piwowarsky, E. Anforderungen an Lineargleitführungen und Einfluss der Schmierstoffe. Tribol. Schmier. 1999, 46, 33–37. [Google Scholar]
  36. Wittstock, V.; Ibrar, B.; Dix, M. Experimentelle Verifizierung des hydrodynamischen Drucks in Gleitführungen zur Kontrolle der Schmierung bei hohen Geschwindigkeiten; 15. VDI Fachtagung, Gleit- und Wälzlagerungen; VDI-Berichte Band 2415; VDI Verlag: Düsseldorf, Germany, 2023; pp. 211–220. [Google Scholar] [CrossRef]
Figure 1. Principal pressure distribution in the lubricant of a hydrodynamic linear bearing according to Reynolds (unscaled).
Machines 14 00609 g001
Figure 2. Test facilities and equipment used: (a) Setup of the linear test stand. (b) Double symmetric geometry of the sliding surface and the lubrication grooves of the steel slide bar.
Machines 14 00609 g002
Figure 3. Cross-section views of measuring principle: (a) Principle of the preliminary test acc. to [33]. (b) Favorite design principle of the sensor placement acc. to [32].
Machines 14 00609 g003
Figure 4. Position of the front steel slide rail at the start of the stroke and positions of the integrated pressure sensors PS-1 to PS-7 in the guiding rail of the test stand and its final design shown in cross-section.
Machines 14 00609 g004
Figure 5. (a) Setup for dynamic characterization of the pressure sensor integrated in the steel rail (left) and schematic cross-section (right). (b) The same setup as in figure (a), but with an additional sleeve that closes all but one hole to the lubrication gap.
Machines 14 00609 g005
Figure 6. Pressure rise p ˙ m e s s derived from the pressure curve over time and frequency response of the measured pressure in relation to rail width.
Machines 14 00609 g006
Figure 7. Measured carriage-related pressure curve p S F , i ( x L ) of the sensors PS-1 to PS-7 transformed to the stroke coordinate x S with marking of the average pressure values in dashed lines (bottom) and the corresponding measured floating heights h 0 ( x S ) and h 1 ( x S ) and lubrication wedge angle α ( x S ) during forward stroke (top).
Machines 14 00609 g007
Figure 8. Comparison of measurement (overlaid and aligned) curves of the pressure sensors PS-1 to PS-7 related to slide bar length at constant feed rate.
Machines 14 00609 g008
Figure 9. Measured pressure of PS-3 as well as the average value over the entire slide bar length l L and the point of maximum pressure rise.
Machines 14 00609 g009
Figure 10. Spatial curves of hydrodynamic pressure (mirrored/rail-related) determined during the same forward stroke and averaged pressure pPS-i,m with sensors PS-3, -5, and -6 on plane slide bars at static load p s t a t = 0.07 MPa and feed rate of v S = 30 m/min.
Machines 14 00609 g010
Figure 11. Comparison of the pressure curves measured via the individual boreholes L1 to L9 with the curve measured via all boreholes with sensors PS-3, -5, and -6 on plane slide bars at static load p s t a t = 0.07 MPa and feed rate of v S = 30 m/min.
Machines 14 00609 g011
Figure 12. Measured carriage-related pressure curve p S F , i ( x L ) of the sensors PS-1 to PS-3 and PS-5 to PS-7 transformed to the stroke coordinate x S using concave slide bars with marking of the average pressure values in dashed lines (bottom) and the corresponding measured floating heights h 0 ( x S ) and h 1 ( x S ) and lubrication wedge angle α ( x S ) during forward stroke (top) at static load p s t a t = 0.07 MPa and feed rate of v S = 30 m/min.
Machines 14 00609 g012
Figure 13. Spatial curves of hydrodynamic pressure (mirrored/rail-related) determined during the same forward stroke and averaged pressure pPS-i,m with sensors PS-1 to -5, and PS-5 to -7 on concave slide bars at static load p s t a t = 0.07 MPa and feed rate of v S = 30 m/min.
Machines 14 00609 g013
Disclaimer/Publisher’s Note: The statements, opinions and data contained in all publications are solely those of the individual author(s) and contributor(s) and not of MDPI and/or the editor(s). MDPI and/or the editor(s) disclaim responsibility for any injury to people or property resulting from any ideas, methods, instructions or products referred to in the content.