Article

A Method for Detecting Damage in Drill Tool Threads Based on APMR-GBM

1
College of Safety and Ocean Engineering, China University of Petroleum, Beijing 102249, China
2
Key Laboratory of Oil and Gas Safey and Emergency Technology Ministry of Emergency Management, Beijing 100007, China
3
Zhejiang Academy of Special Equipment Science, Hangzhou 310020, China
4
Zhejiang Key Laboratory of Special Equipment Safety Technology, Hangzhou 310020, China
*
Author to whom correspondence should be addressed.
Machines 2026, 14(5), 519; https://doi.org/10.3390/machines14050519
Submission received: 9 March 2026 / Revised: 1 May 2026 / Accepted: 5 May 2026 / Published: 8 May 2026
(This article belongs to the Section Machines Testing and Maintenance)

Abstract

Drill pipe threads are susceptible to fatigue cracking under complex downhole loads, posing significant risks to drilling safety. Although metal magnetic memory (MMM) testing enables efficient nondestructive evaluation, its practical utility is often compromised by interference from material magnetization and lift-off distance. To overcome this limitation, we introduce a novel damage assessment method based on the area peak-to-mean ratio (APMR) of magnetic signals. This feature is specifically designed to suppress external disturbances while retaining sensitivity to stress-induced magnetic anomalies. Finite element analysis was performed to elucidate the magneto-mechanical coupling behavior at defective thread roots. Subsequently, MMM signals were acquired from drill pipe threads under varying inspection conditions using a custom-built scanning system equipped with 16 tunneling magnetoresistance (TMR) sensors. Multiple features, including APMR, were extracted and evaluated across various machine learning classifiers. The gradient boosting machine (GBM) achieved superior performance, yielding an accuracy of 0.9861 and a recall of 1.0000 on the test set—outperforming all other models. This work presents an effective automated approach for drill pipe thread damage evaluation, contributing to enhanced reliability and safety in drilling operations.

1. Introduction

Drill pipes serve as the “backbone” of drilling operations, subjected to cyclic stresses including tension, compression, torsion, and bending [1,2,3]. As oil and gas drilling depths continue to increase, the service conditions of drill pipes become increasingly severe. When drill pipes reach critical rotational speeds, vibrations occur [4], often leading to pipe bending, excessive wear [5], rapid damage progression, and fatigue failure [6]. Fatigue cracks tend to initiate particularly at connector sections—regions of stress concentration [7]. Once microcracks appear, the stress concentration factor increases [8], dramatically accelerating crack propagation and potentially leading to drill string failure. Such failures range from disrupting drilling operations and causing economic losses to, in severe cases, triggering blowouts. Consequently, employing appropriate nondestructive testing (NDT) methods to detect crack defects at drill pipe connector sections is crucial for preventing accidents. Mainstream NDT techniques include magnetic particle testing [9], ultrasonic testing [10], and metal magnetic memory (MMM) testing [11]. The advantages, limitations, and underlying mechanisms of each method are summarized and illustrated in the following table.
As evident from the comparative analysis in Table 1, the Metal Magnetic Memory (MMM) technique—characterized by its operational simplicity, strong applicability, rapid inspection capability, and portability—is particularly well-suited for detecting thread damage in drill pipes under field drilling conditions. First proposed by Russian scholars, MMM is an effective method for evaluating early-stage fatigue damage in ferromagnetic materials. In ferromagnetic components, abnormal stress states can induce microscopic defects or stress concentration zones on the surface or within the material. Notably, MMM is sensitive not only to macroscopic defects but also to hidden flaws and stress concentration states, thereby offering the potential for proactive failure prevention.
To date, numerous studies have investigated the characteristics of MMM signals in metallic materials under various fatigue damage states. For instance, Liu et al. [12] developed a multi-parameter magnetic charge model incorporating residual stress, phase transformations, and cracks to analyze MMM signal features at pipeline welds, enabling quantitative assessment of weld damage levels. Yang et al. [13] investigated the effect of double circular hole defects on MMM signals through tensile testing, revealing a strong correlation between the gradient of MMM signals and stress distribution—providing both theoretical and experimental support for quantitative defect evaluation in ferromagnetic materials. He et al. [14] integrated MMM with relative entropy theory to characterize fatigue damage in welds, offering a theoretical basis for early warning. Yang et al. [15] combined a strain-type Jiles–Atherton hysteresis model, a magnetic charge model, and a cumulative damage mechanics model to establish a theoretical relationship between MMM signals and cumulative plastic damage in butt welds under low-cycle fatigue. Liu et al. [16] systematically acquired and analyzed all three components of MMM signals, demonstrating that the Bx and Bz components are more stable than By and better suited for early fatigue damage assessment—providing experimental evidence for multi-component MMM-based fatigue evaluation.
In parallel, several studies have explored broader metal damage detection and fatigue assessment methodologies. Ge et al. [17] proposed an AC-excited Helmholtz coil array probe capable of full-circumference, non-contact, quantitative detection of multiple defect types—successfully identifying holes, axial cracks, and circumferential cracks and approximating defect profiles. Perng et al. [18] developed an innovative optical thread plug gauge system that captures and stitches local images of internal threads into a complete two-dimensional unfolded image, enabling damage detection and classification for internal drill pipe threads. Kong et al. [19] designed a machine vision-based hardware-software system and proposed an improved template matching method for online visual inspection of surface defects on external bolt threads. Su et al. [20] investigated crack propagation and fatigue life evaluation in locally corroded bridge steel using high-cycle fatigue tests and MMM technology. By applying a naive Bayes model, they achieved statistical fatigue life assessment based on magnetic feature parameters, offering a novel approach for early damage diagnosis and life prediction in corroded bridge steel. Li et al. [21] proposed a rapid defect profile reconstruction method based on MMM. Using an improved magnetic charge model and a chaotic particle swarm optimization (PSO) algorithm, they achieved high-precision reconstruction of rectangular and V-shaped defects with errors within ±5%. Wang et al. [22] introduced an automated network design method combining neural architecture search and weight-balancing techniques to construct a high-performance, lightweight convolutional neural network for multi-label classification of sewer pipe defects under imbalanced dataset conditions.
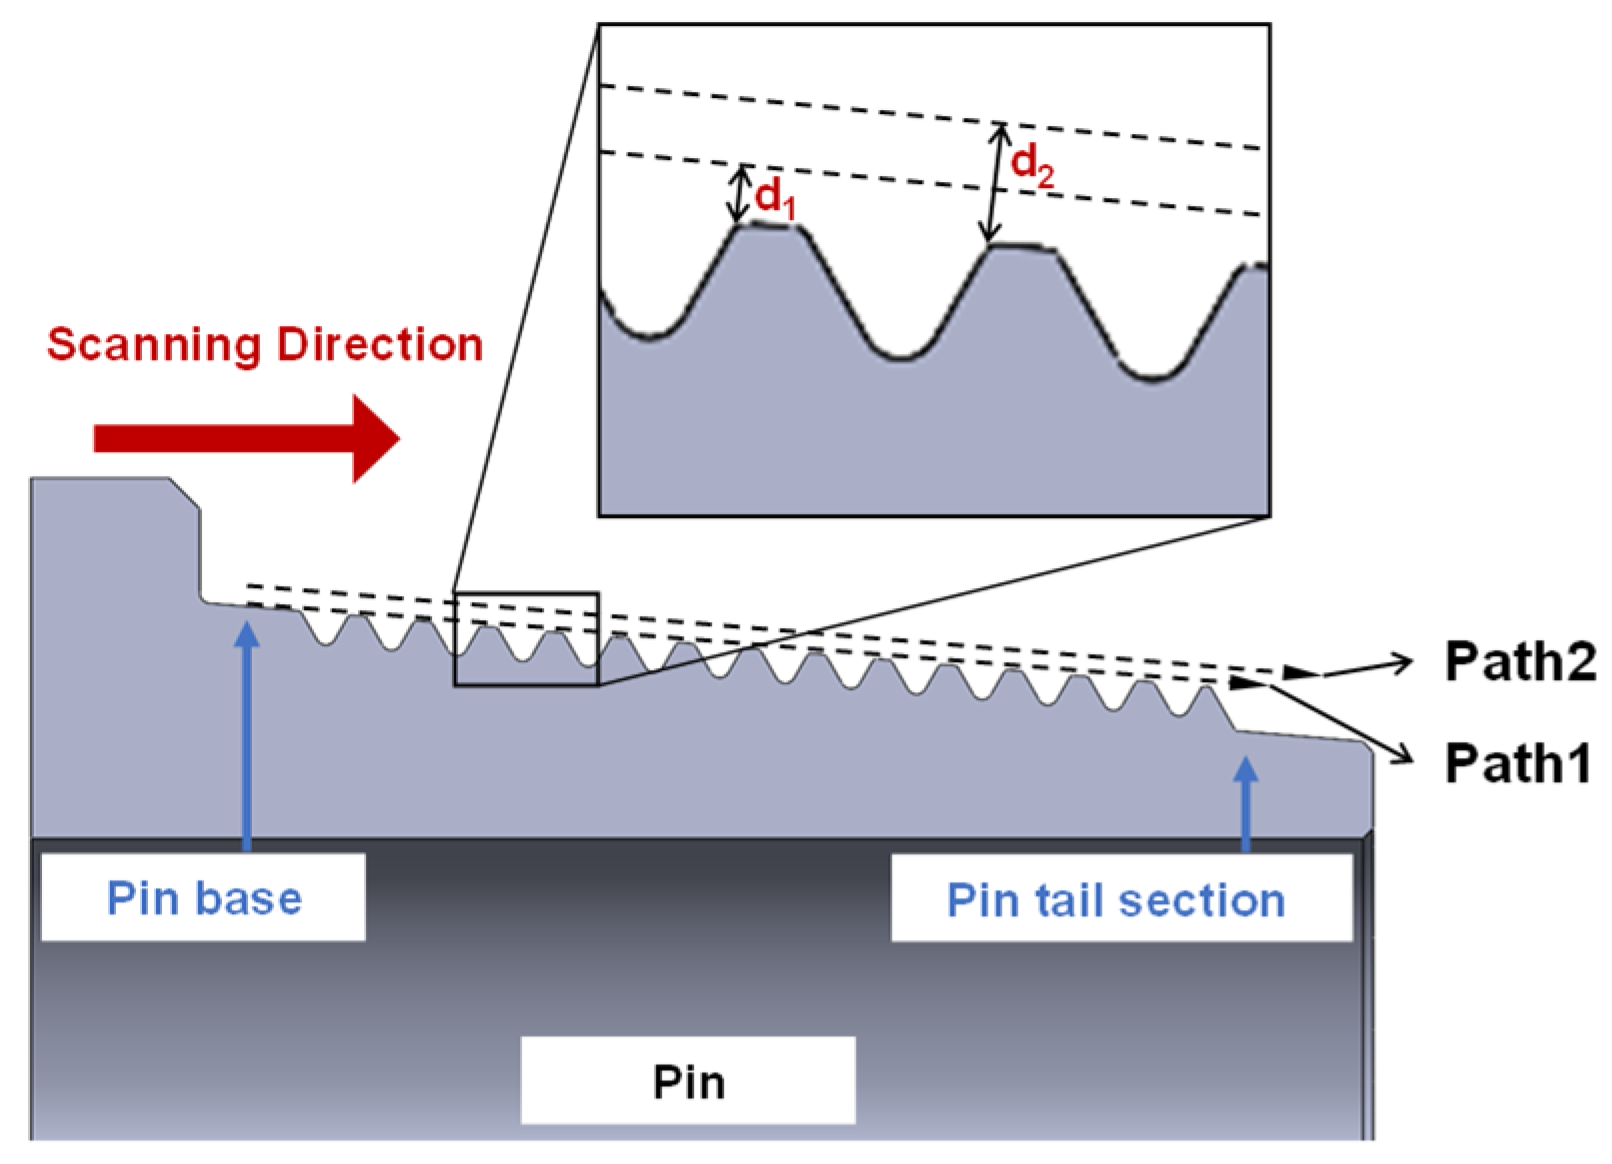
In summary, substantial research has been devoted to understanding the magnetic memory effect during fatigue damage in metallic materials, leading to the development of various fatigue damage evaluation methods and exploratory applications of MMM technology. However, as illustrated in Figure 1, the practical deployment of MMM remains challenging due to interference from factors such as sample magnetization intensity, scanning speed, and lift-off distance—limiting its adoption in field applications. To address this gap, we propose a novel method for evaluating thread damage in drill pipes based on the Area Peak-to-Mean Ratio (APMR) of magnetic memory signals, integrating both simulation and experimental approaches. The proposed method effectively mitigates the influence of magnetization intensity, scanning speed, and lift-off distance on defect detection, enabling accurate identification of thread damage states. By combining this approach with a custom-developed drill pipe thread scanning device and machine learning algorithms, we achieve efficient and precise assessment of thread damage—offering a new technical pathway for the non-destructive evaluation of drill pipe threads.

2. Theoretical Analysis

When an external magnetic field strength HH is applied to a ferromagnetic material without any external stress ( σ = 0 ), the resulting magnetic flux density is denoted as B T . Under the influence of stress, the magnetic flux density becomes B σ . These quantities can be expressed as:
B T = μ 0 μ T H
B σ = μ 0 μ σ H
where μ 0 is the vacuum permeability and μ σ and μ T represent the relative permeabilities with and without applied stress, respectively.
When stress is applied to a ferromagnetic material, the magnetic flux density changes from B T to B σ . During magnetization, the energy change per unit volume corresponding to the alteration of the magnetization state—termed the stress energy E —can be obtained by approximately integrating the hysteresis loop or constitutive relation. Assuming negligible hysteresis and that the material operates in the linear region, this energy change can be approximated as:
E = H   d B H ( B σ B T ) 2
Substituting Equations (1) and (2) into the above expression yields:
E = ( μ σ μ T ) 2 μ 0 μ σ 2 B σ 2
For a magnetostrictively homogeneous ferromagnetic material under stress, the magnetoelastic energy [23] can be expressed as:
E σ = 3 2 λ σ σ co s 2 θ
where λ σ is the magnetostriction coefficient, σ is the stress (positive for tensile stress, negative for compressive stress, in MPa), and θ is the angle between the magnetization direction and the internal stress direction. When the external force is aligned with the magnetization direction, the magnetic energy change induced by the stress, as derived from energy conservation, is given by:
E σ = 3 2 λ σ σ
According to the approximate model proposed in Ref. [24], the magnetostriction coefficient λ σ under stress is proportional to the square of the magnetization (or magnetic flux density). When the magnetic flux density reaches its saturation value B m , the magnetostriction coefficient also attains its saturation value λ m . Thus:
λ σ λ m = B σ 2 B m 2
where B m is the saturation magnetic flux density. Further simplification leads to:
μ σ μ T = 3 σ λ σ μ 0 H 2
In a thermodynamic equilibrium state, the change in free energy of the system induced by external stress can be described by two equivalent physical pictures: one is the macroscopic magnetic energy change (stress energy E ), and the other is the magnetoelastic energy ( E σ ) based on the microscopic magnetostriction mechanism. For a system in thermodynamic equilibrium, these two descriptions must be equivalent—they represent the same physical reality. Therefore, we have E = E σ . Expanding this equality yields:
1 2 μ 0 H 2 ( μ σ μ T ) = 3 2 λ σ σ
Substituting Equations (2) and (7) into Equation (9) and eliminating λ σ and H yields the relationship between the permeability of a ferromagnetic material and the applied stress:
3 μ 0 λ m σ B m 2 μ σ 2 + μ σ μ T = 0
Solving this quadratic equation using Vieta’s formulas gives the expression for the relative permeability:
μ σ = B m 2 + B m 4 + 12 B m 2 μ 0 λ m σ μ T 6 μ 0 λ m σ

3. Finite Element Simulation Analysis

To comprehensively investigate the distribution characteristics of magnetic memory signals in drill pipe threads under fatigue damage conditions, finite element simulations were conducted to analyze the magneto-mechanical coupling effect [25] in defective drill pipe pins.

3.1. Model and Meshing

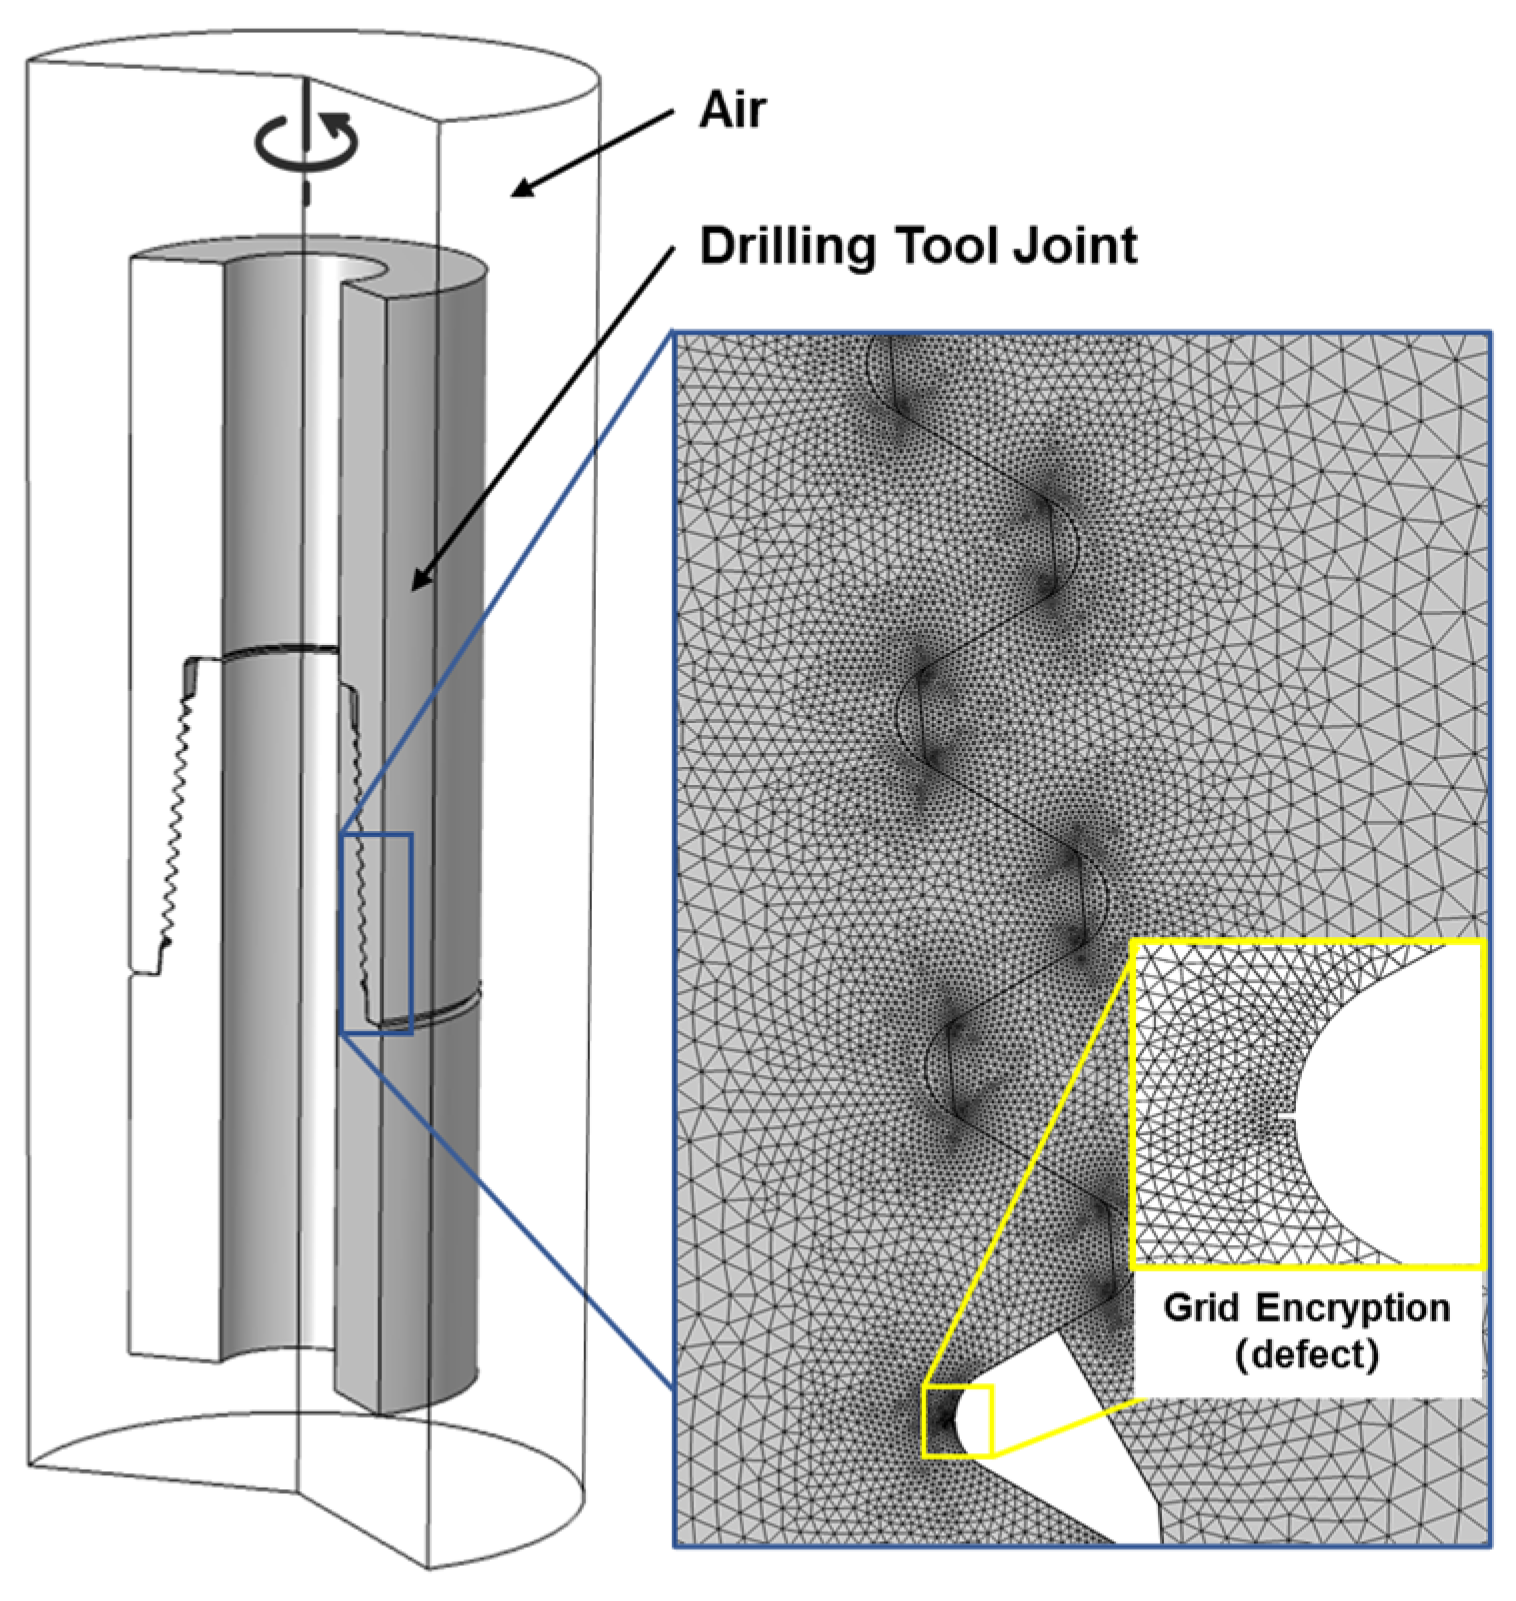
A drill pipe connector model containing defects was established and subsequently discretized through meshing. Figure 2 presents the developed finite element model alongside the refined meshing results for the threaded section, where local mesh refinement was implemented at the roots of defective threads to ensure computational accuracy.

3.2. Boundary Conditions

The primary loads experienced by drill pipe during operation are internal pressure and axial loading. Accordingly, the following boundary conditions were established in the model. A fixed constraint was applied at one axial end of the drill pipe to simulate the fixed end of the drill string, while an axial compressive load of 7 tons was applied at the opposite end to represent the actual downhole loading conditions. Concurrently, a uniformly distributed internal pressure of 26 MPa was applied to the inner wall to simulate the effect of drilling fluid pressure. To accurately extract the surface magnetic field distribution characteristics of the pin, the relative permeability of the surrounding air domain (Box) was set to 1, while all other material parameters remained unchanged. This approach effectively eliminates any interference from the air domain on the magnetic field distribution, ensuring that the simulation results reflect only the magnetic field distortion attributable to defects within the pin itself.

3.3. Results and Analysis

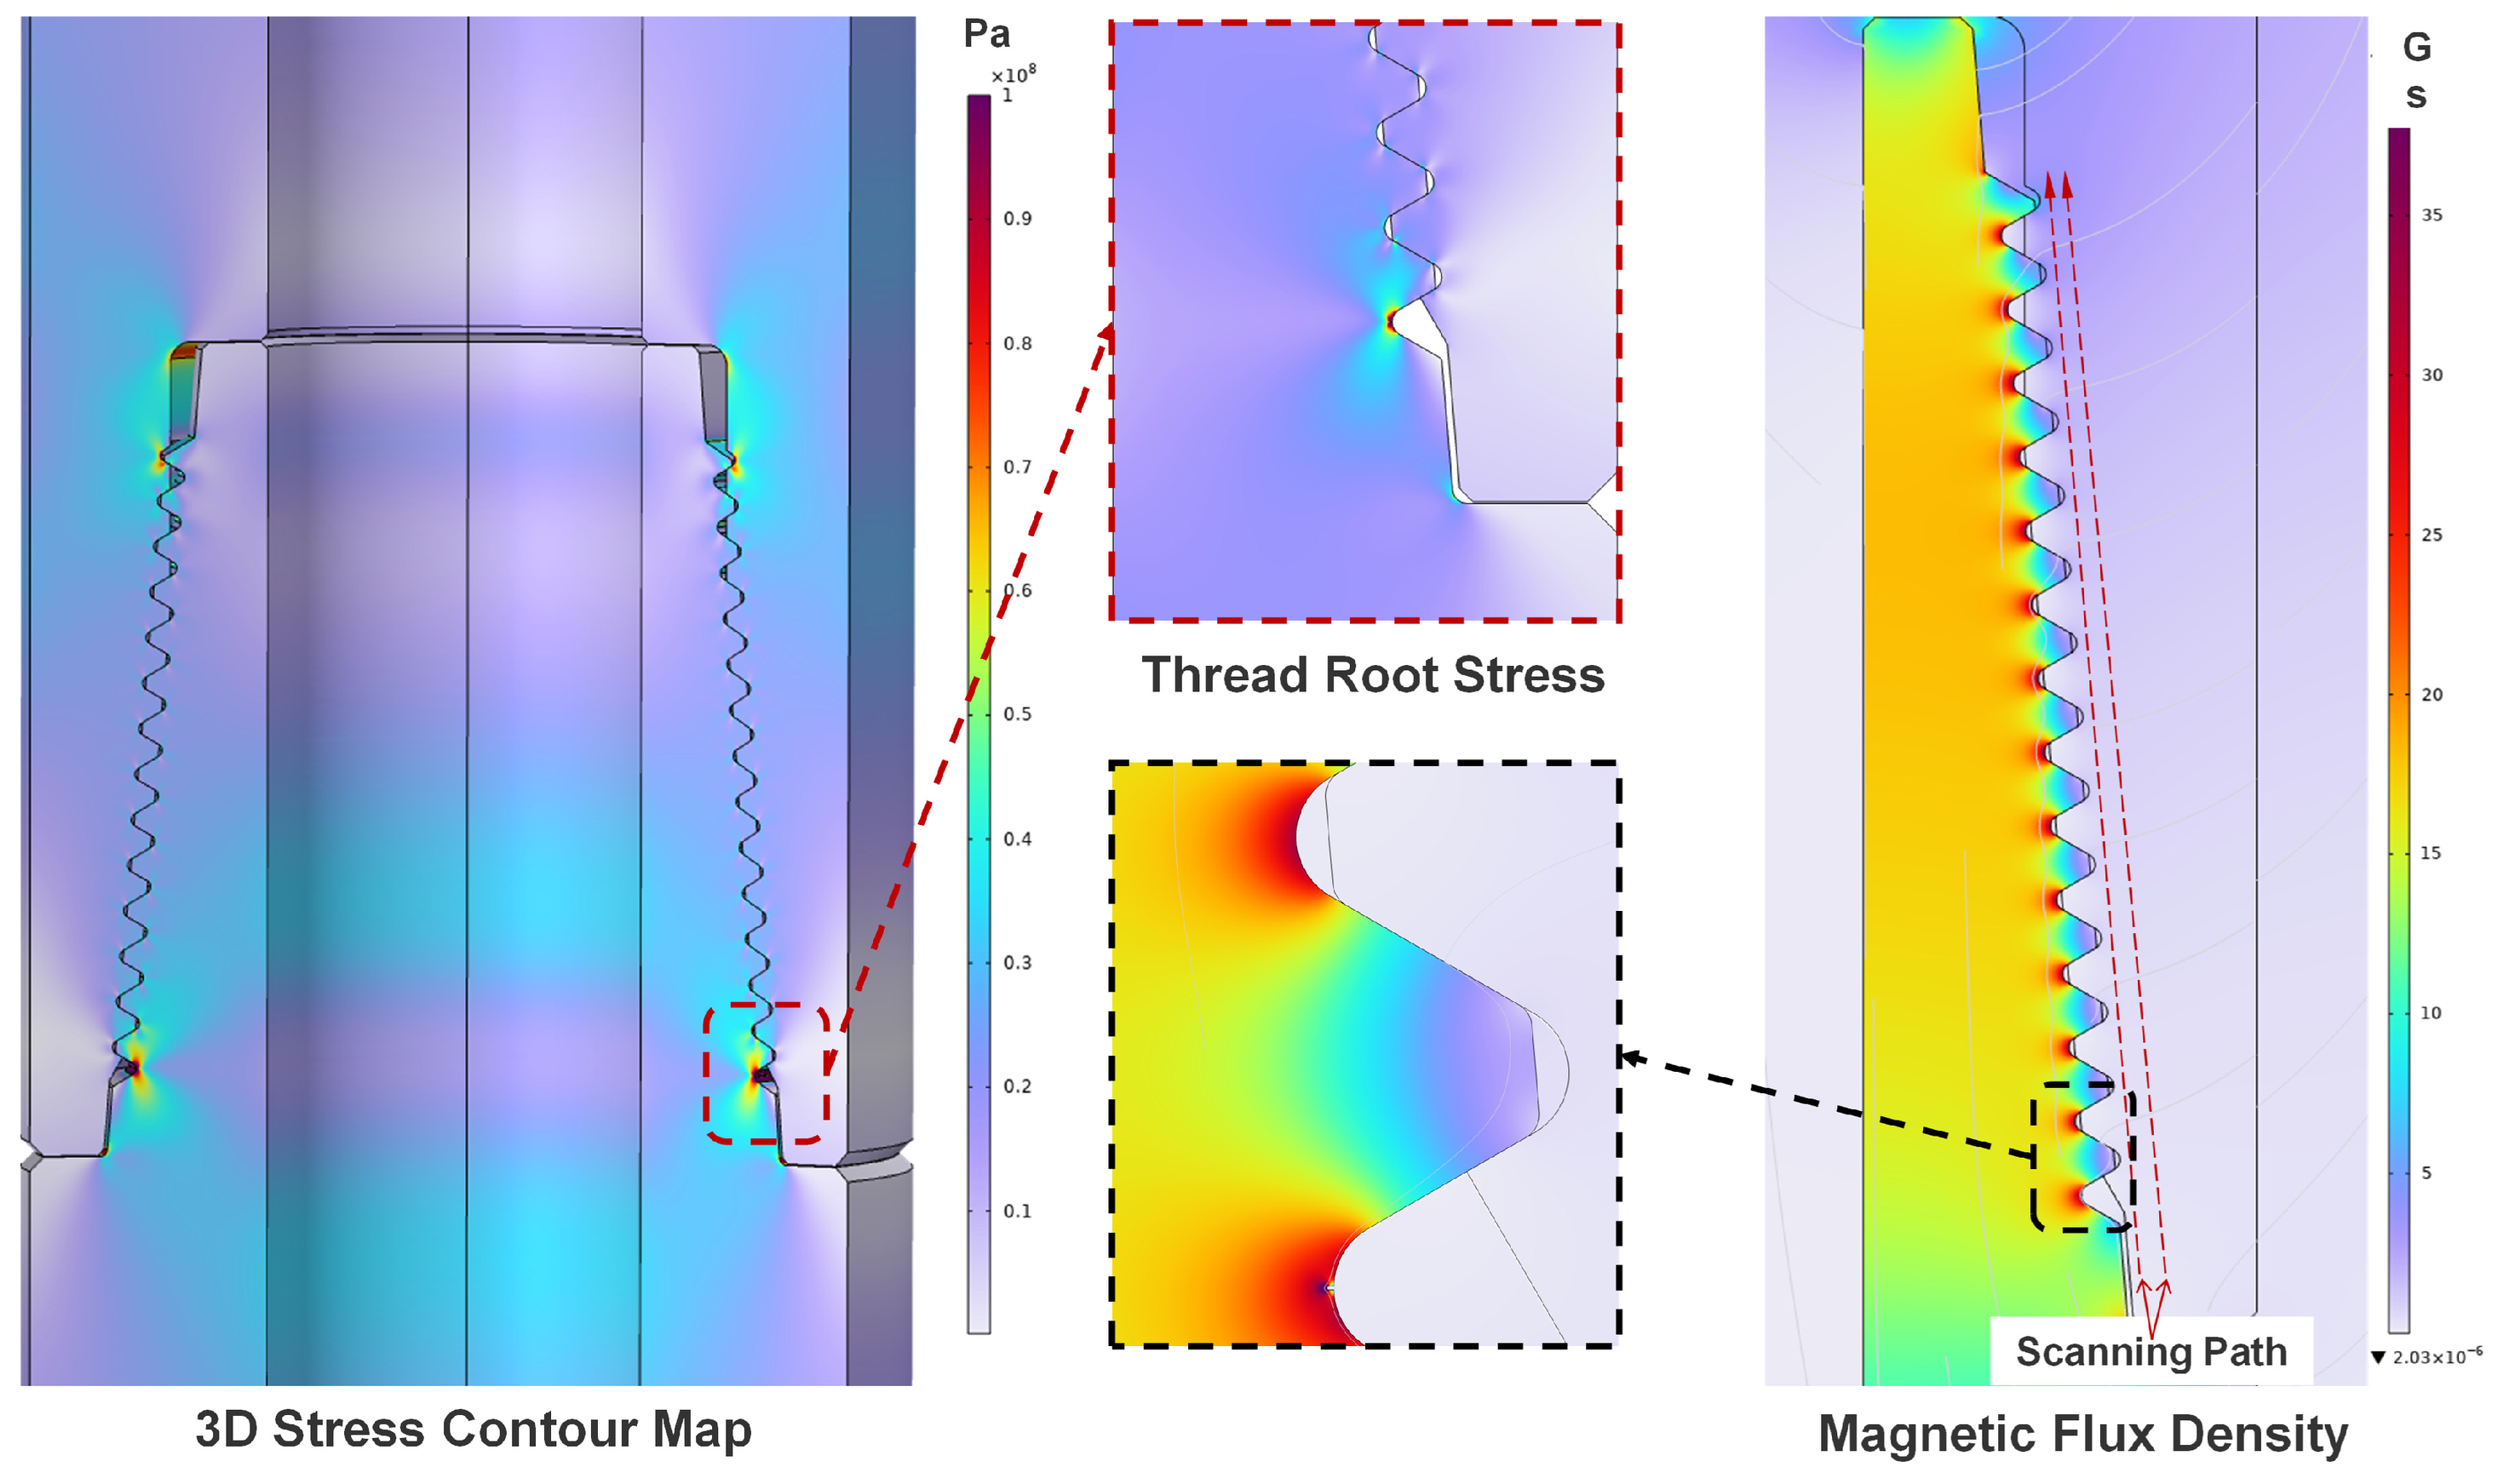
The simulated stress distribution contour and the cross-sectional magnetic flux density contour are presented in Figure 3. Owing to microscopic defects at the thread roots, stress concentration in this region is significantly more pronounced compared to other thread sections. Concurrently, a distinct distortion of the magnetic field intensity is observed at the defect locations.
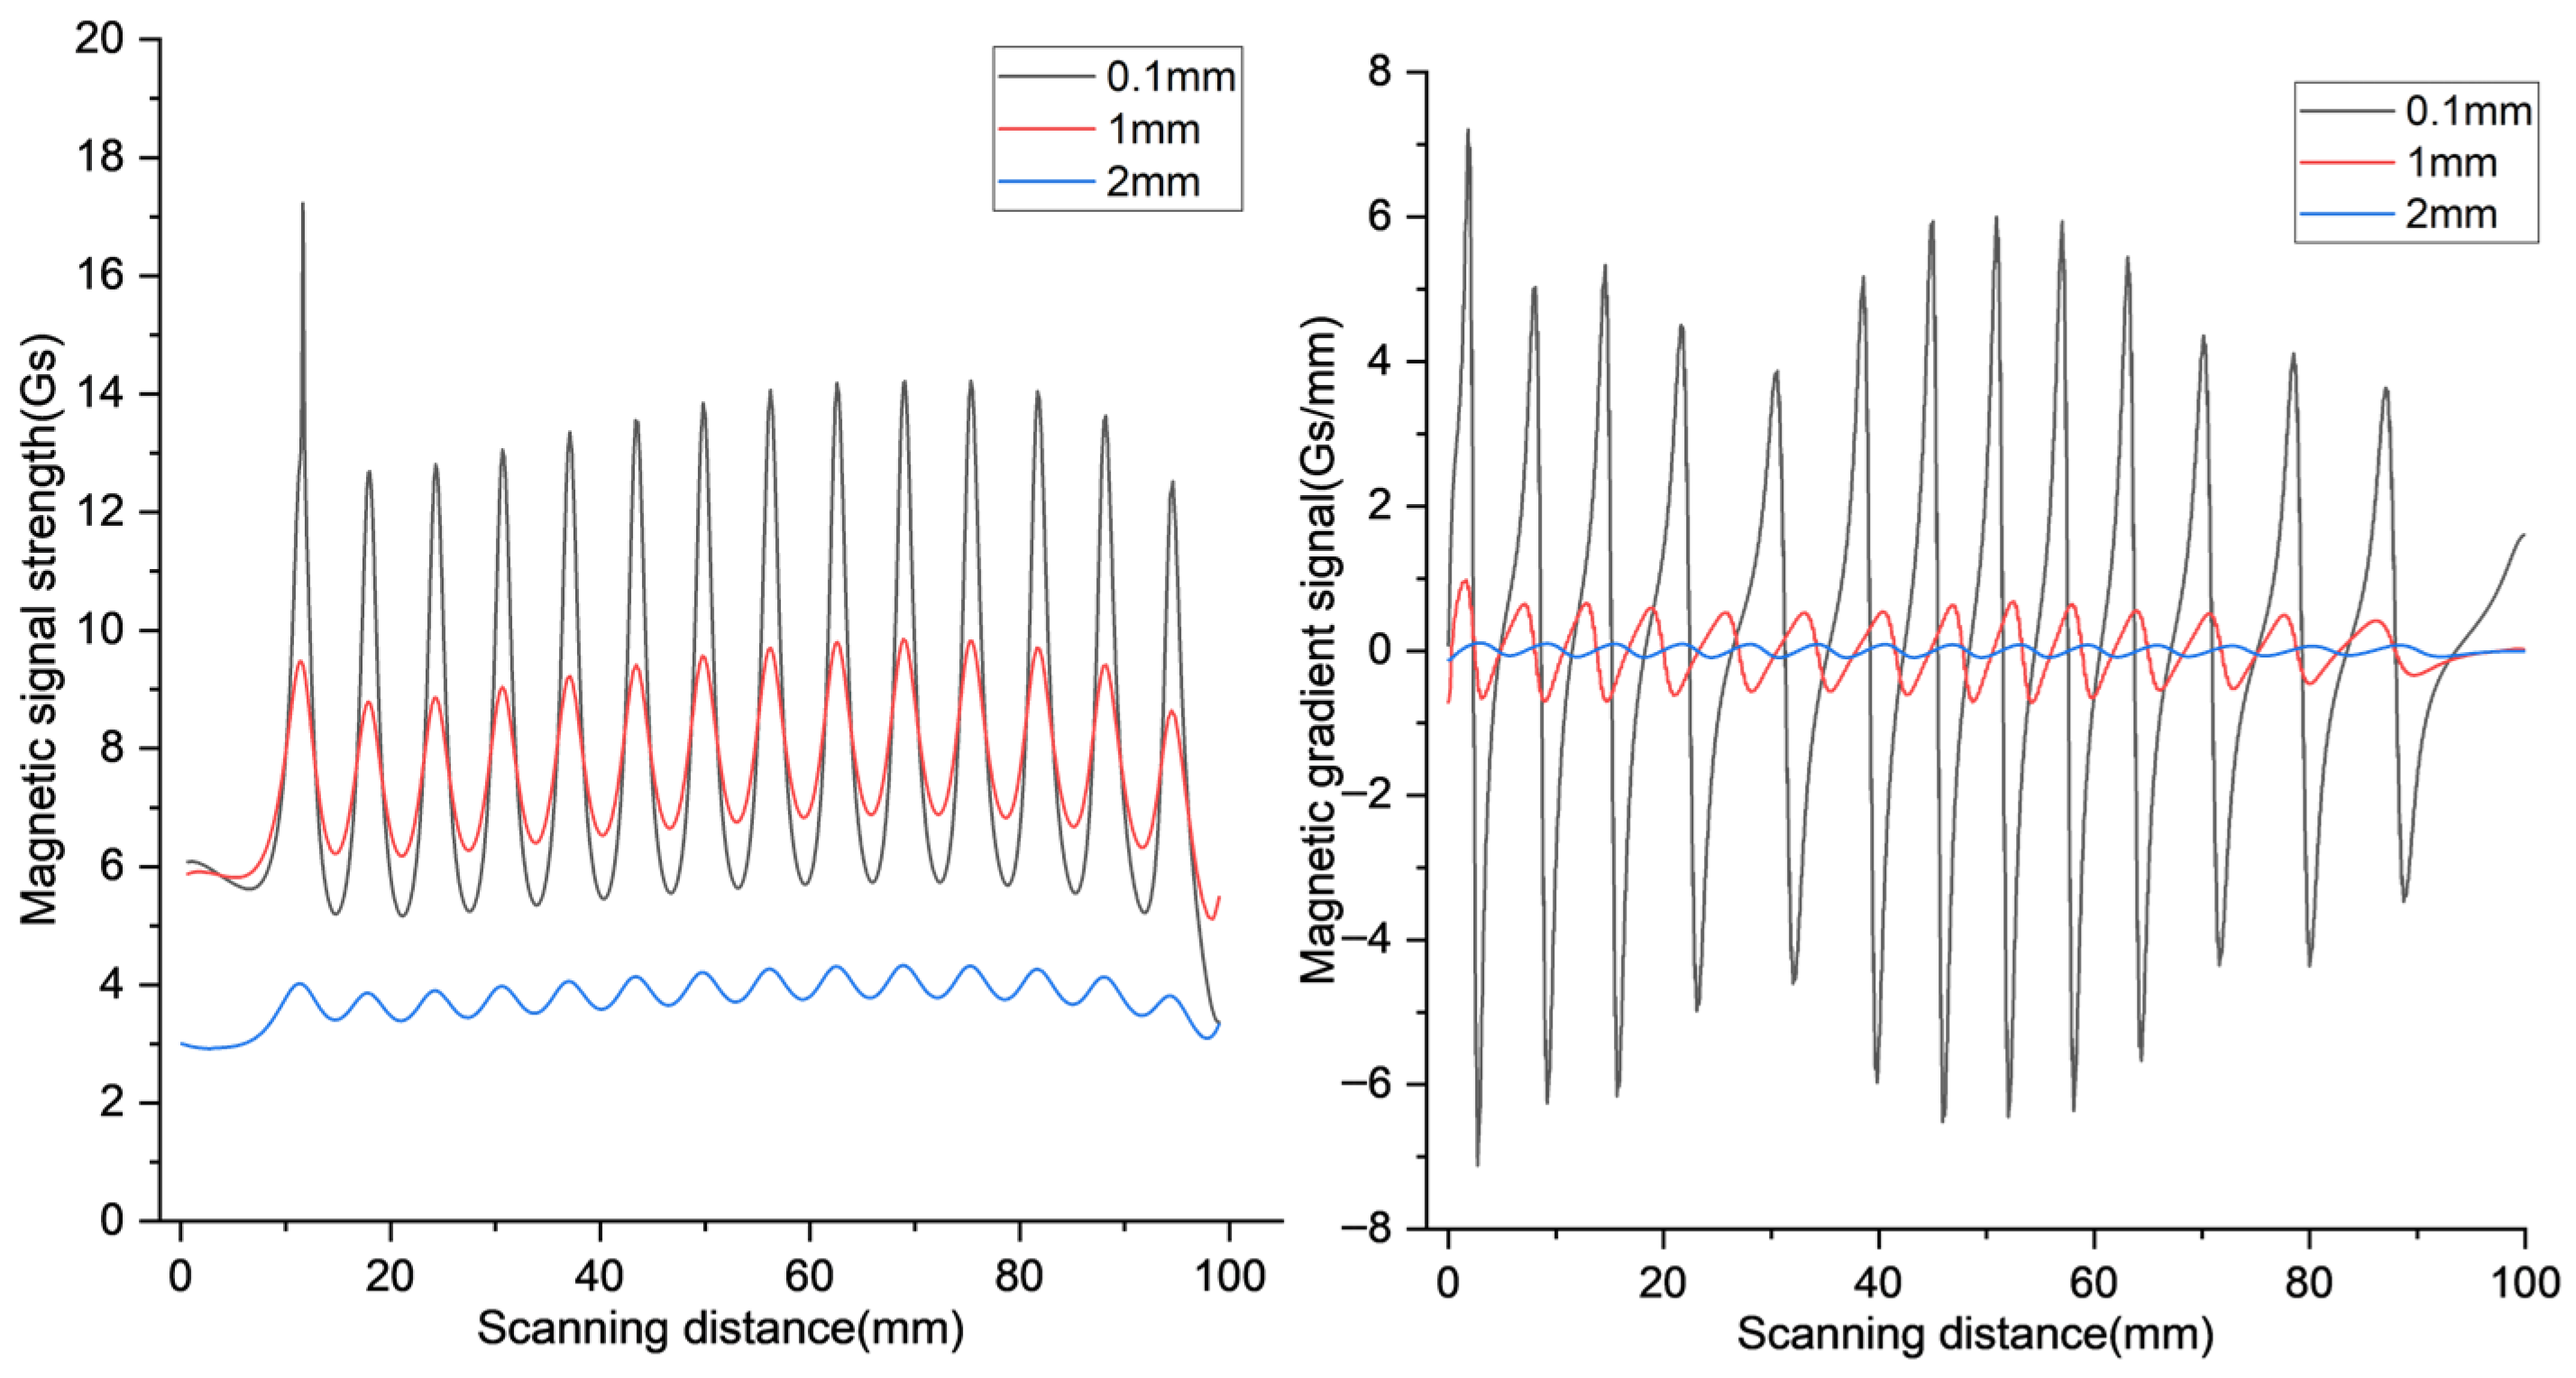
To investigate the influence of lift-off distance on magnetic field signal characteristics, magnetic flux density signals were extracted from the pin surface at various lift-off distances for comparative analysis. The raw signals and their corresponding gradients are presented in Figure 4.
As shown in Figure 4, the amplitude of the magnetic field signals gradually attenuates with increasing lift-off distance, accompanied by significant changes in signal waveform characteristics. This observation indicates that lift-off distance substantially affects both the sensitivity and resolution of magnetic field detection. Consequently, in practical inspections, single metrics such as peak magnetic flux density or gradient peak-to-peak values [13] cannot reliably reflect the actual damage state of drill pipe threads. This limitation necessitates an analytical approach integrating multi-scale feature fusion to more accurately evaluate and identify the extent of thread damage.

4. Data Acquisition

4.1. Experimental Setup

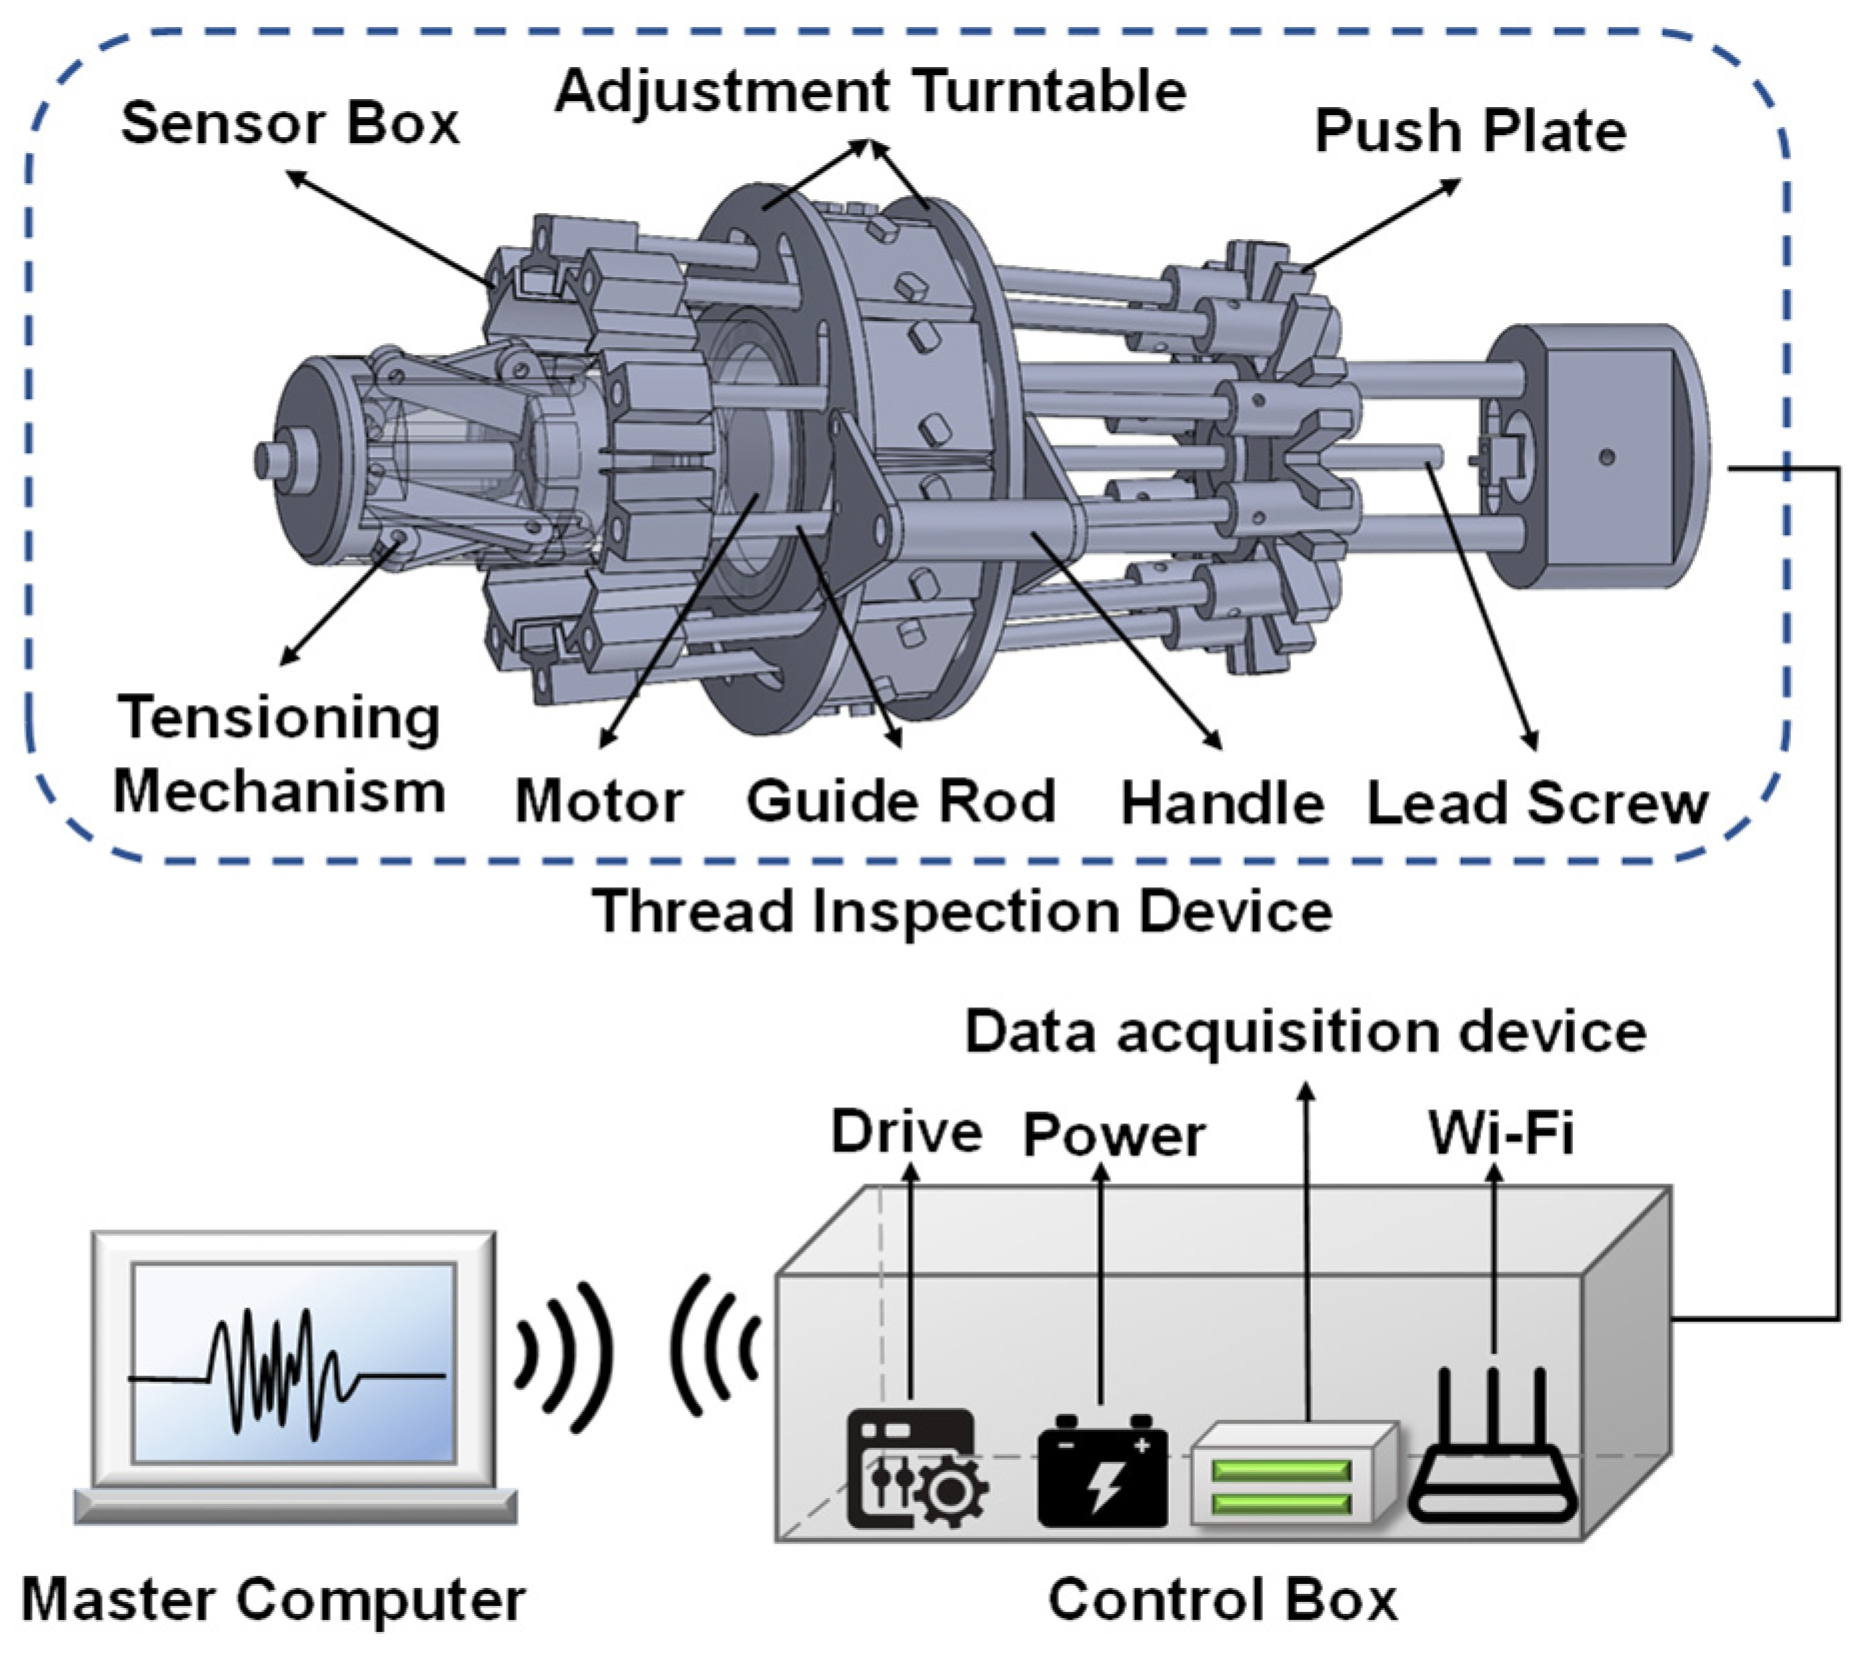
Figure 5 illustrates the fatigue damage evaluation system for drill pipe threads alongside the mechanical structure of the thread inspection device. The complete system comprises three main components: the thread inspection device, the control cabinet, and a host computer. The thread inspection device is primarily responsible for acquiring magnetic signals from the drill pipe surface. Within the control cabinet, the power supply, drivers, data acquisition card, and Wi-Fi module enable device control, data processing, and wireless transmission. The host computer ultimately analyzes the acquired data.
The thread inspection device is equipped with eight sensor cassettes, each housing two tunneling magnetoresistance (TMR) sensors, yielding a total of 16 TMR sensors. During operation, an expansion mechanism at the front of the device inserts into the drill pipe’s fluid passage, ensuring precise alignment with the pipe axis. A rotating handle adjusts the rotary disk, thereby modifying the radial distribution of the sensor cassettes to control the lift-off distance during inspection; this adjustment also accommodates drill pipes of various specifications. Once the motor is activated, the sensor cassettes travel steadily and uniformly along the thread surface, enabling efficient and high-precision acquisition of magnetic memory signals from the drill pipe.
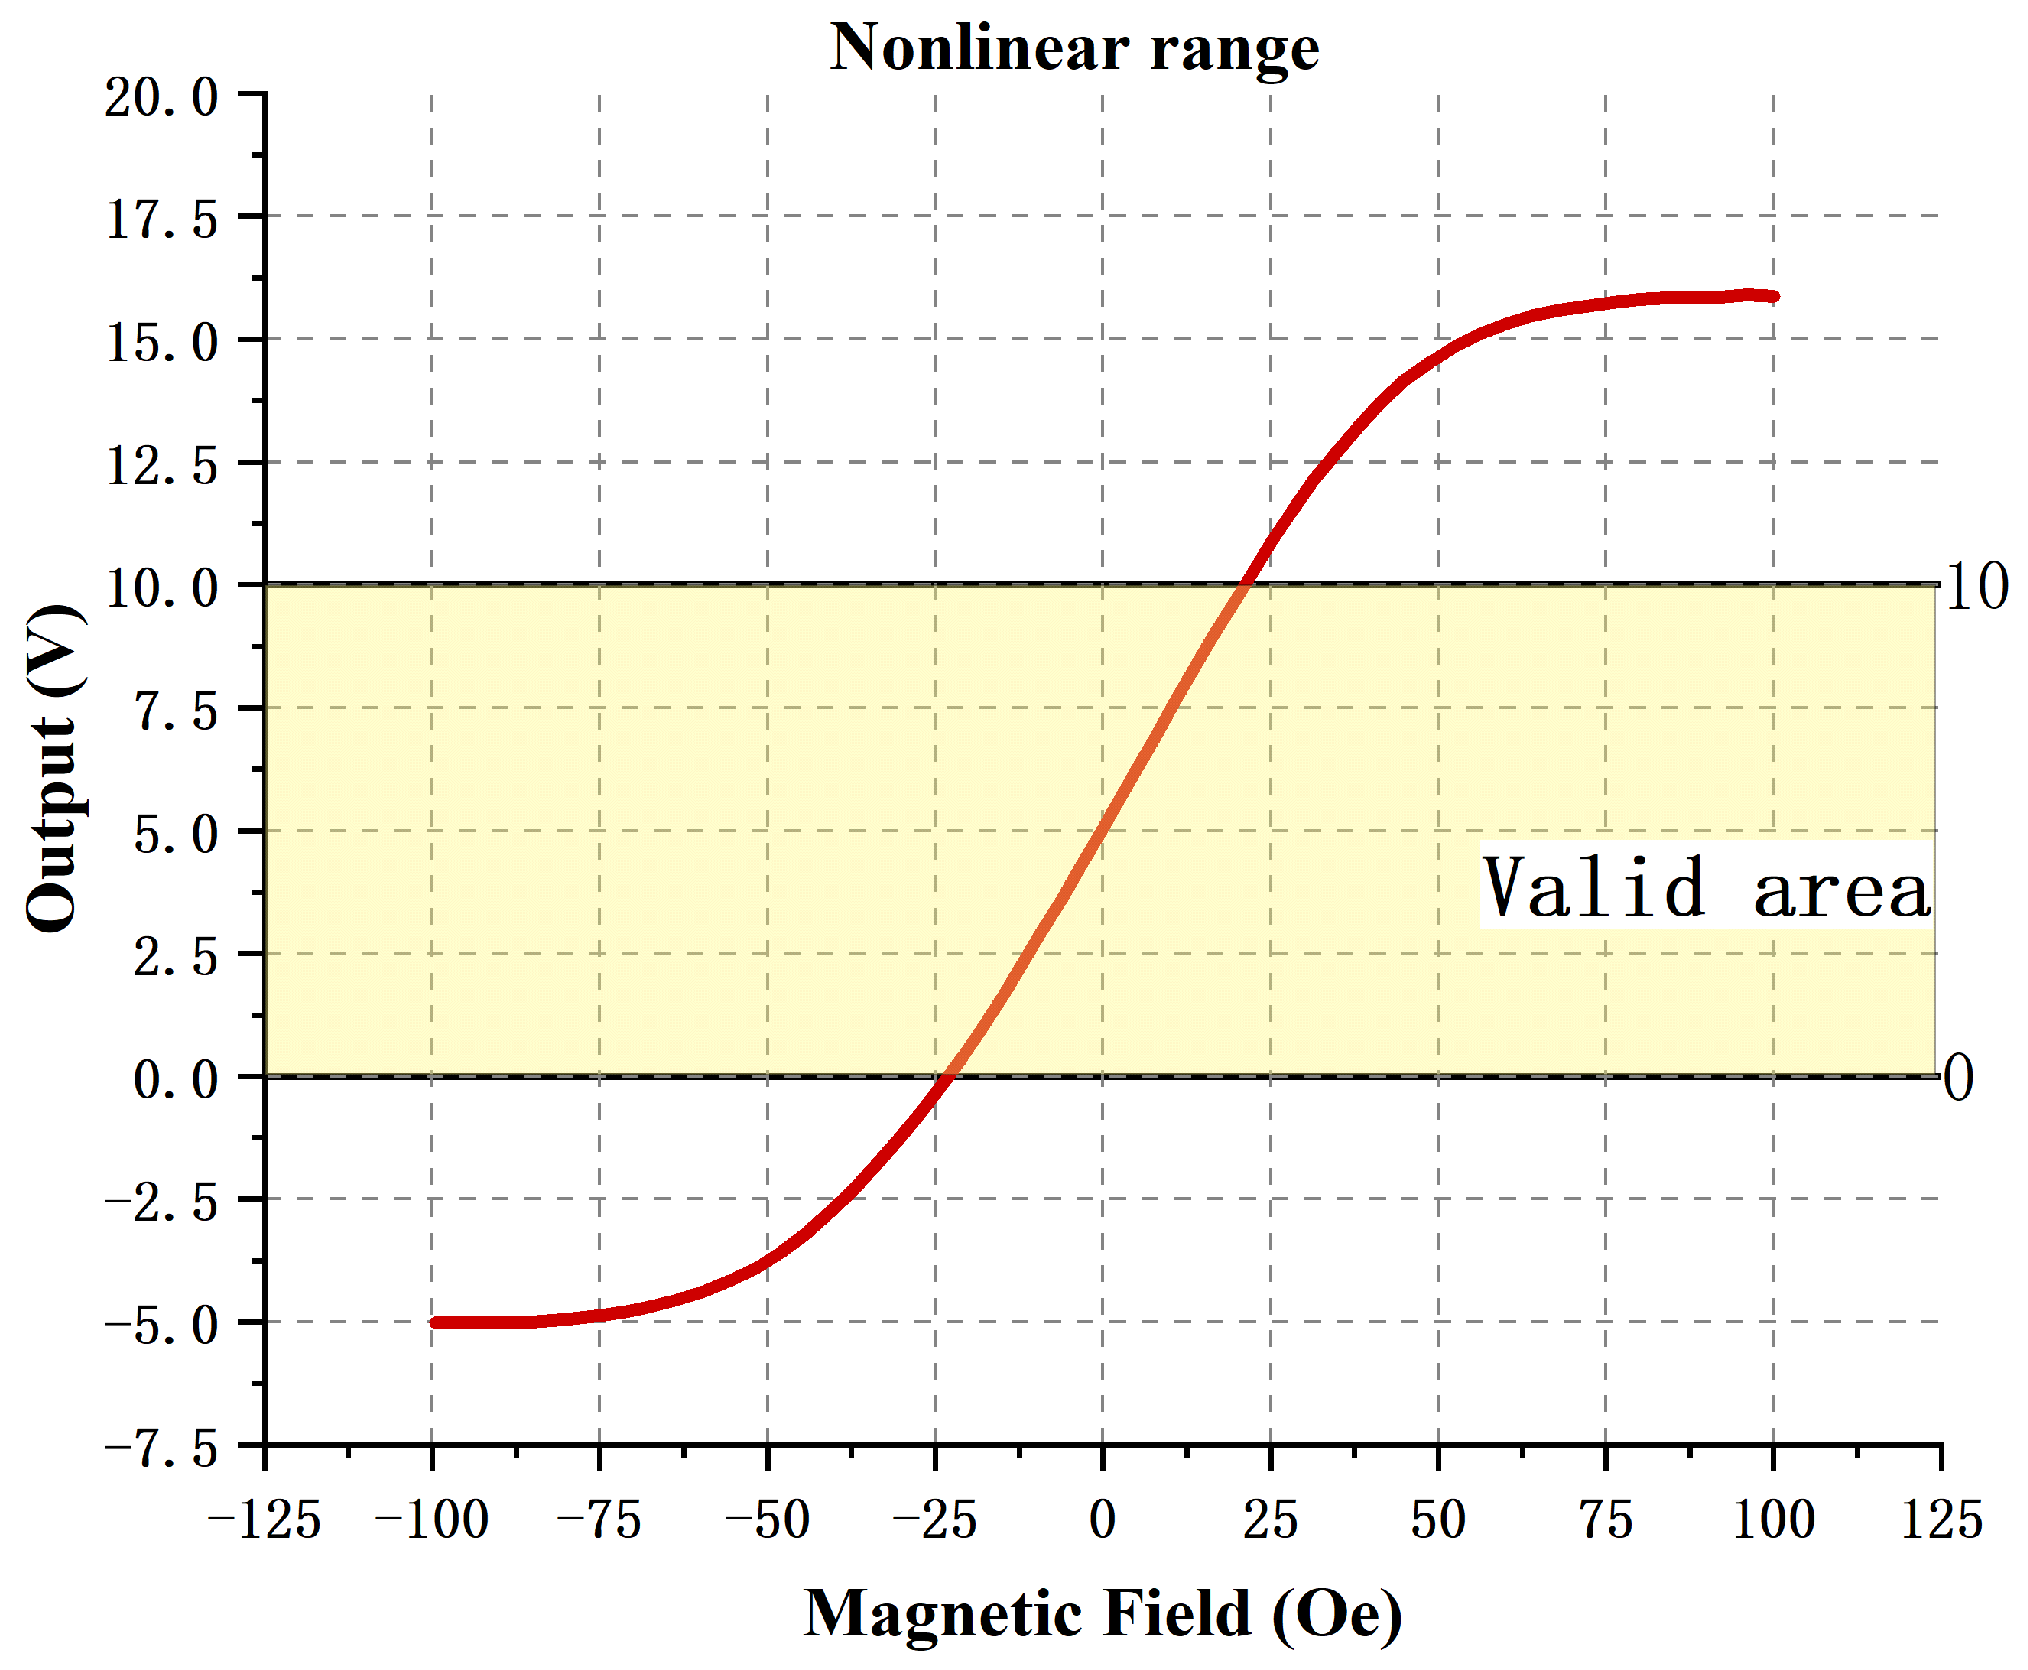
The TMR sensors (Sinomags®, Sinomags Technology Co., Ltd., Bengbu, China) were used for measurements. To reduce noise during signal acquisition, improve signal accuracy and reliability, and effectively amplify weak signals, the sensors were integrated with peripheral circuits for signal conversion, amplification, and filtering. The resulting characteristic curve of the probe is shown in Figure 6.

4.2. Field Testing

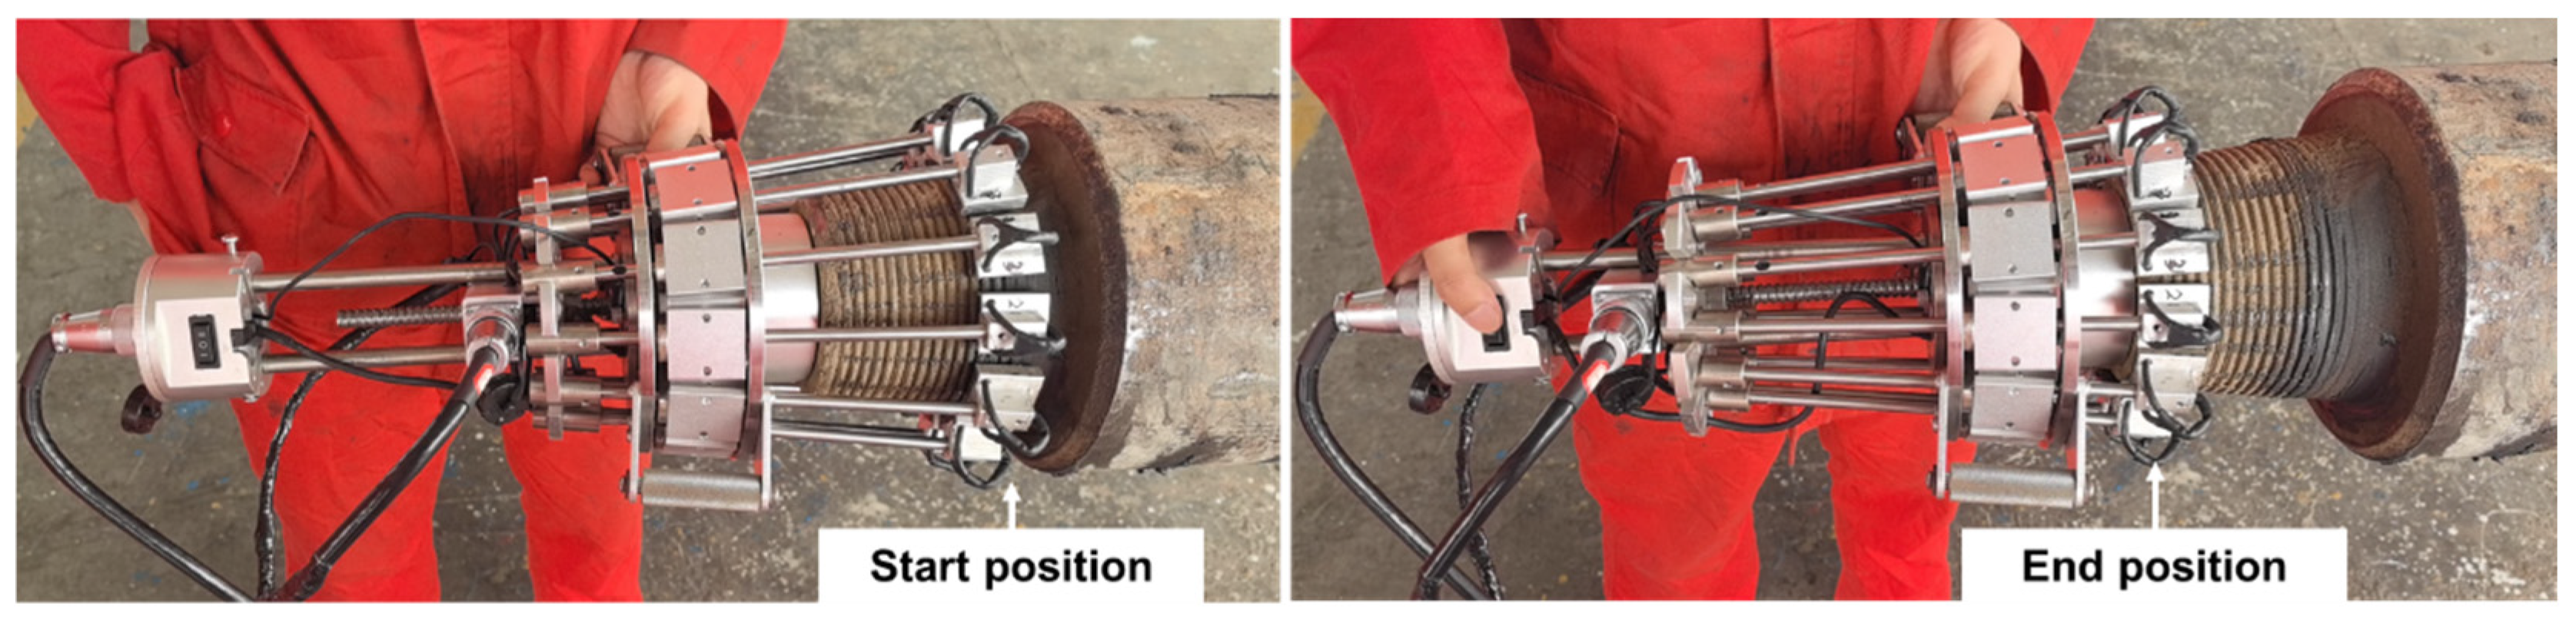
Figure 7 illustrates the drill pipe before and after the field test. The inspection device was installed on the drill pipe connector section and subsequently tightened to minimize the lift-off distance between the probes and the thread surface. Once installation was completed, the inspection procedure commenced. Because the metal magnetic memory (MMM) technique detects defects by sensing stress-induced reorientation of magnetic domains within the material itself, non-ferromagnetic contaminants such as grease and mud do not interfere with magnetic signal measurement. Consequently, surface cleaning is unnecessary when applying MMM to drill pipe threads. This characteristic offers a substantial advantage over methods requiring stringent surface cleanliness—such as magnetic particle testing and ultrasonic testing—by significantly enhancing inspection efficiency while reducing operational costs. The approach is particularly well suited to harsh field environments like drilling sites and simultaneously eliminates the risk of missed detections caused by inadequate cleaning. The field test parameters are summarized in Table 2.
To further validate the accuracy of the MMM results, magnetic particle testing (MT) was employed as a complementary method following the magnetic memory scans. As a well-established and intuitively interpretable technique for detecting surface defects [9], MT effectively identifies surface-breaking discontinuities in welds and near-surface regions. This dual-validation approach provides a more reliable experimental basis for subsequent data analysis and conclusions, thereby ensuring the accuracy and repeatability of the acquired data.
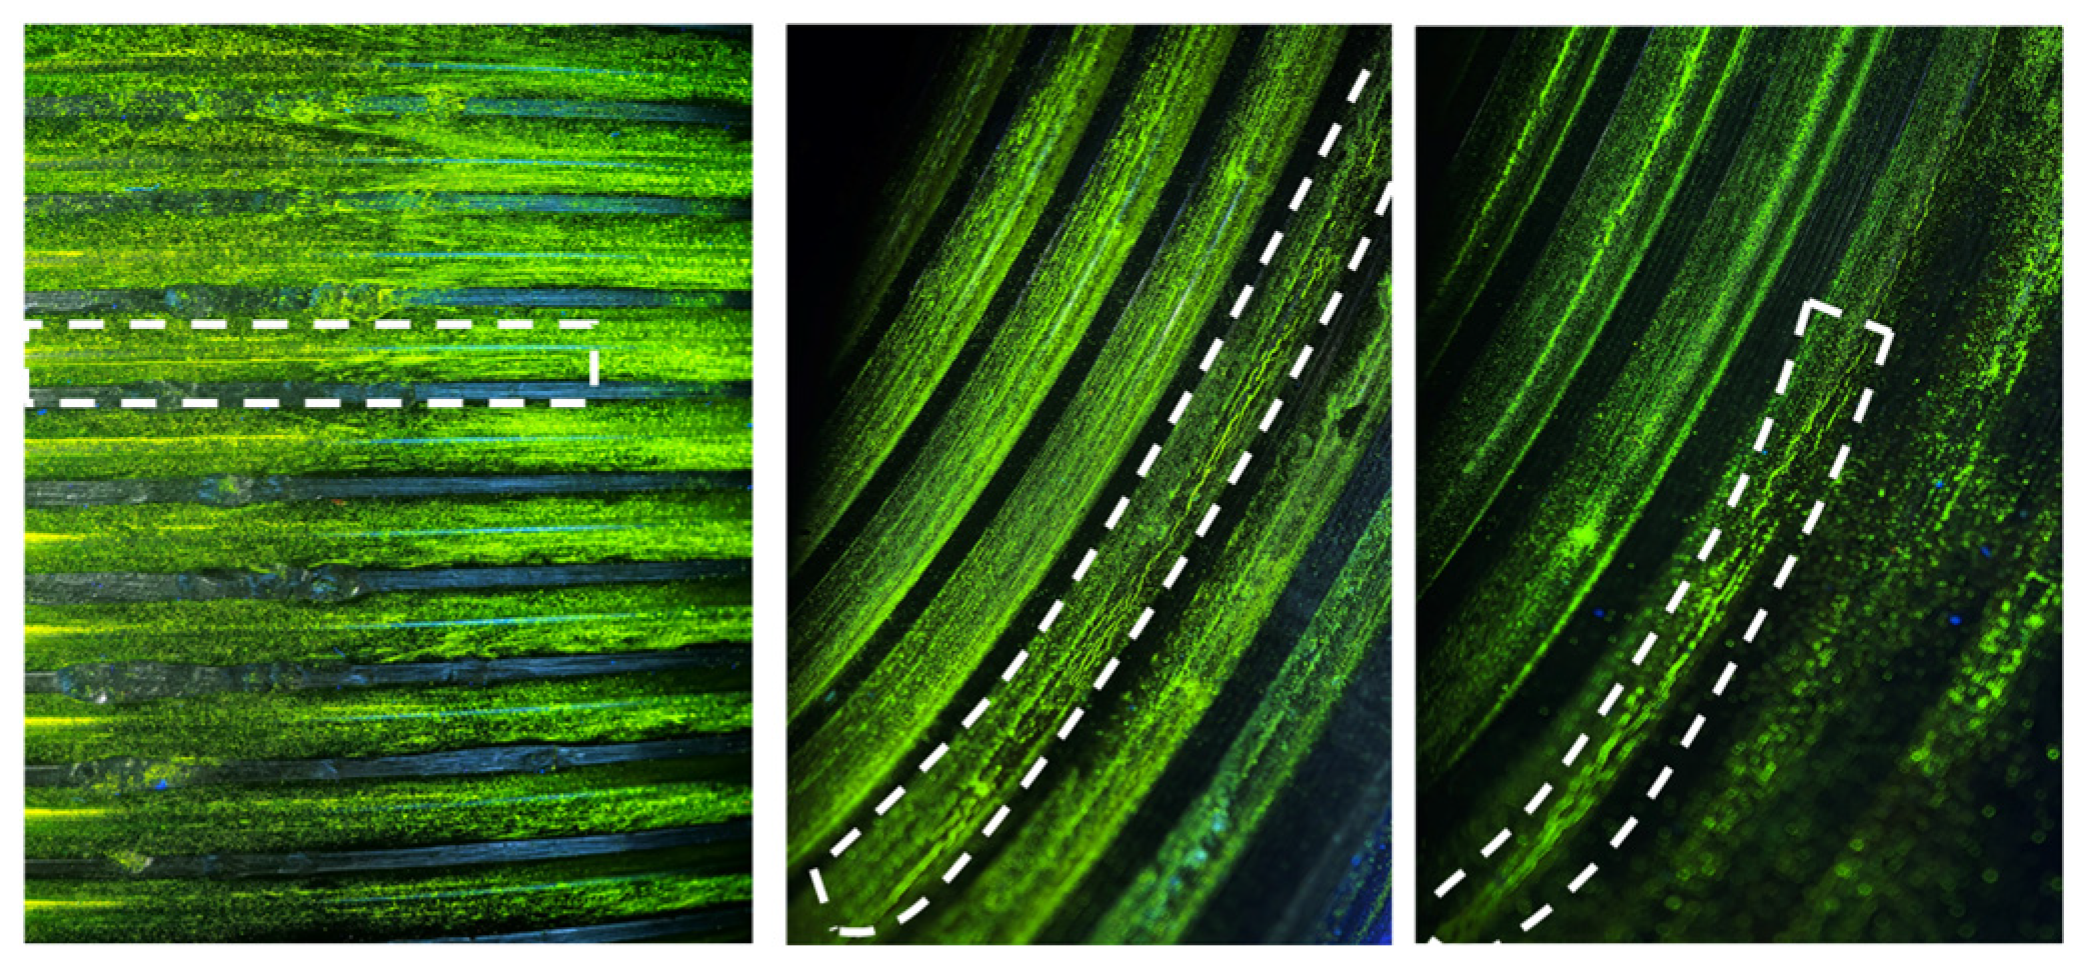
Figure 8 presents the surface morphology of the defective drill pipe connector specimen after magnetic particle inspection. At thread regions without defects, the magnetic particles are evenly distributed, adhering naturally along the thread roots. Due to the smooth thread surface and the absence of magnetic flux leakage, no preferential aggregation or linear buildup of particles is observed. Under ultraviolet illumination, the background exhibits a uniform fluorescent or contrasting coloration with no luminous indications—only the geometric profile of the threads is visible. In contrast, at the roots of defective threads, the magnetic particles form clearly visible accumulations at defect sites. These accumulations appear as linear or striated indications with well-defined, slightly curved contours.
During the tests, the sensor traversal speed was set to 5, 7, and 10 mm/s, while the sampling frequency of each individual sensor was 1000 Hz. A total of 750 magnetic signals were acquired from the thread surfaces, comprising 270 signals from defective threads and 480 signals from intact threads.
To assess the repeatability of the magnetic signal measurements, selected defective and intact threads were scanned three times under identical conditions (same lift-off distance, scanning speed, and sensor configuration). The acquired signals exhibited high consistency, with the coefficient of variation of the APMR feature below 5%, confirming the satisfactory repeatability of the proposed sensor system for field applications.

5. XGB-Based Methodology for Drill Pipe Thread Damage Evaluation

5.1. Feature Extraction

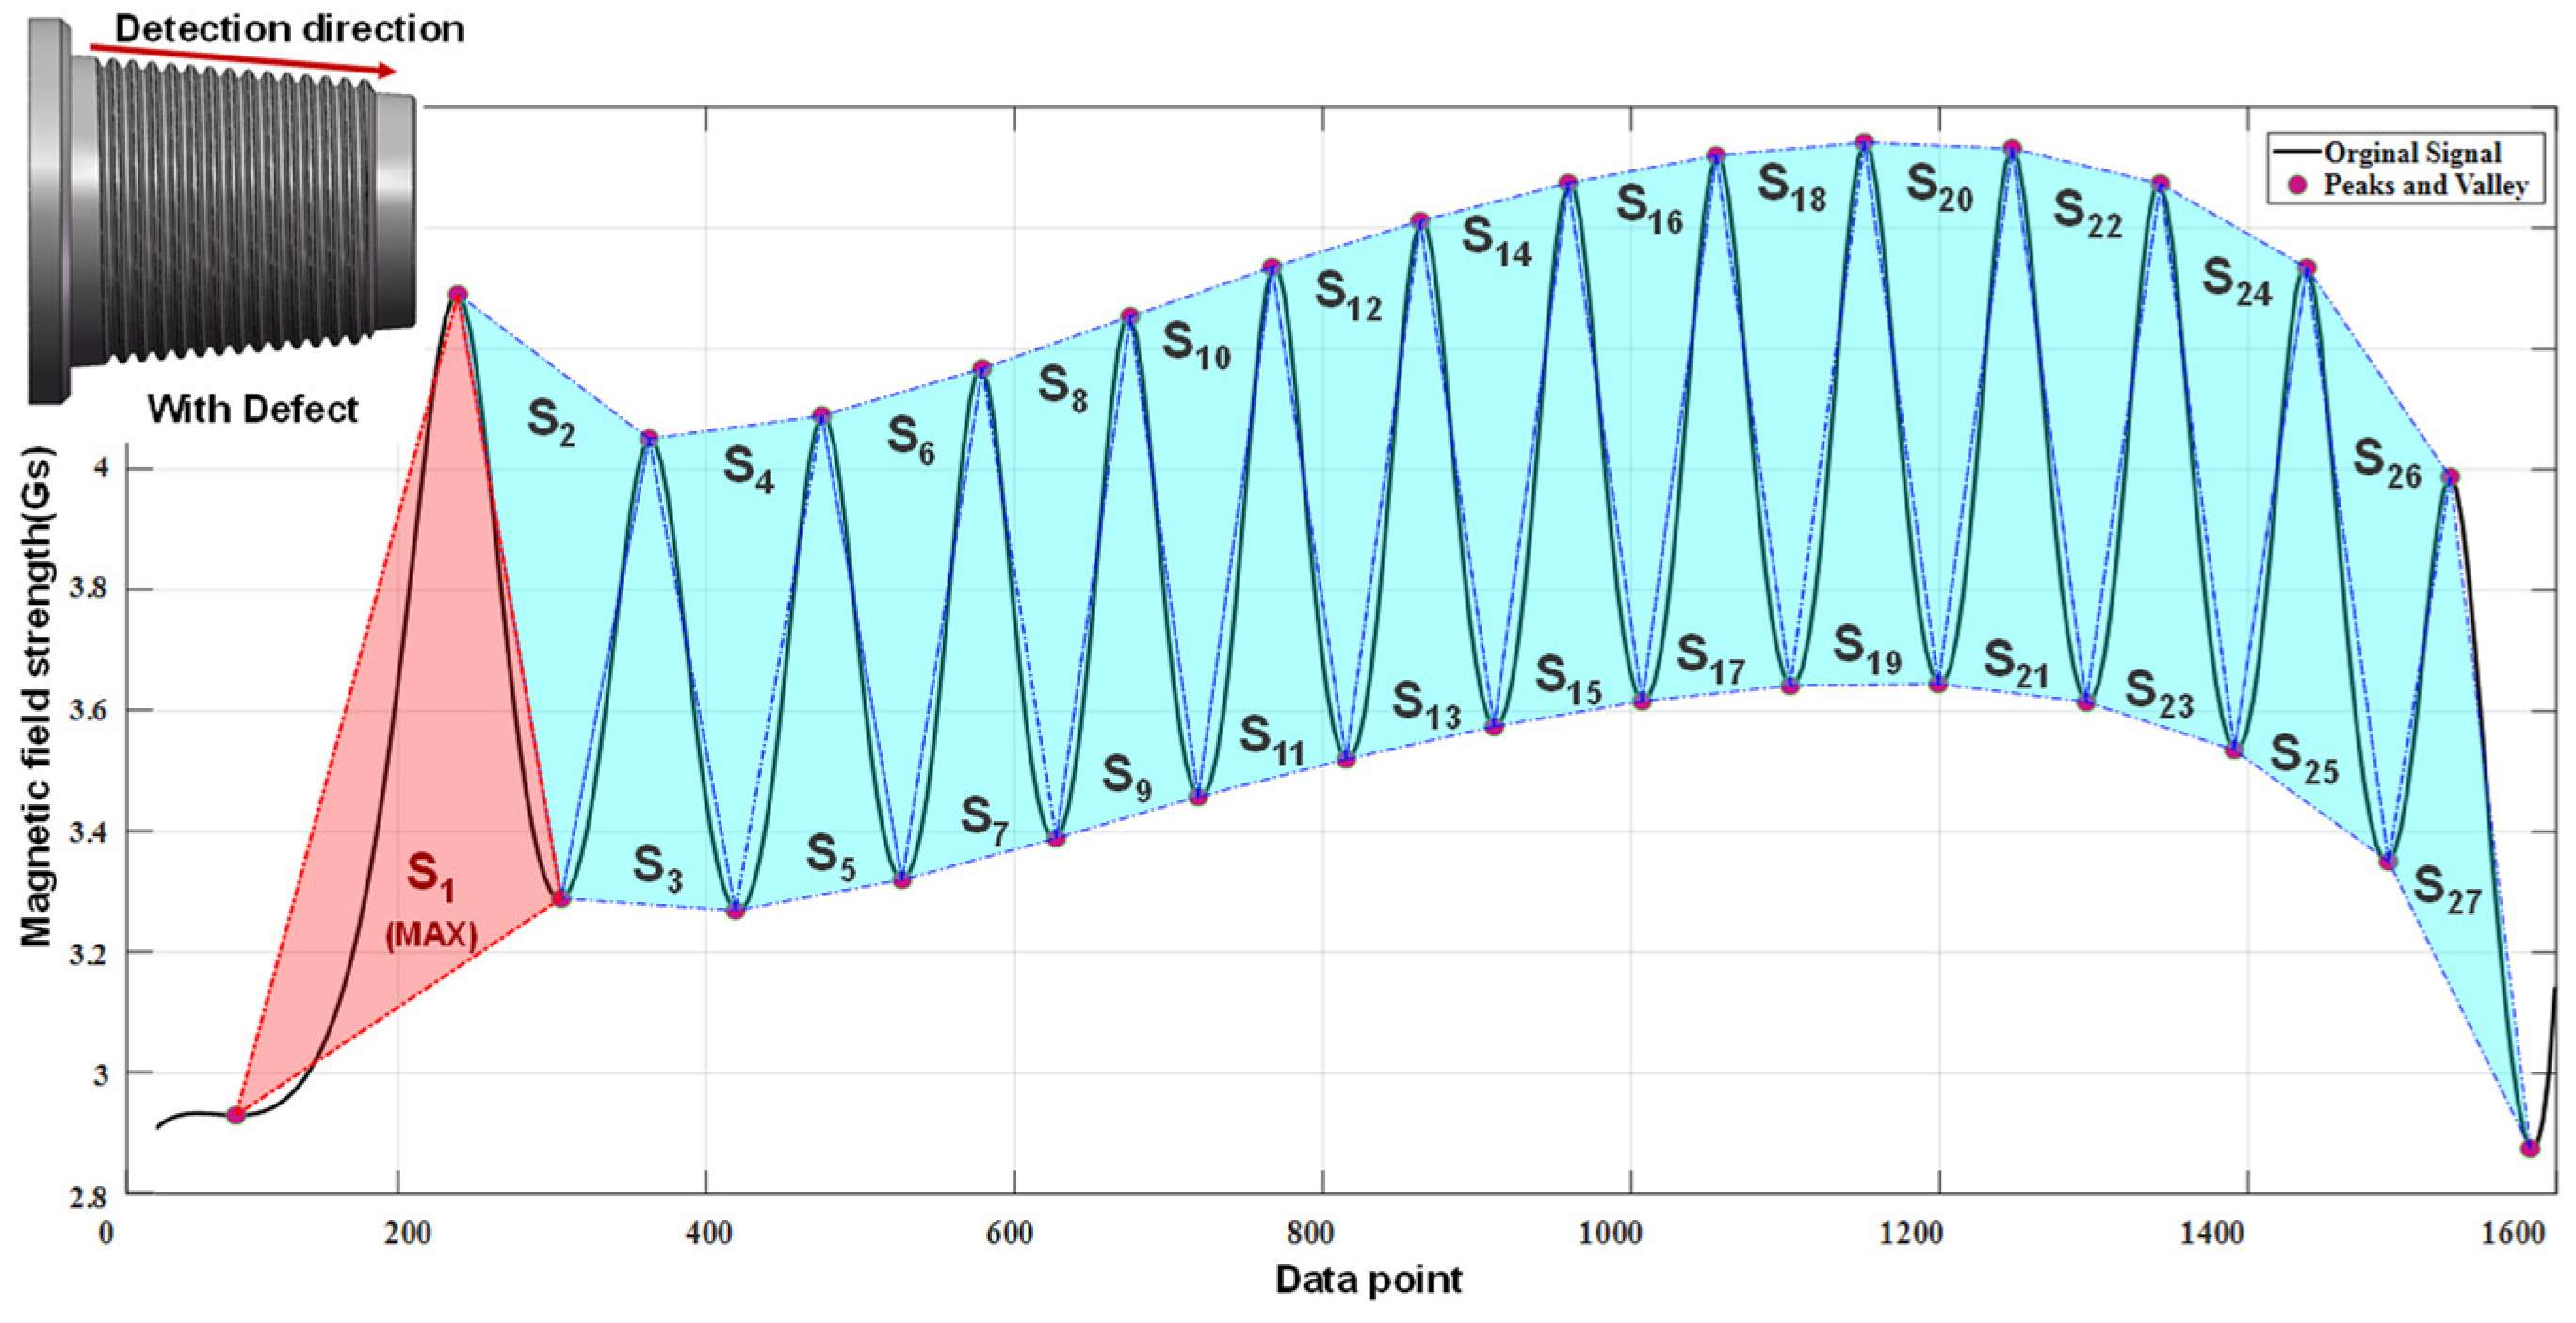
To address the issue of lift-off distance interference in damage evaluation discussed above, this paper proposes a fatigue damage assessment parameter for drill pipe threads based on the APMR of magnetic signals. Damage evaluation is achieved by analyzing characteristic waveforms within the acquired signals. The specific implementation procedure is as follows: magnetic memory signals are acquired from the threaded section. Due to the thread profile, the magnetic signals exhibit undulating characteristics. All peak and valley points within the signal are extracted, and three adjacent feature points are sequentially combined to form triangles. After calculating the area of each triangle, the ratio of the maximum area to the overall mean area serves as the damage indicator. The calculation formula is as follows:
A P M R = M a x ( S 1 , S 2 , S 3 , , S n ) i = 1 n S i / n
This geometric feature is illustrated in Figure 9, which presents the simulated magnetic signal distribution along the surface of a defective drill pipe connector. By quantifying geometric characteristics, this approach enables accurate assessment of thread fatigue damage. Compared to conventional single-parameter methods relying on peak values or gradients, the proposed feature effectively captures the amplitude variations in magnetic memory signals, thereby overcoming the limitations of traditional approaches under varying lift-off distances and scanning rates.
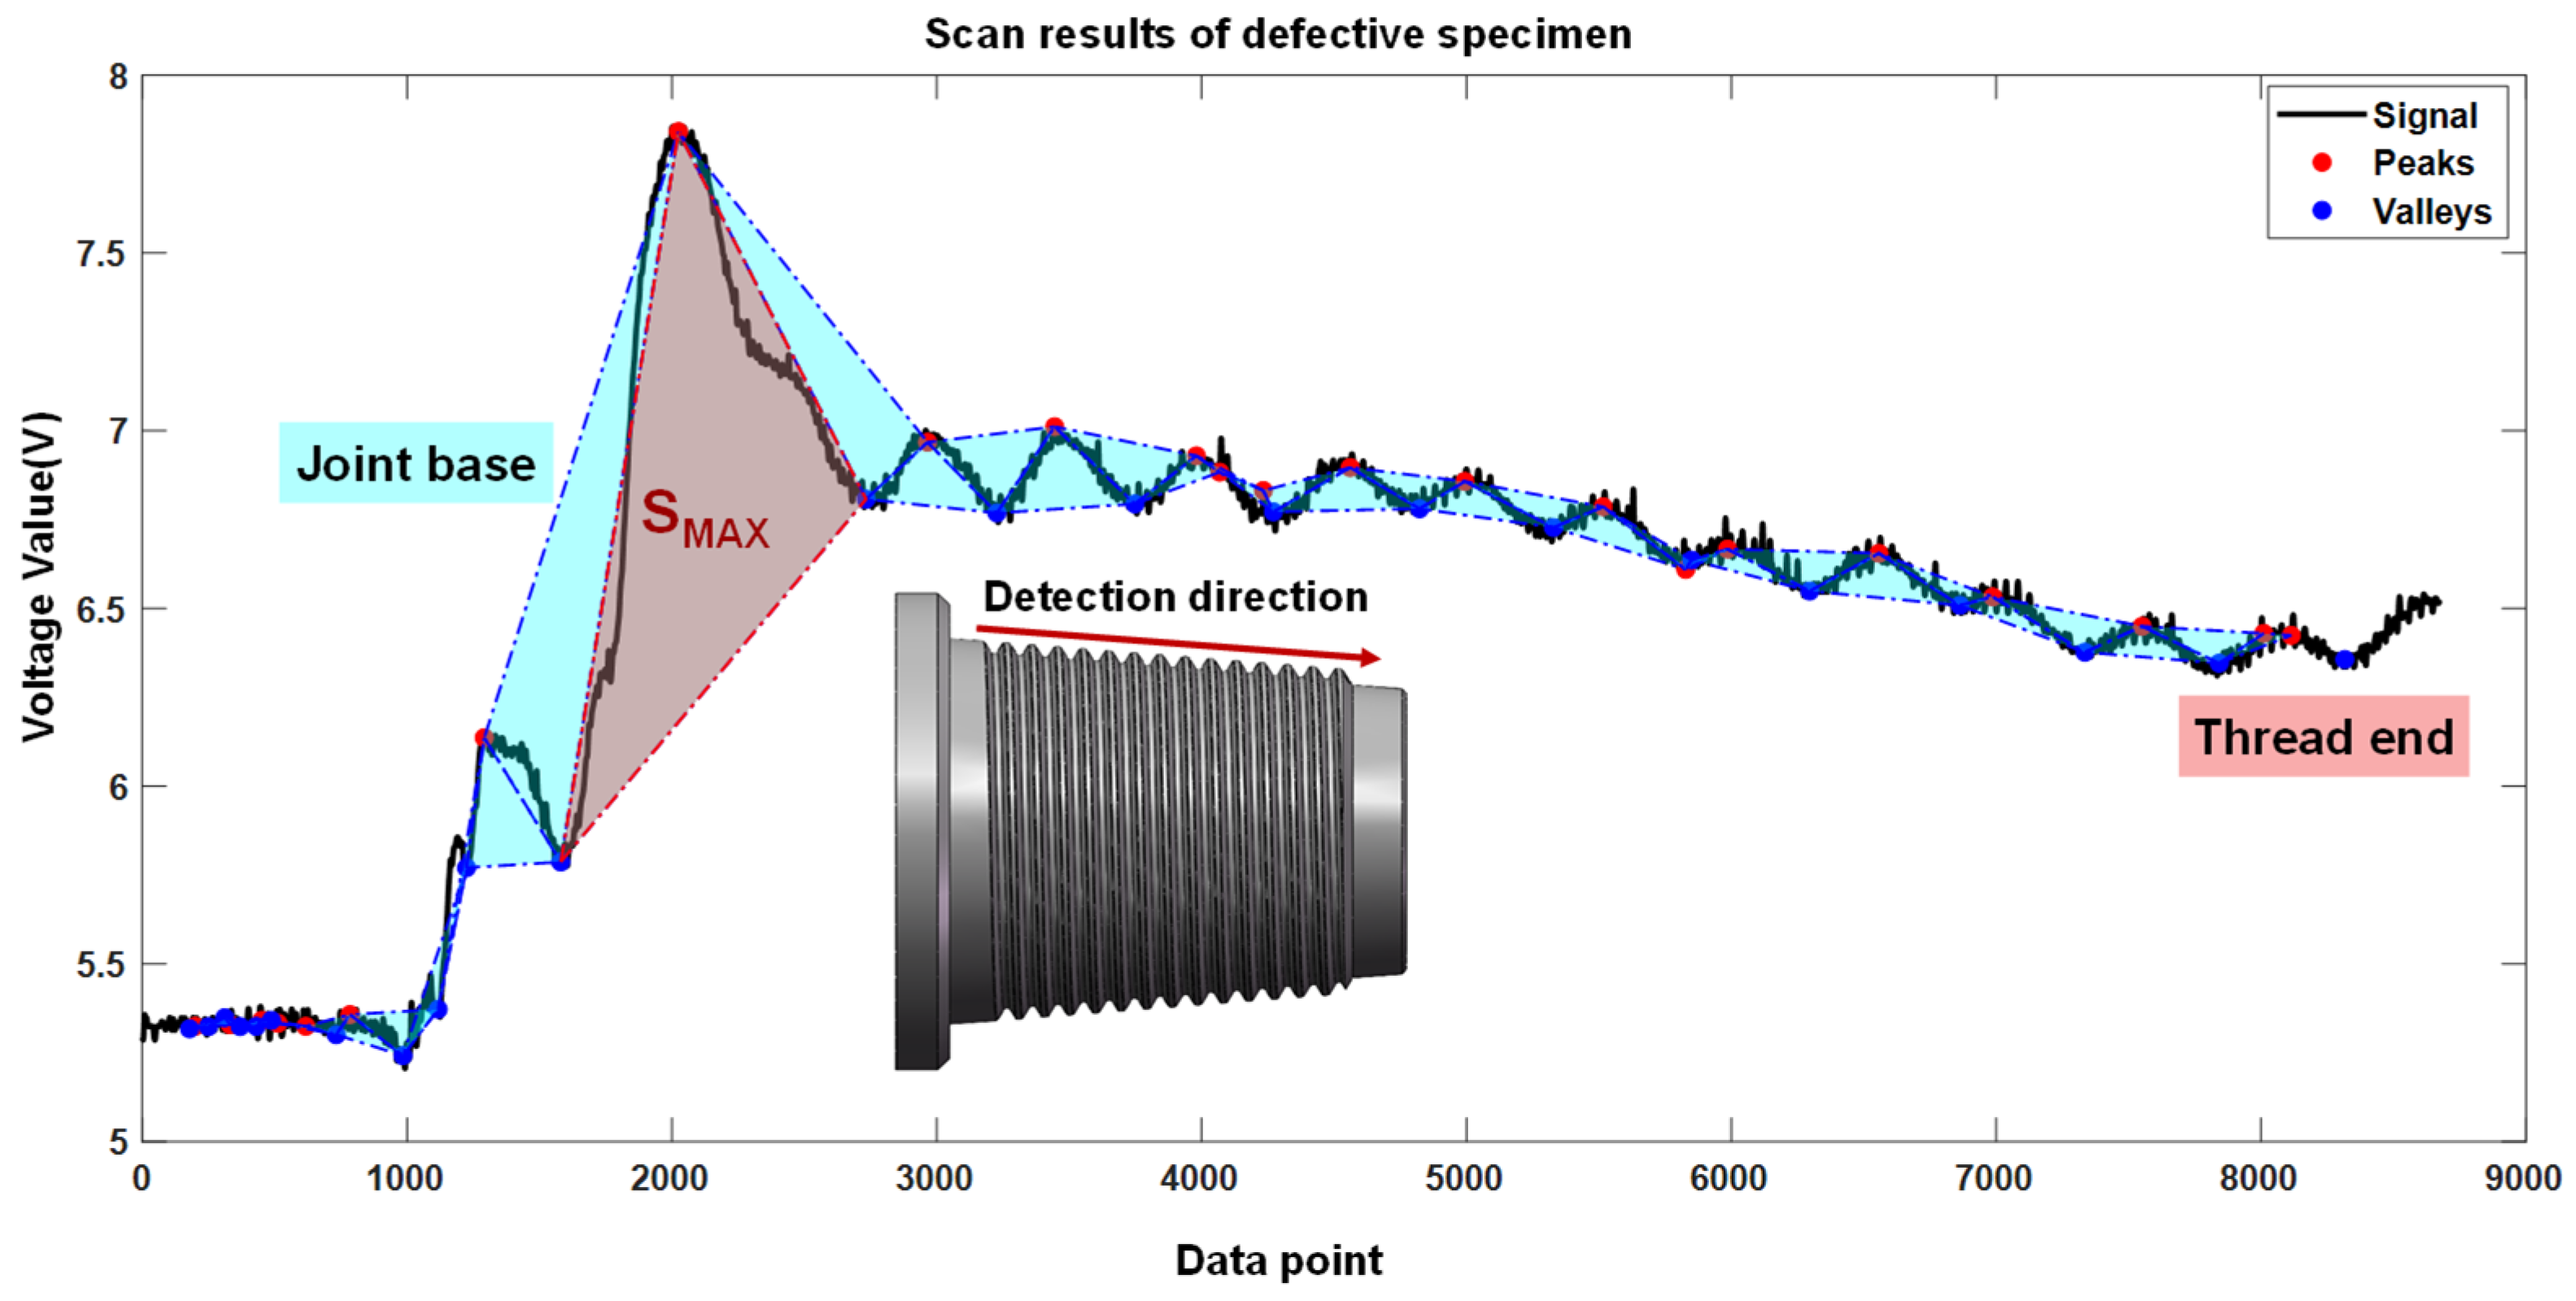
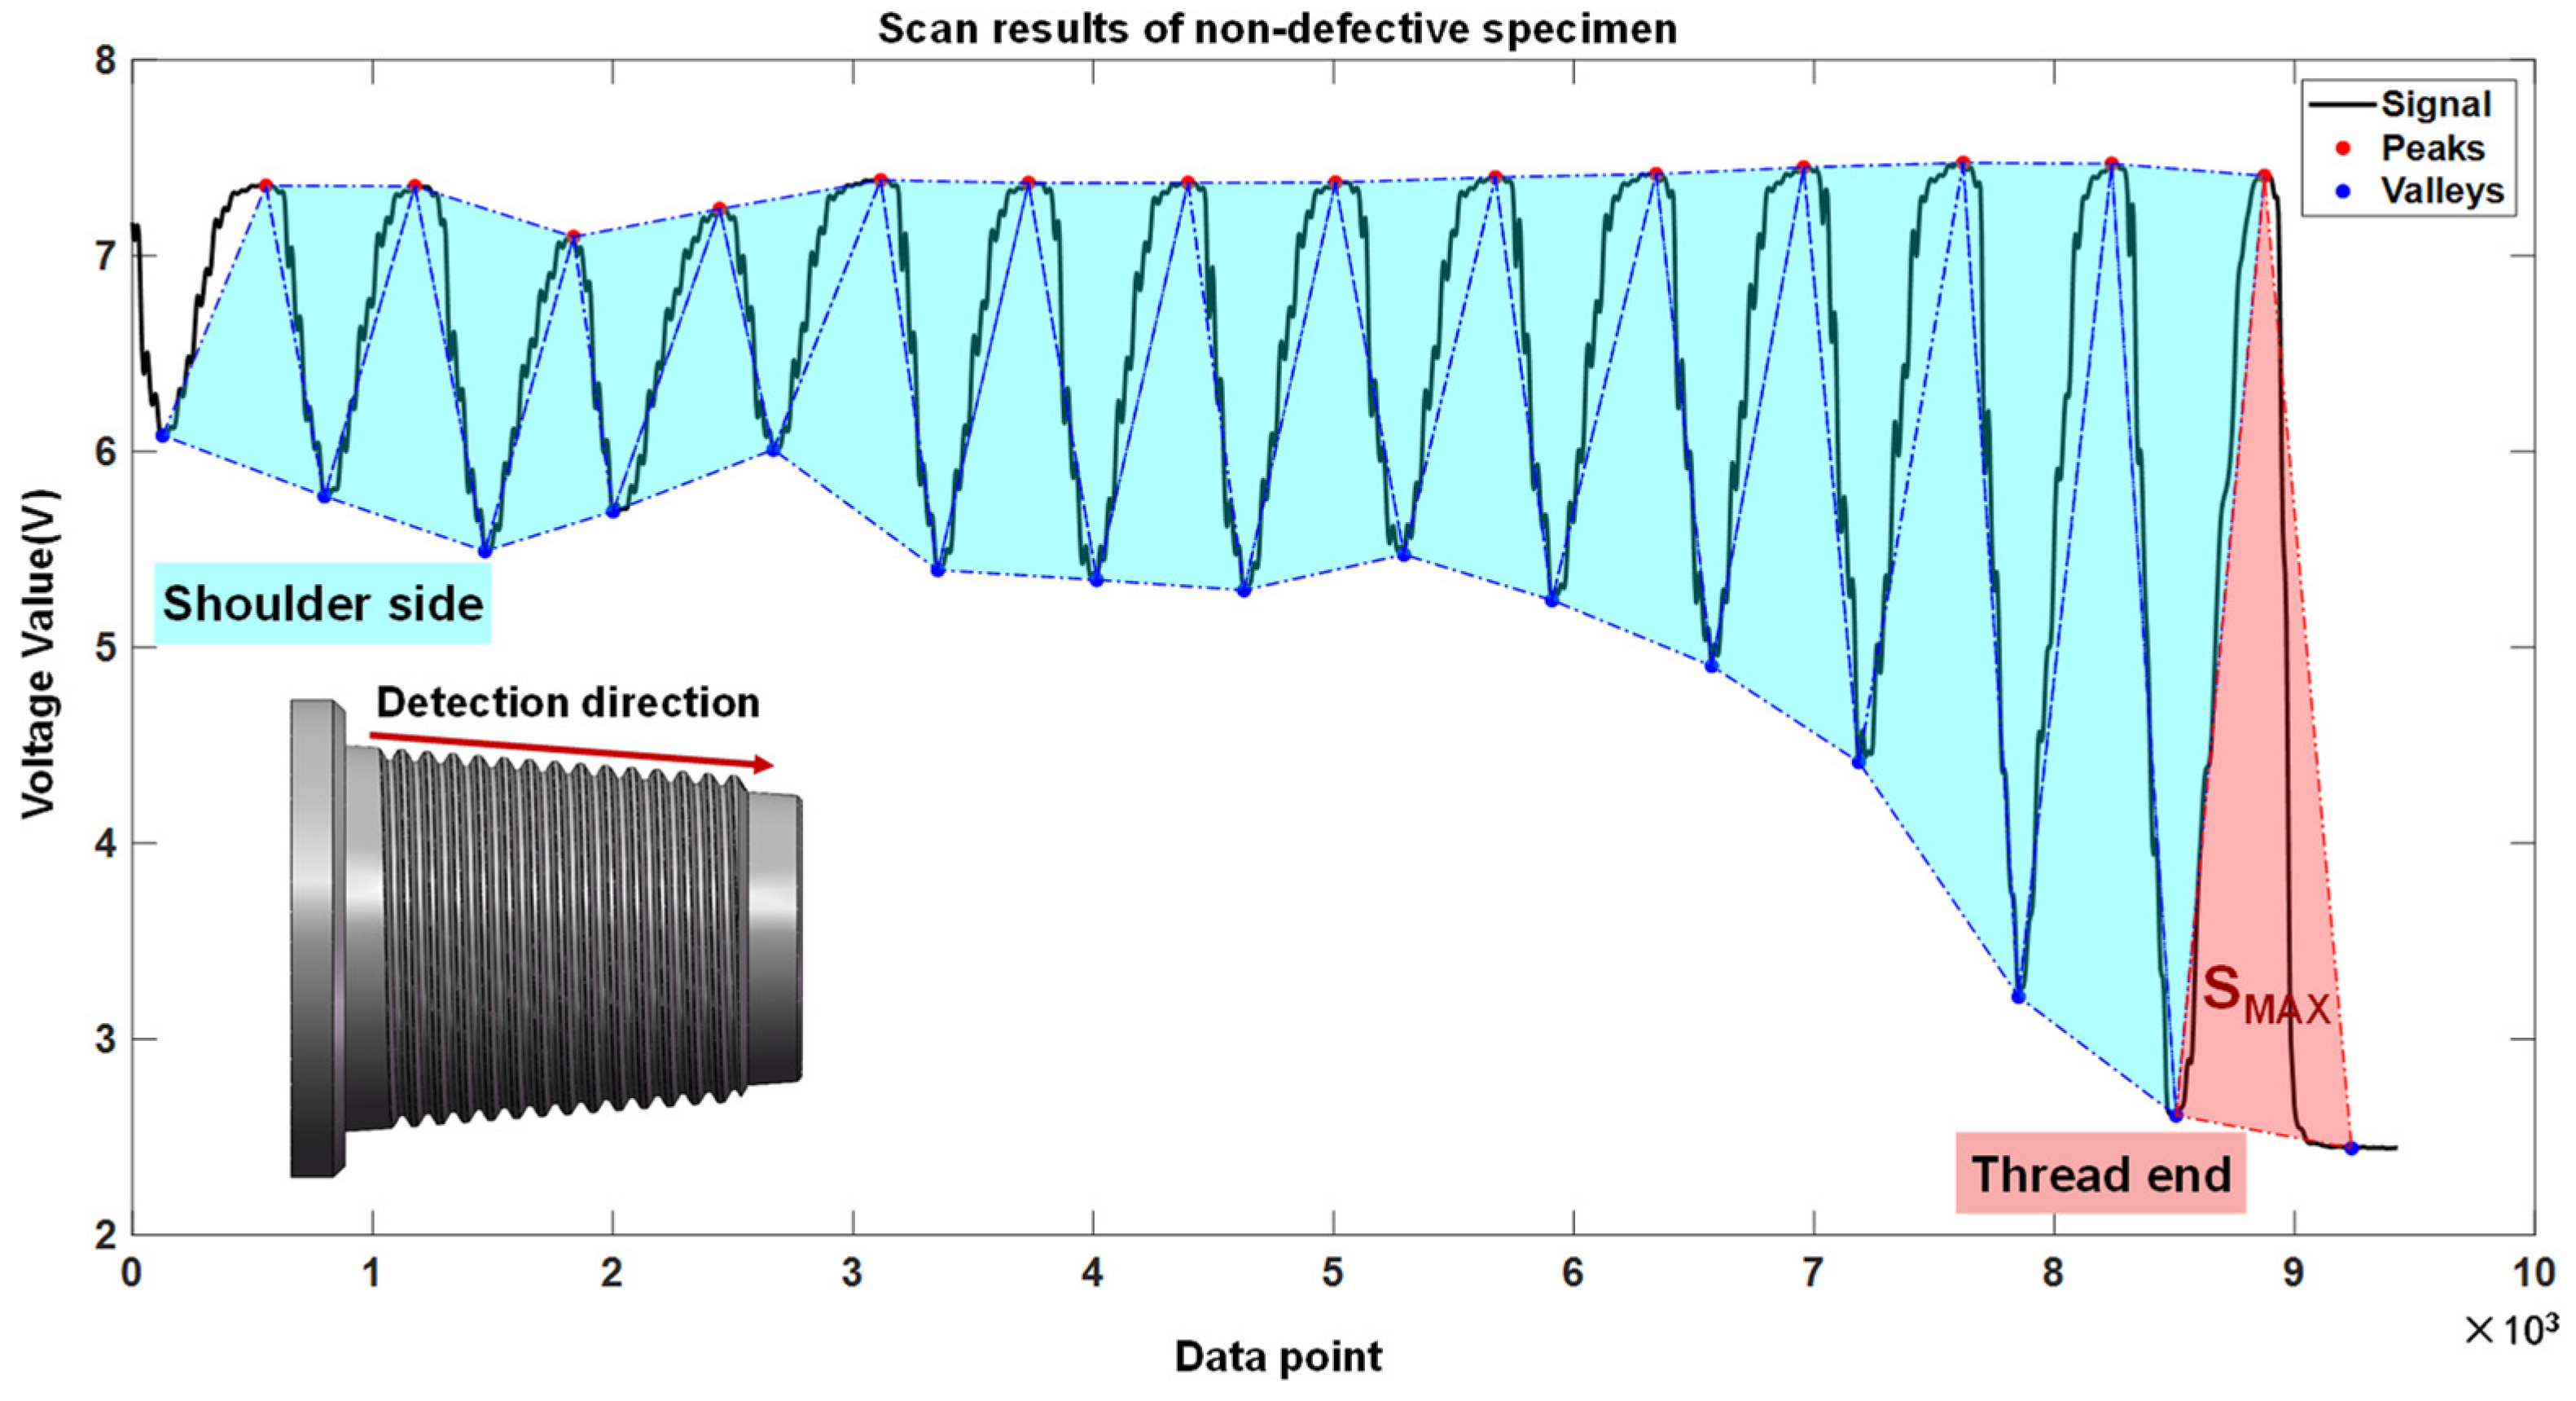
Analysis of the field magnetic memory testing results reveals that signals acquired from defective pin sections exhibit pronounced distortion (see Figure 10), whereas signals from intact threads display relatively uniform variations—a characteristic consistent with the simulation results. However, due to the geometric configuration of the drill pipe, localized magnetic pole formation occurs at certain pin ends as a result of magnetization (equivalent to local accumulation of “magnetic charges”), generating substantial magnetic field interference. This end effect induces anomalous signal fluctuations even in defect-free regions (see Figure 11). Nevertheless, based on simulation results and prior investigations [26], the pin end is not a region of stress concentration. Therefore, when applying the APMR method for defect diagnosis, the centroid of each triangle can be incorporated as an additional positional feature parameter to enhance diagnostic accuracy and prevent misjudgment.
Commonly employed parameters for defect evaluation in MMM testing include standard deviation, signal amplitude, gradient peak value, and gradient peak-to-peak value. In conjunction with the two parameters proposed above—APMR and LOMA—a total of six characteristic features were extracted, as summarized in Table 3.

5.2. Model Construction and Training

To ensure impartiality and generalizability in model evaluation, the original dataset was partitioned into three mutually exclusive subsets—training, validation, and independent test sets—using stratified sampling in a 7:2:1 ratio.
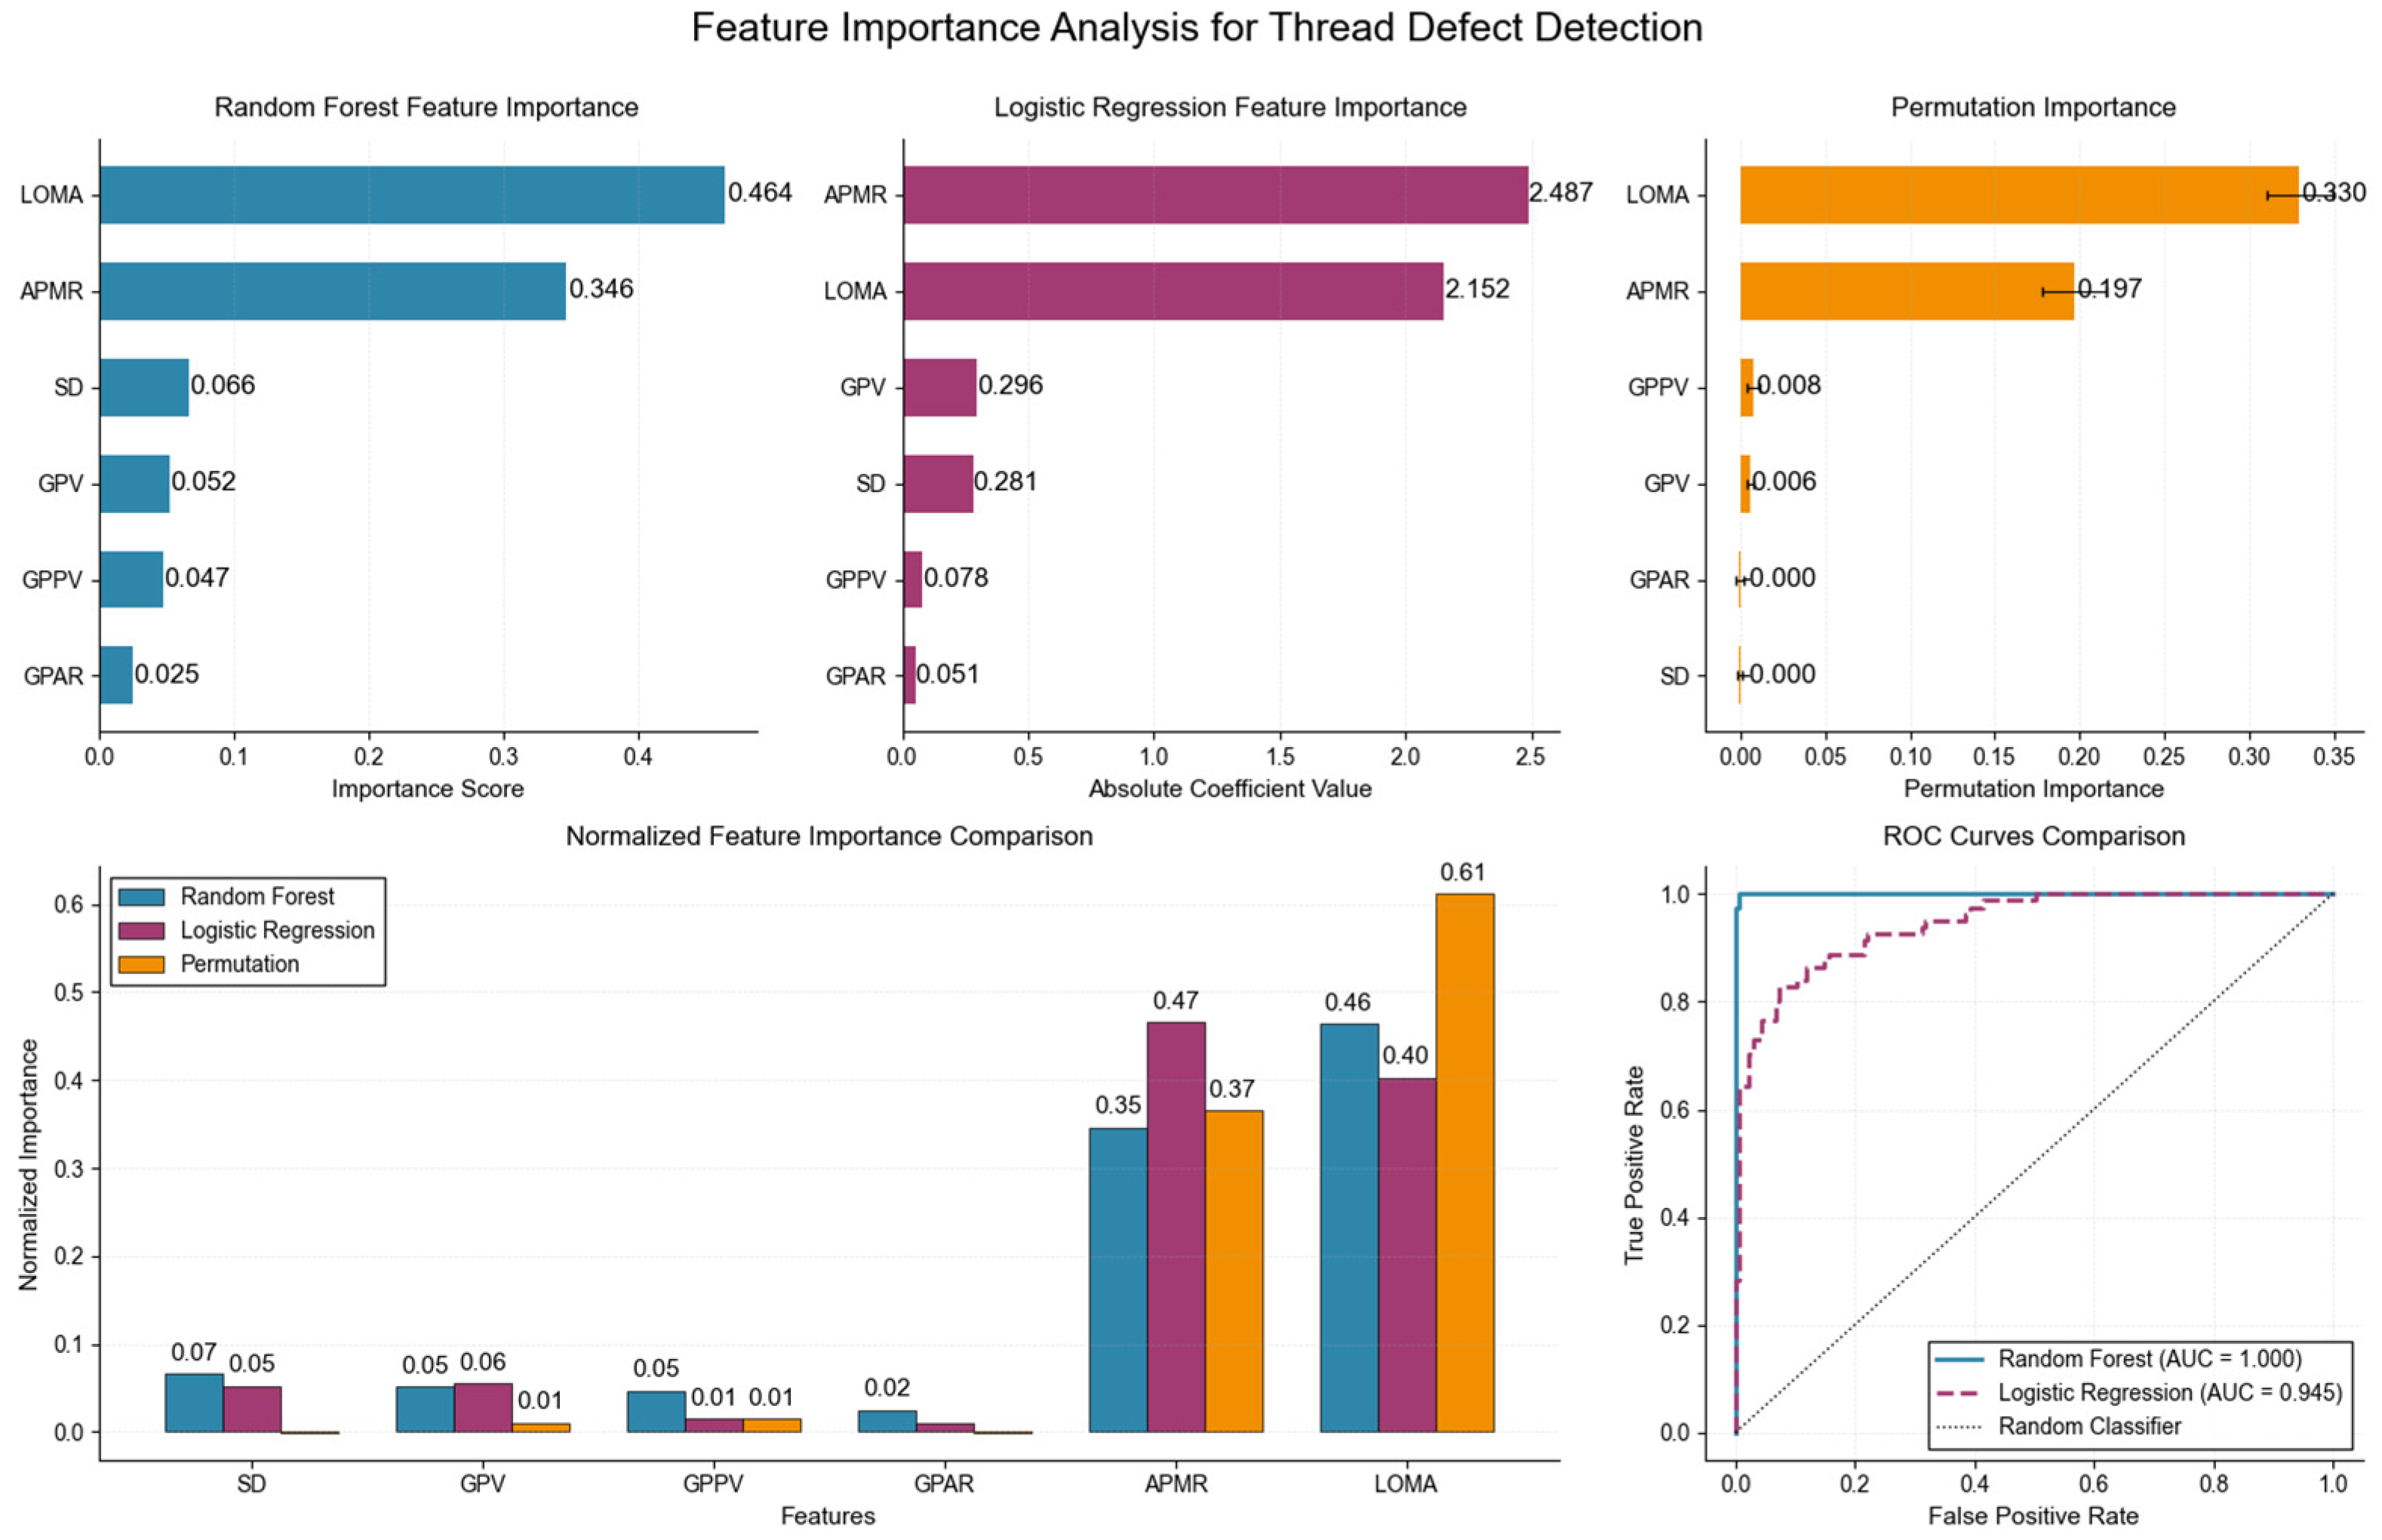
For the feature parameters described above, three complementary machine learning approaches—Random Forest-based feature importance [27], logistic regression coefficient analysis [28], and permutation importance [29]—were employed to assess the contribution of each feature to drill pipe thread defect detection. The resulting feature importance evaluation is presented in Figure 12.
Analysis of the feature importance results revealed that, compared to conventionally used parameters such as gradient peak value, the two proposed features—APMR and LOMA—exhibited the highest contribution rates across all three evaluation models. This indicates that these novel parameters more effectively characterize the damage state of drill pipe threads. The Area Under the Curve (AUC) values achieved by the Random Forest and logistic regression models were 1.000 and 0.945, respectively, further validating the effectiveness of the selected features.
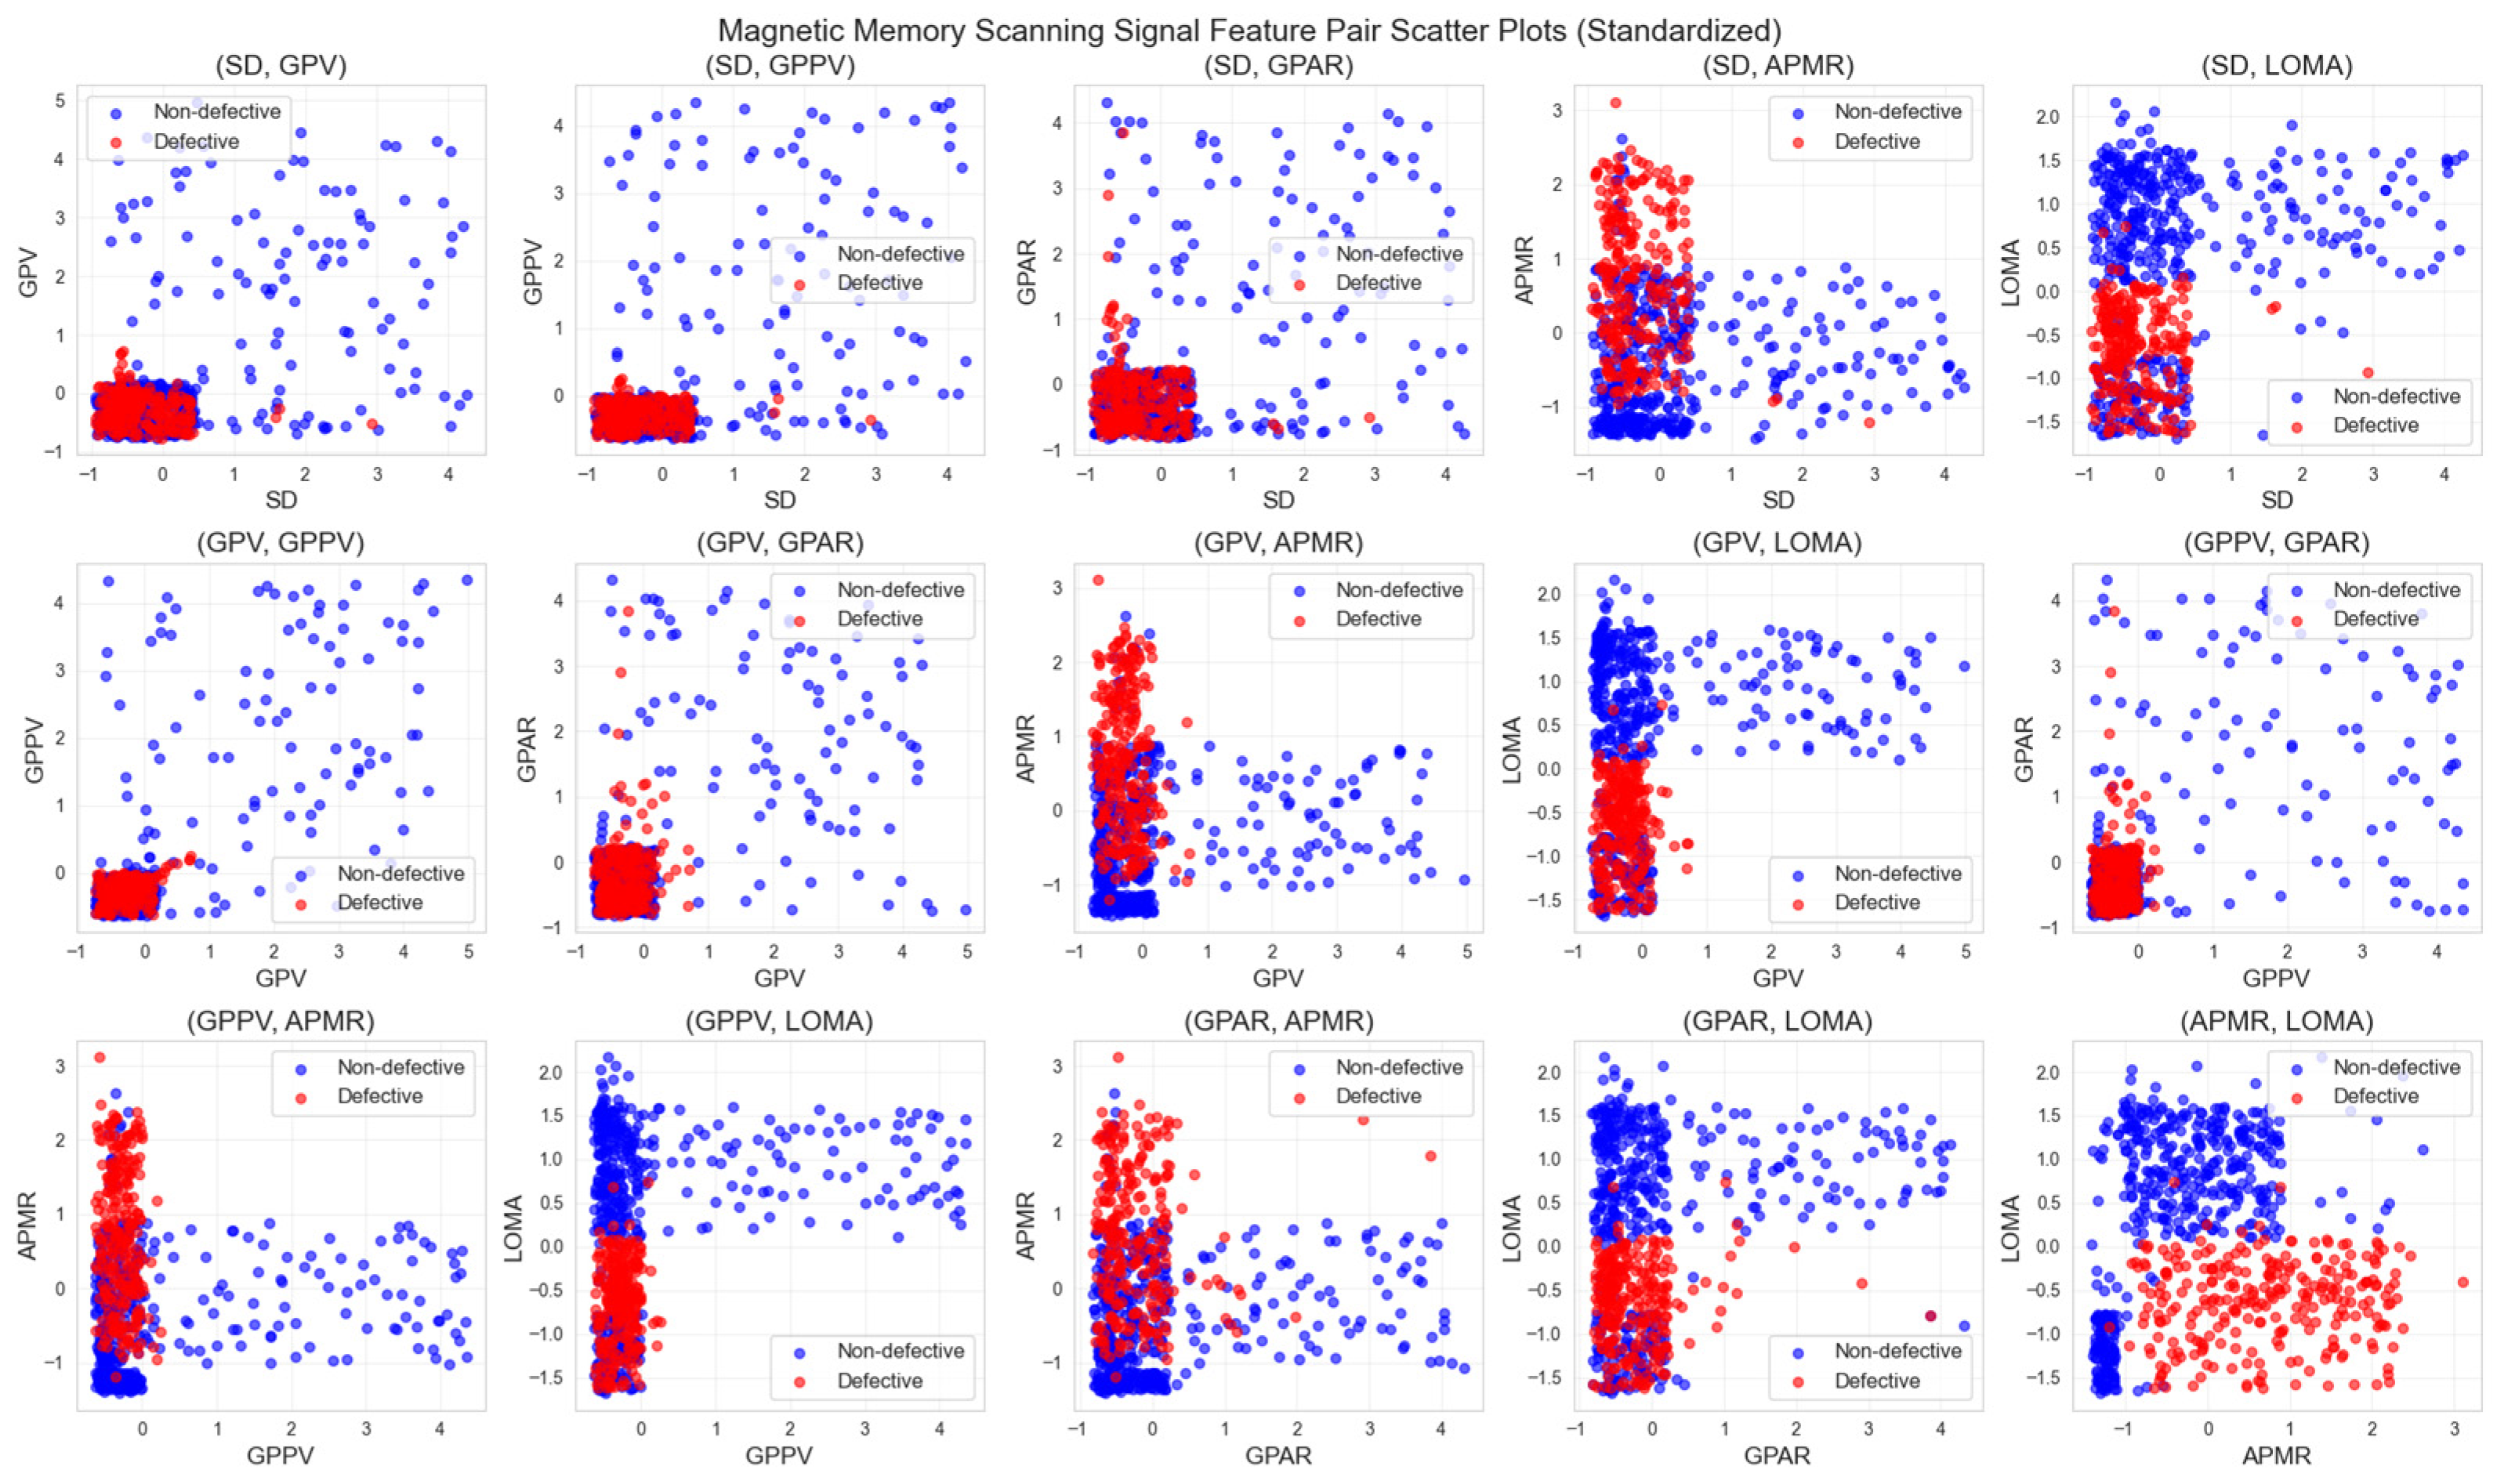
Through three complementary methods—Random Forest, logistic regression, and permutation importance—LOMA and APMR were identified as the two features with the highest contribution. However, single-feature importance assessments reflect only the individual contribution of each feature to classification and do not fully capture synergistic effects or redundancy among features [30]. To validate the above findings and explore potential synergies, a feature-pair evaluation experiment was designed. All six features were combined into 15 unique pairs, and each pair was evaluated using a composite score (70% accuracy + 30% F1 score) for ranking.
Figure 13 presents the two-dimensional scatter distributions for all 15 feature pairs. Distinct differences were observed in the ability of various feature pairs to discriminate between defective and non-defective samples. For instance, the feature pair (APMR, LOMA) exhibited superior class separability, with samples from the two categories showing clear boundaries in the feature space. In contrast, certain pairs (e.g., GPV, GPPV) demonstrated substantial overlap, indicating limited discriminatory power for defect detection.
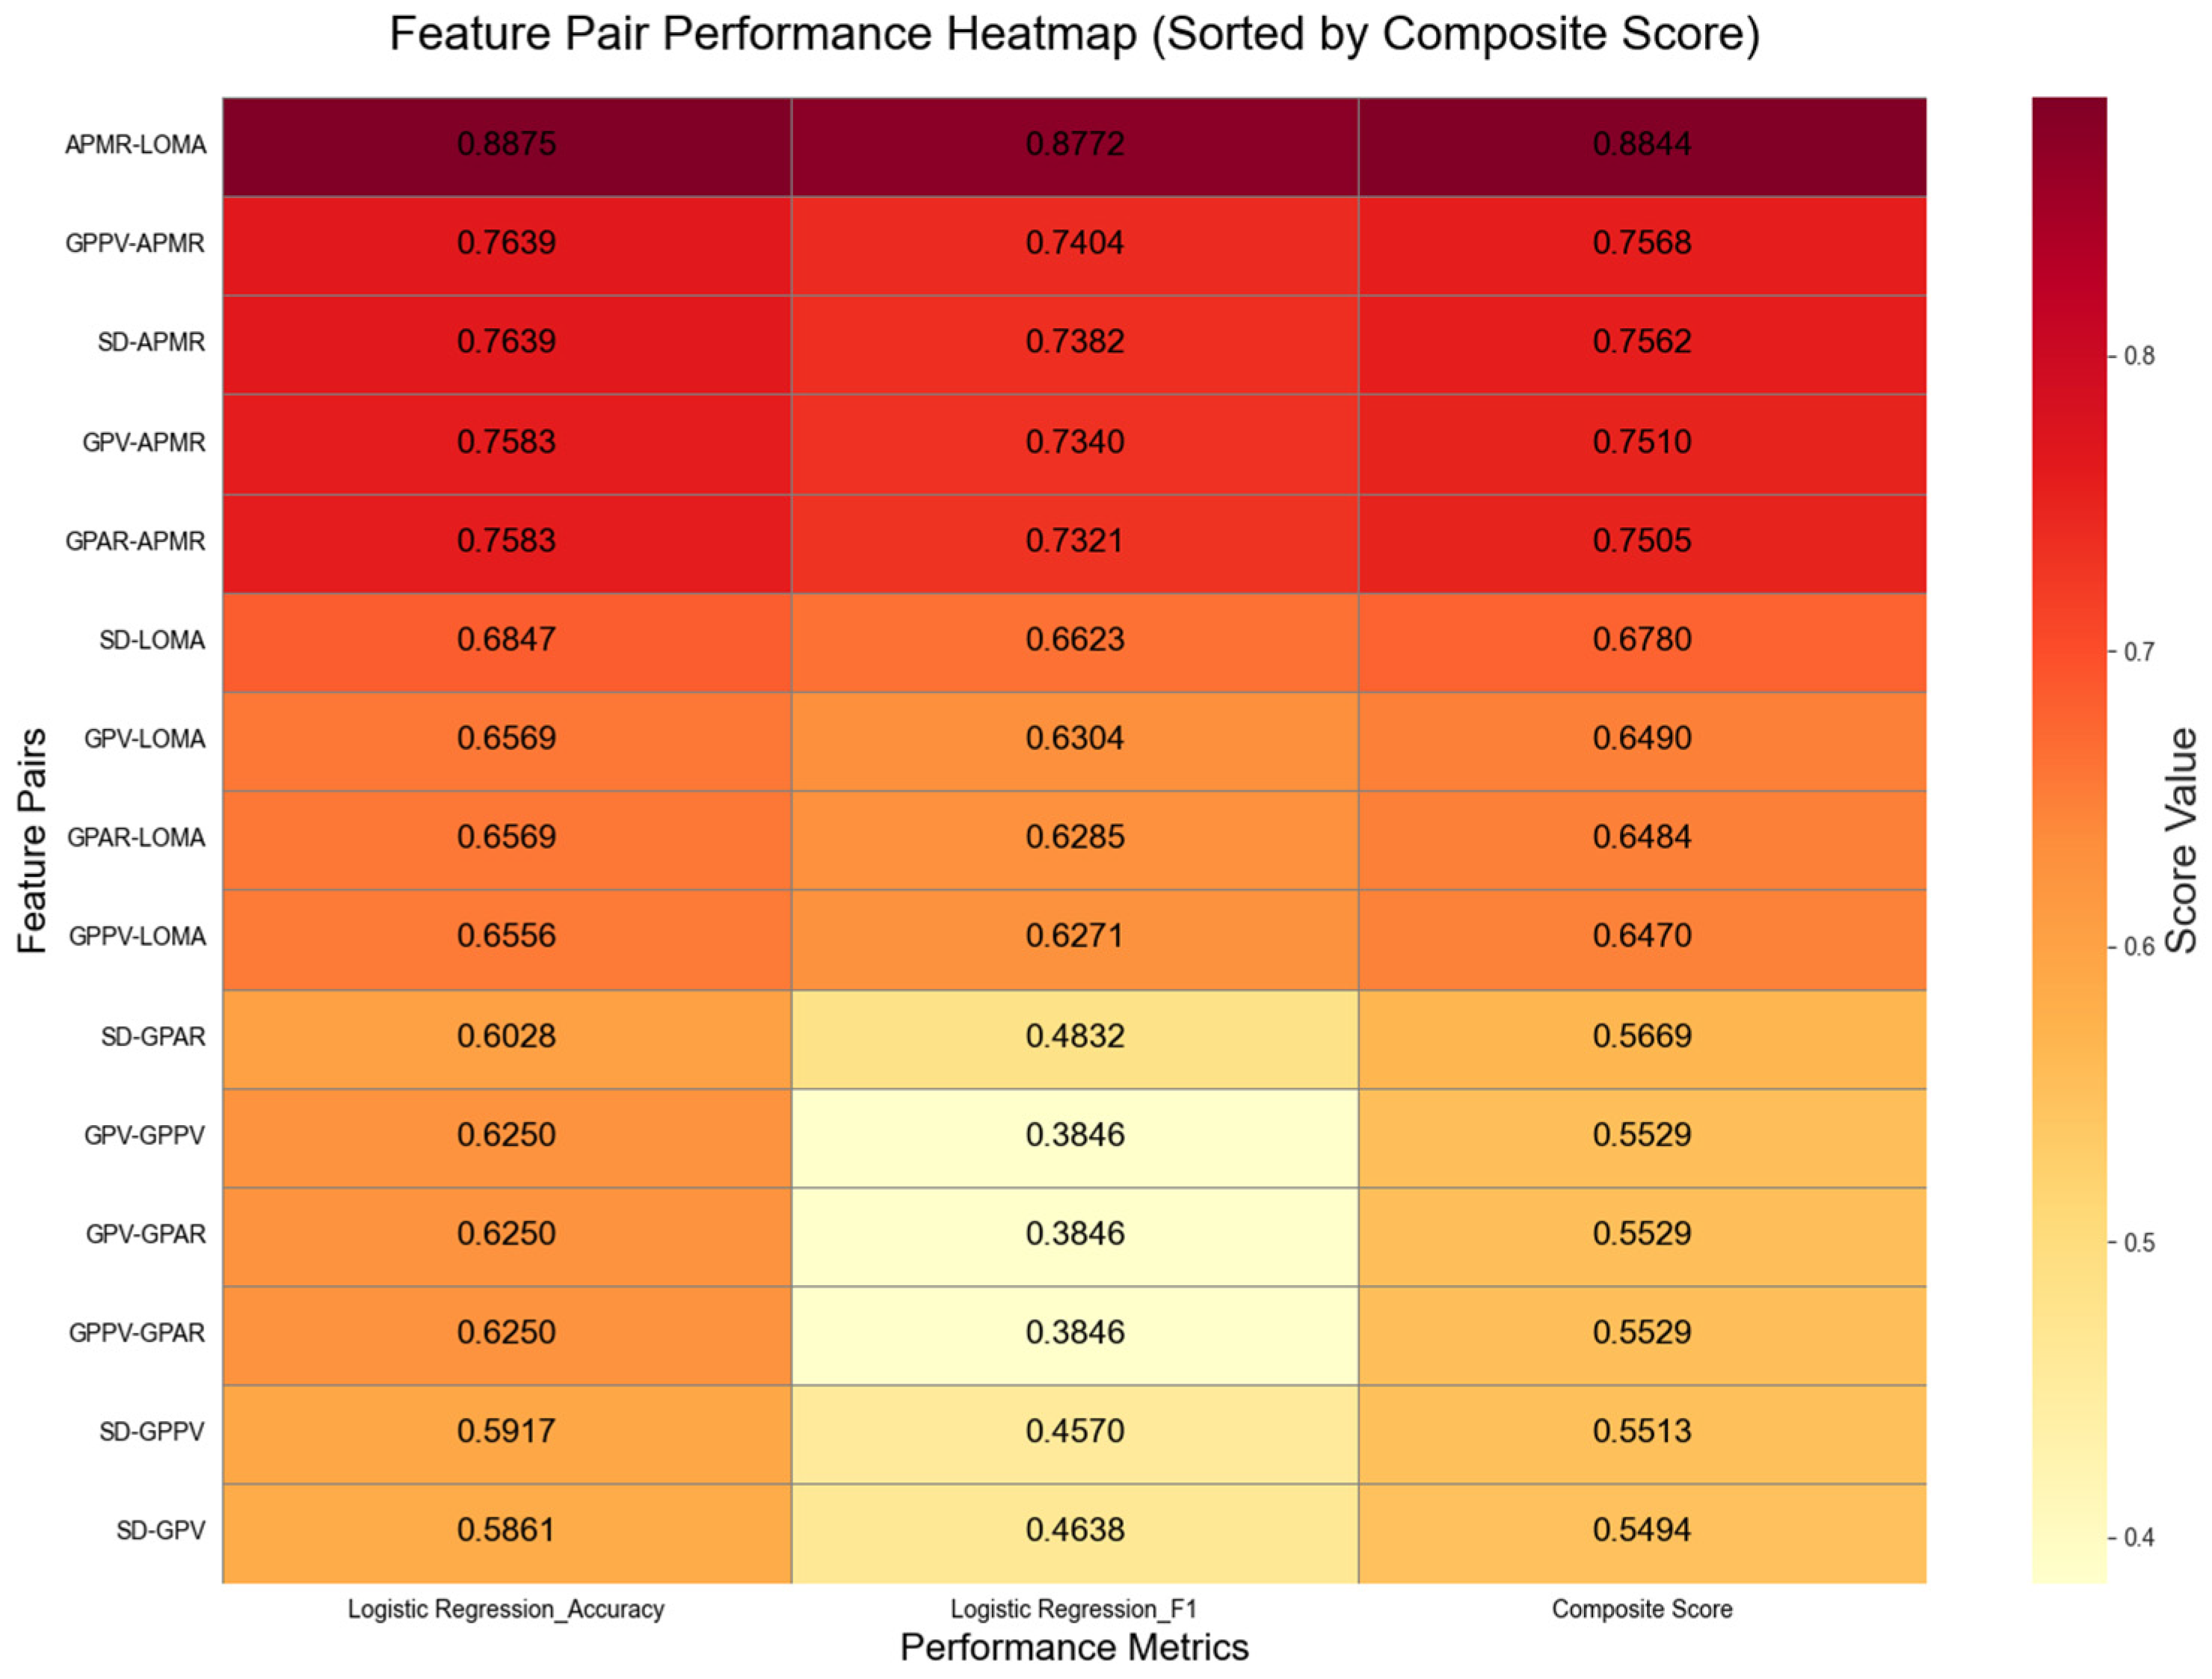
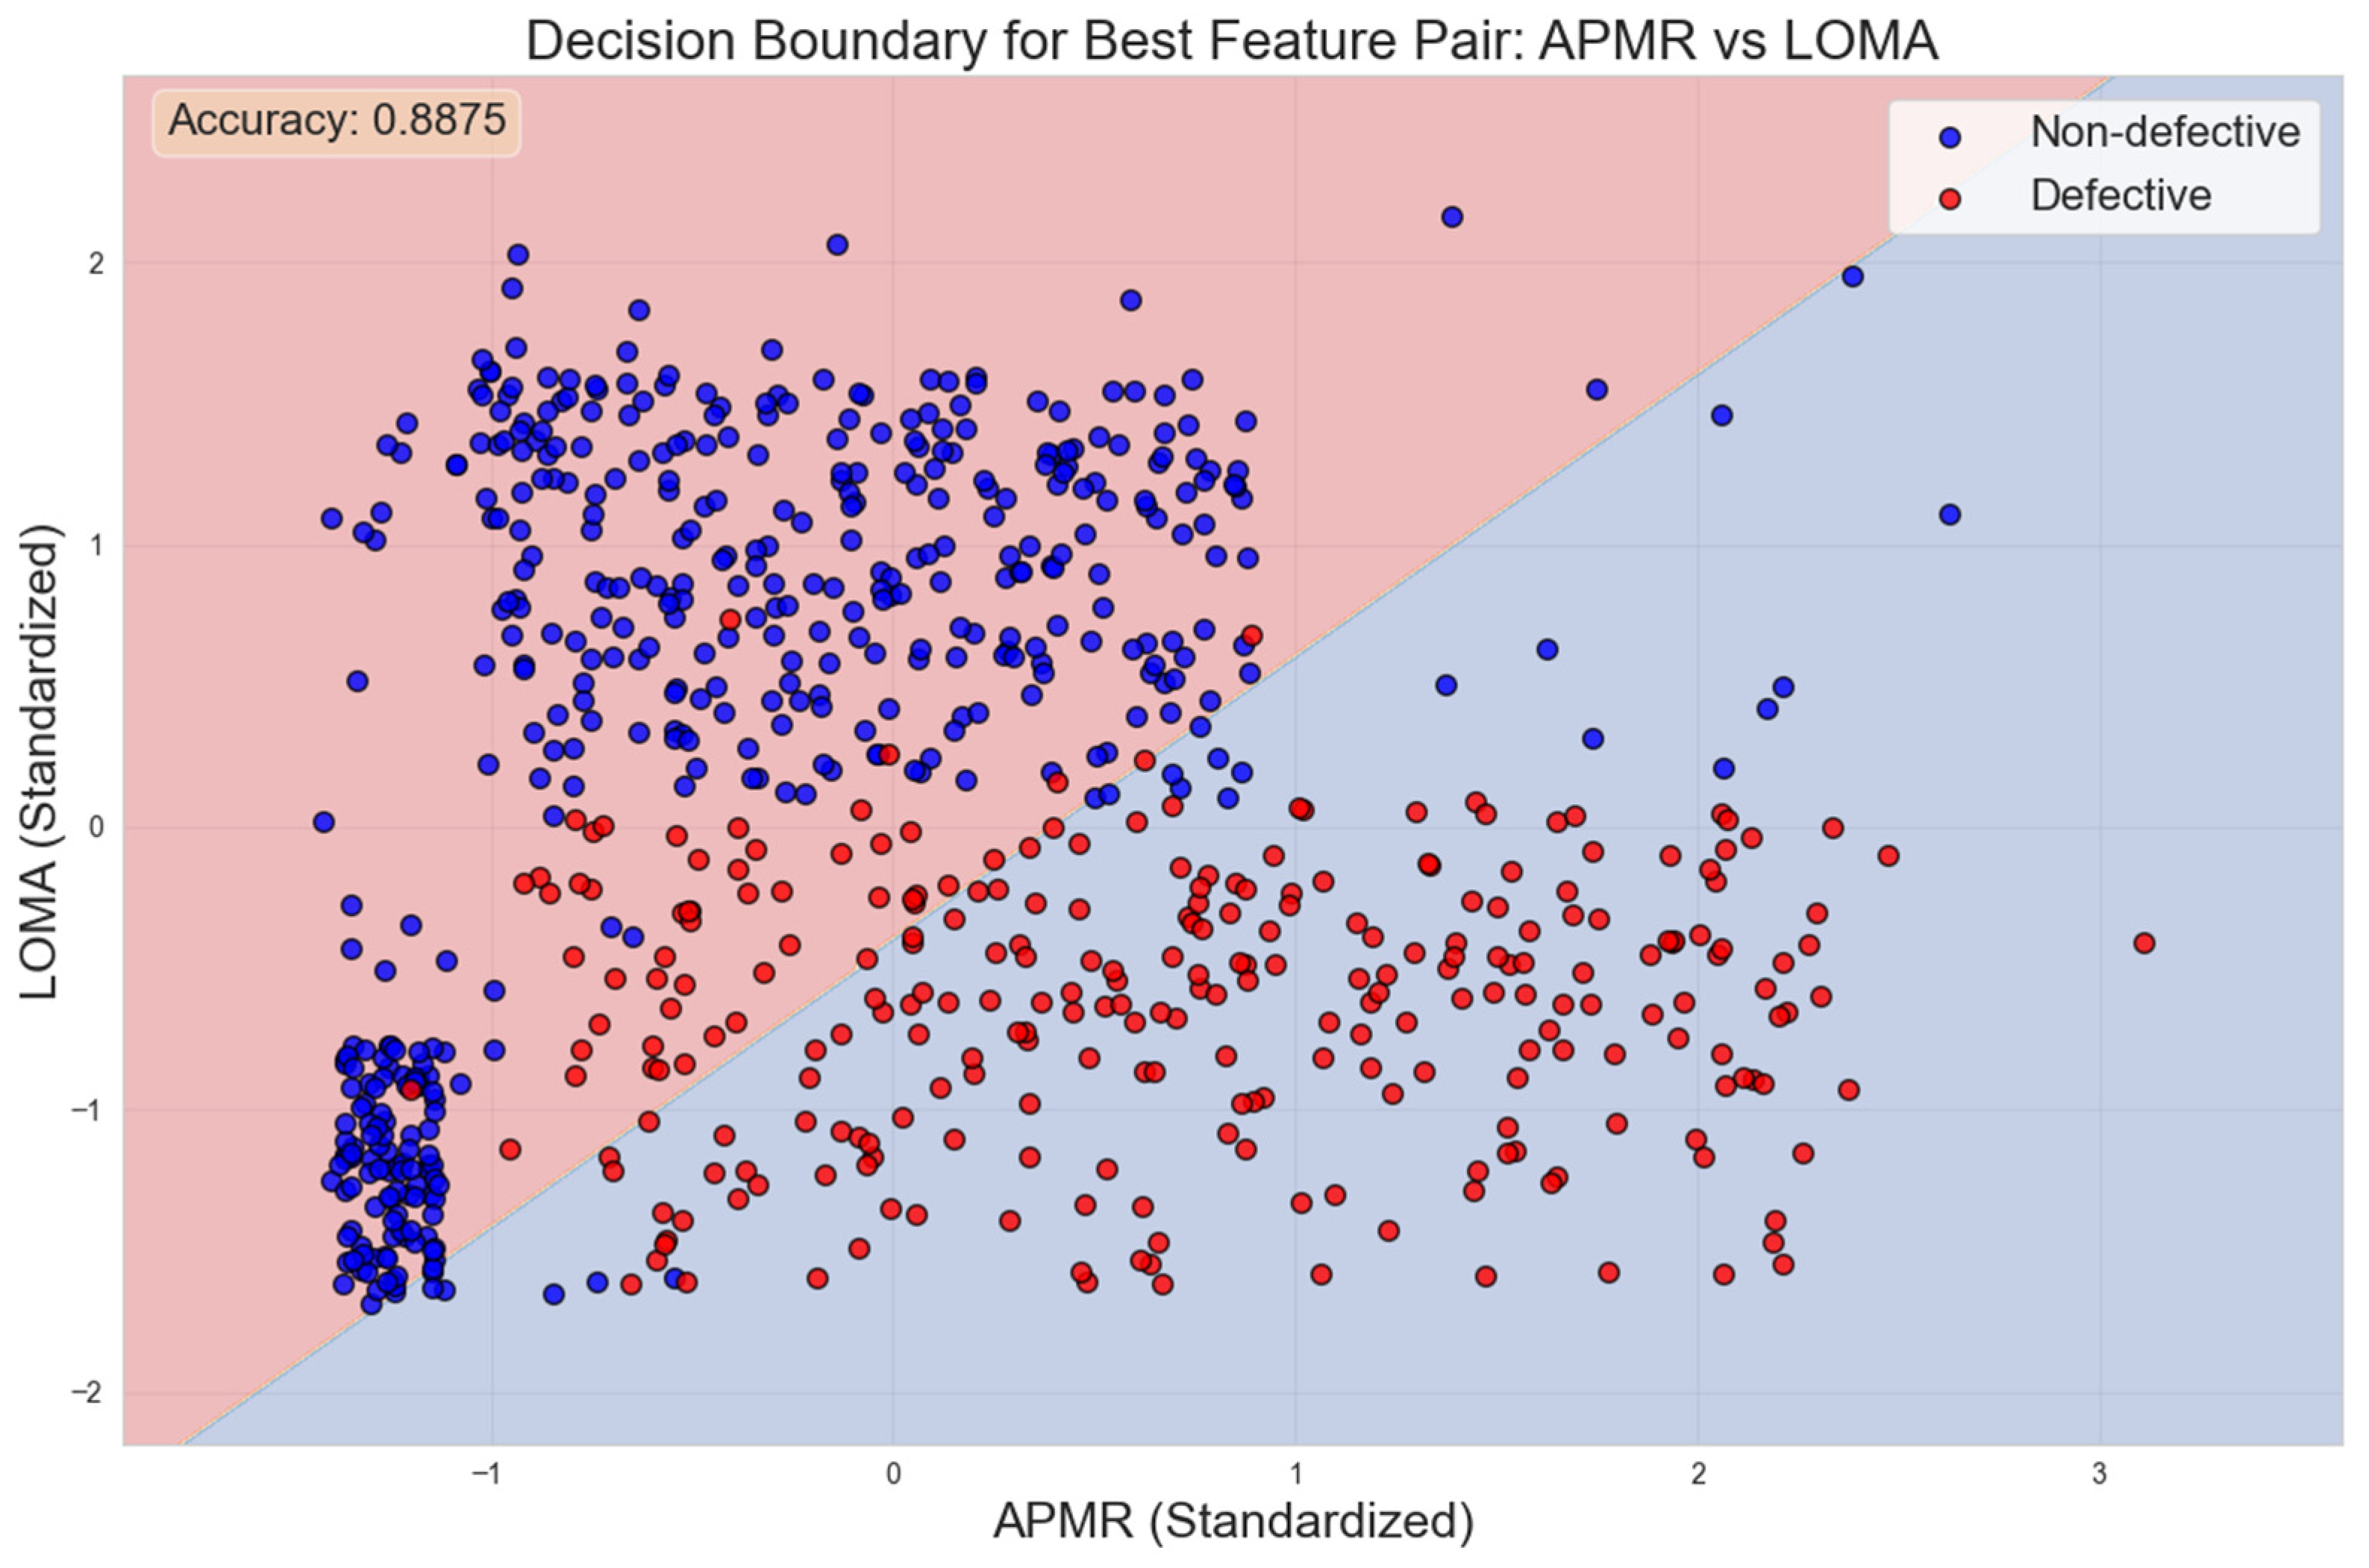
Figure 14 presents a heatmap visualizing the performance of each feature pair. The composite score ranking indicates that the feature pair (APMR, LOMA) achieved the best overall performance, attaining an accuracy of 0.8875 and an F1 score of 0.8772 on the logistic regression model.
Figure 15 depicts the two-dimensional feature space distribution and linear classification results for thread defect detection using the optimal feature combination (APMR vs. LOMA), where blue and red points represent non-defective and defective samples, respectively. These results indicate, on one hand, that the dataset acquired from field experiments closely resembles the simulation-derived results, thereby validating the rationality of the proposed feature extraction method. On the other hand, examination of the feature scatter plot reveals that although the linear classifier achieves an accuracy of 0.8875, its linear decision boundary fails to effectively capture the underlying distribution pattern of the samples. To enhance classification performance, nonlinear machine learning methods are therefore required [31].
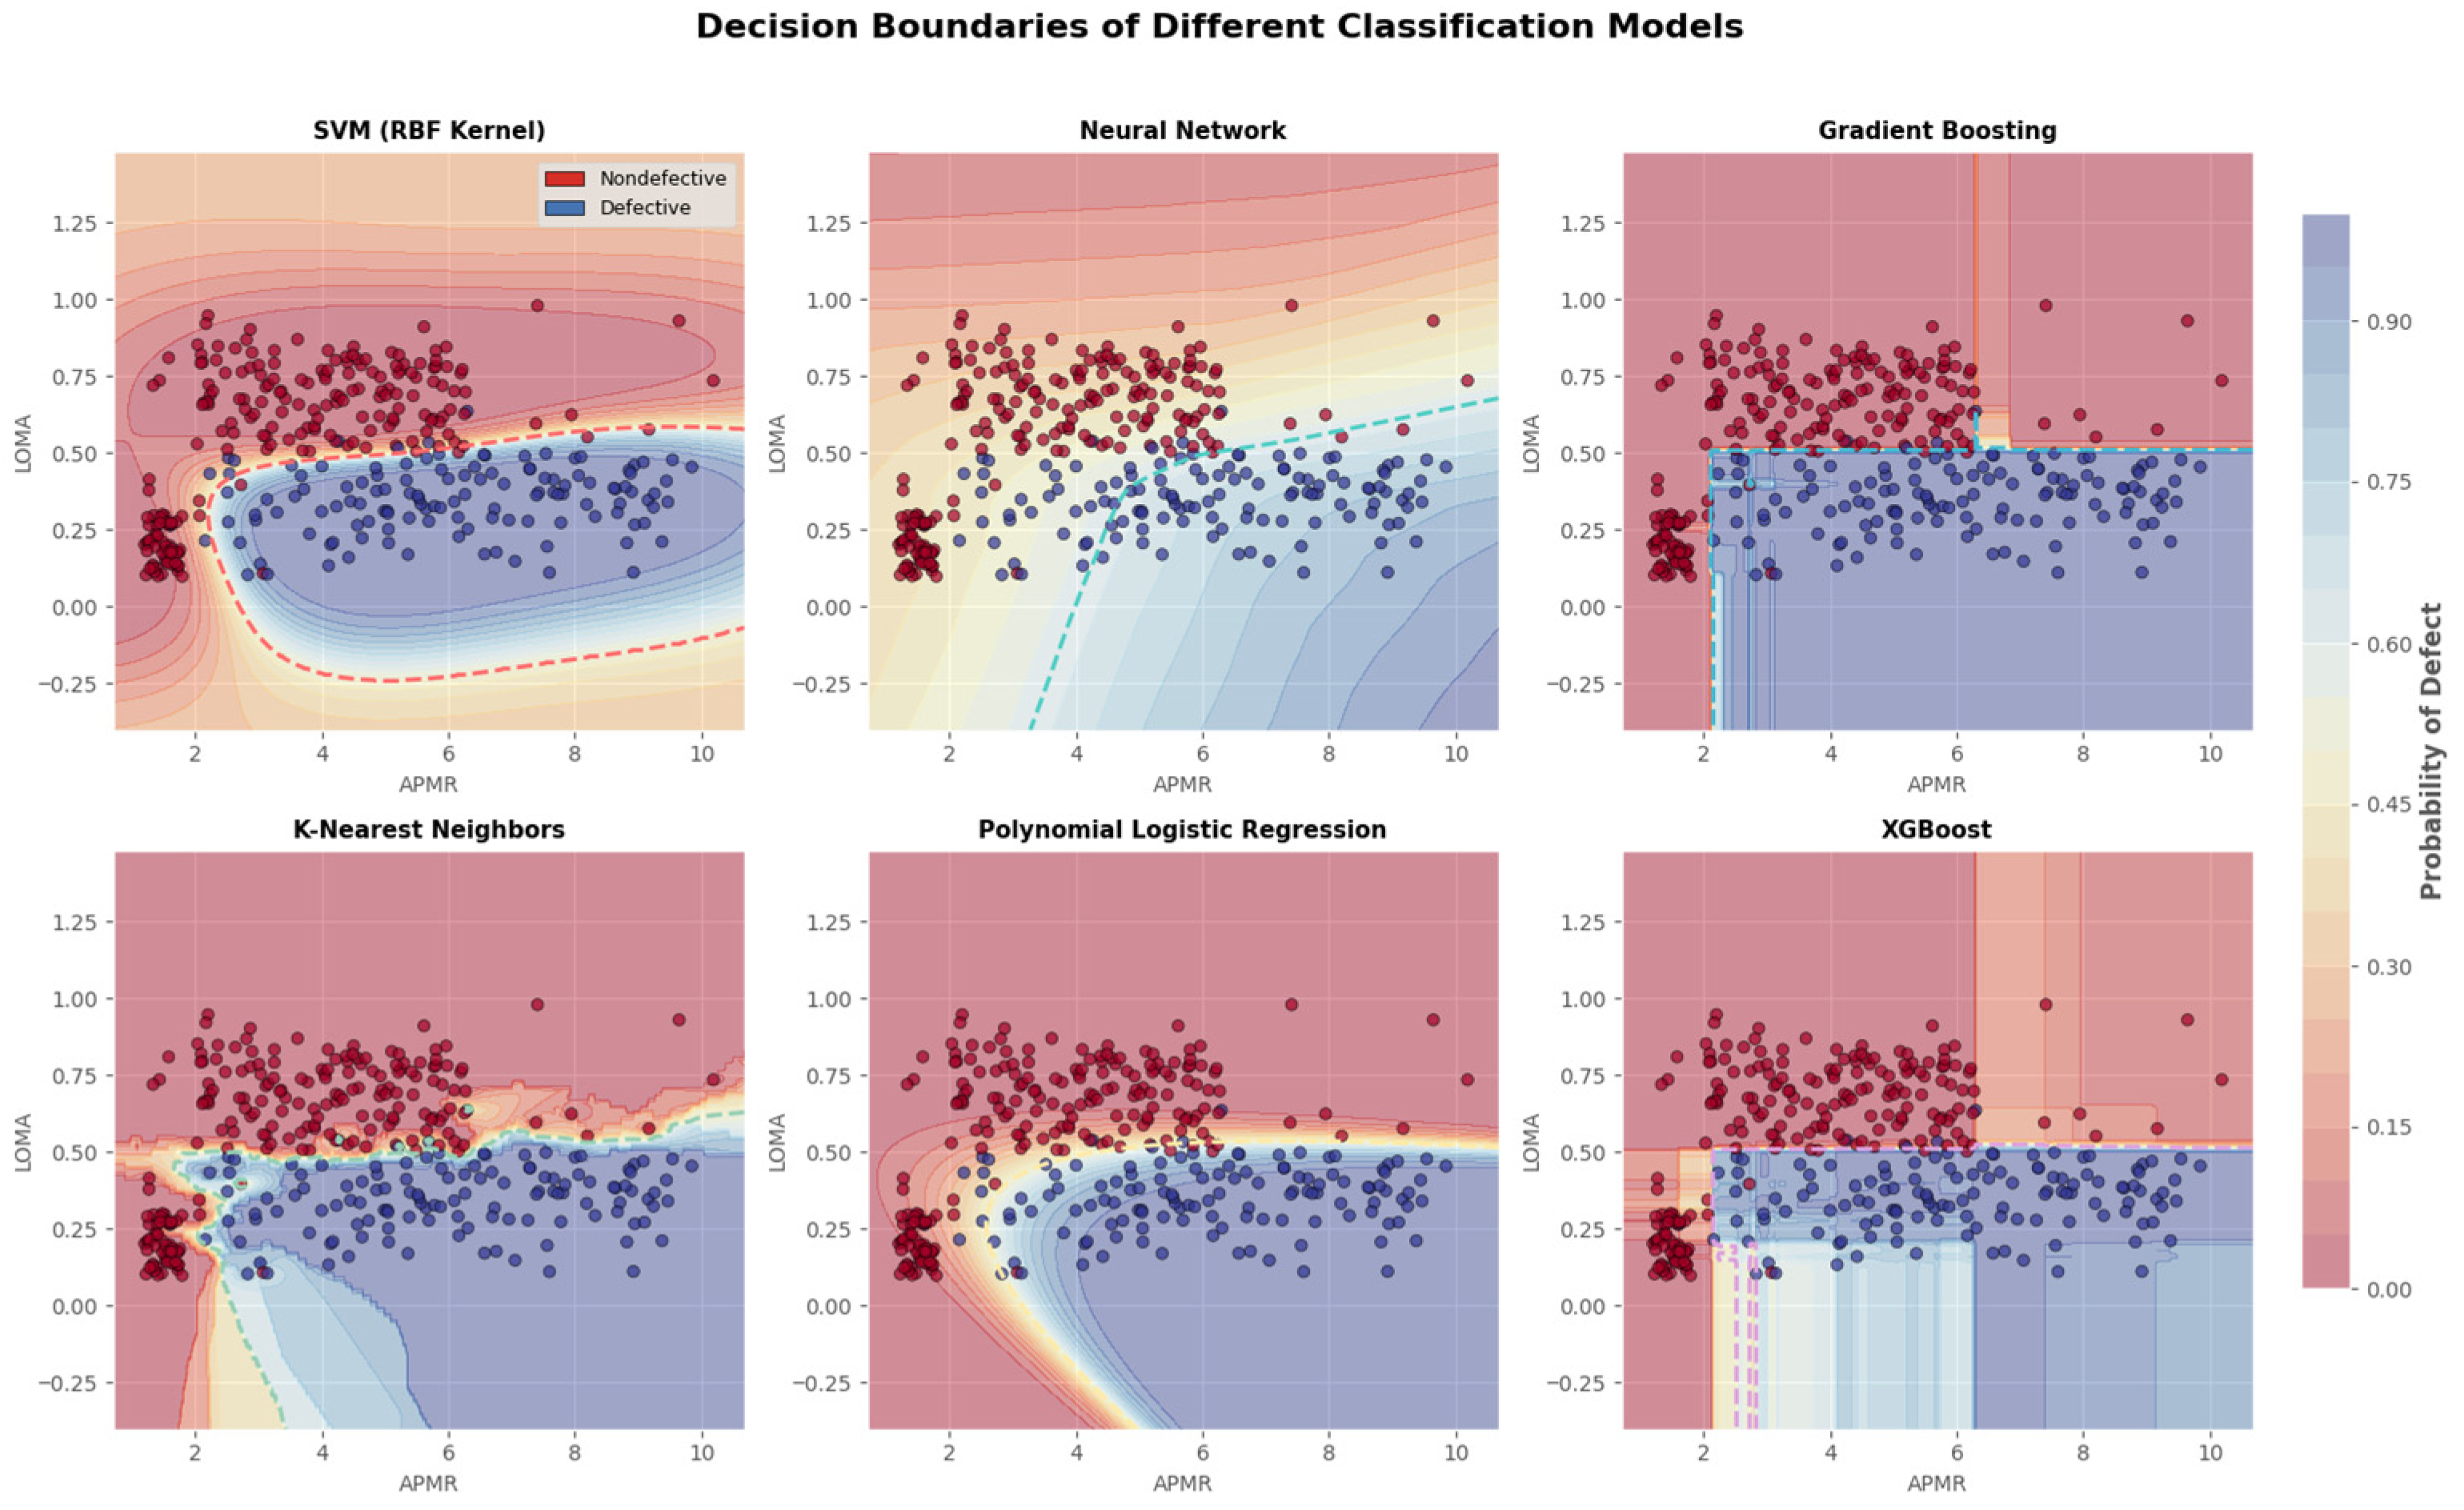
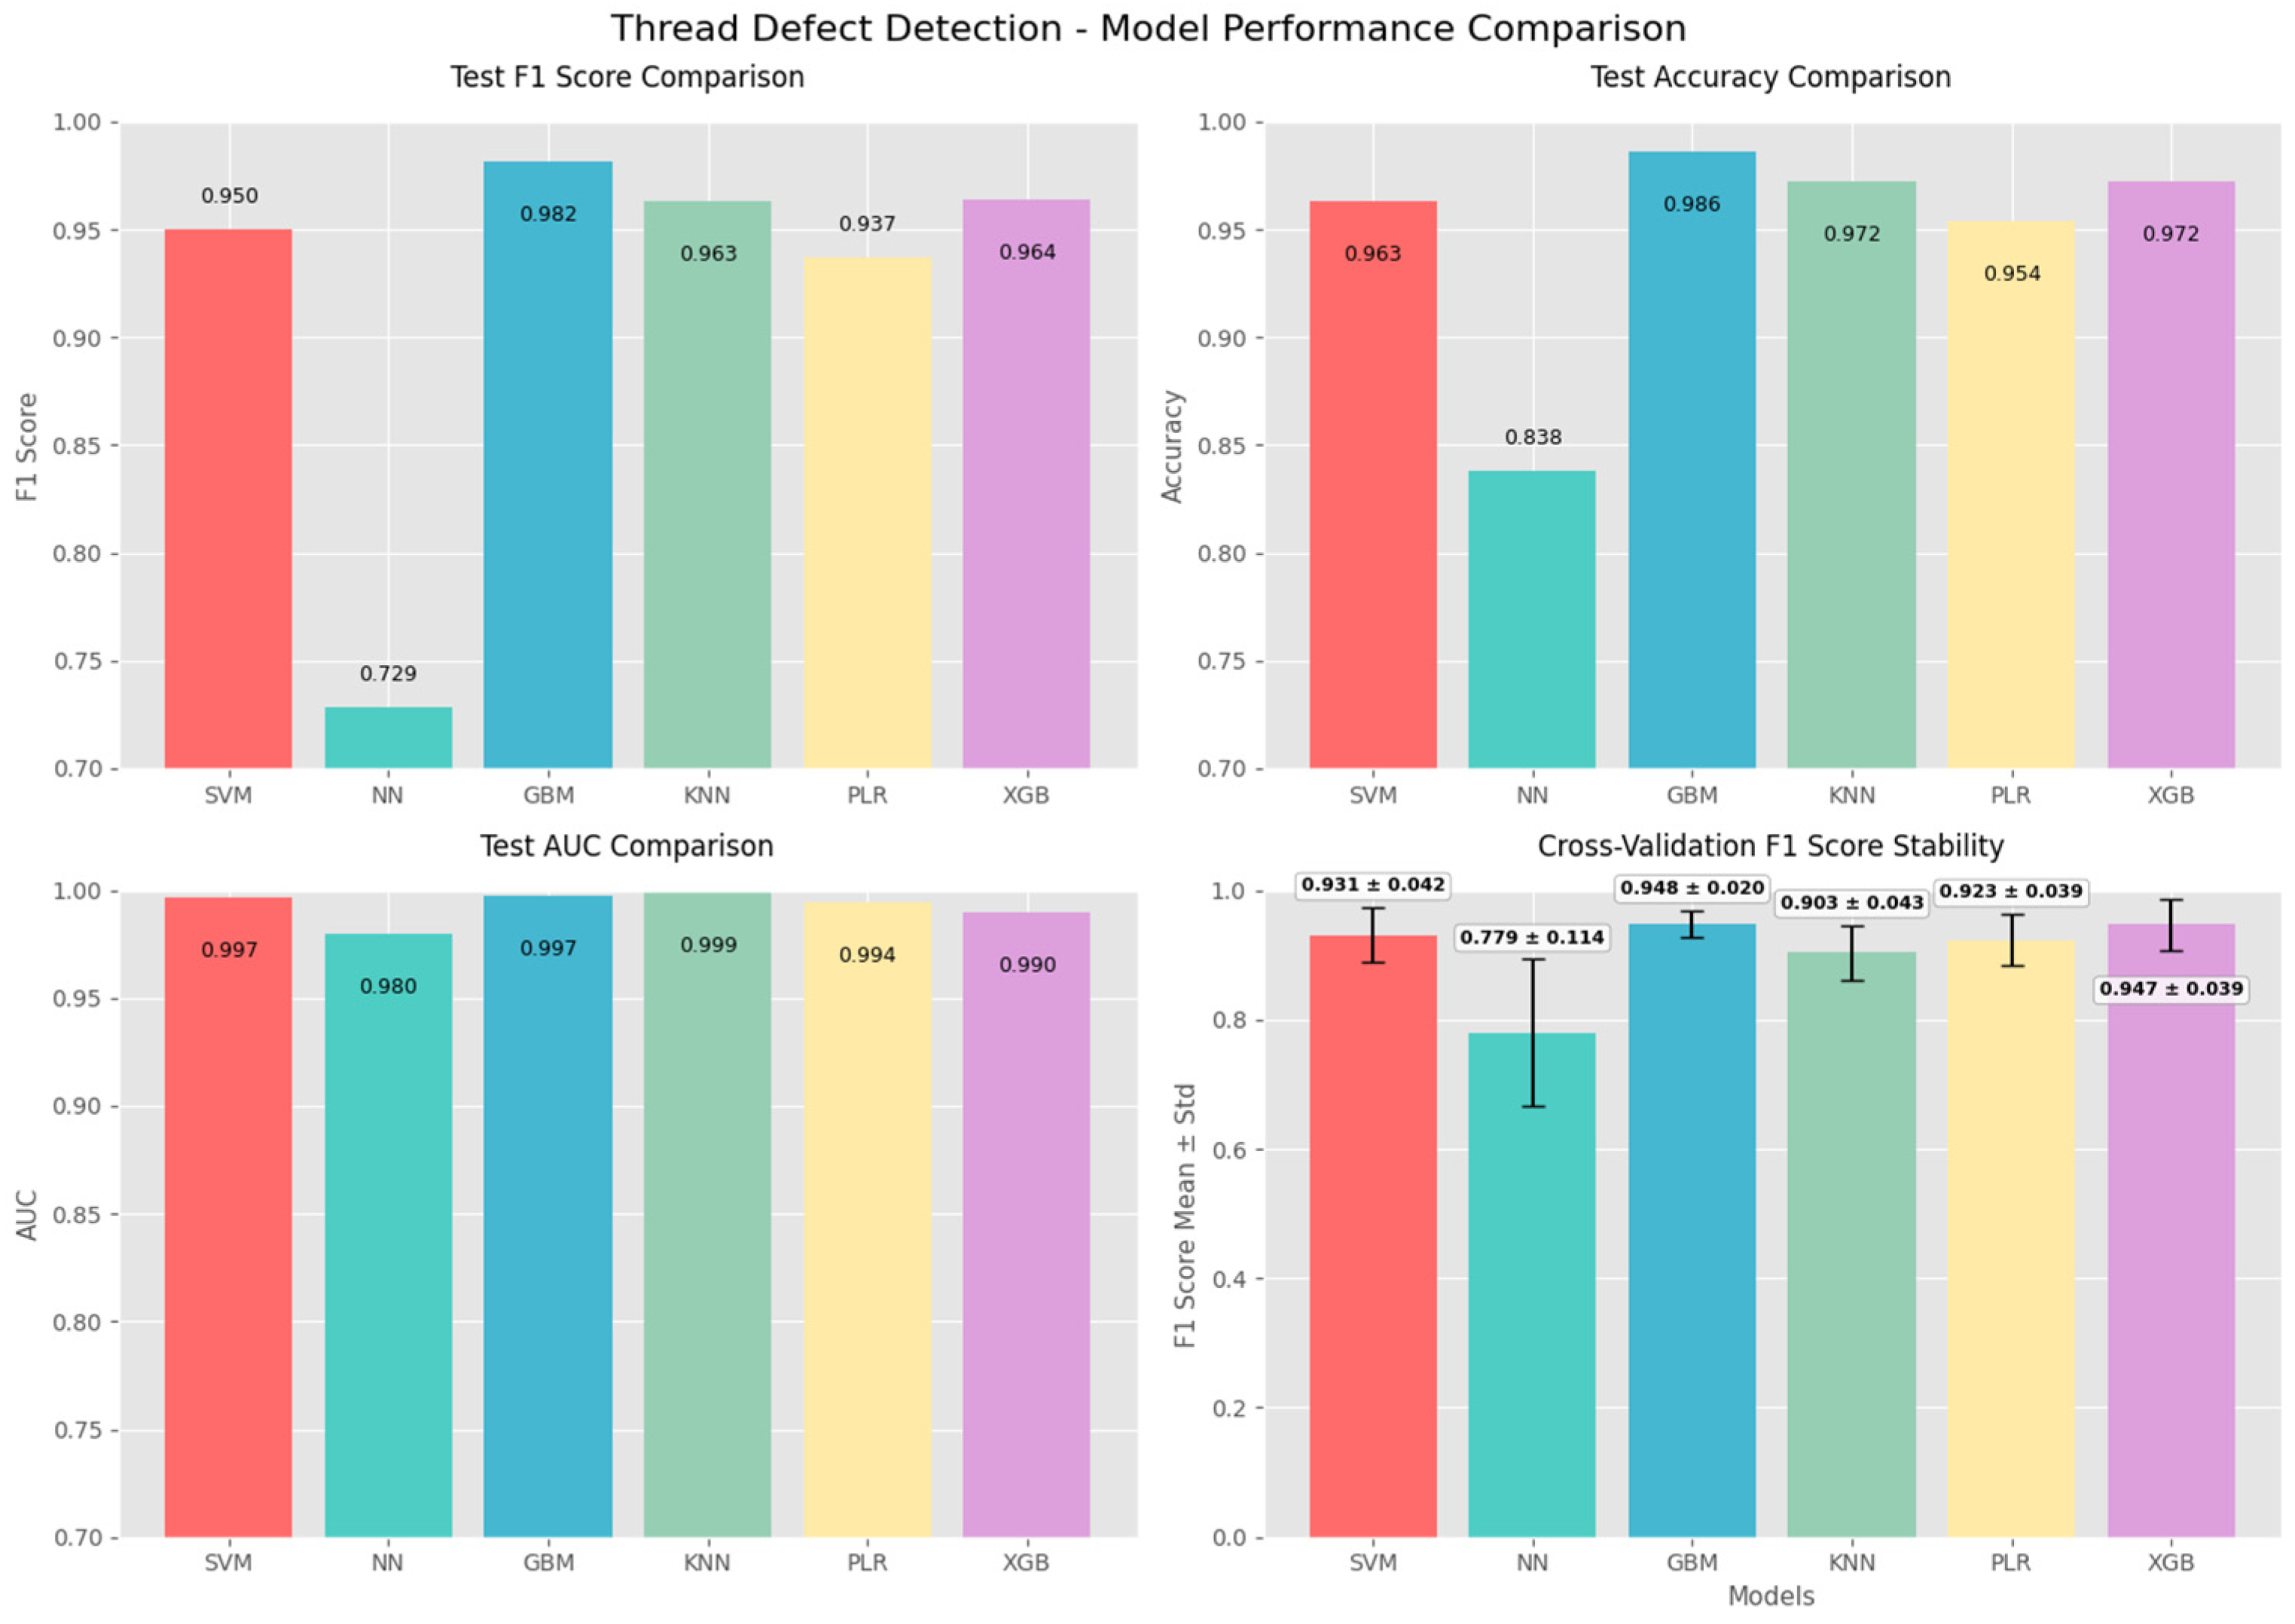
For binary classification tasks, mainstream machine learning methods include Support Vector Machine (SVM) [32], Neural Networks (NNs) [33], Gradient Boosting Machines (GBMs) [34], K-Nearest Neighbors (KNNs) [35], Polynomial Regression (PLR) [36], and XGBoost (XGB) [37]. As illustrated in Figure 16, this study visualizes the decision mechanisms of six machine learning models for thread defect detection within a two-dimensional feature space. The figure presents training set samples as scatter points, with blue and red representing non-defective and defective samples, respectively. The background color gradient from light to dark indicates the model’s predicted defect probability.
The visualization results reveal the following:
  • The GBM and XGBoost models exhibit the most reasonable decision boundaries, clearly separating the two sample classes with smooth boundaries, indicating strong generalization capability;
  • SVM and KNN also form effective classification regions, though minor local overfitting is observed;
  • The neural network generates relatively complex nonlinear boundaries due to its high model complexity given the limited data;
  • The polynomial logistic regression decision boundary displays a simple curved shape, reflecting the inherent limitations of its model assumptions.

5.3. Evaluation and Analysis

As shown in Figure 17, among the six machine learning models evaluated, GBM exhibits the best overall performance in the defect detection task. On the test set, GBM achieves the highest F1 score (0.9818) and accuracy (0.9861), along with a recall of 1.0000—achieving complete detection of defective samples, which holds significant importance for practical industrial quality control. Additionally, its AUC value of 0.9972 ranks second only to the K-nearest neighbors algorithm, demonstrating excellent defect discriminative capability. In summary, GBM not only achieves the highest F1 score and accuracy on the test set but also ensures complete detection of all defects while exhibiting the strongest stability. Consequently, GBM represents the optimal choice for the thread defect detection task in this study, offering a practical and reliable solution for industrial thread quality monitoring.

6. Conclusions

Based on the above research, the main conclusions of this paper are summarized as follows:
  • To address the inherent susceptibility of conventional metal magnetic memory (MMM) methods to interferences from material magnetization and lift-off distance in detecting fatigue damage on drill pipe threads, this paper proposes a novel damage evaluation approach based on the Area Peak-to-Mean Ratio (APMR) of magnetic signals integrated with machine-learning classification.
  • Through theoretical analysis, finite-element simulations, and field experiments, the feasibility and effectiveness of the proposed method are validated, culminating in the successful development of a dedicated inspection system.
  • The results demonstrate that the APMR feature effectively mitigates signal interferences, particularly those arising from lift-off distance variations. Among the evaluated machine-learning models, the Gradient Boosting Machine (GBM) exhibits superior overall performance, achieving efficient and accurate identification of thread damage, thereby offering a reliable technical solution for rapid on-site inspection.
  • This technical pathway provides a new method for enhancing safety and equipment reliability in drilling operations and lays an important foundation for the broader adoption of intelligent nondestructive evaluation technologies in oil and gas drilling. In summary, this research not only presents an innovative solution to the practical challenge of drill-pipe thread damage detection but also establishes a crucial foundation for the wider application of intelligent nondestructive evaluation technologies in the oil and gas drilling field.

Author Contributions

Conceptualization, H.J. and J.F.; methodology, Y.W.; validation, H.J., Y.F. and K.W.; formal analysis, H.J. and K.W.; investigation, L.Z.; resources, J.F.; data curation, H.J.; writing—original draft preparation, H.J.; writing—review and editing, Y.Y. and H.J.; visualization, H.J.; supervision, J.F.; project administration, J.F.; funding acquisition, J.F. All authors have read and agreed to the published version of the manuscript.

Funding

This research was funded by National Key Research and Development Program of China (grant number 2023YFC3009200).

Data Availability Statement

The data supporting the findings of this study are available from the corresponding author upon reasonable request.

Conflicts of Interest

The authors declare no conflicts of interest.

References

  1. Cheng, J.; Yu, Y.; Sun, Y. Numerical Analysis of Whirl for Drill String with Aluminium Alloy Drill Pipes in Deep Vertical Well. Geoenergy Sci. Eng. 2023, 231, 212314. [Google Scholar] [CrossRef]
  2. Mao, L.; Luo, J.; Zeng, S.; Li, J.; Chen, R. Dynamic Characteristic Analysis of Riser Considering Drilling Pipe Contact Collision. Ocean Eng. 2023, 286, 115470. [Google Scholar] [CrossRef]
  3. Song, X.; Xiao, H.; Yang, H.; Wang, H.; Zhou, M.; Xu, Z.; Zhu, Z.; Li, B.; Jing, S. Experimental Study on the Sliding Friction of Cuttings Bed and Pipe during Horizontal-Well Drilling Considering Pipe Rotation. Powder Technol. 2024, 436, 119440. [Google Scholar] [CrossRef]
  4. Song, J.; Liu, S.; He, Y.; Jiang, S.; Zhou, S.; Zhu, H. The State-of-the-Art Review on the Drill Pipe Vibration. Geoenergy Sci. Eng. 2024, 243, 213337. [Google Scholar] [CrossRef]
  5. Jin, C.; Qian, F.; Feng, F. Effect of Variable Drill Pipe Sizes on Casing Wear Collapse Strength. J. Pet. Sci. Eng. 2020, 195, 107856. [Google Scholar] [CrossRef]
  6. Zou, H.; Tan, Z. Fatigue Life Analysis of Rotary Drill Pipe. Int. J. Press. Vessel. Pip. 2023, 201, 104874. [Google Scholar] [CrossRef]
  7. Zhu, X.; Zhang, Z. Design of an Ultra-High Torque Double Shoulder Drill-Pipe Tool Joint for Extended Reach Wells. Nat. Gas Ind. B 2017, 4, 374–381. [Google Scholar] [CrossRef]
  8. Chen, Y.; Wu, S.; Huang, L.; He, Y.; Zhou, M. Stress Concentration and Tensile Failure Risk of a Wire Rope Induced by a Rectangular Surface Defect: A Finite Element Analysis. Eng. Fail. Anal. 2026, 185, 110424. [Google Scholar] [CrossRef]
  9. Wu, Q.; Dong, K.; Qin, X.; Hu, Z.; Xiong, X. Magnetic Particle Inspection: Status, Advances, and Challenges—Demands for Automatic Non-Destructive Testing. NDT E Int. 2024, 143, 103030. [Google Scholar] [CrossRef]
  10. Chen, M.; Ma, X.; Xu, X.; Yang, K.; Chen, J.; Mei, D.; Jin, H. Ultrasonic Multi-Mode Total Focusing Method for Pipe Axial Defects in Inaccessible and Distant Areas. Measurement 2025, 251, 117238. [Google Scholar] [CrossRef]
  11. Jiang, H.; Zhang, L.; Fan, J.; Zhang, Z.; Wang, K. A Study on Fatigue Life Evaluation of 42CrMo Steel under Cyclic Loading Based on Metal Magnetic Memory Method. NDT E Int. 2025, 151, 103285. [Google Scholar] [CrossRef]
  12. Liu, B.; Wang, F.C.; Wu, Z.H.; Lian, Z.; He, L.Y.; Yang, L.J.; Tian, R.F.; Geng, H.; Tian, Y. Research on Magnetic Memory Inspection Signal Characteristics of Multi-Parameter Coupling Pipeline Welds. NDT E Int. 2024, 143, 103019. [Google Scholar] [CrossRef]
  13. Yang, B.; Liu, Z.; Feng, R.; Li, W. Magnetic Memory Signals Induced by Adjacent Circular Hole Defects. J. Magn. Magn. Mater. 2025, 618, 172854. [Google Scholar] [CrossRef]
  14. He, Z.; Zhang, H.; Ma, H.; Zou, Y.; Zhou, J.; Liao, L. Study on Magnetic Memory Detection of Weld Fatigue Damage by Using the Relative Entropy Theory. J. Magn. Magn. Mater. 2023, 570, 170472. [Google Scholar] [CrossRef]
  15. Yang, Y.; Ma, X.; Su, S.; Wang, W. Theoretical and Experimental Analysis of the Correlation between Magnetic Memory Signals and Cumulative Ductile Damage of Butt Weld under Low Cycle Fatigue. J. Magn. Magn. Mater. 2023, 580, 170911. [Google Scholar] [CrossRef]
  16. Liu, B.; Zeng, Z.; Wang, H. Study on the Early Fatigue Damage Evaluation of High Strength Steel by Using Three Components of Metal Magnetic Memory Signal. NDT E Int. 2021, 117, 102380. [Google Scholar] [CrossRef]
  17. Ge, J.; Li, W.; Chen, G.; Yin, X.; Yuan, X.; Yang, W.; Liu, J.; Chen, Y. Multiple Type Defect Detection in Pipe by Helmholtz Electromagnetic Array Probe. NDT E Int. 2017, 91, 97–107. [Google Scholar] [CrossRef]
  18. Perng, D.-B.; Chen, S.-H.; Chang, Y.-S. A Novel Internal Thread Defect Auto-Inspection System. Int. J. Adv. Manuf. Technol. 2010, 47, 731–743. [Google Scholar] [CrossRef]
  19. Kong, Q.; Wu, Z.; Song, Y. Online Detection of External Thread Surface Defects Based on an Improved Template Matching Algorithm. Measurement 2022, 195, 111087. [Google Scholar] [CrossRef]
  20. Su, S.; Yang, Y.; Wang, W.; Ma, X. Crack Propagation Characterization and Statistical Evaluation of Fatigue Life for Locally Corroded Bridge Steel Based on Metal Magnetic Memory Method. J. Magn. Magn. Mater. 2021, 536, 168136. [Google Scholar] [CrossRef]
  21. Li, J.; Su, S.; Wang, W.; Liu, X.; Zuo, F. Fast Reconstruction Method for Defect Profiles of Ferromagnetic Materials Based on Metal Magnetic Memory Technique. Measurement 2023, 215, 112885. [Google Scholar] [CrossRef]
  22. Wang, Y.; Fan, J.; Sun, Y. Classification of Sewer Pipe Defects Based on an Automatically Designed Convolutional Neural Network. Expert Syst. Appl. 2025, 264, 125806. [Google Scholar] [CrossRef]
  23. Jiles, D.C. Theory of the Magnetomechanical Effect. J. Phys. D Appl. Phys. 1995, 28, 1537. [Google Scholar] [CrossRef]
  24. Xie, Z.; Zhao, Y.; Bai, P.; Li, Q.; Pei, C.; Chen, H.; Chen, Z. Influence of Tensile Stress on Hysteresis Loop of Reduced Activation Ferrite & Martensitic Steel. J. Nucl. Mater. 2019, 515, 28–34. [Google Scholar] [CrossRef]
  25. Sun, L.; Liu, X.; Niu, H. A Method for Identifying Geometrical Defects and Stress Concentration Zones in MMM Technique. NDT E Int. 2019, 107, 102133. [Google Scholar] [CrossRef]
  26. Wang, R.; Li, B. Finite Element Analysis of Double-Shoulder Drill Joint. Front. Econ. Manag. 2020, 1, 166–170. [Google Scholar] [CrossRef]
  27. Thomas, N.S.; Kaliraj, S. An Improved and Optimized Random Forest Based Approach to Predict the Software Faults. SN Comput. Sci. 2024, 5, 530. [Google Scholar] [CrossRef]
  28. Pandey, A.; Jadhav, A. Towards Effective Software Defect Prediction Using Machine Learning Techniques. SN Comput. Sci. 2024, 5, 1096. [Google Scholar] [CrossRef]
  29. Li, Z.; Zhu, W.; Zhang, H.; Miao, Y.; Ren, J. The Impact of Unsupervised Feature Selection Techniques on the Performance and Interpretation of Defect Prediction Models. Autom. Softw. Eng. 2025, 32, 40. [Google Scholar] [CrossRef]
  30. Li, M.; Liu, Y.; Chen, D.; Li, X. Lightweight Metal Surface Defect Segmentation Method Based on Multi-Scale Feature Fusion and Knowledge Distillation. J. Supercomput. 2025, 81, 886. [Google Scholar] [CrossRef]
  31. Sharma, D.N.; Yadav, D.K. ROS-XGB: A Machine Learning Model for Software Defect Prediction. Int. J. Syst. Assur. Eng. Manag. 2025. [Google Scholar] [CrossRef]
  32. Kannan, V.; Dao, D.V.; Li, H. Detection of Signal Integrity Issues in Vibration Monitoring Using One-Class Support Vector Machine. J. Vib. Eng. Technol. 2024, 12, 601–611. [Google Scholar] [CrossRef]
  33. Zhao, W.; Li, D.; Xu, F. A Lightweight Weld Defect Recognition Algorithm Based on Convolutional Neural Networks. Pattern Anal. Appl. 2024, 27, 94. [Google Scholar] [CrossRef]
  34. Kang, G.; Lee, G.; Kim, Y. Combining Residual Network and Bidirectional Long Short-Term Memory with Additive Attention for Wafer Defect Classification. Int. J. Adv. Manuf. Technol. 2025, 141, 4967–4983. [Google Scholar] [CrossRef]
  35. Sánchez-García, Á.J.; Limon, X.; Dominguez-Isidro, S.; Olvera-Villeda, D.J.; Perez-Arriaga, J.C. Class Balancing Approaches to Improve for Software Defect Prediction Estimations: A Comparative Study. Program. Comput. Softw. 2024, 50, 621–647. [Google Scholar] [CrossRef]
  36. Liu, X.; Zhu, P.; Qian, Z.; Yang, S. Fatigue Life Prediction Methodology for Welded Joints Considering Defect Effects. Int. J. Fatigue 2026, 203, 109307. [Google Scholar] [CrossRef]
  37. Wang, Y.; Zhang, C.; Wang, Z.; Jiao, Y.; Qin, J. Evolution-Aimed Reliability Prediction of Blended Hydrogen-Natural Gas Pipelines with Crack Defects. Int. J. Hydrogen Energy 2025, 176, 151491. [Google Scholar] [CrossRef]
Figure 1. Schematic of thread inspection.
Machines 14 00519 g001
Figure 2. Model and mesh.
Machines 14 00519 g002
Figure 3. Stress distribution and magnetic flux density contour.
Machines 14 00519 g003
Figure 4. Scanning results under different lift-off distances.
Machines 14 00519 g004
Figure 5. Experimental set-up.
Machines 14 00519 g005
Figure 6. Sensor Characteristic Curve.
Machines 14 00519 g006
Figure 7. Field inspection test.
Machines 14 00519 g007
Figure 8. Magnetic particle inspection results.
Machines 14 00519 g008
Figure 9. Schematic diagram of magnetic signal area peak-to-mean ratio.
Machines 14 00519 g009
Figure 10. Scan results of defective specimen.
Machines 14 00519 g010
Figure 11. Schematic of magnetic field interference at the pin end.
Machines 14 00519 g011
Figure 12. Contribution rate analysis.
Machines 14 00519 g012
Figure 13. Two-dimensional scatter distribution of 15 feature pairs.
Machines 14 00519 g013
Figure 14. Heatmap of feature pair performance.
Machines 14 00519 g014
Figure 15. Two-dimensional scatter plot of the optimal feature pair.
Machines 14 00519 g015
Figure 16. Visualization of Two-Dimensional Decision Boundaries.
Machines 14 00519 g016
Figure 17. Model performance comparison.
Machines 14 00519 g017
Table 1. Comparison of non-destructive testing methods.
MethodMagnetic Particle Testing (MPT)Ultrasonic Testing (UT)Metal Magnetic Memory (MMM)
AdvantagesReliable Results;
Simple Equipment;
Low Cost;
Direct and Intuitive Indication.
Deep detection;
High sensitivity;
Versatility.
Early detection;
Fast and portable;
No external magnetic field excitation required.
LimitationsLimited to ferromagnetic materials;
Only detects macroscopic defects;
Low efficiency.
Operating difficulty;
Coupling and surface requirements.
Limited to ferromagnetic
materials;
Not suitable for deep defects.
DiagramMachines 14 00519 i001Machines 14 00519 i002Machines 14 00519 i003
Table 2. Test Parameters.
Specimen Material4145 H
Scanning Speed5 mm/s, 10 mm/s
Sampling Frequency1000 Hz per channel
Scanning Directionshoulder side → thread end
Thread SpecificationNC46, NC50
Damage typeFatigue crack
Table 3. Characteristic parameters.
Feature NameCalculation Formula
Standard Deviation (SD) σ = 1 N 1 i = 1 N ( x i x ¯ ) 2
Gradient Peak Value (GPV) G p e a k = m a x ( | x | )
Gradient Peak-to-Peak Value (GPPV) G p p = m a x x m i n x
Gradient Peak-to-Average Ratio (GPAR) G P A R = m a x | x | m e a n | x |
Area Peak-to-Mean Ratio (APMR) A P M R = M a x ( S 1 , S 2 , S 3 , , S n ) i = 1 n S i / n
Location of maximum area (LOMA) L O M A = p o s i t i o n A P M R
Disclaimer/Publisher’s Note: The statements, opinions and data contained in all publications are solely those of the individual author(s) and contributor(s) and not of MDPI and/or the editor(s). MDPI and/or the editor(s) disclaim responsibility for any injury to people or property resulting from any ideas, methods, instructions or products referred to in the content.