Article

Enhancement of Vertical and Pitch Dynamics in Vehicles Utilizing Mechatronic Suspension

1
Automotive Engineering Research Institute, Jiangsu University, Zhenjiang 212013, China
2
School of Management Engineering, Xuzhou University of Technology, Xuzhou 221018, China
3
Department of Civil and Environmental Engineering, The Hong Kong Polytechnic University, Hong Kong 999077, China
*
Author to whom correspondence should be addressed.
Machines 2026, 14(3), 285; https://doi.org/10.3390/machines14030285
Submission received: 29 January 2026 / Revised: 22 February 2026 / Accepted: 28 February 2026 / Published: 3 March 2026
(This article belongs to the Special Issue New Journeys in Vehicle System Dynamics and Control)

Abstract

To address the limitations of existing quarter-vehicle models in capturing pitch motion and front-rear coupling effects, this paper proposes a half-vehicle mechatronic suspension system based on the electromechanical analogy. Traditional methods often overlook non-ideal effects and the dynamic interaction between the front and rear wheels. This paper constructs an equivalent electrical network model for the half-vehicle suspension system. To ensure the physical realizability of the system, parameter optimization is performed under positive-real constraints using the Non-dominated Sorting Genetic Algorithm II (NSGA-II). This approach achieves an optimal trade-off between vertical vibration suppression and pitch control. Simulation results under random road input at a vehicle speed of 20 m/s indicate that while the unconstrained mechatronic suspension improves ride comfort, it increases the dynamic tire load by 19.18%. In contrast, the constrained mechatronic suspension reduces RMS vertical body acceleration by 19.54% and pitch angular acceleration by 2.22% compared to the standard passive suspension. Additionally, a reduction of 8.29% was observed in the suspension working space RMS, alongside a 1.26% decrease in the dynamic tire load. These results demonstrate that introducing appropriate positive-real constraints effectively balances ride comfort and road-holding performance, providing a systematic modeling and optimization framework for half-vehicle mechatronic suspensions.

1. Introduction

Vehicle suspension systems constitute the mechanical interface between the vehicle body and the wheels, directly affecting ride comfort, handling stability, and tire–road contact performance. Conventional passive suspensions employ fixed-parameter spring–damper configurations. Although structurally simple and cost-effective, their inherent parameter trade-offs limit performance adaptability under varying road excitations, particularly for commercial and agricultural vehicles operating under complex terrain conditions. Recent field tests by Xu et al. [1] on crawler-type combine harvesters and Gao et al. [2] on traction rotary tillers show that strong low-frequency vibrations reduce driver comfort and cause parts to break. This happens in key parts like conveyor troughs (Jing et al. [3]), where high static stiffness is needed to carry heavy loads but often makes the vibration worse for the vehicle body, as noted by Gao et al. [2], Cui et al. [4], Chen et al. [5], and Xu et al. [1]. Related studies in vibration engineering by Chen et al. [5], Cui et al. [6], Chen et al. [7], and Li et al. [8] have reported that long exposure to low-frequency vibration strongly affects driver comfort, work efficiency, and equipment life. This problem goes beyond vehicle dynamics; recent cross-field studies in material science and acoustics by Yaw et al. [9] and Ding et al. [10] have also pointed out the critical importance of effective low-frequency vibration and noise reduction.
To improve suspension performance without substantially increasing energy consumption or system complexity, semi-active suspension systems have been extensively investigated. Existing studies mainly focus on controllable damping devices and hybrid structural optimization strategies. Zhang et al. [11] addressed performance degradation caused by actuator response delay using time-delay-dependent multi-objective control and compensation methods, respectively. Addressing similar control fidelity issues, Yang et al. [12] recently investigated the phase deviation characteristics in semi-active suspension systems and proposed corresponding compensation strategies. Jin et al. [13] introduced inerter–spring–damper (ISD) configurations or hydro-pneumatic inertial elements with parameter optimization, achieving improved vibration suppression and tire load characteristics under various operating conditions. Further improvements in strength and error rejection have been reported by Tharehalli Mata et al. [14] and Wang et al. [15] using advanced control strategies. However, for agricultural and heavy-duty vehicles with limited onboard energy and harsh working environments, the applicability of fully active suspension systems remains constrained by high energy consumption, cost, and structural complexity, as discussed by Tharehalli Mata et al. [14], Jin et al. [16], Yu et al. [17], and Barredo et al. [18]. Excessive chassis vibration can reduce the prediction accuracy of soil-engaging tool forces (Chandio et al. [19]) consistency of precision spraying systems (Ji et al. [20]). In addition, for agricultural tractors with complex mechanical-electronic-hydraulic powertrains, controlling vibration is key to the machine’s energy efficiency, according to Zhu et al. [21]. Consequently, energy-efficient solutions are highly desirable. Emerging research by Liu et al. [22] has even explored the potential of integrating energy harvesting with vibration control to achieve self-powered or low-energy operation.
In this context, ISD suspension systems have attracted increasing attention due to their favorable balance between structural feasibility and dynamic performance enhancement. As summarized in a recent comprehensive review by Liu et al. [23], inerter-based technologies offer unique advantages in impedance shaping and vibration isolation. The inerter is a two-terminal mechanical impedance element whose output force is proportional to the relative acceleration between its terminals, enabling large equivalent inertia with limited physical mass. By integrating inerters with springs and dampers in different topological configurations, ISD suspensions provide additional degrees of freedom for impedance shaping and vibration control. The effectiveness of ISD structures has been demonstrated by Shen et al. [24] in vehicle air suspension systems incorporating frequency-varying negative stiffness, showing reductions in vibration response and suspension working space. To broaden the horizon of suspension design, researchers such as Ji et al. [20], Zhu et al. [21], Pirrotta et al. [25], Shen et al. [26], John and Wagg [27], and Li et al. [28] have introduced diverse physical realizations of the inerter, ranging from fluid-based and compliant mechanisms to ball-screw and rack-and-pinion variants. In heavy-vehicle and off-road applications, Liu et al. [29] experimentally demonstrated that inerter-based suspension topologies can effectively reduce dynamic tire loads and road damage.
With the development of mechatronic system theory, diverse modeling strategies have emerged, ranging from advanced physics-driven approaches by Liu et al. [30] to novel data-driven techniques by Chen et al. [31]. Parallel to these developments, electromechanical analogy theory has emerged as an effective framework for the modeling and optimization of complex mechanical vibration systems. Based on power equivalence and energy conservation principles, this theory establishes one-to-one mappings between mechanical and electrical domains, allowing mechanical systems to be equivalently represented as electrical networks. Within this framework, mechanical components stiffness, damping, and inerter elements correspond to specific electrical components such as inductors, capacitors, and resistors, enabling the direct application of mature electrical network synthesis theory, positive-realness criteria, and optimization techniques.
Under the electromechanical analogy framework, multi-element ISD suspension systems can be systematically described using standardized electrical network models, in which dynamic characteristics and parameter coupling relationships are explicitly characterized. Shen et al. [32] constructed fractional-order passive electrical networks using Oustaloup approximation, achieving effective reductions in body acceleration and suspension working space. Beyond quarter-vehicle configurations, electromechanical analogy has been extended to electromagnetic suspension systems by Liu et al. [33], full-vehicle ISD models by Li et al. [34], ISD seat–suspension coupled systems by Li et al. [28], Zhang et al. [35], Song et al. [36], and Li et al. [37], and air suspensions with auxiliary chambers by Xu et al. [38], demonstrating scalability to multi-degree-of-freedom systems.
Nevertheless, most existing ISD suspension studies based on electromechanical analogy theory remain limited to quarter-vehicle models, which cannot capture the dynamic coupling between front and rear suspensions induced by vehicle pitch motion. Half-vehicle models provide a more realistic representation of pitch–heave interaction and suspension coordination, and are therefore more relevant to overall vehicle dynamics. Although extensions of electromechanical analogy theory and positive-real network synthesis to multi-degree-of-freedom systems have been reported by Jiang and Smith [39], systematic modeling procedures and parameter optimization strategies for half-vehicle ISD suspensions remain insufficiently explored. Therefore, it is necessary to develop an accurate modeling method and an effective parameter optimization strategy for the half-vehicle ISD suspension to improve its performance.
This paper is arranged as follows. Section 2 establishes the dynamic model of the half-vehicle mechatronic suspension and develops its equivalent electrical network using electromechanical analogy theory. Section 3 details the parameter optimization of the suspension system using the NSGA-II algorithm, incorporating positive-real constraints. Section 4 presents a comparative analysis of the systems’ dynamic responses and evaluates the sensitivity of performance indices to variation in electrical parameters (resistance, capacitance, and inductance) on the suspension performance indices is analyzed. Finally, Section 5 summarizes the conclusions.

2. Model of Suspension Dynamics

2.1. Modeling of Half-Vehicle Mechatronic Suspension Systems

To investigate the performance of electromechanical suspension in vibration suppression and pitch control, this paper establishes a half-car four-degree-of-freedom suspension model. As shown in Figure 1.
In Figure 1, z r f and z r r denote the vertical displacements caused by road roughness at the front and rear suspensions, respectively; z u f and z u r represent the vertical displacements of the front and rear wheels, respectively; z s f and z s r indicate the vertical displacements of the front and rear vehicle body, respectively; z s signifies the vertical displacements of the vehicle body at the front and rear axles; k t f and k t r are the equivalent stiffness of the front and rear tires, respectively; m u f and m u r denote the unsprung masses (wheel masses) of the front and rear suspensions, respectively; k f and k r represent the stiffness of the front and rear suspension springs, respectively; m s indicates the sprung mass (body mass); φ represents the pitch angle of the vehicle body around the y-axis; I y denotes the moment of inertia of the vehicle body around the y-axis; a and b are the distances from the center of mass to the front and rear axles, respectively; Ff and Fr represent the actuator forces of the front and rear suspensions of the vehicle; the red boxes represent the structures of the motor and the external electrical network.
The equation for the vertical motion of the sprung mass is:
m s z ¨ S + k f z s f z u f + F f + k r ( z s r z u r ) + F r = 0
The equation of motion for the pitching of the sprung mass is:
I y φ ¨ = a k f z s f z u f + F f b k r z s r z u r + F r
The equation for the vertical motion of the front unsprung mass is:
m u f z ¨ u f = k f z s f z u f + F f k t f z u f z r f
The equation for the vertical motion of the rear unsprung mass is:
m u r z ¨ u r = k r ( z s r z u r ) + F r k t r ( z u r z r r )
Assuming the pitch angle is sufficiently small, the following approximations are adopted:
z sf = z s a φ z s r = z s + b φ
The parameters of the vehicle model are presented in Table 1.

2.2. External Electrical Network Model

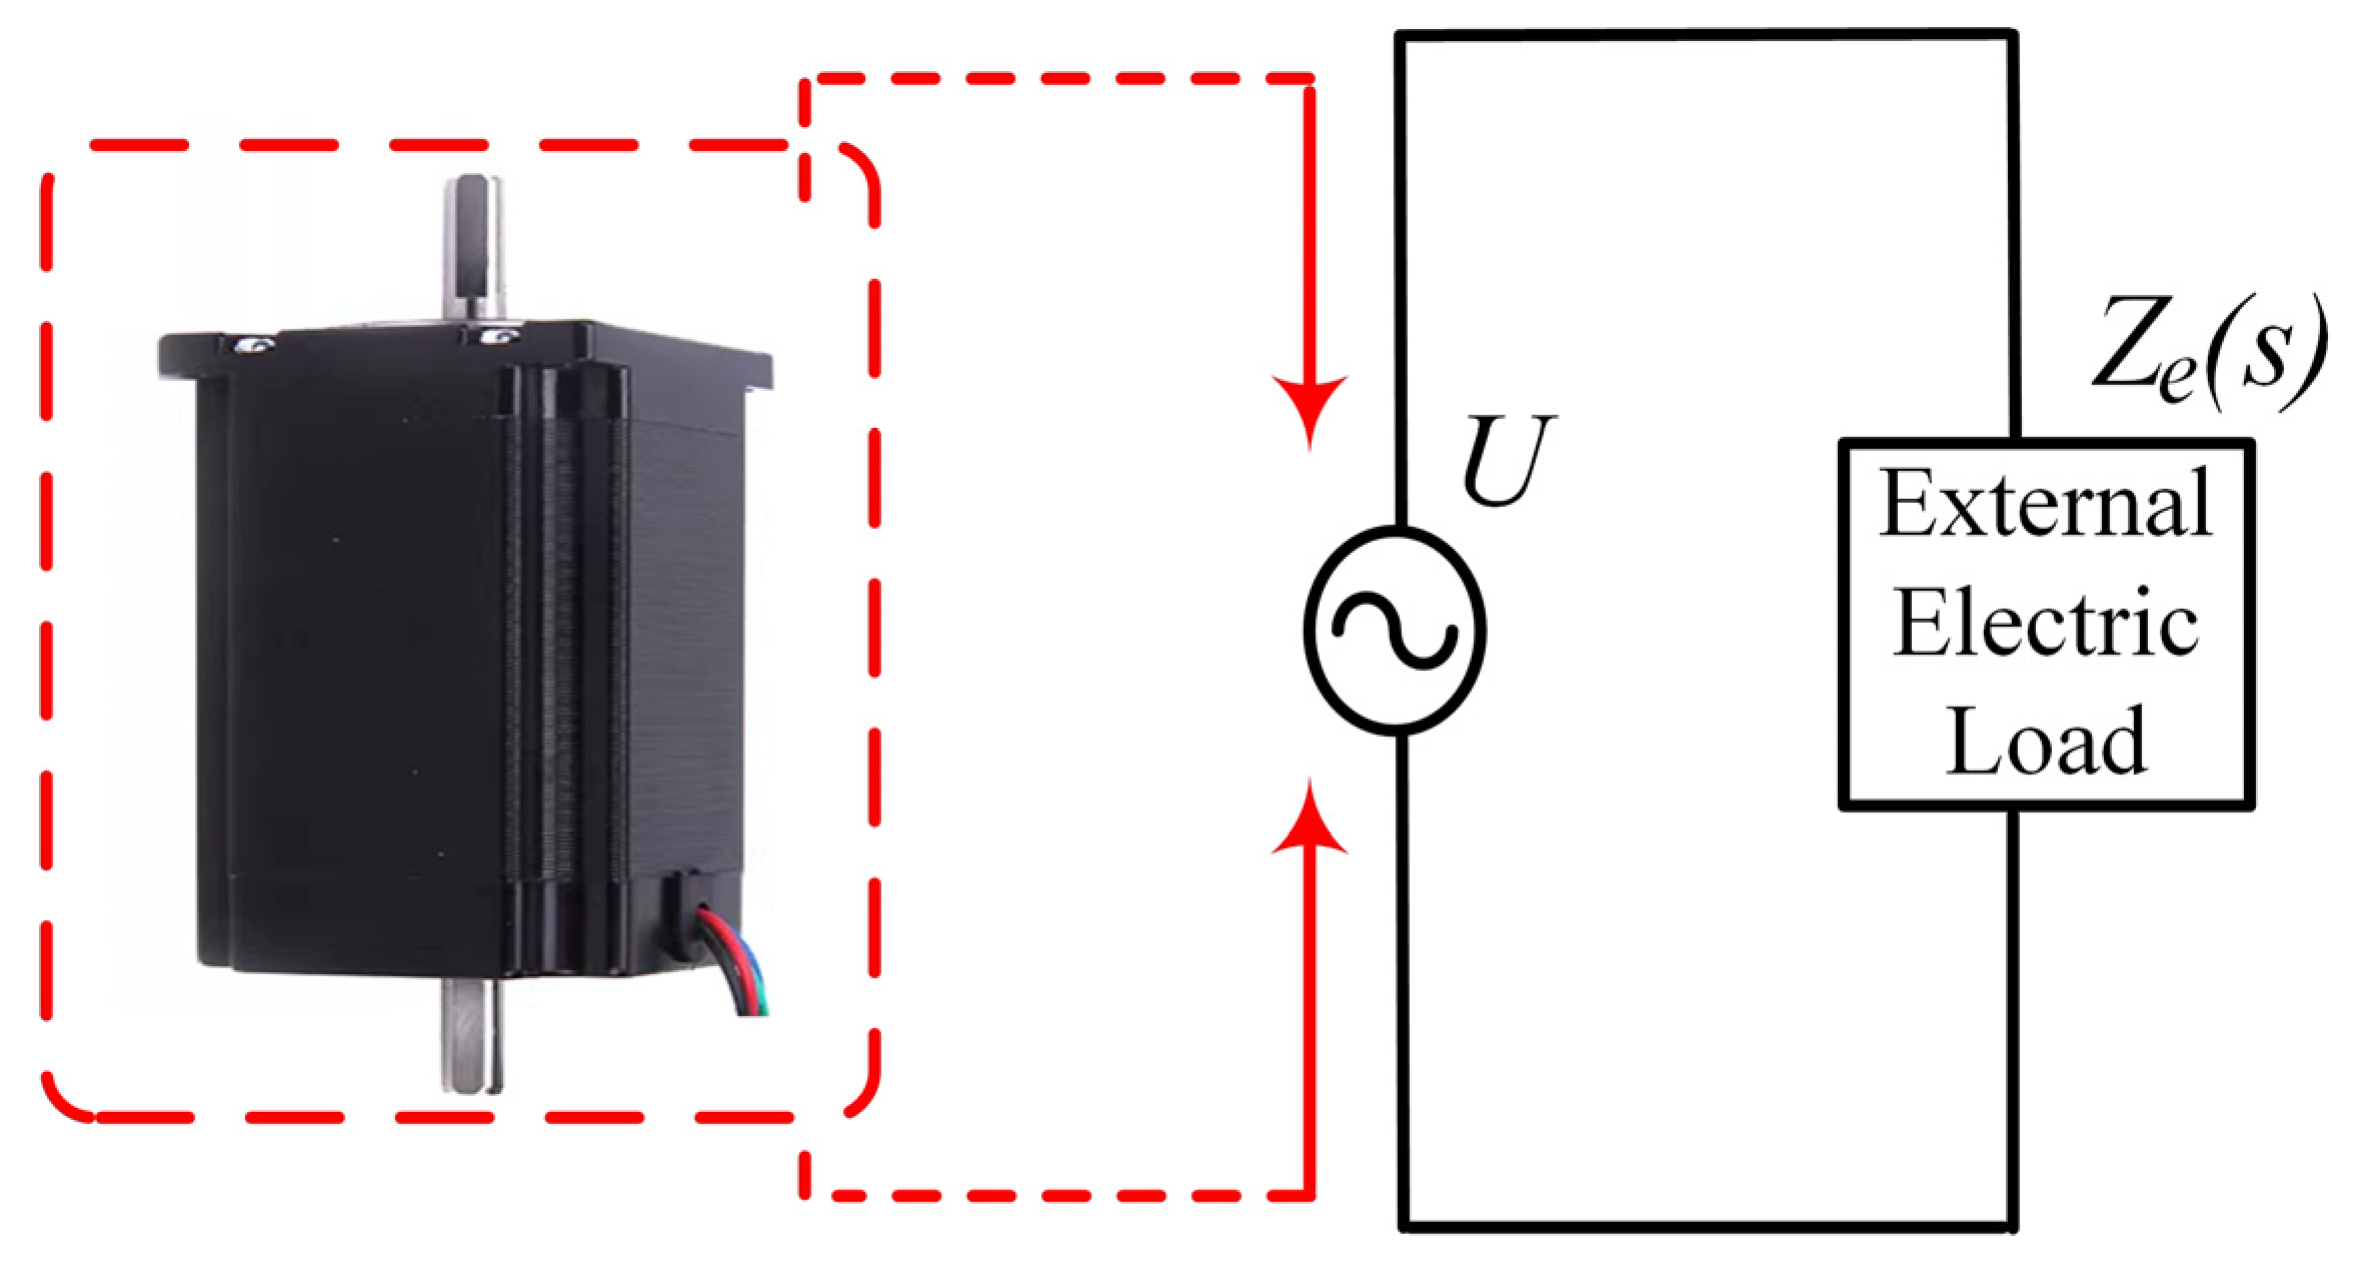
The structure of the suspension model, as illustrated in Figure 2, consists of a rotary electric machine and an external electrical network.
The device is integrated into the suspension system. Relative linear motion between the suspension terminals drives the electric machine’s rotor, inducing a voltage across the external electrical load. By modifying the configuration of the external electrical network, tunable impedance characteristics can be realized.
The output force of this device is given by:
F i = B ( s ) ( z ˙ s i z ˙ u i )
where Fi(i = f or r) represents the actuator force, and B(s) denotes the velocity-dependent equivalent mechanical impedance of the rotary electric machine, which can be expressed as:
B ( s ) = ( 2 π P ) k t k e Z e ( s )
In this equation, s denotes the Laplacian variable, and P signifies the lead of the ball screw, ke and kt are the back-EMF coefficient and the thrust coefficient of the motor, respectively. Ze(s) represents the impedance of the external circuit.
The impedance expression of the external circuit is as follows:
Z e ( s ) = A s 2 + B s + C D s 2 + E s + F
where the coefficients of the impedance model are denoted by A, B, C, D, E, and F.
This section explains the structure and operation of the proposed network. First, the mechatronic suspension uses a physically decentralized structure. The front and rear electrical networks work without a direct electrical connection. Therefore, the system reduces coupled pitch motion through global parameter optimization based on the half-vehicle model, not real-time signal exchange. This ensures the independent units work together effectively. In this network, the resistor R acts as the energy-dissipating element. It is similar to a mechanical damper and turns vibration energy into heat.
In the modeling framework, the rotary motor is treated as an ideal electromagnetic actuator. This allows us to focus on the impedance matching mechanism. The derivation does not include nonlinear factors like magnetic saturation, mechanical friction, and internal winding resistance. However, Section 4.3 carefully analyzes their effects, especially the effect of resistance. Also, to improve reliability, the system has a fail-safe design. If the control system fails, the circuit switches to a backup resistor or a short-circuit mode. This ensures the motor still provides electromagnetic damping force to keep the vehicle safe.

3. Parameter Optimization

3.1. Optimization Objectives and Variables

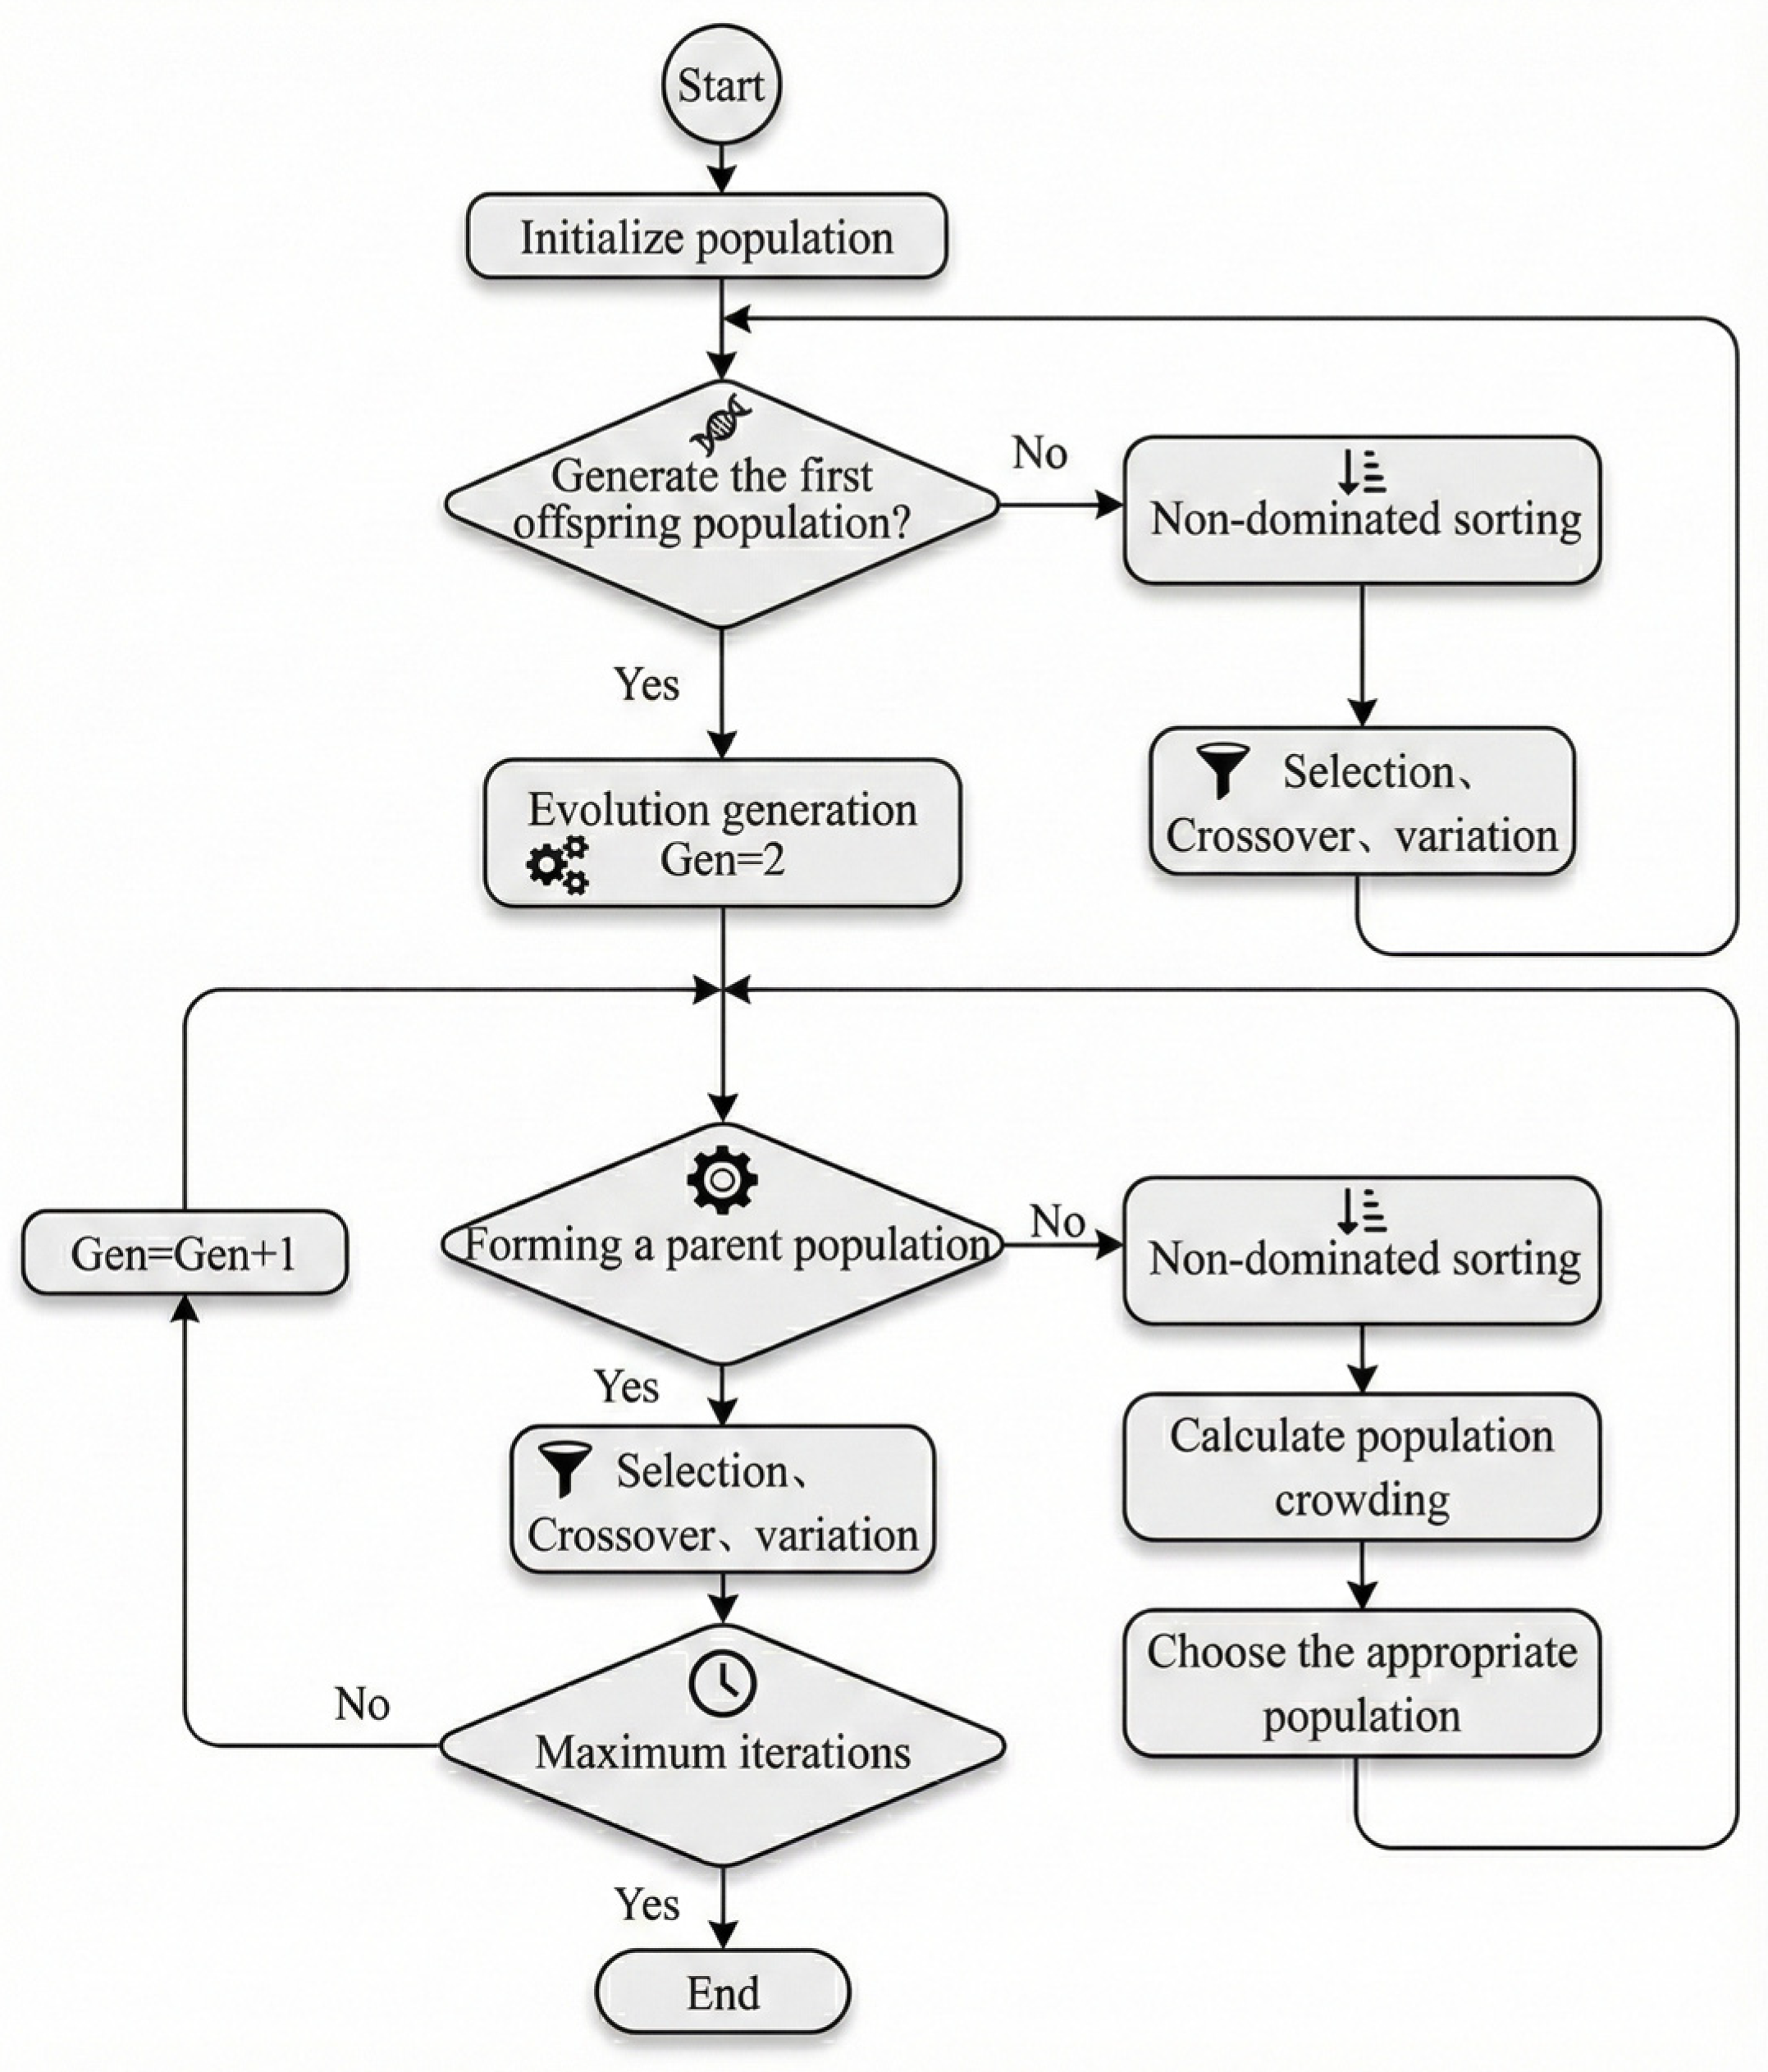
Recent research explores advanced strategies for system optimization and monitoring. These range from optimizing operating parameters using vibration analysis by Gao et al. [40] to applying Deep Reinforcement Learning (DRL) for dynamic task planning by Xie et al. [41] and identifying faults in vibrating components by Xu et al. [42]. While these approaches offer strong theoretical performance, they often require significant computational resources or complex model tuning. To address the computational inefficiency and lack of elitism inherent in the original NSGA, the NSGA-II method is adopted in this study. By incorporating a fast non-dominated sorting mechanism and an elitist strategy, this algorithm effectively reduces computational cost. Furthermore, a crowding distance comparison operator is introduced to ensure a diverse distribution of Pareto solutions by Gadhvi et al. [43], as illustrated in the workflow in Figure 3.
To comprehensively evaluate the performance of the half-vehicle mechatronic suspension, both ride comfort and road-holding capability must be considered. Unlike single-objective optimization, improving one performance index in a vehicle suspension often leads to the deterioration of another. Therefore, this study adopts the NSGA-II to solve the multi-objective optimization problem.
Based on the equivalent electrical network established in Section 2, the parameters of the external circuit directly determine the output force of the mechatronic suspension. Therefore, the resistance (R), capacitance (C), and inductance (L) are selected as the decision variables.
X = [ R ,   L ,   C ] T
For the half-vehicle model, suppressing both vertical vibration and pitch motion is critical. Consequently, the RMS values of the vehicle body vertical acceleration z ¨ s and pitch angular acceleration φ ¨ are selected as the two conflicting objective functions to be minimized simultaneously.
J 1 = R M S ( z ¨ s ) J 2 = R M S ( φ ¨ s )
Although Dynamic Tire Load (DTL) is a critical metric for road-holding, this study treats it as a hard constraint rather than a third optimization objective. This approach avoids the high computational cost and complexity of interpreting high-dimensional Pareto frontiers. Additionally, treating DTL as a constraint ensures the dynamic load never exceeds the static limit. This guarantees continuous tire-road contact and driving safety.

3.2. Constraints

This section outlines the constraints for the two optimization scenarios. The “Unconstrained” case minimizes vertical and pitch accelerations without strictly limiting suspension working space or dynamic tire load compared to the passive system. In contrast, the “Constrained” case enforces strict limits: suspension working space and dynamic tire load must not exceed the passive suspension’s values. This comparison highlights the trade-off between ride comfort and road holding. It demonstrates how the proposed method improves overall performance under strict engineering constraints.
To ensure the physical realizability of the suspension and driving safety, the optimization is subject to several constraints. The suspension working space (SWS) must not exceed its mechanical limits to prevent mechanical impact. Additionally, the dynamic tire load (DTL) must be less than the static load to ensure continuous tire-road contact.
R M S ( S W S f , r ) S m a x R M S ( D T L f , r ) F s t a t
A key contribution of this study is considering the physical realizability of the electrical network. To ensure that the optimized parameters can be implemented using passive components without an active energy source, the parameters must satisfy the positive-real condition:
R > 0 , L > 0 , C > 0
The parameter settings for the NSGA-II algorithm are listed in Table 2.
The NSGA-II optimization yields a Pareto front representing the trade-off between vehicle body vertical acceleration (J1) and pitch angular acceleration (J2). Because the Pareto front consists of multiple non-dominated solutions, a single parameter set must be selected for implementation. To ensure balanced performance, this study employs a distance-based approach to identify the “knee point” on the Pareto front. This solution represents the optimal compromise between ride comfort and pitch control performance.
The optimization was conducted with the vehicle traveling at a constant speed of 20 m/s in a straight line on a Class C random road surface. The external electrical network was optimized, and the results after multiple iterations are listed in Table 3. Under unconstrained conditions, the impedance transfer functions Z u n c ( s ) and F i 1 are given by:
Z u n c ( s ) = 666,557,950 s 2 + 6,707,423,125 s 1,157,500 s 2 + 5,758,600 s + 57,947,500
F i 1 = ( 2 π P ) k t k e Z u n c ( s ) ( z ˙ s i z ˙ u i ) ω
Subsequently, the system was re-optimized subject to the proposed constraints, while maintaining the same operating conditions (constant speed of 20 m/s on a Class C random road surface). The results of this constrained optimization are also listed in Table 3. Under constrained conditions, the impedance transfer functions Z c o n s ( s ) and F i 2 are:
Z c o n s ( s ) = 1,462,516,433 s 2 + 10,536,883,602 s 1,561,700 s 2 + 9,364,900 s + 67,470,600
F i 2 = ( 2 π P ) k t k e Z c o n s ( s ) ( z ˙ s i z ˙ u i )
Based on network synthesis theory, realizing a biquadratic impedance function requires up to nine elements in a series-parallel topology. However, for practical engineering implementation, minimizing the component count is desirable. Therefore, adhering to the principle of minimal realization, the conditions for the simplest circuit structure are verified.
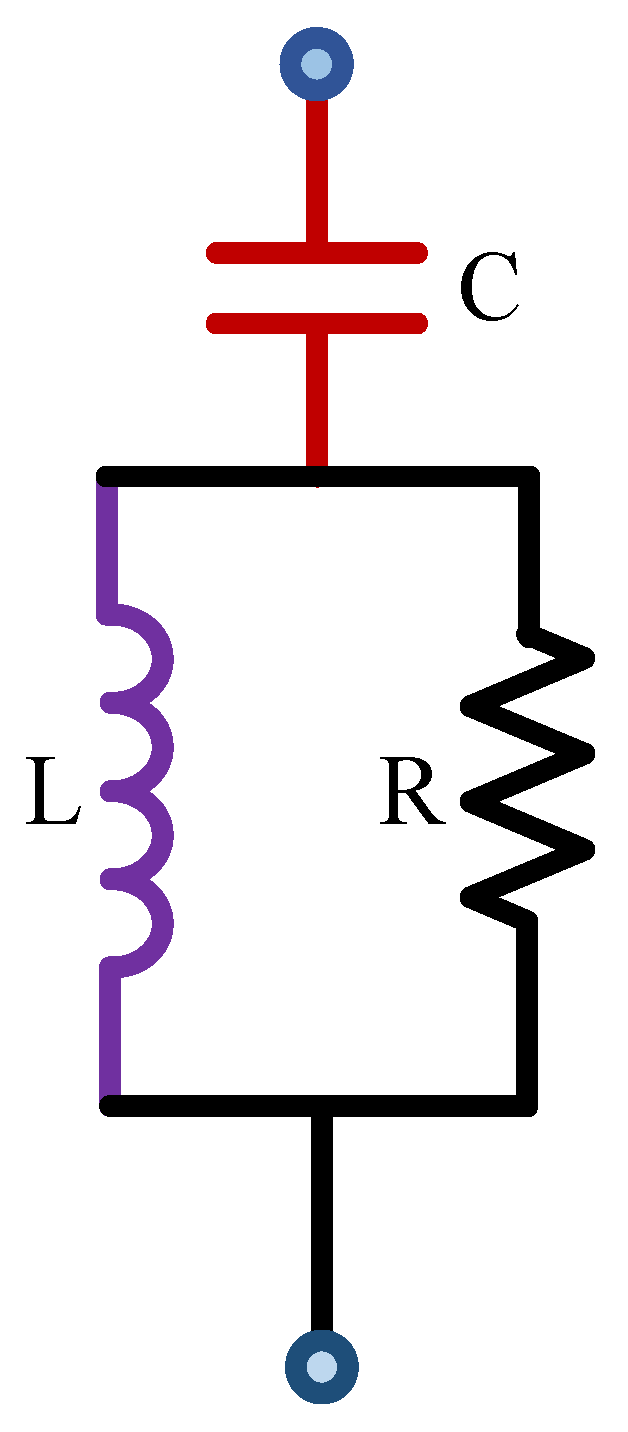
According to Equations (13)–(16), the optimized impedance transfer function satisfies the realizability conditions and can be passively implemented using only three components in a series-parallel configuration. The structure of the optimized electrical network is shown in Figure 4, where L, R, and C represent the inductor, resistor, and capacitor, respectively.
The optimized electrical parameters corresponding to the selected solution are listed in Table 4.

4. Discussion

4.1. Random Road Input

For the optimization process, a Class C road profile is adopted as the excitation source, with the vehicle maintaining a constant velocity of u = 20 m/s. The mathematical model for the road roughness input is given by:
z ˙ r ( t ) = 0.111 [ u z r ( t ) + 40 G q ( n 0 ) u w ( t ) ]
In this equation, zr(t) signifies the vertical displacement induced by road irregularities. The term w(t) represents a Gaussian white noise signal, while the road roughness coefficient is set to Gq(n0) = 2.56 × 10⁻⁴ m3.

4.2. Dynamic Performance Analysis

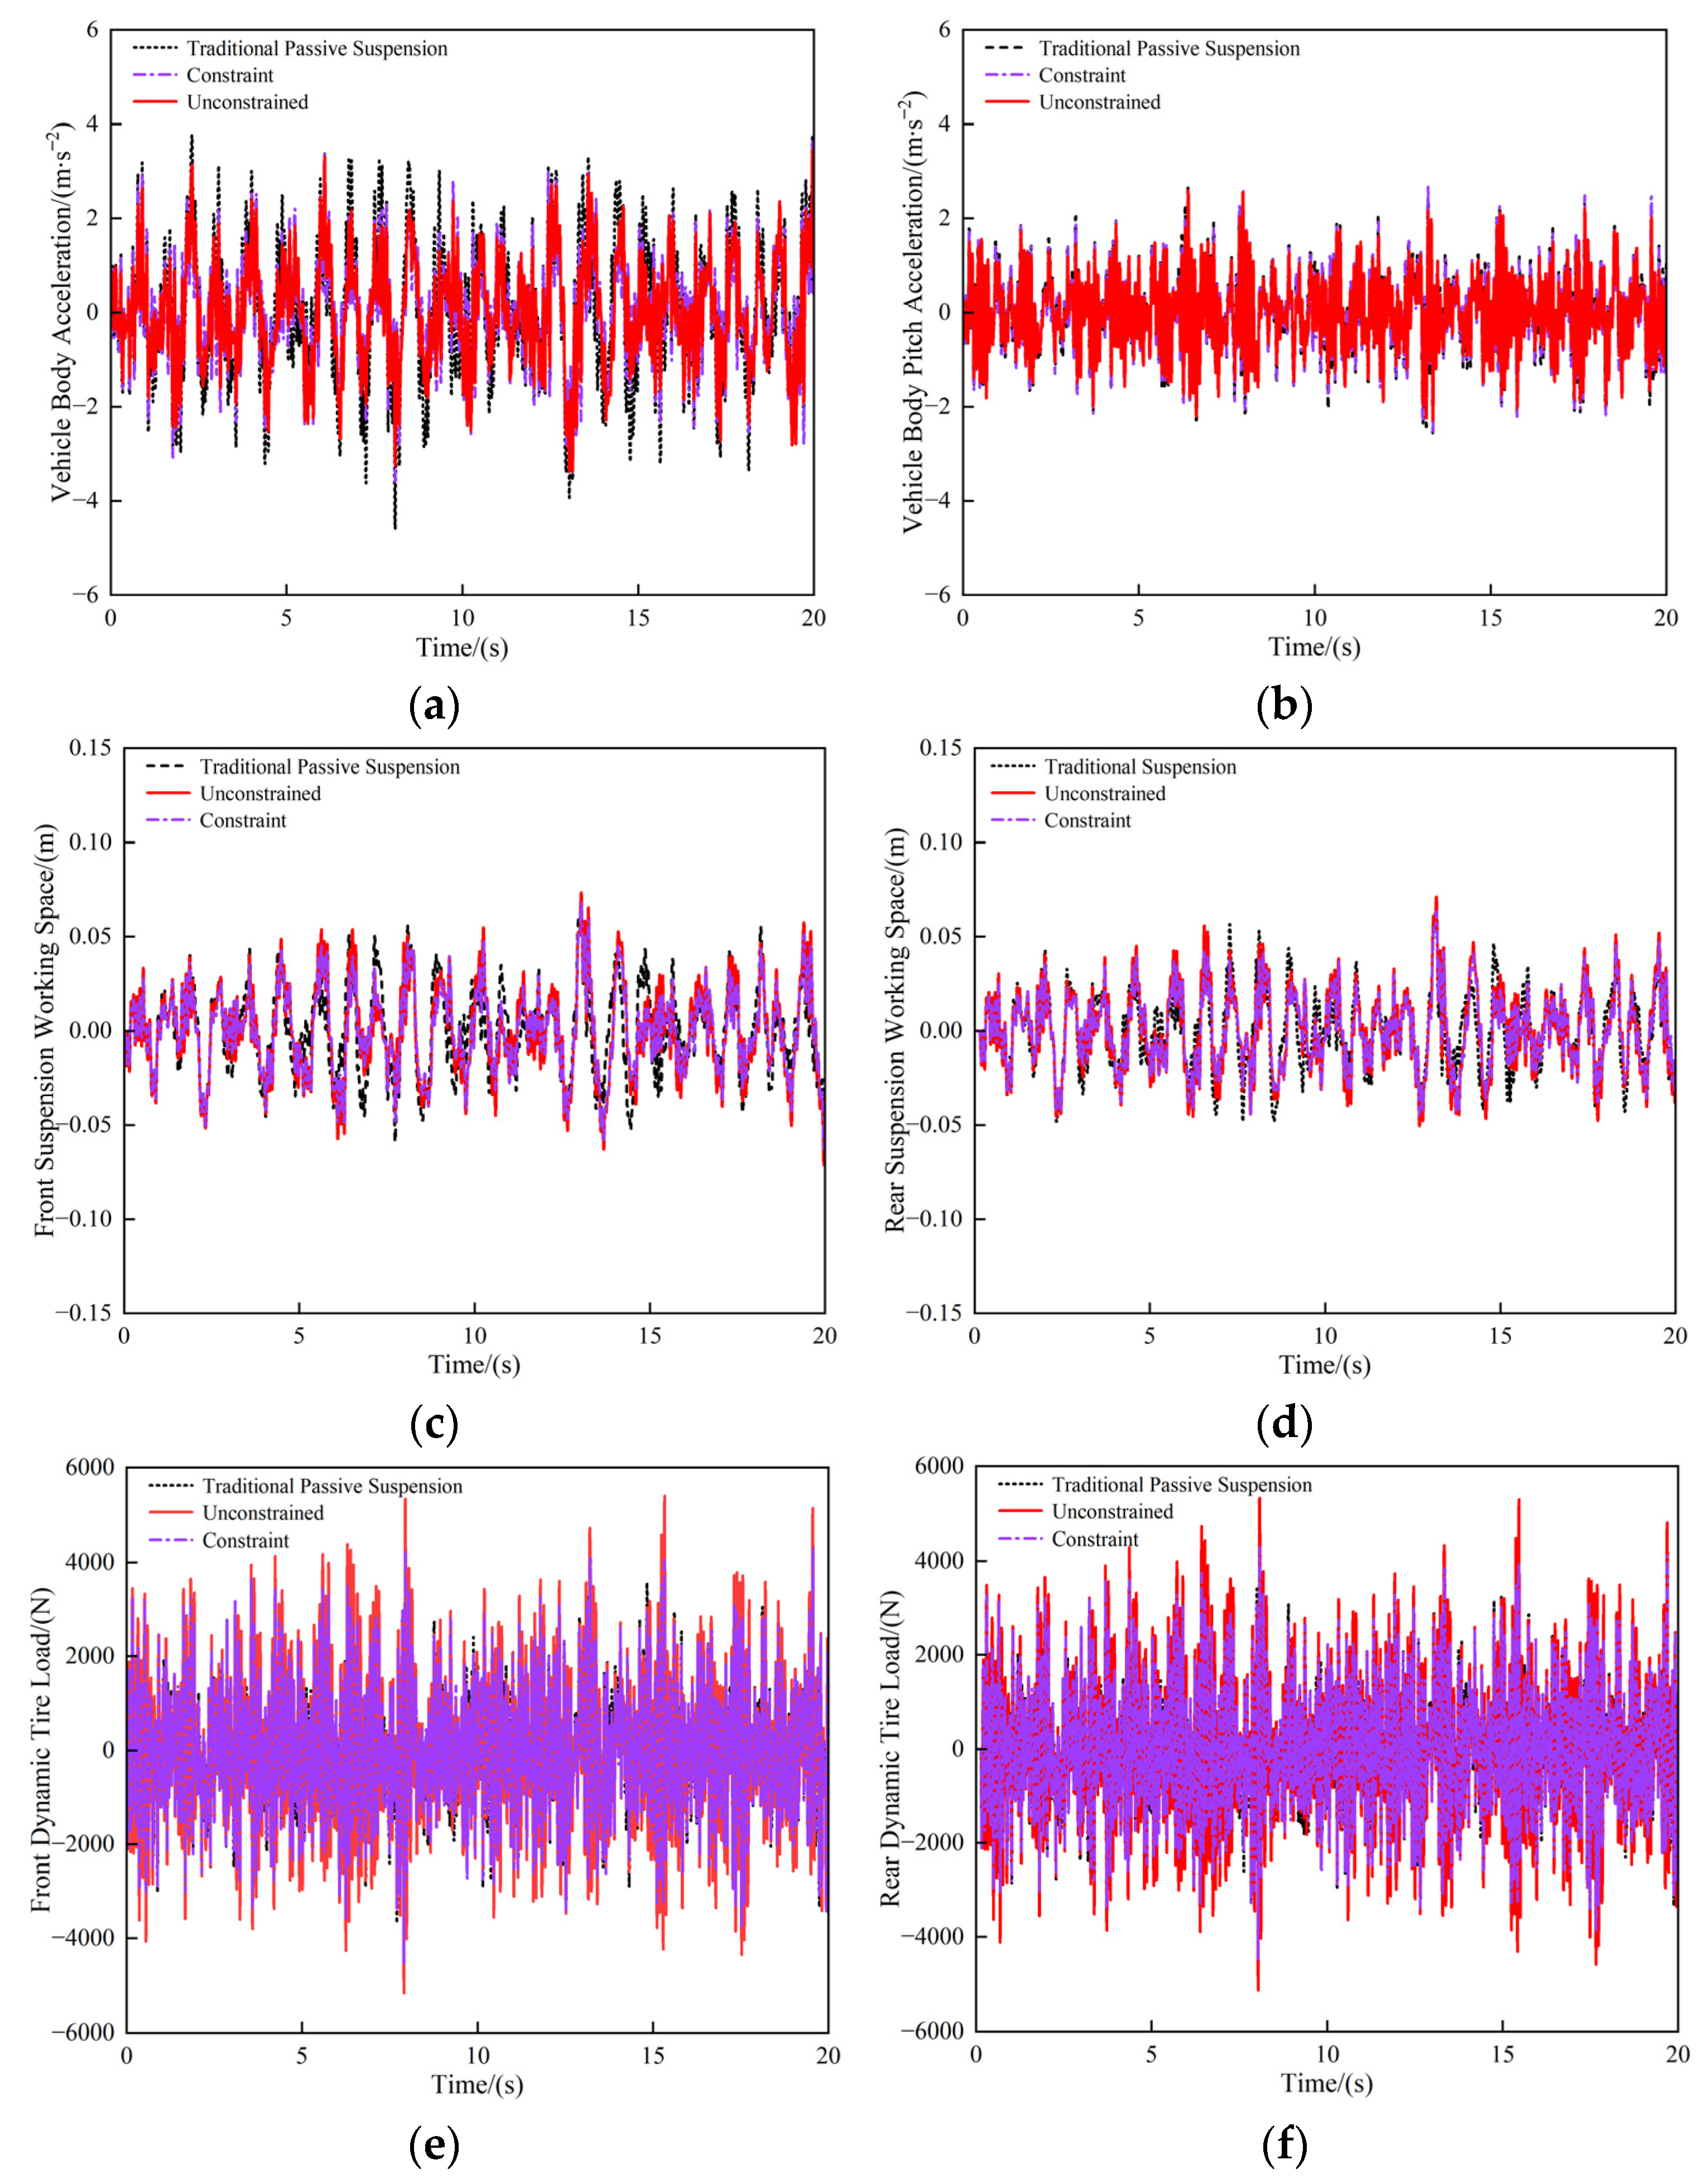
To verify the effectiveness of NSGA-II in suspension parameter optimization, a simulation model was established in the MATLAB/Simulink R2022b environment. The road excitation was generated based on the ISO 8608 Class C random road profile by Foo and Tan [44]. The vehicle speed was set to 20 m/s, and the simulation duration was 10 s. A vehicle speed of 20 m/s is selected as the test condition. On a Class C road, this speed excites the vehicle’s primary resonant modes (body bounce and wheel hop). This provides a strong baseline for evaluating the system’s performance and robustness. Figure 5 presents the time-domain response comparisons of the conventional passive suspension, the constrained mechatronic suspension, and the unconstrained mechatronic suspension.
To quantitatively evaluate the optimization performance, the RMS metrics including vertical body acceleration, pitch angular acceleration, suspension working space, and dynamic tire load were calculated for each suspension configuration. The corresponding results are summarized in Table 5.
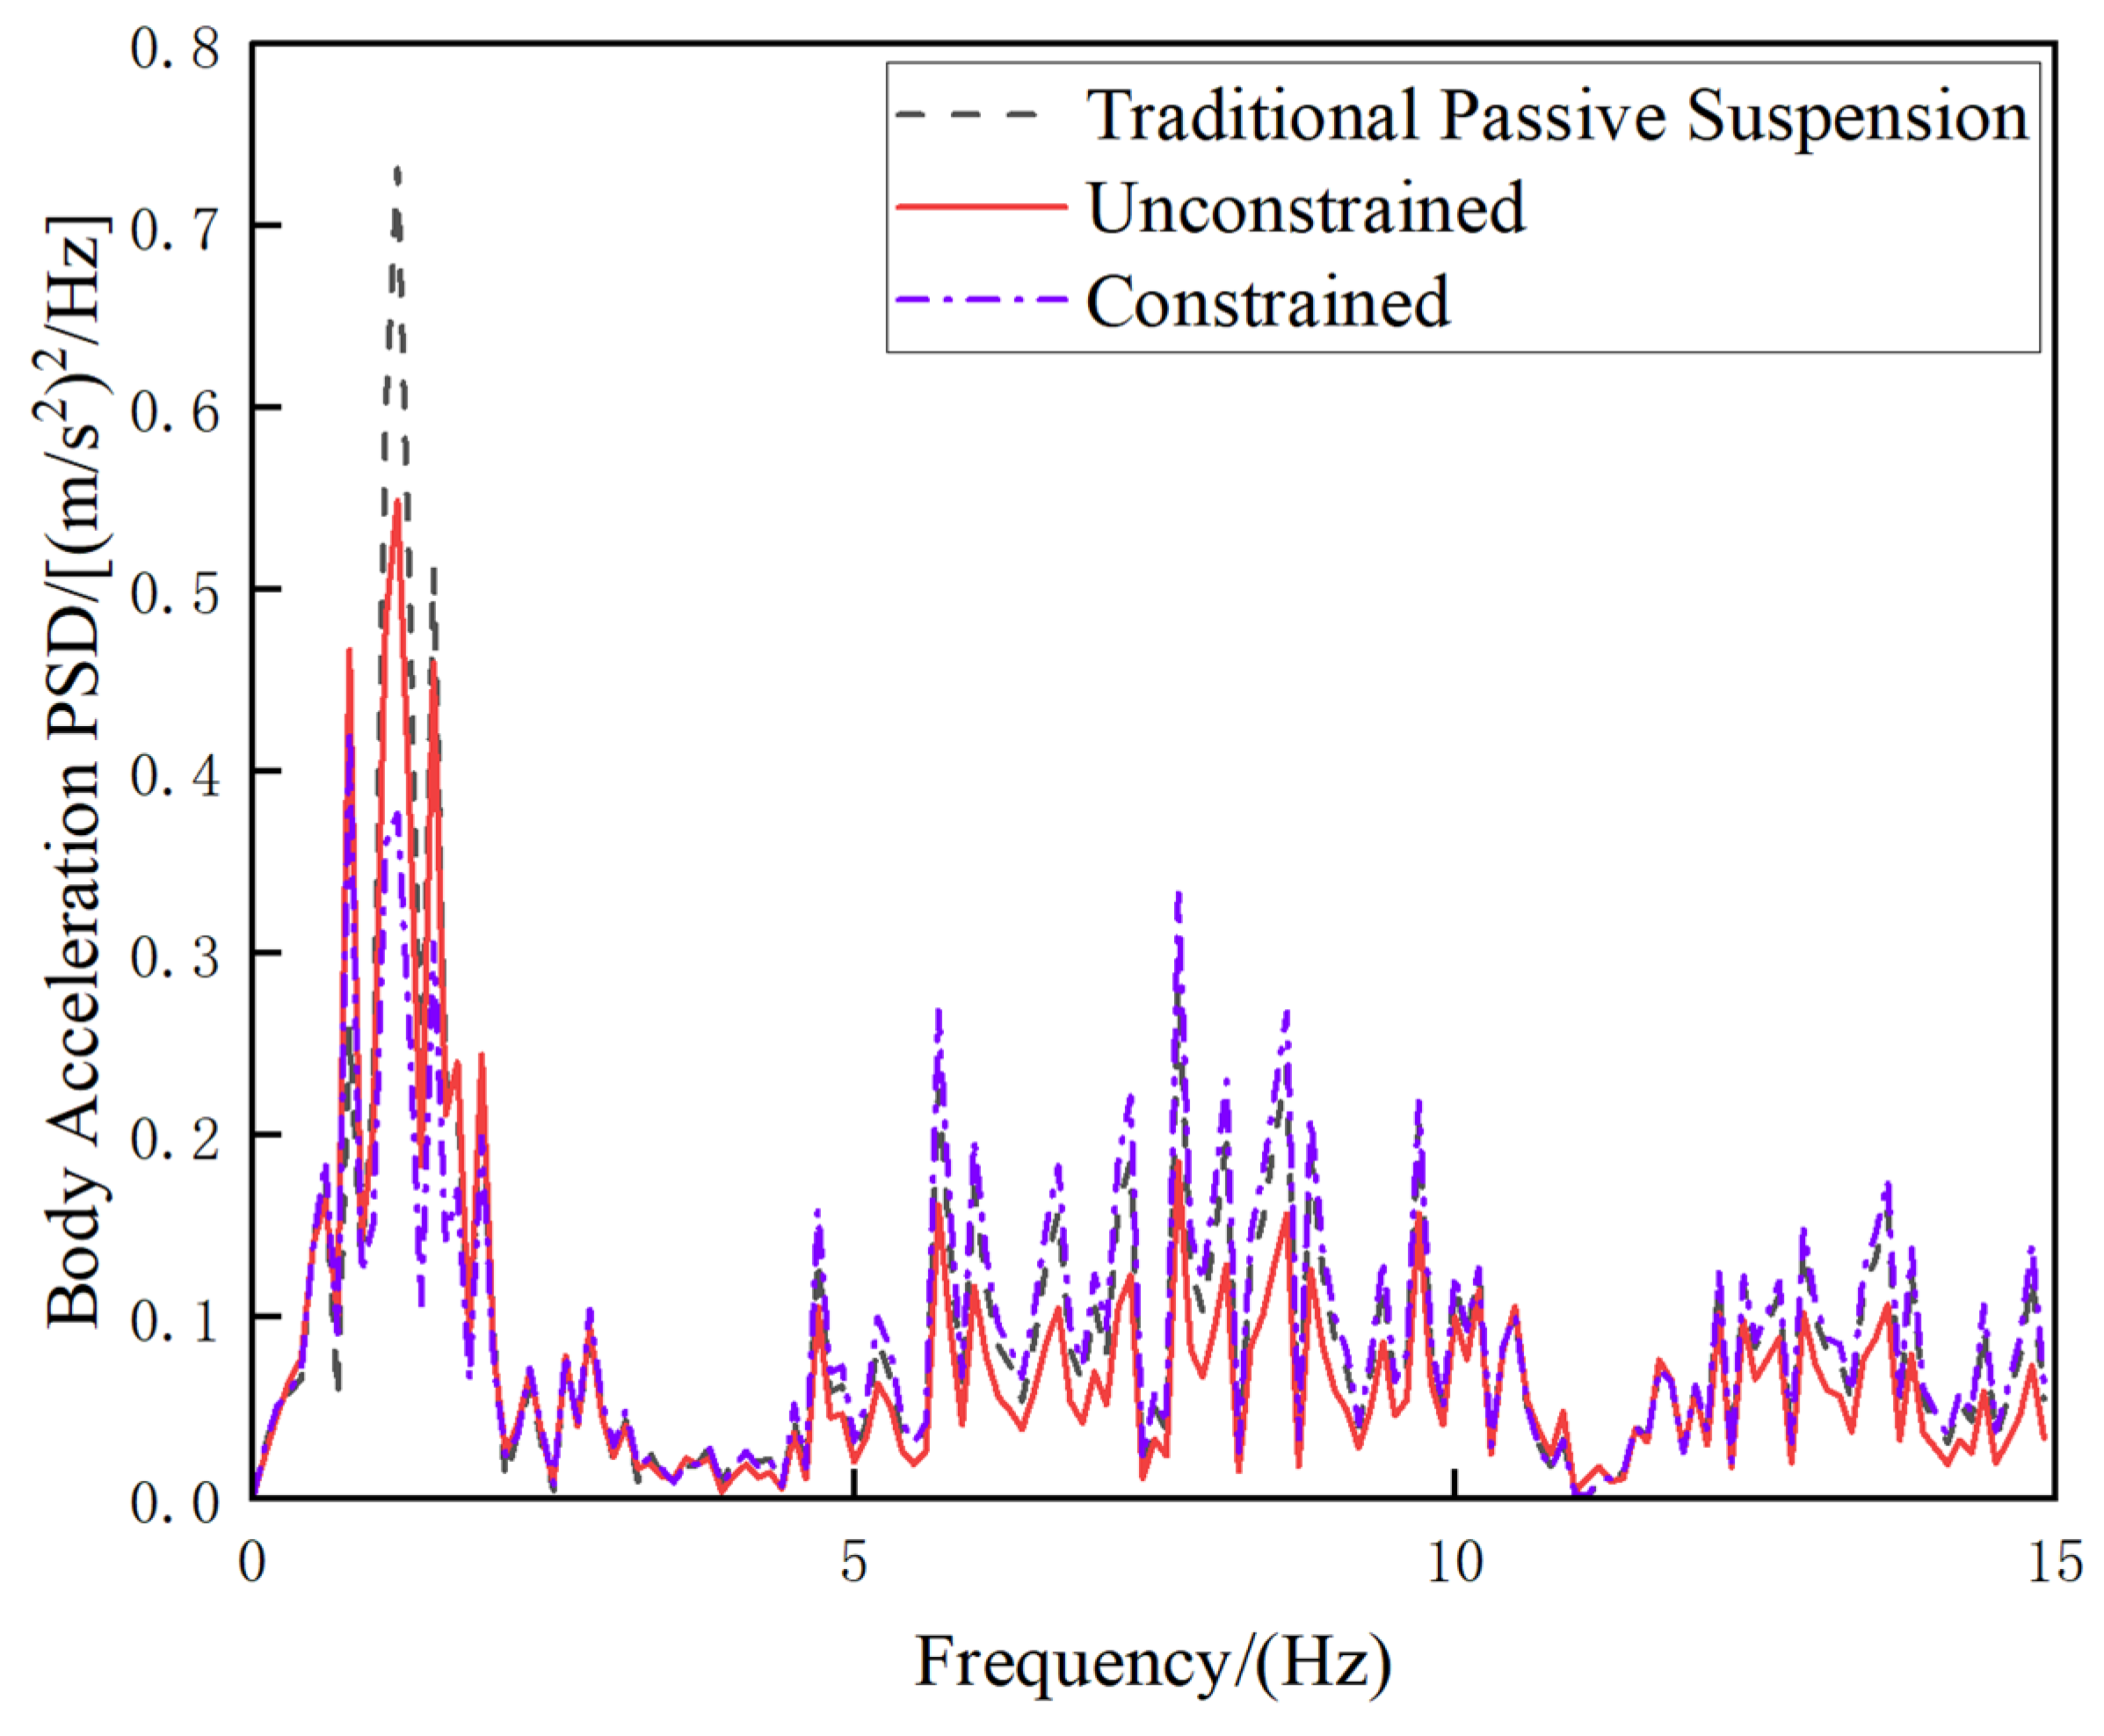
To further evaluate the vibration isolation performance in the frequency domain, the Power Spectral Density (PSD) of the body vertical acceleration was computed for the representative operating condition. Figure 6 presents the comparison between the traditional passive suspension and the proposed mechatronic suspension under both Unconstrained and Constrained optimization scenarios.
As shown in Figure 5 and Table 5, under identical random road excitation, the optimized mechatronic suspension systems exhibit reduced body acceleration and pitch angular acceleration compared to the passive system, regardless of whether constraints are imposed.
Compared to the conventional passive suspension, the unconstrained mechatronic suspension achieves reductions of 20.49% in the RMS value of body acceleration and 7.11% in pitch angular acceleration. However, this improvement comes at the cost of increased suspension working space and dynamic tire load, with RMS values rising by 2.76% and 19.18%, respectively.
In contrast, the constrained mechatronic suspension demonstrates comprehensive performance improvements across all evaluation indices. To be precise, the system lowers the RMS body acceleration by 19.54%, while simultaneously achieving a 2.22% drop in pitch angular acceleration. Furthermore, a reduction of 8.29% was observed in the suspension working space RMS, alongside a 1.26% decrease in the dynamic tire load. These results indicate that introducing appropriate constraints effectively balances the trade-off between ride comfort and road-holding performance.
As shown in Figure 6, the passive suspension exhibits a prominent resonance peak at approximately 1.5 Hz, corresponding to the vehicle body’s natural frequency. In contrast, both the Unconstrained and Constrained optimization strategies markedly suppress this peak, indicating a substantial reduction in vibration energy transmission. Specifically, the Unconstrained case achieves the lowest spectral density amplitude across the low-frequency range. Although the Constrained case exhibits slightly higher magnitude due to strict constraints on working space and dynamic tire load, it maintains a significant advantage over the passive system. This analysis confirms that the proposed method effectively attenuates vibrations in critical frequency bands, consistent with the time-domain results.
Although a speed of 20 m/s provides a strong baseline for testing the main resonant modes, suspension performance naturally changes with vehicle speed. Different speeds change the road excitation frequencies, which tests the adaptability of the optimized parameters. To fully test the robustness of the proposed mechatronic suspensions, extra simulations were run at 15 m/s and 25 m/s on the same Class C random road. Table 6 shows the vertical and pitch performance results at these different speeds.
As shown in Table 6, both optimized mechatronic suspensions achieve lower RMS values than the traditional passive suspension. Specifically, the reduction in pitch angular acceleration RMS is relatively small. At speeds of 15 m/s, 20 m/s, and 25 m/s, the constrained mechatronic suspension reduces the pitch acceleration RMS by 6.27%, 2.22%, and 2.00%, respectively, while the unconstrained mechatronic suspension reduces it by 16.43%, 7.11%, and 12.25%. For the vertical body acceleration RMS, the constrained mechatronic suspension achieves reductions of 16.67%, 19.53%, and 16.54% at 15 m/s, 20 m/s, and 25 m/s, respectively. Meanwhile, the unconstrained mechatronic suspension reduces it by 14.54%, 20.49%, and 16.23%. Overall, both mechatronic suspensions effectively improve vehicle performance across different speeds compared to the passive suspension, demonstrating strong robustness.
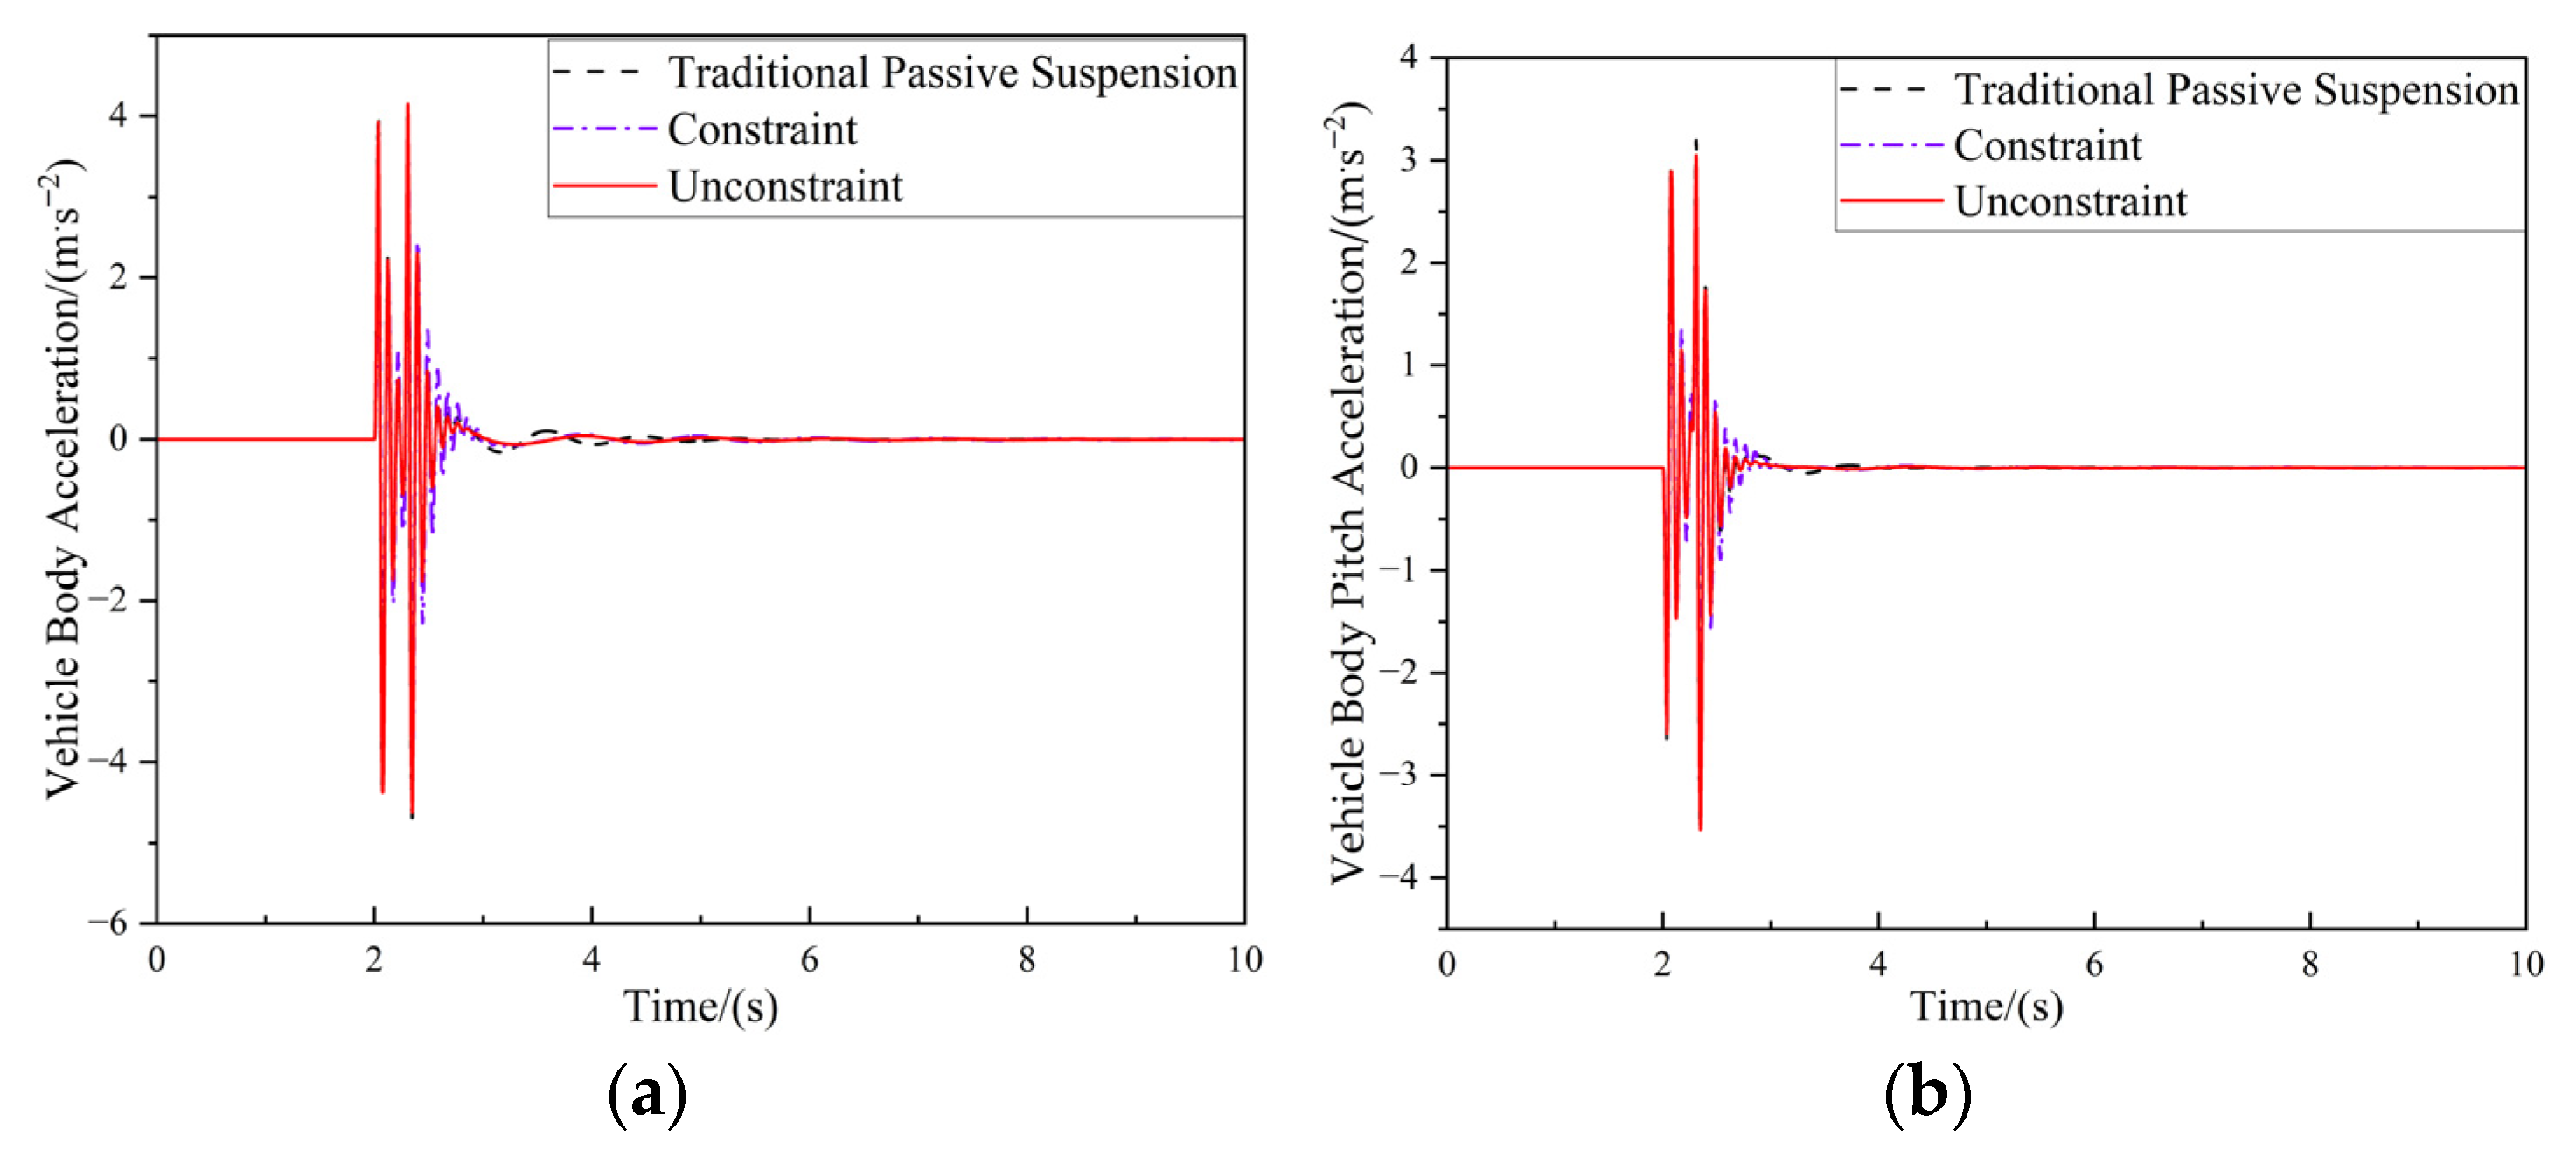
To evaluate the shock absorption of the proposed suspension under high-intensity impacts, a discrete bump test is used. While a random road profile provides a steady-state test, a discrete bump tests the transient limits of the system. In this simulation, the vehicle travels over a standard speed bump (0.1 m high and 5 m long) at a constant speed of 10 m/s.
Figure 7 shows the time-domain responses of the vehicle passing over the bump under passive, unconstrained, and constrained conditions. Compared to the passive suspension, the unconstrained and constrained mechatronic suspensions reduce the peak-to-peak vertical acceleration by 10.79% and 0.88%, respectively. Similarly, they reduce the peak-to-peak pitch angular acceleration by 27.73% and 2.85%, respectively. Although the unconstrained case reduces the accelerations the most, it exceeds the safety limits for dynamic tire load and suspension working space during the impact. In contrast, the constrained mechatronic suspension effectively handles the transient shocks while keeping the suspension travel and tire load strictly within safe limits. This confirms that the optimized system offers excellent robustness.

4.3. Influence of Component Parameters on Dynamic Suspension Performance

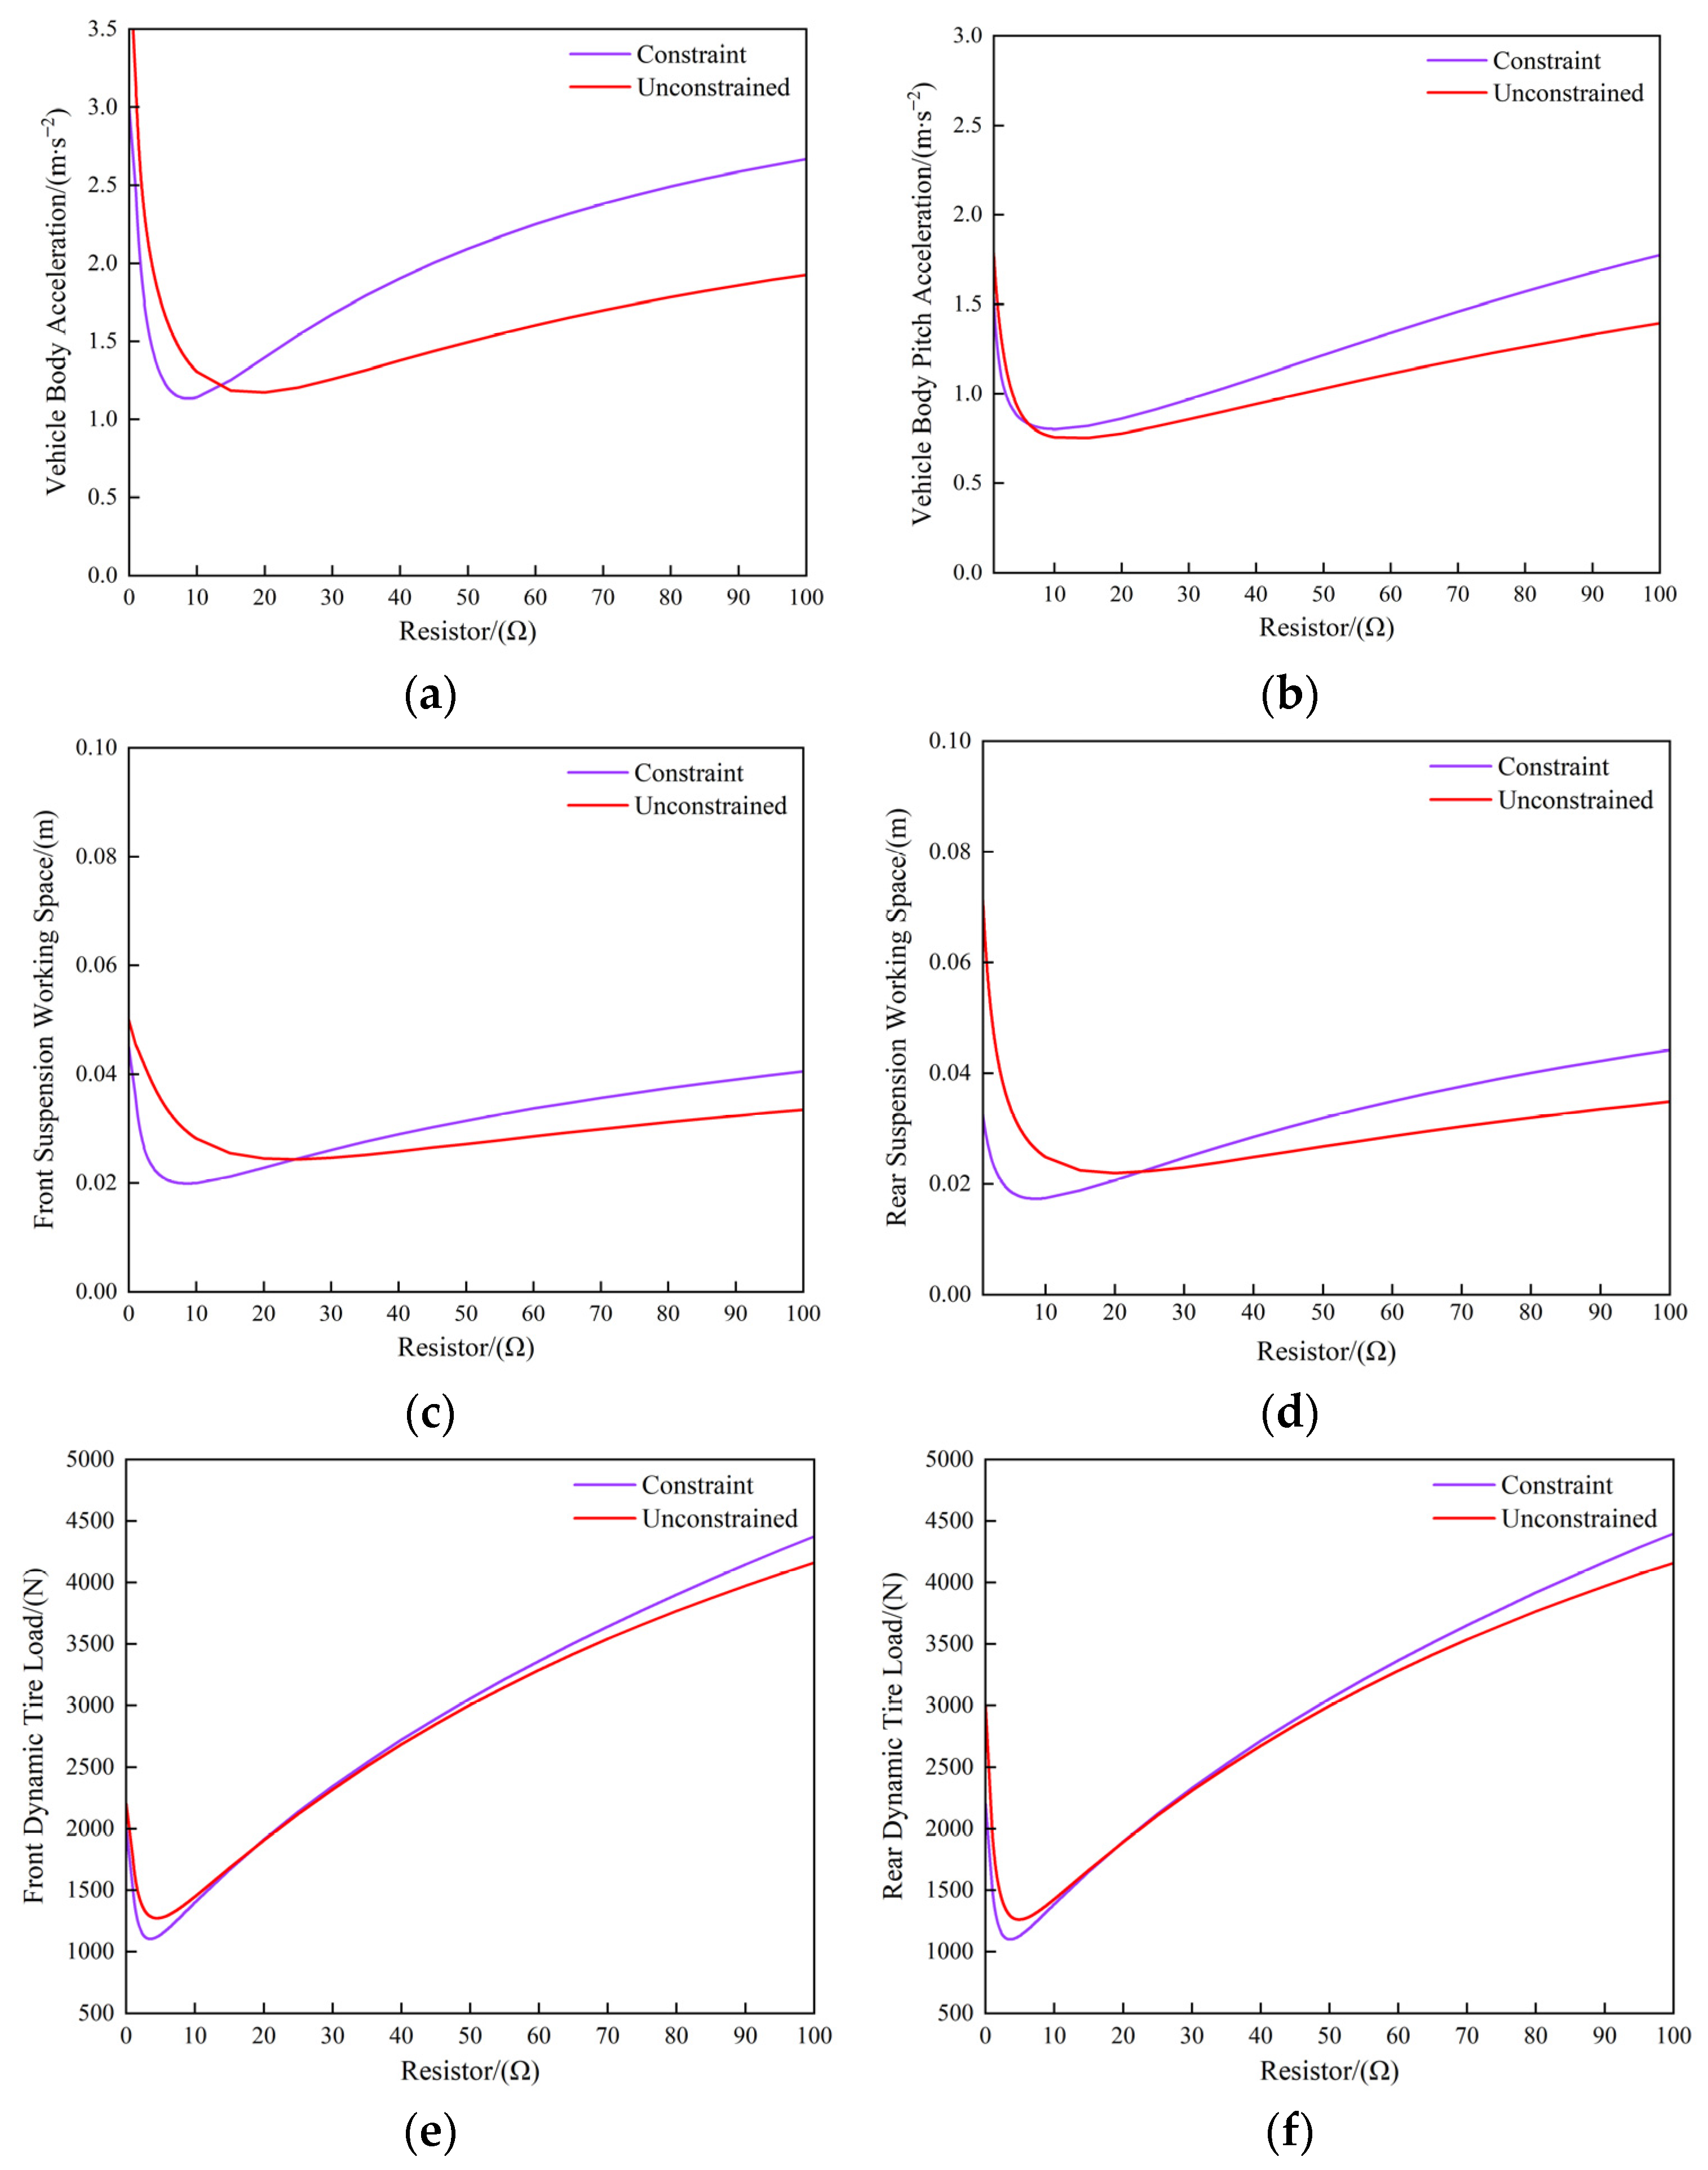
Using the optimal electrical settings from Table 4 as a baseline, a sensitivity analysis was conducted by adjusting the resistance R within the 0–100 Ω range, keeping other variables unchanged. The impact of these resistance variations on the six performance indicators is plotted in Figure 8.
As shown in Figure 8, all six performance indices are highly sensitive to changes in resistance R. When R is within the range of 0–10 Ω, all indices decrease rapidly. As R increases further to the range of 10–100 Ω, the performance indices gradually increase. Moreover, compared to the unconstrained mechatronic suspension, the constrained configuration exhibits more pronounced sensitivity to resistance variations, particularly regarding the RMS value of body acceleration.
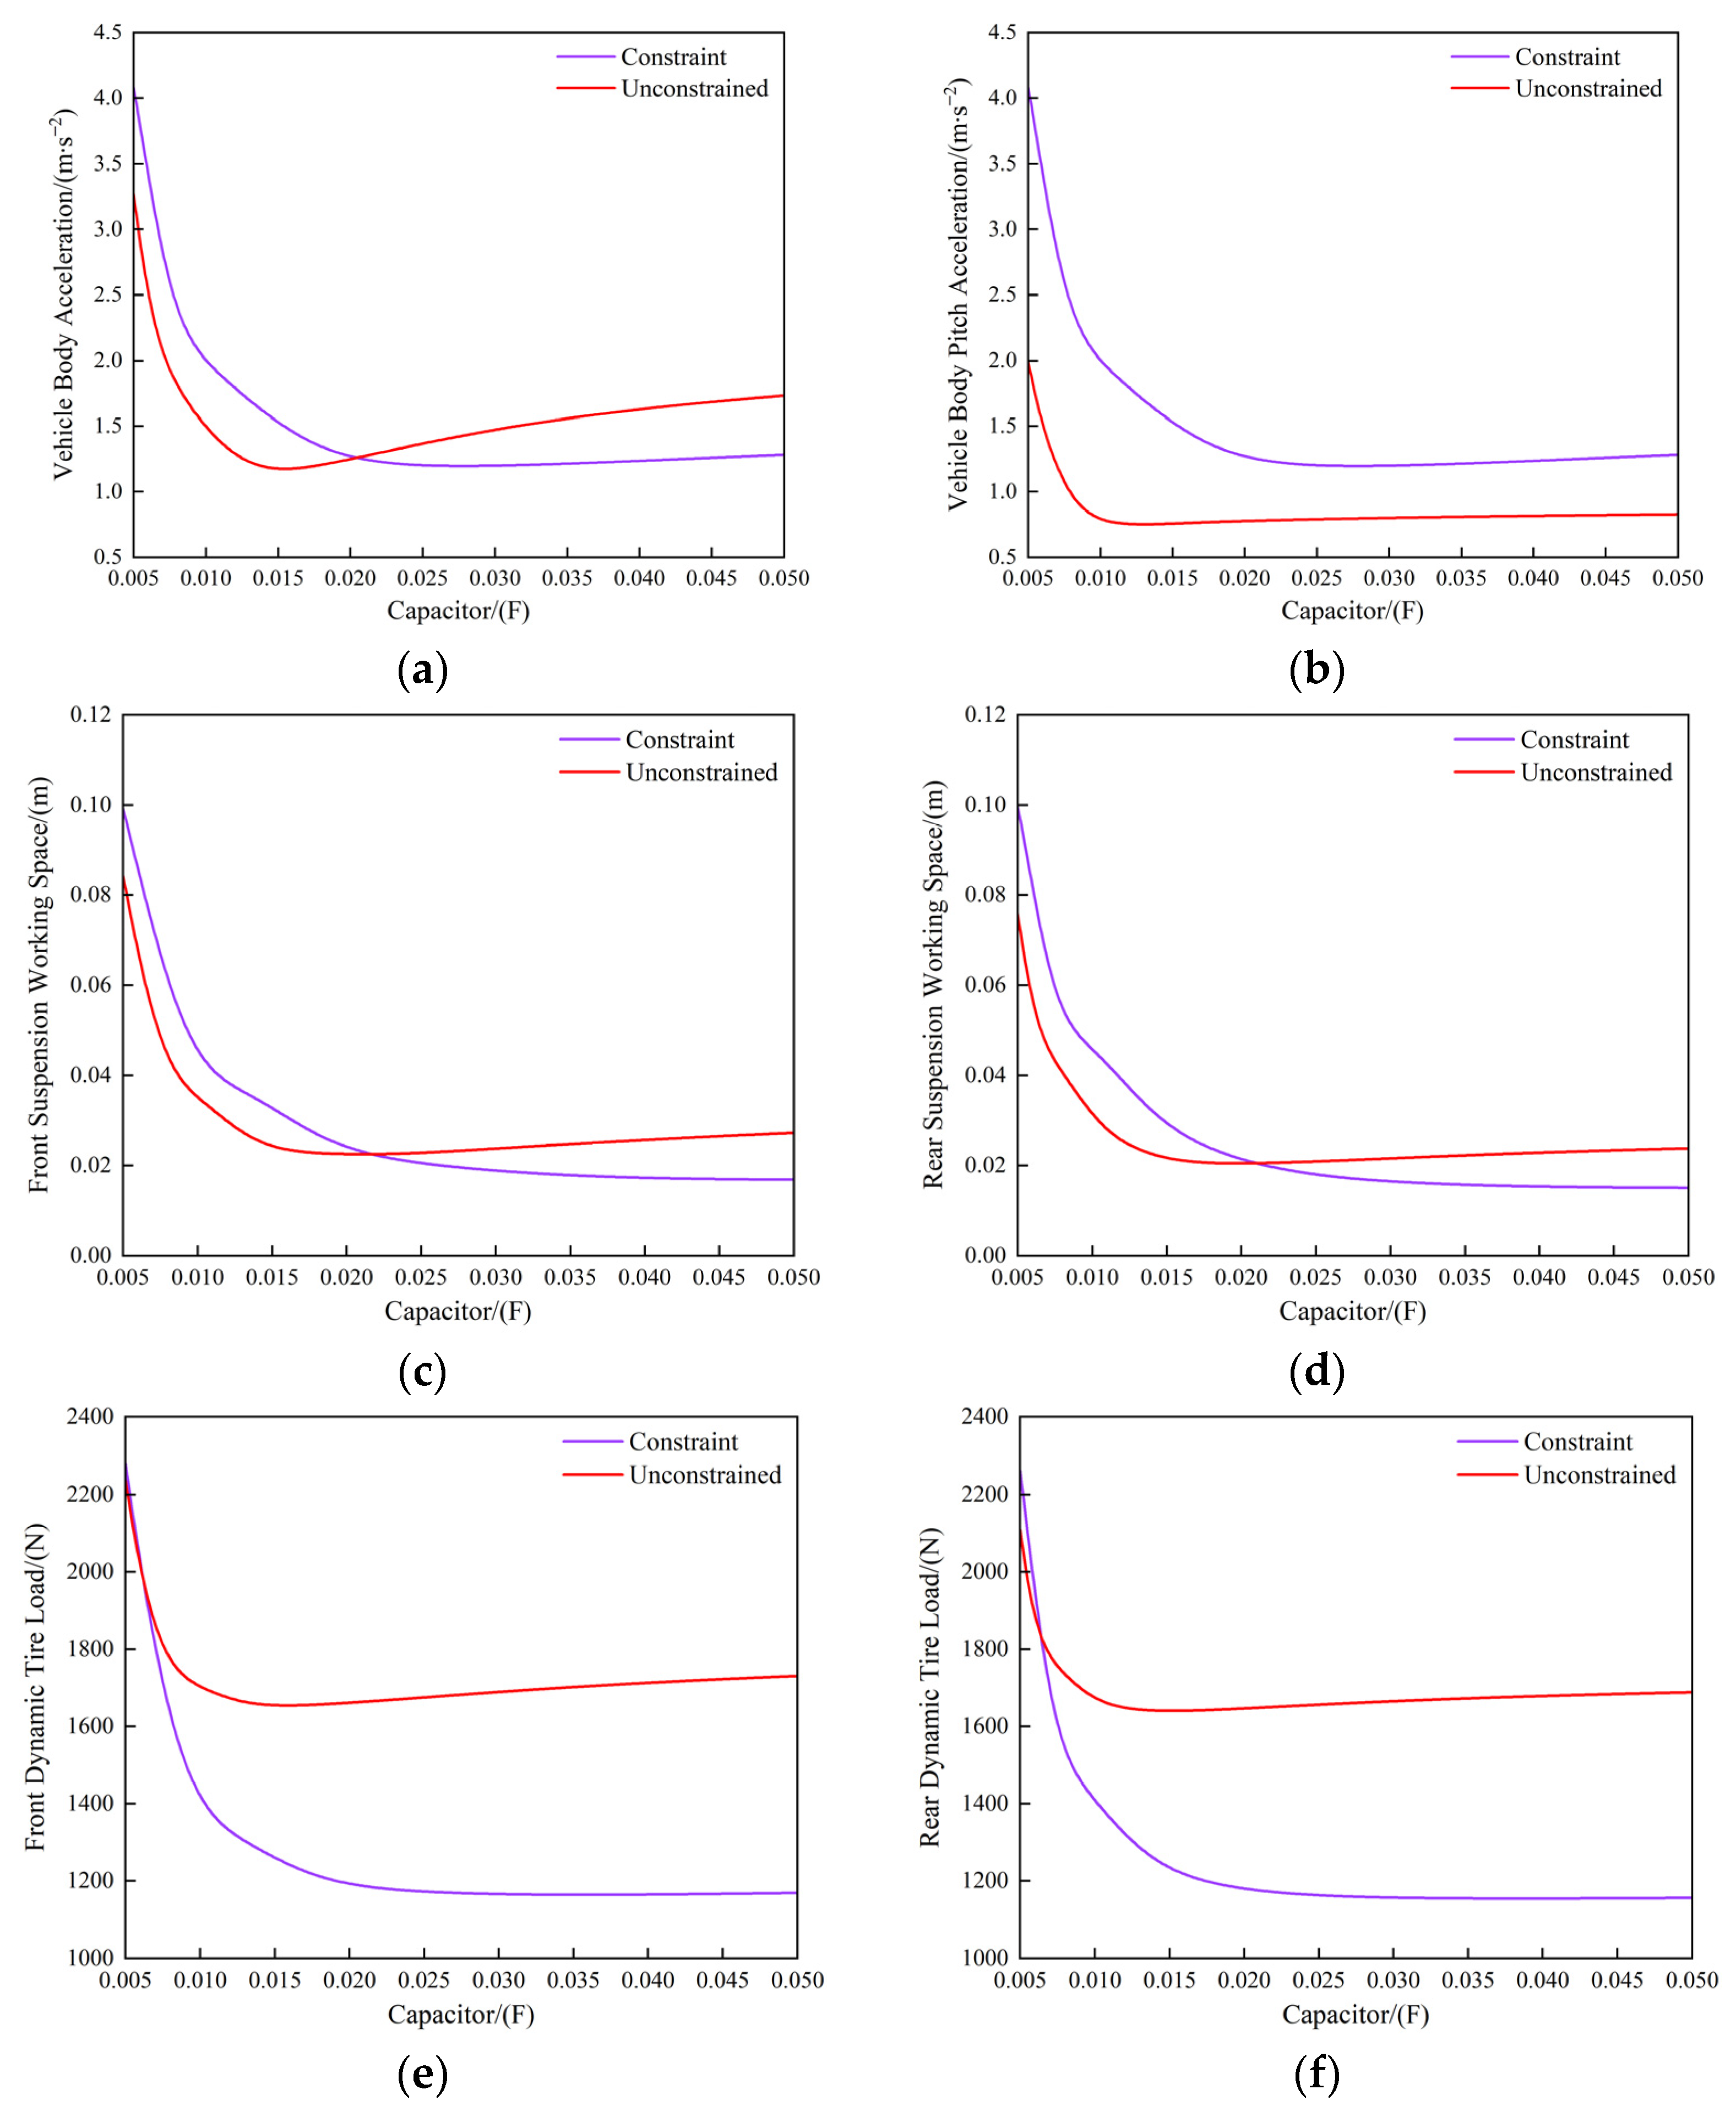
Similarly, the impact of capacitance C was examined by sweeping its value from 0.005 F to 0.05 F under otherwise identical conditions. The corresponding performance trends are shown in Figure 9. When C is within the range of 0.005–0.01 F, all six performance indices decrease rapidly. In the range of 0.01–0.02 F, the unconstrained mechatronic suspension shows a trend where the body acceleration RMS first decreases and then increases, while the pitch angular acceleration remains nearly constant. The remaining four indices follow a decreasing trend similar to that observed in the constrained suspension. When C increases to the range of 0.02–0.05 F, the body acceleration RMS of the unconstrained suspension gradually increases, whereas the other indices tend to stabilize. In this range, although the dynamic tire loads of both configurations become nearly constant, the constrained suspension consistently exhibits lower tire load levels.
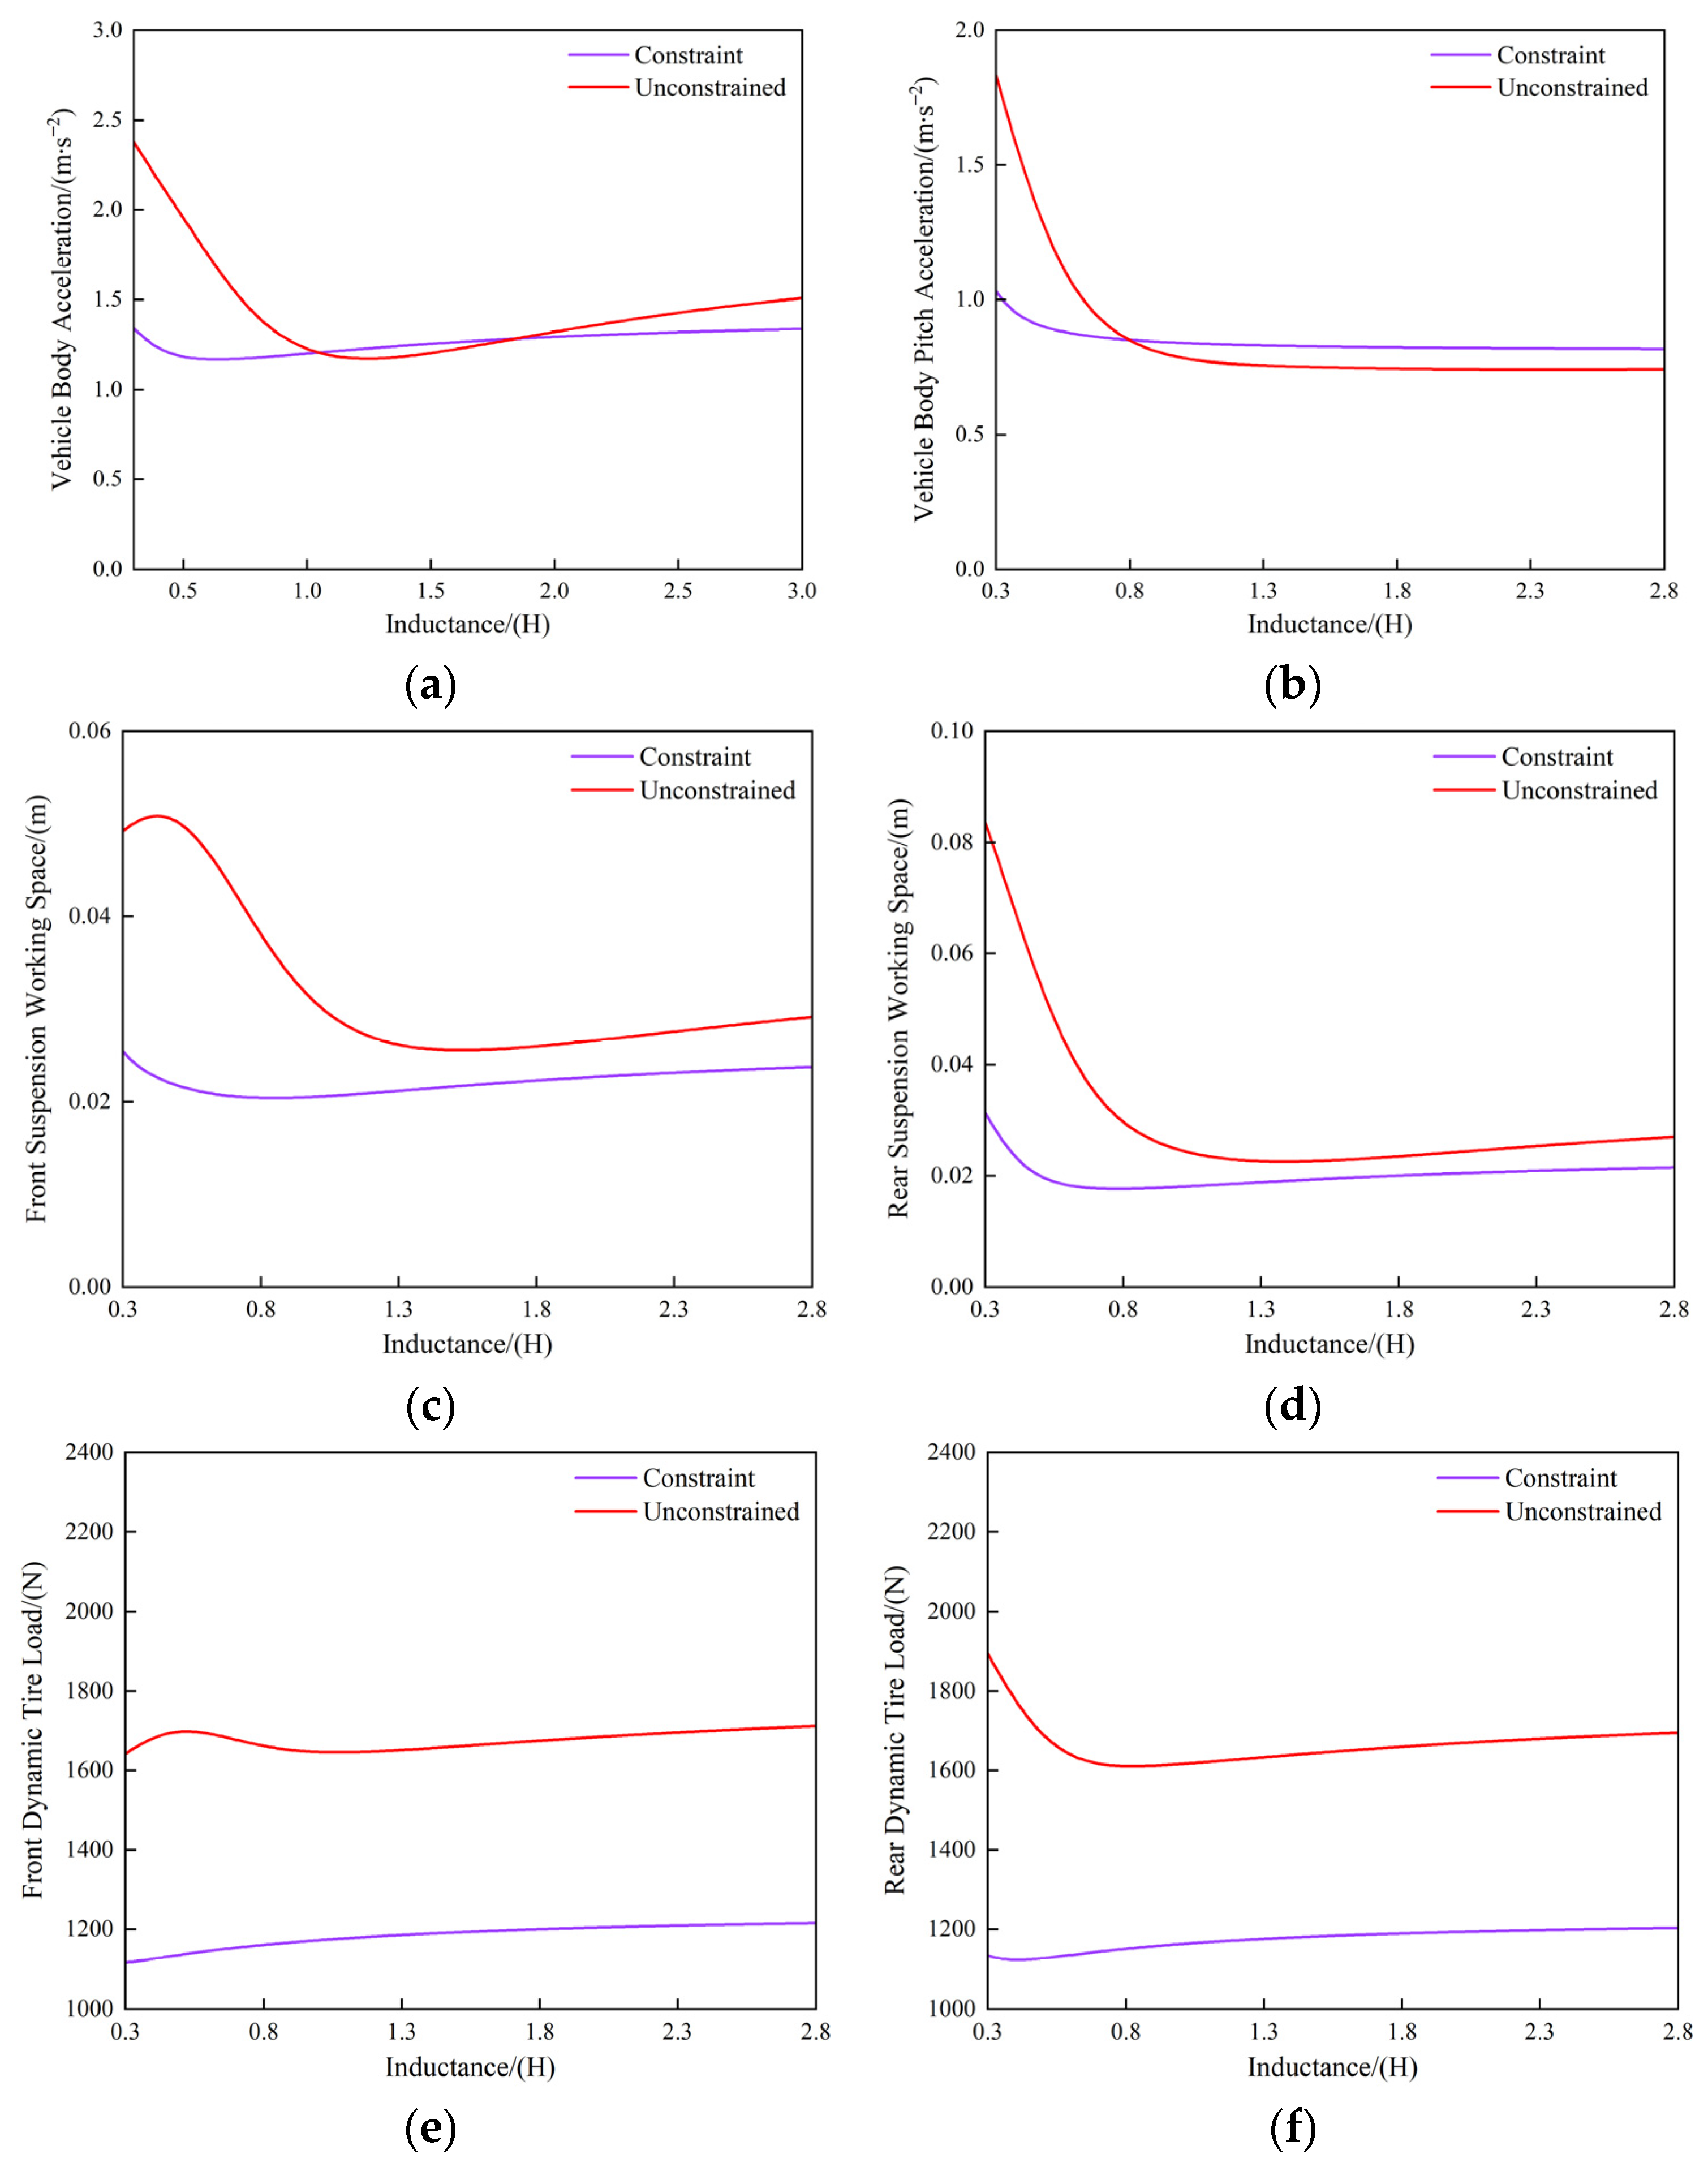
Subsequently, the impact of inductance L was investigated by sweeping its value from 0.3 H to 2.8 H, as plotted in Figure 10. Results indicate that the constrained mechatronic system is highly robust, with its performance metrics showing negligible fluctuations against inductance variations. Conversely, the unconstrained model exhibits a sharp decline in the RMS values of body acceleration, pitch angular acceleration, and suspension working space as L rises from 0.3 H to 1.0 H. Moreover, throughout the entire tested range, the constrained configuration maintains superior road-holding ability, yielding substantially lower dynamic tire load than its unconstrained counterpart.
Sensitivity analysis shows that system performance, particularly vertical body acceleration, is highly sensitive to variations in electrical resistance R. This is most critical in the low-resistance range (0–20 Ω). In practice, the motor’s internal resistance and the external resistor change due to heat during long operation (thermal drift). These resistance changes can reduce the system’s damping performance. To improve robustness, future designs should use temperature compensation algorithms or components with low temperature coefficients. This ensures consistent performance regardless of temperature changes.

5. Conclusions

This paper proposes a half-vehicle mechatronic suspension system using electromechanical analogy to overcome the inability of quarter-vehicle models to represent pitch motion and front-rear coupling. An equivalent electrical network model was developed, and structural parameters were optimized using the NSGA-II. To ensure the physical realizability and road-holding performance, positive-real constraints were incorporated into the optimization process.
Simulation results based on the Pareto optimal set reveal that while the unconstrained mechatronic suspension improves ride quality, it compromises road holding, increasing dynamic tire load by 19.18%. In contrast, the constrained configuration achieves comprehensive performance improvements. Compared to the standard passive suspension, this system reduces RMS vertical body acceleration by 19.54% and pitch angular acceleration by 2.22%. Moreover, suspension working space and dynamic tire load decreased by 8.29% and 1.26%, respectively.
Sensitivity analysis indicates that system performance, particularly body acceleration, is highly sensitive to variations in electrical resistance. The results demonstrate that introducing appropriate positive-real constraints combined with multi-objective optimization effectively balances the trade-off between ride comfort and safety. Future work will focus on experimental verification of the proposed system and the investigation of non-ideal factors in practical electrical components.

Author Contributions

Conceptualization, Y.S. and J.Y.; methodology, Y.Y.; software, J.C.; validation, J.C., H.R. and S.M.; formal analysis, J.Y.; investigation, Y.Y.; resources, Y.S.; data curation, J.Y.; writing—original draft preparation, Y.S.; writing—review and editing, J.C.; visualization, H.R.; supervision, Y.Y.; project administration, S.M.; funding acquisition, Y.S. All authors have read and agreed to the published version of the manuscript.

Funding

This work was supported by the National Natural Science Foundation of China (Grant No. 52472408, 52502472).

Data Availability Statement

The original contributions presented in this study are included in the article.

Acknowledgments

The authors would like to thank the editor and the anonymous reviewers for their careful reading and helpful comments.

Conflicts of Interest

The authors declare no conflicts of interest.

References

  1. Xu, L.; Chai, X.; Gao, Z.; Li, Y.; Wang, Y. Experimental study on driver seat vibration characteristics of crawler-type combine harvester. Int. J. Agric. Biol. Eng. 2019, 12, 90–97. [Google Scholar] [CrossRef]
  2. Gao, Y.; Yang, Y.; Fu, S.; Feng, K.; Han, X.; Hu, Y.; Zhu, Q.; Wei, X. Analysis of Vibration Characteristics of Tractor–Rotary Cultivator Combination Based on Time Domain and Frequency Domain. Agriculture 2024, 14, 1139. [Google Scholar] [CrossRef]
  3. Jing, J.; Yan, G.; Tang, Z.; Chen, S.; Liang, R.; Chen, Y.; He, X. Response Prediction and Experimental Validation of Vibration Noise in the Conveyor Trough of a Combine Harvester. Agriculture 2025, 15, 1099. [Google Scholar] [CrossRef]
  4. Cui, L.; Mao, H.; Xue, X.; Ding, S.; Qiao, B. Optimized design and test for a pendulum suspension of the crop spray boom in dynamic conditions based on a six DOF motion simulator. Int. J. Agric. Biol. Eng. 2018, 11, 76–85. [Google Scholar] [CrossRef]
  5. Chen, S.; Zhou, Y.; Tang, Z.; Lu, S. Modal vibration response of rice combine harvester frame under multi-source excitation. Biosyst. Eng. 2020, 194, 177–195. [Google Scholar] [CrossRef]
  6. Cui, L.; Xue, X.; Le, F.; Mao, H.; Ding, S. Design and experiment of electro hydraulic active suspension for controlling the rolling motion of spray boom. Int. J. Agric. Biol. Eng. 2019, 12, 72–81. [Google Scholar] [CrossRef]
  7. Chen, Y.; Chen, L.; Wang, R.; Xu, X.; Shen, Y.; Liu, Y. Modeling and test on height adjustment system of electrically-controlled air suspension for agricultural vehicles. Int. J. Agric. Biol. Eng. 2016, 9, 40–47. [Google Scholar] [CrossRef]
  8. Li, J.; Nie, Z.; Chen, Y.; Ge, D.; Li, M. Development of boom posture adjustment and control system for wide spray boom. Agriculture 2023, 13, 2162. [Google Scholar] [CrossRef]
  9. Yaw, Z.; Zhang, Y.; Liu, C.; Chen, Z.; Ni, Y.-Q.; Lai, S.-K. Reconfigurable 3D-printed 1-bit coding metasurface for simultaneous acoustic focusing and energy harvesting at low-frequency regime. Nano Energy 2025, 138, 110874. [Google Scholar] [CrossRef]
  10. Ding, L.; Wan, F.; Chen, Y.; Zou, Y.; Chen, K.; Chen, W.; Xu, S.; Chen, S.; Shen, J.; Ouyang, Q.; et al. Poly(vinyl alcohol)/MXene nanofiber composite materials with gradient structured for highly efficient mid- and low-frequency sound absorption. Colloids Surfaces A Physicochem. Eng. Asp. 2026, 731, 139111. [Google Scholar] [CrossRef]
  11. Zhang, J.; Hu, G.; Yang, C.; Yu, L.; Zhu, W. NSGA-II-TLQR control of semi-active suspension system with magnetorheological damper considering response time delay. J. Vib. Eng. Technol. 2024, 12, 825–838. [Google Scholar] [CrossRef]
  12. Yang, Y.; Liu, C.N.; Chen, L.; Zhang, X.L. Phase deviation of semi-active suspension control and its compensation with inertial suspension. Acta Mech. Sin. 2024, 40, 523367. [Google Scholar] [CrossRef]
  13. Jin, L.; Fan, J.; Du, F.; Zhan, M. Research on two-stage semi-active ISD suspension based on improved fuzzy neural network PID control. Sensors 2023, 23, 8388. [Google Scholar] [CrossRef] [PubMed]
  14. Tharehalli Mata, G.; Mokenapalli, V.; Krishna, H. Performance analysis of MR damper-based semi-active suspension system using optimally tuned controllers. Proc. Inst. Mech. Eng. Part D J. Automob. Eng. 2021, 235, 2871–2884. [Google Scholar] [CrossRef]
  15. Wang, Y.; Dong, L.; Chen, Z.; Sun, M.; Long, X. Integrated skyhook vibration reduction control with active disturbance rejection decoupling for automotive semi-active suspension systems. Nonlinear Dyn. 2024, 112, 6215–6230. [Google Scholar] [CrossRef]
  16. Jin, X.; Wang, J.; Yan, Z.; Xu, L.; Yin, G.; Chen, N. Robust vibration control for active suspension system of in-wheel-motor-driven electric vehicle via μ-synthesis methodology. J. Dyn. Syst. Meas. Control 2022, 144, 051007. [Google Scholar] [CrossRef]
  17. Yu, Y.; Li, B.; Zhao, L.; Ma, C.; Jiao, G. A novel optimal control strategy for active suspension systems with control weighting coefficient dynamically adjusted based on operating conditions. Mech. Syst. Signal Process. 2026, 244, 113752. [Google Scholar] [CrossRef]
  18. Barredo, E.; Rojas, G.L.; Mayén, J.; Flores-Hernández, A.A. Innovative negative-stiffness inerter-based mechanical networks. Int. J. Mech. Sci. 2021, 205, 106597. [Google Scholar] [CrossRef]
  19. Chandio, F.A.; Li, Y.; Xu, L.; Ma, Z.; Ahmad, F.; Cuong, D.M.; Lakhiar, I.A. Predicting 3D forces of disc tool and soil disturbance area using fuzzy logic model under sensor based soil-bin. Int. J. Agric. Biol. Eng. 2020, 13, 77–84. [Google Scholar] [CrossRef]
  20. Ji, X.; Wang, A.; Wei, X. Precision Control of Spraying Quantity Based on Linear Active Disturbance Rejection Control Method. Agriculture 2021, 11, 761. [Google Scholar] [CrossRef]
  21. Zhu, Z.; Yang, Y.; Wang, D.; Cai, Y.; Lai, L. Energy Saving Performance of Agricultural Tractor Equipped with Mechanic-Electronic-Hydraulic Powertrain System. Agriculture 2022, 12, 436. [Google Scholar] [CrossRef]
  22. Liu, C.; Wang, J.; Zhang, W.; Yang, X.-D.; Guo, X.; Liu, T.; Su, X. Synchronization of broadband energy harvesting and vibration mitigation via 1:2 internal resonance. Int. J. Mech. Sci. 2025, 301, 110503. [Google Scholar] [CrossRef]
  23. Liu, C.; Chen, L.; Lee, H.P.; Yang, Y.; Zhang, X. A review of the inerter and inerter-based vibration isolation: Theory, devices, and applications. J. Frankl. Inst. 2022, 359, 7677–7707. [Google Scholar] [CrossRef]
  24. Shen, Y.; Ren, H.; Zhang, S.Y.; Lin, J.; Yang, X.; Liu, Y. Vehicle semi-active air inerter–spring–damper suspension with frequency-varying negative stiffness: Design, control, and experimental validation. Mech. Syst. Signal Process. 2026, 244, 113740. [Google Scholar] [CrossRef]
  25. Pirrotta, A.; Di Nardo, L.A.; Masnata, C. Theoretical and experimental investigation on an improved rack and pinion inerter. Nonlinear Dyn. 2024, 113, 30571–30592. [Google Scholar] [CrossRef]
  26. Shen, Y.J.; Qiu, D.D.; Yang, X.F.; Chen, J.; Guo, Y.; Zhang, T. Vibration isolation performance analysis of a nonlinear fluid inerter-based hydro-pneumatic suspension. Int. J. Struct. Stab. Dyn. 2024, 2650079. [Google Scholar] [CrossRef]
  27. John, E.D.A.; Wagg, D.J. Design and testing of a frictionless mechanical inerter device using living-hinges. J. Frankl. Inst. 2019, 356, 7650–7668. [Google Scholar] [CrossRef]
  28. Li, Y.; Hu, N.; Cheng, Z.; Zhang, L.; Yang, Y.; Yin, Z.; Huang, L. Dynamic-breakdown of the ball-screw inerter in ISD system. Appl. Sci. 2023, 13, 2168. [Google Scholar] [CrossRef]
  29. Liu, X.; Jiang, J.Z.; Harrison, A.; Na, X. Truck suspension incorporating inerters to minimise road damage. Proc. Inst. Mech. Eng. Part D J. Automob. Eng. 2020, 234, 2693–2705. [Google Scholar] [CrossRef]
  30. Liu, C.; Lai, S.-K.; Ni, Y.-Q.; Chen, L. Dynamic modelling and analysis of a physics-driven strategy for vibration control of railway vehicles. Veh. Syst. Dyn. 2024, 63, 1080–1110. [Google Scholar] [CrossRef]
  31. Chen, Z.; Lai, S.-K.; Yang, Z. AT-PINN: Advanced time-marching physics-informed neural network for structural vibration analysis. Thin-Walled Struct. 2024, 196, 111423. [Google Scholar] [CrossRef]
  32. Shen, Y.; Cui, J.; Lin, J.; Sun, K.; Zhao, Y.; Du, F. Vibration suppression of a frequency-varying negative stiffness based on vehicle air ISD suspension. Proc. Inst. Mech. Eng. Part D J. Automob. Eng. 2026. [Google Scholar] [CrossRef]
  33. Liu, J.; Zheng, J.; Liu, R.; Luo, Y.; Yuan, Y.; Yan, W. A stationary simulation method for dynamic electromechanical characteristics in null-flux electrodynamic suspension systems. IEEE Trans. Ind. Electron. 2025, 73, 139–148. [Google Scholar] [CrossRef]
  34. Li, F.; Ma, P.; Zhao, Y.; Li, X.; Wen, B. Optimization design and vibration reduction performance analysis of vehicle suspension structure. J. Vib. Control 2025. [Google Scholar] [CrossRef]
  35. Zhang, T.; Yang, X.; Shen, Y.; Liu, Y.; Wang, H.; Bi, S. A sky-hook positive real network-based ISD seat suspension for commercial vehicles. J. Vib. Control 2026. [Google Scholar] [CrossRef]
  36. Song, H.; Zhao, T.; Wang, X.; Gu, L. Research on the configuration of electromechanical suspension based on inertial force attenuation structure. Adv. Mech. Eng. 2024, 16, 16878132241284371. [Google Scholar] [CrossRef]
  37. Li, F.; Li, X.; Shang, D.; Yang, Y.; Guo, J.; Xuan, S. Structural optimization and dynamic analysis of vehicle suspension seat coupling system. In Proceedings of the International Symposium on Autonomous Systems (ISAS); IEEE: Piscataway, NJ, USA, 2020; pp. 239–243. [Google Scholar]
  38. Xu, X.; Jiang, H.; Gao, M.H. Modeling and validation of air suspension with auxiliary chamber based on electromechanical analogy theory. Appl. Mech. Mater. 2013, 437, 190–193. [Google Scholar] [CrossRef]
  39. Jiang, J.Z.; Smith, M.C. Regular positive-real functions and five-element network synthesis for electrical and mechanical networks. IEEE Trans. Autom. Control 2010, 56, 1275–1290. [Google Scholar] [CrossRef]
  40. Gao, Y.; Hu, Y.; Yang, Y.; Feng, K.; Han, X.; Li, P.; Zhu, Y.; Song, Q. Optimization of Operating Parameters for Straw Returning Machine Based on Vibration Characteristic Analysis. Agronomy 2024, 14, 2388. [Google Scholar] [CrossRef]
  41. Xie, F.; Guo, Z.; Li, T.; Feng, Q.; Zhao, C. Dynamic Task Planning for Multi-Arm Harvesting Robots Under Multiple Constraints Using Deep Reinforcement Learning. Horticulturae 2025, 11, 88. [Google Scholar] [CrossRef]
  42. Xu, J.; Jing, T.; Fang, M.; Li, P.; Tang, Z. Failure State Identification and Fault Diagnosis Method of Vibrating Screen Bolt Under Multiple Excitation of Combine Harvester. Agriculture 2025, 15, 455. [Google Scholar] [CrossRef]
  43. Gadhvi, B.; Savsani, V.; Patel, V. Multi-objective optimization of vehicle passive suspension system using NSGA-II, SPEA2 and PESA-II. Procedia Technol. 2016, 23, 361–368. [Google Scholar] [CrossRef]
  44. Foo, M.; Tan, A.H. Benchmark vehicle suspension data based on ISO 8608 road profiles. Control Eng. Pract. 2026, 169, 106755. [Google Scholar] [CrossRef]
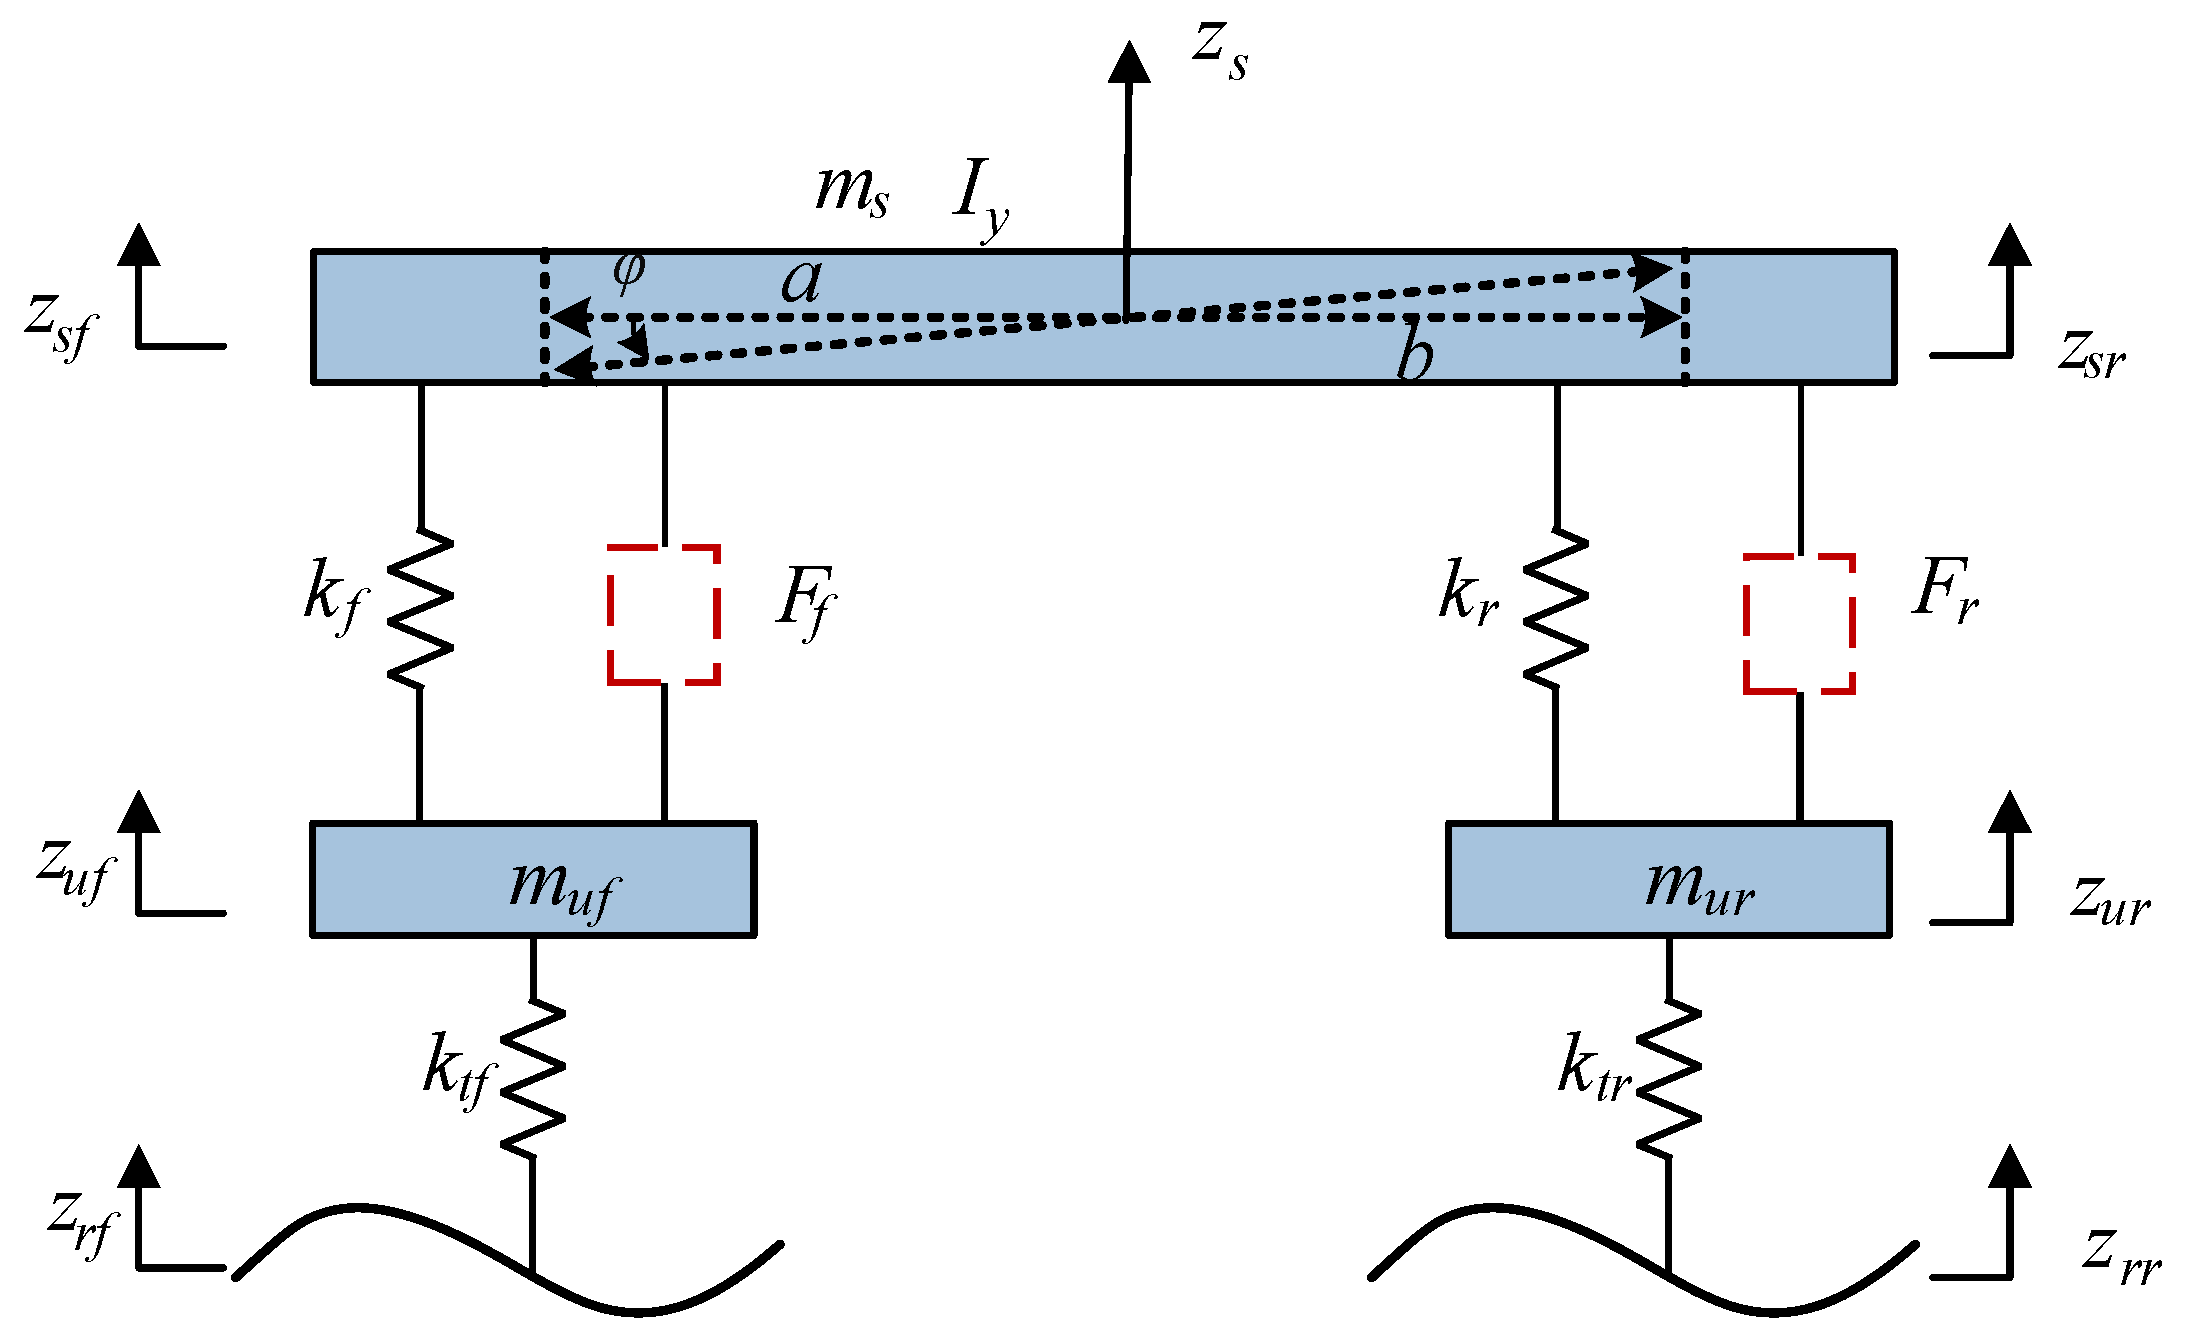
Figure 1. The dynamic model of the half-car suspension.
Machines 14 00285 g001
Figure 2. Schematic diagram of the electromechanical device.
Machines 14 00285 g002
Figure 3. Flowchart of NSGA-II.
Machines 14 00285 g003
Figure 4. Structure of the external electrical network.
Machines 14 00285 g004
Figure 5. Time-domain responses of the suspension systems: (a) vertical body acceleration; (b) vehicle pitch acceleration; (c) working space of the front suspension; (d) working space of the rear suspension; (e) dynamic load on the front tire; and (f) dynamic load on the rear tire.
Machines 14 00285 g005
Figure 6. Frequency-domain response of the suspension systems: power spectral density (PSD) of vertical body acceleration.
Machines 14 00285 g006
Figure 7. Time-domain responses of the suspension systems under discrete bump input: (a) vertical body acceleration; (b) vehicle pitch angular acceleration.
Machines 14 00285 g007
Figure 8. Influence of resistance R on suspension performance indices: (a) vertical body acceleration; (b) vehicle pitch acceleration; (c) working space of the front suspension; (d) working space of the rear suspension; (e) dynamic load on the front tire; and (f) dynamic load on the rear tire.
Machines 14 00285 g008
Figure 9. Influence of capacitance C on suspension performance indices: (a) vertical body acceleration; (b) vehicle pitch acceleration; (c) working space of the front suspension; (d) working space of the rear suspension; (e) dynamic load on the front tire; and (f) dynamic load on the rear tire.
Machines 14 00285 g009
Figure 10. Influence of inductance L on suspension performance indices: (a) vertical body acceleration; (b) vehicle pitch acceleration; (c) working space of the front suspension; (d) working space of the rear suspension; (e) dynamic load on the front tire; and (f) dynamic load on the rear tire.
Machines 14 00285 g010
Table 1. Parameters of the vehicle model.
ParametersValue
ms (kg)690
muf, mur (kg)45
a (m)1.2
b (m)1.5
Iy (kg·m2)1250
ktf, ktr (kN·m−1)192,000
kf, kr (kN·m−1)20,000
Table 2. Optimize algorithm parameters.
ParametersValue
Population size100
Maximum generation30
Crossover probability0.8
Mutation probability0.3
Table 3. Z(s) optimization results for tandem structures.
SituationParameterValue
UnconstrainedAunc666,557,950
Bunc6,707,423,125
Cunc1,157,500
Dunc5,758,600
Eunc57,947,500
ConstrainedAcons1,462,516,433
Bcons10,536,883,602
Ccons1,561,700
Dcons9,364,900
Econs67,470,600
Table 4. Parameters of the external electrical network (Optimize algorithm results).
NameValue (Unconstrained)Value (Constraint)
R(Ω)14.55.8
C(F)0.0140.025
L(H)1.51.005
Table 5. Performance evaluation indices.
RMS of Vertical
Acceleration/(m·s−2)
RMS of Pitch
Acceleration/(m·s−2)
RMS of Suspension Working Space/(m)RMS of Dynamic Tire Load/(N)
Traditional
passive
suspension
1.42580.81990.02171280.9
Constrained1.14720.80170.01991264.8
Unconstrained1.13360.76160.02231526.6
Table 6. Performance comparison of three suspensions at different speeds.
Performance IndicatorSpeed (m/s)Traditional Passive SuspensionConstraintDecreaseUnconstraintDecrease
RMS of Vertical
Acceleration/(m/s2)
151.23571.029716.67%1.056014.54%
201.42581.147219.53%1.133620.49%
251.74361.455216.54%1.460616.23%
RMS of Pitch Acceleration/(m/s2)150.70760.66326.27%0.591316.43%
200.81990.80172.22%0.76167.11%
250.75340.73832.00%0.661112.25%
Disclaimer/Publisher’s Note: The statements, opinions and data contained in all publications are solely those of the individual author(s) and contributor(s) and not of MDPI and/or the editor(s). MDPI and/or the editor(s) disclaim responsibility for any injury to people or property resulting from any ideas, methods, instructions or products referred to in the content.