Article

Effects of Ultra-High Reynolds Number and Low Mach Number Compressibility on the Static Stall Behavior of a Wind Turbine Airfoil

1
School of New Energy, Nanjing University of Science and Technology, Jiangyin 214443, China
2
School of Energy and Power Engineering, Nanjing University of Science and Technology, Nanjing 210094, China
3
Jiangsu Key Laboratory of Hi-Tech Research for Wind Turbine Design, Nanjing University of Aeronautics and Astronautics, Nanjing 210016, China
4
Yangtze River Shipbuilding Group Co., Ltd., Jiangyin 214434, China
*
Author to whom correspondence should be addressed.
Machines 2025, 13(9), 847; https://doi.org/10.3390/machines13090847
Submission received: 9 August 2025 / Revised: 8 September 2025 / Accepted: 10 September 2025 / Published: 12 September 2025
(This article belongs to the Special Issue Aerodynamic Analysis of Wind Turbine Blades)

Abstract

The increasing scale of wind turbines introduces significant aerodynamic challenges at ultra-high Reynolds numbers and under conditions of low Mach number compressibility. The stall behavior, flow separation, and boundary layer transition are all significantly changed by these characteristics. However, wind tunnel testing cannot concurrently satisfy Re-Ma similarity, and current design frameworks ignore their associated impacts, leading to a great deal of uncertainty in load prediction and power efficiency for next-generation turbines. To bridge this gap, we utilize high-fidelity CFD simulations combined with parametric scaling to develop a novel size-based decoupling technique. With Re and Ma independently controlled by changing chord length and freestream velocity, the FFA-W3-211 airfoil is used as the benchmark. Static stall prediction accuracy is confirmed by validations against the wind-tunnel experimental data of S809 and VR-7B airfoils. The results show that the influence of a high Reynolds number markedly postpones flow separation and enhances pressure distribution, delaying the onset of stall. In contrast, the effect of a high Mach number hastens flow separation and deteriorates pressure distribution due to shock-induced separation, leading to an earlier occurrence of stall. For angles of attack lower than 12°, the influence of the Reynolds number prevails, effectively counteracting the negative impacts of the Mach number. For angles of attack greater than 12°, the two effects combine to raise the risk of flow instability considerably. This study focuses on independently analyzing the effects of the Reynolds and Mach numbers on the stall behaviors of wind turbine airfoils.

1. Introduction

Contemporary wind turbine designs now have blades longer than 100 m and more than 20 megawatts of capacity [1], thanks to the wind energy sector’s explosive growth. While these massive turbines enhance energy capture, their unprecedented size poses significant aerodynamic challenges to conventional design approaches. The interplay of low Mach number compressibility and ultra-high Reynolds number effects has emerged as a critical factor influencing the structural integrity and efficiency of wind turbines [1,2,3,4,5]. Despite the substantial impact of these parameters on boundary layer behavior, flow separation characteristics, and stall phenomena, existing design frameworks often fail to account for their combined effects adequately [1,5,6,7,8,9,10]. This limitation introduces considerable uncertainty in predicting the performance of next-generation turbines [10,11,12].
The aerodynamic performance of wind turbine blades is governed by two critical dimensionless parameters: the Reynolds number and the Mach number. The Reynolds number, which quantifies the ratio of inertial forces to viscous forces in a fluid flow, profoundly influences boundary layer development, transition, and separation [5,6]. As wind turbine blades grow larger and operational velocities increase, the Reynolds number based on chord length can exceed 20 million [2,13]. At such elevated Reynolds numbers, viscous effects become less dominant, and turbulent flow dynamics prevail, delaying flow separation and enhancing lift generation at higher angles of attack. Conversely, the Mach number, which characterizes the compressibility of the flow, adds complexity [1,5,14,15,16]. Although wind turbines typically operate at subsonic freestream velocities, localized transonic flow conditions can emerge near the blade tips, especially at high rotational speeds [17]. These conditions lead to shock wave formation and compressibility effects, altering pressure distributions and potentially causing premature flow separation and increased aerodynamic loading.
Previous research has predominantly investigated the Reynolds number and Mach number effects in isolation. For example, Aditya et al. (2024) experimentally studied the transonic flow effects on the FFA-W3-211 airfoil using Schlieren imaging and PIV techniques in a high-speed wind tunnel, revealing localized supersonic flow regions and shock wave formation at high Mach numbers [14]. However, their study focused on isolated airfoil behavior without considering the full rotor context. Cao et al. (2023) highlighted that including air compressibility improves thrust and torque predictions for the IEA-15MW offshore wind turbine, demonstrating the importance of considering compressibility effects at the rotor scale [15]. De Tavernier and von Terzi (2022) further highlighted the emergence of supersonic flow on wind turbine blades under turbulent inflow conditions through OpenFAST simulations, emphasizing the detrimental implications for turbine loads and fatigue life [16].
In the realm of Reynolds number effects, Pires et al. (2016) conducted 2D wind tunnel tests to analyze the influence of high Reynolds numbers on a wind turbine airfoil, revealing substantial improvements in aerodynamic performance with increasing Reynolds numbers [18]. Vitulano et al. (2024) extended this understanding by numerically exploring the static and dynamic characteristics of the FFA-W3-211 airfoil in transonic flows, documenting hysteresis phenomena during dynamic stall and variations in aerodynamic coefficients with reduced frequency [1,7]. However, these studies either focused solely on Reynolds number or Mach number effects or were limited in scope to specific flow regimes.
Recent advancements in wind turbine aerodynamics have underscored the significance of Reynolds number and Mach number in governing flow behavior and aerodynamic performance. While studies have explored the individual influences of Reynolds number and Mach number on airfoil characteristics, the coupled effects of these parameters, especially under ultra-high Reynolds number and low but non-negligible Mach number conditions, remain inadequately addressed. Brusca et al. (2025) demonstrated the effectiveness of advanced CFD methods, such as Sliding Mesh and Dynamic Fluid Body Interaction (DFBI) techniques, in characterizing the performance of ducted Savonius turbines. This underscores the growing reliance on sophisticated CFD approaches across diverse turbine configurations [8]. Sfravara et al. (2024) developed a predictive model combining machine learning with CFD simulations to evaluate parameter influences on Oscillating Water Column devices. This integration of data-driven and physics-based methods offers valuable insights for future extensions of decoupling frameworks [9].
Despite these valuable contributions, a comprehensive understanding of the coupled Reynolds number and Mach number effects on wind turbine aerodynamics remains elusive. Existing research has not adequately addressed the intricate interplay between these parameters, particularly in the context of ultra-high Reynolds numbers and low but non-negligible Mach numbers relevant to contemporary large wind turbines [15,18,19]. Most studies have relied on simplified assumptions or isolated test cases [1,7,14,20], leaving critical gaps in our knowledge of how these factors collectively influence aerodynamic performance, stall behavior, and load distribution.
In order to independently investigate the impacts of Reynolds and Mach numbers, we have built a unique decoupling framework using sophisticated CFD simulations with a high-fidelity turbulence model [1,19,21]. The FFA-W3-211 airfoil serves as the benchmark for our study [14]. And our methodology involves extensive parametric scaling of chord length and freestream velocity, enabling a detailed exploration of the individual and combined impacts of these dimensionless parameters.
The results of our investigation provide critical insights into the static stall mechanisms of wind turbine airfoils under extreme flow conditions. We demonstrate that the high Reynolds number environment can significantly delay flow separation, thereby enhancing aerodynamic efficiency and load capacity [19]. However, the concurrent increase in Mach number introduces compressibility effects that may counteract these benefits by promoting adverse pressure gradient and shock-induced separation. Our study further reveals nonlinear interactions between Reynolds number and Mach number effects, where the separation-suppressing properties of high Reynolds numbers can partially mitigate but not entirely offset the detriments of compressibility effects. These findings are validated through rigorous comparisons with experimental data from the S809 and VR-7B airfoils, ensuring the reliability of our simulations [22,23,24].
The significance of this research extends beyond academic interest. As wind turbine designs continue to evolve towards larger rotor diameters and higher operational efficiencies, the ability to accurately predict and optimize aerodynamic performance becomes paramount [6,10]. The modeling framework and validated results presented in this study offer a robust foundation for future wind turbine design and analysis. They enable more precise predictions of blade loads, power output, and fatigue life, thereby supporting the development of more reliable and cost-effective wind energy solutions [10,25]. Furthermore, the insights gained into the complex flow physics at play in large wind turbines can inform the design of advanced flow control strategies and improved airfoil geometries tailored to mitigate the adverse effects of high Reynolds number and compressibility phenomena.
In summary, this study addresses the pressing need for a deeper understanding of the aerodynamic challenges posed by ultra-high Reynolds numbers and low Mach number compressibility in modern wind turbines. By building upon and extending the existing body of knowledge, our work aims to provide both theoretical advancements and practical guidelines for the continued growth and optimization of wind energy technology.
Following this introduction, Section 2 details the Re-Ma relationship and decoupling methodology. Section 3 describes numerical methods and validation. Section 4 validates CFD models against S809 and VR-7B airfoil data. Section 5 clarifies numerical uncertainty and demonstrates grid independence. Section 6 and Section 7 analyze Re and Ma effects on FFA-W3-211 aerodynamics, respectively, and Section 8 presents conclusions and implications for future blade design.

2. Relationship and Decoupling of Reynolds Number and Mach Number

2.1. High Reynolds Number Effect

Reynolds number is defined as
R e = ρ U c μ = ρ U 2 c 2 μ U c Inertial force Viscous force
where ρ is air density, U is inflow velocity, c is blade chord length, and μ is air viscosity, has a substantial impact on the boundary layer development and transition.
The definition of the Reynolds number states that it is equal to the ratio of viscous to inertial forces, which may be inferred from the formula [5]. The boundary layer gets thinner at high Reynolds number, and the inertial forces that predominate cause the boundary layer close to the wall to transition earlier, reducing flow separation and postponing separation and stall [6,19]. Reduced lift, increased friction drag, and decreased aerodynamic efficiency result from the earlier transition at low angles of attack. At high angles of attack, the delayed separation produces increased lift, decreased pressure drag, and improved aerodynamic efficiency. Furthermore, the turbulence intensity near the wall increases with increasing Reynolds number, exhibiting more complicated and elaborate coherent structures. The surface flow state of the wind turbine usually undergoes a transition from laminar flow, transition flow to turbulent flow. Since the actual operating Reynolds number range is between low Reynolds number (flow dominated by viscous forces) and ultra-high Reynolds number (flow dominated by inertial forces), its aerodynamic performance is significantly affected by the nonlinearity of Reynolds number changes.
Figure 1 shows the radial distribution of the Reynolds and Mach numbers for wind turbine blades of various diameters under rated operating circumstances. For wind turbine blades operating under rated conditions, the radial distribution of the Reynolds number increases with increasing size, initially rising and then falling from the blade root to the blade tip, as seen in Figure 1a. The maximum Reynolds number for the IEA 22MW wind turbine is close to 2 × 10⁷, and the blade size approaches 142 m [2].

2.2. Compressible Effect

Mach number is mostly used to indicate the drag of a fluid medium to compression, given by:
M a = U a = ρ U 2 c 2 E v c 2 Inertial force Elastic force
a = d p d ρ = E v ρ = κ R T
E v = d p d V / V = d p d ρ / ρ = ρ a 2
where a is the speed of sound that influences the compressibility of the flow, U is inflow velocity, Ev is the bulk modulus of elasticity, p is pressure, and V is volume.
The pressure field surrounding the wind turbine is significantly impacted by changes in the density field brought on by the compressibility effect [13,26]. The flow acceleration and the positive pressure gradient at the airfoil’s leading edge both get stronger as the Mach number rises, while the suction surface experiences an increase in the negative pressure gradient. This causes an early stall and significant flow separation at high angles of attack [3,27]. Flow separation can be made worse by local supersonic flow and shock wave that can develop near the leading edge of the airfoil’s suction surface when the Mach number rises above the critical Mach number. The strength of turbulence close to the wall increases as the Mach number rises, resulting in the creation of smaller-scale turbulence structures and more complex turbulence structures [28,29,30].
Figure 1b indicates that the Mach number radial distribution of wind turbine blades at rated conditions exhibits a linear growth trend from the root to the tip, increasing with increasing size. The air becomes compressible near the tip of the IEA 22MW wind turbine blade when the Mach number surpasses 0.3 [1,7,14]. Transonic flow can exist at the blade tip of a 20MW wind turbine, according to research from TU Delft, which also shows that the critical Mach number for the FFA-W3-211 blade tip at high angles of attack can be lowered to less than 0.3 [1]. At high tip speed ratios, compressibility can also result in a 20% decrease in turbine power [31].

2.3. Decoupling Between Reynolds Number and Mach Number

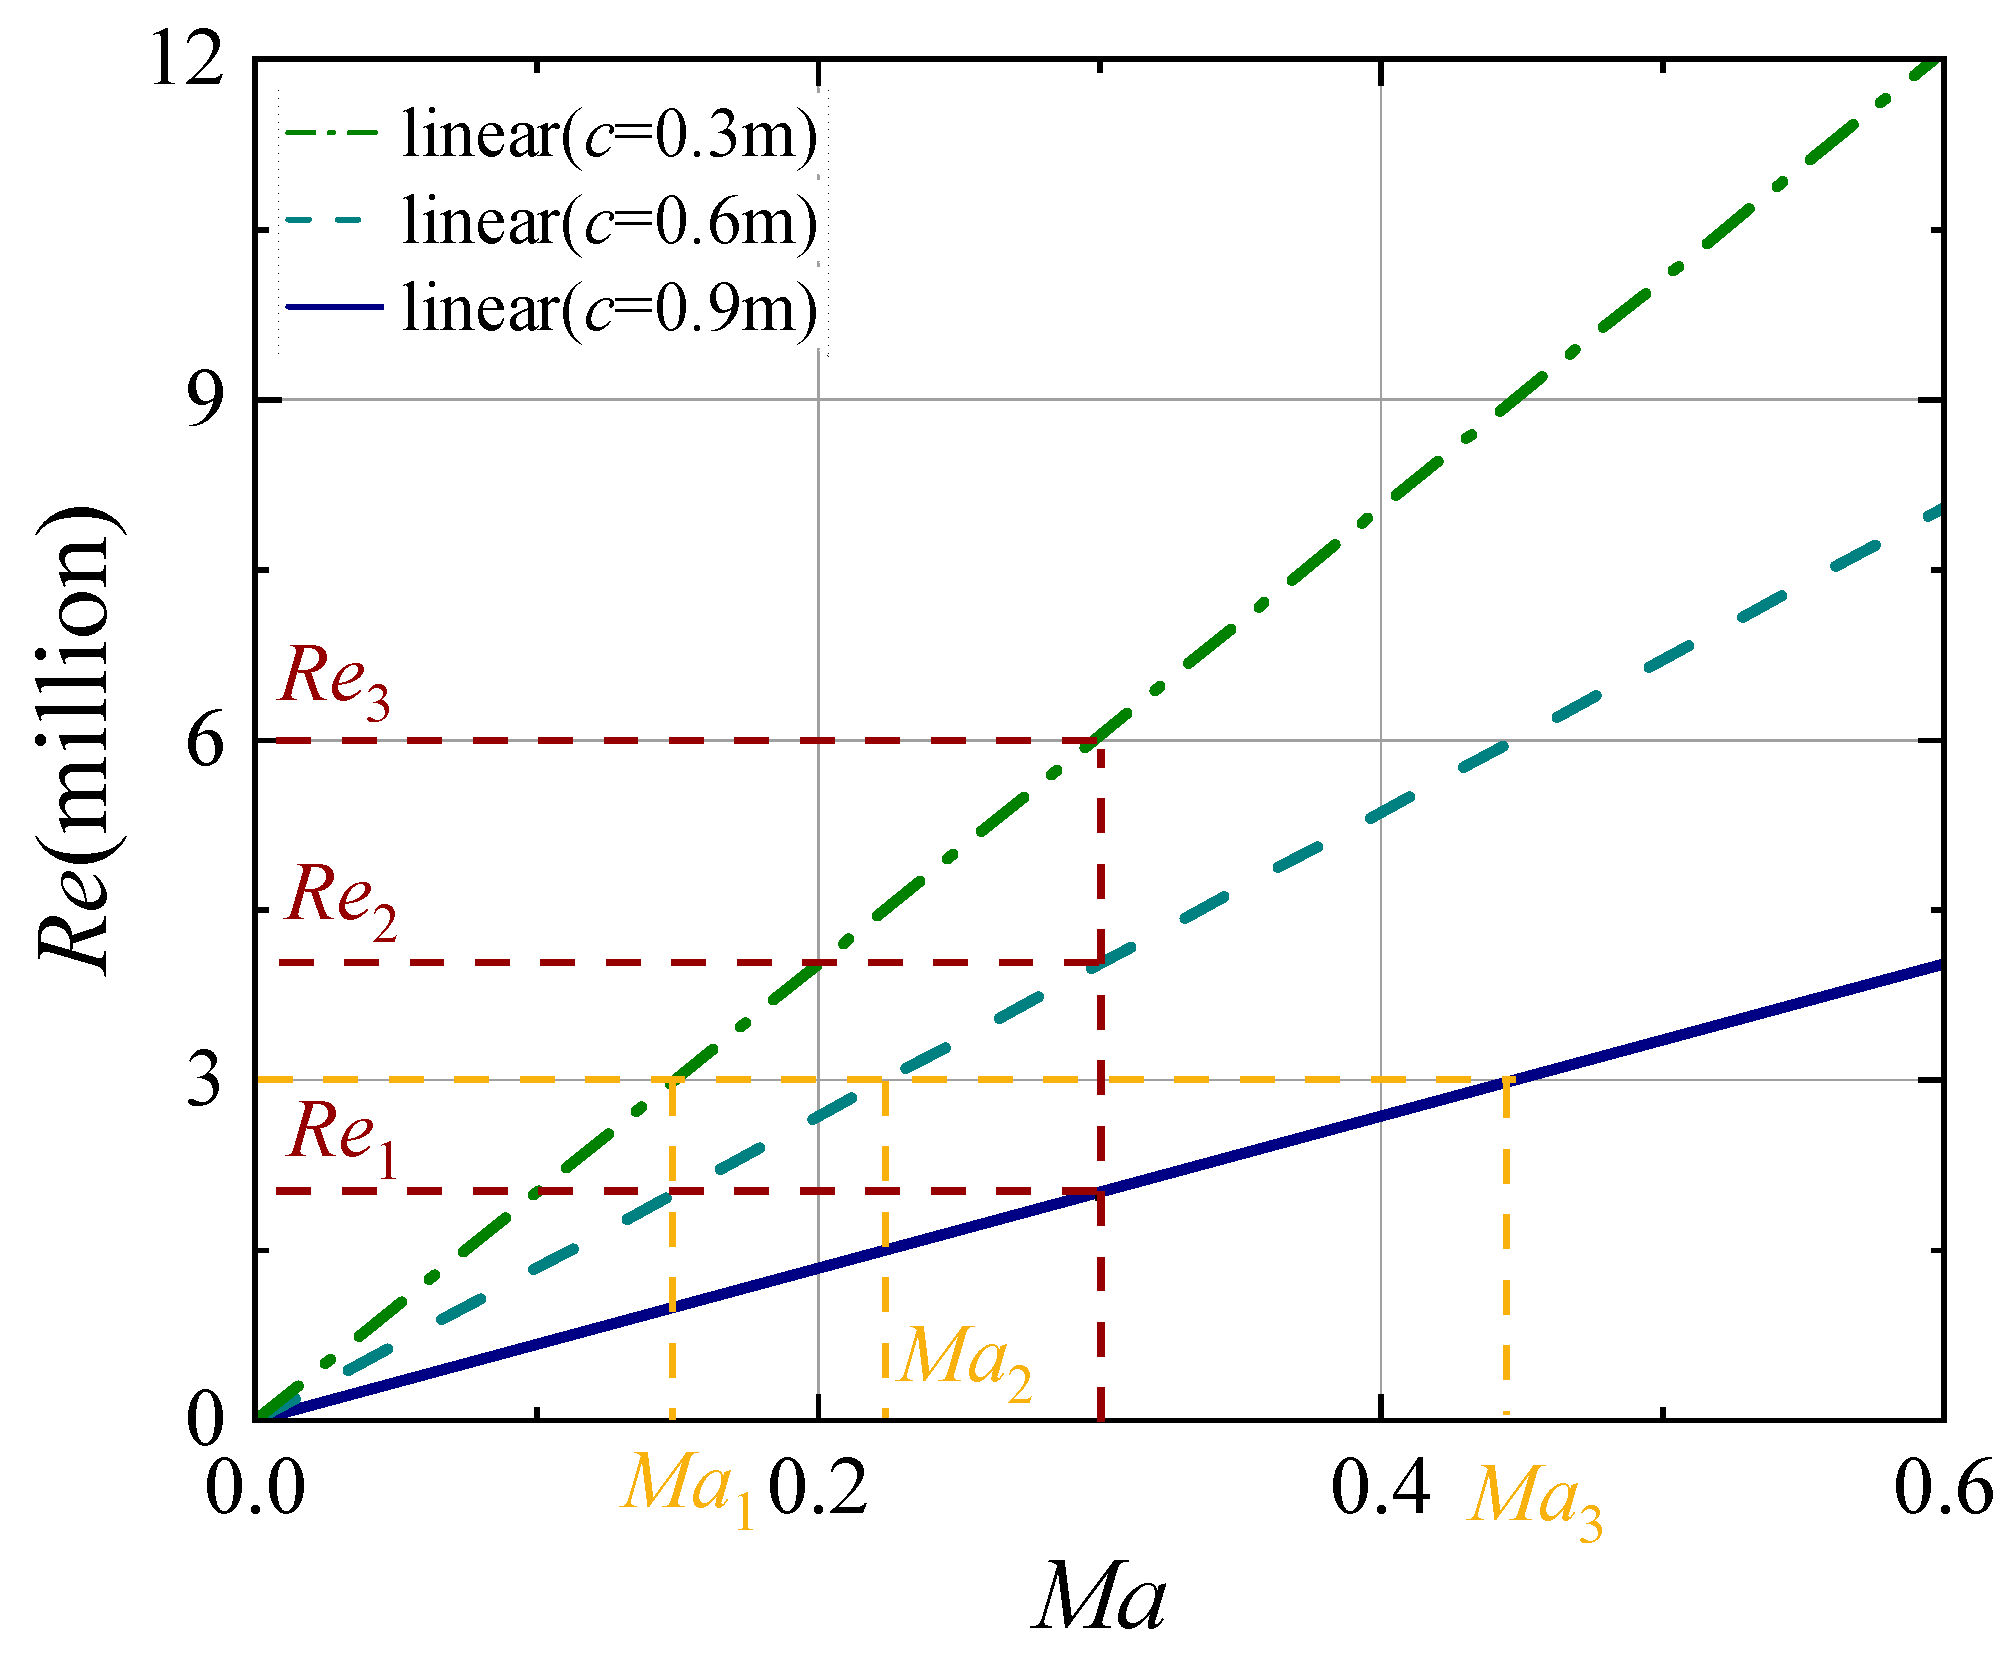
Figure 2 shows that the Reynolds number and Mach number are linearly connected under fixed dimensions, which means that as wind speed increases, so do both numbers. Because wind tunnel scale-down tests usually only take Reynolds similarity into account, they are unable to fully satisfy the flow similarity conditions of identical Reynolds and Mach numbers [5,11,29].
When the Mach number is ≤0.3, the influence of fluid compressibility is negligible, and the flow can be approximately treated as incompressible, with the air density set as a constant [5]. For Mach number >0.3, the fluid density varies significantly, requiring consideration of compressibility effects; thus, air density is modeled as ideal-gas, where its value changes with pressure. Additionally, to decouple the Mach number and Reynolds number, this study primarily adjusts the airfoil chord length, setting the freestream velocity as a multiple of the Mach number [31,32]. For investigating the Reynolds number effect, the inflow velocity is maintained to keep the Mach number constant, and the Reynolds number is altered by modifying the chord length. When examining the effect of the Mach number, the freestream velocity is varied, while the Reynolds number is kept constant by adjusting the airfoil chord length [33].
Therefore, the purpose of this study is to further uncover the mechanism of the coupled interaction between high Reynolds number and compressibility effects using a single similarity criterion:
R e = ρ a c μ M a

3. Numerical Modeling of Airfoil Static Stall

This study uses the FFA-W3-211 airfoil as the benchmark for our study. It is utilized at the blade tip position of both the IEA 15MW and IEA 22MW wind turbines. This airfoil is used at the tip of the IEA 15MW and IEA 22MW wind turbine blades, specifically from 77% to 100% of the blade span for the 15MW and from over 90% to 100% for the 22MW. This airfoil is chosen due to its high aerodynamic efficiency, characterized by a favorable lift-to-drag ratio, which is critical for maintaining performance at high Reynolds numbers and low Mach numbers [34]. Its design helps mitigate the effects of compressibility at the blade tips, where airflow velocities are highest, thereby reducing drag and improving overall turbine efficiency [35,36].
In this study, ANSYS/FLUENT solver is used to perform numerical simulations. It is a widely validated transition-aware turbulence model that integrates the γ-Reθ transition correction to capture the onset and development of turbulence [34,35].
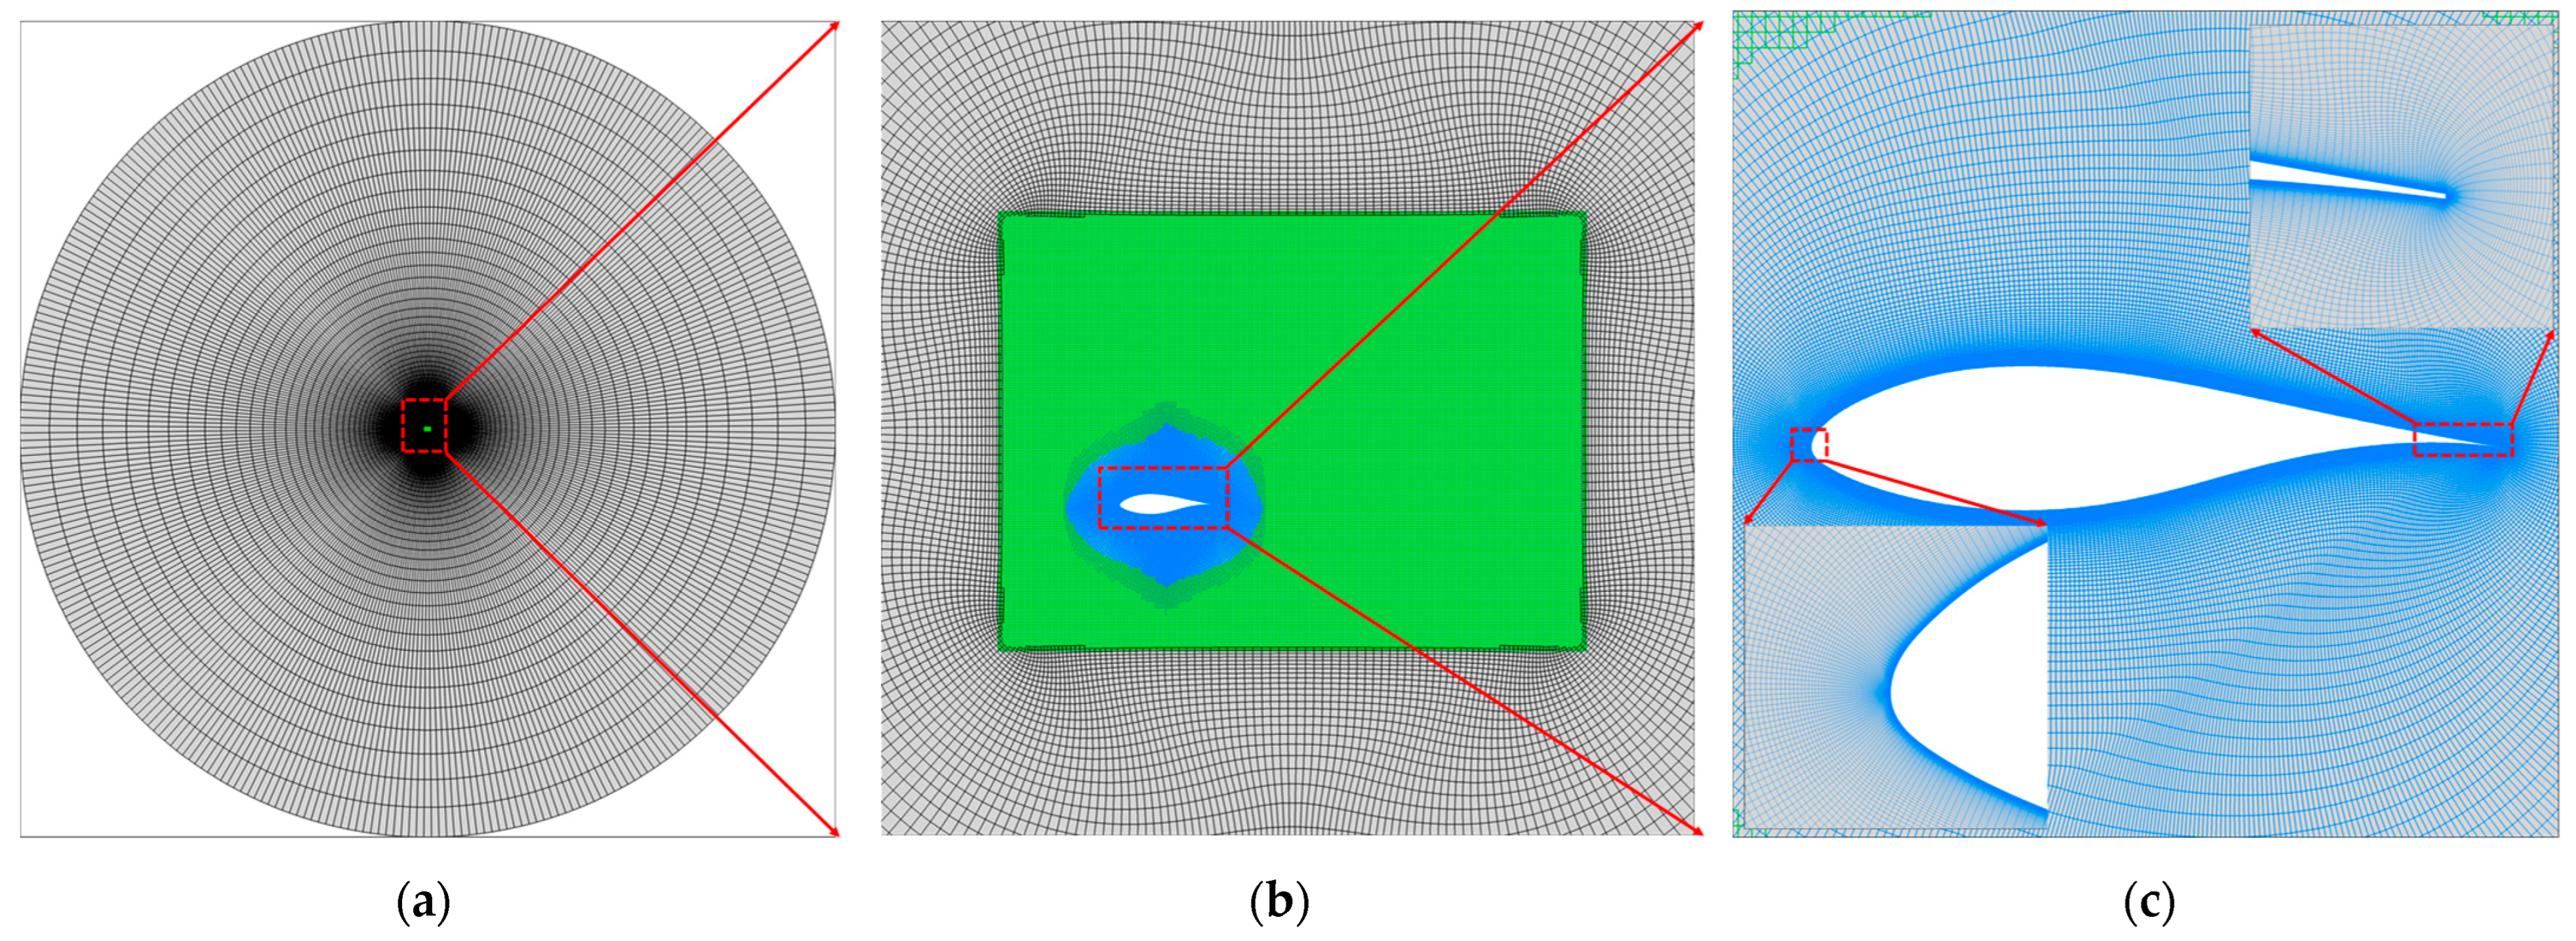
Figure 3 illustrates the structure of the overset grid, which in this study consists of one background grid and two component grids. The overset grid technique greatly reduces the difficulty involved in producing grids for the whole flow field domain while allowing independent computation of grids in various locations, guaranteeing the continuity of the flow field during calculations [20]. The intersection areas between the background grid and component grids are handled through “hole-cutting” and interpolation to achieve nesting.
The outer part of the background grid adopts an O-type grid, with the computational domain radius set to 300 times the chord length c. The inlet boundary condition is specified as a velocity inlet, the outlet as a pressure outlet, and the wall conditions as no-slip and no-penetration. A refined grid region, defined as a rectangular area of 6 c × 4.5 c, is implemented. Both the upper and lower airfoil surfaces are discretized with 250 nodes each along the line grids, with 5 nodes allocated at the trailing edge; local refinement is applied to both the leading and trailing edges. The grid outside the airfoil covers a circular region with a radius of 1.35 c, where the boundary condition is set as overset grid. The initial height of the boundary layer is 2 × 10⁻⁶, with a growth rate of 1.05, ensuring y+ < 1 [37,38]. The total number of grid nodes and cells is 186,600 and 185,430, respectively.
Table 1 shows the solver settings. The turbulence model employed is the Menter’s Transition SST k-ω model [19], which enables a more accurate description of the flow state during the transition process of the airfoil boundary layer [34,35,36]. The solution method adopts the Coupled pressure-velocity coupling approach, and the second-order upwind discretization scheme is utilized for both spatial and temporal terms [1,26].

4. Validation of Numerical Modeling

The S809 and Vertol VR-7B airfoils are chosen for validation using the same simulation modeling and calculations as the FFA-W3-211 airfoils. The simulation values are compared with the available experimental values, using the coefficients of lift Cl, drag coefficient Cd, and pressure distribution coefficient Cp for comparison. This is performed in order to ensure the reliability of Computational Fluid Dynamics (CFD) simulations in predicting the aerodynamic characteristics of these airfoils. In experimental and numerical studies of airfoil bypass flow, the static pressure data at the airfoil surface are usually expressed in terms of the pressure coefficient Cp. In essence, the top airfoil is in a suction condition (Cp < 0), whereas the bottom airfoil is in a pressure state (Cp > 0). The stationary point is then the lower airfoil against the leading edge (Cp = 1). The lift drag characteristics of the S809 airfoil derived from numerical simulations and wind tunnel experiments are contrasted in Figure 4 [22]. The computational Cl agrees well with the actual value prior to the highest point but diverges rapidly following stall (Figure 4a). Cd also follows the same pattern (Figure 4b).
Figure 4 also indicates significant predictions of aerodynamic coefficients at high angles of attack (α > 20°) due to massive flow separation. For α = 24°, RANS yields Cl = 0.614 (20.3% below experimental 0.77) and Cd = 0.346 (19.5% below experimental 0.43). Figure 4 further indicates close agreement at moderate α (α = 16.2°: Cl = 1.019 vs. 1.01, Cd = 0.087 vs. 0.088; errors < 1.1%). This confirms RANS reliability for attached flows, but limitations in deep stall regimes where unsteady vortex shedding dominates.
The pressure distributions determined experimentally and numerically for Re = 106, Ma < 0.3, and α = 15.2° are contrasted in Figure 4c. The overall strong agreement between RANS predictions and actual results shows that the numerical simulation can accurately assess how flow configurations affect the airfoil’s local aerodynamic forces [39].
The lift drag properties of the Vertol VR-7B airfoil derived from numerical simulations and wind tunnel experiments are contrasted in Figure 5. Up until it reaches Cl,max, the computationally determined Cl matches well with the experimental data, but the inaccuracy quickly increases after stalling (Figure 5a). Compared to the experiment, the numerical simulation’s stall characteristics are more severe. Because the RANS-predicted Cd encompasses both pressure drag and friction drag, whereas the experimental Cd only contains pressure drag, so the computed value is somewhat larger than the experimental value (Figure 5b). In the pressure distribution plots of numerical simulation and experimental observations for Re = 4.05 × 10⁶, Ma = 0.3, and α = 12.5°, the RANS predicted values are essentially identical to the experimental values (Figure 5c). As a result, the RANS numerical simulation of steady flow around airfoils in this work is entirely trustworthy.

5. Clarification of Numerical Uncertainty

5.1. Verification of Grid Independence

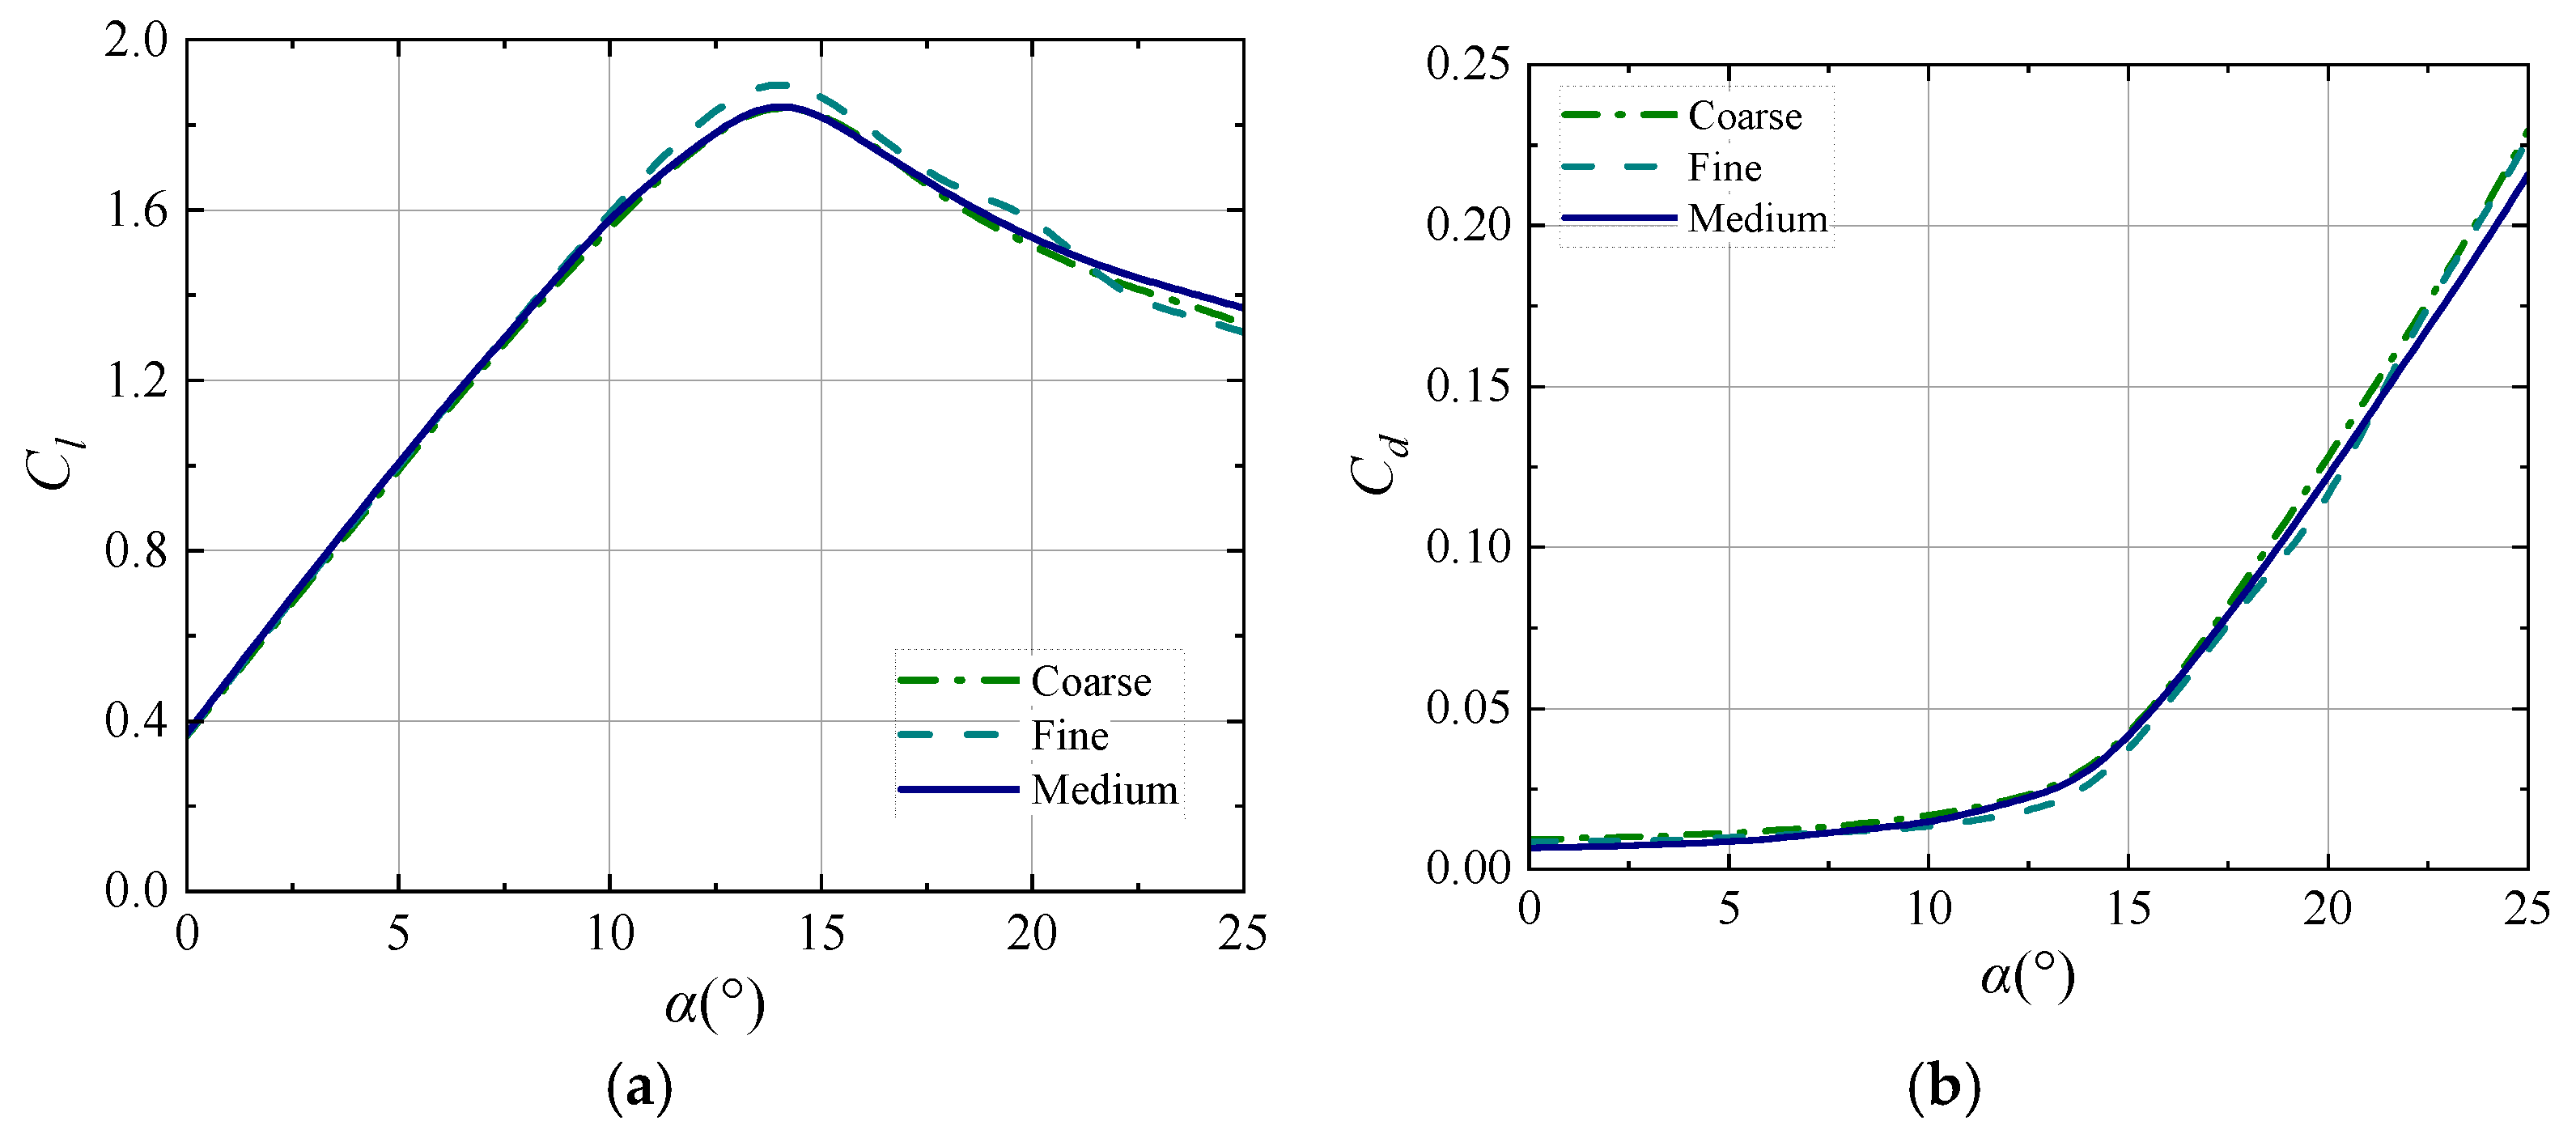
To confirm that the numerical results are unaffected by the mesh used in the simulation, we created three different meshes. Table 2 shows the mesh parameters for the three distinct meshes. By changing the number of line meshes spread across the upper and lower wing surfaces as well as the boundary layer’s development rate, we were able to produce variations in mesh density. The mesh sizes are about 144,994, 185,430 and 327,836 from coarse to fine.
Figure 6 shows the lift and drag coefficient curve for the FFA-W3-211 airfoil at a Mach number of 0.3 and a Reynolds number of ten million. There is good consistency in the lift drag coefficient curves that were computed using the three meshes. The three curves are nearly perfectly overlaid before stall. The differences between them continue to be negligible after stall.

5.2. Turbulence Model Sensitivity

The Menter’s Transition SST k-ω model was selected for its proven accuracy and reliability in predicting boundary layer transition and flow separation in wind turbine airfoils. Numerous studies have validated the effectiveness of this model. For instance, Qian et al. (2023) demonstrated that Menter’s Transition SST k-ω model accurately captured the flow control effects on a thick wind turbine airfoil using deformable trailing edge flaps [23]. Gharali and Johnson (2012) also showed that this model provided reliable predictions of dynamic stall, erosion, and high reduced frequencies for an S809 airfoil [22]. These validations confirm the suitability of our turbulence model choice for the present study [22,23,34,35,36].

5.3. Numerical Error

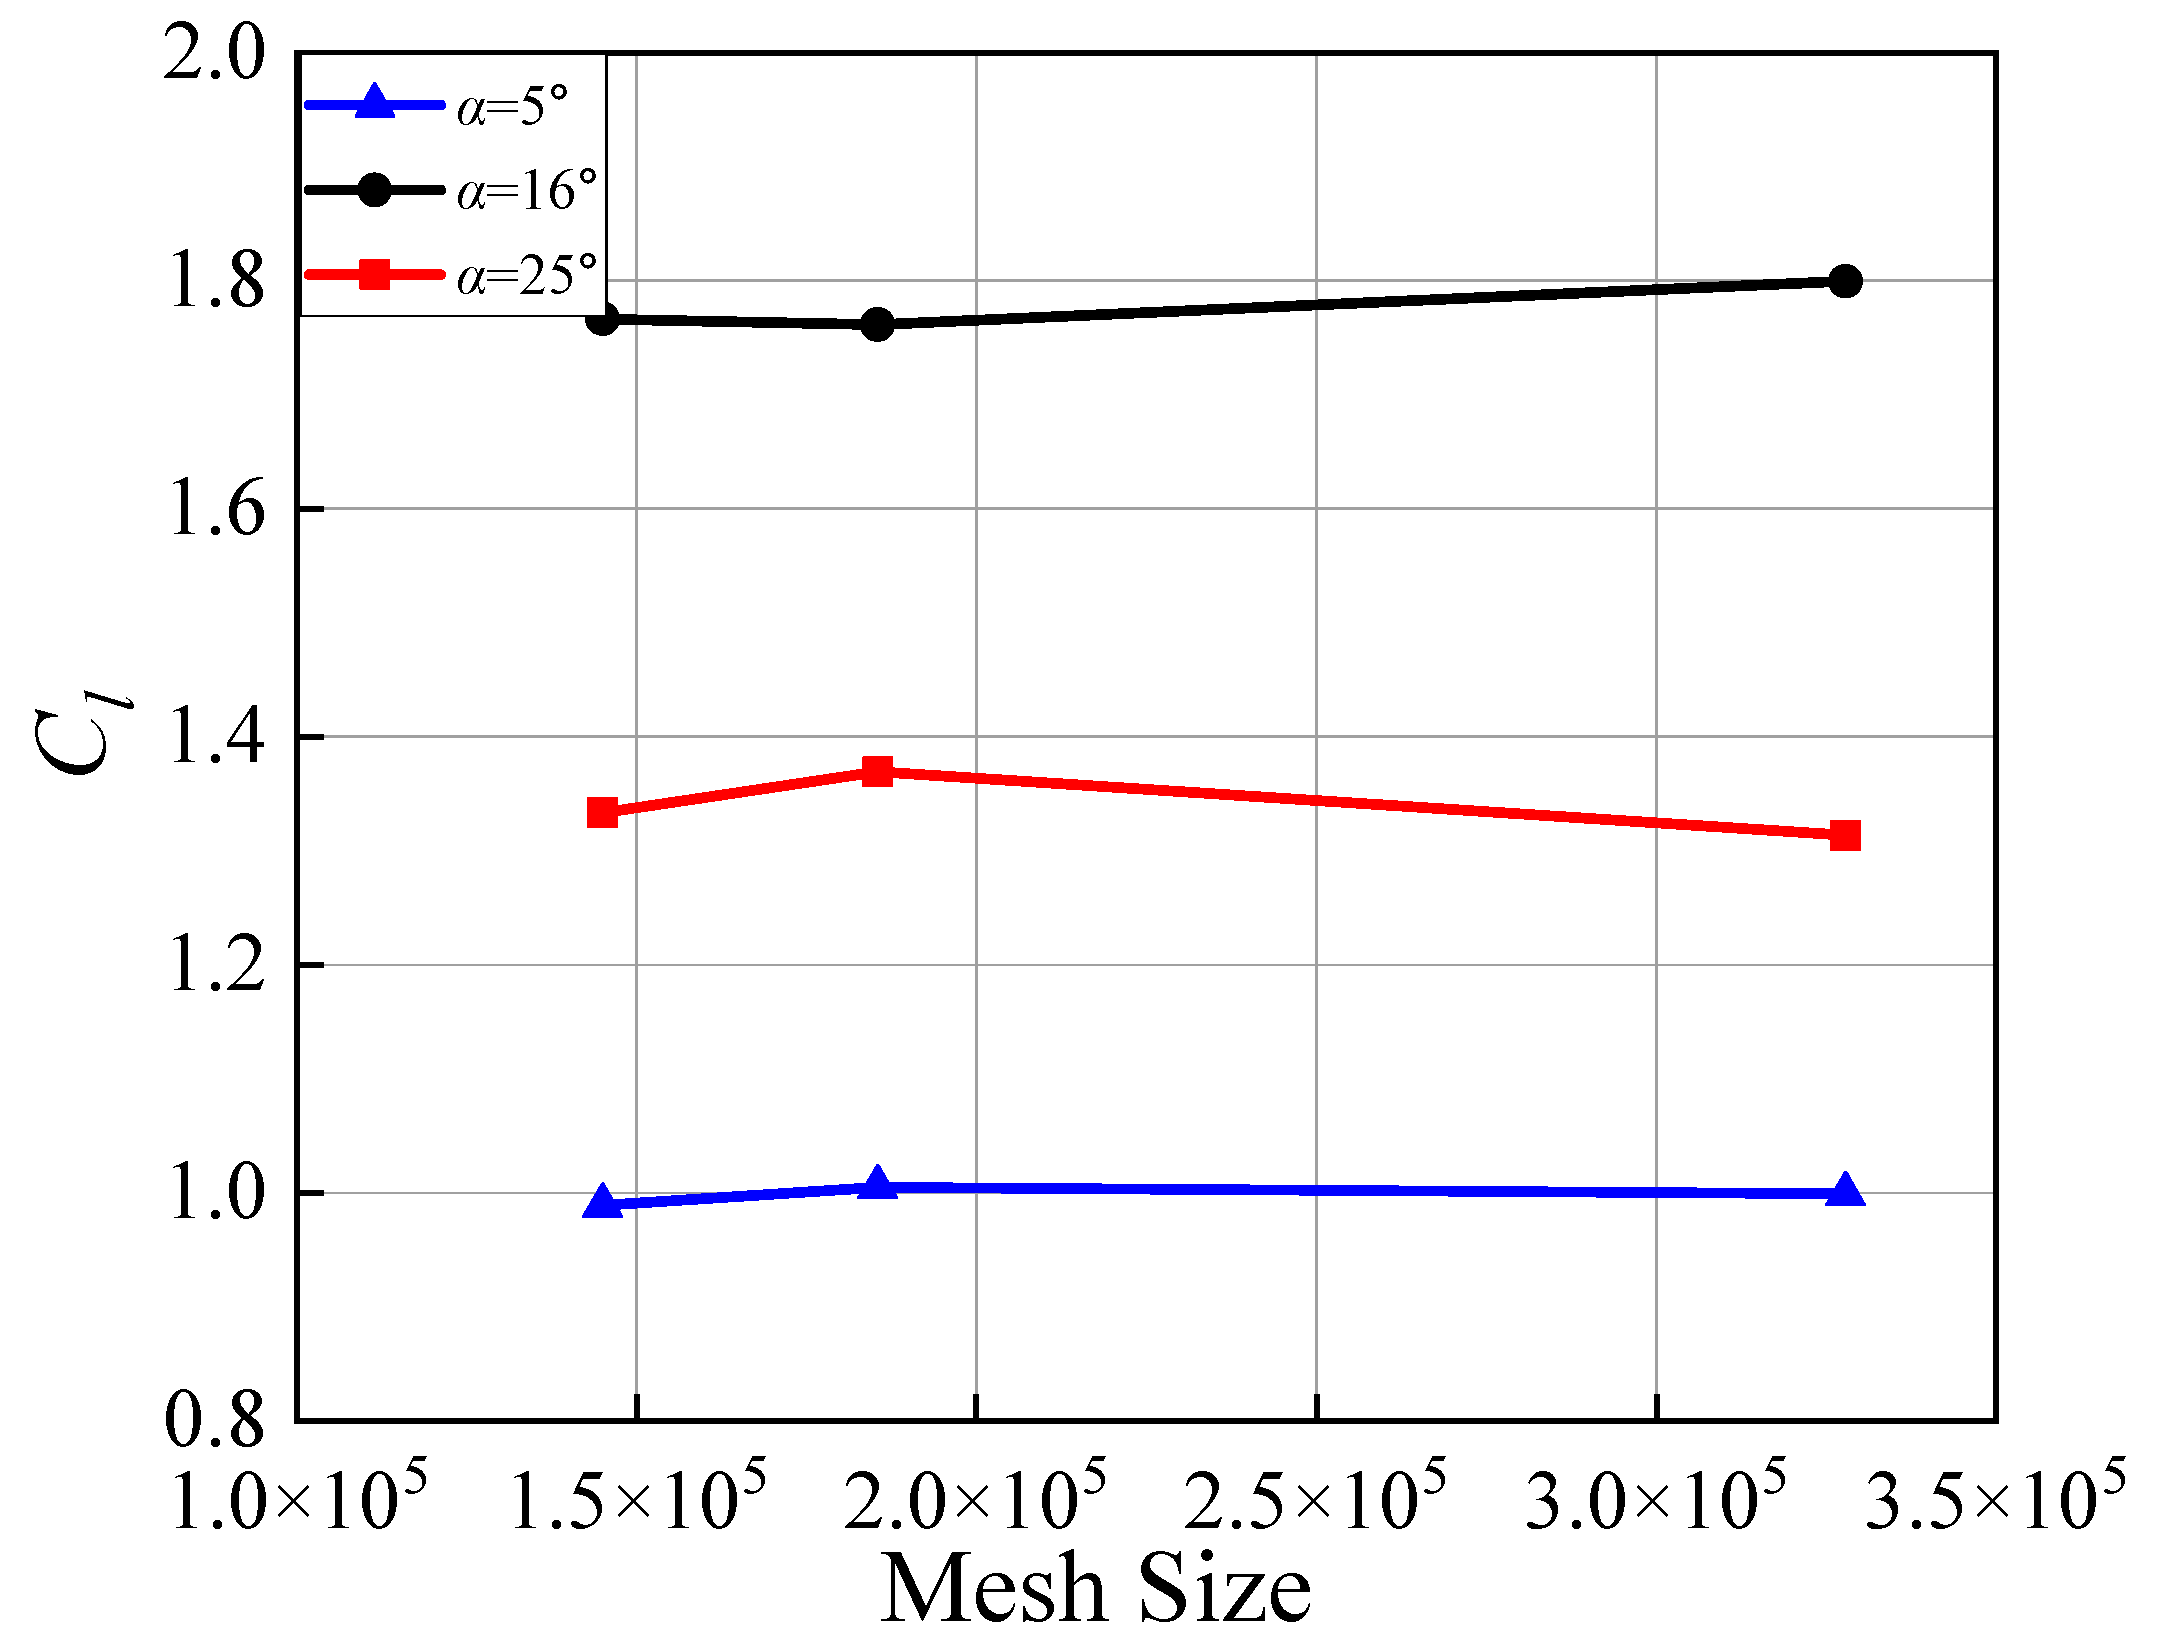
To quantify the numerical errors associated with the mesh density, a detailed analysis was performed on the FFA-W3-211 airfoil, focusing on the lift coefficients at angles of attack of 5°, 16°, and 25° across different mesh densities (coarse, medium, and fine).
Figure 7 shows how the lift coefficients change with mesh size at different angles of attack. The results indicate that the numerical errors are within acceptable limits for all angles of attack. For instance, at 5° angle of attack, the relative error of the medium mesh is only 0.61%, which is much lower than the 1.01% error of the coarse mesh. All errors are kept below 4.2%. This shows that the medium mesh can provide reliable results with low numerical uncertainty. It also ensures the robustness and efficiency of our numerical simulations.

6. High Re-Turbulent Separation Control Delays Static Stall

6.1. Static Stall Behaviors

Profile drag is a common term used to describe the drag force acting on an airfoil in the airflow. Pressure drag and skin friction drag are the two parts that make up profile drag [6,19]. Whereas the boundary layer state mostly affects friction drag, the adverse pressure gradient surrounding the airfoil primarily affects pressure drag.
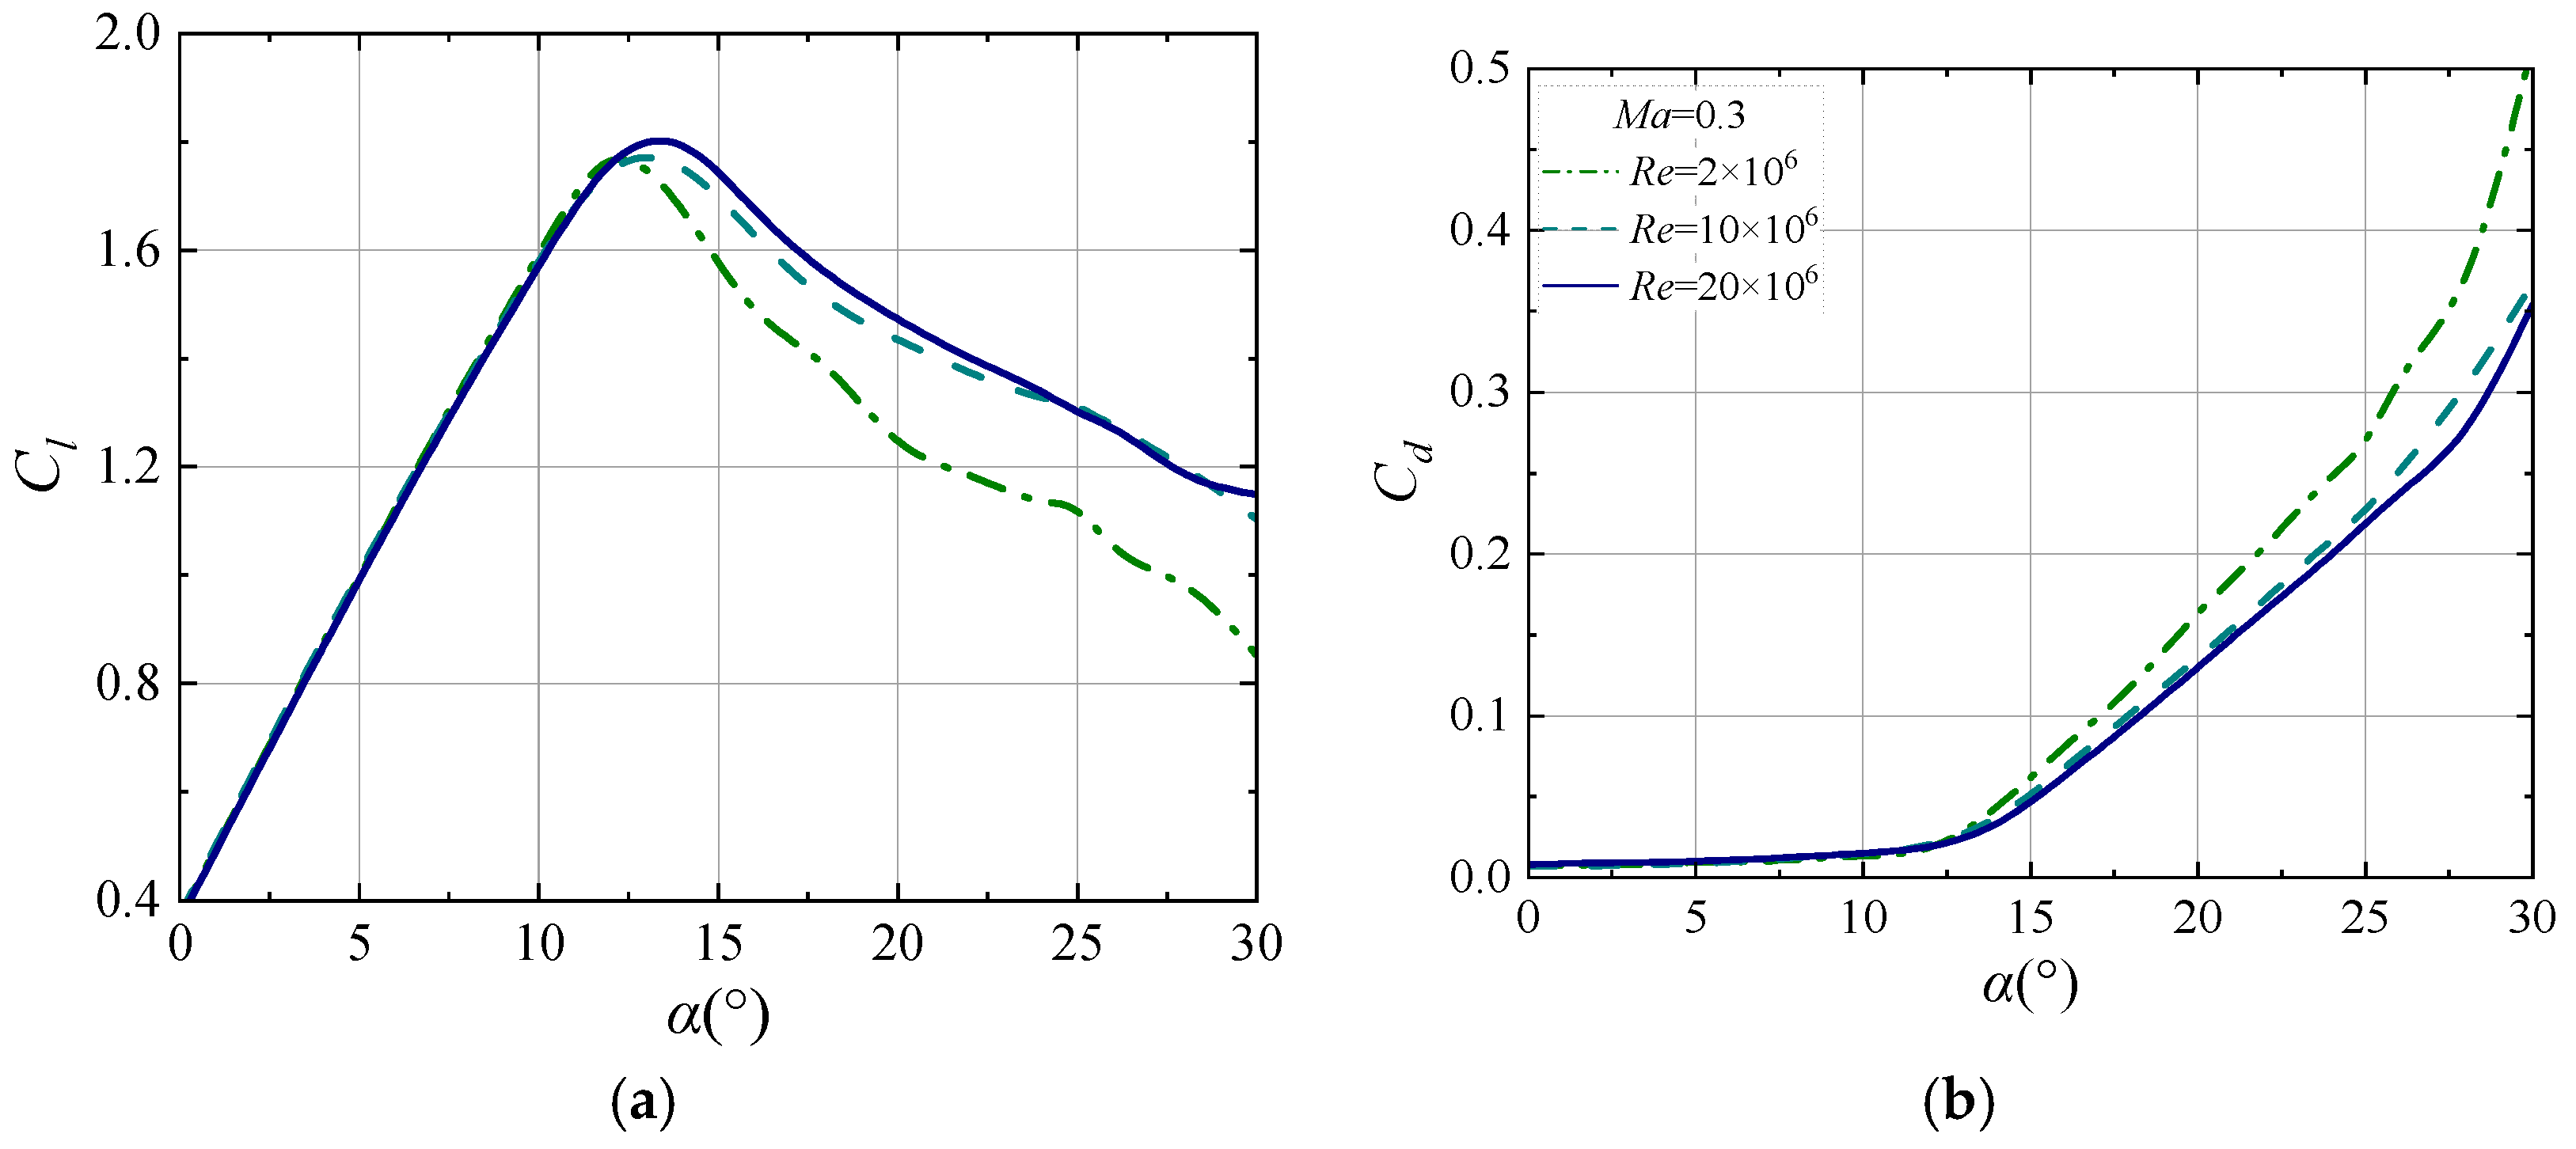
Figure 8 shows the lift drag of the FFA-W3-211 wind turbine airfoil. The airflow surrounding the airfoil is fully connected when 0 < α < 12°, so the lift coefficient has a linear relationship with the angle of attack [11].
Table 3 shows that for Ma = 0.3, the slopes of the linear segments of the three variable Reynolds number curves are 0.118, 0.1159, and 0.1172 (in the degree system). These values are consistent with the lift curve slope derived from the thin-wing theory through potential-flow modeling and linearization processes [4]. In particular, the theoretical lift coefficient slope is 2π in radian units, equivalent to 0.1097 per degree [5]. The agreement between the computed and theoretical slopes stems from the solver configuration of the model, which aligns with the key assumptions of the thin-wing theory—namely, a two-dimensional airfoil, incompressible inflow, and small angle of attack.
Figure 8 also indicates Cl and Cd enter the nonlinear section, the airfoil flow separation appears, and the pressure drag takes over in the profile drag when 12 < α < 30°. Cl sharply drops and Cd sharply rises when α > 12°, causing the airfoil separation region to rapidly expand and lift stall. The figure shows that when the Reynolds number is a single variable, the lift coefficient of the separation section under the same angle of attack remains high as the Reynolds number increases, whereas the drag coefficient is the opposite.
At high Reynolds numbers, inertial forces dominate over viscous forces, leading to increased flow instability and the emergence of chaotic turbulent structures [19]. At high Re, the vortices are stretched and split into smaller-scale vortices, creating a chaotic structure of turbulence from the perspective of the energy level string. Conversely, the viscous forces cannot stop the formation of large-scale vortices since they only work at extremely small vortex scales, which are described as Kolmogorov scales [12,29]. In order to counteract part of the adverse pressure gradient and reduce the thickness of the boundary layer, the outer boundary layer flow injects energy into the near-wall inner flow, suppressing the flow separation and delaying the stall. This causes the fluid to change from laminar to turbulent earlier, intensifying the momentum exchange between the inner and outer boundary layer flows [11]. At the same time, a higher Reynolds number indicates a larger fluid flow velocity and a greater inertia force. Also, the pressure drag is decreased and the separation is suppressed. This results in a wider range of equivalent angles of attack, a gentler decline of lift coefficient decreases after stall, and a slower rate of drag coefficient increase.

6.2. Flow Field Development

Table 4 shows that there is a noticeable scale effect in how the Reynolds number affects the aerodynamic properties of wind turbine airfoils. At a 10° angle of attack, the airfoil’s surface friction drag coefficient rises by 14.4% when the Reynolds number rises from 2 × 10⁶ to 2 × 10⁷. This causes a 14% drop in the lift-to-drag ratio. This suggests that the friction drag effect in the linked flow progressively takes over at higher Reynolds numbers.
As the Reynolds number rises, the lift coefficient rises by 12.3% at a 16° angle of attack stall condition, the drag coefficient falls by 22.4%, and the lift-to-drag ratio dramatically improves by 45%. Changes in flow characteristics are directly correlated with this performance improvement: the separation point position moves backward by 5.1%, the separation zone height drops by 25.7%, and the boundary layer transition point moves forward from 26.9% to 0.96%, but the maximum suction coefficient’s absolute value rose by 28%.
From the standpoint of physical mechanisms, increased turbulent mixing effects are the main cause of the improvement in aerodynamic performance under high Reynolds number conditions. Inertial forces take over in the boundary layer when the Reynolds number rises over 107, which causes the flow to change from laminar to turbulent sooner. This early transition greatly increases the boundary layer’s capacity for momentum exchange, giving the fluid close to the wall greater kinetic energy to withstand the pressure gradient. This effectively delays flow separation and decreases the size of separation vortices. A larger leading-edge suction peak and a smoother pressure recovery zone are also produced by the improved turbulent mixing, which also optimizes the pressure distribution on the wing profile surface. This considerably lowers pressure drag in addition to improving lift characteristics.
Figure 9 shows the FFA-W3-211 airfoil’s pressure distribution. A significant leading-edge suction peak is created when the fluid above the stationary point quickly travels around the leading-edge point and goes through the leading-edge acceleration zone. The boundary layer flow slows down as it reaches the airfoil’s highest point in the vertical direction and runs against a significant adverse pressure gradient. The boundary layer quickly reattaches with turbulence after turning due to laminar separation bubbles about 20% c. Until the near-wall flow is unable to tolerate the backward pressure gradient because of viscous holdup, the boundary layer flow experiences greater adverse pressure gradient downstream of the turn than upstream. The boundary layer flow separates close to the trailing edge. The adverse pressure gradient at the suction surface will likewise rise noticeably as the angle of approach increases, and the trailing edge separation point will swiftly approach the leading edge. The lift stall will eventually result from the trailing edge separation zone expanding quickly at the same time.
Figure 9 also illustrates that the maximum pressure coefficient rises in tandem with the angle of attack. This is because, as the angle of attack increases, the flow acceleration effect becomes more pronounced and accelerates more quickly. According to Bernoulli’s principle, this causes the pressure to decrease more quickly, which shows up as a higher value of negative pressure and strengthens the suction force. The airfoil’s attitude in the airflow also changes when the angle of attack changes. As the angle of attack increases, the airfoil shortens its point of maximum thickness by moving from the leading edge of the point to the equivalent of its highest point of range, and the airfoil’s trailing edge increases the distance between the airfoils. The decrease in the airfoil’s acceleration area causes a more significant shift in the pressure coefficient. Closer to the leading edge, this results in a steeper curve in the figure and a more noticeable reduction in slope. Also, an earlier entry into the pressure plateau zone appears, where pressure is nearly constant and flow separation takes place.
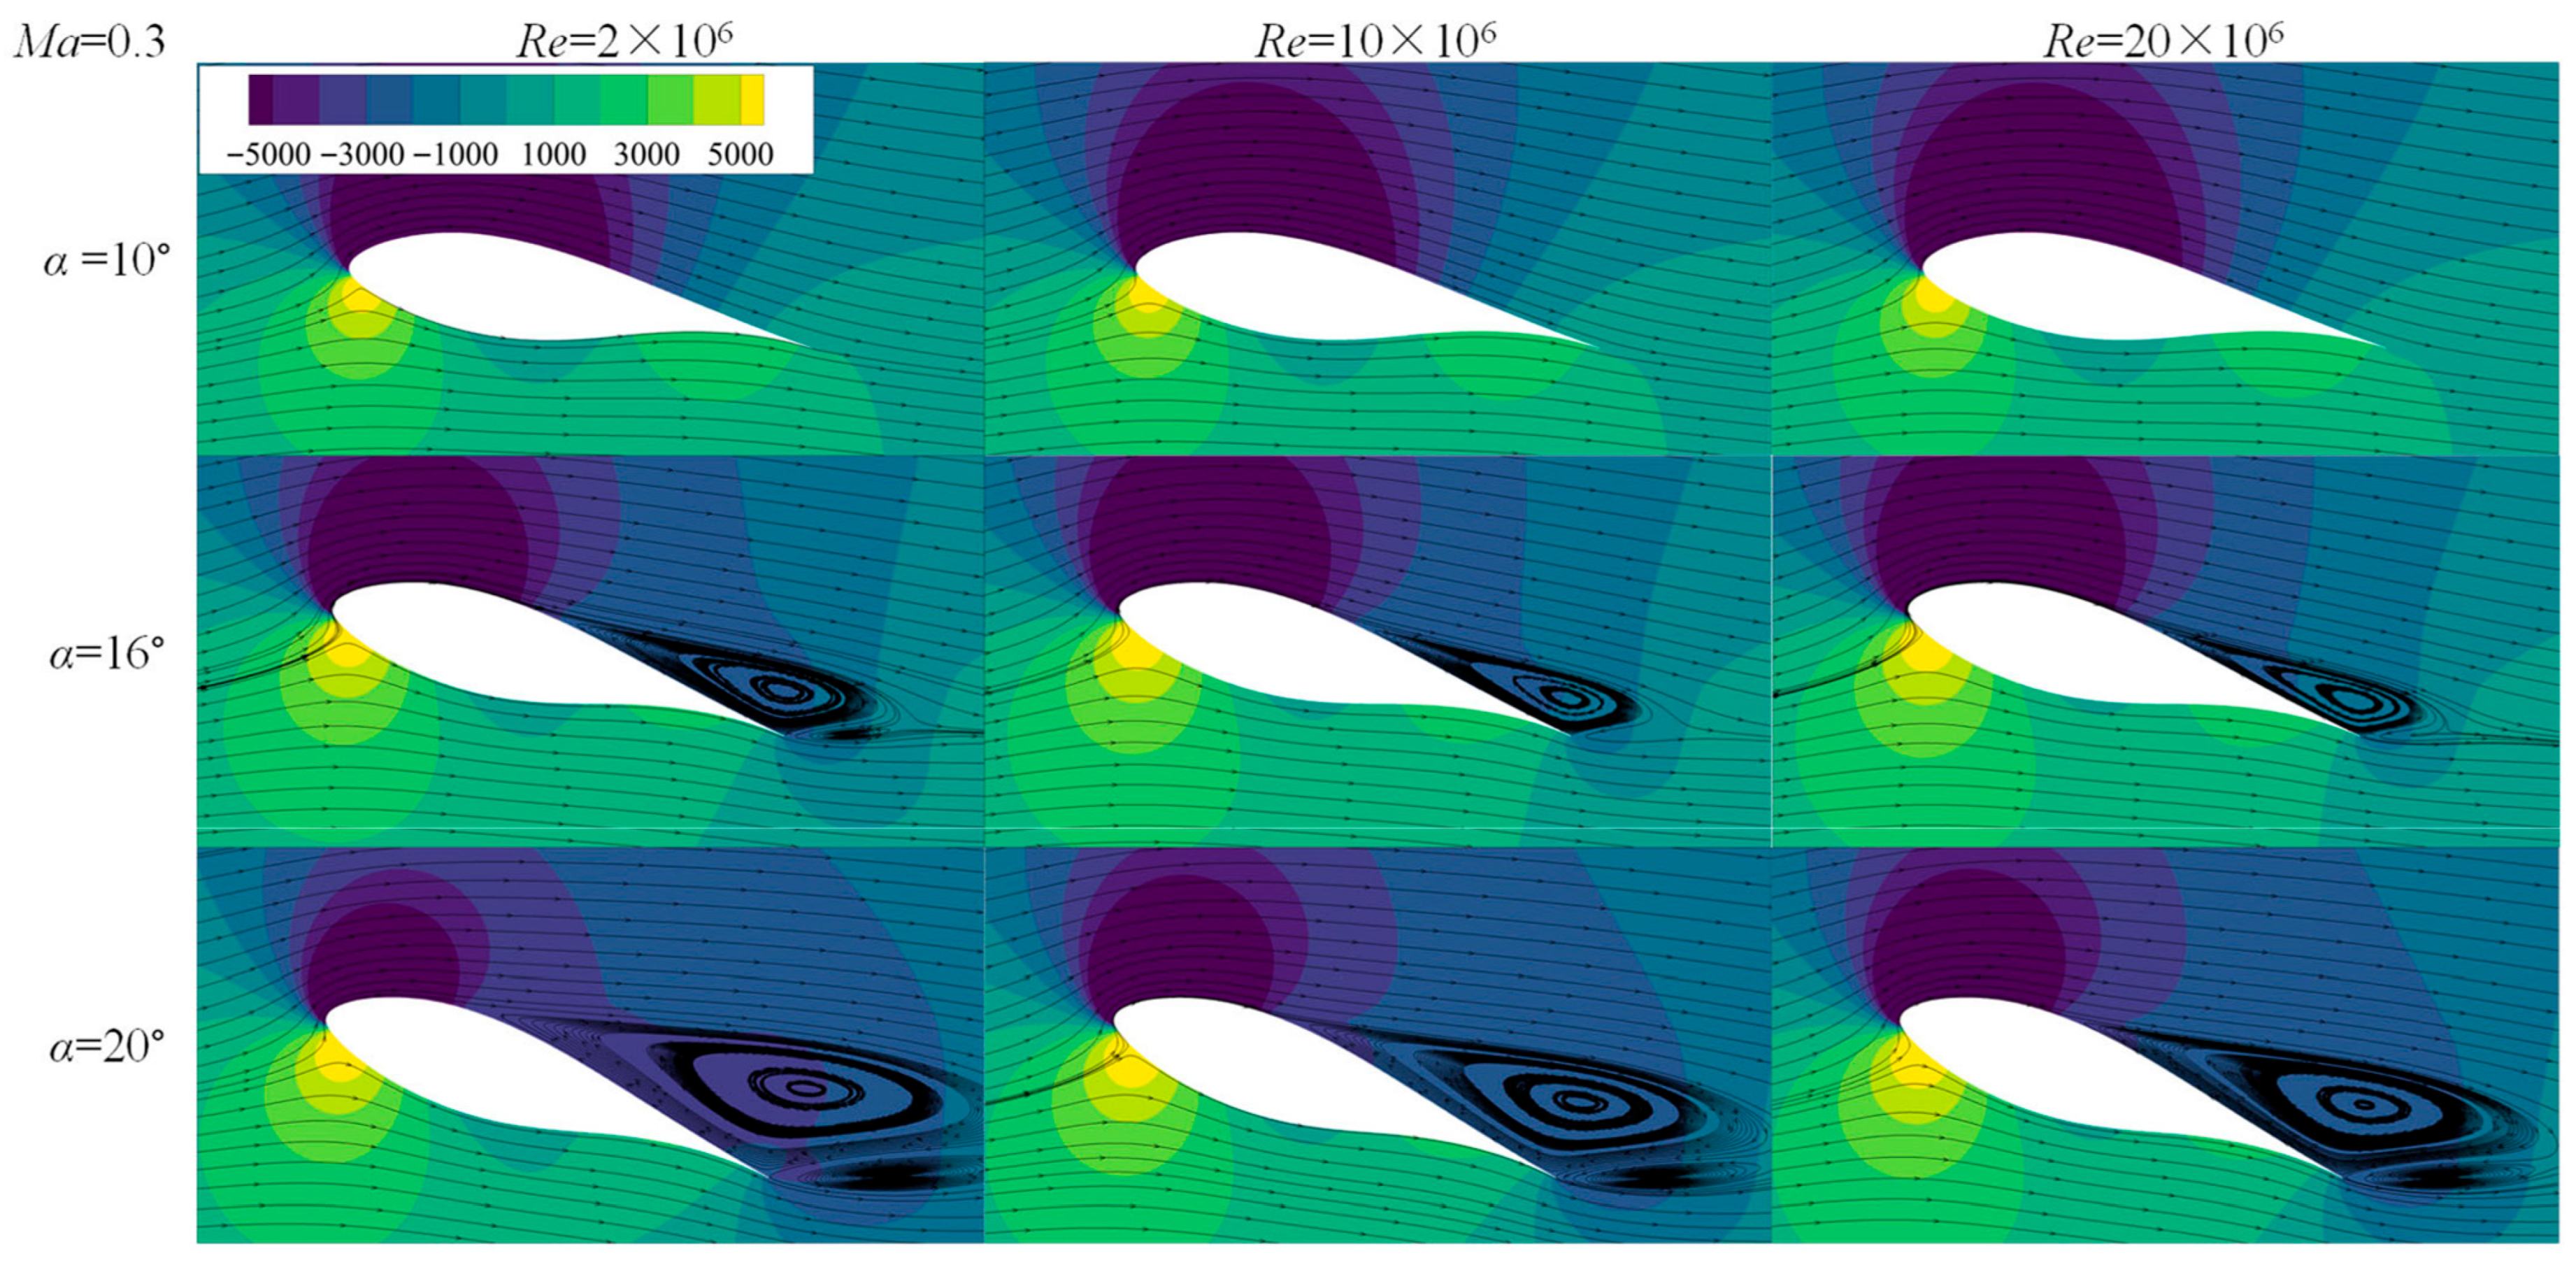
Figure 10 shows the pressure distribution and streamlines surrounding the airfoil. It is evident that the vortex shedding occurs farther downstream as the Reynolds number rises at the same angle of attack. The reason for this is that a higher Reynolds number accelerates the transition from laminar to turbulent flow, leading to a more thorough exchange of turbulent momentum, which postpones separation. At the same Reynolds number, however, the flow accelerates more quickly as the angle of attack rises, creating a greater reverse pressure gradient behind the peak. The separating vortex thus emerges at an earlier location.
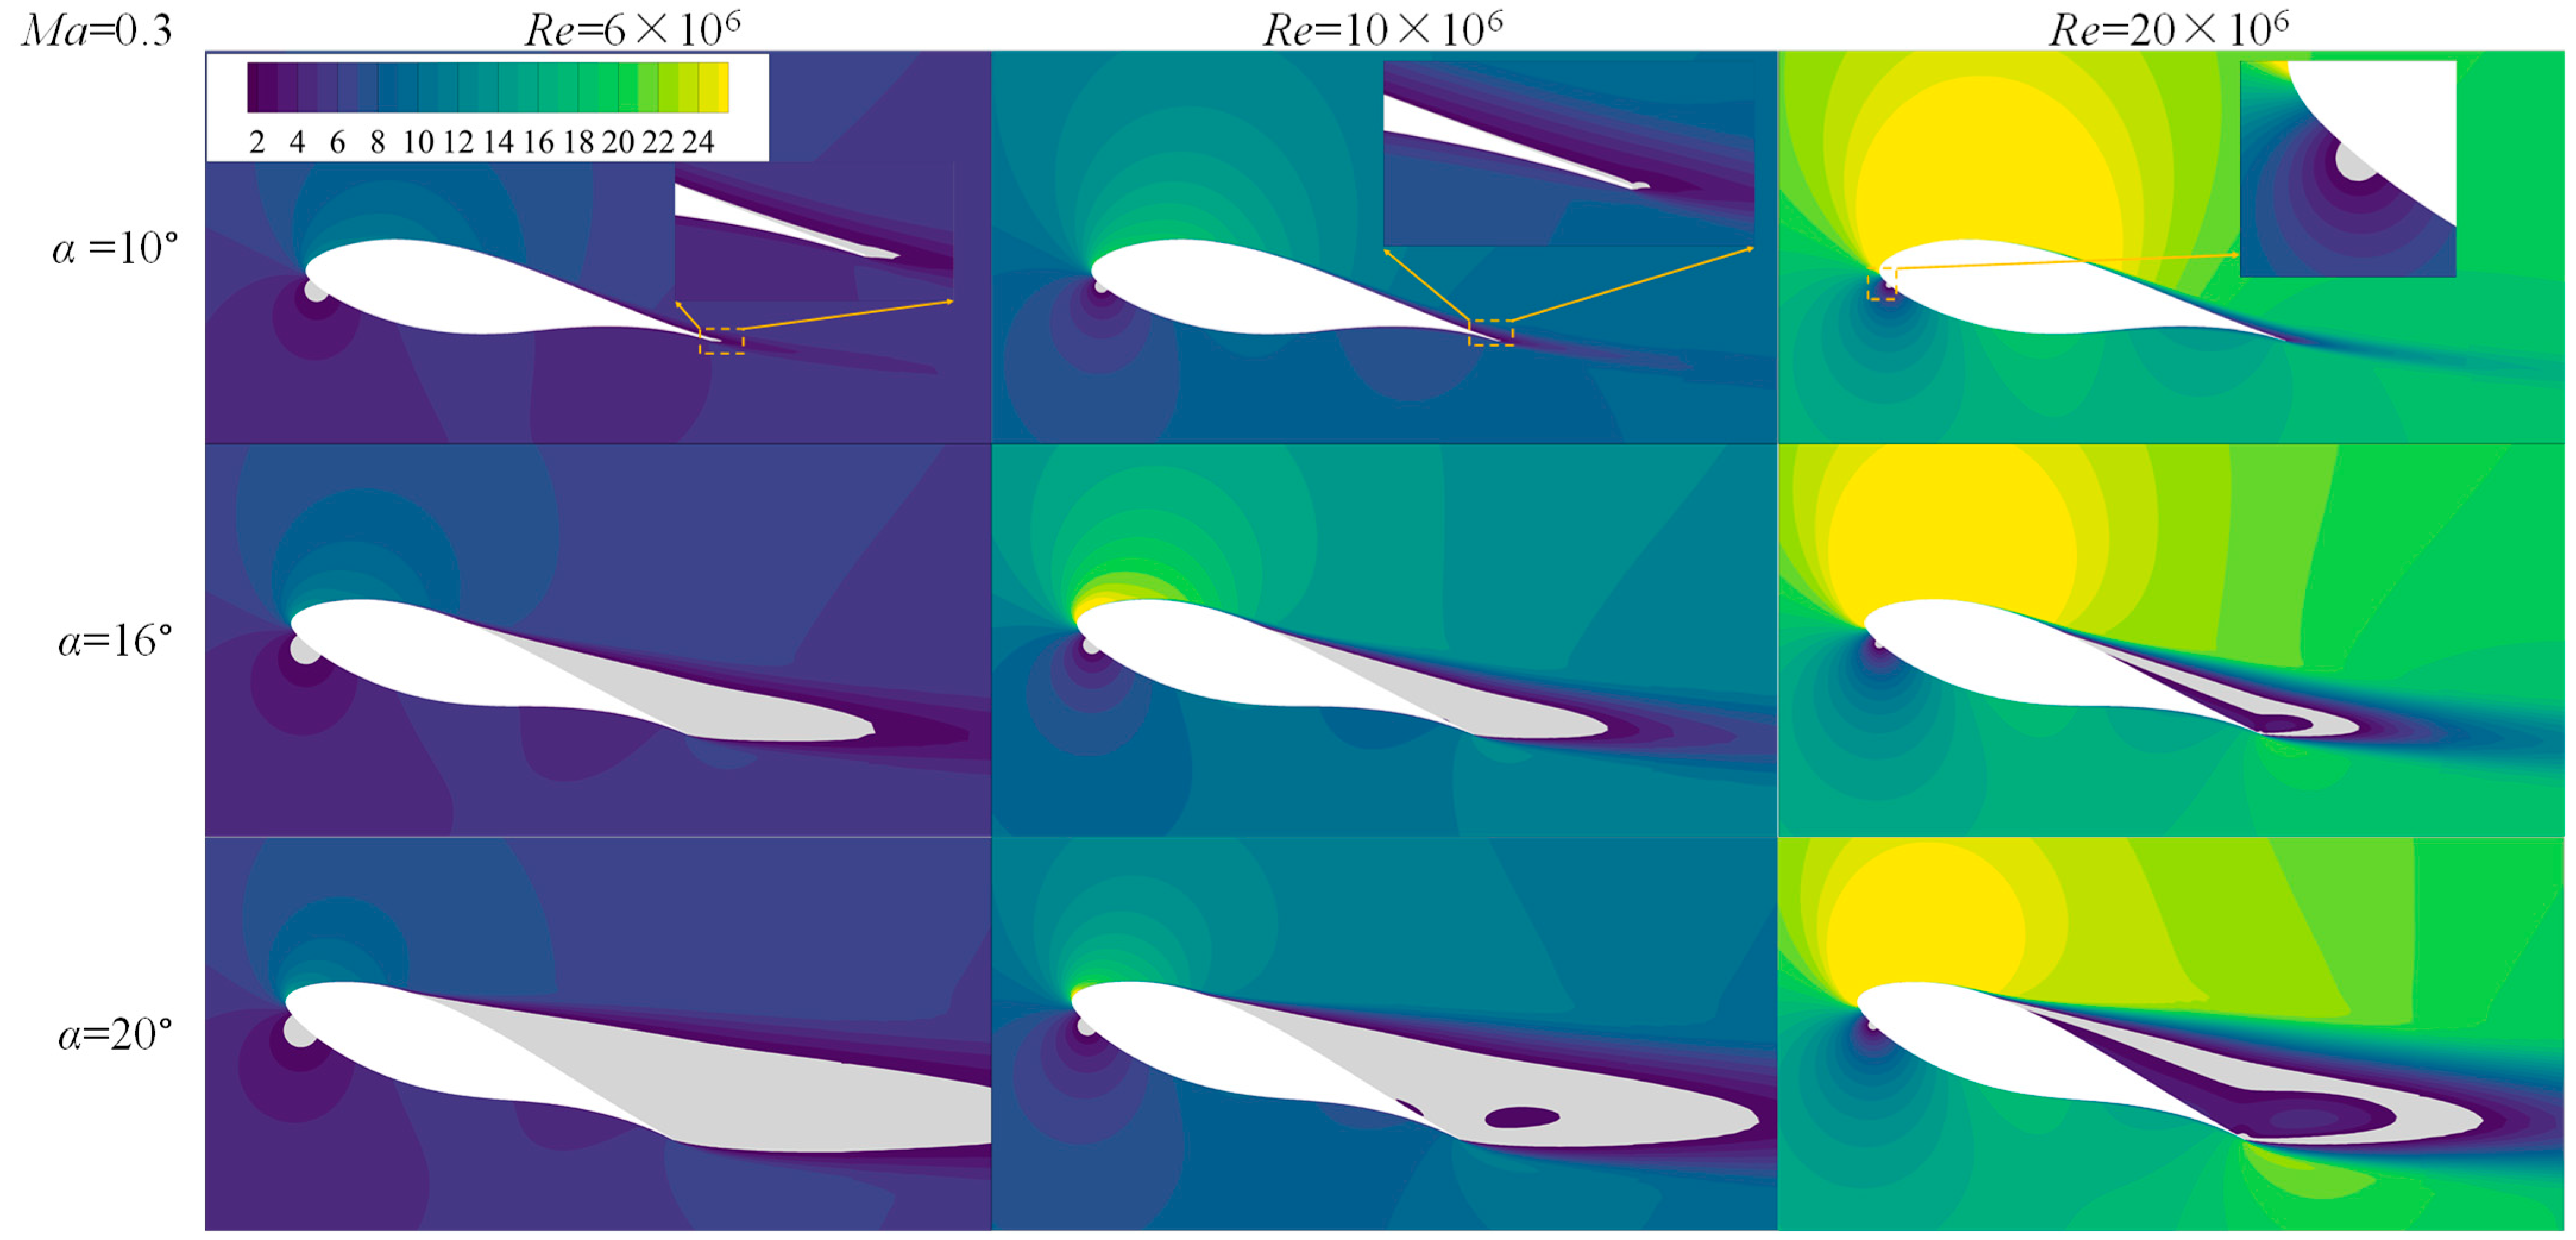
Figure 11 shows that the region from the leading edge point to the highest point, or the accelerated region, reduces as the angle of attack increases, as shown in the figure. As a result, the area of the high Reynolds number region at the front end diminishes. According to the law of conservation of mass, the 2D airfoil’s flow channel area increases and, consequently, its velocity decreases with increasing distance from the trailing edge point. The pressure will then rise, resulting in an adverse pressure gradient and separation, as is also known from Bernoulli’s theorem. An increase in the angle of attack expands the range between the airfoil’s highest point and the point at the trailing edge, or the range where the reverse pressure gradient occurs. This results in a larger area where velocity decreases, as shown in the image as an increase in the area of the low Reynolds number region, which is represented by the gray area. Even in the region of high angle of attack, that is, under the condition of easy flow separation, an increase in Reynolds number can effectively slow down the decrease in velocity, weaken the formation of the adverse pressure gradient, and ultimately delay the flow separation and stall. This is demonstrated by the fact that the range of low Reynolds number area under the natural same angle of attack decreases as the Reynolds number increases, and even a colored area higher than the gray area appears near the wall.

7. Low-Mach Shock Interaction Induces Premature Stall

7.1. Static Stall Behaviors

Table 5 shows that the slopes of the linear segments of the three variable Mach number curves for the case of Re = 10 million are in the order of 0.1139, 0.1159, and 0.1221 (degree system) with the increase in Mach number. This is because the airfoil is fully attached around the flow when 0 < α < 12°, and the lift coefficient Cl is linearly related to meet.
Figure 12 shows that when Ma = 0.5, the incompressible limit is broken, the incoming flow at low angle of attack is faster and is more strongly accelerated by the flow. The rate of increase in the lift coefficient with respect to angle of attack rises with Mach number. With an inaccuracy of only 3%, this is essentially in line with the slope of 0.1266 (degree system) determined by the formula below in the Prandtl-Glauert Correction case of Ma = 0.5.
Figure 12 also indicates that when 12 < α < 30°, the separation occurs. Cl and Cd move into the nonlinear section, and the profile drag is dominated by the pressure drag. Cl sharply drops and Cd sharply rises when α > 12°, causing the airfoil separation zone to rapidly expand and lift stall. When the Mach number is a single variable, the figure shows that the lift coefficient decreases as the Mach number increases at the same angle of attack of the separation section. In contrast, the drag coefficient exhibits the opposite trend, meaning that the higher the Mach number, the greater the drag coefficient of the separation section. This is because the local supersonic zone on the upper surface is continuously expanded as the Mach number rises [1]. A shock wave then emerges, destroying the low pressure created by the isentropic expansion of the supersonic zone prior to the shock wave. Additionally, the pressure jump that follows the shock wave creates a large adverse pressure gradient, which causes the separation point to move forward. The suction peak can cause significant damage, the lift can drop suddenly, and the boundary layer can lose kinetic energy. The high-pressure differential drag caused by the surge also causes a significant increase in the drag coefficient.

7.2. Flow Field Development

Table 6 demonstrates the substantial impact of Mach number on the FFA-W3-211 airfoil’s aerodynamic performance within the range of 0.1 to 0.5. At a 16° angle of attack, the lift coefficient of the airfoil shows a monotonically decreasing trend as the Mach number increases from 0.1 to 0.5 under fixed Reynolds number conditions of 1 × 10⁷. At the same time, the drag coefficient shows an accelerated upward trend, rising from 0.0354 to 0.0994 with an increase of 180.8%, causing the lift-to-drag ratio to drop sharply from 54.0 to 16.0, with a performance degradation of 70.4%. At greater angles of attack, this decline in aerodynamic performance is much more noticeable. The lift coefficient falls by 28.2% at a 20° angle of attack, the drag coefficient rises by 114.1%, and the lift-to-drag ratio falls by 66.3%, from 17.8 to 6.0.
A thorough examination of the flow field properties shows that the flow structure on the wing surface is drastically changed by an increase in Mach number. Local supersonic regions start to form on the top wing surface when the Mach number rises over 0.3, and a clear shock wave structure appears at Ma = 0.5. As the angle of attack increases, the shock wave’s position moves forward, reaching the 23.5% chord length position at 20° angle of attack. At an angle of attack of 16°, the separation point shifts significantly from 68.1% of the chord length at Ma = 0.1 to 40.5% of the chord length at Ma = 0.5, with a shift amplitude of 40.5%; the absolute value of the maximum lift coefficient weakens from 6.90 to 4.16, a decrease of 39.7%. Additionally, the relative height of the separation zone expands from 5.61% to 21.11%, a 276% increase. The fundamental cause of the decline in aerodynamic properties is directly explained by these quantitative changes in flow characteristics.
Figure 13 shows that from the pressure distribution, the earlier the flow separation happens, the farther forward the pressure plateau appears as the angle of attack grows. The surge is shown by the point at which the pressure coefficient seems to plummet. Because of isentropic flow, the pressure in the area following the surge rises sharply, creating a high backward pressure gradient.
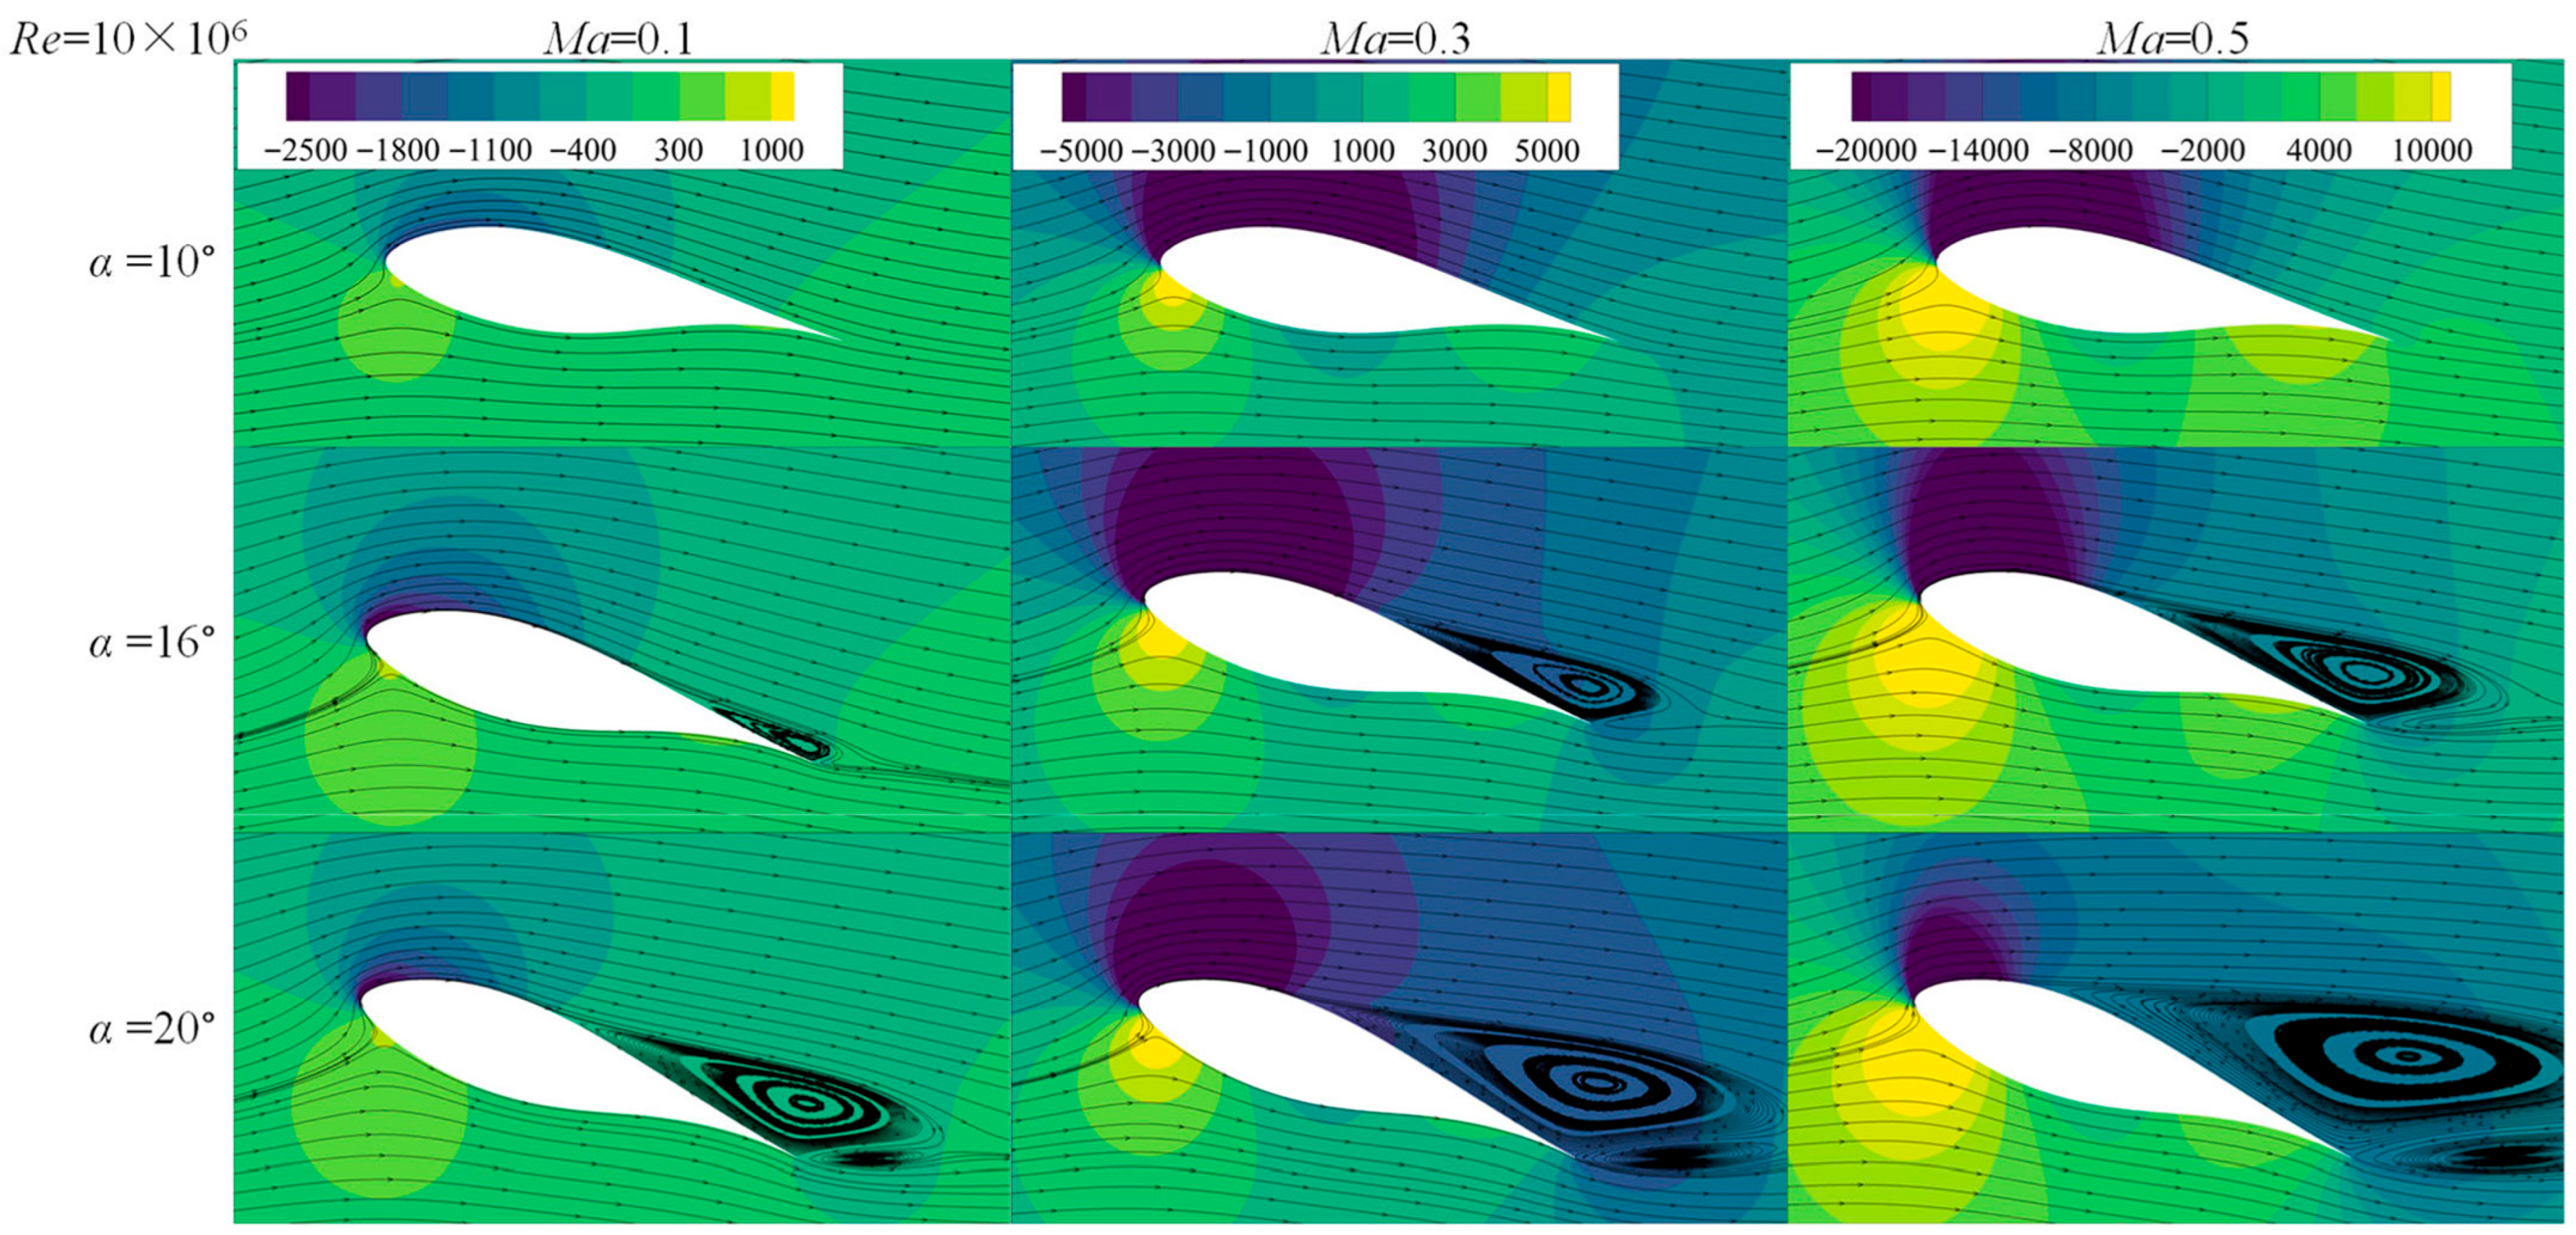
Figure 14 shows the airfoil’s streamlines and pressure distribution. It is evident that the separation vortex occurs earlier and earlier at the same angle of attack as the Mach number rises. This is due to the fact that a greater Mach number causes the solver’s inflow velocity to increase, which causes the velocity to drop more sharply after reaching its peak. As a result, separation happens early, and the separation vortex forms sooner due to a stronger reverse pressure gradient. The separation vortex’s position at the same Mach number, which happens earlier as the angle of attack increases, follows the same logic. A greater pressure gradient forms behind the peak as a result of the flow being accelerated more quickly by a larger angle of attack.
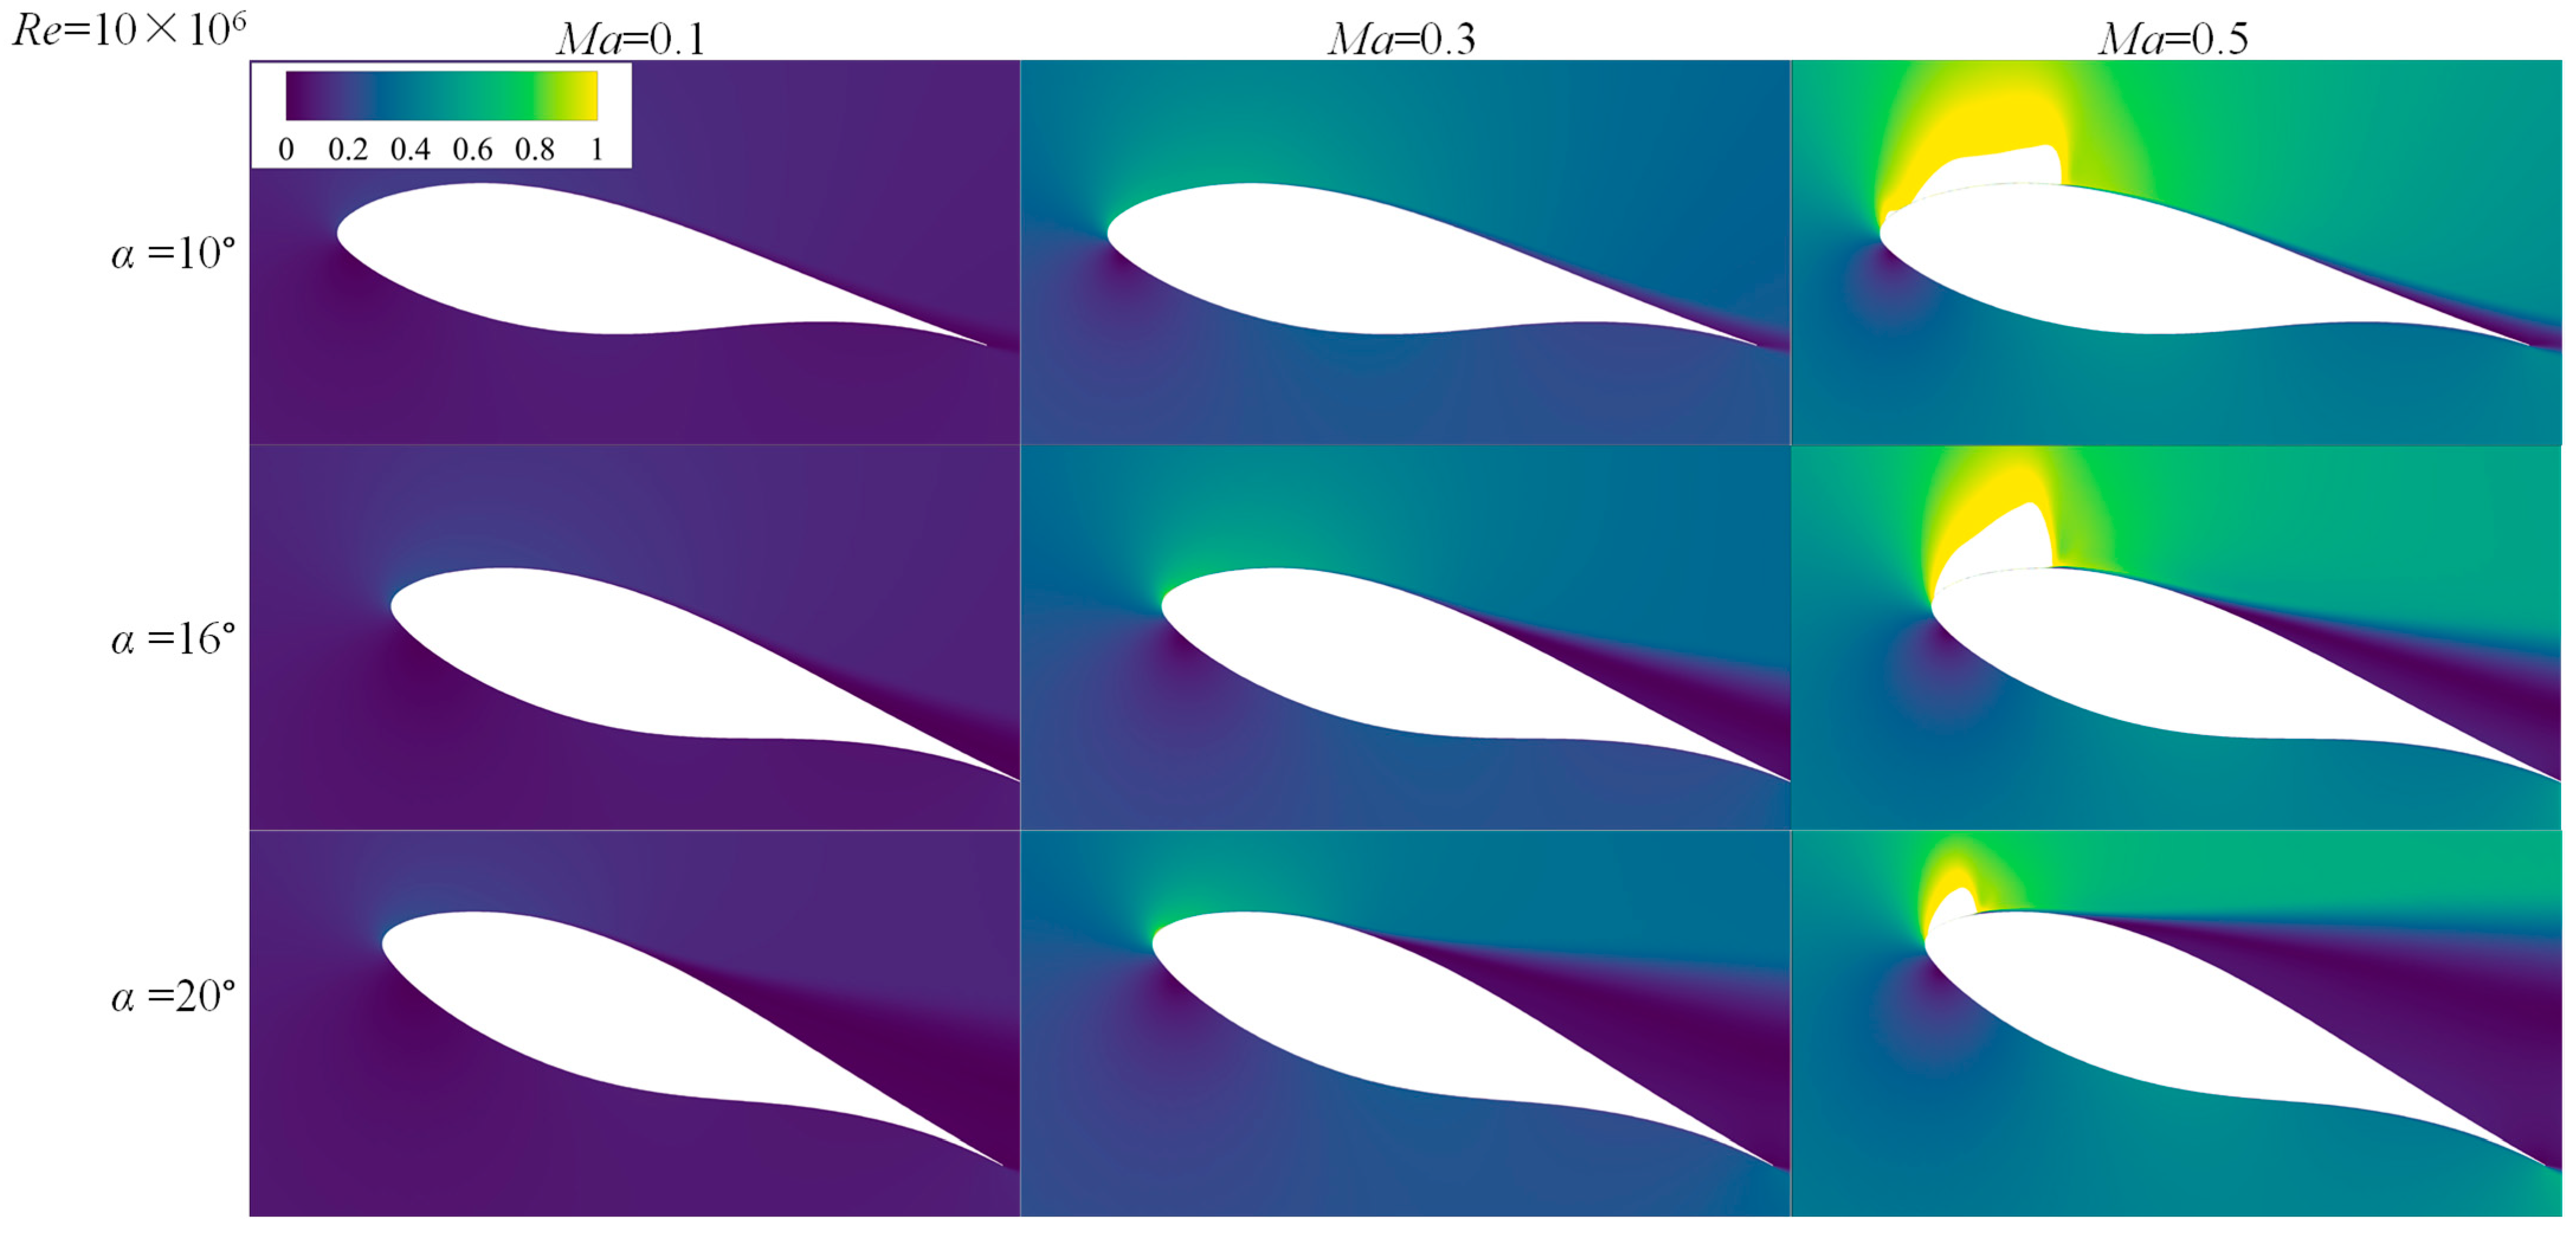
Areas with wing surface Mach number greater than 1—the supersonic zone—are eliminated from the local Mach number distribution cloud map (Figure 15). The figure makes it clear that the Mach number is higher in the airfoil’s leading edge section. Furthermore, more momentum transfer of the fluid is made possible when the Mach number rises because at the leading edge section’s acceleration area, velocity rises [16].
As the angle of attack rises, the area decreases and the surge region moves forward at Ma = 0.5. This happens as a result of a steep pressure drop and suction peak caused by airflow accelerating from the leading edge to the highest point of the airfoil. An increased angle of attack accelerates the flow, hastening the process and causing surge creation sooner. A large angle reduces the conditions for the development of surge waves and shrinks the surge area by narrowing the acceleration range. Through the surge layer, supersonic airflow transforms into subsonic flow. Heat conduction and viscosity predominate because of the significant temperature and velocity gradients [29]. Friction increases energy loss by converting mechanical energy into heat. At the same time that the airflow reaches its maximum altitude, the flow path’s cross-sectional area grows as it descends. The airflow velocity decreases due to the principle of conservation of mass, which causes the pressure to rise.

8. Conclusions

This study presents independent analyses of the Reynolds number and Mach number by manipulating the airfoil’s chord length and the inflow velocity in CFD simulations. The wind-tunnel experimental data of S809 and VR-7B airfoils are used to validate the CFD airfoil flow simulations. The linked interaction mechanism between ultra-high Reynolds numbers and compressibility effects is revealed by analyzing the flow stall mechanism of wind turbines under a single similarity criterion using the FFA-W3-211 airfoil as a reference.
The results indicate that inertial forces at ultra-high Reynolds numbers, particularly above 10 million, thin the boundary layer, resulting in an earlier transition, suppressed flow separation, and a stall that is successfully delayed. Because of increasing friction drag, the lift-to-drag ratio moderately drops at low angles of attack below 12°. At high angles of attack above 12°, the lift-to-drag ratio effectively increases as separation suppression lowers pressure drag. Additionally, this study reveals that in compressibility effects, when the Mach number surpasses 0.3, the flow acceleration effect intensifies as the angle of attack rises, the fluid’s adverse pressure gradient increases, all of which lead to premature stall. Shock waves produced concurrently by local supersonic flow have the potential to seriously harm the suction surface’s low-pressure area, resulting in a precipitous decrease in lift and a notable rise in pressure-difference drag. The shock separation induced by compressibility may be partially offset by the separation suppression characteristics of ultra-high Reynolds numbers under the coupled mechanism of the two effects. However, the turbulence enhancement effect under ultra-high Reynolds numbers and the shock separation advance caused by increased Mach numbers overlap, which somewhat increases flow instability.
The independent yet connected mechanisms of Reynolds number and Mach number may be better understood as a result of this study. It may also further the knowledge of the load control and aerodynamic performance of large-scale blades and high-power-class wind turbines in engineering applications. In the follow-up study, the impact of compressible flow at low Mach numbers and ultra-high Reynolds numbers on the flow characteristics and stall behavior of rotating wind turbine blades will be the subject.

Author Contributions

Conceptualization, Z.Z. (Zijian Zhang), X.H. and Z.Z. (Zijie Zhang); methodology, C.Z.; software, Z.Z. (Zijie Zhang); validation, Z.Z. (Zijian Zhang), X.H. and Z.Z. (Zijie Zhang); formal analysis, Z.Z. (Zijian Zhang) and X.H.; investigation, Z.Z. (Zijian Zhang) and X.H.; resources, C.Z.; data curation, Z.Z. (Zijian Zhang) and X.H.; writing—original draft preparation, Z.Z. (Zijian Zhang), X.H. and Z.Z. (Zeling Zhu); writing—review and editing, Z.Z. (Zijian Zhang) and X.H.; visualization, Z.Z. (Zijian Zhang) and X.H.; supervision, T.W., C.Z. and Y.Q.; project administration, C.Z.; funding acquisition, C.Z. and Y.Q. All authors have read and agreed to the published version of the manuscript.

Funding

This work is funded by the Natural Science Foundation of Jiangsu Province under Grant No. BK20220920, the National Natural Science Foundation of China under Grant No. 52506246, the Fundamental Research Funds for the Central Universities under Grant No. 30925010536, the Major Research Plan of the National Natural Science Foundation of China under Grant No. 92270101, and the 2024 Jiangsu Provincial Carbon Peaking and Carbon Neutrality Science and Technology Innovation Special Project under Grant No. BT2024003.

Data Availability Statement

Data are contained within the article.

Conflicts of Interest

Chengyong Zhu is a faculty member at Nanjing University of Science and Technology and concurrently a postdoctoral researcher at an enterprise in Yangtze River Shipbuilding Group Co. Ltd. The authors declare that the research was conducted in the absence of any commercial or financial relationships that could be construed as a potential conflict of interest.

References

  1. Vitulano, M.C.; De Tavernier, D.A.M.; De Stefano, G.; Von Terzi, D.A. Numerical Analysis of Transonic Flow over the FFA-W3-211 Wind Turbine Tip Airfoil. Wind. Energy Sci. Discuss. 2024, 2024, 1–19. [Google Scholar] [CrossRef]
  2. Zahle, F.; Barlas, A.; Loenbaek, K.; Bortolotti, P.; Zalkind, D.; Wang, L.; Labuschagne, C.; Sethuraman, L.; Barter, G. Definition of the IEA Wind 22-Megawatt Offshore Reference Wind Turbine; Department of Wind and Energy Systems: Roskilde, Denmark, 2024. [Google Scholar]
  3. Kim, H.R.; Printezis, J.A.; Ahrens, J.D.; Seume, J.R.; Wein, L. Characterization of Dynamic Stall on Large Wind Turbines. Wind. Energy Sci. Discuss. 2024, 2024, 1–20. [Google Scholar]
  4. Akhtar, N.; Geyer, B.; Schrum, C. Larger wind turbines as a solution to reduce environmental impacts. Sci. Rep. 2024, 14, 6608. Available online: https://www.nature.com/articles/s41598-024-56731-w (accessed on 15 July 2025). [CrossRef]
  5. Gudmundsson, S. The Anatomy of the Airfoil. In General Aviation Aircraft Design; Elsevier: Amsterdam, The Netherlands, 2014; pp. 235–297. Available online: https://linkinghub.elsevier.com/retrieve/pii/B9780123973085000088 (accessed on 15 July 2025).
  6. Lei, W.; Zhao, K.; Yang, H.; Xie, L.; Zhang, C.; Bai, J. Research progress on reynolds number effects in the design of large aircraft. Acta Aerodyn. Sin. 2025, 43, 1–17. [Google Scholar] [CrossRef]
  7. Vitulano, M.C.; De Tavernier, D.; De Stefano, G.; Von Terzi, D. Numerical analysis of static and dynamic wind turbine airfoil characteristics in transonic flow. J. Phys. Conf. Ser. 2024, 2767, 022013. Available online: https://iopscience.iop.org/article/022010.021088/021742-026596/022767/022012/022013 (accessed on 15 July 2025). [CrossRef]
  8. Brusca, S.; Cucinotta, F.; Galvagno, A.; Sfravara, F.; Chillemi, M. Development of a numerical characterization method for a ducted savonius turbine with power augmenters. Energies 2025, 18, 1142. Available online: https://www.mdpi.com/1996-1073/18/5/1142 (accessed on 15 July 2025). [CrossRef]
  9. Sfravara, F.; Barberi, E.; Bongiovanni, G.; Chillemi, M.; Brusca, S. Development of a predictive model for evaluation of the influence of various parameters on the performance of an oscillating water column device. Sensors 2024, 24, 3582. Available online: https://www.mdpi.com/1424-8220/24/11/3582 (accessed on 15 July 2025). [CrossRef] [PubMed]
  10. Jamieson, P. Innovation in Wind Turbine Design; Wiley: Hoboken, NJ, USA, 2018; Available online: https://onlinelibrary.wiley.com/doi/book/10.1002/9781119137924 (accessed on 15 July 2025).
  11. Hansen, M.O.L. Aerodynamics of Wind Turbines; Routledge: London, UK, 2015; Available online: https://www.taylorfrancis.com/books/9781482264005/chapters/10.1201/b18363-6 (accessed on 16 July 2025).
  12. Burton, T.L.; Jenkins, N.; Bossanyi, E.; Sharpe, D.; Graham, M. Wind Energy Handbook; Wiley: Hoboken, NJ, USA, 2001; Available online: https://onlinelibrary.wiley.com/doi/book/10.1002/0470846062 (accessed on 16 July 2025).
  13. Yin, J.; Shen, W.Z.; Sun, Z.; Zhu, W.J.; Cho, H. A new Blade Element Momentum theory for both compressible and incompressible wind turbine flow computations. Energy Convers. Manag. 2025, 328, 119619. Available online: https://linkinghub.elsevier.com/retrieve/pii/S0196890425001426 (accessed on 16 July 2025). [CrossRef]
  14. Aditya, A.; De Tavernier, D.; Schrijer, F.; Van Oudheusden, B.; Von Terzi, D. Experimental investigation of the occurrence of transonic flow effects on the FFA-W3-211 airfoil. J. Phys. Conf. Ser. 2024, 2767, 022031. Available online: https://iopscience.iop.org/article/022010.021088/021742-026596/022767/022032/022031 (accessed on 16 July 2025). [CrossRef]
  15. Cao, J.; Qin, Z.; Ju, Y.; Chen, Y.; Shen, W.Z.; Shen, X.; Ke, S. Study of air compressibility effects on the aerodynamic performance of the IEA-15 MW offshore wind turbine. Energy Convers. Manag. 2023, 282, 116883. Available online: https://linkinghub.elsevier.com/retrieve/pii/S0196890423002297 (accessed on 16 July 2025). [CrossRef]
  16. De Tavernier, D.; Terzi, D.V. The emergence of supersonic flow on wind turbines. J. Phys. Conf. Ser. 2022, 2265, 042068. Available online: https://iopscience.iop.org/article/042010.041088/041742-046596/042265/042064/042068 (accessed on 16 July 2025). [CrossRef]
  17. Glauert, H.; Taylor, G.I. The effect of compressibility on the lift of an aerofoil. Proc. R. Soc. London. Ser. A Contain. Pap. A Math. Phys. Character 1928, 118, 113–119. Available online: https://royalsocietypublishing.org/doi/10.1098/rspa.1928.0039 (accessed on 16 July 2025).
  18. Pires, O.; Munduate, X.; Ceyhan, O.; Jacobs, M.; Snel, H. Analysis of high Reynolds numbers effects on a wind turbine airfoil using 2D wind tunnel test data. J. Phys. Conf. Ser. 2016, 753, 022047. Available online: https://iopscience.iop.org/article/022010.021088/021742-026596/022753/022042/022047 (accessed on 16 July 2025). [CrossRef]
  19. Zhu, C.; Yang, H.; Qiu, Y.; Zhou, G.; Wang, L.; Feng, Y.; Shen, Z.; Shen, X.; Feng, X.; Wang, T. Effects of the reynolds number and reduced frequency on the aerodynamic performance and dynamic stall behaviors of a vertical axis wind turbine. Energy Convers. Manag. 2023, 293, 117513. Available online: https://linkinghub.elsevier.com/retrieve/pii/S0196890423008592 (accessed on 16 July 2025). [CrossRef]
  20. Campobasso, M.S.; Sanvito, A.G.; Drofelnik, J.; Jackson, A.; Zhou, Y.; Xiao, Q.; Croce, A. Compressible navier-stokes analysis of floating wind turbine rotor aerodynamics. In Proceedings of the ASME 2018 1st International Offshore Wind Technical Conference, San Francisco, CA, USA, 4–7 November 2018; Available online: https://asmedigitalcollection.asme.org/OMAE/proceedings/IOWTC2018/51975/San%51920Francisco,%51920California,%51920USA/275559 (accessed on 16 July 2025).
  21. Cheng, X. Development of wind energy model and application of CFD in wind energy assessment. Acta Aerodyn. Sin. 2023, 41, 1–15. Available online: http://kqdlxxb.xml-journal.net/en/article/doi/10.7638/kqdlxxb-2023.0011 (accessed on 20 July 2025).
  22. Gharali, K.; Johnson, D.A. Numerical modeling of an S809 airfoil under dynamic stall, erosion and high reduced frequencies. Appl. Energy 2012, 93, 45–52. Available online: https://linkinghub.elsevier.com/retrieve/pii/S0306261911002595 (accessed on 20 July 2025). [CrossRef]
  23. Qian, Y.; Zhang, Y.; Sun, Y.; Wang, T. Numerical investigations of the flow control effect on a thick wind turbine airfoil using deformable trailing edge flaps. Energy 2023, 265, 126327. Available online: https://linkinghub.elsevier.com/retrieve/pii/S0360544222032133 (accessed on 20 July 2025). [CrossRef]
  24. McAlister, K.W.; Pucci, S.L.; McCroskey, W.J.; Carr, L.W. An Experimental Study of Dynamic Stall on Advanced Airfoil Section. Volume 2: Pressure and Force Data; NASA Ames Research Center: Moffett Field, CA, USA, 1982. Available online: https://ntrs.nasa.gov/citations/19830003778 (accessed on 20 July 2025).
  25. Amjith, L.; Bavanish, B. A review on biomass and wind as renewable energy for sustainable environment. Chemosphere 2022, 293, 133579. Available online: https://linkinghub.elsevier.com/retrieve/pii/S0045653522000686 (accessed on 20 July 2025). [CrossRef] [PubMed]
  26. Souza, L.F.d.; Miotto, R.F.; Wolf, W.R. Active flow control of vertical-axis wind turbines: Insights from large-eddy simulation and finite-time resolvent analysis. arXiv 2025, arXiv:2507.08625. [Google Scholar]
  27. Chellini, S.; De Tavenier, D.; Von Terzi, D. Impact of dynamic stall model tailoring on wind turbine loads and performance prediction. J. Phys. Conf. Ser. 2024, 2767, 022016. Available online: https://iopscience.iop.org/article/022010.021088/021742-026596/022767/022012/022016 (accessed on 20 July 2025). [CrossRef]
  28. Corke, T.C.; Thomas, F.O. Dynamic Stall in Pitching Airfoils: Aerodynamic Damping and Compressibility Effects. Annu. Rev. Fluid Mech. 2015, 47, 479–505. Available online: https://www.annualreviews.org/content/journals/10.1146/annurev-fluid-010814-013632 (accessed on 20 July 2025). [CrossRef]
  29. Leishman, J.G. Principles of Helicopter Aerodynamics; Cambridge University Press: Cambridge, UK, 2006; Available online: https://assets.cambridge.org/97811070/13353/frontmatter/9781107013353_frontmatter.pdf (accessed on 20 July 2025).
  30. McCroskey, W.J. The Phenomenon of Dynamic Stall; Ames Research Center: Moffett Field, CA, USA, 1981.
  31. Yan, C.; Archer, C.L. Assessing compressibility effects on the performance of large horizontal-axis wind turbines. Appl. Energy 2018, 212, 33–45. Available online: https://linkinghub.elsevier.com/retrieve/pii/S0306261917317348 (accessed on 22 July 2025). [CrossRef]
  32. Sørensen, N.N.; Bertagnolio, F.; Jost, E.; Lutz, T. Aerodynamic effects of compressibility for wind turbines at high tip speeds. IOPscience 2018, 1037, 022003. Available online: https://iopscience.iop.org/article/022010.021088/021742-026596/021037/022002/022003 (accessed on 22 July 2025).
  33. Zunaid, M.; Mustafa, M.G. Mathematical analysis of wind turbine blade at various angle of attack and reynold number. IOP Conf. Ser. Mater. Sci. Eng. 2020, 804, 012005. Available online: https://iopscience.iop.org/article/012010.011088/011757-012899X/012804/012001/012005 (accessed on 22 July 2025). [CrossRef]
  34. Mereu, R.; Passoni, S.; Inzoli, F. Scale-resolving CFD modeling of a thick wind turbine airfoil with application of vortex generators: Validation and sensitivity analyses. Energy 2019, 187, 115969. Available online: https://linkinghub.elsevier.com/retrieve/pii/S0360544219316597 (accessed on 22 July 2025). [CrossRef]
  35. Balduzzi, F.; Bianchini, A.; Maleci, R.; Ferrara, G.; Ferrari, L. Critical issues in the CFD simulation of darrieus wind turbines. Renew. Energy 2016, 85, 419–435. Available online: https://linkinghub.elsevier.com/retrieve/pii/S0960148115300719 (accessed on 22 July 2025). [CrossRef]
  36. Wang, H.; Zhang, B.; Qiu, Q.; Xu, X. Flow control on the NREL S809 wind turbine airfoil using vortex generators. Energy 2017, 118, 1210–1221. Available online: https://linkinghub.elsevier.com/retrieve/pii/S0360544216315924 (accessed on 22 July 2025). [CrossRef]
  37. Cai, X.; Gu, R.; Pan, P.; Zhu, J. Unsteady aerodynamics simulation of a full-scale horizontal axis wind turbine using CFD methodology. Energy Convers. Manag. 2016, 112, 146–156. Available online: https://linkinghub.elsevier.com/retrieve/pii/S0196890416000145 (accessed on 22 July 2025). [CrossRef]
  38. Carrion, M. Low Mach Number CFD for Wind Turbine Analysis; University of Liverpool: Liverpool, UK, 2015. [Google Scholar]
  39. Bai, C.-J.; Wang, W.-C. Review of computational and experimental approaches to analysis of aerodynamic performance in horizontal-axis wind turbines (HAWTs). Renew. Sustain. Energy Rev. 2016, 63, 506–519. Available online: https://linkinghub.elsevier.com/retrieve/pii/S1364032116301903 (accessed on 22 July 2025). [CrossRef]
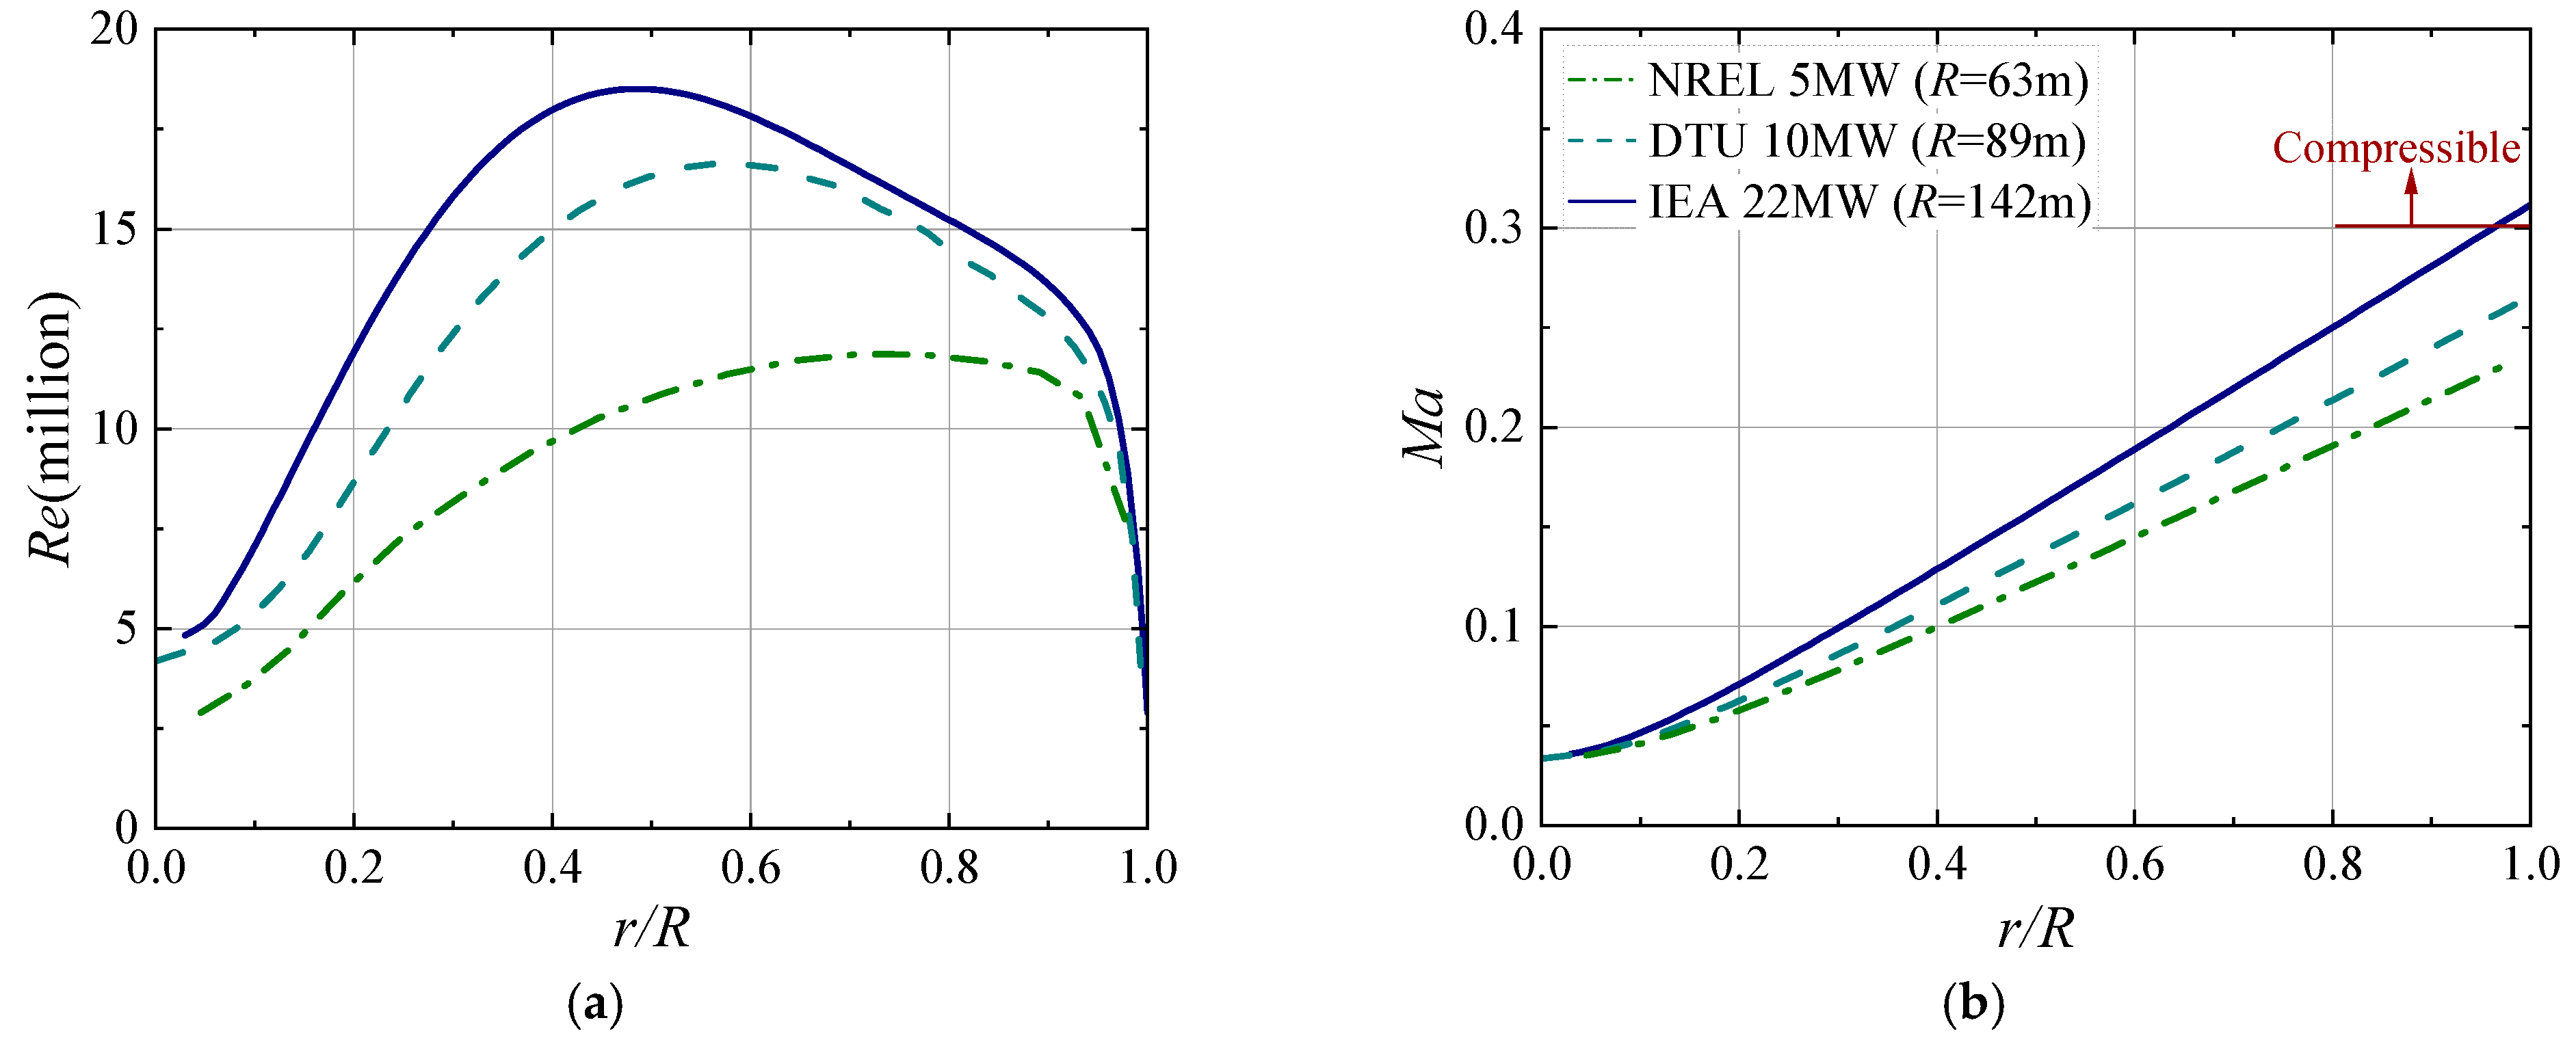
Figure 1. Radial distribution for different sizes of wind turbine blades at rated operating conditions. (a) Radial distribution of Reynolds number; (b) Radial distribution of Mach number.
Machines 13 00847 g001
Figure 2. Linear relationship between Reynolds number and Mach number for different sizes.
Machines 13 00847 g002
Figure 3. O-overlap computational grid for FFA-W3-211 airfoil modeling, where the near-wall boundary layer grid is blue, the background grid is black, and the green portion is the encrypted grid for recording the airfoil wake. (a) computational domain; (b) airfoil; (c) blade boundary layer grid.
Machines 13 00847 g003
Figure 4. Lift drag coefficient and pressure distribution validation of S809 airfoil. (a) Lift coefficient; (b) Drag coefficient; (c) Pressure coefficient.
Machines 13 00847 g004
Figure 5. Lift drag coefficient and pressure distribution of VR-7B airfoil validation. (a) Lift coefficient; (b) Drag coefficient; (c) Pressure coefficient.
Machines 13 00847 g005
Figure 6. Comparison of lift and drag coefficients obtained from three types of mesh. (a) Lift coefficient; (b) Drag coefficient.
Machines 13 00847 g006
Figure 7. Variation in lift coefficients with mesh size for FFA-W3-211 airfoil at different angles of attack.
Machines 13 00847 g007
Figure 8. FFA-W3-211 airfoil controlling Reynolds number as a single variable. (a) Lift coefficient (b) Drag coefficient.
Machines 13 00847 g008
Figure 9. Pressure distribution of the FFA-W3-211 airfoil at Ma = 0.3. (a) The angle of attack is 10°; (b) The angle of attack is 16°; (c) The angle of attack is 20°.
Machines 13 00847 g009
Figure 10. Pressure distribution and flow lines around the FFA-W3-211 airfoil at Ma = 0.3.
Machines 13 00847 g010
Figure 11. Distribution cloud of local Reynolds number around the airfoil for FFA-W3-211 airfoil at Ma = 0.3 (Re < 2 million is in the blank area that was cut off).
Machines 13 00847 g011
Figure 12. FFA-W3-211 airfoil control Mach number as a single variable. (a) lift coefficient (b) drag coefficient.
Machines 13 00847 g012
Figure 13. Pressure distribution of FFA-W3-211 airfoil at Re = 10 million for the airfoil. (a) The angle of attack is 10°; (b) The angle of attack is 16°; (c) The angle of attack is 20°.
Machines 13 00847 g013
Figure 14. Pressure distribution and flow lines around the FFA-W3-211 airfoil at Re = 10 million.
Machines 13 00847 g014
Figure 15. Distribution cloud of local Mach number around the airfoil for FFA-W3-211 airfoil at Re = 10 million (Ma > 1 is in the blank area that was cut off).
Machines 13 00847 g015
Table 1. Main RANS settings for the flow simulations.
Solver Setting ItemParameter/Selection Value
Solver typePressure-Based Solver
Time typeSteady
Energy equationMa ≤ 0.3, off
Ma > 0.3, on
DensityMa ≤ 0.3, constant
Ma > 0.3, ideal-gas
Turbulence modelingSST k-ω model
Transition modelingγ-Reθ model
Spatial discretizationSecond-order upwind scheme
Temporal discretizationUnbounded second-order implicit scheme
Pressure-velocity couplingCoupled algorithm
Courant number20
Number of Iterations4000
Reporting Interval10
Table 2. Grid parameters of three types of grids.
Grid AccuracyMesh Distribution on the Upper/Lower SurfaceFirst Layer HeightGrowth Rate
coarse1502.0 × 10−61.07
medium2502.0 × 10−61.05
fine3502.0 × 10−61.03
Table 3. The effect of Reynolds Number on the static stall behavior of the FFA-W3-211 airfoil (fixed Ma = 0.3).
Re (Million)Slope of the Linear
Segment of the Cl
αStall (°)Cl,max
20.1180121.76
100.1159141.75
200.1172141.79
Table 4. Effect of Reynolds number on aerodynamic performance of FFA-W3-211 airfoil (fixed Ma = 0.3).
α (°)Re
(Million)
ClCdCl/Cdft/cfs/cCp,minh/c
1021.5920.0132120.726.88%---−3.60---
101.5790.0146108.25.29%---−3.58---
201.5710.0151103.90.96%---−3.57---
1621.4910.080518.52.18%43.62%−4.9417.26%
101.6280.067524.11.31%47.15%−5.6713.37%
201.6750.062526.80.79%48.72%−5.9212.82%
2021.2480.16317.71.80%25.82%−4.8440.37%
101.4350.135710.60.96%31.97%−6.0633.53%
201.4730.129911.30.82%32.97%−6.3132.50%
In the table, ft denotes the position of the turning point, fs denotes the position of the separation point, Cp,min denotes the maximum suction coefficient, and h/c denotes the relative height of the separation zone.
Table 5. The effect of Mach Number on the static stall behavior of the FFA-W3-211 airfoil (fixed Re = 10 million).
MaSlope of the Linear Segment of the Clαstall (°)Cl,max
0.10.1139161.91
0.30.1159141.75
0.50.1221121.82
Table 6. Effect of Mach number on aerodynamic performance of FFA-W3-211 airfoil (fixed Re = 10 million).
α (°)MaClCdCl/Cdft/cfs/cCp,minh/c
100.11.5140.0137110.64.34%---−3.49---
0.31.5790.0146108.25.29%---−3.58---
0.51.7360.021082.822.20%---−3.54---
160.11.9080.035454.01.01%68.09%−6.905.61%
0.31.6280.067524.11.10%47.15%−5.6713.37%
0.51.5850.099416.03.10%40.49%−4.1621.11%
200.11.6820.094217.80.77%42.31%−7.2423.06%
0.31.4350.135710.60.82%31.97%−6.0633.53%
0.51.2070.20176.04.85%23.50%−4.1951.86%
In the table, ft denotes the position of the turning point, fs denotes the position of the separation point, Cp,min denotes the maximum suction coefficient, and h/c denotes the relative height of the separation zone.
Disclaimer/Publisher’s Note: The statements, opinions and data contained in all publications are solely those of the individual author(s) and contributor(s) and not of MDPI and/or the editor(s). MDPI and/or the editor(s) disclaim responsibility for any injury to people or property resulting from any ideas, methods, instructions or products referred to in the content.