Article

Development of a Numerical Characterization Method for a Ducted Savonius Turbine with Power Augmenters

by
Sebastian Brusca
,
Filippo Cucinotta
,
Antonio Galvagno
,
Felice Sfravara
and
Massimiliano Chillemi
*
Department of Engineering, University of Messina, Contrada Di Dio s.n.c., 98166 Messina, Italy
*
Author to whom correspondence should be addressed.
Energies 2025, 18(5), 1142; https://doi.org/10.3390/en18051142
Submission received: 11 February 2025 / Revised: 21 February 2025 / Accepted: 24 February 2025 / Published: 26 February 2025
(This article belongs to the Special Issue Vertical Axis Wind Turbines: Current Technologies and Future Trends)

Abstract

:
Savonius turbines are widely used in energy recovery applications, including urban-integrated wind energy systems and Oscillating Water Column (OWC) setups for wave energy conversion. This study explores the use of a ducted Savonius turbine. Experimental tests were conducted on a scaled turbine to evaluate its performance. A Computational Fluid Dynamics (CFDs) model, incorporating Sliding Mesh and Dynamic Fluid Body Interaction (DFBI) techniques, was developed to replicate the experimental conditions. The accuracy of the model was confirmed through validation against experimental data. In total, four conditions were studied: one without a Power Augmenter, one with the Bell-Metha Power Augmenter, and two custom ones obtained by increasing the slope at the end of the Power Augmenters. To facilitate rapid turbine characterization, a fast computational method was developed, allowing the derivation of characteristic curves using only three CFD simulations per configuration. The reliability of this approach was assessed by comparing predictions with experimental results. Developing such a model is crucial, as it enables seamless integration with Reduced-Order Models (ROMs), significantly improving efficiency in evaluating multiple operating points. Compared to traditional experimental testing, this approach provides a faster and more efficient way to obtain performance insights, paving the way for enhanced turbine optimization and real-world deployment.

1. Introduction

The growing demand for sustainable energy solutions has accelerated research and development in renewable energy technologies [1]. Among these, energy systems based on Savonius turbines have attracted significant interest [2].
Their simple design, cost-effectiveness, and ability to operate efficiently under variable flow conditions make them a promising choice for sustainable energy solutions.
Oscillating Water Column (OWC) systems are one of the most promising technologies for harnessing wave energy, with several operational plants worldwide demonstrating their feasibility [3]. These systems convert wave energy into pneumatic energy, which is subsequently transformed into electricity via a Power Take-Off (PTO) mechanism.
OWC systems typically consist of a partially submerged chamber with an underwater opening and an air turbine. The oscillation of the internal water column, induced by incoming waves, generates an alternating airflow that powers a turbine. Due to this bidirectional nature of the airflow, selecting an appropriate turbine design is crucial for efficient energy conversion [4].
Despite their potential, OWC systems face challenges, such as high initial costs and the need for efficient energy conversion mechanisms. Research has focused on improving PTO efficiency through innovative designs, such as ducted Savonius turbines [5].
Savonius turbines are also widely used in energy recovery applications, such as urban-integrated wind energy recovery systems [6], i.e., integrated in buildings [7]. Recent research has explored various design modifications to enhance the performance of Savonius turbines in urban environments. One notable approach involves the use of airfoil-shaped blades, which can improve aerodynamic efficiency while maintaining the turbine’s compactness and bidirectional functionality. Research demonstrated that employing an FX74-CL5-140 airfoil in Savonius rotors led to a 16.5% increase in the power coefficient compared to conventional semicircular designs, extending the turbine effective working range to lower tip speed ratios, which is particularly beneficial for urban applications [8]. The choice of the FX74-CL5-140 airfoil can be attributed to the characteristics of the profile, which exhibit moderate stall behaviour [9]. This is crucial because, during rotation, the turbine blades experience a wide range of angles of attack.
Another innovative urban application is the wind tree concept, where multiple small Savonius turbines are integrated into a tree-like structure to harness wind energy from multiple directions. This design has been investigated for its potential to provide localized renewable energy in urban areas, offering an aesthetically pleasing and space-efficient alternative to traditional wind energy solutions. Computational simulations have shown that these systems can effectively capture wind energy at speeds as low as 3.3 m/s, making them viable for deployment in city environments where wind speeds tend to be lower and more variable [10].
Conventional and non-conventional blade shapes were widely investigated, as in [11]. The study analysed various performance metrics of the Savonius turbine, including torque and power coefficients, pressure on the blades, flow velocity, and wake characteristics. The modified blade design proposed in this study has the potential to improve the power efficiency of a Savonius wind turbine by 10–28% compared to conventional designs.
The performance of the turbines can also be influenced by different objects upstream of the turbine, as demonstrated in [12]. This study found that using an optimized barrier increased the power coefficient of a Savonius hydrokinetic turbine by about 18% compared to the conventional, obstacle-less turbine. The numerical simulations used in the study were validated against experimental data, showing good agreement.
Machine learning (ML) has been increasingly integrated into CFD simulations to enhance accuracy, reduce computational costs, manage uncertainties, or predict instabilities in turbomachinery [13]. Below are the key areas where ML is applied, along with relevant references from the review paper. An extensive review on this topic is presented in [14].
ML has been used to improve Reynolds-Averaged Navier–Stokes (RANS) turbulence models by leveraging high-fidelity datasets from Direct Numerical Simulation (DNS) and Large Eddy Simulation (LES). Techniques like Artificial Neural Networks (ANNs) [15] and Gene Expression Programming (GEP) [16] have been used to enhance turbulence closures models.
ML-based surrogate models have been also employed to reduce the computational time of CFD simulations while maintaining accuracy. There are two possible approaches: spatial and temporal discretization techniques. Spatial discretization focuses on enhancing solver efficiency by utilizing coarse meshes, with ML-based super-resolution techniques reconstructing the finer details. A method has been proposed in [17] to accurately predict the evolution of a CFD simulation using a mesh that is significantly coarser—by approximately one order of magnitude in each spatial dimension—while employing learned interpolation techniques. This approach achieves a computational speed-up of nearly 40 times. However, its effectiveness relies heavily on the availability of extensive high-resolution datasets.
On the other hand, temporal discretization leverages ML to predict the future evolution of the numerical scheme, significantly accelerating simulations compared to traditional time-stepping methods. A comprehensive comparison of various methods is made in [18], evaluating the performance of four different neural networks in solving the inviscid 2D shallow water equations, which are analogous to compressible wave propagation problems. The study examines three recurrent neural networks alongside a feedforward model, assessing their effectiveness in capturing temporal dynamics efficiently.
Other ML-based approaches have been developed to quantify epistemic and aleatoric uncertainties in CFD models. Bayesian frameworks have been proposed that treat the parameters of the Reynolds stress tensor as a set of uncertain parameters [19], while Co-Kriging and other ML approaches are used to merge low-fidelity and high-fidelity datasets for robust uncertainty assessment [20].
The objective of this study is the evaluation of the performance of a ducted Savonius turbine. Experimental tests were conducted on a scaled turbine to assess its performance. Additionally, a Computational Fluid Dynamics (CFDs) model, incorporating Sliding Mesh and Dynamic Fluid Body Interaction (DFBI) techniques, was developed to replicate the experimental setup. The accuracy of the mode validated against experimental data.
To improve turbine performance, a fifth-order Bell-Metha polynomial profile Power Augmenter (PA) [21] was integrated into the CFD analysis. The aim of this design was to increase rotational speed and reduce flow resistance by minimizing upstream vortex effects. Then, the baseline polynomial was modified to evaluate the effects on the turbine.
Four configurations were analysed: one without a Power Augmenter, one with the Bell-Metha Power Augmenter, and two custom designs featuring an increased slope at the end of the augmenter.
In the literature, the only stand-alone method to characterize the turbine requires a time-consuming experimental campaign, starting from the no-load condition and gradually reaching the locked rotor condition. Examples of these procedures are reported in [22,23], in which at least ten experimental tests are required to obtain a power coefficient curve. The alternative characterization method, based on numerical CFD simulations, still necessitates validation through extensive experimental testing.
In this work, a fast computational method was developed to enable rapid turbine characterization, allowing the derivation of characteristic curves with only three CFD simulations per configuration. An experimental campaign was necessary to validate the CFD model; however, once validation was achieved, selecting the calculation points appropriately—without repeating the experimental ones—made it possible to obtain the characteristic curves with just three simulations.
The reliability of this approach was assessed by comparing numerical predictions with experimental results through the calculation of the determination coefficients. Developing such a model that would essentially act as a Digital Twin, is essential as it facilitates seamless integration with Reduced-Order Models (ROMs), greatly improving efficiency in evaluating multiple operating points as already performed for other applications, such as manifolds [24], jet actuators [25], or furnaces [26]. Compared to traditional experimental testing, this methodology offers a faster and more efficient way to obtain performance insights, contributing to the optimization and real-world deployment of Savonius-based energy systems.

2. Materials and Methods

2.1. Experimental Setup

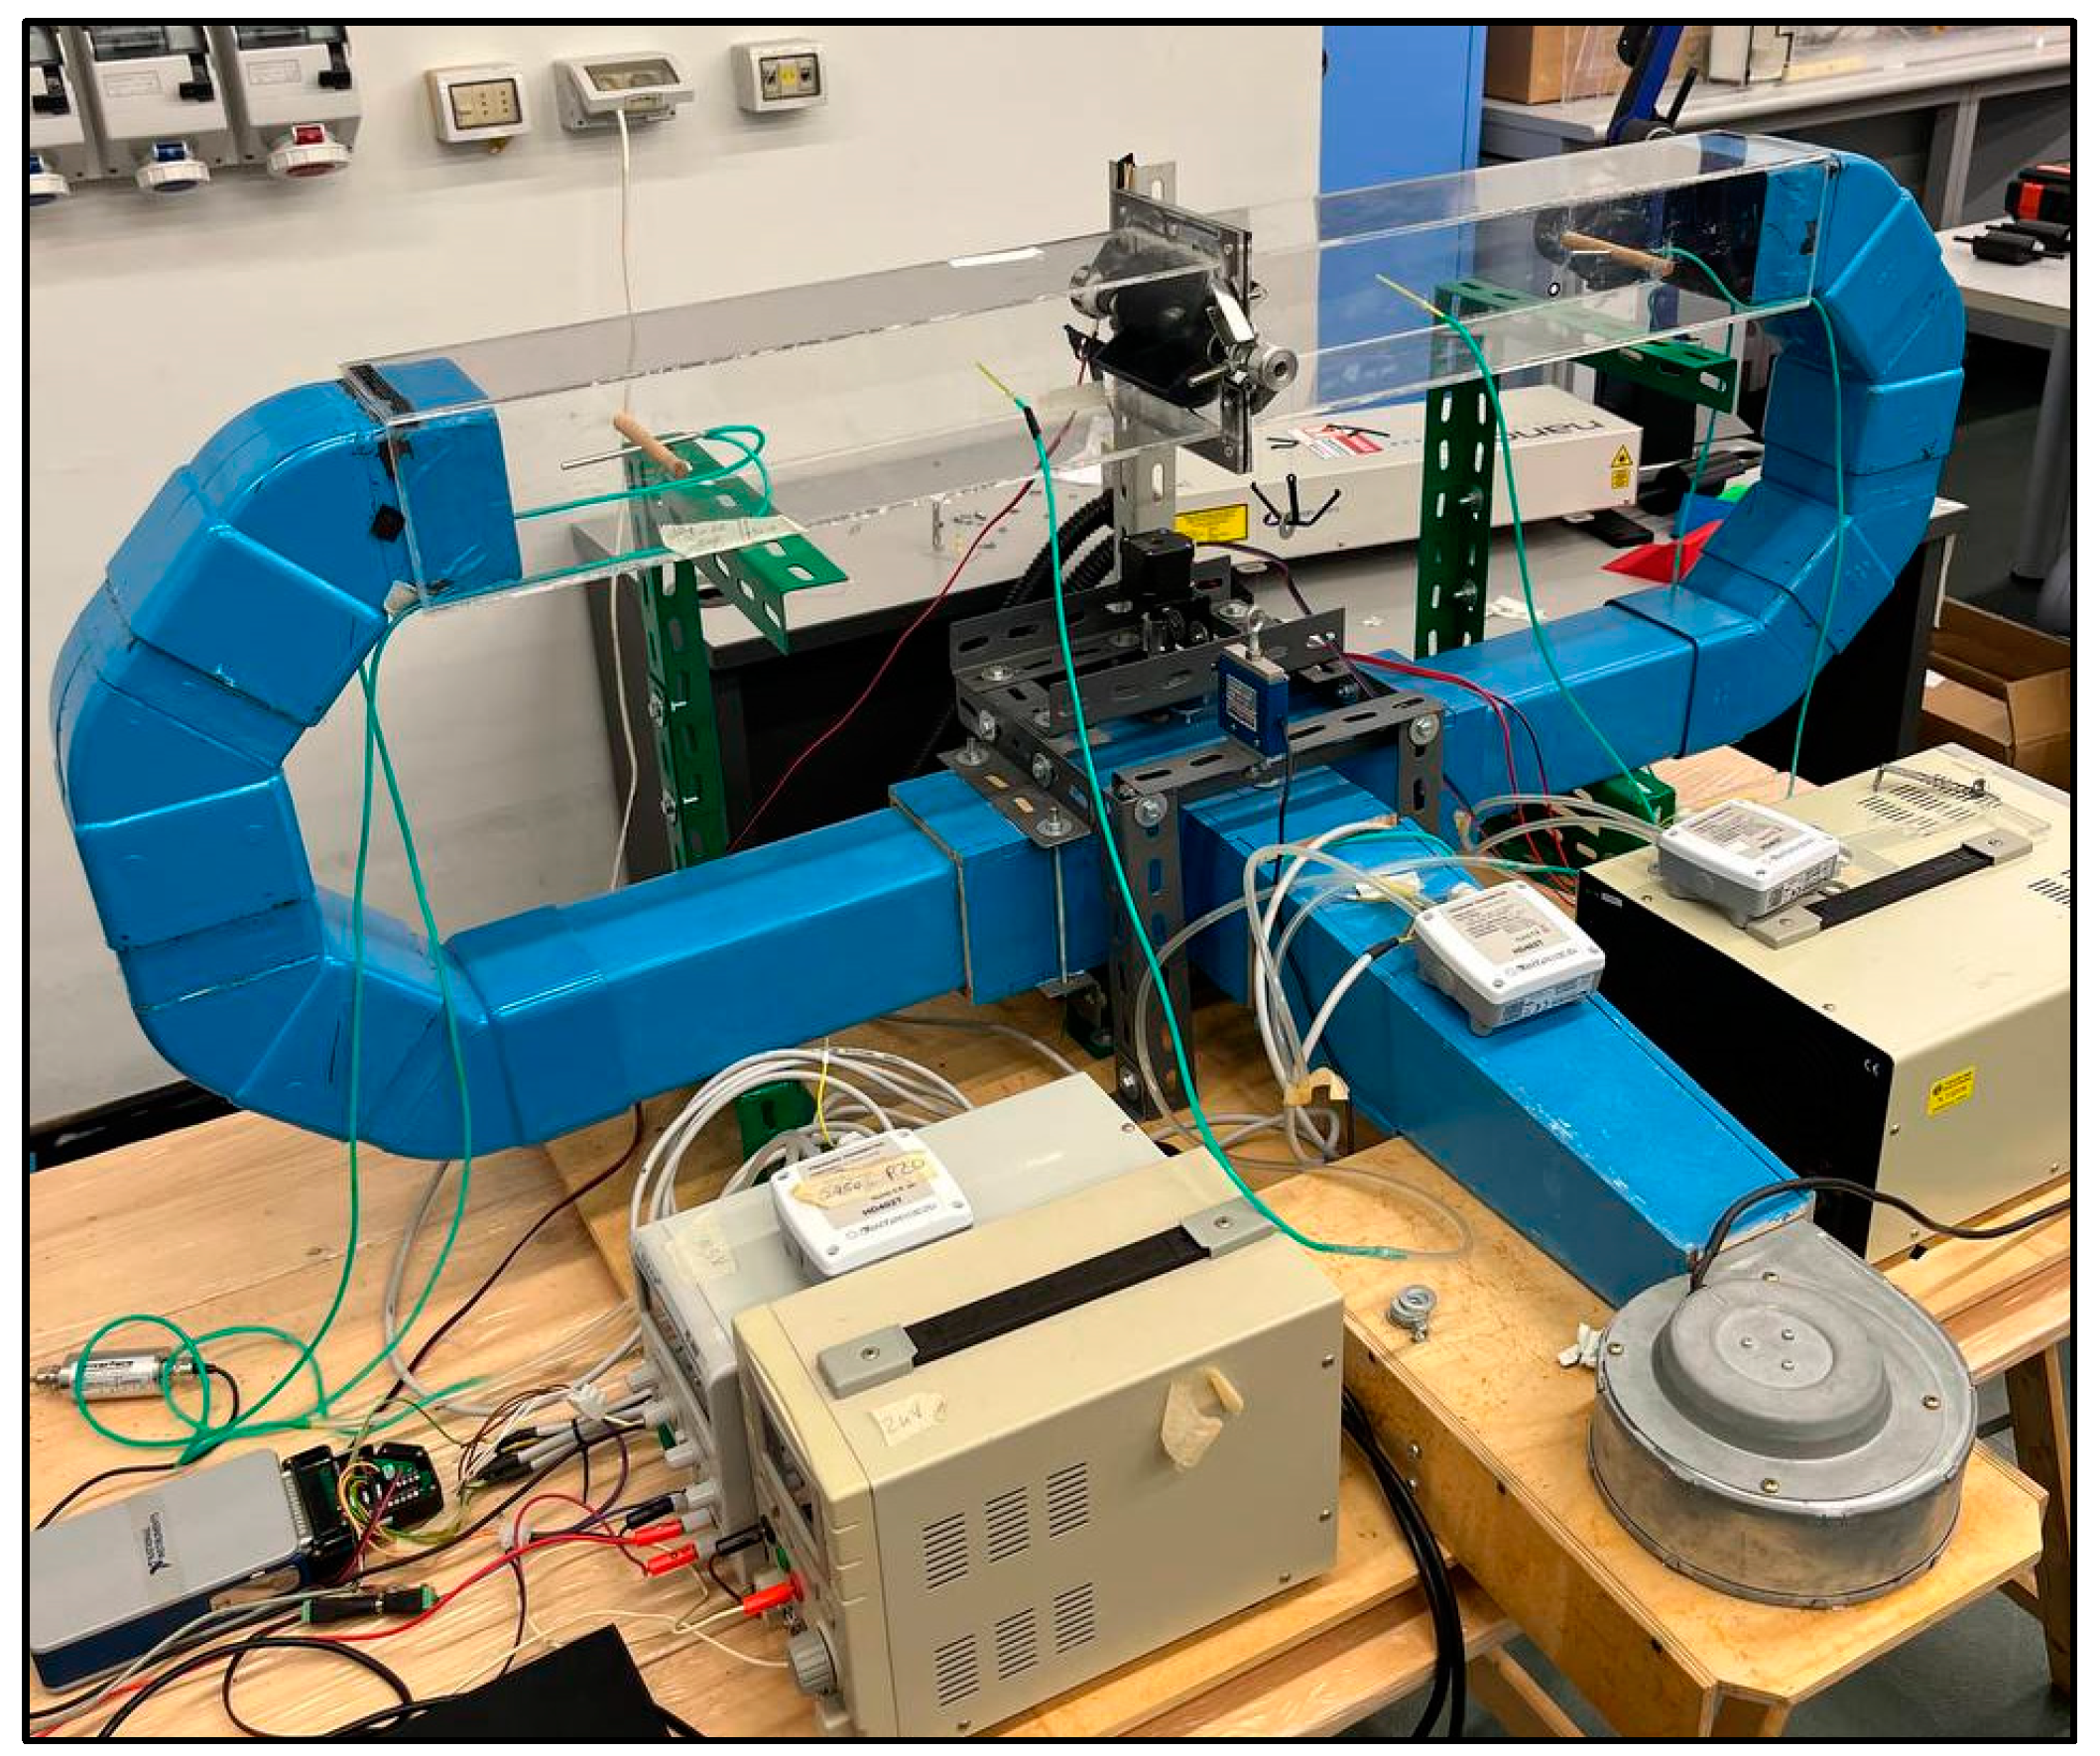
The experimental tests took place within a test tube setup at the University of Messina (Figure 1). The upper section of the test tube is constructed using PVC walls, forming a square internal cross-section of 100 × 100 mm and extending 1000 mm in length. The turbine is positioned at the centre of this upper section. The remaining components of the setup are made of wood and PVC.
The lateral sections consist of two 45° bends, each measuring 160 mm in length, connected by a vertical junction, all featuring square cross-sections. In the lower part of the setup, a fan is responsible for generating airflow, while a diverter is incorporated to regulate flow direction. The diverter operates at a predefined frequency f, allowing airflow to be redirected toward one of the two bends. When f = 0, the flow remains mono-directional; when f > 0, the flow alternates direction, with the inversion speed being adjustable.
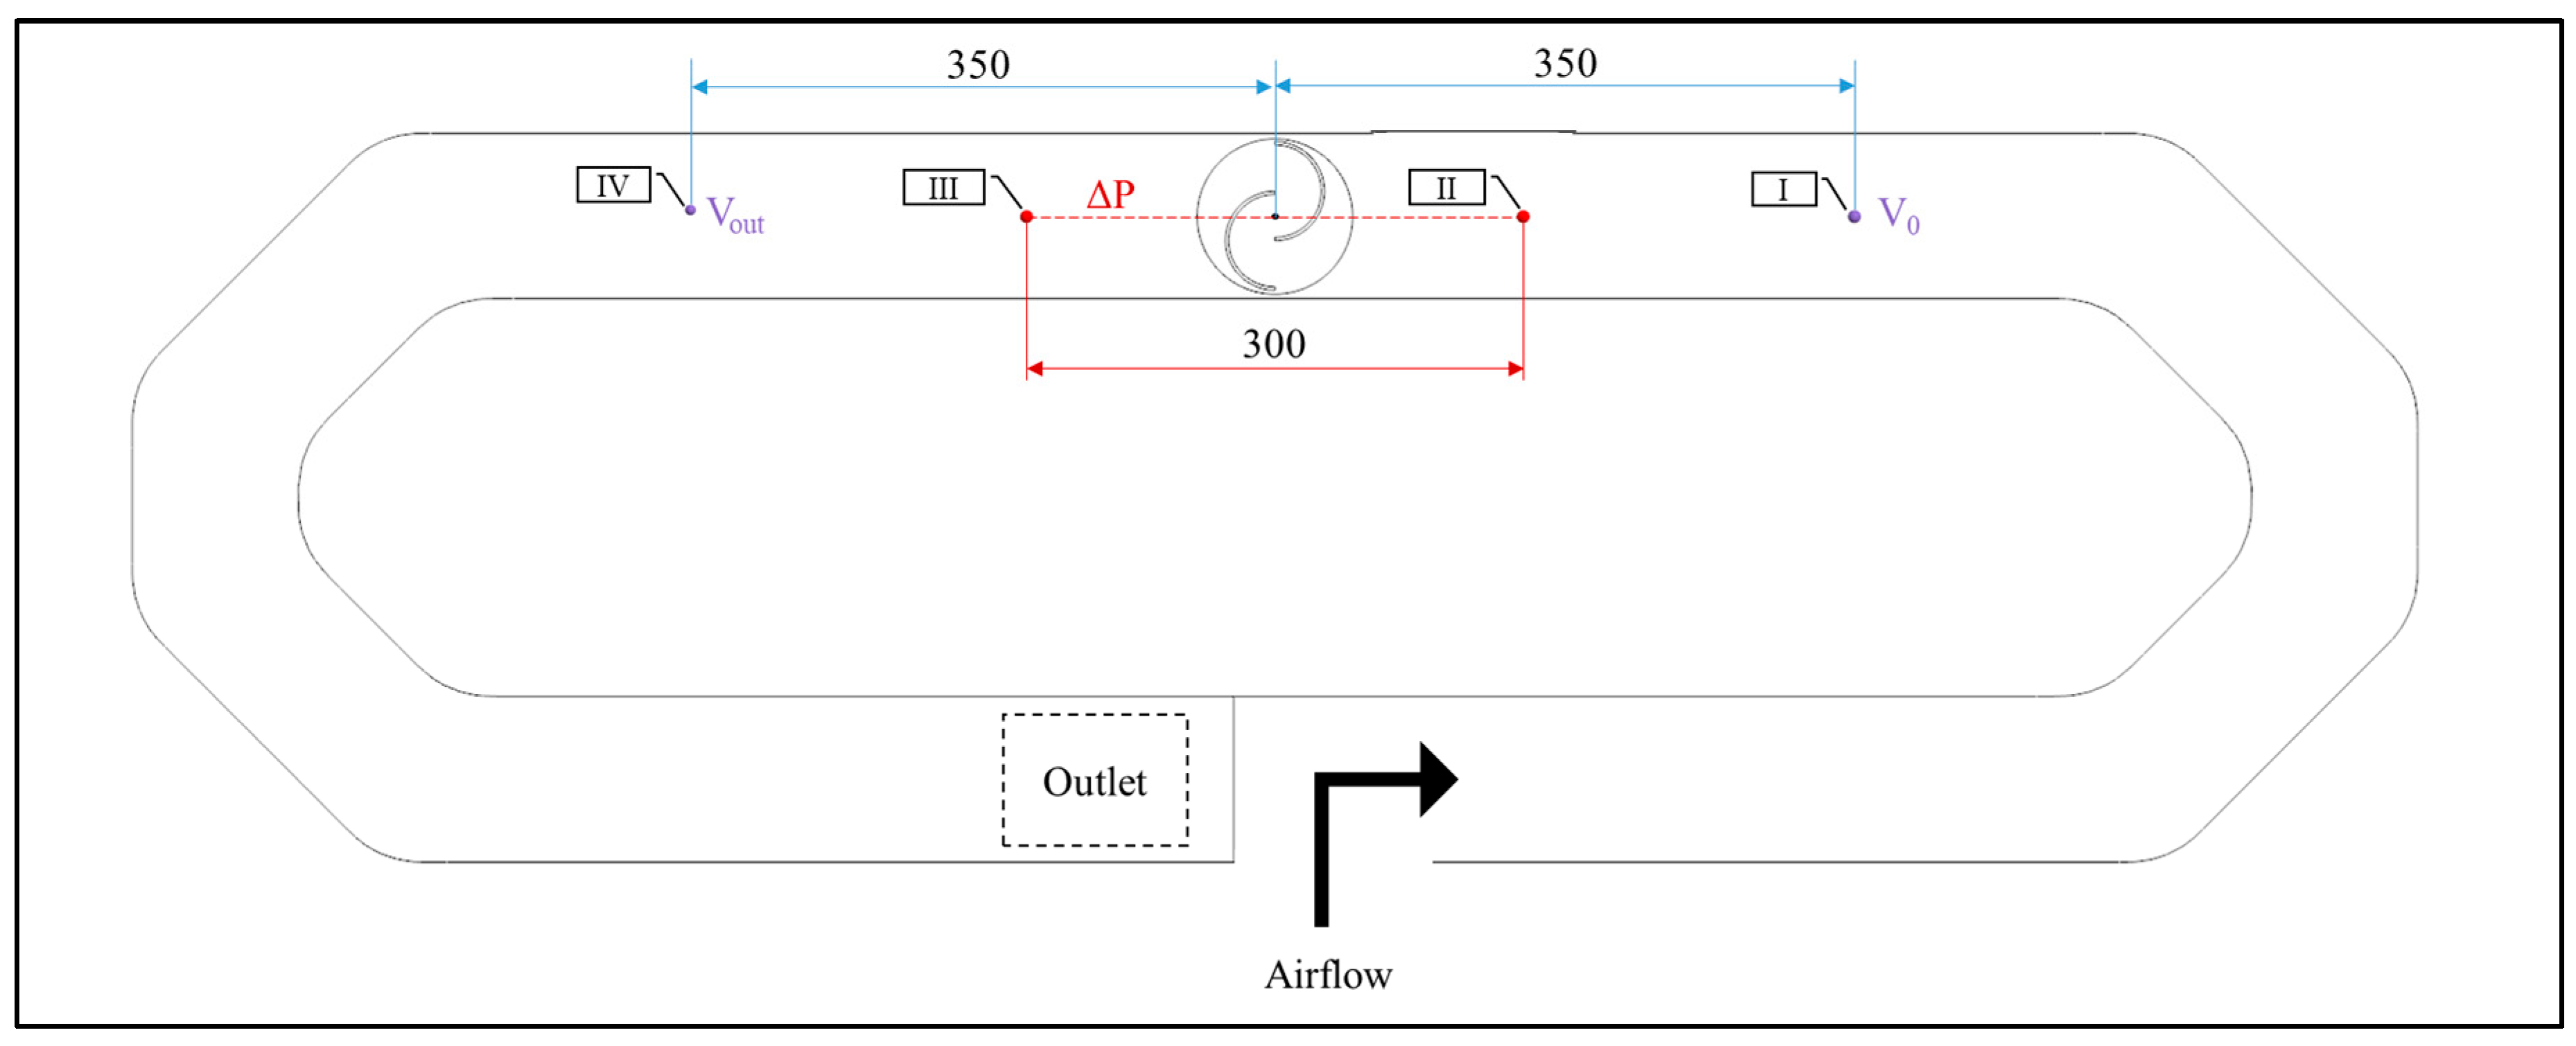
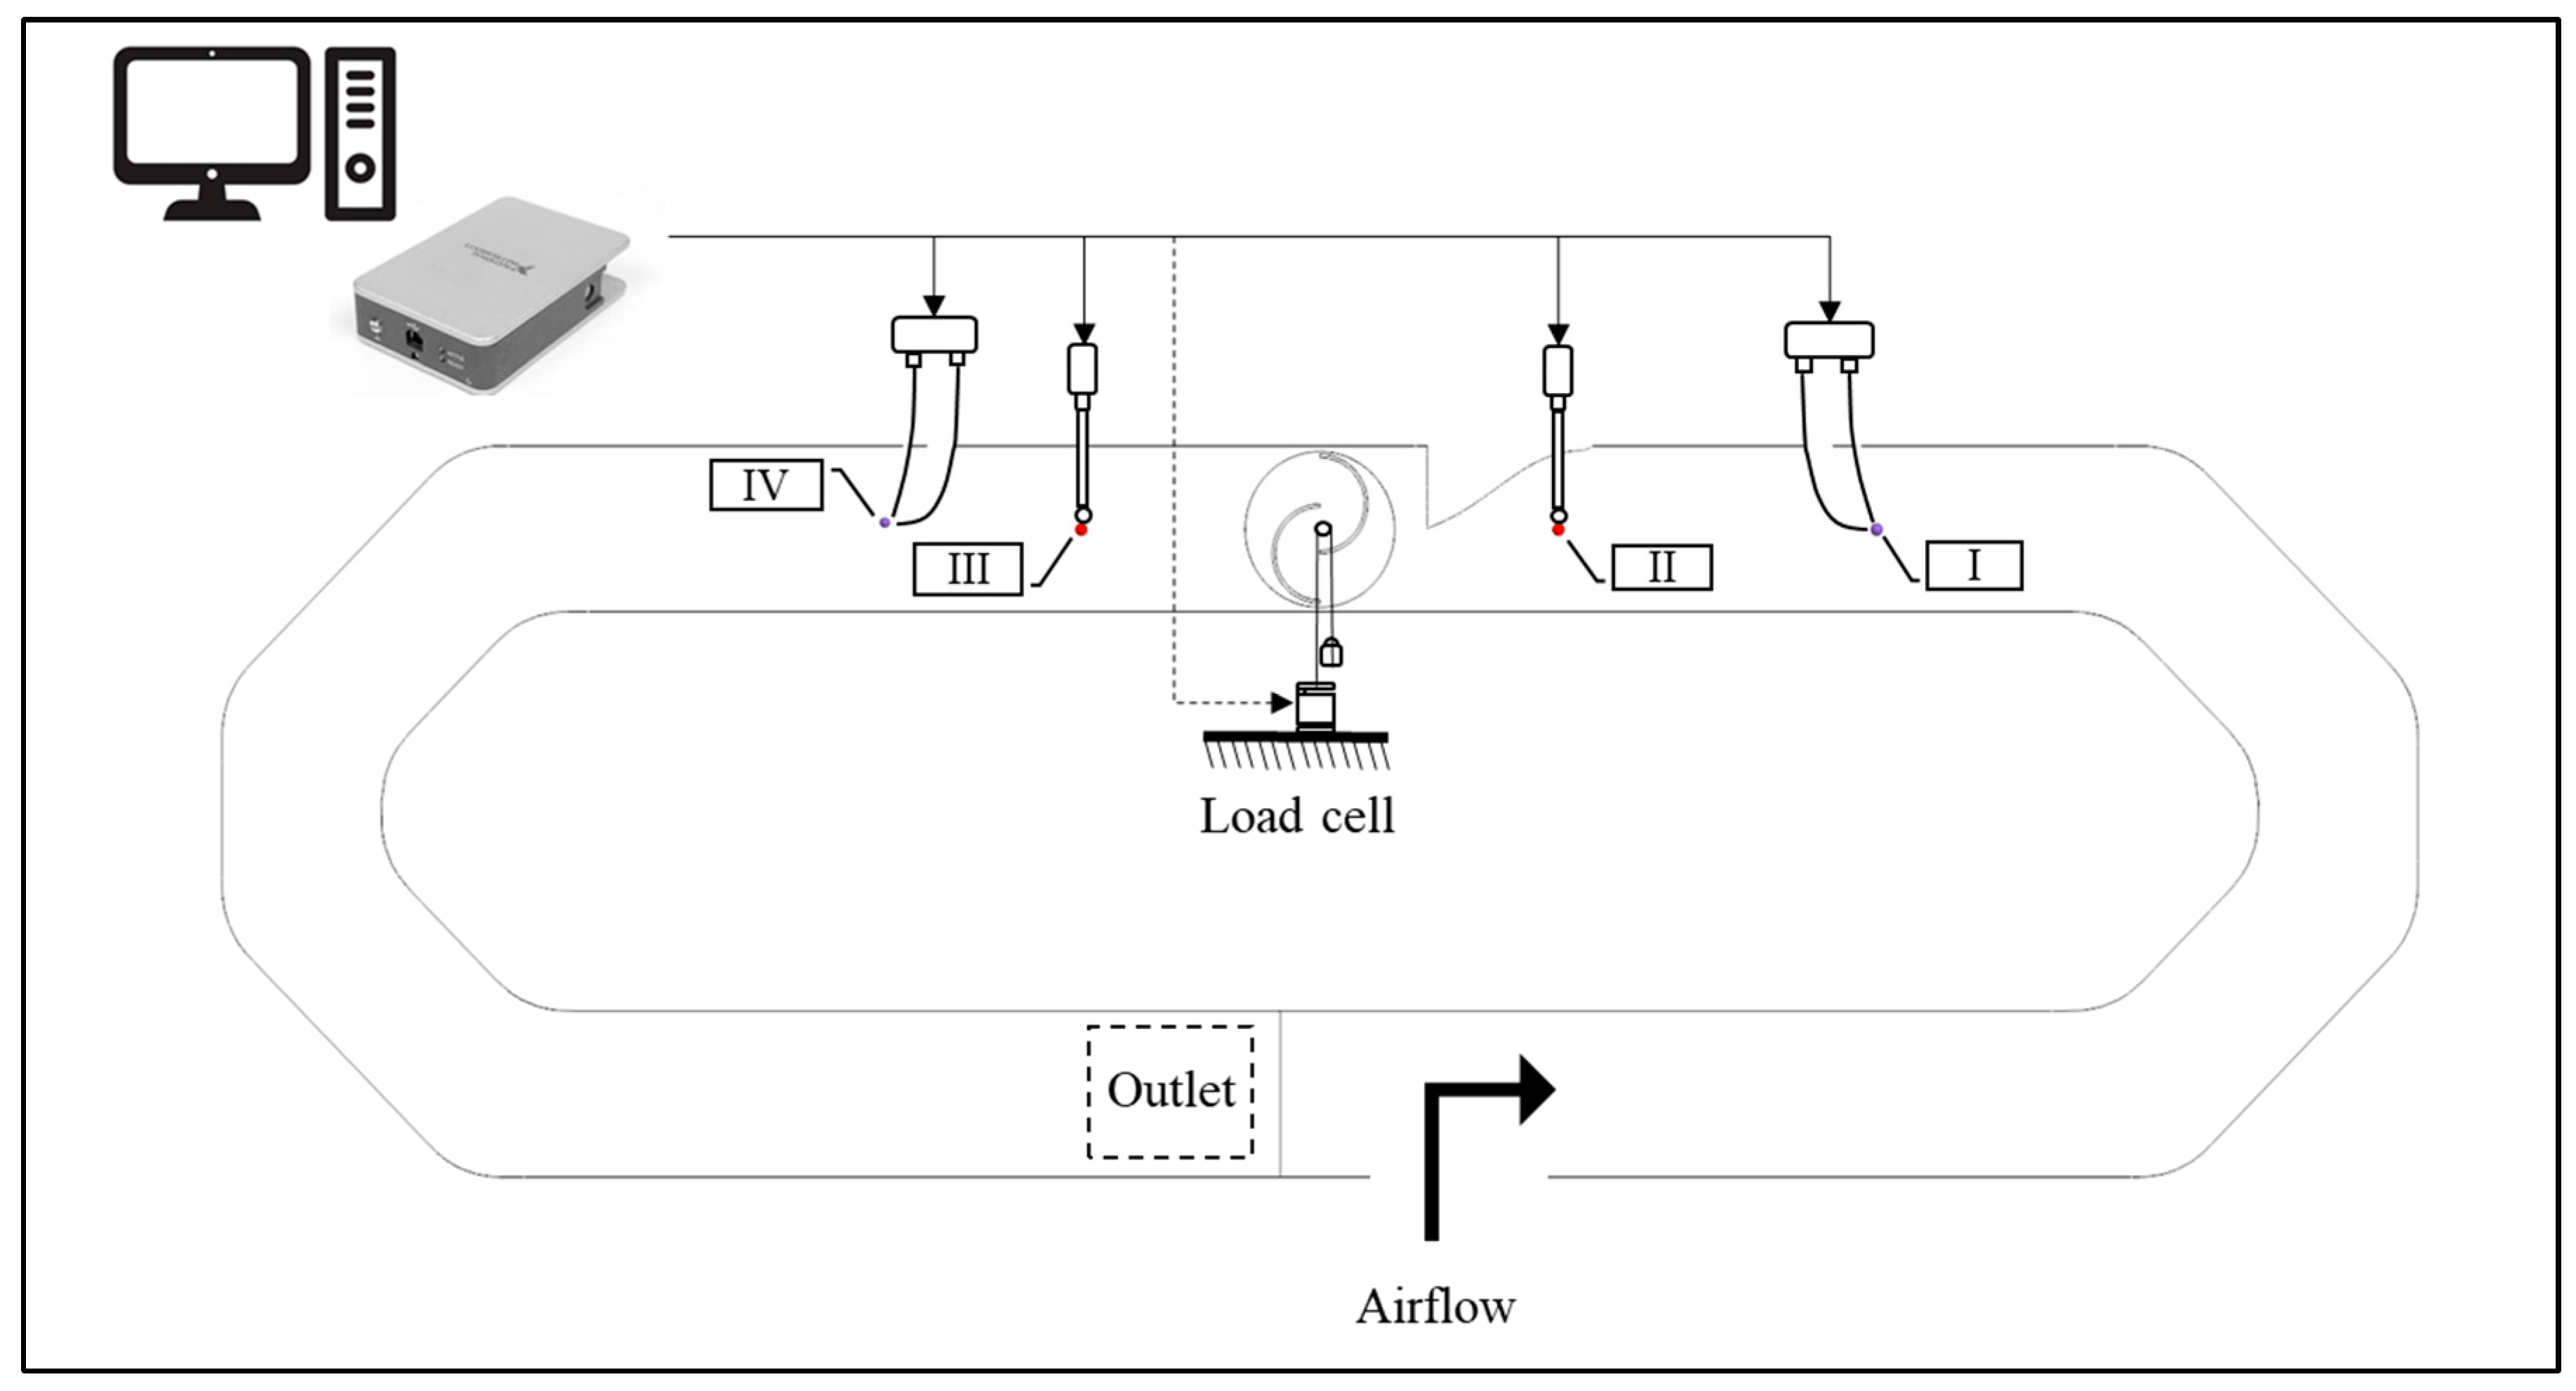
The schematic representation of the setup is represented in Figure 2.
The Savonius turbine used in this study consists of two blades: a motor blade and a resistant blade. The motor blade is the one that primarily drives the turbine’s rotation by capturing the incoming airflow and generating torque. In contrast, the resistant blade opposes the flow, creating drag that influences the overall performance of the turbine. This two-blade configuration is typical of Savonius turbines, as it allows for a simple yet effective self-starting mechanism and ensures continuous rotation by utilizing the differential pressure between the two blades.
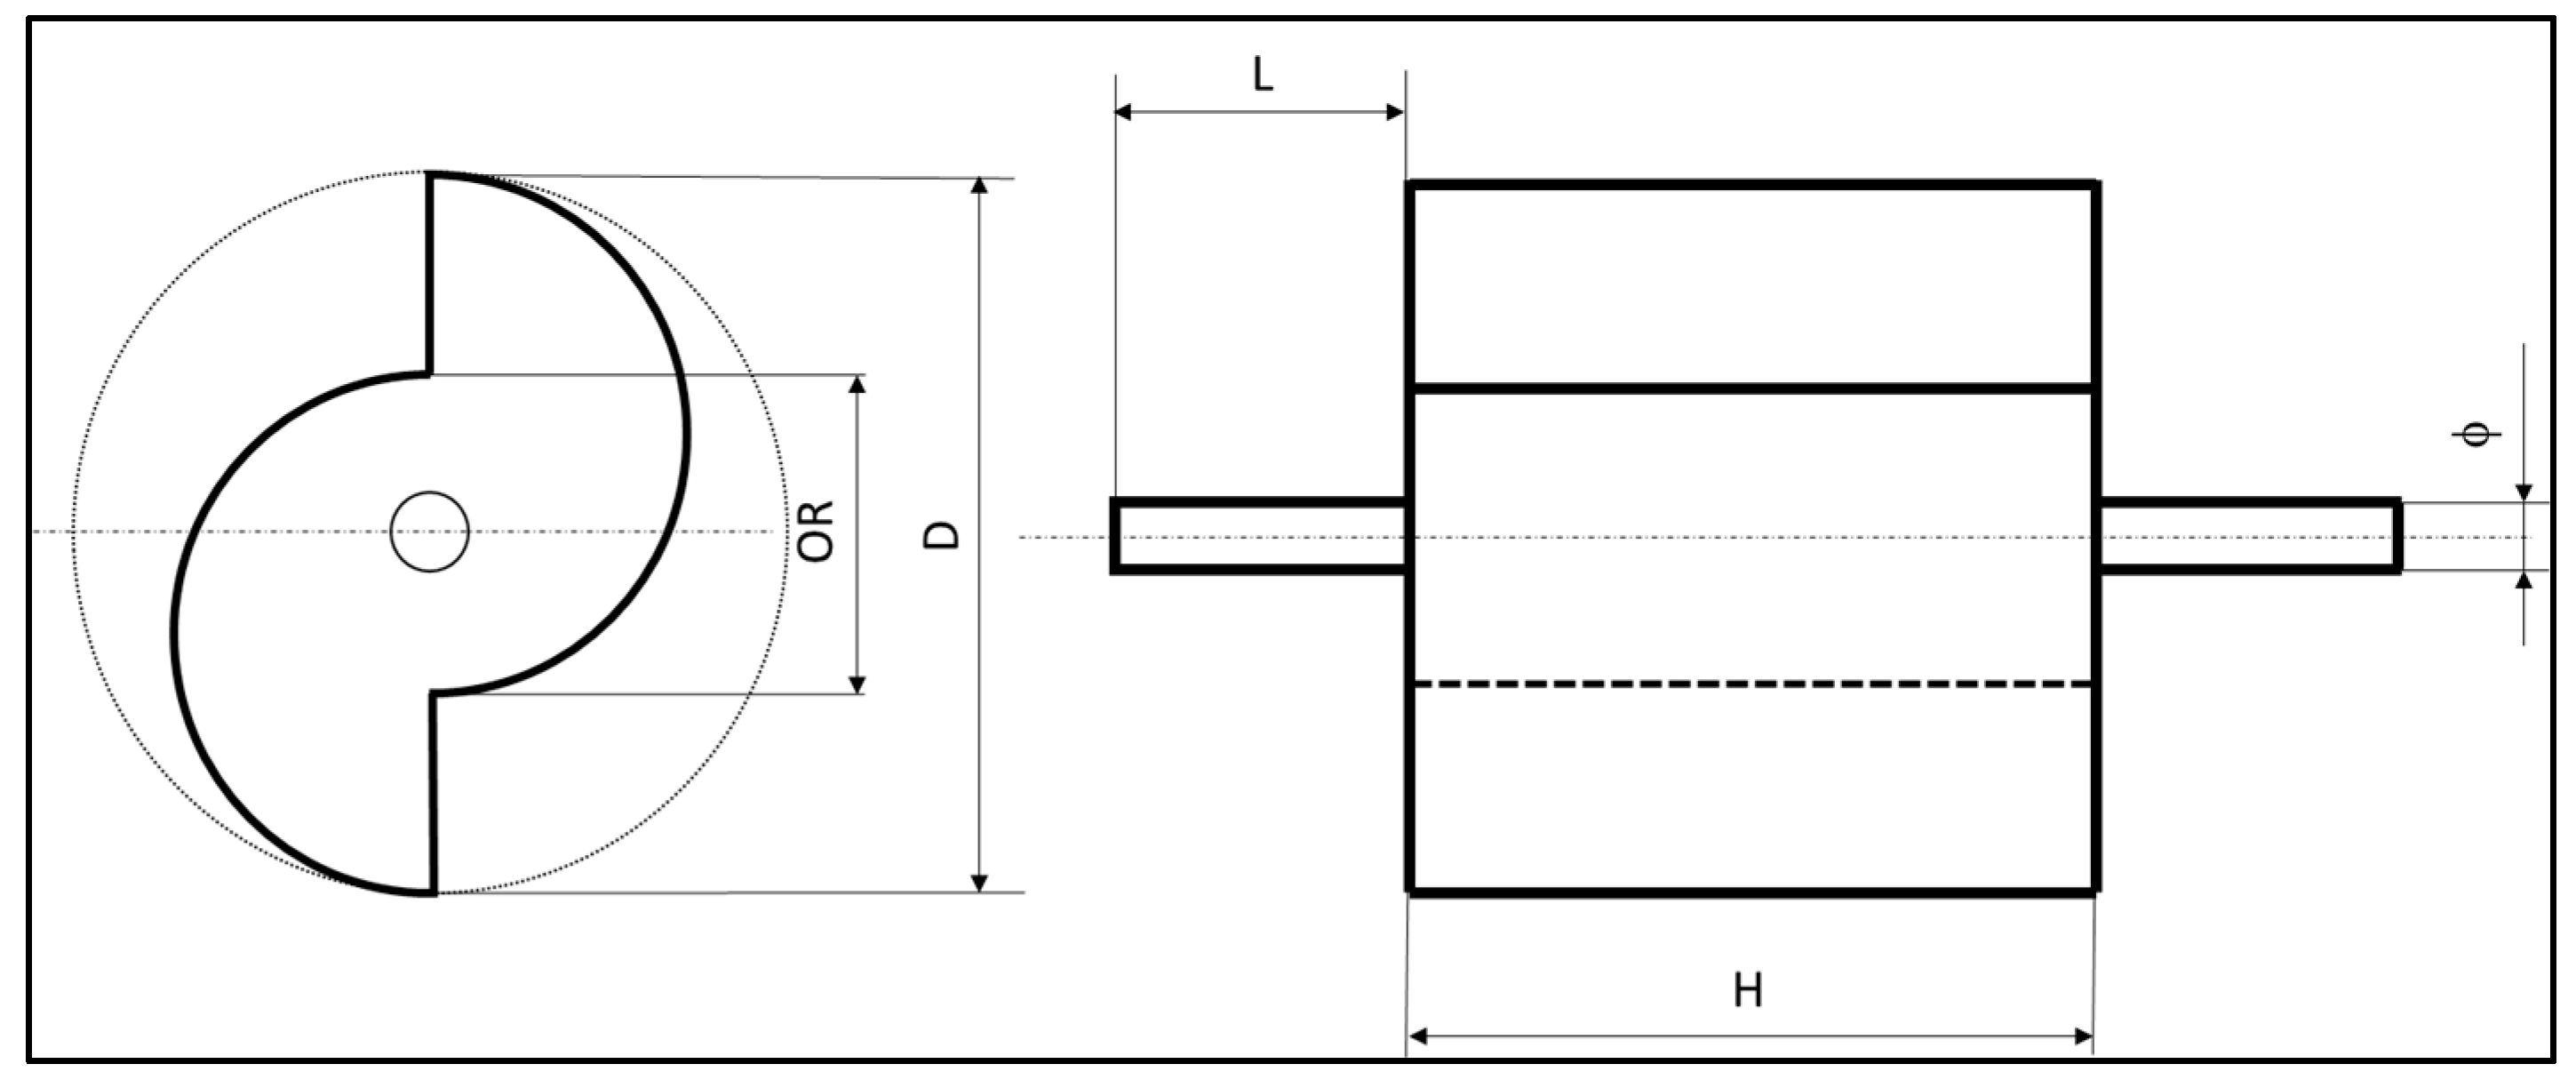
The turbine (Figure 3) was 3D printed in PLA.
The principal dimensions are listed in Table 1.
The airflow is generated by a centrifugal fan, the EBM Papst G1G133-DE19-15 (Mulfingen, Germany), powered by a 24-volt DC voltage. This fan operates at a rotational speed of 2000 r/min, has an outlet section measuring 59 × 71 mm and a mass flow rate of 0.0653 kg/s. In the present study, only mono-directional tests were conducted.
The test on a certain configuration was repeated at least five times to ensure the repeatability of the measurement.

2.2. Measurement System

The system’s measurements were obtained using two velocity sensors, a load cell, and two pressure sensors.
Data acquisition was managed through an NI cDAQ 9171 analog board, which processes signals from the sensors. These signals were analysed and controlled via LabView 2020 software on a computer. Looking at Figure 4, the NI cDAQ 9171 was connected to the Pitot tubes, to the pressure probes, and to the load cell as well.
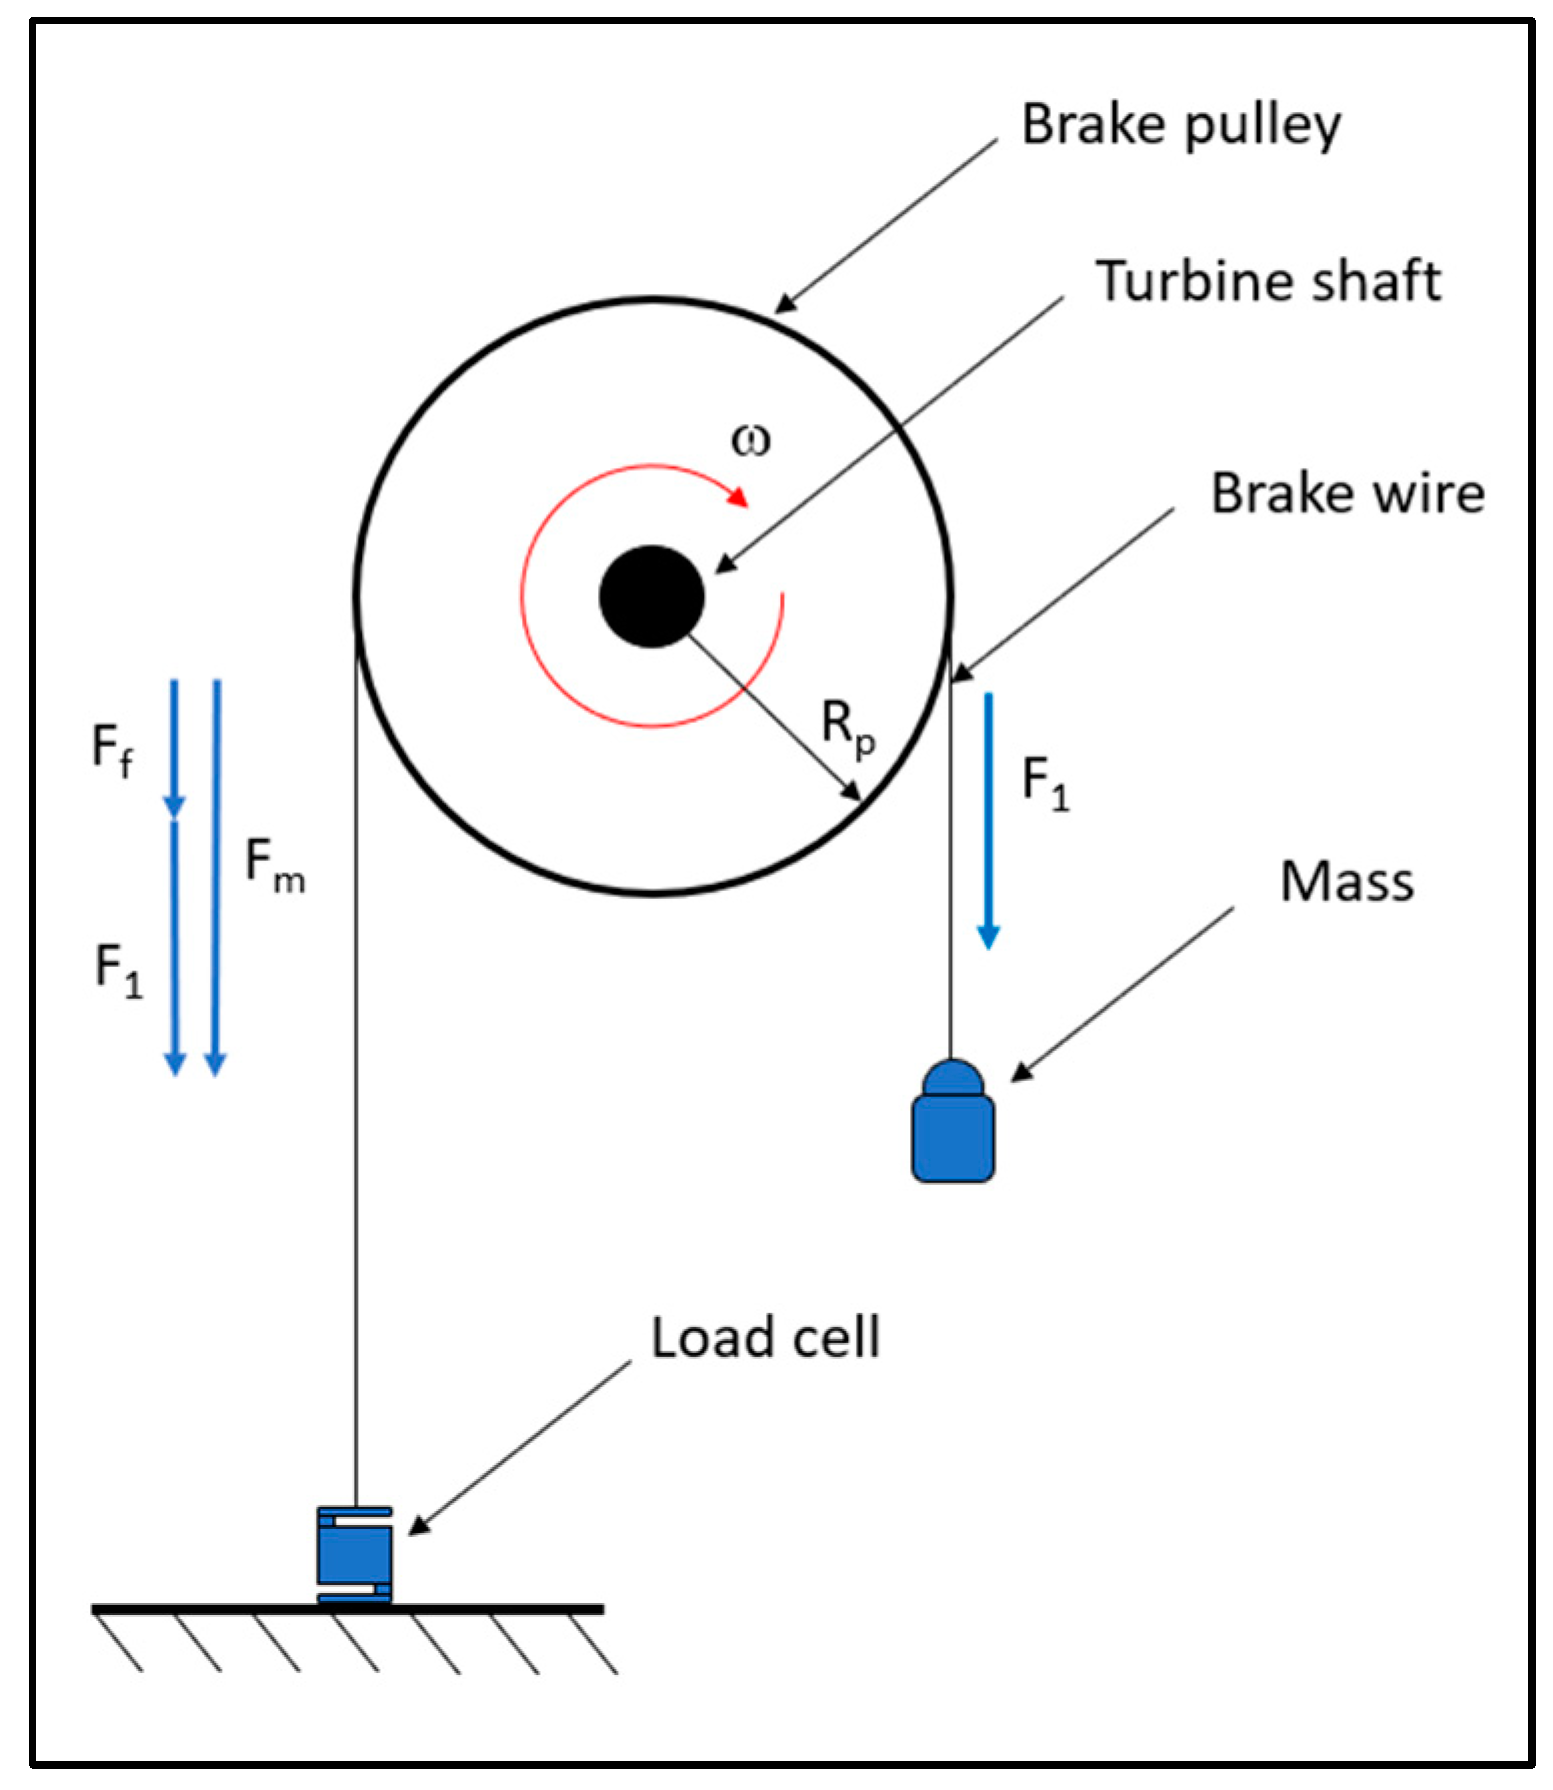
To determine the torque produced by the turbine, a belt brake system was implemented, consisting of a pulley, a nylon wire, a suspended mass, and a load cell (Figure 5).
The load cell can measure between −5 N and +5 N and has an uncertainty on the measurement of ±0.1% on the full scale.
The nylon wire is fixed at one end to a load cell anchored to the ground, runs over the pulley, and has a hook at the opposite end where masses can be suspended. Since the pulley is directly connected to the turbine shaft, its rotational speed varies depending on the suspended mass. Figure 5 provides a schematic representation of the system and the balance of dynamic forces.
  • F 1 : weight force.
  • F f : friction force acting on the pulley.
  • F m : force measured by the load cell.
Under static conditions, since F f = 0 :
F m = F 1
However, under dynamic conditions, the force measured by the cell will be as follows:
F m = F 1 + F f
The torque T, expressed in N·m, can, therefore, be calculated.
T = F m · D p u l l e y / 2
To measure fluid velocity within the test tube, two Pitot tubes were positioned 100 mm from the bends in the upper section (I and IV in Figure 2). These tubes are immersed in the fluid—one oriented upstream and the other downstream. Each tube features a front-facing hole serving as the total pressure port, while additional holes along the tube measure static pressure.
Fluid velocity is determined using Bernoulli’s equation:
P s t + 1 2 ρ V 2 = P t o t
V = 2 P t o t P s t ρ = 2 Δ P ρ
The data obtained from the Pitot tubes and the pressure taps located upstream and downstream of the rotor ΔP were analysed using a pressure transmitter. Three DeltaOhm HD420T devices (Caselle di Selvazzano, Italy) were utilized: two assigned to the Pitot tubes and one dedicated to assessing the pressure drop near the turbine with the probes II and III (Figure 2). The measurement range of the Pitot tubes is ±50 Pa and the uncertainty is ±0.1% on the full scale; the pressure probes can measure between ±250 Pa and have an uncertainty of ±1% on the full scale.
To determine the rotational speed of the turbine, a rotary encoder was implemented. This device was placed in front of a ring featuring alternating black and white bands, generating a voltage signal corresponding to the detected band. The output is a square wave signal.
Each time the encoder identifies a white band, it registers a peak in the signal. The number of pulses per second (PPS) can be determined using Equation (5).
P P S = P P S t o t T i m e
represents the total pulses recorded during the test, while the recording period is given in seconds.
Since the encoder ring consists of eight white bands, the rotational speed of the turbine in revolutions per minute (r/min) is calculated once the PPS is obtained.
n = P P S 8 · 60
The data acquisition process consists of two stages: one in which the fan is not operational and another in which it is switched on. By analysing the data from both conditions, it is possible to determine the turbine’s torque and effective power, as the friction force on the pulley becomes negligible in the second phase.
LabView software was employed for data recording, with a measurement duration set at 20 s and a sampling interval of 0.001 s. The recorded parameters included the force measured by the load cell, the pressure drop detected by the Pitot tubes, and the voltage output from the encoder.
Additionally, to enhance accuracy, it was necessary to recalibrate the load cell before testing. This step ensured that the mass of the screw, nylon wire, and hook did not interfere with torque calculations, thereby isolating the actual measurements.
Given that each acquisition cycle produces 20,000 data points, an average of all recorded values is computed to determine the mean airflow velocity V 0 , the mean pressure differential Δ P across the turbine, and the mean applied load T .
Specifically, the airflow velocity and the applied load can be derived from Equations (8) and (9).
V 0 = 2 · Δ P P i t o t ρ
L = 1 n d a t a · L o a d O N L o a d O F F
where
  • n d a t a , number of registered data;
  • L o a d O N , load measured with the fan on;
  • L o a d O F F , load measured with the fan off.
The power W of the turbine and the available power Win are expressed in Watts.
W = 2 π · n 60 · T
W i n = 1 2 · ρ · A t u r b i n e · V 0 3 + Δ P · A t u r b i n e · V 0
Once these parameters have been established, the power coefficient C p and the tip speed ratio λ can be calculated.
C p = W W i n
λ = 2 π · n · D t u r b i n e 120 · V 0
Since the measurements were averaged over the recording period, the calculated performance coefficients represent time-averaged values rather than instantaneous readings.

2.3. CFD Setup

The experimental setup geometry was recreated in a CAD model, which was then imported into a CFD model on Simcenter STAR-CCM+ 2402.
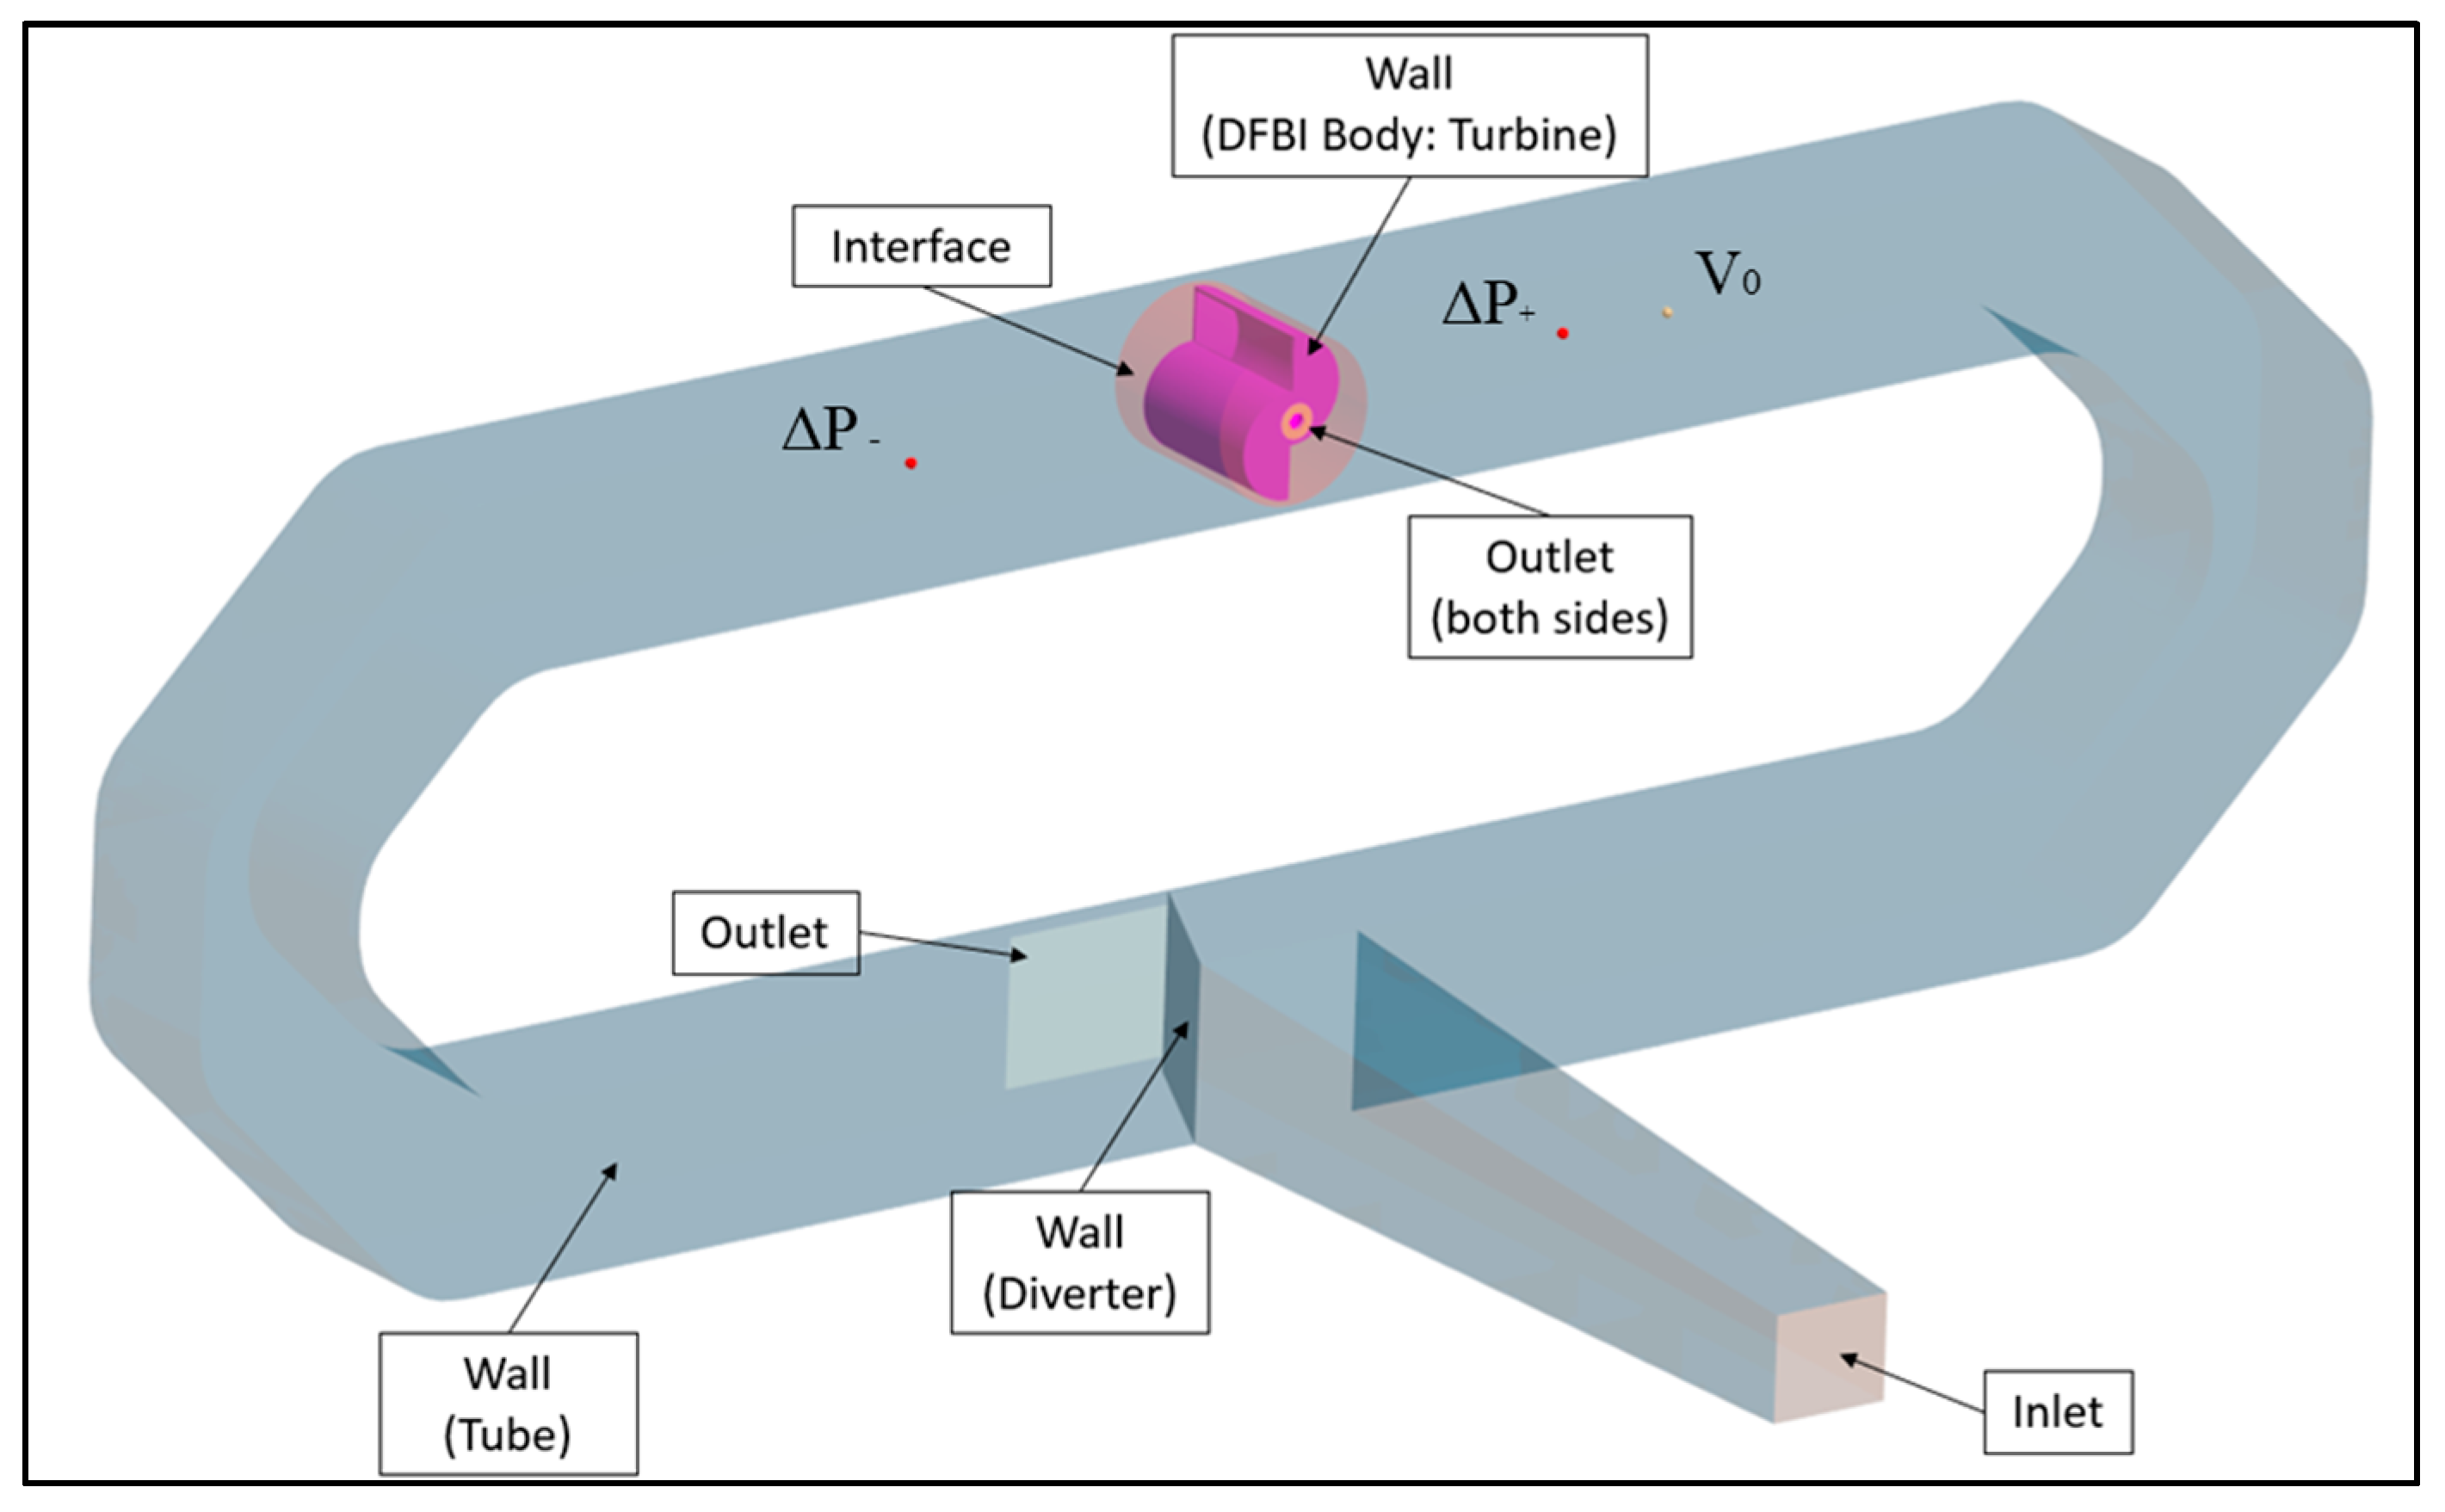
The computational domain (Figure 6) consists of the test tube and an inner rotating region within the tube, which contains the turbine.
In the experimental setup, the test tube wall is perforated at the turbine axis with a diameter larger than that of the shaft itself, allowing for its rotation. This condition was also incorporated into the model by applying two outlet conditions to the circular region surrounding the shaft. To speed up the calculation process, the decision was made not to include the fan but to apply a Mass Flow Inlet condition with an airflow rate equal to that generated by the fan itself to a surface that would correspond to the outlet section of the fan. The applied mass airflow rate is 0.0653 kg/s.
The percentage of flow exiting through the two lateral outlets, combined with the flow leaving the tube outlet, corresponds to the airflow rate defined at the inlet.
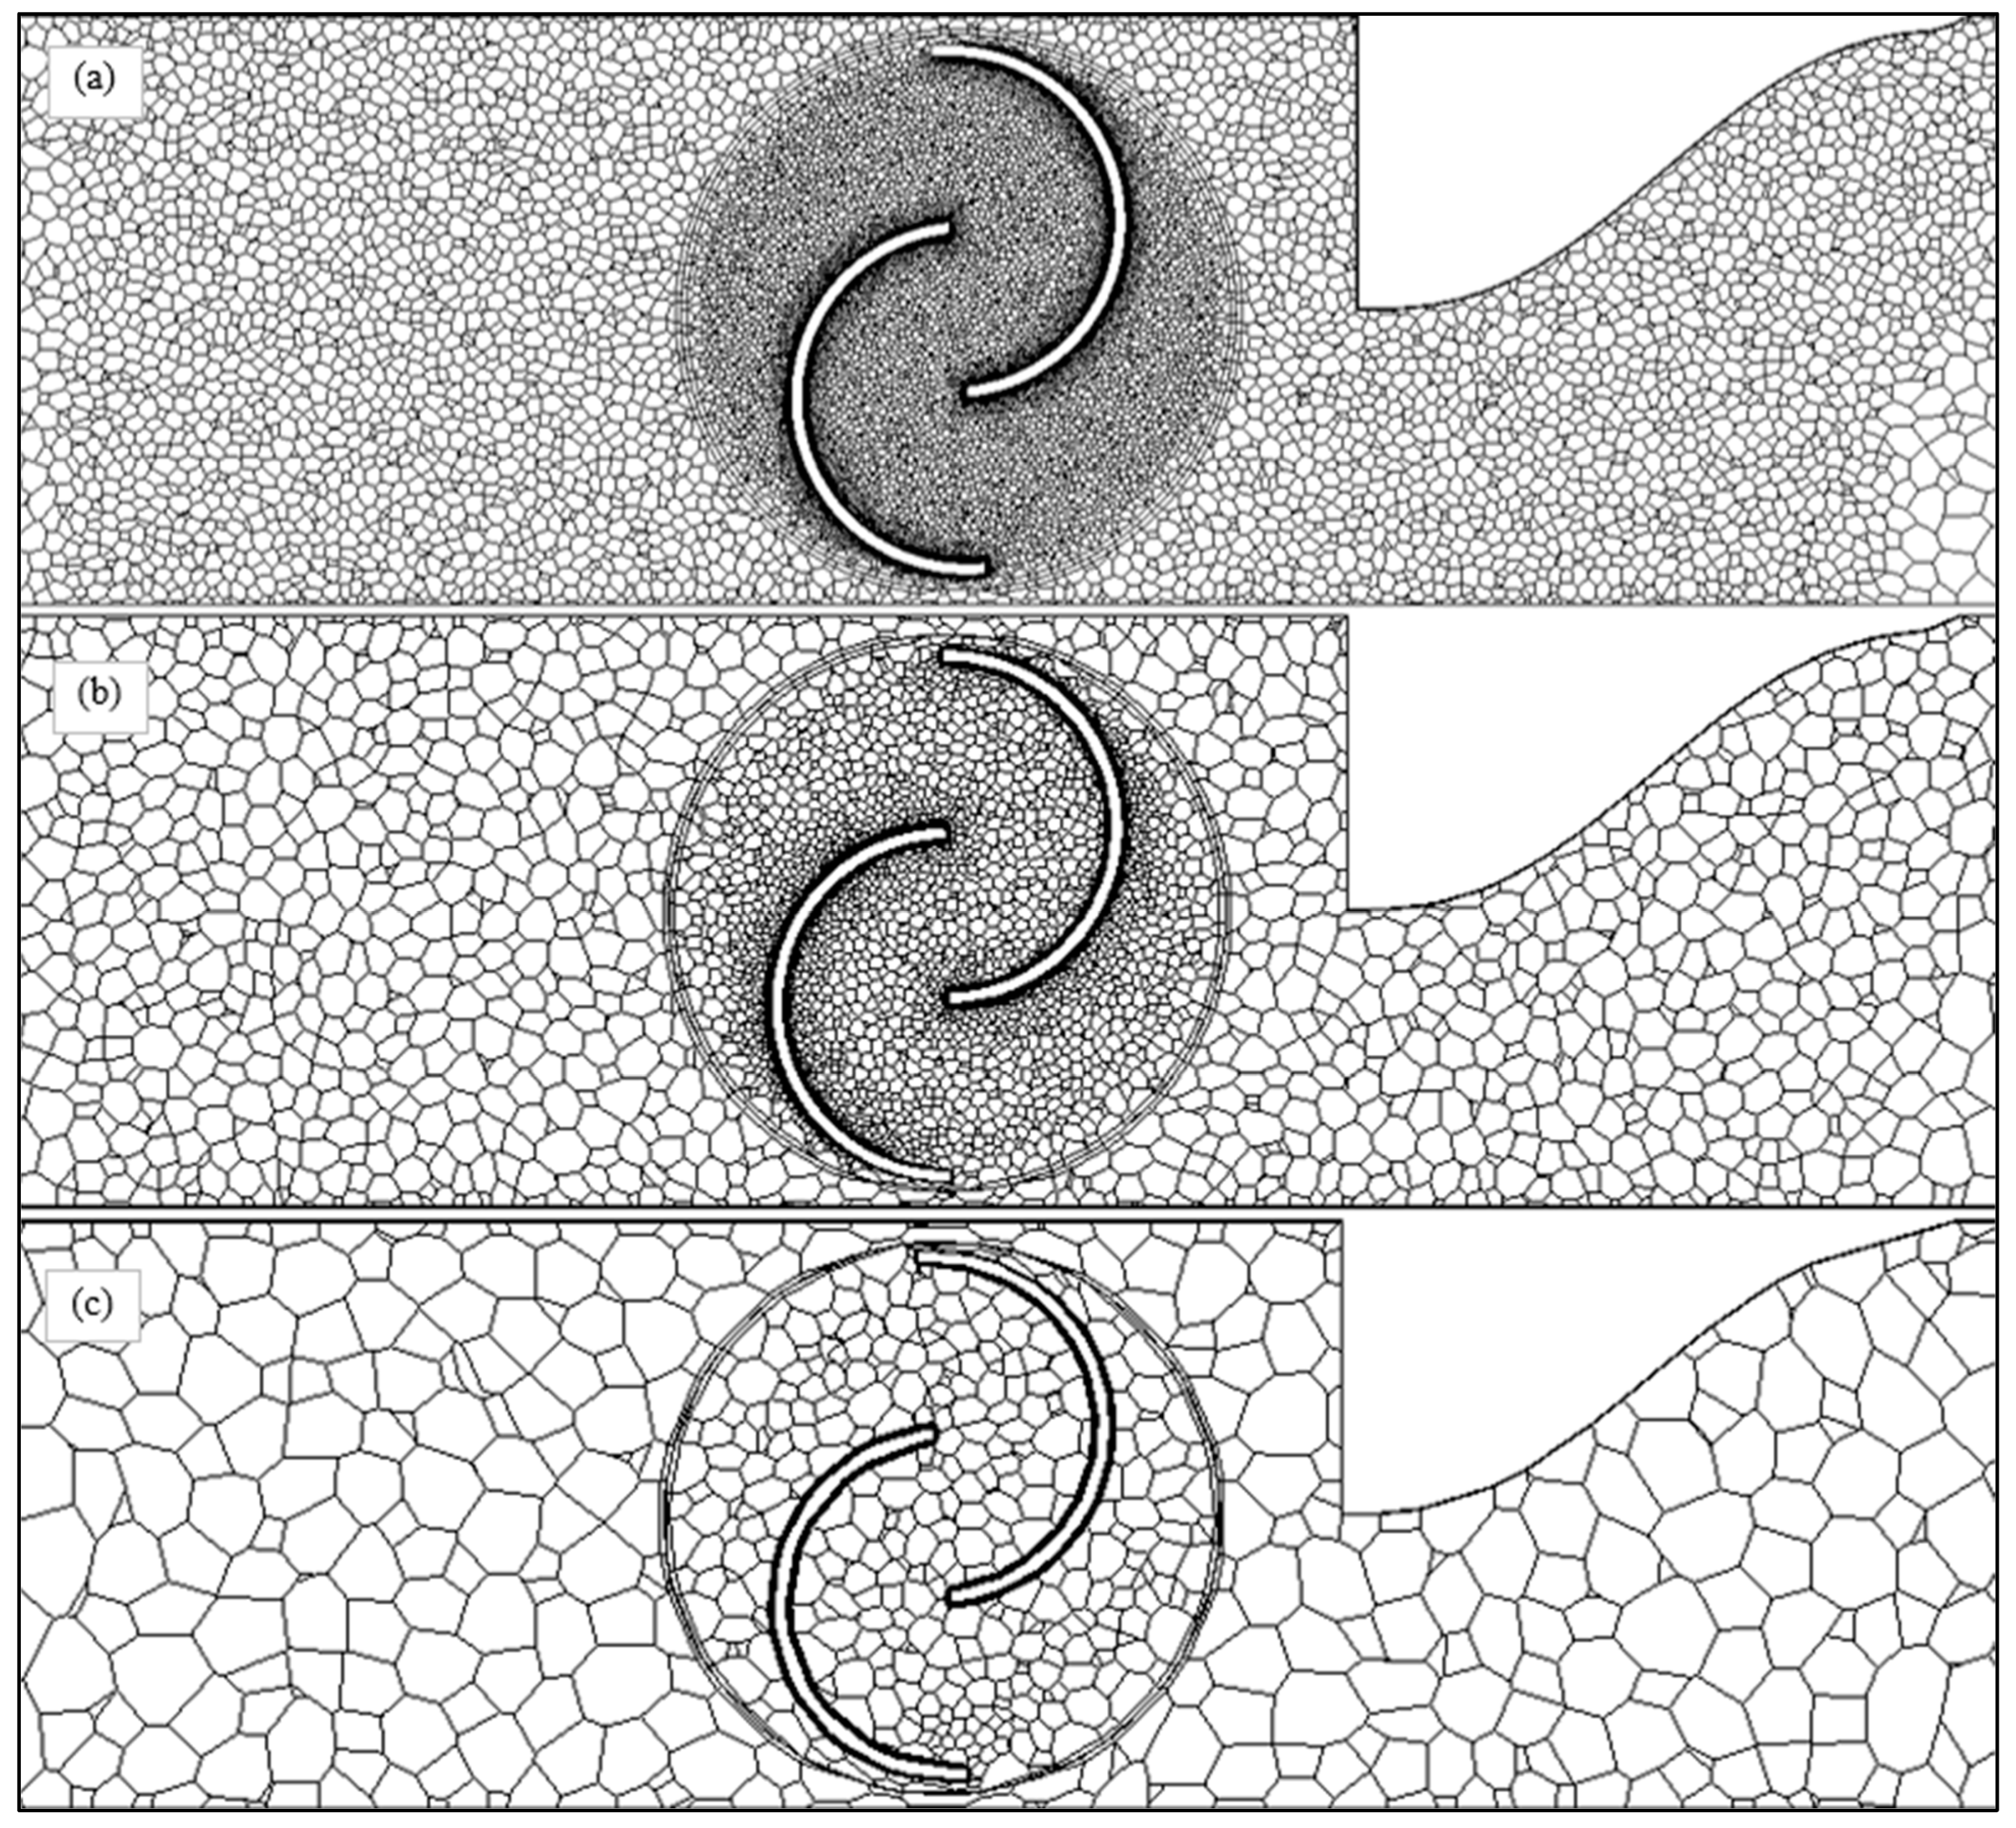
The domain was meshed using a Polyhedral Cell Mesher with a base size of 0.01 m that goes down to 0.002 m in the parts where a higher refinement is required (Figure 7). A total of 327,759 elements are distributed across both the Moving Region and the Tube Region (without PA).
The turbine is contained within a Sliding Mesh, which rotates according to the DFBI rotation and interfaces with the fixed domain through a layer of Prism Layers.
The interface between these two regions is defined by two prism layers, each with a thickness of 1 cm. The boundary layer on the blades is captured using six prism layers, with a combined total thickness of 1 mm. The sensitivity analysis conducted on the mesh is reported in the Appendix A.
In the simulation, virtual probes were placed at positions corresponding to those in the experimental setup to measure the pressure drop before and after the turbine, as well as the upstream velocity.
The turbine was modelled with a Dynamic Fluid Body Interaction (DFBI) model freely rotating around its axis, subject to gravitational and fluid-induced forces. The complete boundary conditions are reported in Figure 6. In the DFBI settings, the moments of inertia and the mass of the turbine were specified to ensure that the virtual turbine would behave like the real one when subjected to the action of the fluid.
In the blocked rotor simulations, the DFBI is deactivated, and the region surrounding the turbine remains fixed.
The time discretization is Implicit Unsteady, with the time step size being controlled by the Adaptive Time Step model, which ensures that the Courant number is always less than 1.
The chosen turbulence model is the SST Menter k-ω. The k-ω model provides accurate predictions of the turbulence behaviour in the boundary layer, which is important for capturing the effects of the fluid’s interaction with the turbine’s surfaces. Additionally, it performs well for low Reynolds number flows, which are typically encountered in turbine simulations. This makes it particularly suitable for the current study, where the flow characteristics around the turbine play a crucial role in the performance analysis [27].
The main physics models are listed in Table 2.

2.4. Power Augmenters

The purpose of the PA is to form a converging nozzle in front of the active blade of the Savonius turbine, as this configuration helps to accelerate airflow. Additionally, the PA serves to shield the turbine section that would otherwise create resistance to rotation (as illustrated in Figure 5).
The PA’s design was selected to facilitate straightforward manufacturing, featuring a uniform shape along the z-axis while also adhering to the spatial constraints imposed by the test chamber. Various curve types can be employed for Power Augmenters, including Spline, NURBS, Bezier curves, and Polynomial curves. For this study, a polynomial curve was chosen to define the PA’s section profile.
In general, increasing the polynomial degree allows for greater control over geometric parameters. However, it also introduces multiple unknowns, which can complicate optimization through numerical methods. A practical balance is achieved with a fifth-degree polynomial, specifically the Bell-Metha polynomial. This equation enables control over key geometric attributes of the profile, such as the maximum profile height—limited by the turbine’s dimensions—as well as the location of the curve’s inflection point. The polynomial equation is given in Equation (14).
y = a ξ 5 + b ξ 4 + c ξ 3 + d ξ 2 + e ξ + f
Here, y represents the PA height, x is a generic length measured in millimeters, L denotes the total length of the PA, and ξ is the dependent variable defined as x/L (Figure 8a).
The PA functions as a converging duct, whose length must satisfy the following condition:
0.667 < L 2 y 0 < 1.79
where y 0 is the radius of the inlet section of the converging duct, expressed in millimeters. These limits were determined experimentally: the lower bound prevents fluid vein detachment, while the upper bound avoids an excessive reduction in the effective passage section.
By substituting the design values for L and y 0 , the following ratio is obtained:
L 2 y 0 = 103.8 2 · 50 = 1.038
To determine the coefficients of the Bell-Metha polynomial, the following boundary conditions must be imposed.
Geometric constraints:
ξ = 0 y = y 0
ξ = 1 y = y 1
Slope conditions:
ξ = 0 d y d ξ = e
ξ = 1 d y d ξ = 0
Curvature constraints:
ξ = 1 d 2 y d ξ 2 = 0
ξ = 0 d 2 y d ξ 2 = 0
By imposing these conditions and solving using the design data, a system of six equations with six unknowns is obtained.
Apart from e = 0 (original Bell-Metha design), two values of the parameter e were considered: e = 40 and e = 42.
Figure 8b illustrates the setup for the tests, where the PA is positioned at a distance of D/8 from the turbine.
The coefficients for all the tested designs are listed in Table 3.
The three PAs and the turbine were 3D-printed with the same parameters used in [28]. The final objects that were placed inside the test tube are represented in Figure 9.

2.5. Proposed Method for Turbine Performance Evaluation

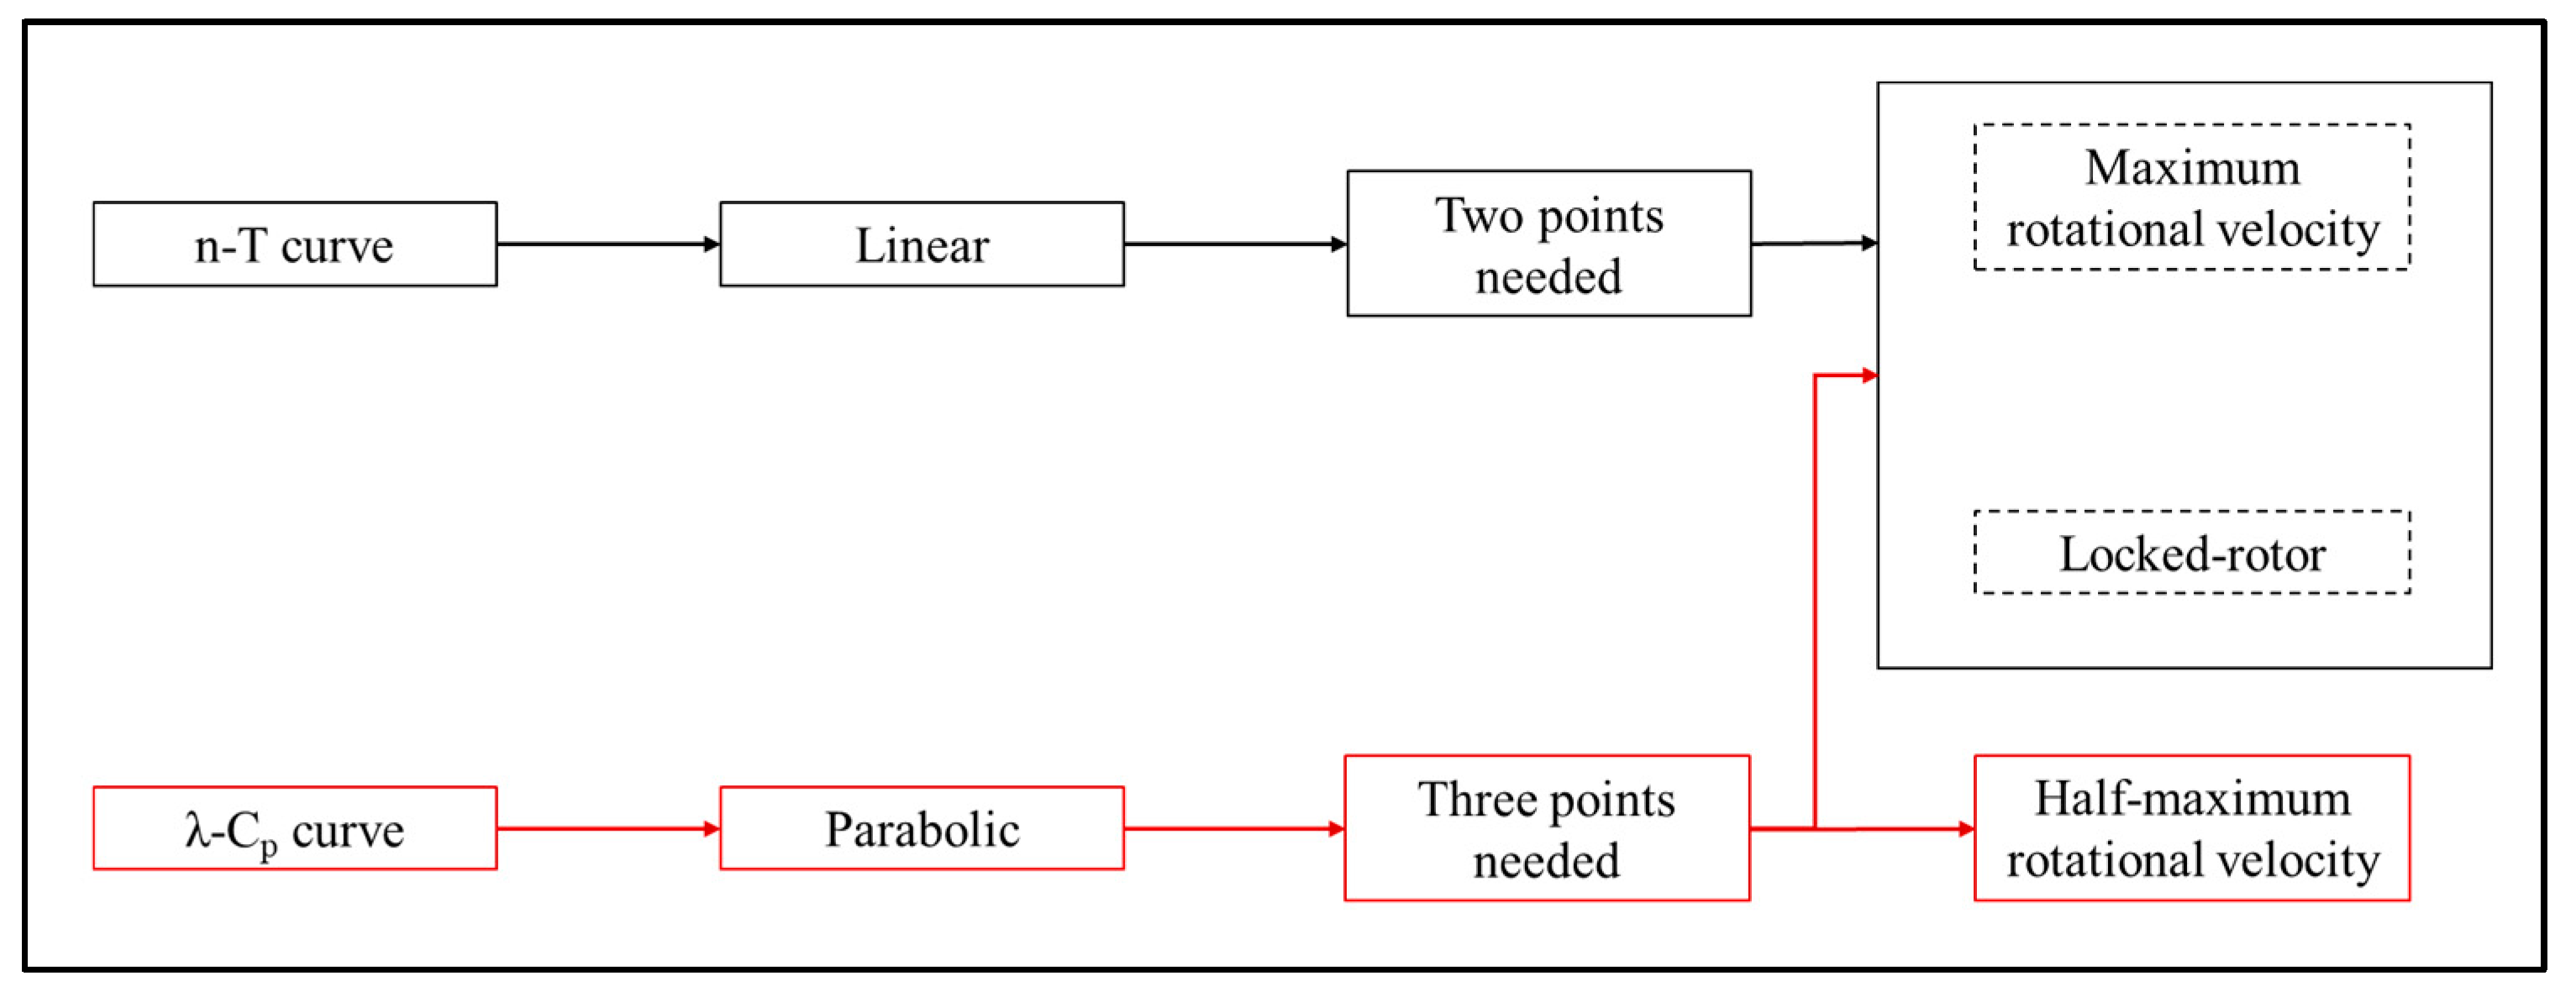
The two characteristic curves of interest for the Savonius turbine are the torque–speed curve and the power coefficient-tip speed ratio curve. The first one has a linear trend, meaning it can be defined using only two points. To achieve this, the torque was calculated at both maximum rotational speed and at zero rotational speed when the rotor is locked, thus obtaining the nT curve.
The second curve, λCp, is parabolic as documented in the literature [29]. To accurately plot it, a third point is needed. This point was chosen at half of the maximum rotational velocity, since at this condition, the power coefficient Cp is expected to reach its peak value. By following this approach, the second curve was also successfully determined with good accuracy. In the results, the reliability of the curves obtained with this method (Figure 10) is evaluated.
With these assumptions, it is possible to define both curves of the turbine with only three numerical simulations, avoiding the time-consuming iterative process of the experimental procedure, where the middle point has to be identified by repeatedly adding and removing masses without prior knowledge of its exact location.

3. Results and Discussion

3.1. Experimental Tests

The experimental tests were conducted in the laboratory, starting with the no-load configuration, where no additional mass was applied. This approach allows for determining the rotational velocity at the maximum tip speed ratio.
After obtaining the first data point, the process continued by gradually adding mass until the turbine could no longer rotate. Each measurement was repeated five times, and the results in terms of mean value and standard deviations are presented in Table 4, Table 5, Table 6 and Table 7.

3.2. CFD Validation and Application of the Proposed Method for Turbine Characterization

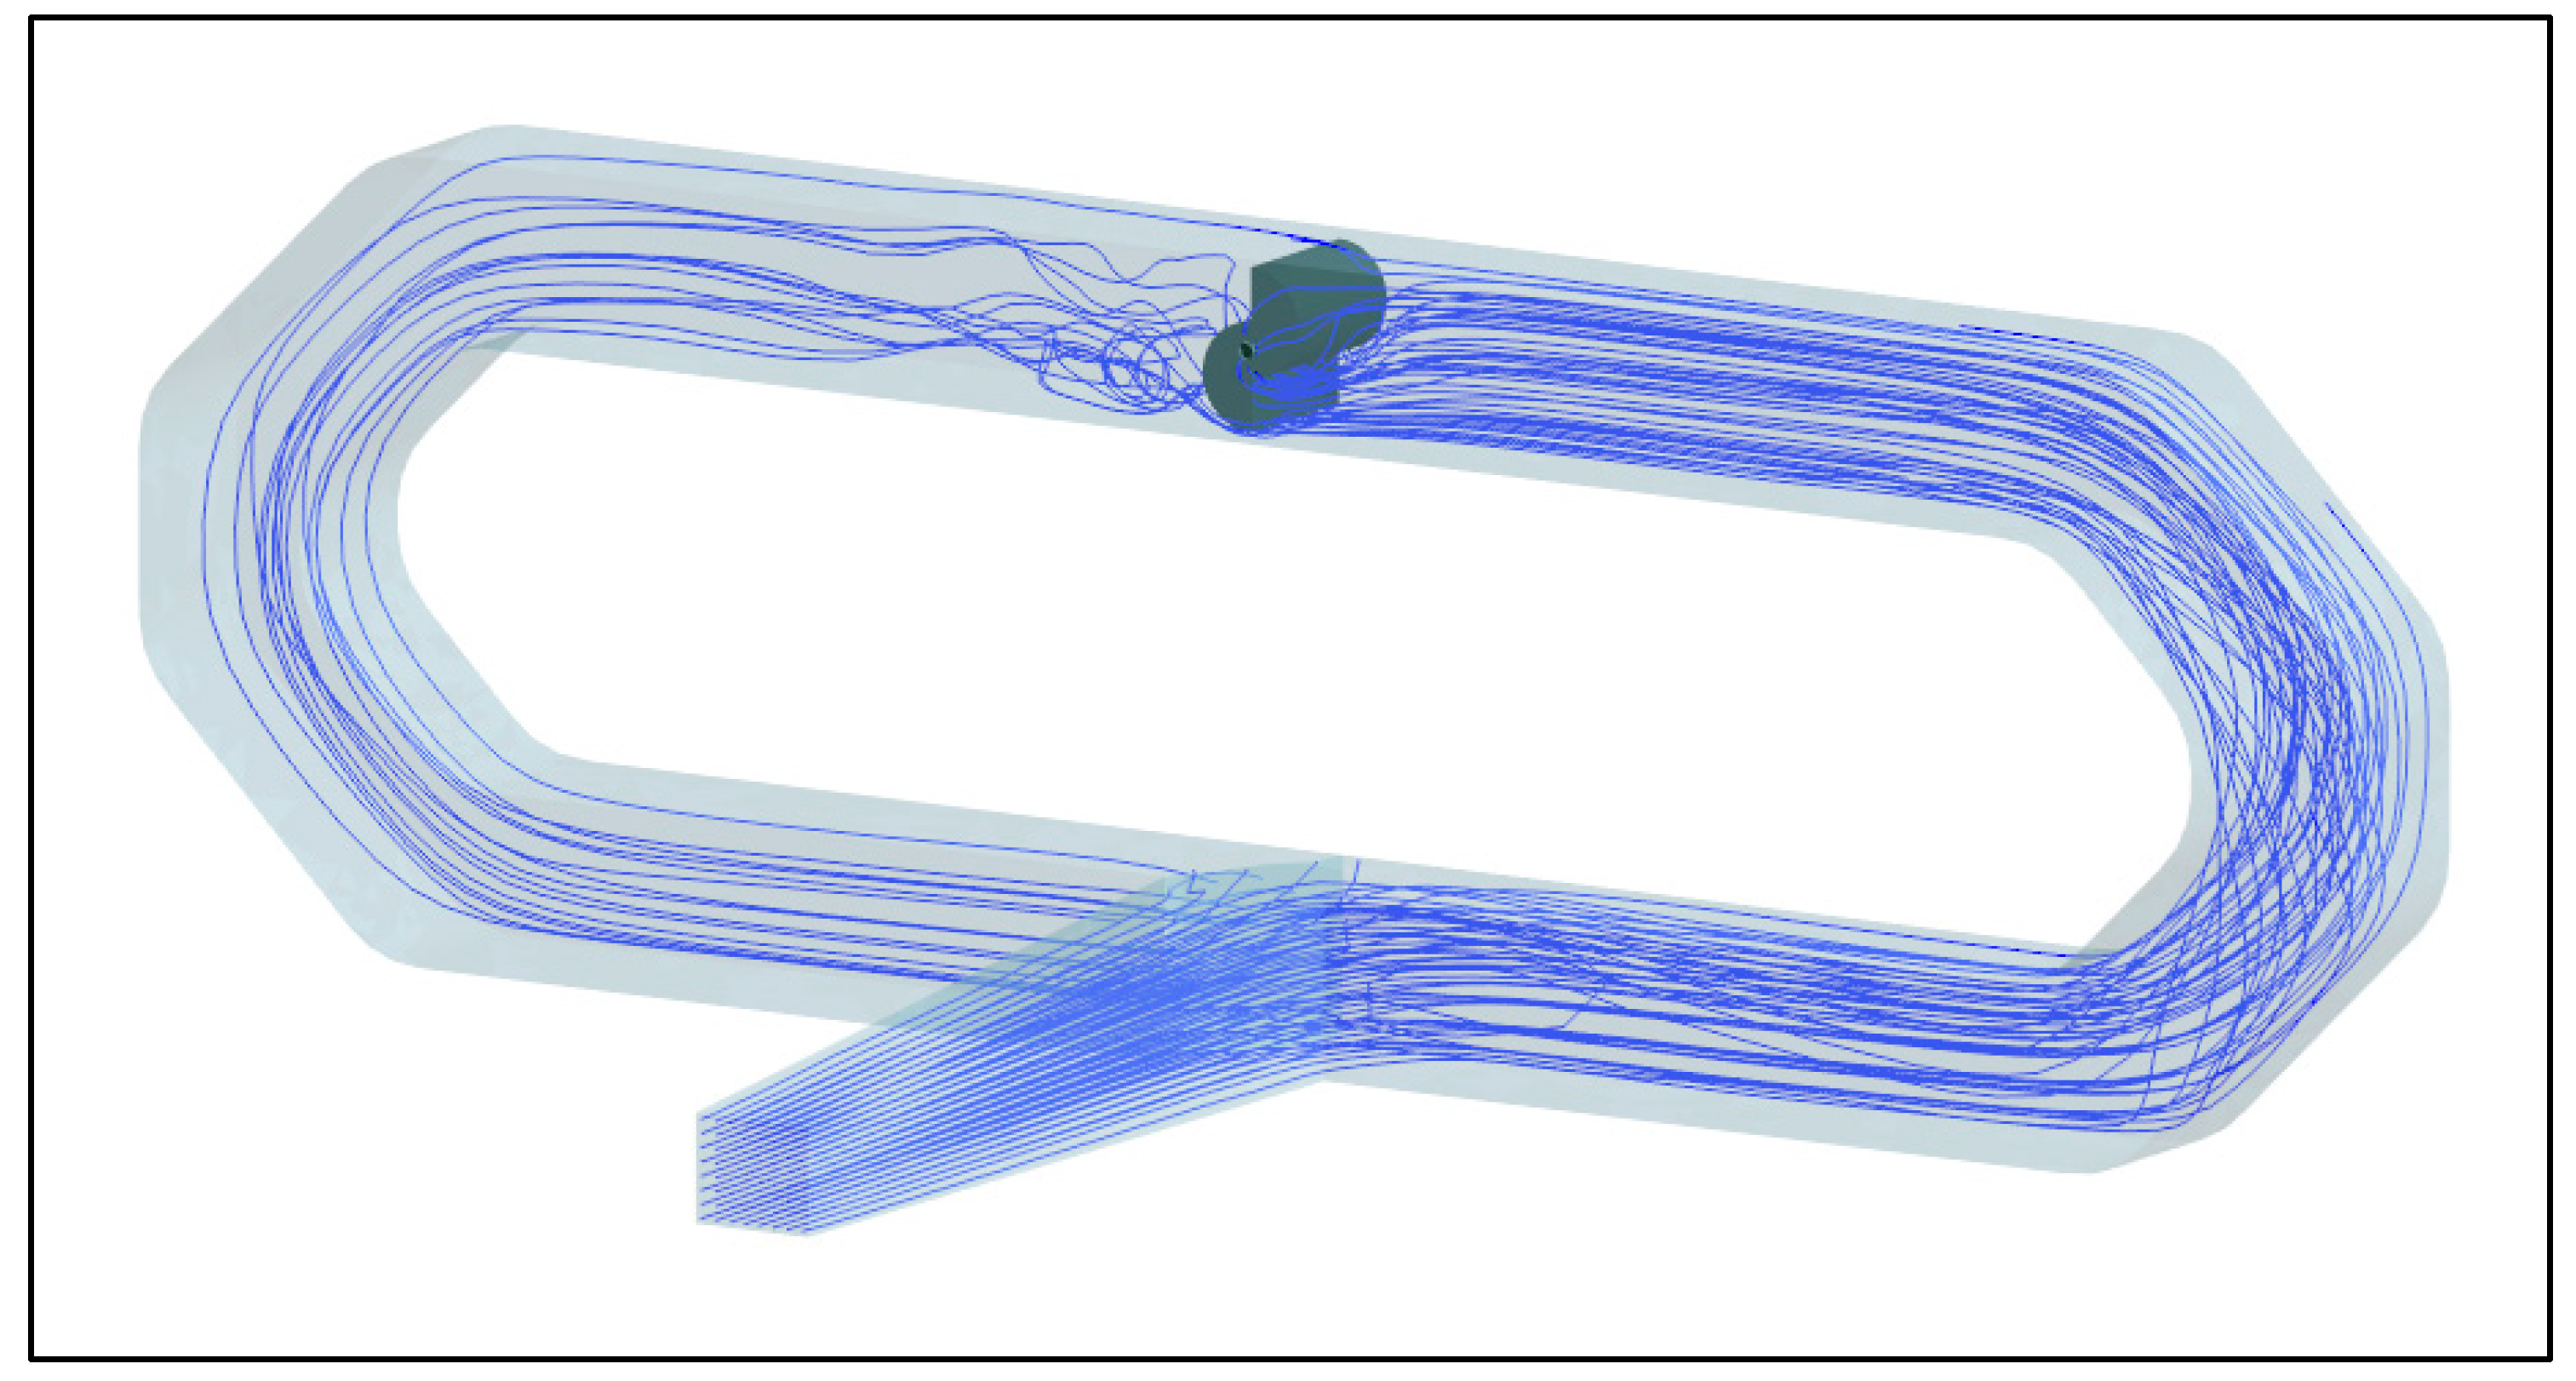
The initial simulation was performed under no-load conditions to determine the maximum rotational velocity. In Figure 11, a streamlines map extracted from the simulation without Power Augmenters is represented. As expected, the flow is deflected from the diverter, passes through the bends of the test tube, impacts the turbine, and exits from its sides and from the back of the structure.
Subsequently, simulations corresponding to the conditions representing the operating states at maximum tip speed ratio, half of the maximum tip speed ratio, and a locked rotor condition were conducted. These simulations were essential for predicting the performance curves both with and without ramps.
The results of the simulations are listed in Table 8, Table 9, Table 10 and Table 11. Using these results, the nC and the λCp curves can both be constructed.
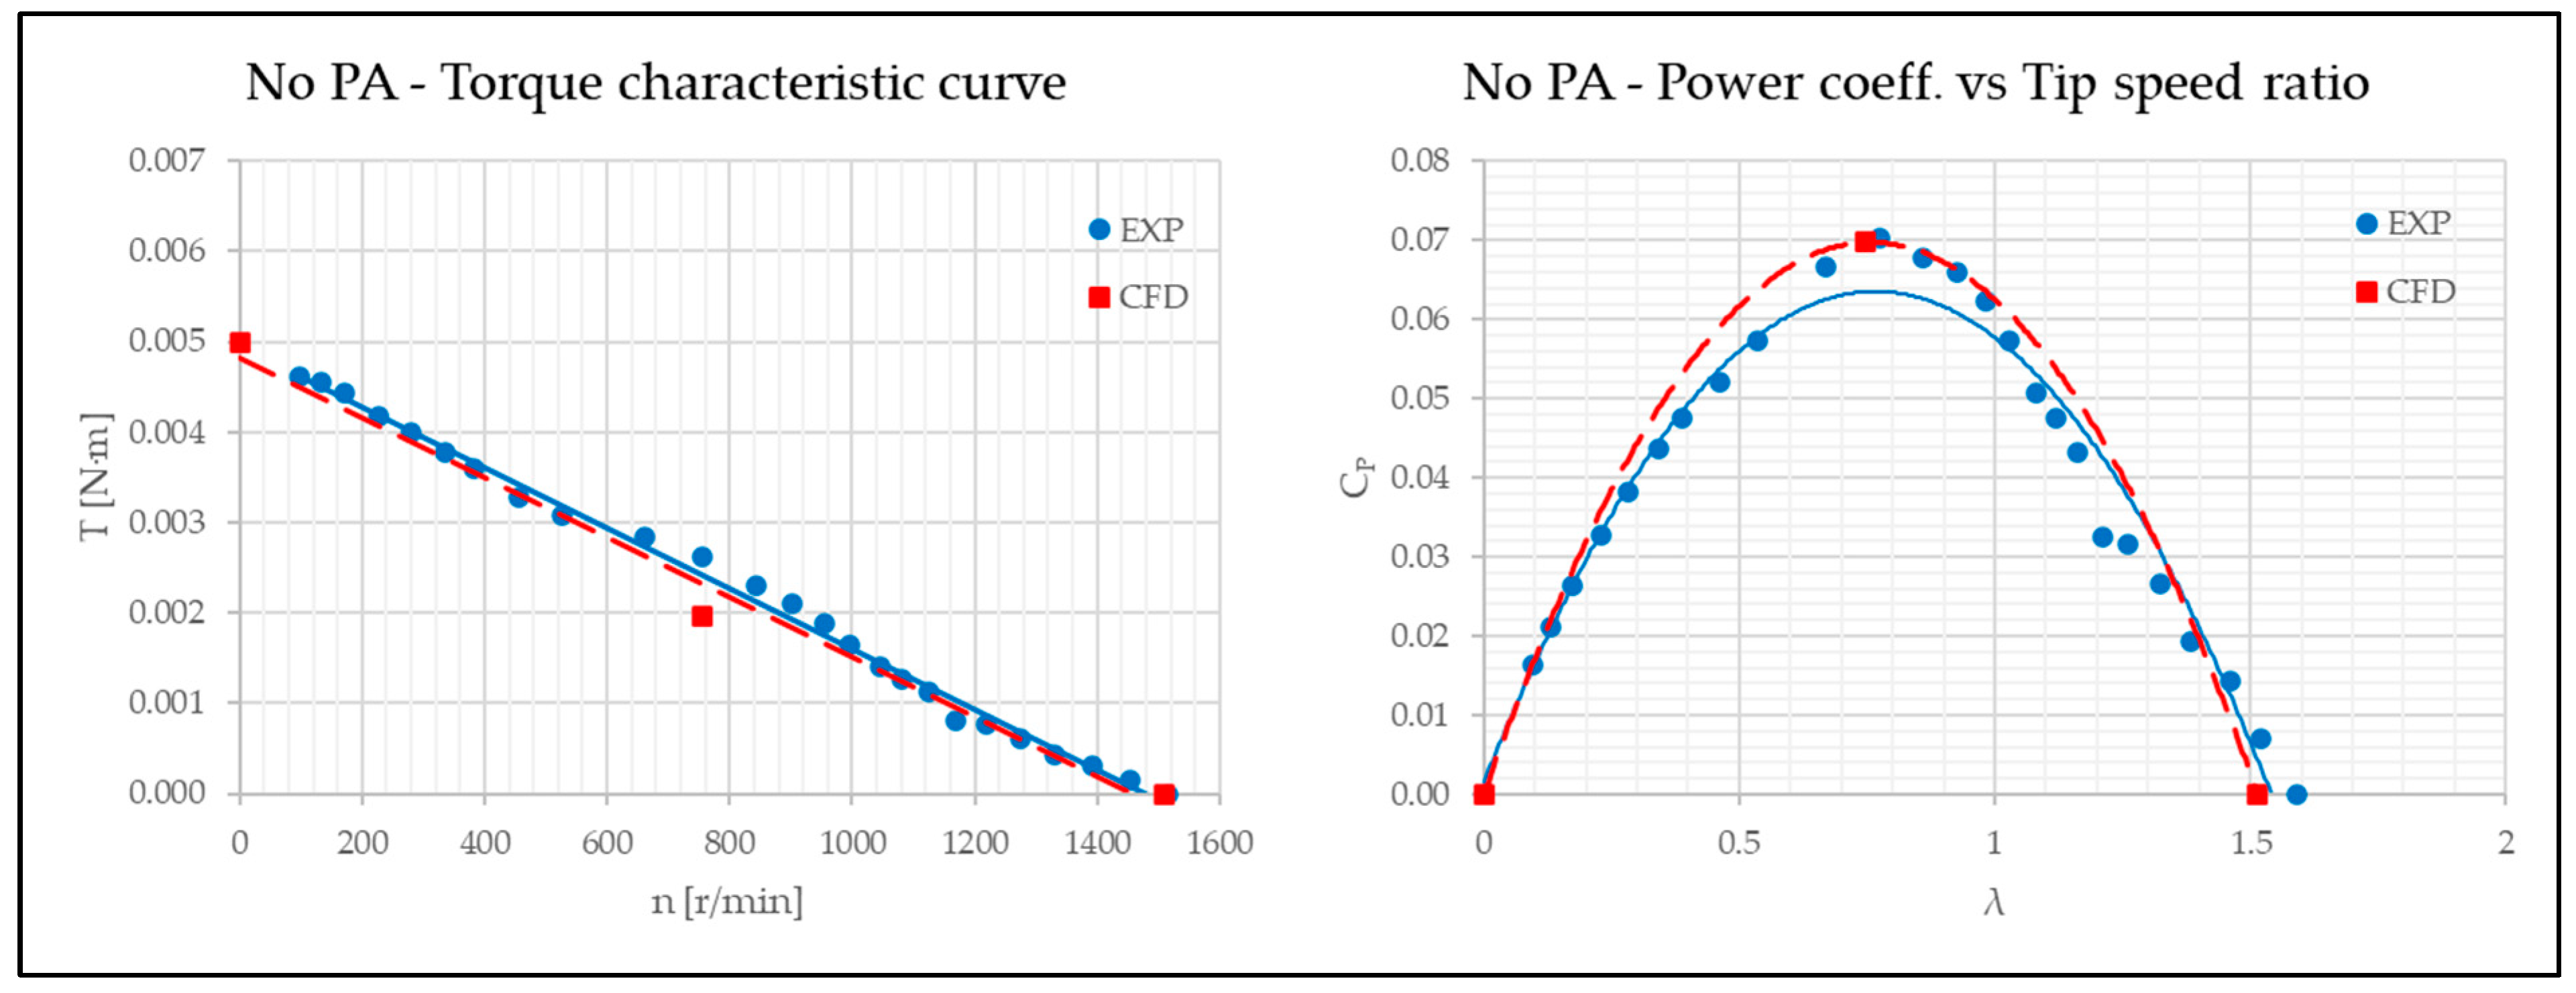
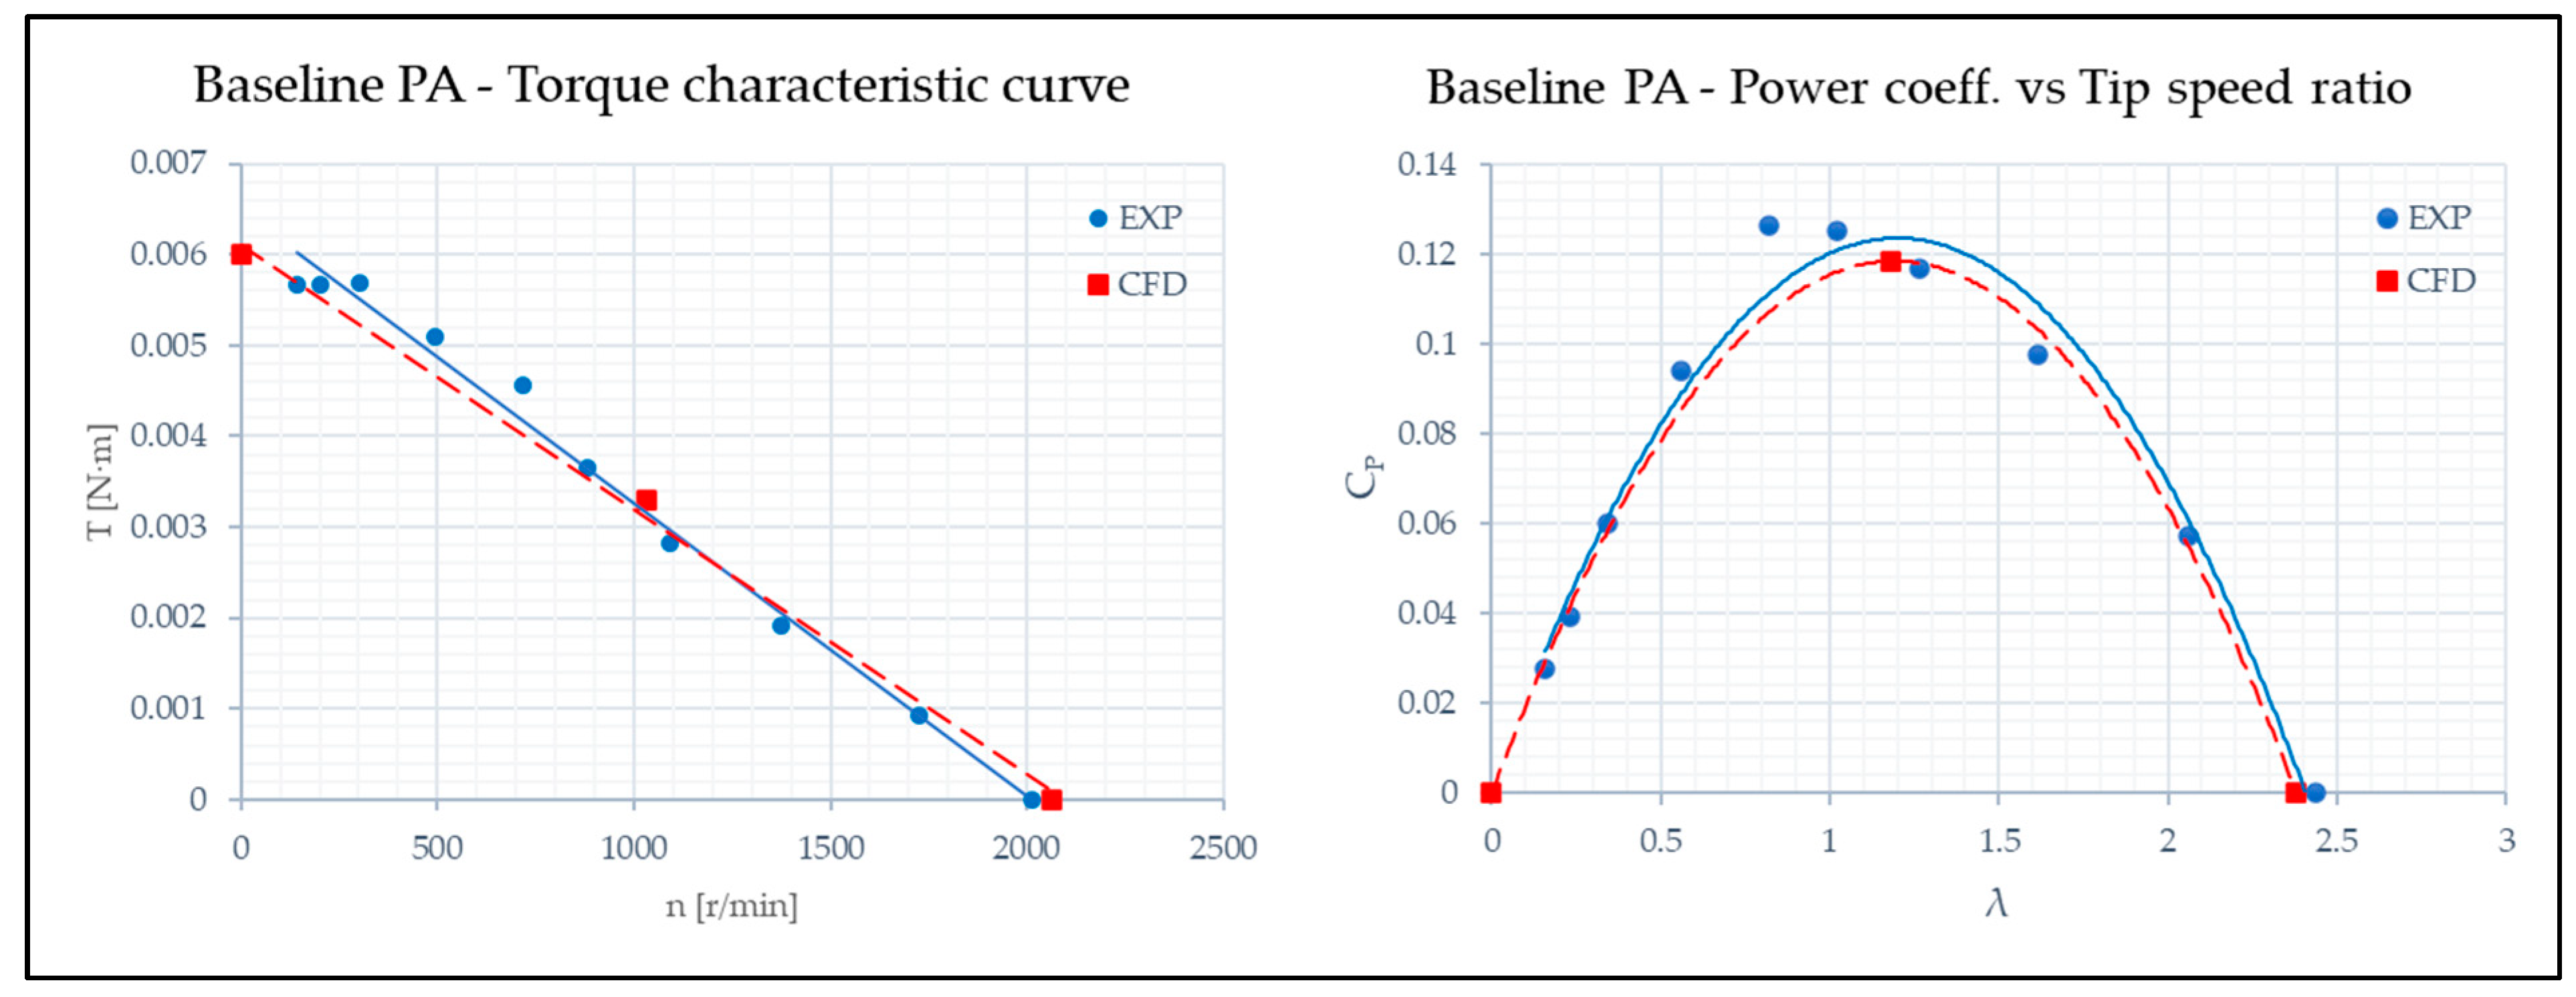
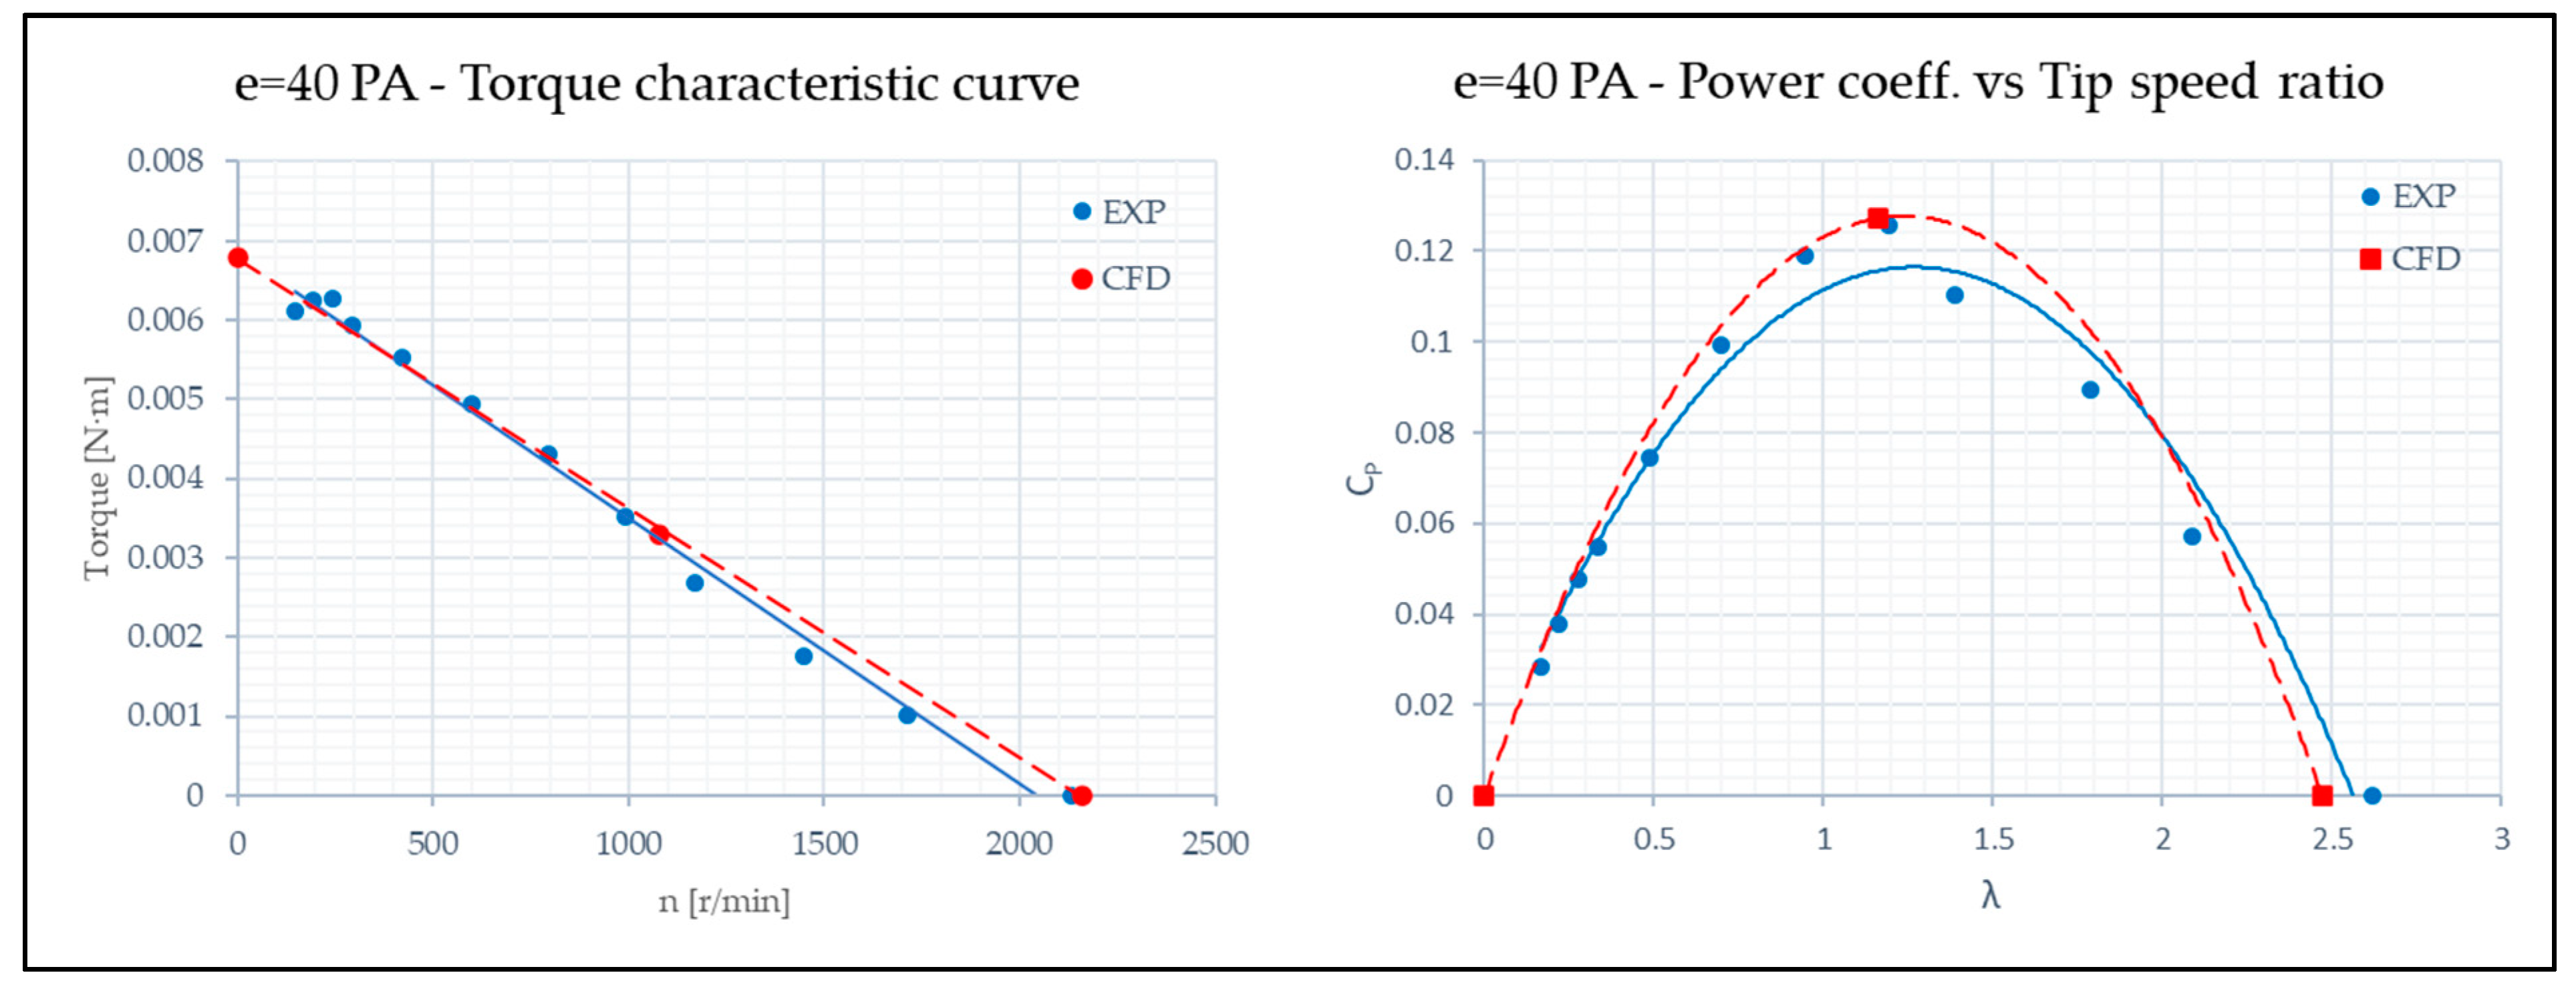
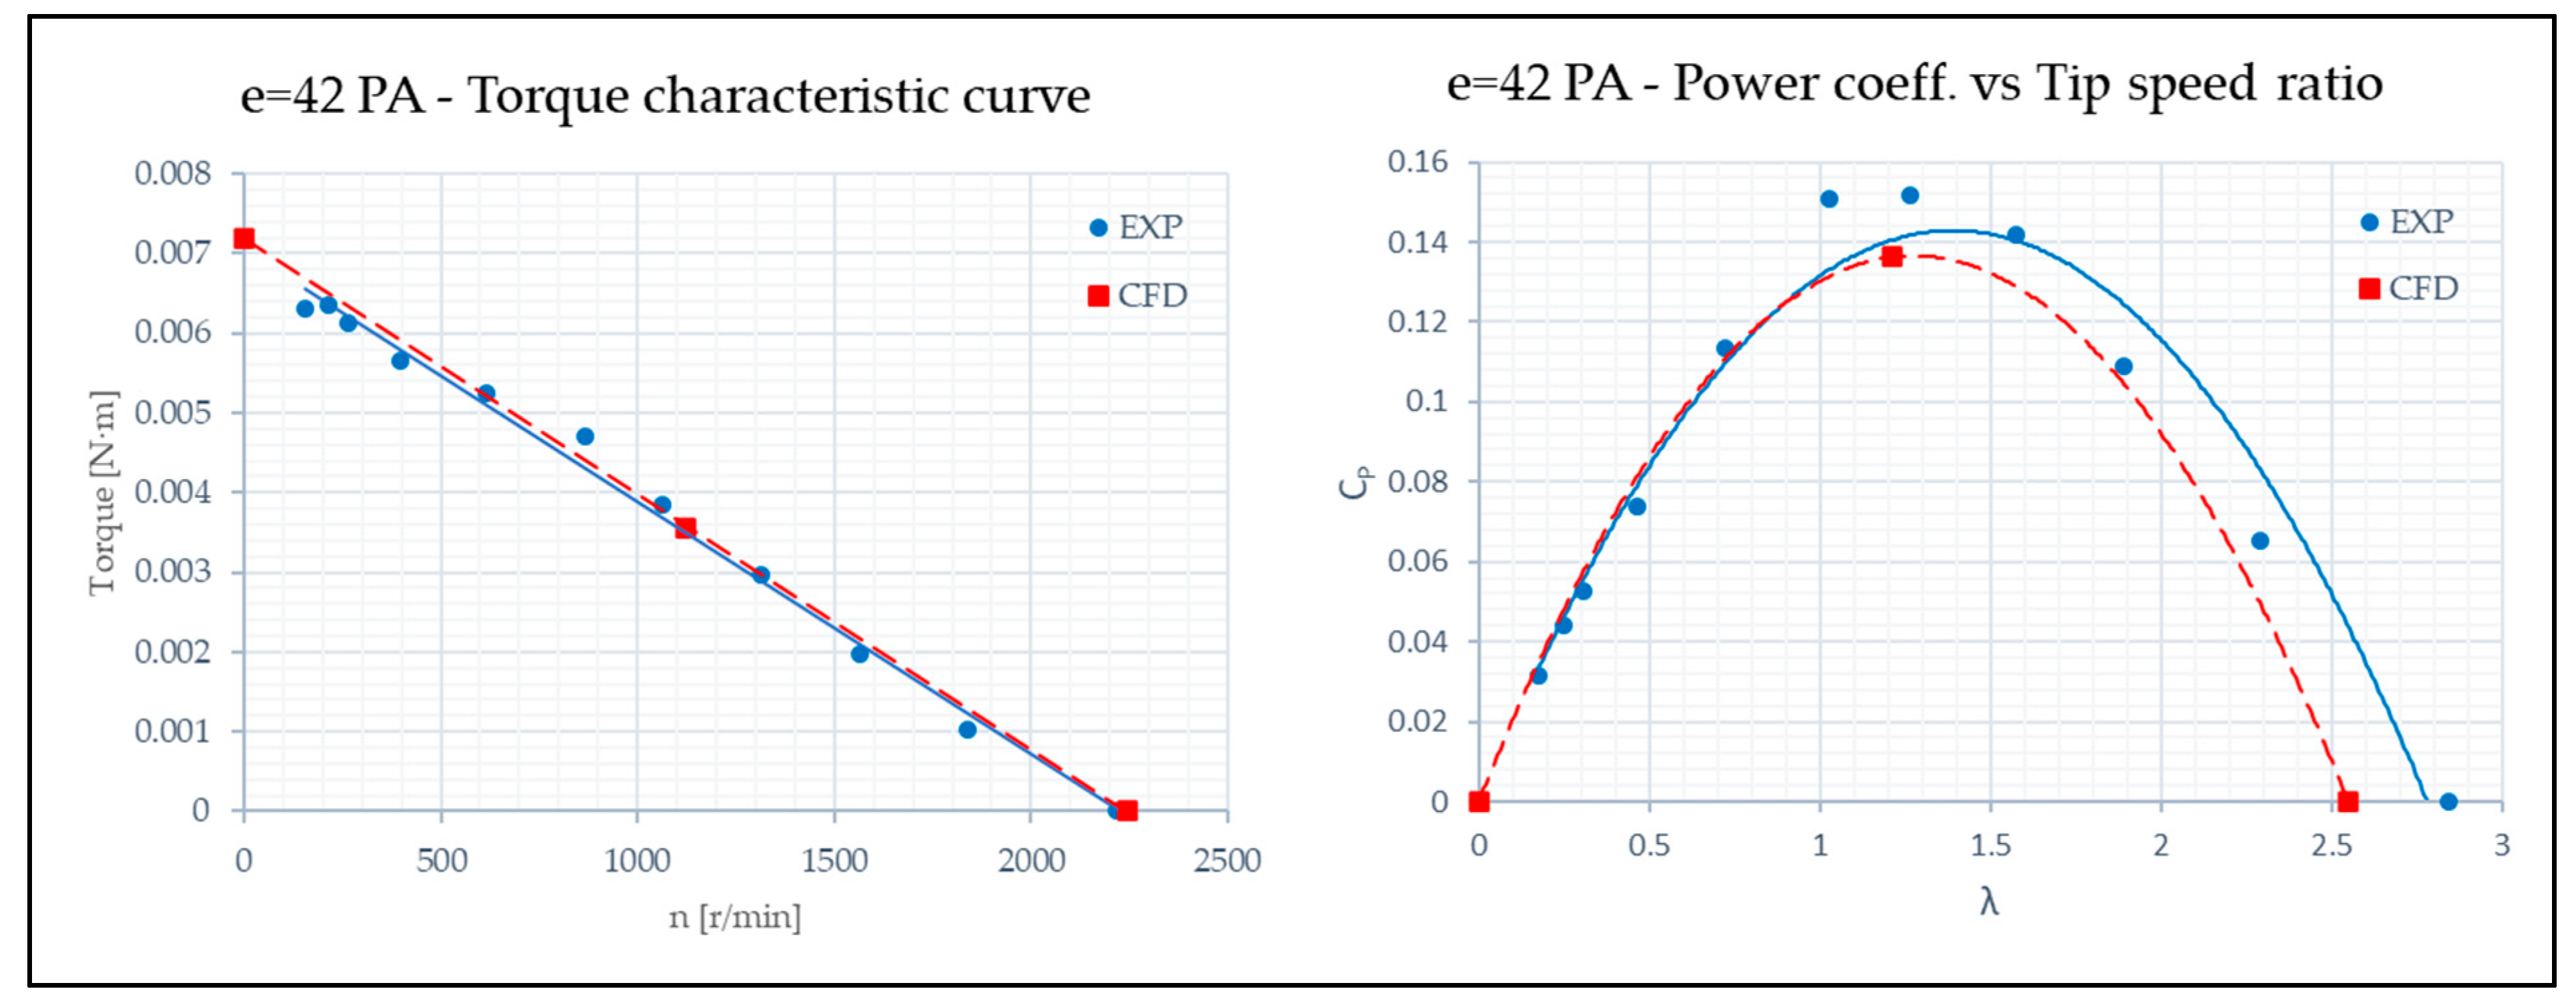
By comparing the CFD curves with the interpolated [30] curve based on the experimental results, a strong correlation is observed, as shown in Figure 12, Figure 13, Figure 14 and Figure 15.
To demonstrate that the CFD curve based on three points provides a reliable prediction of the turbine’s actual behaviour, the R2 value of the experimental points relative to the CFD curve was calculated without and with the Power Augmenters.
The determination coefficient R2 is calculated using the following formula:
R 2 = 1 C p e x p , i C p C F D , i 2 C p e x p , i C p e x p , i ¯ 2 = 1 R S S T S S
where
-
C p e x p , i are the experimentally observed values;
-
C p C F D , i are the values predicted by the regression curve;
-
C p e x p , i ¯ is the mean of the observed values;
-
R S S is the Residual Sum of Squares;
-
T S S is the Total Sum of Squares.
The results of the calculations are listed in Table 12, Table 13, Table 14 and Table 15.
The C p C F D ,   i values were calculated by solving the equations corresponding to each parabolic regression curve, considering the same λ values of the experimental tests.
The first analysed configuration is the one without PA. Equation (24) is the equation of the CFD curve relative to this case.
C p = 0.1217 · λ 2 + 0.1843 · λ + 2 · 10 16
The obtained determination coefficient R 2 is equal to 0.9165.
Equation (25) represents the equation of the CFD curve in the configuration with the Baseline Bell-Metha PA.
C p = 0.0837 · λ 2 + 0.1991 · λ + 4 · 10 17
The obtained determination coefficient R 2 with the Baseline PA is equal to 0.9478.
Equation (26) is relative to the case with PA 2.
C p = 0.0836 · λ 2 + 0.2067 · λ 3 · 10 16
The obtained determination coefficient R 2 with PA 2 is 0.9451.
The last configuration is the one with PA 3. The CFD curve is described by Equation (27).
C p = 0.0841 · λ 2 + 0.2144 · λ 1 · 10 16
The determination coefficient R 2 with PA 3 is 0.9389.
The coefficient of determination has an acceptable value for all configurations, with a minimum value of 0.9165 corresponding to the case without the PA. The values then improve and remain consistently high for all cases with the PA, reaching a maximum of 0.9594 for the configuration with PA 2.
There are multiple factors influencing these results, as the values of the power coefficient and the tip speed ratio depend on variables, such as velocity or pressure, which are also characterized by measurement uncertainties in the experimental data.
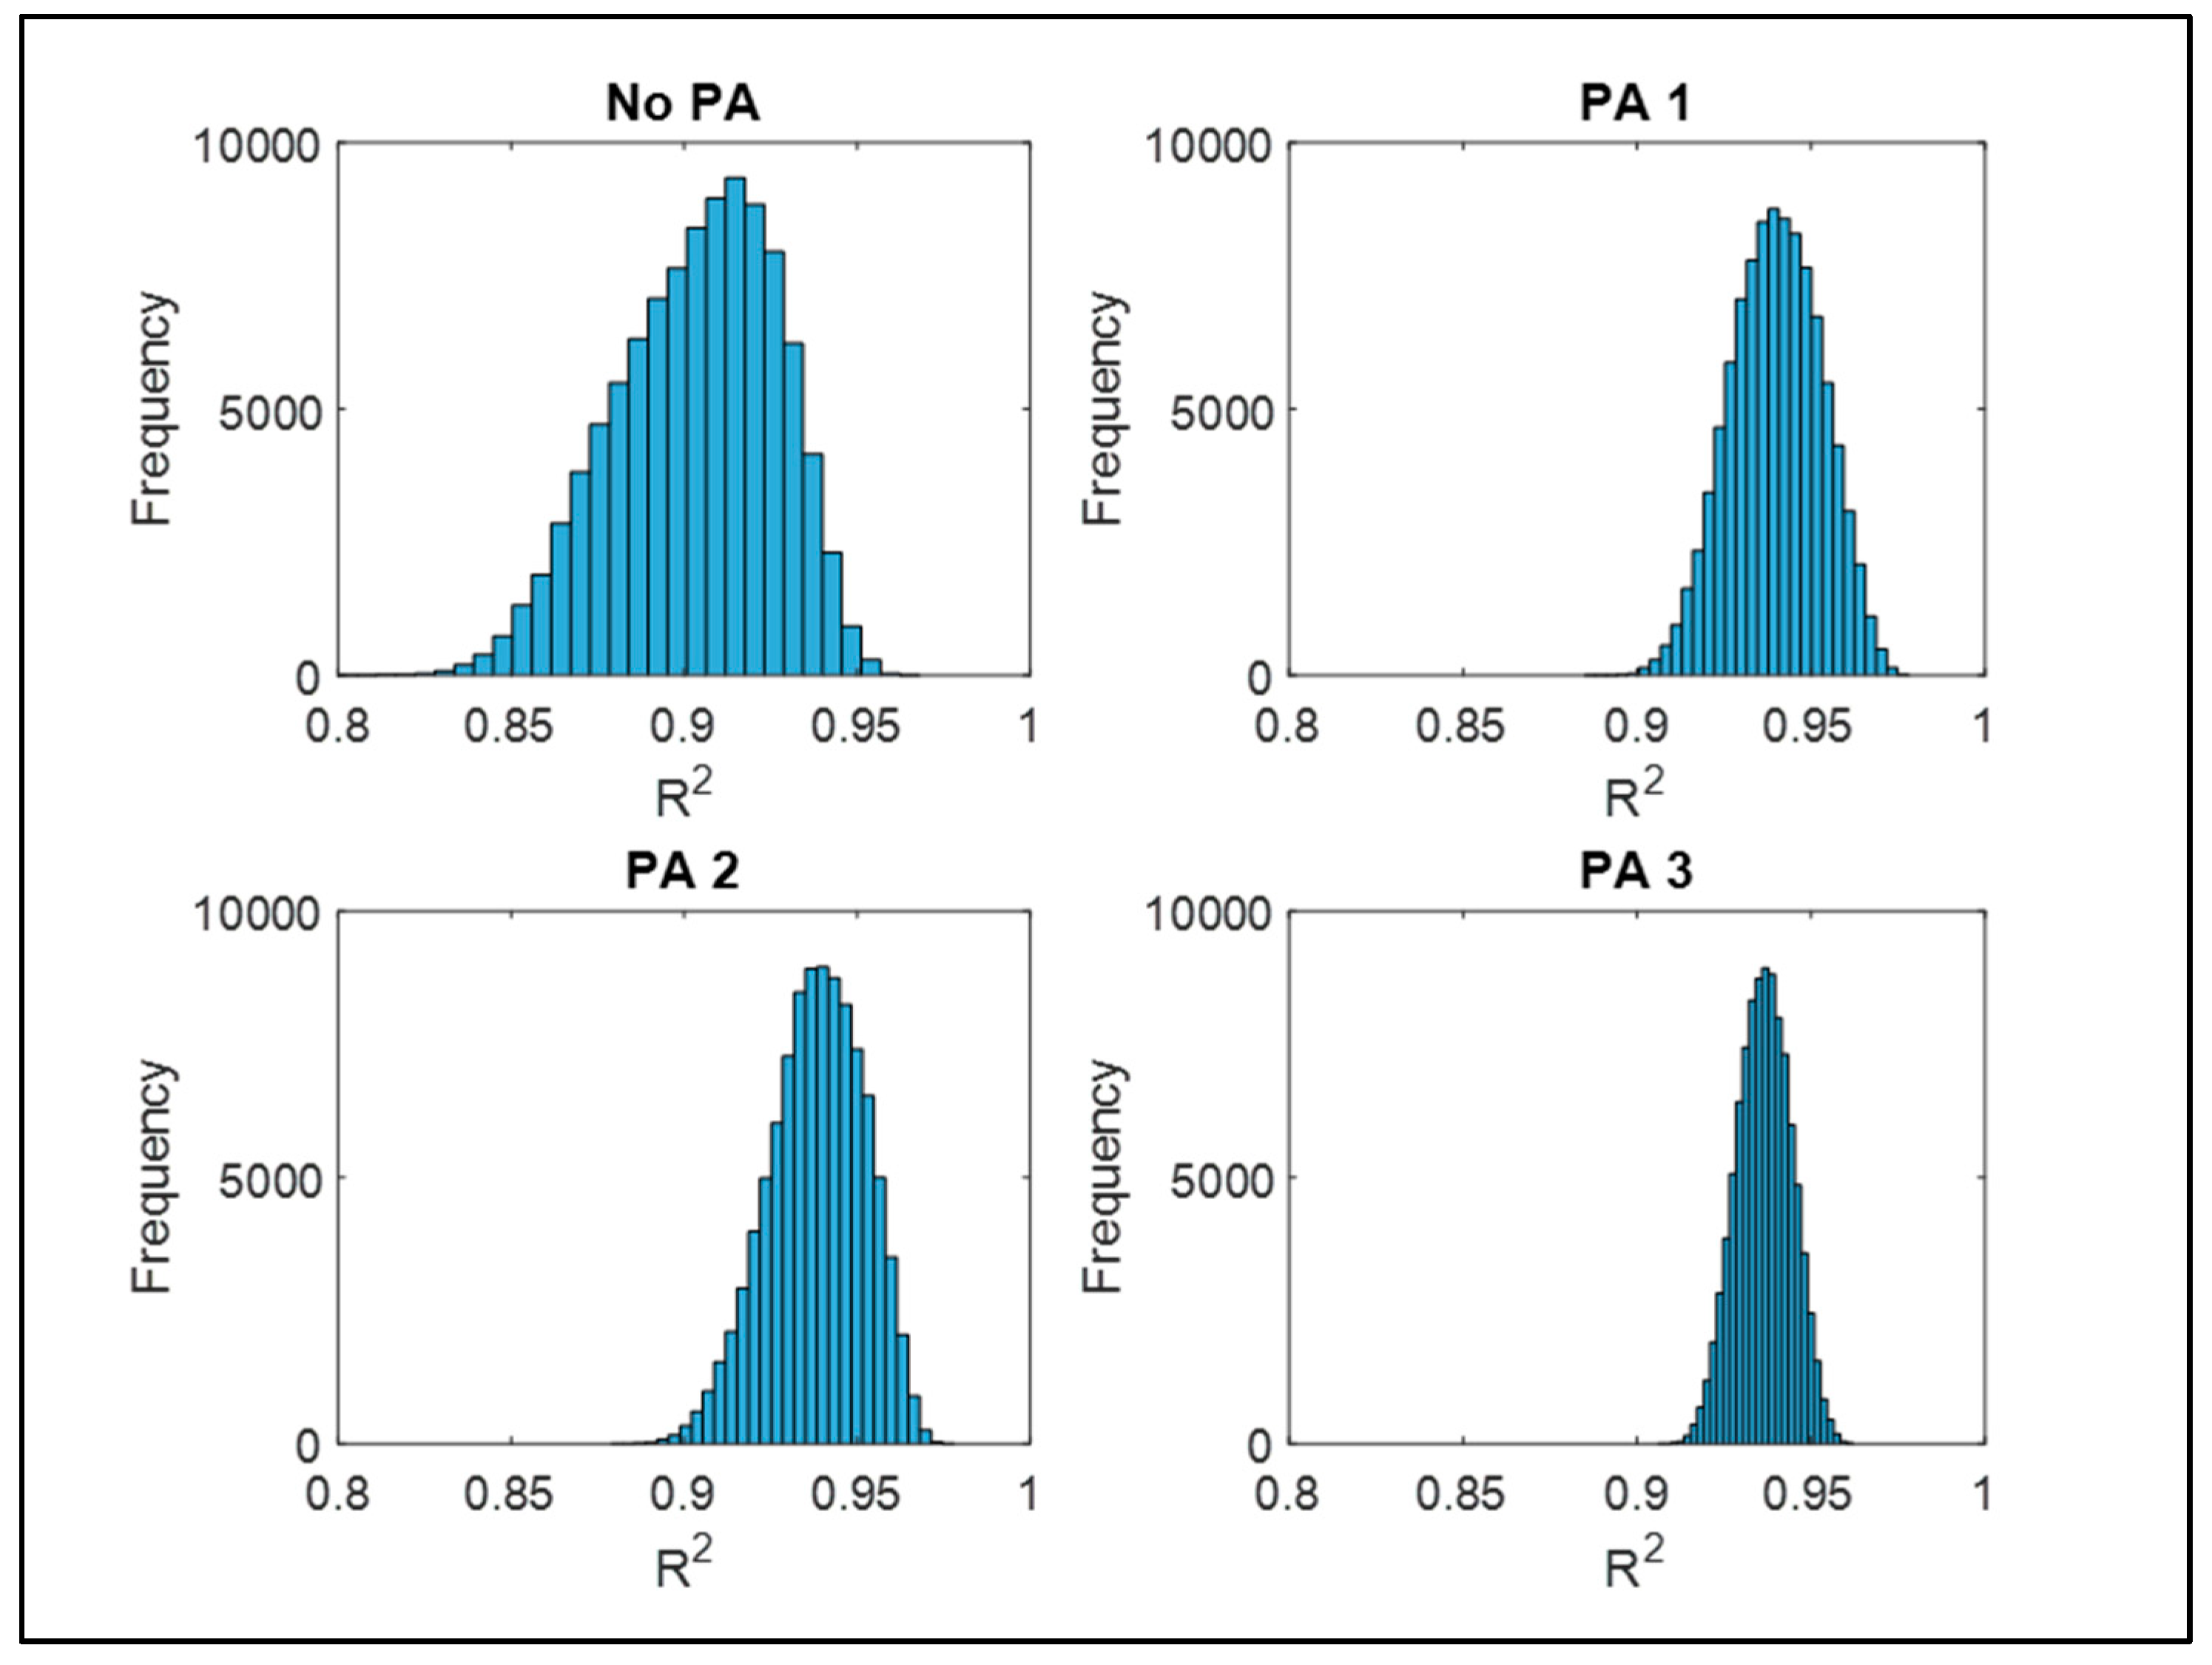
To assess the effect of measurement uncertainties on the determination coefficient, the Monte Carlo method [31] was applied by perturbing the experimental Cp data using the standard deviations reported in Section 3.1. The perturbed data were then compared with the numerical curve obtained using the proposed method.
By doing so, a distribution of R2 was obtained, performing 10,000 trials for each configuration (Figure 16).
Analysing these plots, it can be observed that the R2 value calculated using the unperturbed mean experimental curve falls, for each configuration, within the range of the most frequently occurring values.
The tests conducted with a PA exhibit a lower standard deviation, which consequently leads to a smaller variation in R2.
In all configurations, however, the R2 value calculated with the mean curve remains within an acceptable variability range.
Therefore, the result is very promising because a calculation methodology has been defined that provides reliable results with only three CFD simulations.

3.3. Analysis on the Influence of the Power Augmenters

Figure 17, Figure 18, Figure 19, Figure 20, Figure 21, Figure 22 and Figure 23 represent velocity and pressure scenes for all the configurations.
In Figure 17, Figure 19, Figure 21 and Figure 23 a comparison of velocity vector fields obtained using line integral convolution on the symmetry plane at maximum rotational velocity is presented. The scenes were extracted from the no-load condition simulations.
They are useful to explain how the presence of the PA significantly affects the velocity distribution both upstream of the turbine and in its wake, consequently altering the pressure drop, rotational speed, and generated torque.
Velocity scenes for all configurations have been analysed in the two positions of particular interest: the one with the highest aerodynamic resistance and the one with the lowest resistance, where the blades are aligned parallel to the flow.
In Figure 17a, the turbine is directly impacted by the incoming flow without any shielding. In this high aerodynamic resistance configuration, the flow striking the resisting blade separates, generating turbulent vortices. Part of the flow is redirected towards the motor blade, contributing to torque generation, while another portion leaks through the gap between the upper wall of the test tube and the turbine.
In Figure 17b, in the low resistance condition, multiple vortices and high-velocity peaks are observed inside the turbine. The wake is characterized by the formation of a large-scale vortex, indicating a more streamlined interaction between the flow and the turbine structure.
In Figure 18a,b, from a visual impact perspective, it is evident that the presence of the turbine acts as a barrier in the position of maximum resistance, whereas it has a lesser effect on the pressure drop inside the test tube in the position of minimum resistance.
Figure 17. Velocity scene comparison without PA between high (a) and low (b) resistance positions.
Energies 18 01142 g017
Figure 18. Pressure scene comparison without PA between high (a) and low (b) resistance positions.
Energies 18 01142 g018
By adding the Baseline Bell-Metha PA, in the condition shown in Figure 19a, the resisting blade is largely shielded, thereby reducing the generated aerodynamic resistance. Compared to Figure 17a, the velocity in front of the blade behind the PA is generally lower and the flow is less turbulent. Another beneficial effect of the PA is the redirection of the airflow onto the motor blade, which reaches it in a more organized manner and at a higher velocity than in the case without the PA.
A clear improvement is also observed in the condition shown in Figure 19b: almost half of the turbine remains shielded by the PA, and in the wake, the formation of less extensive vortices is noticeable.
Figure 19. Velocity scene comparison with Baseline Bell-Metha PA between high (a) and low (b) resistance positions.
Energies 18 01142 g019
Considering the pressure distribution, Figure 20a illustrates how the stagnation zone on the resisting blade, which is more extensive in the case without the PA, is now reduced and localized at the lower end of the same blade. Additionally, the presence of the PA creates a low-pressure zone in front of the resisting blade, effectively pulling the turbine while simultaneously increasing the overpressure on the driving blade.
Figure 20b shows that even in the condition of lower resistance, the overpressure zone on the upper blade is reduced. However, stagnation on the lower blade, positioned beneath the PA, becomes more pronounced. Although this effect is not desirable, its overall impact is minimal, and the presence of the PA remains advantageous.
Figure 20. Pressure scene comparison with Baseline Bell-Metha PA between high (a) and low (b) resistance positions.
Energies 18 01142 g020
The Baseline Bell-Metha PA improves performance, but the fully horizontal outlet defined by the original polynomial is not very effective, as a small portion of the flow is not properly directed and still impacts the resisting blade. By introducing a slope at the end of the PA with the PA 2, as shown in Figure 21a, more of the resisting blade is shielded and the velocity of the flow reaching the motor blade is even higher.
In Figure 21b, it can be observed that the tangential outlet helps guide the flow along the curvature of the lower blade, allowing it to continue smoothly downstream.
Figure 22a highlights how the inclination of the PA shifts the stagnation point on the resisting blade, guiding the flow more naturally towards the motor blade. Meanwhile, the overpressure generated by the Baseline Bell-Metha PA, as seen in Figure 20b, is reduced due to the exit slope (Figure 22b).
Figure 21. Velocity scene comparison with PA 2 between high (a) and low (b) resistance positions.
Energies 18 01142 g021
Figure 22. Pressure scene comparison with PA 2 between high (a) and low (b) resistance positions.
Energies 18 01142 g022
By increasing the inclination with the PA 3, the beneficial effects already observed in the PA 2 case are further maximized.
As shown in Figure 23a,b, the velocity distribution is even more regular in both cases compared to the previous configurations. Specifically, in Figure 23a, the flow is now guided exactly onto the motor blade, completely avoiding the resistant blade due to its inertia.
Figure 24a shows how PA 3 further reduces the overpressure on the resisting blade. Additionally, among all configurations, this is the one where the overpressure zone on the motor blade is the most extensive.
Figure 24b reveals that the benefits of this PA are also present in the condition of lower resistance, with the overpressure zone on the lower blade being the smallest among all the studied configurations.
Figure 23. Velocity scene comparison with PA 3 between high (a) and low (b) resistance positions.
Energies 18 01142 g023
Figure 24. Pressure scene comparison with PA 3 between high (a) and low (b) resistance positions.
Energies 18 01142 g024
If the outlet inclination is increased too much, the PA would start acting as a barrier, reducing the velocity and energy of the flow reaching the turbine.
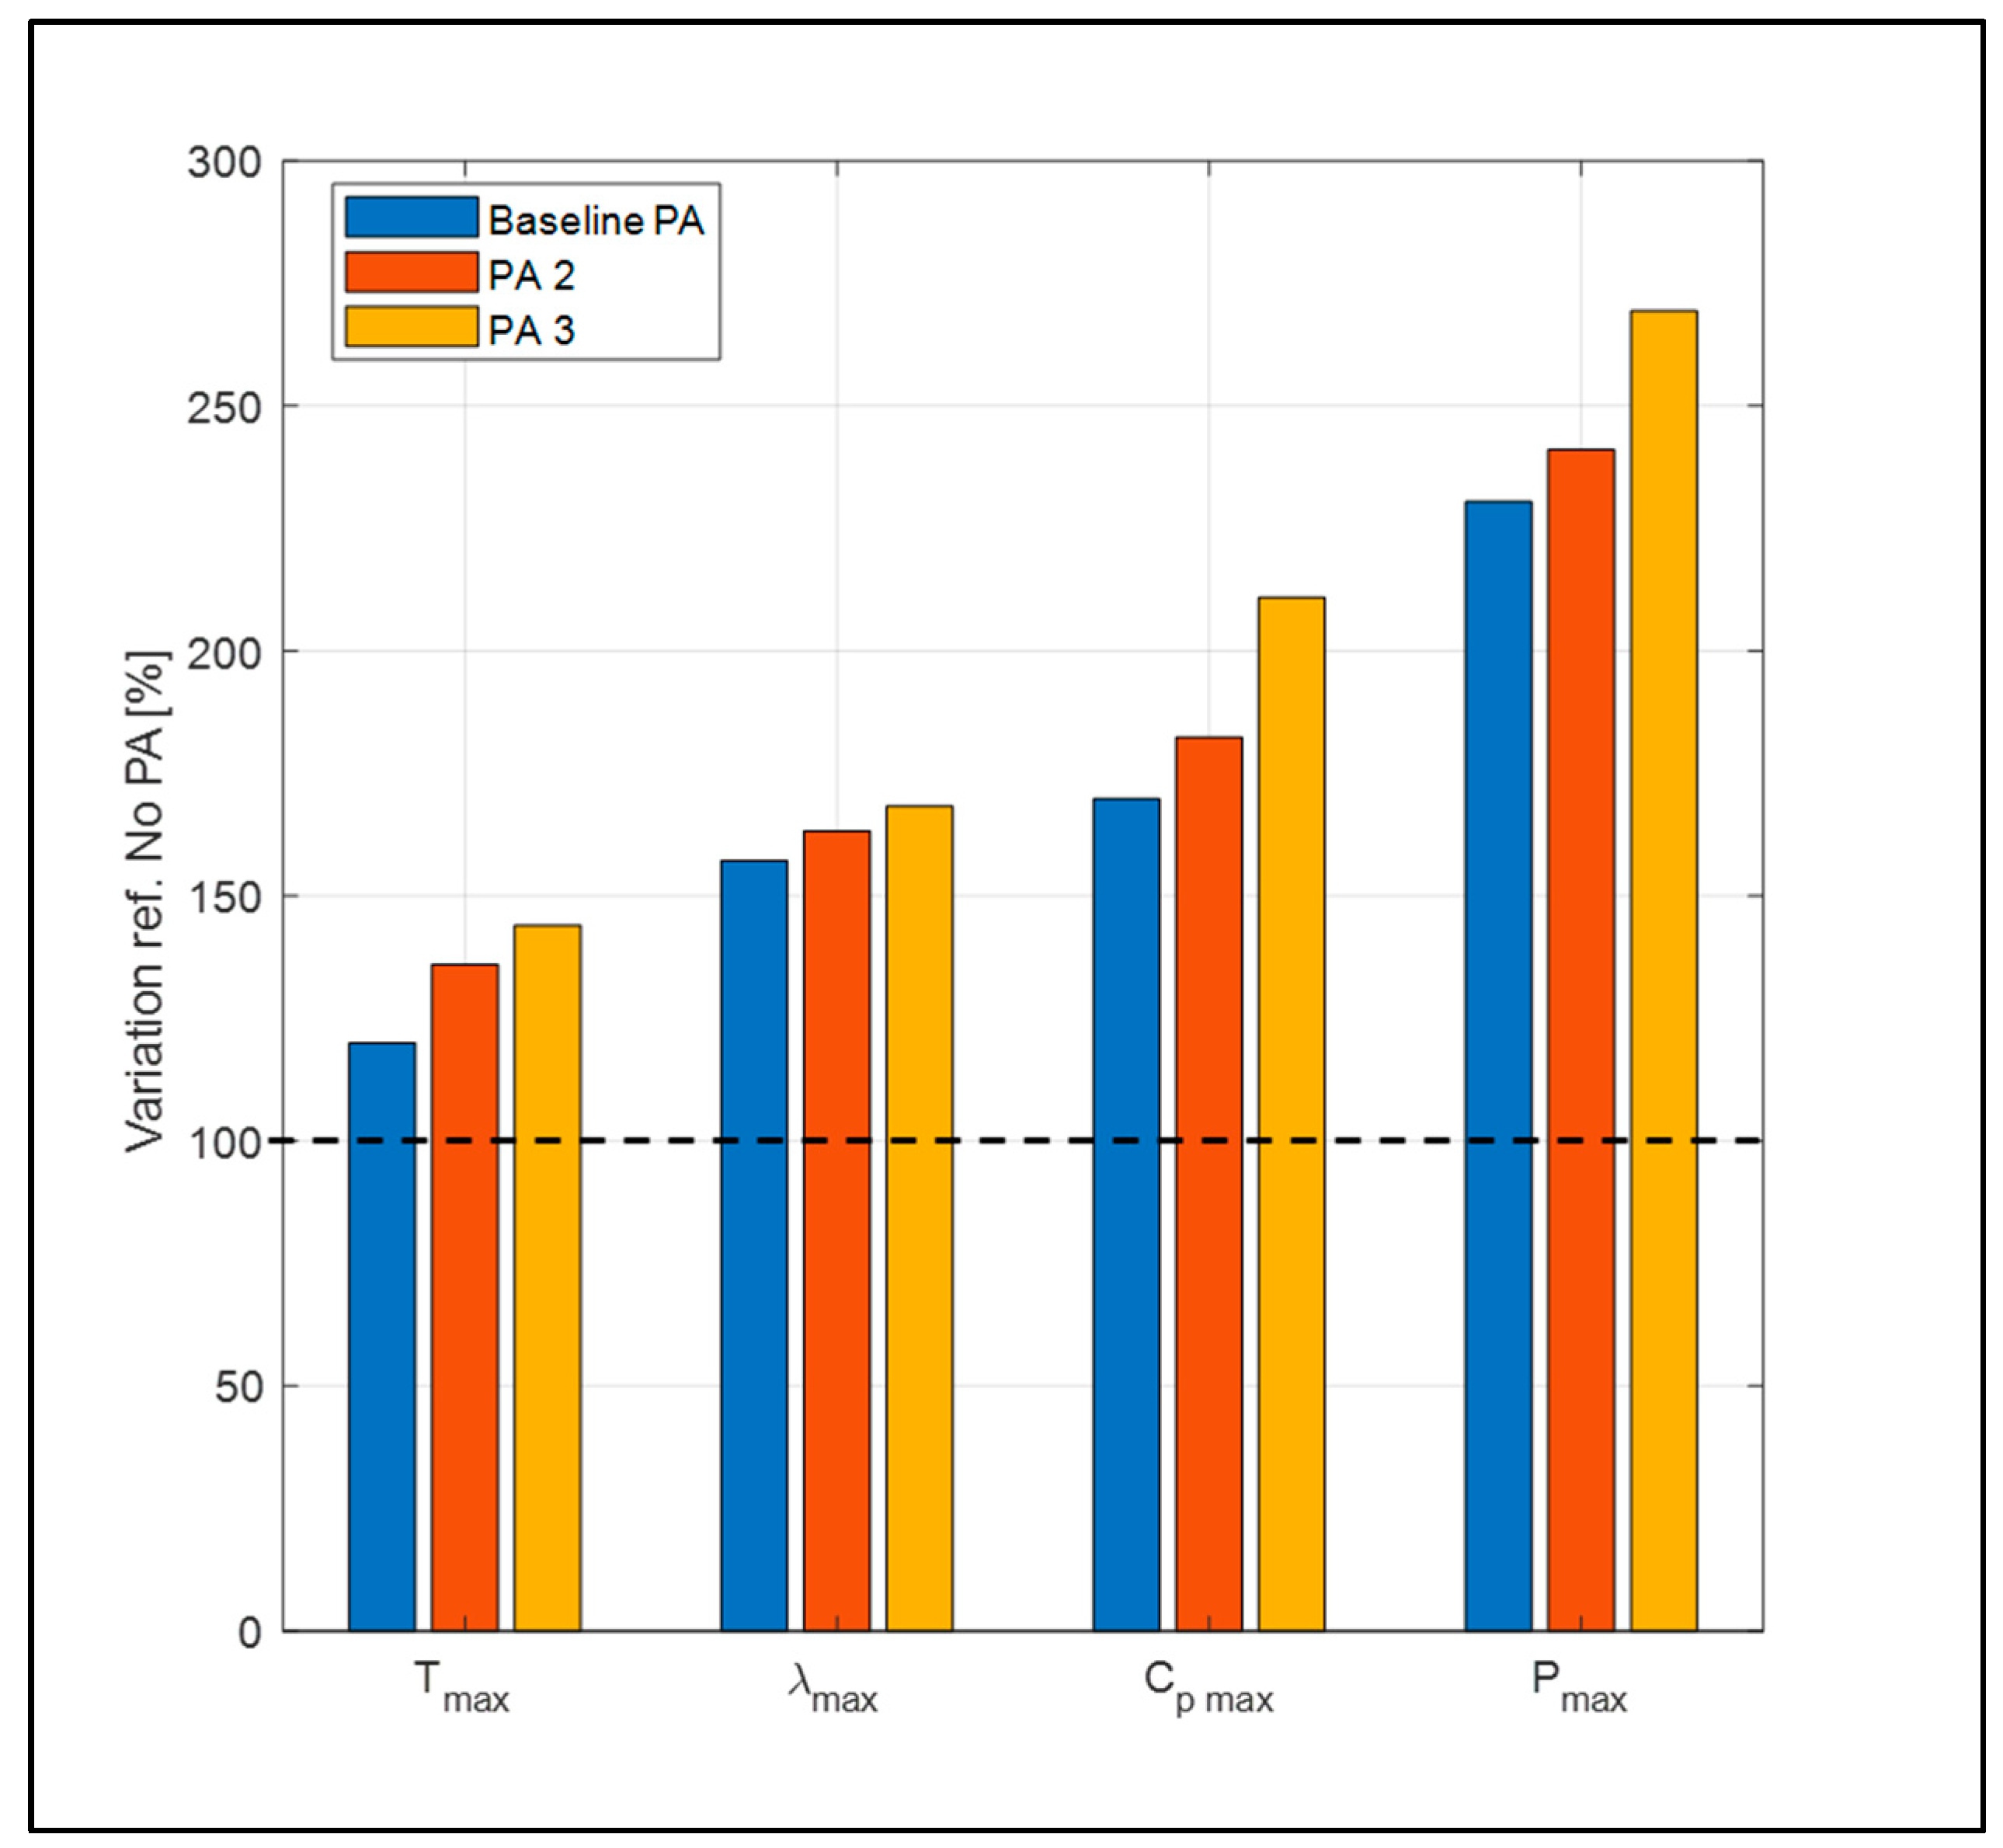
To better understand the impact of integrating various PAs (PA) on the system’s behaviour, the maximum values of torque, tip speed ratio, power coefficient, and power output were analysed and plotted in Figure 25.
The comparison was carried out by normalizing each value in all the configurations with PAs with respect to their corresponding value in the configuration without a PA. The configuration that maximizes all these values is PA 3, which is the most inclined among those tested.
This numerical comparison confirms the findings from the characteristic curve analysis and the velocity and pressure field visualization. Specifically, with PA 3, the torque is 144% of the baseline value, the tip speed ratio reaches 168%, the power coefficient is 210%, and the power output is 269%.
Thus, PA 3 expanded the operational range of the turbine in terms of maximum rotational speed while also increasing the maximum power coefficient. The Baseline PA and PA 2 configurations also led to significant improvements, but to a lesser extent than PA 3.
Figure 25. Comparison between configurations with Power Augmenters.
Energies 18 01142 g025

4. Conclusions

This study presents a comprehensive analysis of a ducted Savonius turbine for energy recovery applications, such as Oscillating Water Column (OWC) systems or urban settings, evaluating its performance through experiments and validated Computational Fluid Dynamics (CFDs) simulations. Experimental tests provided characteristic curves for different configurations, including cases with and without Power Augmenters.
The CFD model was validated across all configurations, accurately replicating experimental results. A CFD-based method was developed to quickly assess turbine performance, requiring only three simulations per configuration—one at maximum tip speed ratio, one at half, and one at a locked rotor condition—to reconstruct characteristic curves reliably. This approach significantly reduces the time and resources needed for performance evaluations.
Experimental data strongly correlated with CFD-generated curves, as confirmed by R2 values, proving the methodology’s reliability. CFD also enabled the visualization of the velocity vector field inside the test tube—an analysis that, experimentally, would require advanced techniques like Particle Image Velocimetry (PIV).
These findings lay the groundwork for developing a Digital Twin capable of accurately replicating the turbine behaviour across configurations. Given the method’s reliability, future research could focus on Reduced Order Models (ROMs) for rapid predictions under varying conditions, optimizing turbine design with minimal computational cost.
Generating characteristic curves efficiently via CFD rather than extensive experimental testing enables faster design iterations, real-time operational adjustments, and greater system adaptability. Further studies could explore additional augmenter or turbine geometries, while integrating machine learning with CFD data could enhance predictive capabilities. These advancements could improve wave energy conversion systems’ viability, scalability, and cost-effectiveness, supporting a wider adoption of renewable energy technologies.

Author Contributions

Conceptualization, S.B., F.C., A.G. and F.S.; Methodology, S.B., F.C., A.G., F.S. and M.C.; Software, M.C.; Validation, M.C.; Formal analysis, S.B., F.C., A.G., F.S. and M.C.; Data curation, M.C.; Writing—original draft, M.C.; Writing—review & editing, S.B., F.C., A.G., F.S. and M.C.; Visualization, M.C.; Supervision, S.B., F.C., A.G. and F.S. All authors have read and agreed to the published version of the manuscript.

Funding

The authors acknowledge financial support under the National Recovery and Resilience Plan (NRRP), Mission 4, Component 2, Investment 1.1, Call for tender No. 1409 published on 14 September 2022 by the Italian Ministry of University and Research (MUR), funded by the European Union—NextGenerationEU—Project Title APEIRON—CUP F53D23009560001—Grant Assignment Decree No. 1379 adopted on 1 September 2023 by the Italian Ministry of Ministry of University and Research (MUR).

Data Availability Statement

The original contributions presented in the study are included in the article, further inquiries can be directed to the corresponding author.

Conflicts of Interest

The authors declare no conflict of interest.

Appendix A. Sensitivity Analysis of the Mesh

To validate the mesh in the simulation, an analysis was conducted following the guidelines proposed by ITTC [32].
There are several sources of uncertainty in a CFD simulation, with the main ones being the following:
  • Iteration-related uncertainty (UI)
  • Mesh size-related uncertainty (UG)
  • Time-step-related uncertainty (UT)
As stated in [33], the uncertainty related to the grid (UG) is usually an order of magnitude higher than the other two and is the primary factor to be verified in a CFD simulation campaign.
The adopted approach involves running the same CFD setup on three different meshes (fine, medium, and coarse), ensuring a constant size ratio between them.
The solution value for the nth parameter is denoted as Sn1, Sn2, and Sn3, corresponding to the values obtained on the fine, medium, and coarse meshes, respectively.
It is then possible to calculate the rate of change between the solution parameters for the medium-fine and coarse-medium meshes.
ε n , 21 = S n 2 S n 1
ε n , 32 = S n 3 S n 2
The two rate changes are used to calculate the convergence ratio R G and the order of accuracy of the simulation.
R G = ε n , 21 ε n , 32
The value of the convergence ratio is important for understanding if the sensitivity analysis has a monotonic convergence, oscillatory convergence, oscillatory divergence, or monotonic divergence as defined in Table A1.
Table A1. Convergence ratio analysis.
Value of Convergence RatioEvaluation of Convergence
0 < RG < 1Monotonic or oscillatory convergence
RG < 0 & |RG| < 1
RG > 0Monotonic or oscillatory divergence
RG < 0 & | RG| > 1
The three simulations considered for the convergence analysis are distinguished by the base size dimension (Figure A1), which also affects the refinements in a cascading manner. The base size is halved when transitioning from coarse to medium and from medium to fine.
The controlled parameter is the pressure drop (ΔP). The configuration used for this analysis is the one with the Baseline PA.
Figure A1. Different meshes considered in the analysis: fine (a), medium (b), and coarse (c).
Energies 18 01142 g0a1
All the values required to obtain the convergence ratio were calculated and reported in Table A2.
Table A2. Mesh sensitivity analysis.
ParameterFineMediumCoarseεn,21εn,32RG
Elements191986132331258389---
ΔP [Pa]91.1289.5893.24−1.423.62−0.39
The convergence ratio value confirms that convergence has been achieved. Therefore, the medium mesh can be used in the simulation, as it represents a good balance between the number of cells and reliability.

References

  1. Falnes, J. A Review of Wave-Energy Extraction. Mar. Struct. 2007, 20, 185–201. [Google Scholar] [CrossRef]
  2. Drew, B.; Plummer, A.R.; Sahinkaya, M.N. A Review of Wave Energy Converter Technology. Proc. Inst. Mech. Eng. Part A J. Power Energy 2016, 223, 887–902. [Google Scholar] [CrossRef]
  3. Falcão, A.F.d.O. Wave Energy Utilization: A Review of the Technologies. Renew. Sustain. Energy Rev. 2010, 14, 899–918. [Google Scholar] [CrossRef]
  4. Sfravara, F.; Barberi, E.; Bongiovanni, G.; Chillemi, M.; Brusca, S. Development of a Predictive Model for Evaluation of the Influence of Various Parameters on the Performance of an Oscillating Water Column Device. Sensors 2024, 24, 3582. [Google Scholar] [CrossRef] [PubMed]
  5. Mauro, S.; Brusca, S.; Lanzafame, R.; Messina, M. CFD Modeling of a Ducted Savonius Wind Turbine for the Evaluation of the Blockage Effects on Rotor Performance. Renew. Energy 2019, 141, 28–39. [Google Scholar] [CrossRef]
  6. Le, A.D.; Duc, B.M.; Van Hoang, T.; Tran, H.T. Modified Savonius Wind Turbine for Wind Energy Harvesting in Urban Environments. J. Fluids Eng. Trans. ASME 2022, 144, 081501. [Google Scholar] [CrossRef]
  7. Škvorc, P.; Kozmar, H. Wind Energy Harnessing on Tall Buildings in Urban Environments. Renew. Sustain. Energy Rev. 2021, 152, 111662. [Google Scholar] [CrossRef]
  8. Dinh Le, A.; Nguyen Thi Thu, P.; Ha Doan, V.; The Tran, H.; Duc Banh, M.; Truong, V.T. Enhancement of Aerodynamic Performance of Savonius Wind Turbine with Airfoil-Shaped Blade for the Urban Application. Energy Convers. Manag. 2024, 310, 118469. [Google Scholar] [CrossRef]
  9. Nachtane, M.; Tarfaoui, M.; El Moumen, A.; Saifaoui, D.; Benyahia, H. Design and Hydrodynamic Performance of a Horizontal Axis Hydrokinetic Turbine. Int. J. Automot. Mech. Eng. 2019, 16, 6453–6469. [Google Scholar] [CrossRef]
  10. Rathore, M.K.; Agrawal, M.; Baredar, P.; Shukla, A.K.; Dwivedi, G.; Verma, P. Fabrication and Performance Analysis of the Aero-Leaf Savonius Wind Turbine Tree. Energies 2023, 16, 3015. [Google Scholar] [CrossRef]
  11. Laws, P.; Saini, J.S.; Kumar, A.; Mitra, S. Improvement in Savonius Wind Turbines Efficiency by Modification of Blade Designs—A Numerical Study. J. Energy Resour. Technol. Trans. ASME 2020, 142, 1068935. [Google Scholar] [CrossRef]
  12. Alizadeh, H.; Jahangir, M.H.; Ghasempour, R. CFD-Based Improvement of Savonius Type Hydrokinetic Turbine Using Optimized Barrier at the Low-Speed Flows. Ocean Eng. 2020, 202, 107178. [Google Scholar] [CrossRef]
  13. Carrattieri, L.; Cravero, C.; Marsano, D.; Valenti, E.; Sishtla, V.; Halbe, C. The Development of Machine Learning Models for Radial Compressor Monitoring with Instability Detection. J. Turbomach. 2025, 147, 051004. [Google Scholar] [CrossRef]
  14. Hammond, J.; Pepper, N.; Montomoli, F.; Michelassi, V. Machine Learning Methods in CFD for Turbomachinery: A Review. Int. J. Turbomach. Propuls. Power 2022, 7, 16. [Google Scholar] [CrossRef]
  15. Marioni, Y.F.; De Toledo Ortiz, E.A.; Cassinelli, A.; Montomoli, F.; Adami, P.; Vazquez, R. A Machine Learning Approach to Improve Turbulence Modelling from DNS Data Using Neural Networks. Int. J. Turbomach. Propuls. Power 2021, 6, 17. [Google Scholar] [CrossRef]
  16. Weatheritt, J.; Sandberg, R.D. Hybrid Reynolds-Averaged/Large-Eddy Simulation Methodology from Symbolic Regression: Formulation and Application. AIAA J. 2017, 55, 3734–3746. [Google Scholar] [CrossRef]
  17. Kochkov, D.; Smith, J.A.; Alieva, A.; Wang, Q.; Brenner, M.P.; Hoyer, S. Machine Learning–Accelerated Computational Fluid Dynamics. Proc. Natl. Acad. Sci. USA 2021, 118, e2101784118. [Google Scholar] [CrossRef] [PubMed]
  18. Fotiadis, S.; Pignatelli, E.; Bharath, A.A.; Lino Valencia, M.; Cantwell, C.D.; Storkey, A. Comparing Recurrent and Convolutional Neural Networks for Predicting Wave Propagation. arXiv 2020, arXiv:2002.08981. [Google Scholar]
  19. Cheung, S.H.; Oliver, T.A.; Prudencio, E.E.; Prudhomme, S.; Moser, R.D. Bayesian Uncertainty Analysis with Applications to Turbulence Modeling. Reliab. Eng. Syst. Saf. 2011, 96, 1137–1149. [Google Scholar] [CrossRef]
  20. Forrester, A.I.J.; Sóbester, A.; Keane, A.J. Multi-Fidelity Optimization via Surrogate Modelling. Proc. R. Soc. A Math. Phys. Eng. Sci. 2007, 463, 3251–3269. [Google Scholar] [CrossRef]
  21. Brusca, S.; Galvagno, A.; Mauro, S.; Messina, M.; Lanzafame, R. Bell-Metha Power Augmented Savonius Turbine as Take-off in OWC Systems. J. Phys. Conf. Ser. 2023, 2648, 012015. [Google Scholar] [CrossRef]
  22. Ricci, R.; Romagnoli, R.; Montelpare, S.; Vitali, D. Experimental Study on a Savonius Wind Rotor for Street Lighting Systems. Appl. Energy 2016, 161, 143–152. [Google Scholar] [CrossRef]
  23. Roy, S.; Saha, U.K. Review of Experimental Investigations into the Design, Performance and Optimization of the Savonius Rotor. Proc. Inst. Mech. Eng. Part A J. Power Energy 2013, 227, 528–542. [Google Scholar] [CrossRef]
  24. Li, R.; Song, S. Manifold Learning-Based Reduced-Order Model for Full Speed Flow Field. Phys. Fluids 2024, 36, 87117. [Google Scholar] [CrossRef]
  25. Persoons, T.; Cressall, R.; Alimohammadi, S. Validating a Reduced-Order Model for Synthetic Jet Actuators Using CFD and Experimental Data. Actuators 2018, 7, 67. [Google Scholar] [CrossRef]
  26. Aversano, G.; Ferrarotti, M.; Parente, A. Digital Twin of a Combustion Furnace Operating in Flameless Conditions: Reduced-Order Model Development from CFD Simulations. Proc. Combust. Inst. 2021, 38, 5373–5381. [Google Scholar] [CrossRef]
  27. Menter, F.R. Review of the Shear-Stress Transport Turbulence Model Experience from an Industrial Perspective. Int. J. Comut Fluid. Dyn. 2009, 23, 305–316. [Google Scholar] [CrossRef]
  28. Barberi, E.; Chillemi, M.; Cucinotta, F.; Raffaele, M.; Salmeri, F. A Hollowing Algorithm for a Parametric Optimisation Method of Structural Components. Int. J. Interact. Des. Manuf. 2023, 18, 6271–6279. [Google Scholar] [CrossRef]
  29. Hassan Saeed, H.A.; Nagib Elmekawy, A.M.; Kassab, S.Z. Numerical Study of Improving Savonius Turbine Power Coefficient by Various Blade Shapes. Alex. Eng. J. 2019, 58, 429–441. [Google Scholar] [CrossRef]
  30. Chapanis, A. Notes on an Approximation Method for Fitting Parabolic Equations to Experimental Data. Psychometrika 1953, 18, 327–336. [Google Scholar] [CrossRef]
  31. Kroese, D.P.; Rubinstein, R.Y. Monte Carlo Methods. Wiley Interdiscip. Rev. Comput. Stat. 2012, 4, 48–58. [Google Scholar] [CrossRef]
  32. ITTC-Recommended Procedures and Guidelines Uncertainty Analysis in CFD Verification and Validation Methodology and Procedures ITTC Quality System Manual Recommended Procedures and Guidelines Procedure Uncertainty Analysis in CFD Verification and Validation, Methodology and Procedures. 2017. Available online: https://www.ittc.info/media/8153/75-03-01-01.pdf (accessed on 10 February 2025).
  33. Stern, F.; Wilson, R.V.; Coleman, H.W.; Paterson, E.G. Comprehensive Approach to Verification and Validation of CFD Simulations—Part 1: Methodology and Procedures. J. Fluids Eng. 2001, 123, 793–802. [Google Scholar] [CrossRef]
Figure 1. Experimental setup in the lab of the University of Messina.
Energies 18 01142 g001
Figure 2. Schematic representation of the experimental setup.
Energies 18 01142 g002
Figure 3. Savonius turbine.
Energies 18 01142 g003
Figure 4. Measurement system (I and IV are Pitot tubes, II and III pressure probes).
Energies 18 01142 g004
Figure 5. Pulley brake scheme.
Energies 18 01142 g005
Figure 6. CFD model of the test.
Energies 18 01142 g006
Figure 7. Mesh of the moving and tube regions.
Energies 18 01142 g007
Figure 8. Bell-Metha based PA (a) and the positioning of the PA (b).
Energies 18 01142 g008
Figure 9. 3D-printed turbine and Power Augmenters.
Energies 18 01142 g009
Figure 10. Proposed method for characteristic curves definition.
Energies 18 01142 g010
Figure 11. Streamlines scene.
Energies 18 01142 g011
Figure 12. Comparison between experimental and CFD without PA.
Energies 18 01142 g012
Figure 13. Comparison between experimental and CFD with Bell-Metha PA 1.
Energies 18 01142 g013
Figure 14. Comparison between experimental and CFD with PA 2.
Energies 18 01142 g014
Figure 15. Comparison between experimental and CFD with PA 3.
Energies 18 01142 g015
Figure 16. Determination coefficient distribution for each configuration.
Energies 18 01142 g016
Table 1. Turbine characteristics.
ParameterSymbolValue
Diameter [mm]D90
Height [mm]H90
Overlap RatioOR1/3
Aspect Ratio-1
Spacing Ratio-0
Axis diameter [mm]ϕ10
Axis length [mm]L60
Weight [kg]-0.635
Table 2. Physics models adopted in the simulation.
Physics Models
SolverImplicit Unsteady
ApproachSegregated Flow
Continuity and Momentum couplingSIMPLE Algorithm
Convection Term2nd order
Turbulence ModelSST Menter k-ω
Temporal Discretization2nd order
Iteration for Time Step5
Gradient DiscretizationHybrid Gauss-LSQ
Algebraic system of Equations solverAlgebraic Multigrid Solver
Savonius turbine motionDynamic Fluid Body Interaction
Mesh motionSliding Mesh
Table 3. Simulated Power Augmenters.
PAabcdef
1−283.20708.00−472.00.000.0050.00
2−157.20372.00−220.000.00−42.0050.00
3−151.20356.00−208.000.00−44.0050.00
Table 4. Experimental results without PA.
No PA—Experimental Results
n [r/min]T [N·m]λCPP [W]
1514.47500 ± 28.975390.00000 ± 0.000001.58980 ± 0.030260.00000 ± 0.000000.00000 ± 0.00000
1452.60000 ± 29.414920.00010 ± 0.000021.52030 ± 0.030710.00700 ± 0.001170.02240 ± 0.00381
1393.50000 ± 30.172940.00030 ± 0.000031.46040 ± 0.035850.01420 ± 0.001530.04440 ± 0.00456
1329.15000 ± 27.907410.00040 ± 0.000061.38320 ± 0.037210.01930 ± 0.003210.06010 ± 0.00957
1273.80000 ± 25.475720.00060 ± 0.000101.32390 ± 0.026040.02650 ± 0.004890.08220 ± 0.01452
1217.70000 ± 20.021980.00080 ± 0.000121.25950 ± 0.028480.03150 ± 0.005100.09730 ± 0.01542
1169.47500 ± 15.628100.00080 ± 0.000291.21120 ± 0.020030.03250 ± 0.011600.09930 ± 0.03545
1126.22500 ± 13.797190.00110 ± 0.000131.16340 ± 0.018170.04330 ± 0.005370.13210 ± 0.01570
1081.65000 ± 12.883310.00130 ± 0.000161.12000 ± 0.014580.04750 ± 0.006160.14390 ± 0.01820
1044.90000 ± 12.888770.00140 ± 0.000171.07930 ± 0.010560.05070 ± 0.006390.15380 ± 0.01793
996.22500 ± 11.002270.00170 ± 0.000201.02960 ± 0.012720.05730 ± 0.006960.17260 ± 0.02033
954.00000 ± 9.615660.00190 ± 0.000170.98210 ± 0.010930.06240 ± 0.006430.18900 ± 0.01547
901.65000 ± 12.164690.00210 ± 0.000150.92450 ± 0.013010.06600 ± 0.004280.19910 ± 0.01156
841.95000 ± 16.558280.00230 ± 0.000130.85950 ± 0.021320.06780 ± 0.003260.20360 ± 0.00850
754.42500 ± 9.755050.00260 ± 0.000090.77330 ± 0.014080.07020 ± 0.002680.20710 ± 0.00575
660.22500 ± 20.237150.00280 ± 0.000070.67010 ± 0.016710.06670 ± 0.002560.19630 ± 0.00654
527.55000 ± 22.219190.00310 ± 0.000050.53510 ± 0.020560.05740 ± 0.002200.17020 ± 0.00644
455.92500 ± 14.161900.00330 ± 0.000040.46290 ± 0.013020.05210 ± 0.000610.15610 ± 0.00310
383.47500 ± 20.123910.00360 ± 0.000110.38910 ± 0.017130.04750 ± 0.000800.14420 ± 0.00377
335.17500 ± 12.961660.00380 ± 0.000080.34160 ± 0.012290.04360 ± 0.001050.13230 ± 0.00347
279.07500 ± 26.247860.00400 ± 0.000150.28280 ± 0.025020.03830 ± 0.002580.11680 ± 0.00902
227.32500 ± 19.847390.00420 ± 0.000090.23010 ± 0.019520.03260 ± 0.002400.09940 ± 0.00804
171.97500 ± 23.573750.00440 ± 0.000110.17320 ± 0.023440.02650 ± 0.003130.07970 ± 0.01006
132.75000 ± 16.120640.00460 ± 0.000070.13260 ± 0.016060.02120 ± 0.002240.06330 ± 0.00747
97.59380 ± 22.046210.00460 ± 0.000110.09620 ± 0.021890.01640 ± 0.003010.04710 ± 0.01052
Table 5. Experimental results with Bell-Metha PA 1.
Baseline PA—Experimental Results
n [r/min]T [N·m]λCPP [W]
2014.57500 ± 21.495380.00000 ± 0.000002.43830 ± 0.224170.00000 ± 0.000000.00000 ± 0.00000
1725.90000 ± 40.641770.00090 ± 0.000052.06190 ± 0.067250.05720 ± 0.006460.16640 ± 0.01816
1376.62500 ± 51.814500.00190 ± 0.000181.61680 ± 0.067470.09750 ± 0.006620.27560 ± 0.01905
1091.02500 ± 39.218080.00280 ± 0.000191.26610 ± 0.049900.11690 ± 0.006510.32230 ± 0.01854
882.30000 ± 28.412780.00370 ± 0.000161.02230 ± 0.039570.12530 ± 0.005450.33770 ± 0.01391
715.57500 ± 32.843450.00460 ± 0.000260.81860 ± 0.042980.12660 ± 0.005540.34190 ± 0.01346
493.20000 ± 24.120400.00510 ± 0.000270.56250 ± 0.031330.09390 ± 0.006620.26250 ± 0.01666
302.32500 ± 20.435610.00570 ± 0.000220.34270 ± 0.022940.06020 ± 0.005960.18010 ± 0.01769
203.02500 ± 9.237490.00570 ± 0.000160.22880 ± 0.010350.03930 ± 0.002420.12070 ± 0.00769
141.60000 ± 11.311080.00570 ± 0.000250.15920 ± 0.012580.02760 ± 0.002910.08420 ± 0.00953
Table 6. Experimental results with PA 2.
e = 40 PA—Experimental Results
n [r/min]T [N·m]λCPP [W]
2131.80000 ± 3.954430.00000 ± 0.000002.61680 ± 0.007780.00000 ± 0.000000.00000 ± 0.00000
1713.90000 ± 46.454310.00100 ± 0.000202.08590 ± 0.056260.05720 ± 0.009640.18100 ± 0.03051
1449.60000 ± 16.988370.00180 ± 0.000071.78790 ± 0.022970.08950 ± 0.002380.26810 ± 0.01071
1168.21150 ± 29.517840.00270 ± 0.000121.38580 ± 0.034810.11030 ± 0.004940.32910 ± 0.01414
992.02500 ± 28.075710.00350 ± 0.000191.19120 ± 0.033040.12570 ± 0.004680.36450 ± 0.01386
794.02500 ± 52.364290.00430 ± 0.000180.94360 ± 0.060370.11910 ± 0.005960.35720 ± 0.01458
599.92500 ± 23.164260.00490 ± 0.000100.69560 ± 0.026410.09940 ± 0.004510.31010 ± 0.01297
422.17500 ± 17.627790.00550 ± 0.000110.48580 ± 0.019980.07450 ± 0.004550.24480 ± 0.01374
293.70000 ± 11.650380.00590 ± 0.000130.33420 ± 0.013160.05480 ± 0.002490.18270 ± 0.00673
243.22500 ± 14.325290.00630 ± 0.000370.27630 ± 0.016160.04760 ± 0.001890.15930 ± 0.00687
194.55000 ± 14.137050.00620 ± 0.000070.22020 ± 0.015900.03790 ± 0.002500.12710 ± 0.00838
148.65000 ± 16.078280.00610 ± 0.000080.16850 ± 0.017940.02820 ± 0.002350.09500 ± 0.00828
Table 7. Experimental results with PA 3.
e = 42 PA—Experimental Results
n [r/min]T [N·m]λCPP [W]
2218.80000 ± 9.052190.00000 ± 0.000002.84550 ± 0.106610.00000 ± 0.000000.00000 ± 0.00000
1836.82500 ± 10.325790.00100 ± 0.000062.29000 ± 0.031320.06540 ± 0.004850.19610 ± 0.01319
1566.30000 ± 9.075460.00200 ± 0.000091.89080 ± 0.010870.10910 ± 0.005050.32400 ± 0.01362
1311.97500 ± 11.189210.00300 ± 0.000161.57630 ± 0.016780.14160 ± 0.006760.40780 ± 0.01966
1064.85000 ± 11.569220.00380 ± 0.000141.26680 ± 0.018460.15180 ± 0.004150.42870 ± 0.01303
865.95000 ± 19.094460.00470 ± 0.000121.02970 ± 0.032410.15090 ± 0.003020.42650 ± 0.00607
618.07500 ± 20.276720.00530 ± 0.000080.72390 ± 0.027350.11340 ± 0.005580.34020 ± 0.01160
395.62500 ± 15.734370.00570 ± 0.000140.46470 ± 0.019730.07370 ± 0.003490.23470 ± 0.00986
266.47500 ± 3.583160.00610 ± 0.000130.30750 ± 0.003950.05250 ± 0.000880.17110 ± 0.00283
213.60000 ± 5.438150.00640 ± 0.000080.24760 ± 0.006380.04390 ± 0.001270.14210 ± 0.00332
154.57500 ± 6.388220.00630 ± 0.000060.17670 ± 0.006820.03130 ± 0.001360.10220 ± 0.00501
Table 8. CFD results without PA.
No PA—CFD Results
n [r/min]T [N·m]λCPP [W]
1510.31000.00001.51430.00000.0000
755.15500.00200.74760.06980.1549
0.00000.00500.00000.00000.0000
Table 9. CFD results with Bell-Metha PA 1.
Baseline PA—CFD Results
n [r/min]T [N·m]λCPP [W]
2065.44000.00002.37970.00000.0000
1032.72000.00331.08630.11850.3569
0.00000.00600.00000.00000.0000
Table 10. CFD results with PA 2.
e = 40 PA—CFD Results
n [r/min]T [N·m]λCPP [W]
2160.90000.00002.47160.00000.0000
1080.45000.00331.15980.12730.3734
0.00000.00680.00000.00000.0000
Table 11. CFD results with PA 3.
e = 42 PA—CFD Results
n [r/min]T [N·m]λCPP [W]
2244.61000.00002.54880.00000.0000
1122.30500.00361.21020.13620.4172
0.00000.00720.00000.00000.0000
Table 12. Determination coefficient analysis without PA.
λ C p e x p , i C p C F D , i R S S T S S
0.09620.01640.01664.5023 × 10−87.1378 × 10⁻⁴
0.13260.02120.02231.1172 × 10−64.7836 × 10⁻⁴
0.17320.02650.02833.2486 × 10−62.7721 × 10⁻⁴
0.23010.03260.03601.0978 × 10−51.0950 × 10⁻⁴
0.28280.03830.04241.6631 × 10−52.3047 × 10⁻⁵
0.34160.04360.04882.6741 × 10−52.2035 × 10⁻⁷
0.38910.04750.05333.3603 × 10−51.9174 × 10⁻⁵
0.46290.05210.05925.0845 × 10−58.0900 × 10⁻⁵
0.53510.05740.06384.0315 × 10−52.0482 × 10⁻⁴
0.67010.06670.06894.6740 × 10−65.5596 × 10⁻⁴
0.77330.07020.06972.4284 × 10−77.3573 × 10⁻⁴
0.85950.06780.06855.0228 × 10−76.0910 × 10⁻⁴
0.92450.06600.06641.4366 × 10−75.2333 × 10⁻⁴
0.98210.06240.06361.4935 × 10−63.7194 × 10⁻⁴
1.02960.05730.06071.2095 × 10−52.0032 × 10⁻⁴
1.07930.05070.05724.0988 × 10−55.8323 × 10⁻⁵
1.12000.04750.05383.9536 × 10−51.9011 × 10⁻⁵
1.16340.04330.04974.1129 × 10−52.8163 × 10⁻⁸
1.21120.03250.04471.4917 × 10−41.1321 × 10⁻⁴
1.25950.03150.03915.6642 × 10−51.3372 × 10⁻⁴
1.32390.02650.03071.7185 × 10−52.7460 × 10⁻⁴
1.38320.01930.02217.8917 × 10−65.6826 × 10⁻⁴
1.46040.01420.00962.1375 × 10−58.3532 × 10⁻⁴
Table 13. Determination coefficient analysis with Bell-Metha PA 1.
λ C p e x p , i C p C F D , i R S S T S S
0.15920.02760.02964.0273 × 10−63.0414 × 10⁻³
0.22880.03930.04123.5194 × 10−61.8850 × 10⁻³
0.34270.06020.05843.1996 × 10−65.0728 × 10⁻⁴
0.56250.09390.08557.0300 × 10−51.2517 × 10⁻⁴
0.81860.12660.10693.8760 × 10−41.9247 × 10⁻³
1.02230.12530.11618.4749 × 10−51.8116 × 10⁻³
1.26610.11690.11791.0187 × 10−61.1690 × 10⁻³
1.61680.09750.10313.1287 × 10−52.1929 × 10⁻⁴
2.06190.05720.05476.2568 × 10−66.5193 × 10⁻⁴
Table 14. Determination coefficient analysis with PA 2.
λ C p e x p , i C p C F D , i R S S T S S
0.16850.02820.03251.0432 × 10−43.8202 × 10⁻⁴
0.22020.03790.04151.6446 × 10−41.6268 × 10⁻⁴
0.27630.04760.05072.4323 × 10−41.1259 × 10⁻³
0.33420.05480.05973.5956 × 10−62.3965 × 10⁻³
0.48580.07450.08072.2689 × 10−61.7939 × 10⁻³
0.69560.09940.10331.5444 × 10−55.1323 × 10⁻⁴
0.94360.11910.12063.8256 × 10−55.0421 × 10⁻⁶
1.19120.12570.12762.4422 × 10−54.8160 × 10⁻⁴
1.38580.11030.12599.7909 × 10−68.4946 × 10⁻⁴
1.78790.08950.10231.2686 × 10−51.5090 × 10⁻³
2.08590.05720.06741.8108 × 10−52.3567 × 10⁻³
Table 15. Determination coefficient analysis with PA 3.
λ C p e x p , i C p C F D , i R S S T S S
0.17670.03130.03531.5869 × 10−53.8559 × 10⁻³
0.24760.04390.04791.6288 × 10−52.4481 × 10⁻³
0.30750.05250.05802.9515 × 10−51.6671 × 10⁻³
0.46470.07370.08155.9821 × 10−53.8569 × 10⁻⁴
0.72390.11340.11115.3609 × 10−64.0279 × 10⁻⁴
1.02970.15090.13163.7445 × 10−43.3145 × 10⁻³
1.26680.15180.13662.3015 × 10−43.4144 × 10⁻³
1.57630.14160.12901.5893 × 10−42.3254 × 10⁻³
1.89080.10910.10471.8824 × 10−52.4577 × 10⁻⁴
2.29000.06540.04992.4017 × 10−47.8014 × 10⁻⁴
Disclaimer/Publisher’s Note: The statements, opinions and data contained in all publications are solely those of the individual author(s) and contributor(s) and not of MDPI and/or the editor(s). MDPI and/or the editor(s) disclaim responsibility for any injury to people or property resulting from any ideas, methods, instructions or products referred to in the content.