1. Introduction
By the end of 2024, China’s operational railway network had surpassed 10,000 kilometers in total length and had been operating in more than 40 major cities across the nation. As a cornerstone of the country’s transportation infrastructure, railway systems have become instrumental in driving regional economic growth and social progress [
1,
2]. However, while this rapid expansion effectively addresses urban traffic congestion, it has concurrently exacerbated environmental noise pollution. This growing public health concern underscores the urgent need for effective noise mitigation strategies in railway transportation systems.
The unique spectral characteristics of train interior noise, particularly its low-frequency dominance, present specific challenges for conventional noise control approaches, necessitating targeted acoustic solutions. Acoustic measurements reveal distinct noise characteristics within train compartments, where mid-to-low frequency noise predominates, with particularly significant low-frequency components [
3,
4,
5]. Additionally, epidemiological studies demonstrate that prolonged exposure to such transportation noise leads to multiple adverse health outcomes, including heightened public annoyance, increased anxiety levels, sleep pattern disruption, mental health deterioration, and elevated risks of cardiovascular diseases [
6,
7,
8,
9,
10,
11,
12,
13].
The adverse health impacts and propagation characteristics of noise pollution from urban rail transit have attracted substantial research, particularly in modeling, prediction, and field measurements [
14,
15,
16,
17,
18]. Noise control strategies encompass source control through wheel-rail vibration-damping structural optimization and propagation path control via noise barriers. He et al. [
19] proposed a rail transit noise prediction model to explore measures for reducing noise during subway line construction and operation. Building upon existing models, parameters were modified and improved to account for environmental factors and to validate their influence on noise prediction. Results indicated that employing vibration-damping tracks and installing sound-absorbing panels are appropriate measures, achieving noise reduction rates exceeding 10%. Field measurements of vibrations generated by rail transit and the resulting noise under three distinct track structures were conducted in [
20]. Results demonstrated that noise barriers are more effective against near-field wheel-rail rolling noise than far-field noise. As an effective rail transit noise control measure, noise barriers have been extensively studied. Zhang et al. [
21] developed stiffened panel design schemes for two types of noise barriers based on a U-shaped barrier (USB) finite element model, further evaluating their vibration and noise reduction performance. The study found that, for the SAP (sound-absorbing panel) barrier, horizontal stiffening ribs yielded superior vibration and noise reduction compared to vertical ribs. The stiffened panel design significantly suppressed noise within the USB structure, enhancing its overall noise attenuation functionality. Mahesh et al. [
22] investigated the coupled design of Helmholtz resonators (HRs) with noise barrier unit panels. After experimentally validating the low-frequency sound absorption characteristics of HRs, they proposed embedding modified HR structures (e.g., with tapered necks or spiral necks) into the unit panels. Simulations demonstrated that this design achieved significant noise reduction (>13.7 dB) at critical frequencies (e.g., 23.7 Hz). Further modeling combining HR arrays with micro-perforated panels (MPP) indicated that this configuration effectively broadened the noise reduction bandwidth, achieving absorption coefficients exceeding 65% within the 318–880 Hz frequency band. This provided a comprehensive solution for low-frequency broadband optimization of the barrier panels. However, this study focused on the unit panel level and did not investigate the overall barrier structure. Li et al. [
23] addressed the noise control requirements in complex environments like rail transit stations (involving wheel-rail noise, structural vibration, and reverberant noise) by proposing a broadband composite noise reduction metamaterial (BNVRM). This metamaterial integrated spindle-shaped phononic crystal plates, S-shaped Fabry–Perot sound absorption channels, and micro-perforated panels. By establishing a coupled “vehicle-track-bridge-metamaterial” dynamic model and conducting acoustic analysis, the study revealed that the phononic crystal plates suppressed structural vibration via the negative mass density effect (noise reduction: 2.0 dB(A)), the S-shaped channels enhanced mid-to-high frequency sound absorption by prolonging the sound path (noise reduction: 4.5 dB(A)), and the micro-perforated panels optimized low-frequency absorption (noise reduction: 2.0 dB(A)). Parameter optimization improved the BNVRM’s total noise reduction to 7.4 dB(A), achieving an integrated design for “sound insulation-sound absorption-vibration reduction” in complex scenarios. Thakre et al. [
24] proposed a novel noise barrier structure. This design utilized composite sound absorption panels made from industrial waste materials (fly ash, waste rubber, and cement) to efficiently absorb noise in the 500–1600 Hz range, operating on the same principle as conventional barrier absorption panels. A rotatable noise cap (adjustable between 45° and 270°) enhanced insertion loss by altering sound reflection paths, offering functionality similar to but more flexible than traditional T-shaped or Y-shaped barrier top structures. Li et al. [
25] employed full-scale modeling to investigate the noise reduction performance of semi- and fully enclosed barriers for high-speed railways. Their results demonstrated that a fully enclosed metal noise barrier incorporating composite sound absorption plates achieved an attenuation of up to 25 dB(A) at a distance of 7.5 m from the track centerline.
While the aforementioned studies primarily focus on noise barrier structures and their optimization, prediction methods for the acoustic performance of barriers have received less attention. The Boundary Element Method (BEM) is one approach currently used for simulating and predicting the acoustic performance of noise barriers, and two-dimensional (2D), 2.5-dimensional (2.5D), and three-dimensional (3D) BEM numerical methods have also been developed [
26,
27,
28,
29,
30,
31]. Lázaro et al. [
32] employed Boundary Element Method (BEM) numerical modeling to illustrate the development of a low-height noise barrier for railway applications. The study found that applying a porous granular material to the barrier’s inner face effectively controls sound reflections between rolling stock and the barrier, thereby enhancing its acoustic efficiency. Focusing on the optimized solution, insertion loss was analyzed across a network of acoustic receivers (i.e., measurement points) positioned 10 meters from the track. This analysis evaluated achievable noise reduction levels at locations typically occupied by humans in activity zones. Li et al. [
33] investigated the acoustic performance of a nearly enclosed barrier using scale model experiments and 2.5D BEM simulations. Their study found that resonance at the top opening degraded performance, and the insufficient sound insulation of the top transparent panels caused initial measured results to fall below simulations. After coating the model surfaces with rubber, the measured results agreed well with the BEM simulations, validating the method’s reliability. Application of the validated method revealed that the barrier provided average attenuation of approximately 15 dB in the near field and 10 dB in the far field and that an increased number of incoherent point sources reduced the overall noise reduction effectiveness. However, these methods lack the advantage of accounting for power dissipation within track components. To address this, Sadeghi et al. [
34] proposed a noise prediction approach combining the Finite Element Method (FEM) and Statistical Energy Analysis (SEA). Compared to previous methods, this FEM–SEA approach has the advantage of considering power dissipation along track components. The results obtained using this new approach were compared with field measurements conducted in the study. The comparison demonstrated that the proposed FEM–SEA method is effective for accurately predicting noise from ballasted railway tracks.
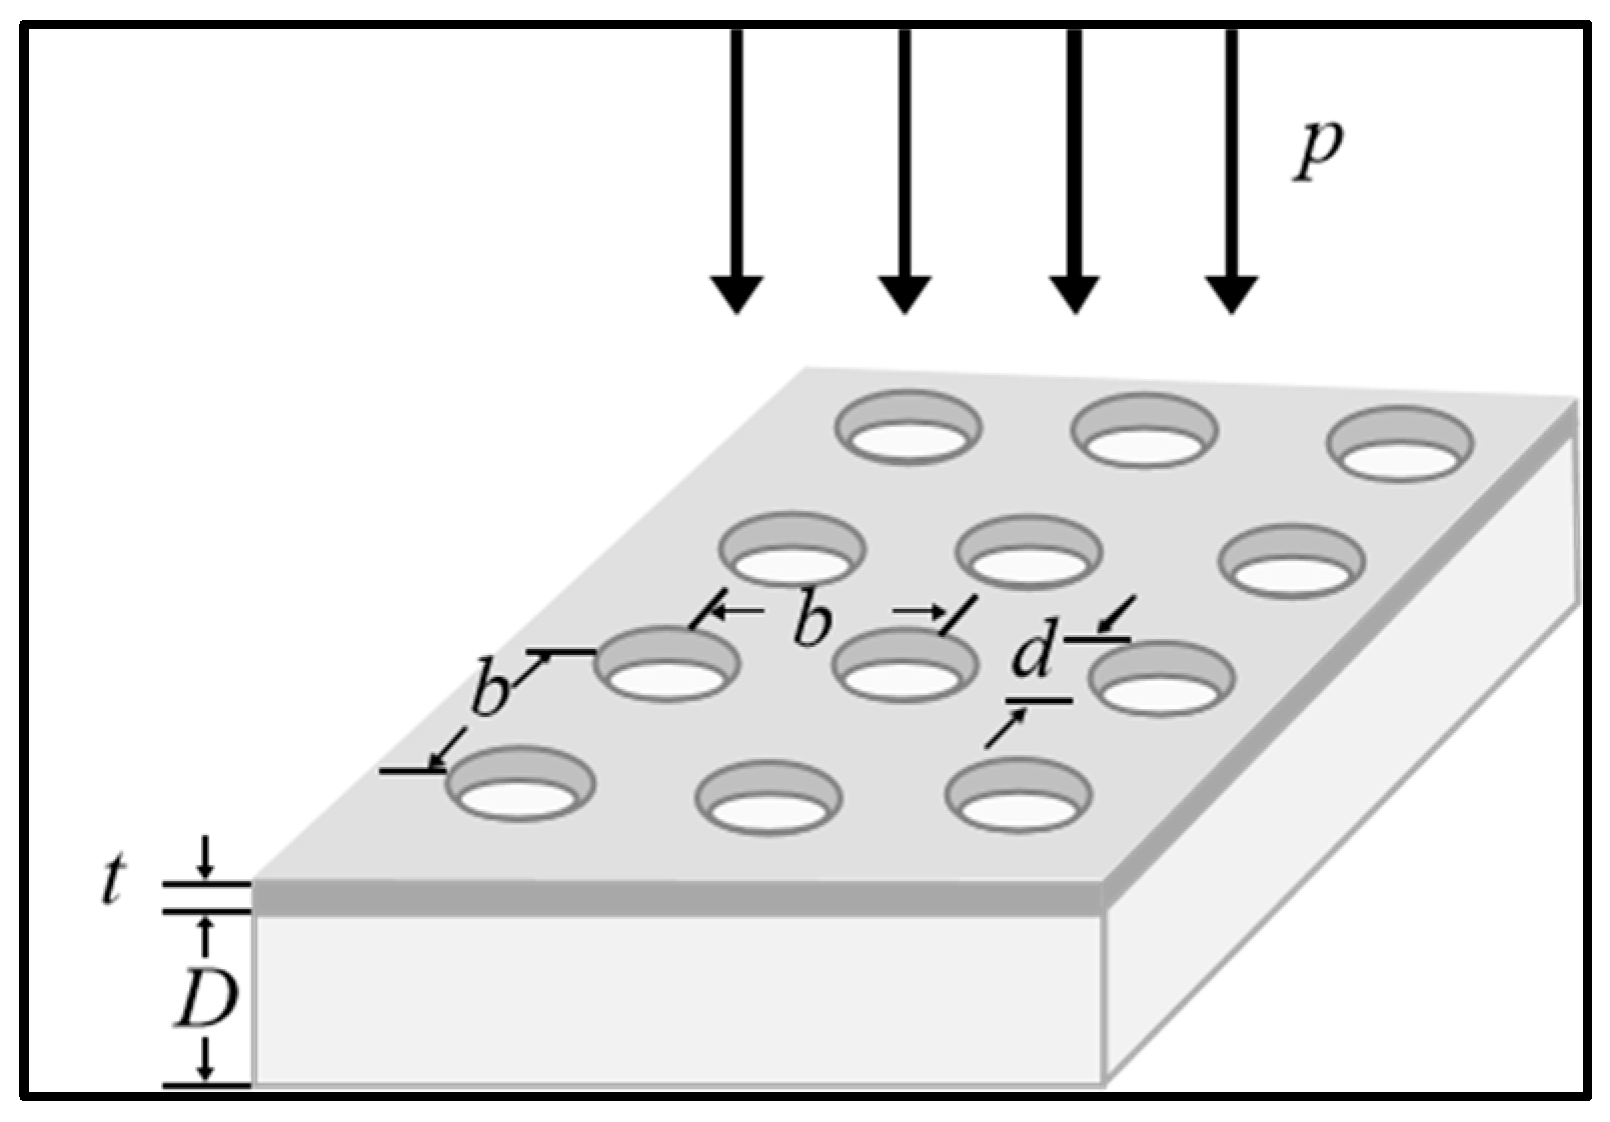
This study underscores the necessity for further research to develop robust quantification methodologies for evaluating sound barrier performance with MPP noise mitigation strategies in elevated rail transit scenarios. It seeks to address the near-field noise amplification phenomenon and enhance the acoustic performance of sound barriers for mitigating train-induced noise along urban rail corridors. An SEA model incorporating field-measured spectra (100–6300 Hz) was developed to evaluate the noise reduction capabilities of both vertical and fully enclosed barrier configurations before and after MPP implementation. MPP parameters (d = 0.1 mm, t = 2 mm, D = 60 mm, b = 0.2 mm) were determined through Maa’s theoretical framework, while a neural network surrogate model (R2 = 0.9094) was established to facilitate geometric optimization of vertical noise barriers. Through the integration of material parameters and geometric optimization design, the improvement in noise reduction performance was achieved, with concurrent elimination of near-field noise amplification effects, demonstrating an effective approach for urban rail noise control.
3. Numerical Simulations
This study utilized the commercial vibro-acoustic simulation suite VA One 2021 to analyze acoustic field distributions under different configurations for the investigated elevated subway line. The simulation methodology based on Statistical Energy Analysis (SEA) is described in
Section 3.1, while comprehensive model validation is presented in
Section 3.3.
3.1. Prediction Methodology
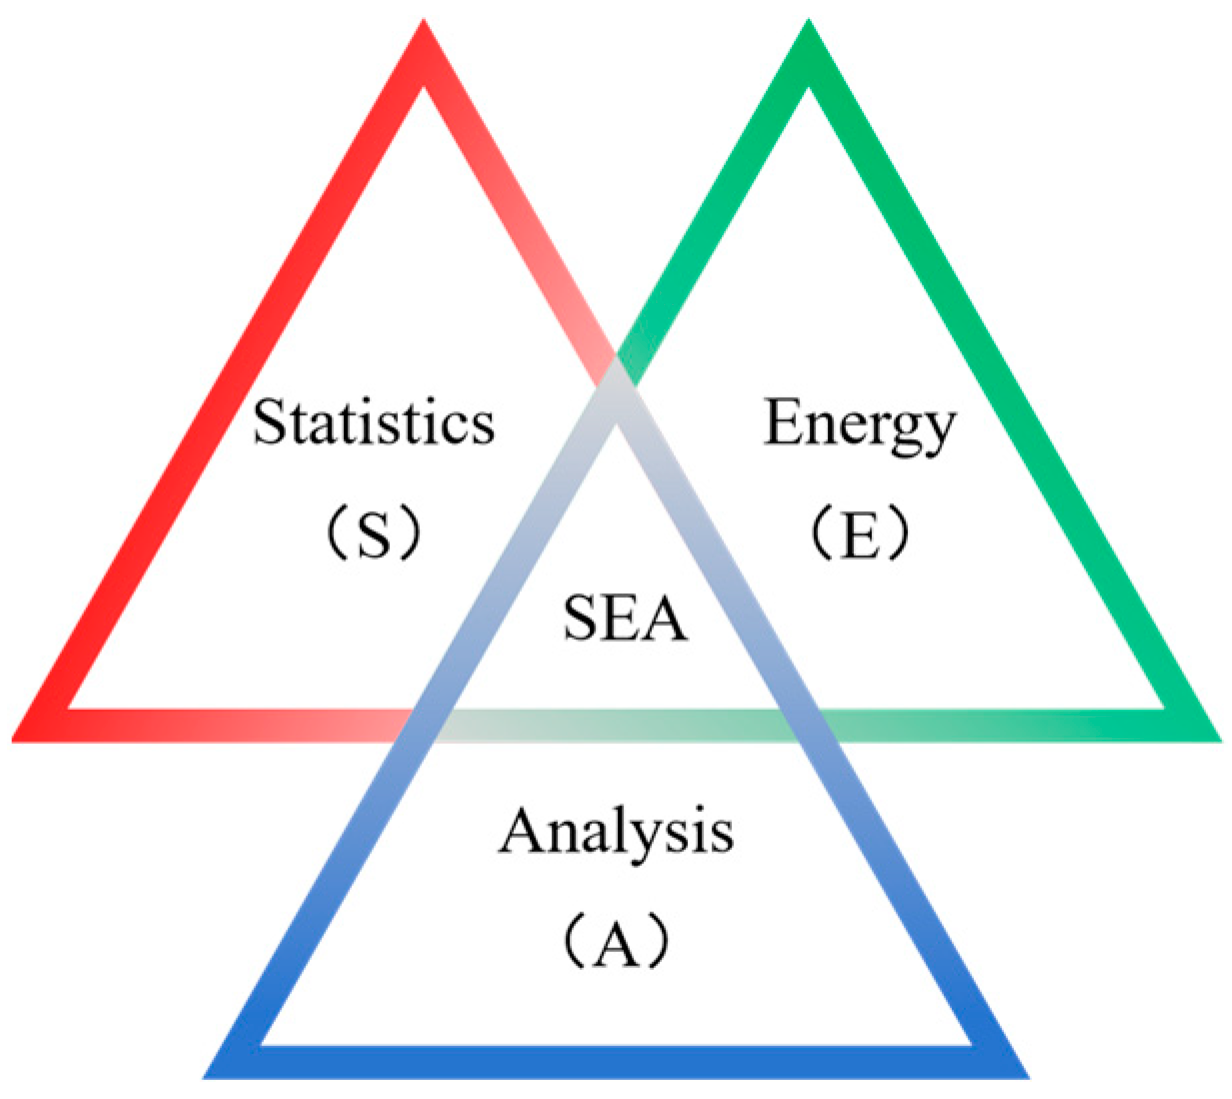
Predicting high-frequency train-induced vibration noise faces challenges from uncertainties in higher-order modal parameters. The SEA method [
35] addresses this by employing statistical modal concepts, treating vibrational energy as the fundamental parameter. By leveraging intrinsic connections between vibrational waves and modes, SEA can simulate energy flow across subsystems. This approach is particularly applicable for coupled dynamic systems with high-frequency excitation, high modal density, and complex configurations (incorporating acoustic and structural subsystems, or structural subsystems alone), as conceptually illustrated in
Figure 3.
3.2. Model Development
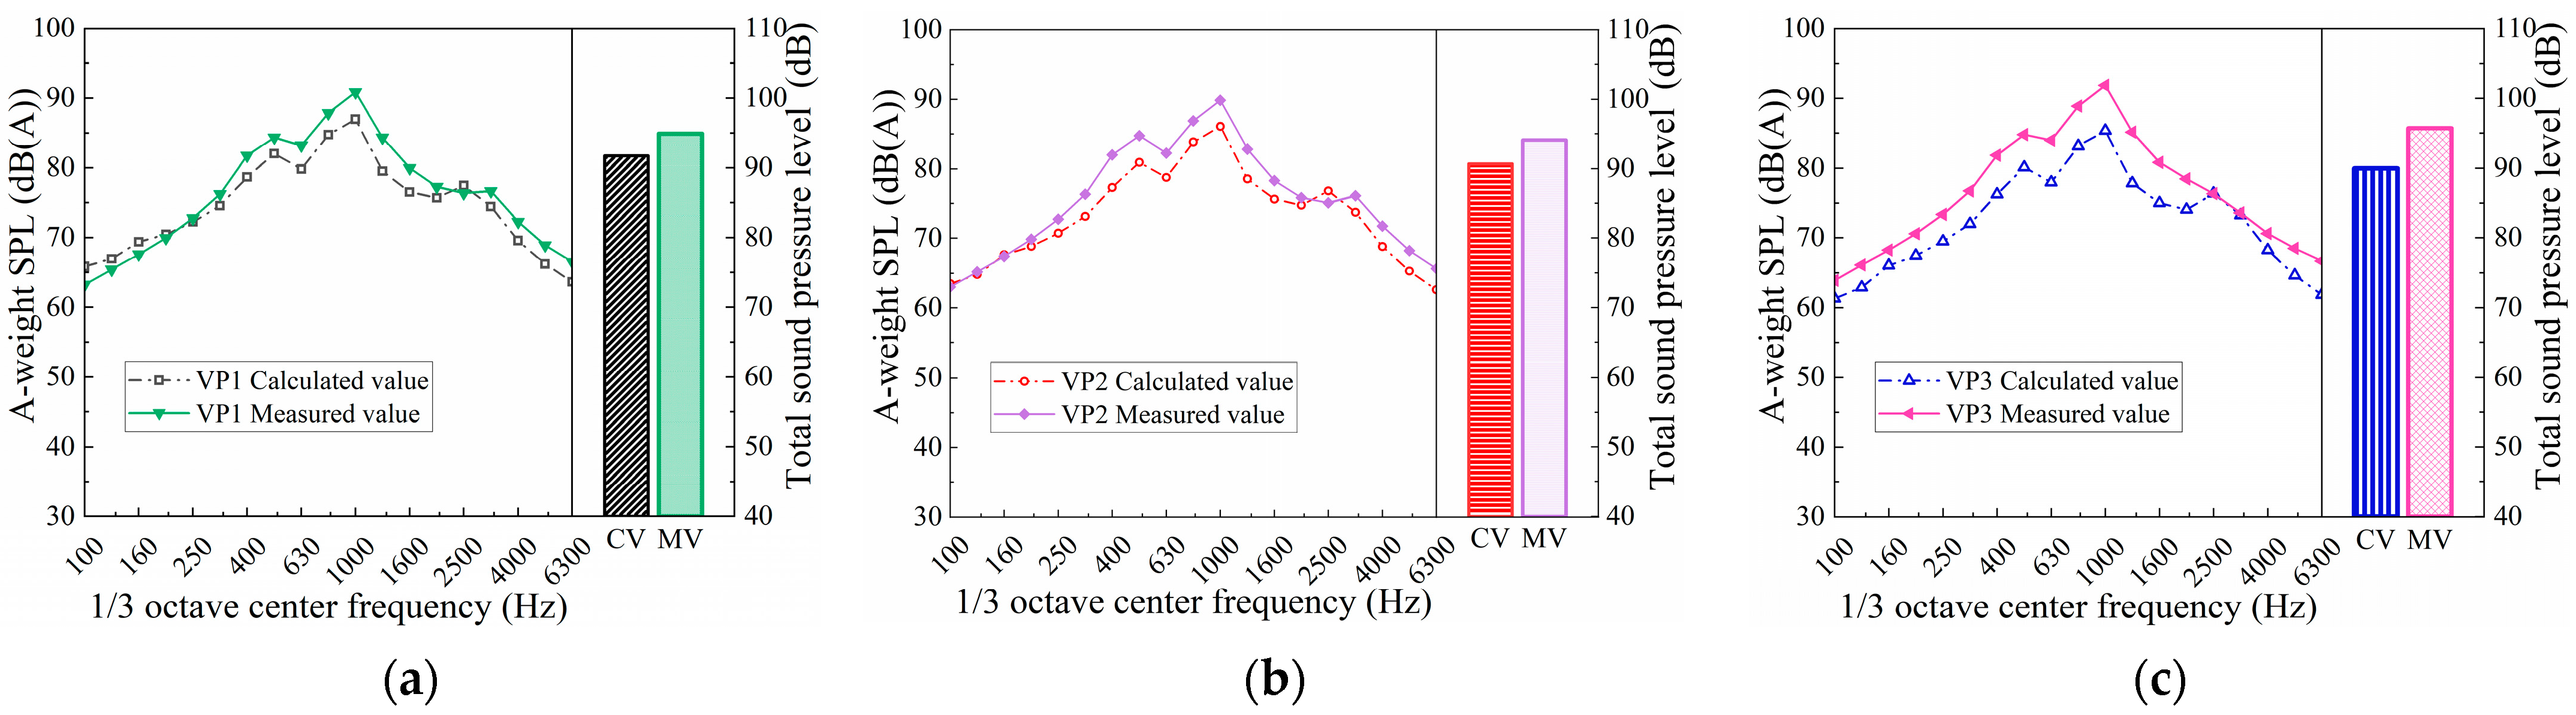
This study developed acoustic prediction models based on the geometric configuration of a four-car metro train system, as described in
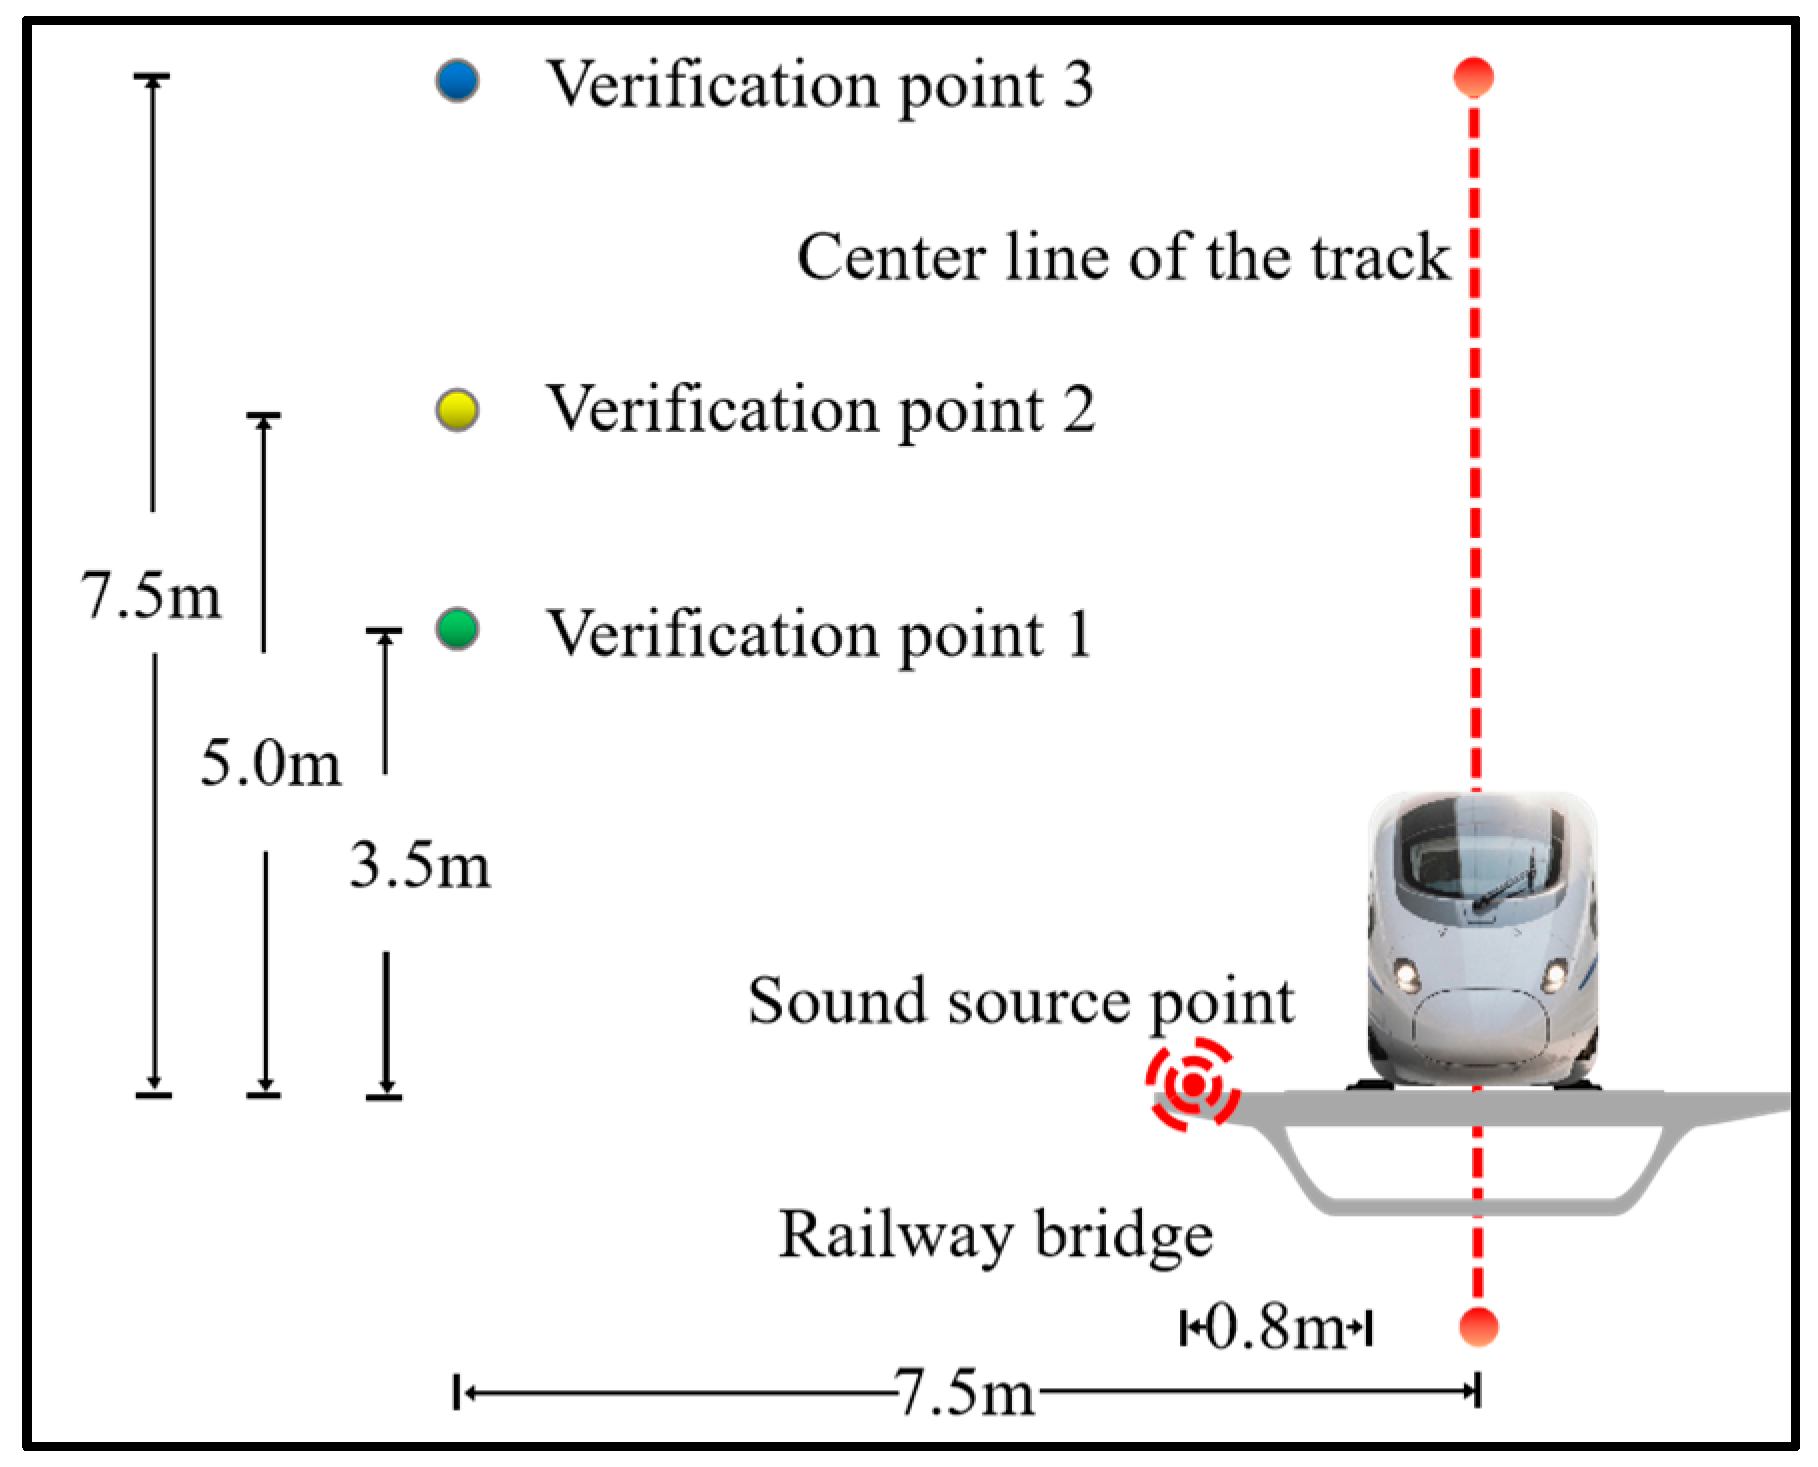
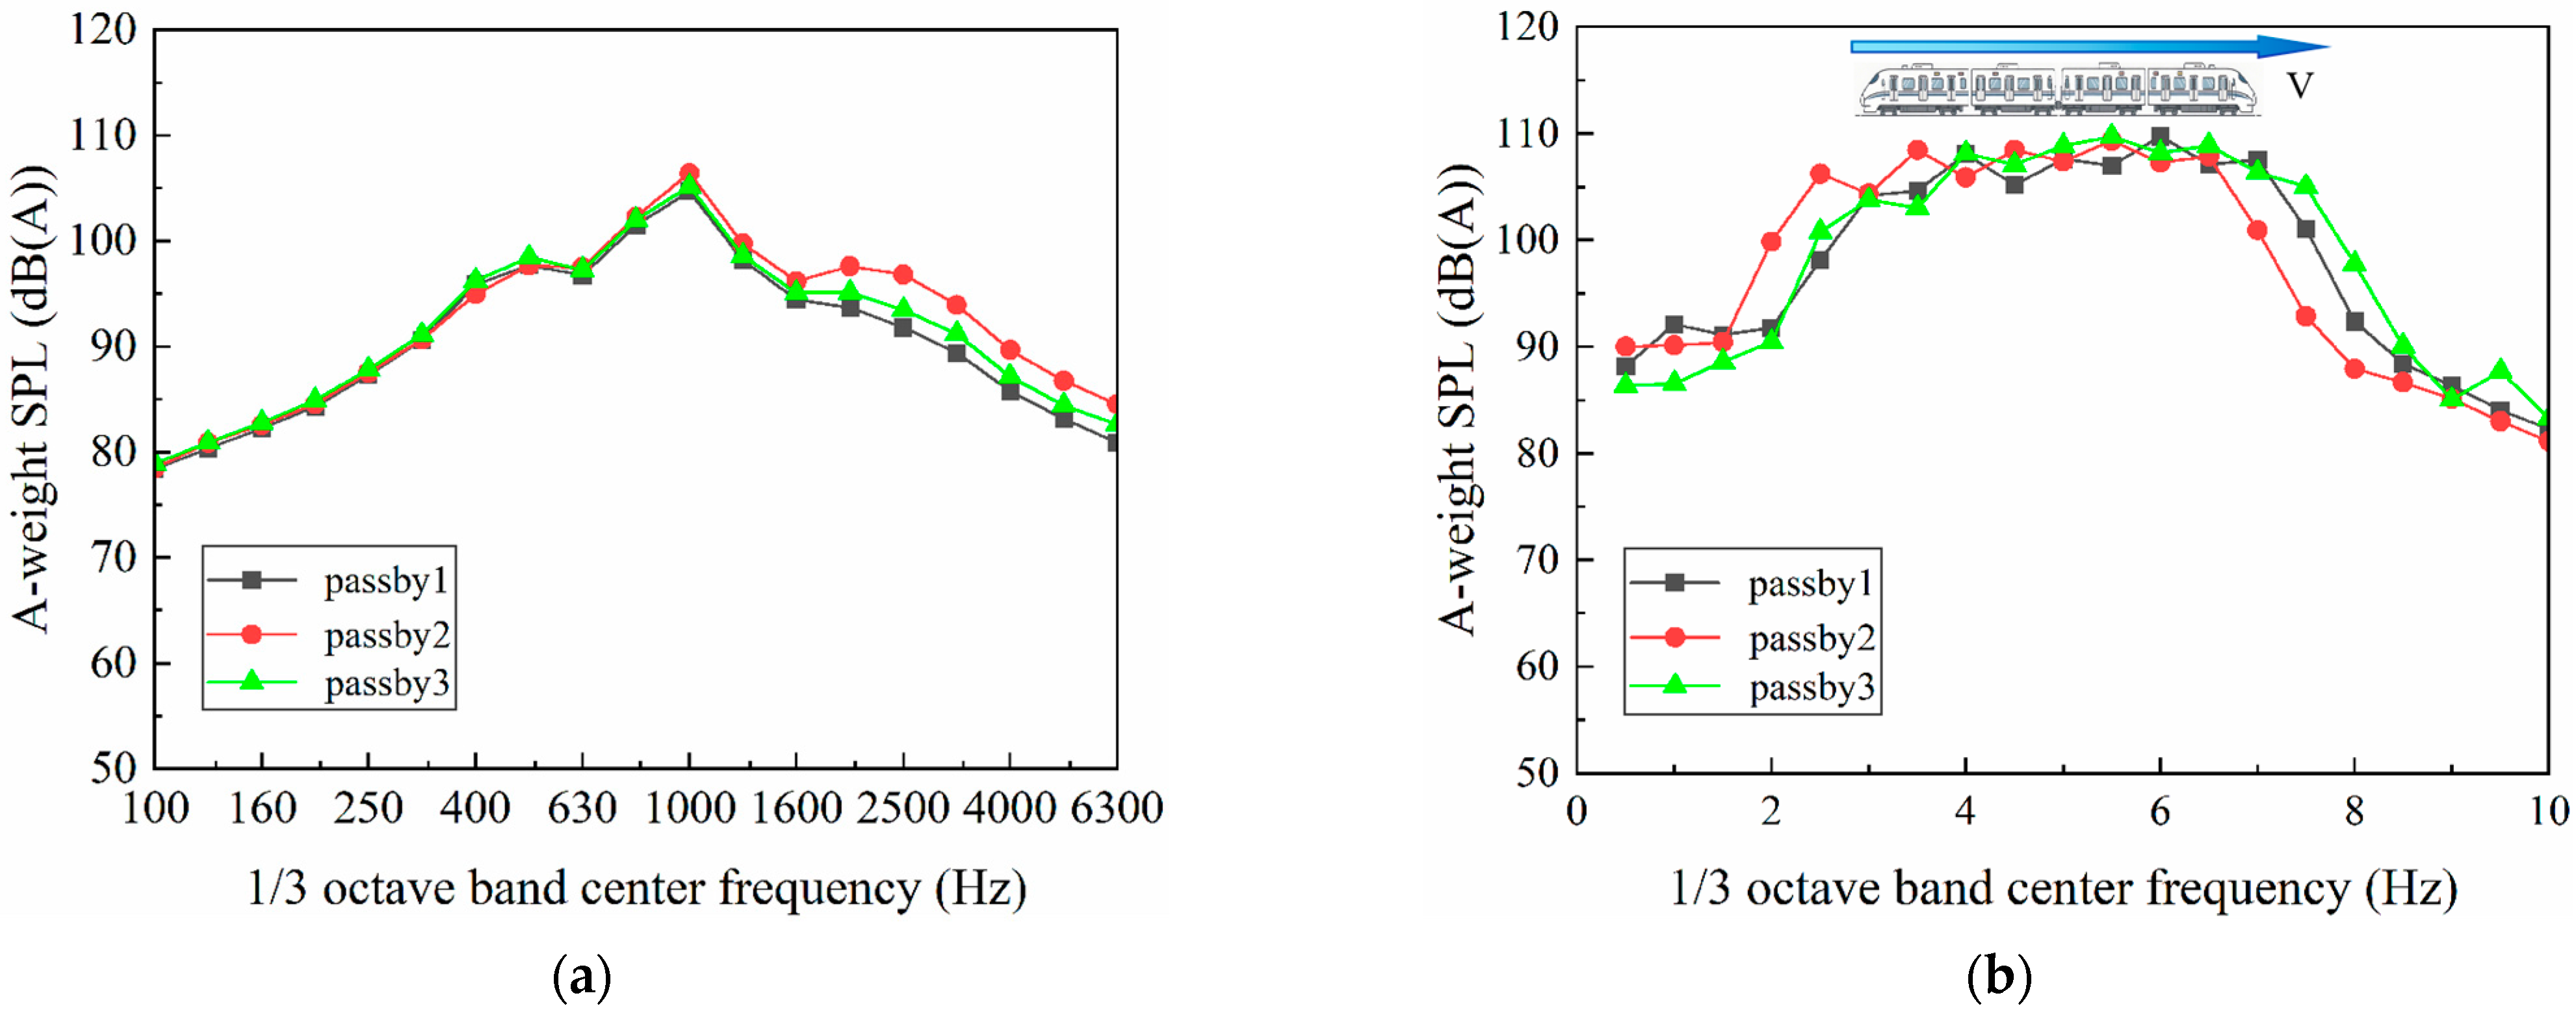
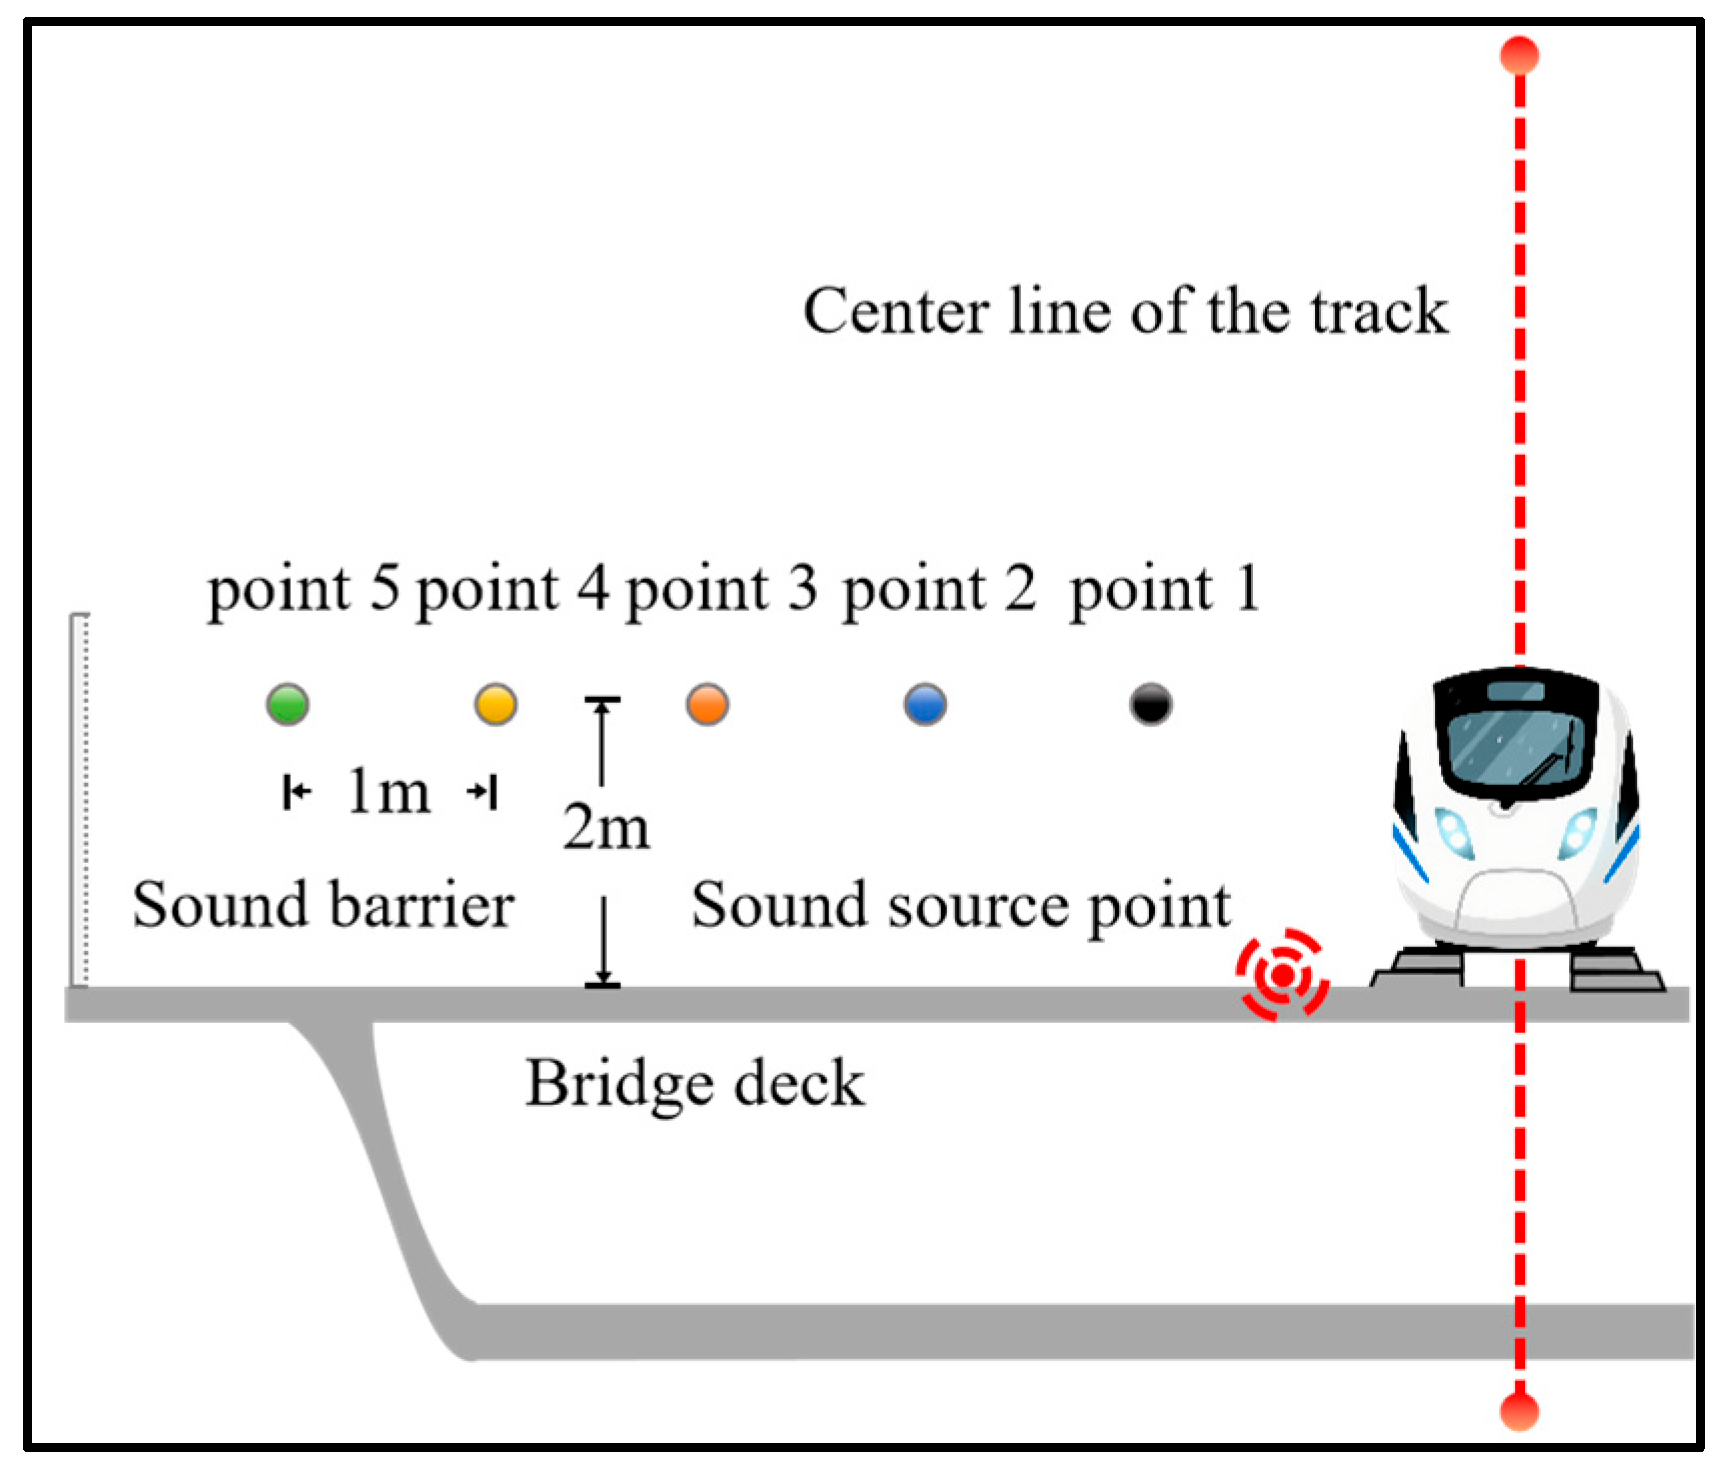
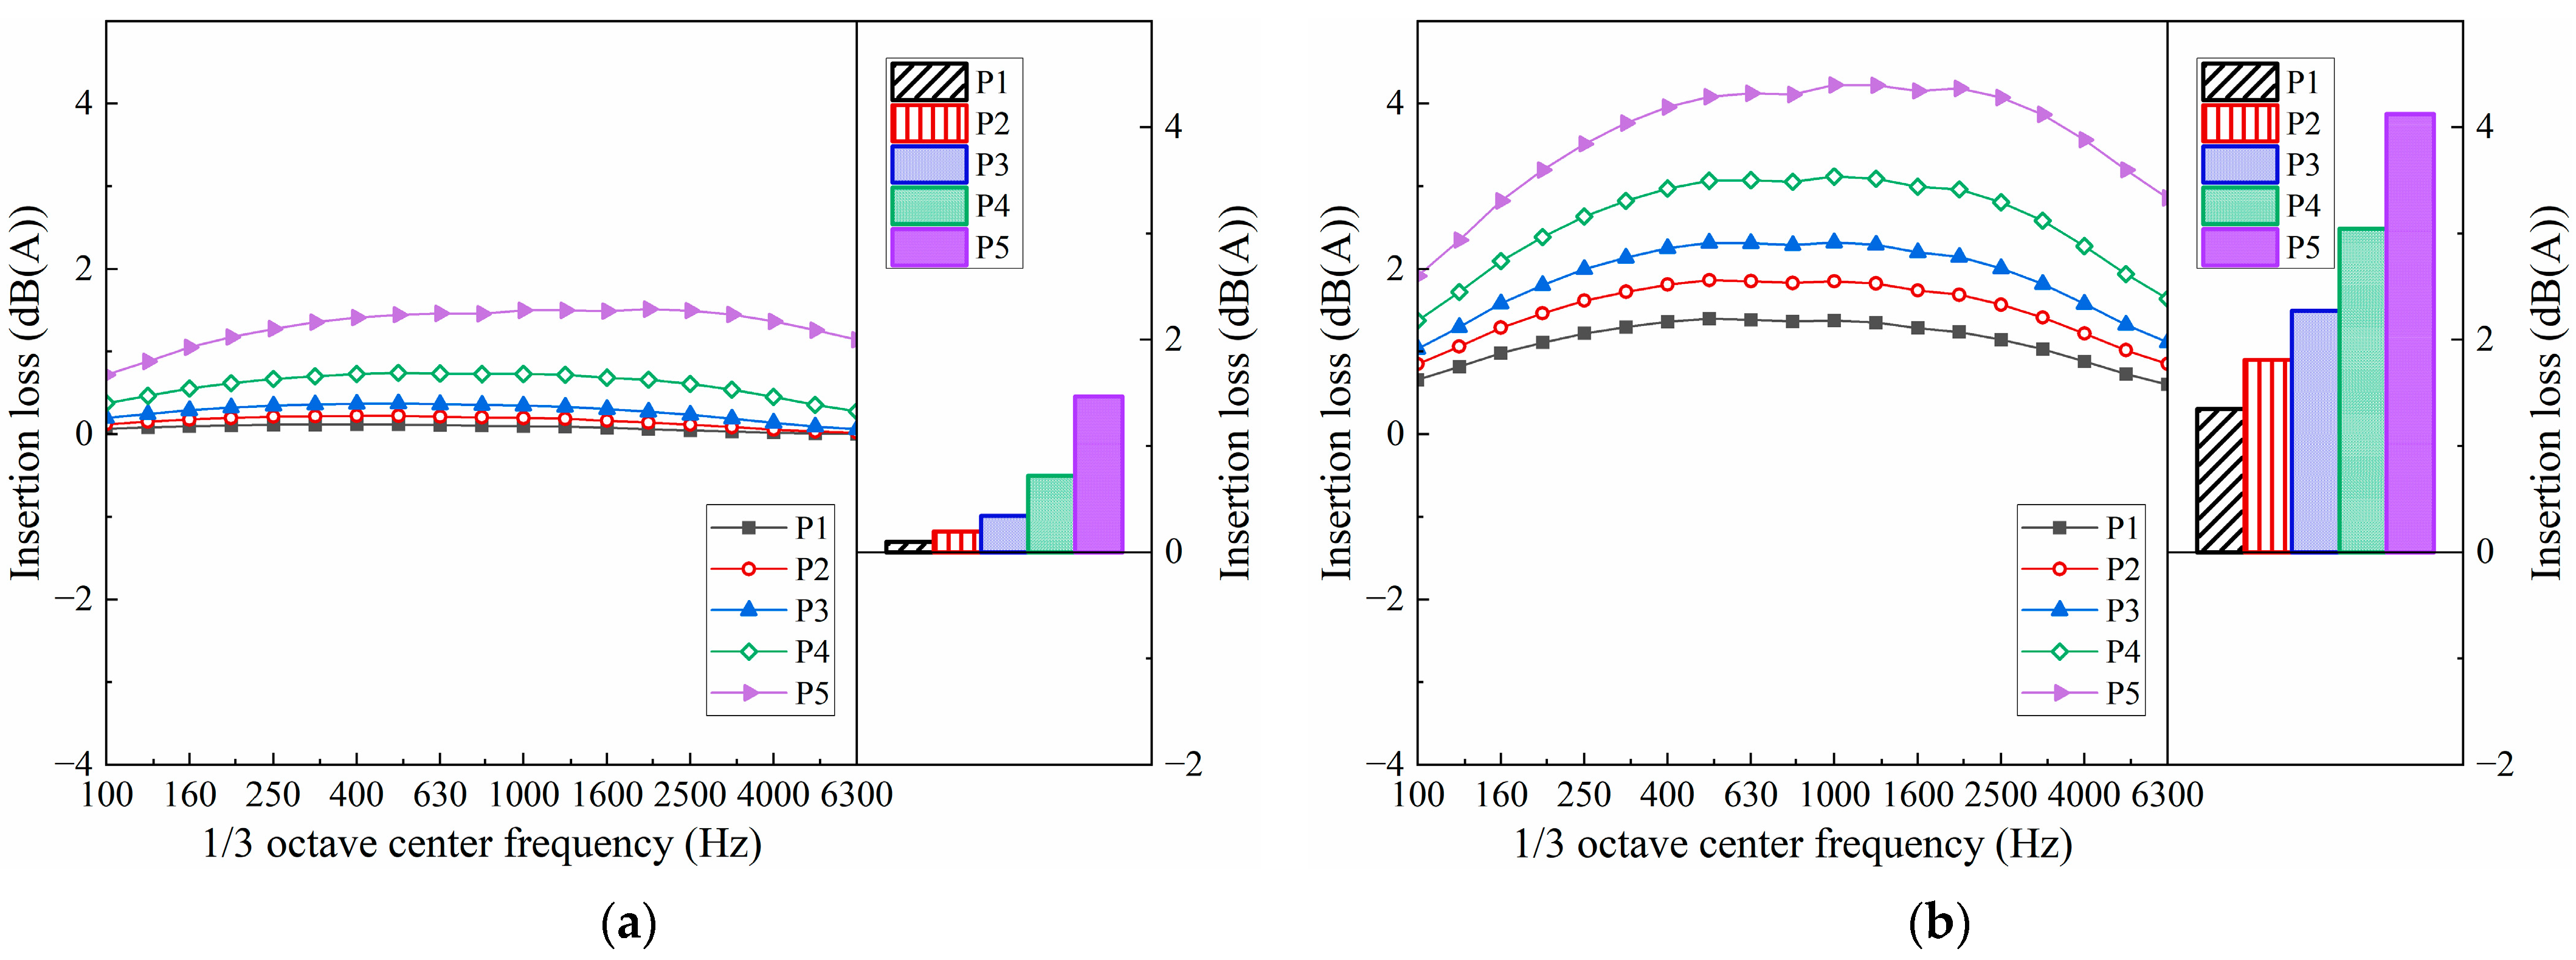
Section 2. The train noise source was characterized as an infinite line source exhibiting cylindrical wave radiation patterns. To optimize computational efficiency while maintaining accuracy, the numerical simulation employed a half-model approach that exploits the structural symmetry of the integrated metro train–track–bridge system. An acoustically rigid boundary condition was implemented at the symmetry plane to ensure proper wave propagation. The equivalent train pass-by noise source was derived from one-third octave band SPL measurements spanning the frequency range of 100–6300 Hz (
Figure 2a) and simulated through constraint-based acoustic modeling.
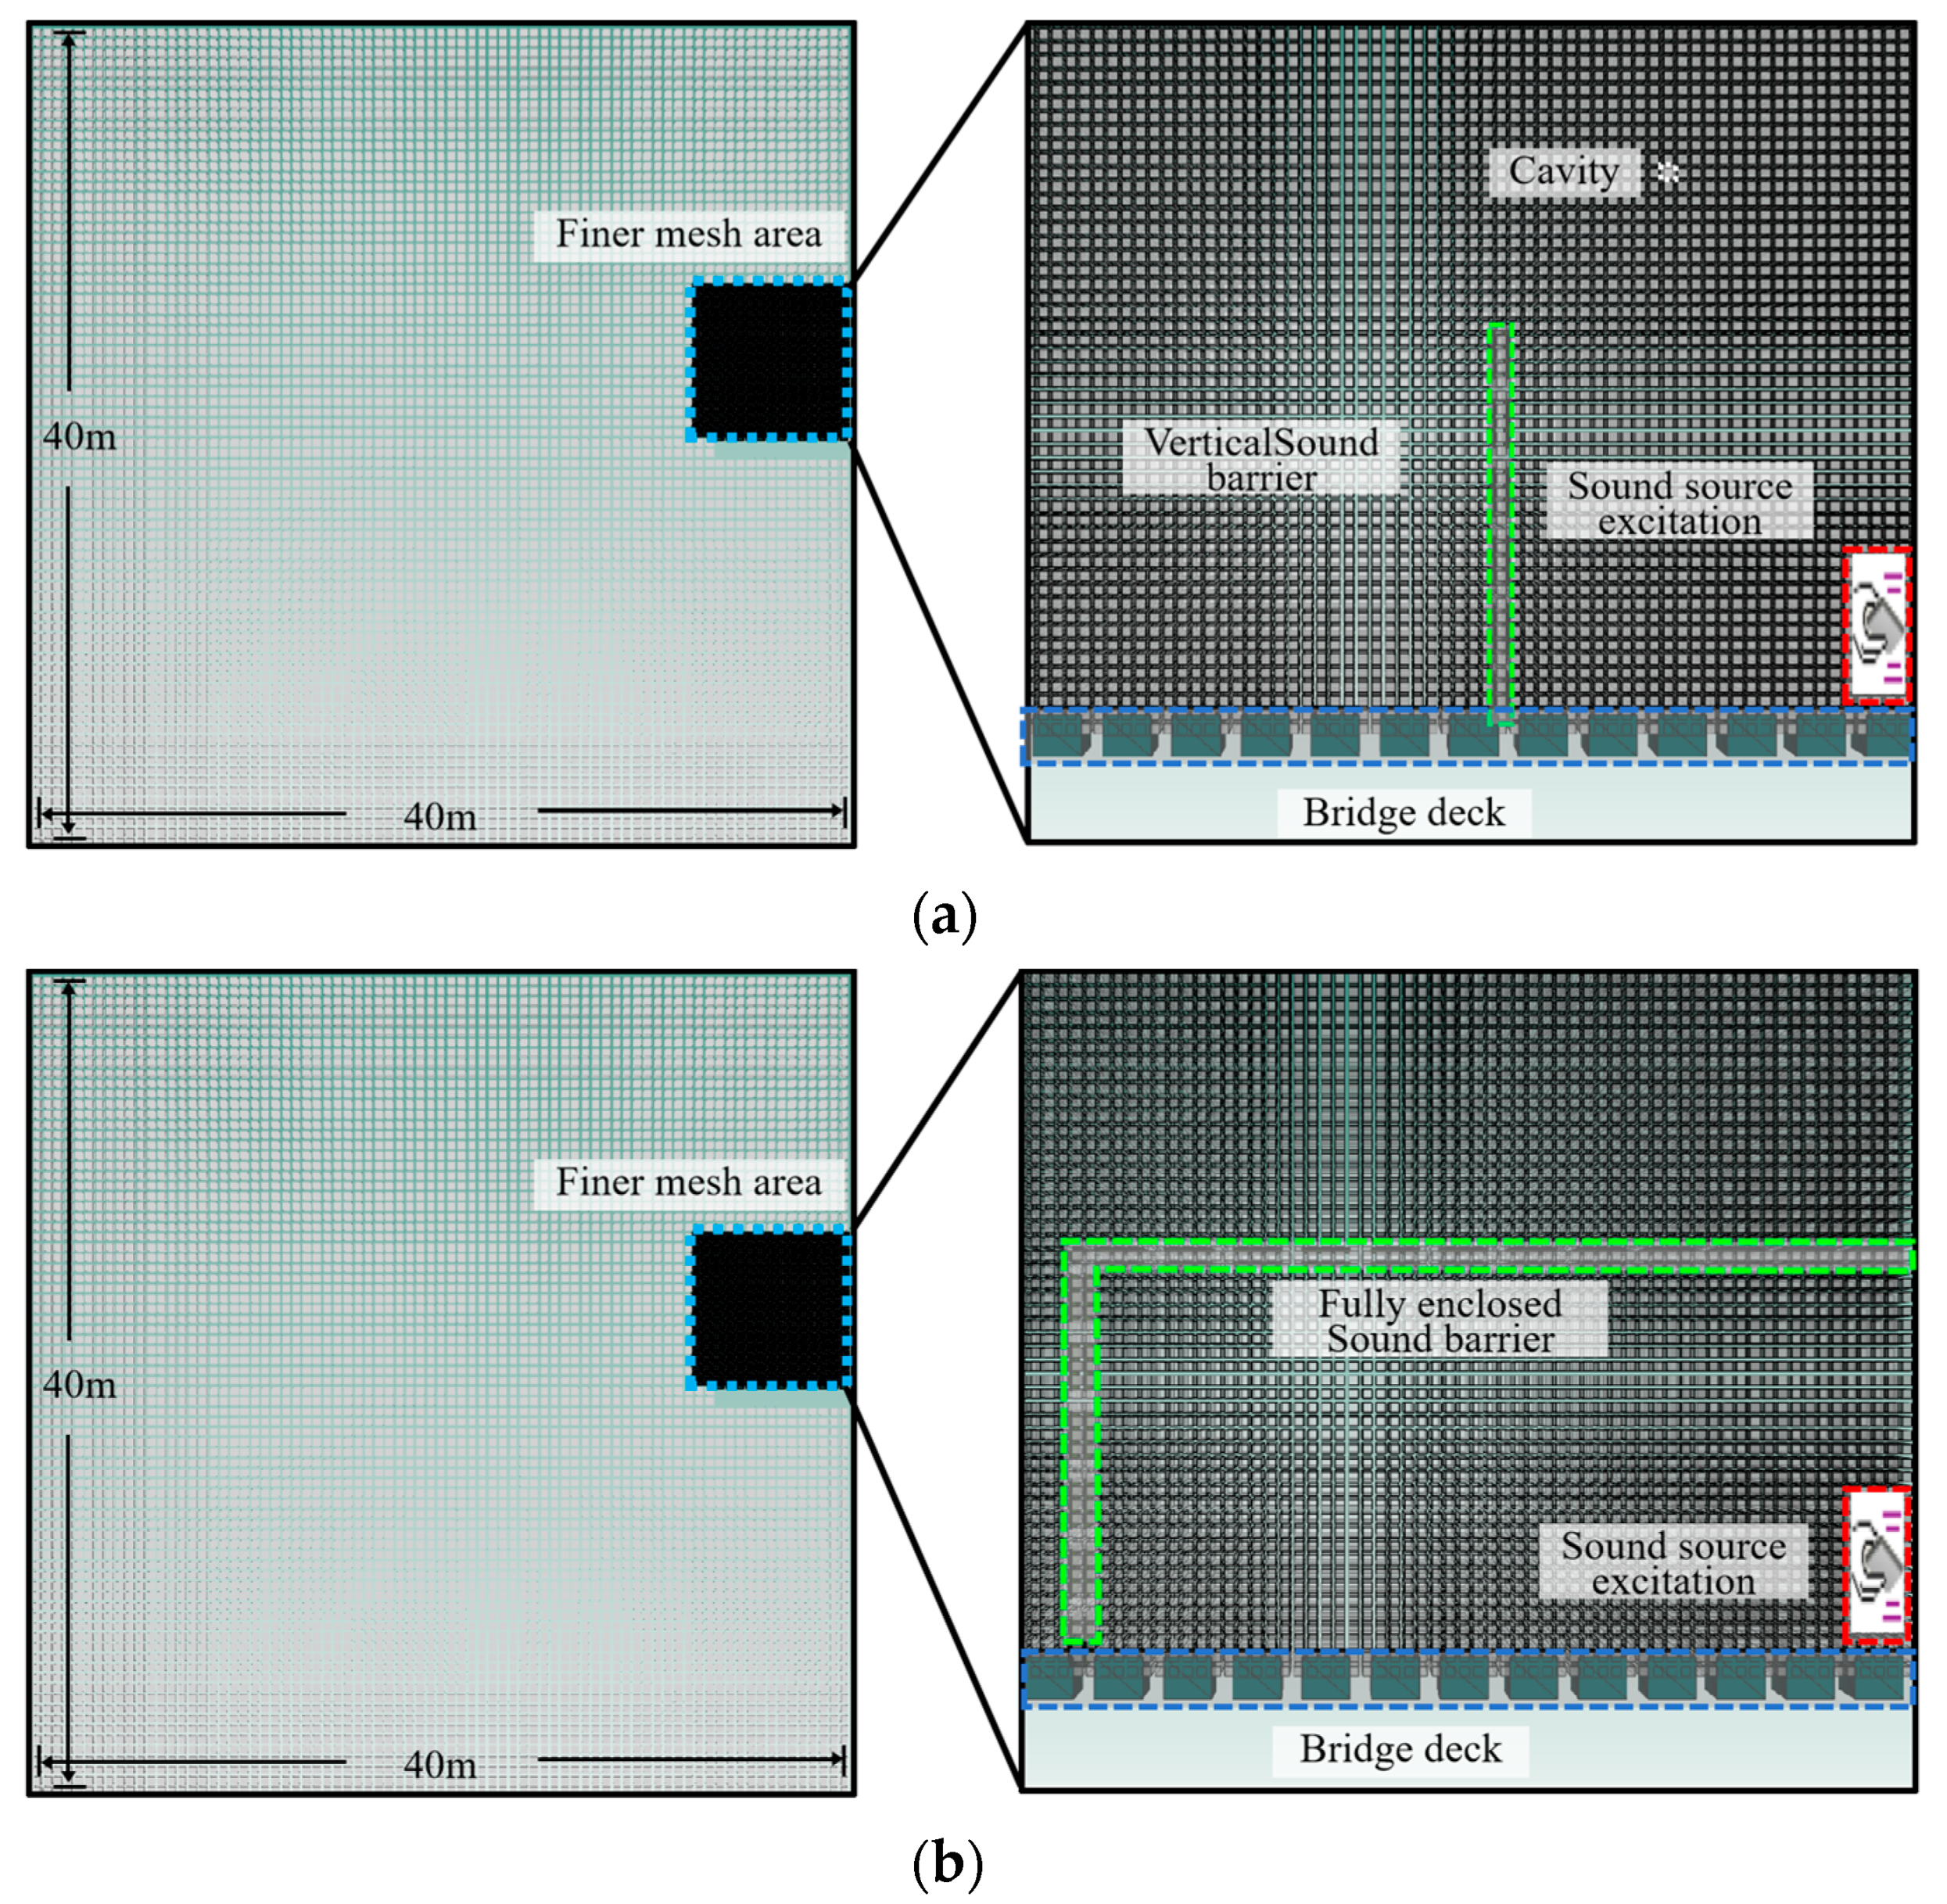
The noise barrier was rigorously modeled using the SEA method, incorporating its actual physical dimensions to investigate the noise reduction effects of different barrier designs. The barrier panel was represented as a 1 mm thick steel plate.
Figure 4a,b illustrates the simulation models for the vertical and fully enclosed barrier configurations, respectively. The computational domain comprised a rectangular acoustic field (40 × 40 m), with the track centerline positioned 40 m from the left boundary and aligned with the right boundary. The vertical extent of the domain extended 20 m above and below the bridge deck elevation.
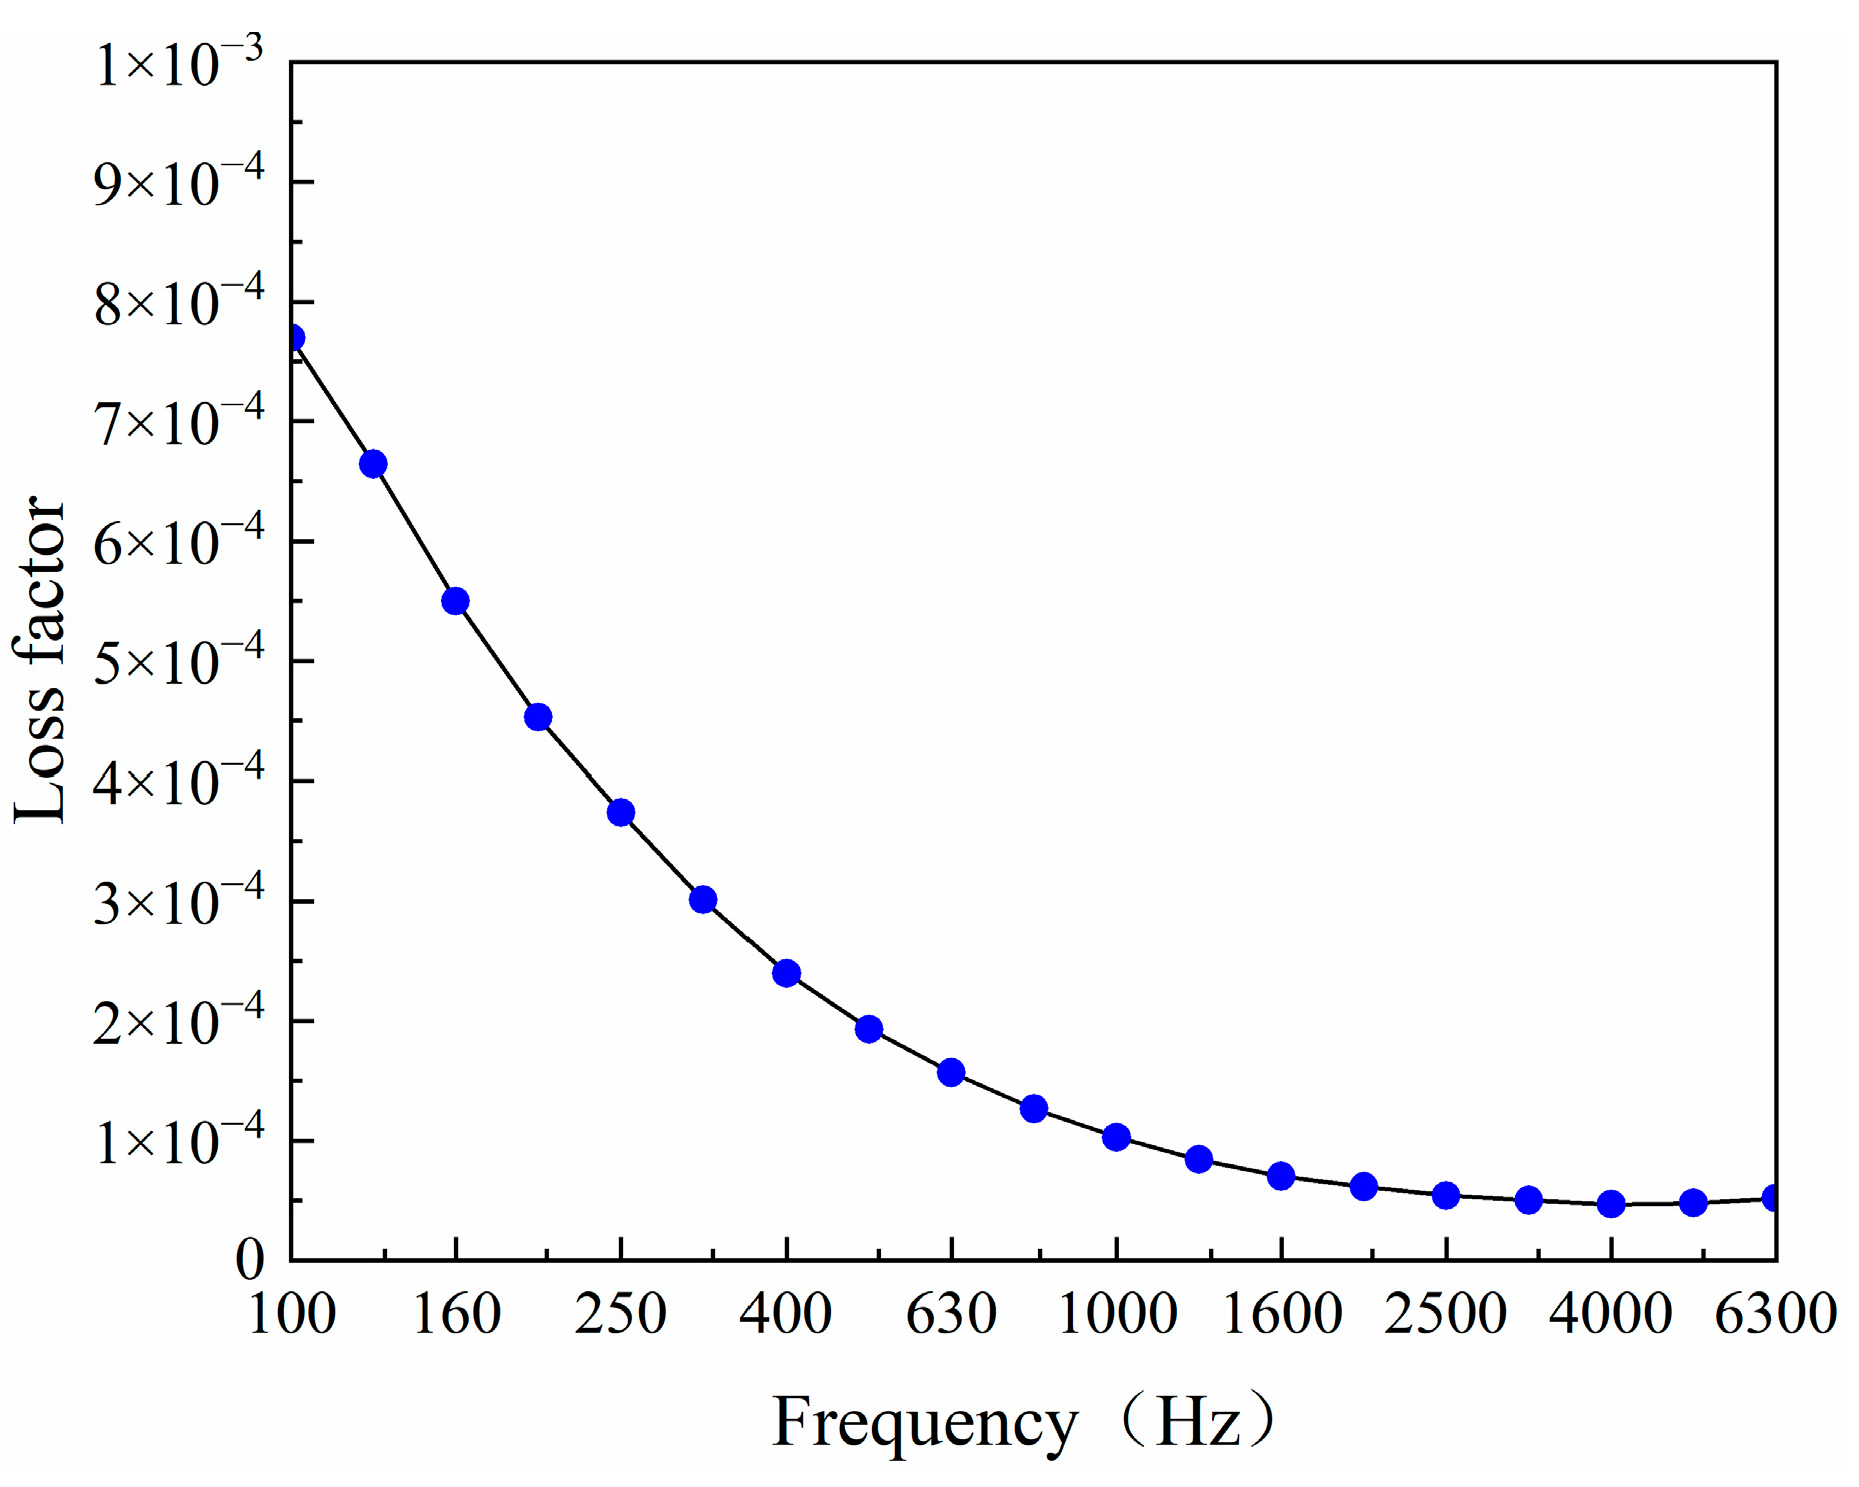
During noise propagation from operating trains, sound energy reaching the barrier surfaces follows the following three primary transmission paths: (1) diffraction over the barrier top to receivers, (2) transmission through barrier materials, and (3) reflection from barrier surfaces [
36]. The acoustic cavities were predominantly discretized using 0.5 m cubic elements, while a refined mesh resolution of 0.1 m × 0.1 m × 0.5 m (width × height × depth) was employed in the critical 7.5 m × 7.5 m zone above the bridge deck to achieve enhanced fidelity. Sound transmission characteristics were implemented by specifying the loss factor and absorption coefficient of the acoustic cavity. The air-mediated sound transmission loss factor is presented in
Figure 5 [
37], while the absorption coefficients for configurations with interior sound-absorbing materials are detailed in
Section 4.1.
3.3. Model Validation
To validate the reliability of the modeling approach, this section compares simulated sound pressure levels with field-measured values at three validation points (VP1-VP3) as shown in
Figure 6a–c, respectively.
For VP1-VP3, the one-third octave band spectra consistently demonstrate good agreement between numerical simulations and field measurements, with aligned SPL trends across frequencies peaking at 1000 Hz. The maximum discrepancies between predicted and measured values were 4.81 dB(A), 4.71 dB(A), and 7.30 dB(A) for measurement points VP1 through VP3, respectively, corresponding to relative errors of 5.7%, 5.7%, and 8.6%.
Furthermore, the measured overall SPLs exhibited acceptable deviations. The absolute prediction errors were 3.22 dB(A), 3.39 dB(A), and 5.76 dB(A) for measurement points VP1 through VP3, respectively, corresponding to relative errors of 3.4%, 3.6%, and 6.0%. All values fell significantly below the 10% threshold for engineering tolerance.
Verification through both one-third octave band spectra and overall SPL values confirms high consistency between simulation results and field-measured data, demonstrating the reliability of the modeling framework for subsequent investigations of rail transit noise barriers.
5. Optimization Framework for Sound Barrier Design
The optimization of sound barrier geometric parameters presents significant computational challenges due to the extensive range of design conditions and parameter space requirements, which inevitably lead to substantial increases in computational workload and processing time. To address these computational constraints while maintaining design efficacy, this study develops a systematic optimization framework by developing a surrogate model. While the vertical noise barrier configuration serves as the primary case study in this section, it is important to emphasize that the proposed optimization framework possesses inherent adaptability and can be readily extended to fully enclosed noise barrier designs.
5.1. Data Preparation for Surrogate Modeling
Numerical simulations for 17 configurations were conducted using VA ONE 2021. These included one baseline case without a noise barrier and 16 cases with varying barrier heights and horizontal distances to the track centerline. The barrier height ranged from 3 m to 6 m, and the distance from the barrier to the track center increased from 3 m to 6 m. Both geometric design parameters had an incremental step of 1 m. The typical computed distribution patterns of overall SPL are presented in
Figure 12.
This section describes the systematic data preparation procedure that was used to facilitate the development of an accurate surrogate model, which is shown in
Section 5.2. The procedure began with establishing a linear regression model to quantify the relationship between color intensity values and corresponding sound pressure levels, as defined by the color scale shown in
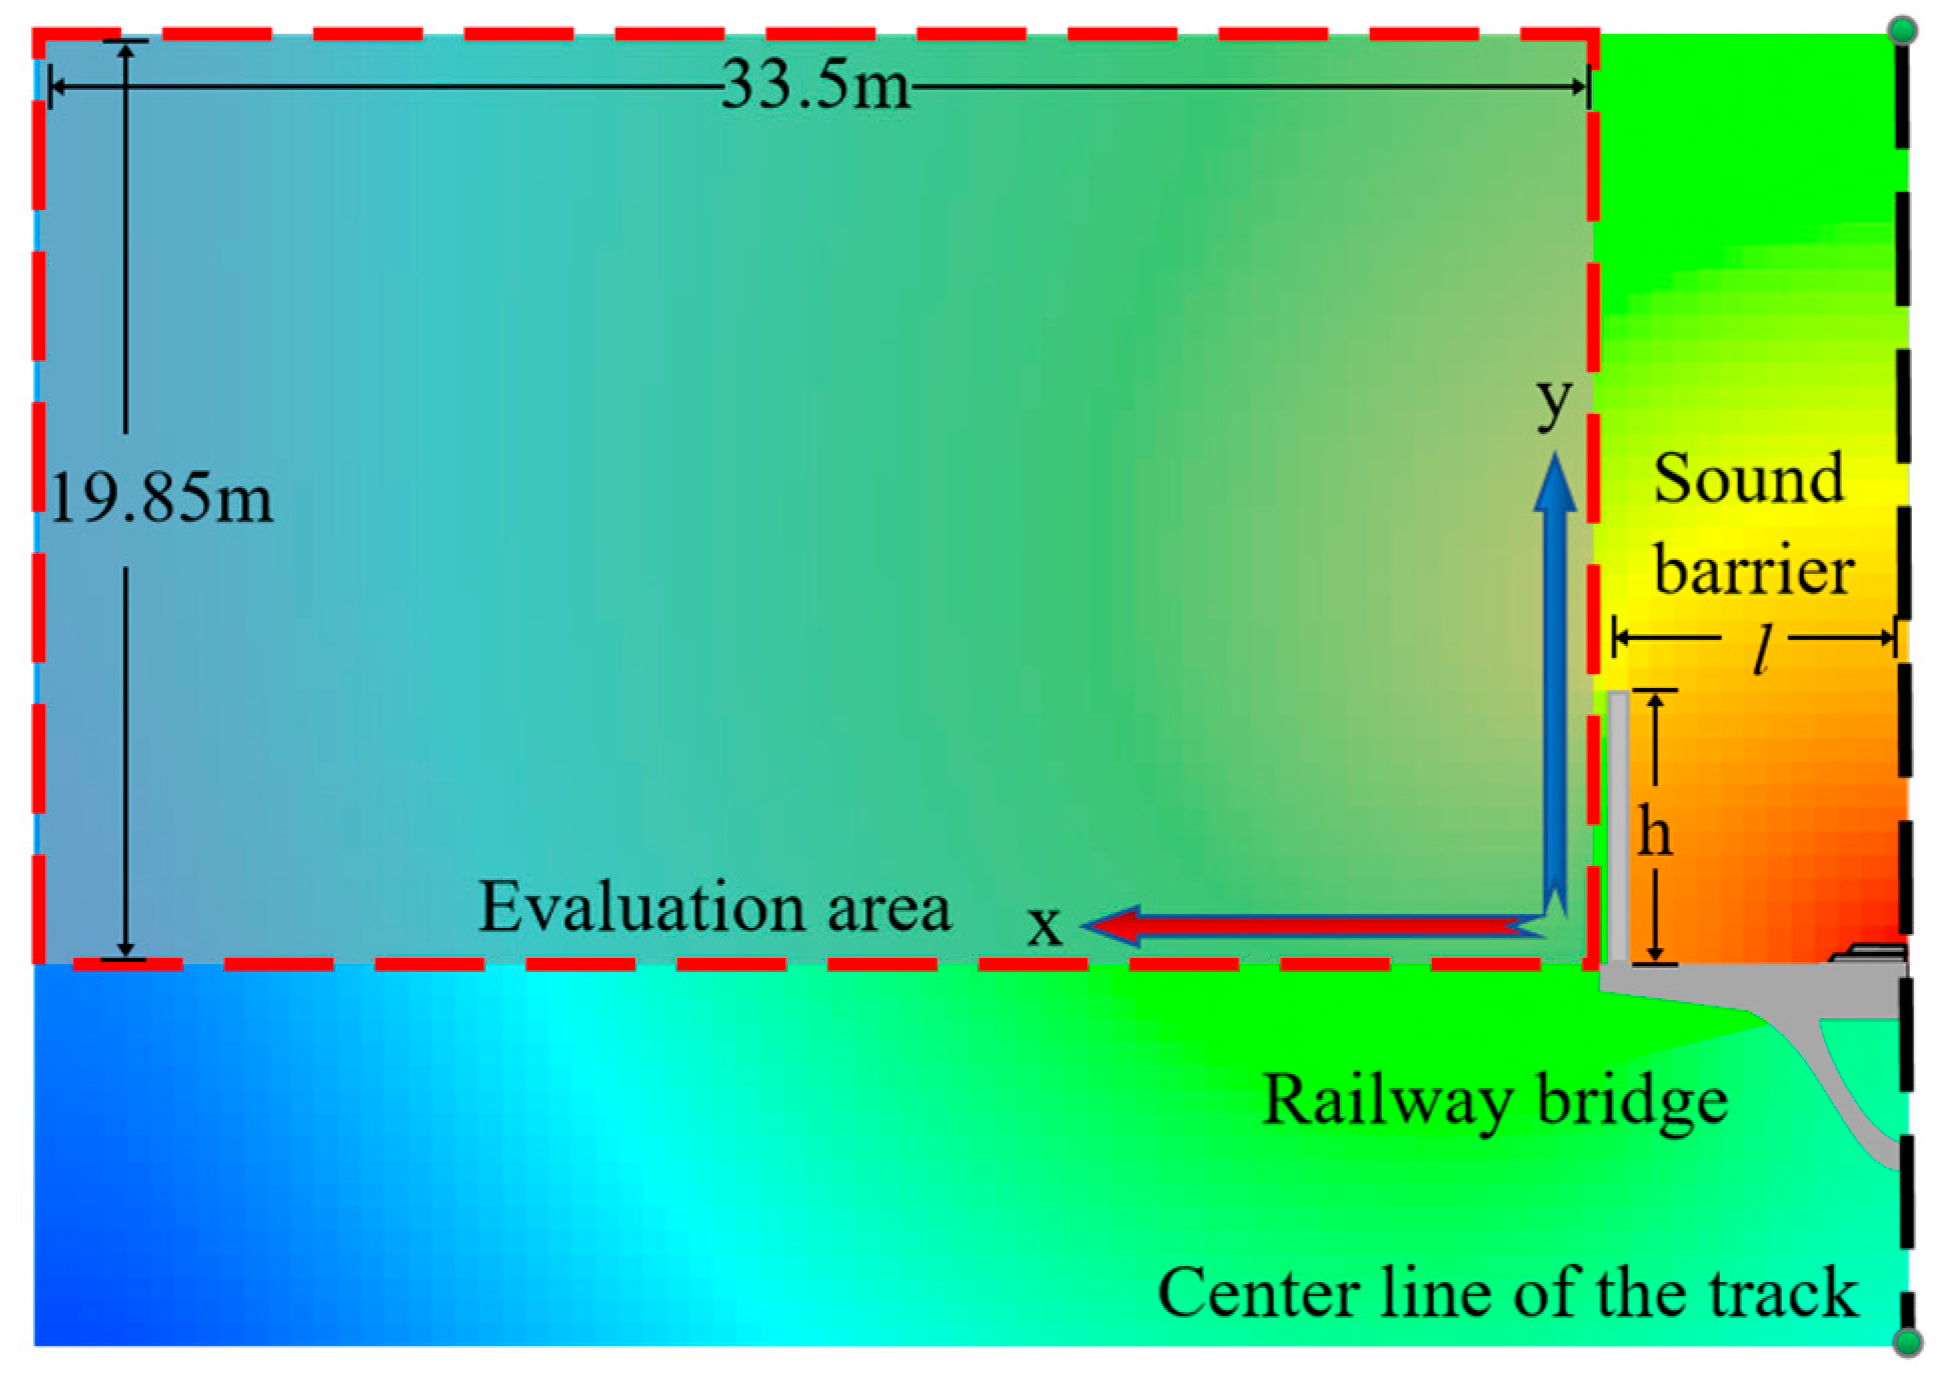
Figure 12. Pixel intensity data were then subsequently extracted from the computed SPL spatial distribution plots across all 17 investigated configurations within a precisely defined rectangular monitoring region. This analysis area extends 33.5 m horizontally from the viaduct edge and 19.85 m vertically, as illustrated in
Figure 13. The extracted color intensities were subsequently transformed into SPL values using the developed linear conversion model. Finally, insertion loss values were computed by subtracting the baseline (no-barrier) SPL calculations from each of the 16 barrier configuration results.
The quantitative relationship between color intensity values and corresponding overall SPL was established through linear regression analysis, yielding the following transformation Equation (7):
The developed linear regression model utilizes independent variables x
1, x
2, and x
3, representing the red, green, and blue color channel intensities, respectively, for individual pixels in the spatial sound pressure level distribution plots. The dependent variable y corresponds to the overall equivalent SPL at each pixel location, with observed values spanning from 39 dB(A) to 109.3 dB(A). As detailed in
Table 1, the model yields an intercept term of 7.403 × 10
1 with a standard error of 1.160 × 10
0, demonstrating extremely high statistical significance (t = 6.380 × 10
1,
p = 1.125 × 10
−235). The red channel coefficient of 9.417 × 10
−2 (SE = 3.650 × 10
−3) shows a strong positive relationship with SPL (t = 2.580 × 10
1,
p = 1.568 × 10
−92), while the green channel coefficient of 6.835 × 10
−4 (SE = 3.230 × 10
−3) exhibits no statistical significance (t = 2.116 × 10
−1,
p = 8.325 × 10
−1). Conversely, the blue channel coefficient of −9.372 × 10
−2 (SE = 3.653 × 10
−3) indicates a significant negative correlation with SPL (t = −2.565 × 10
1,
p = 7.733 × 10
−92). The model achieves excellent predictive capability with an R
2 value of 0.94, confirming its strong explanatory power for converting color intensities to calculated sound pressure levels.
5.2. Development of Surrogate Model
Based on the data prepared in the previous section, a deep learning-based surrogate model was developed for computational optimization of the design parameters. The computational domain for each configuration contained 82,875 discrete data points, yielding a comprehensive dataset of 1,326,000 IL values across all 16 configurations. This dataset was partitioned into 928,200 training samples and 397,800 validation samples to facilitate robust model development and evaluation. The deep learning optimization was applied to the overall SPL in this section to demonstrate the viability of the proposed framework. The overall SPL is defined as the integrated acoustic energy across the frequency band under investigation. Although broadband noise is considered in the current implementation, frequency-specific optimization can be equally accommodated by the methodology. The identical computational framework may be directly adapted for barrier design targeting particular frequency bands, with consistent procedural steps being maintained while narrowband requirements are addressed.
As depicted in
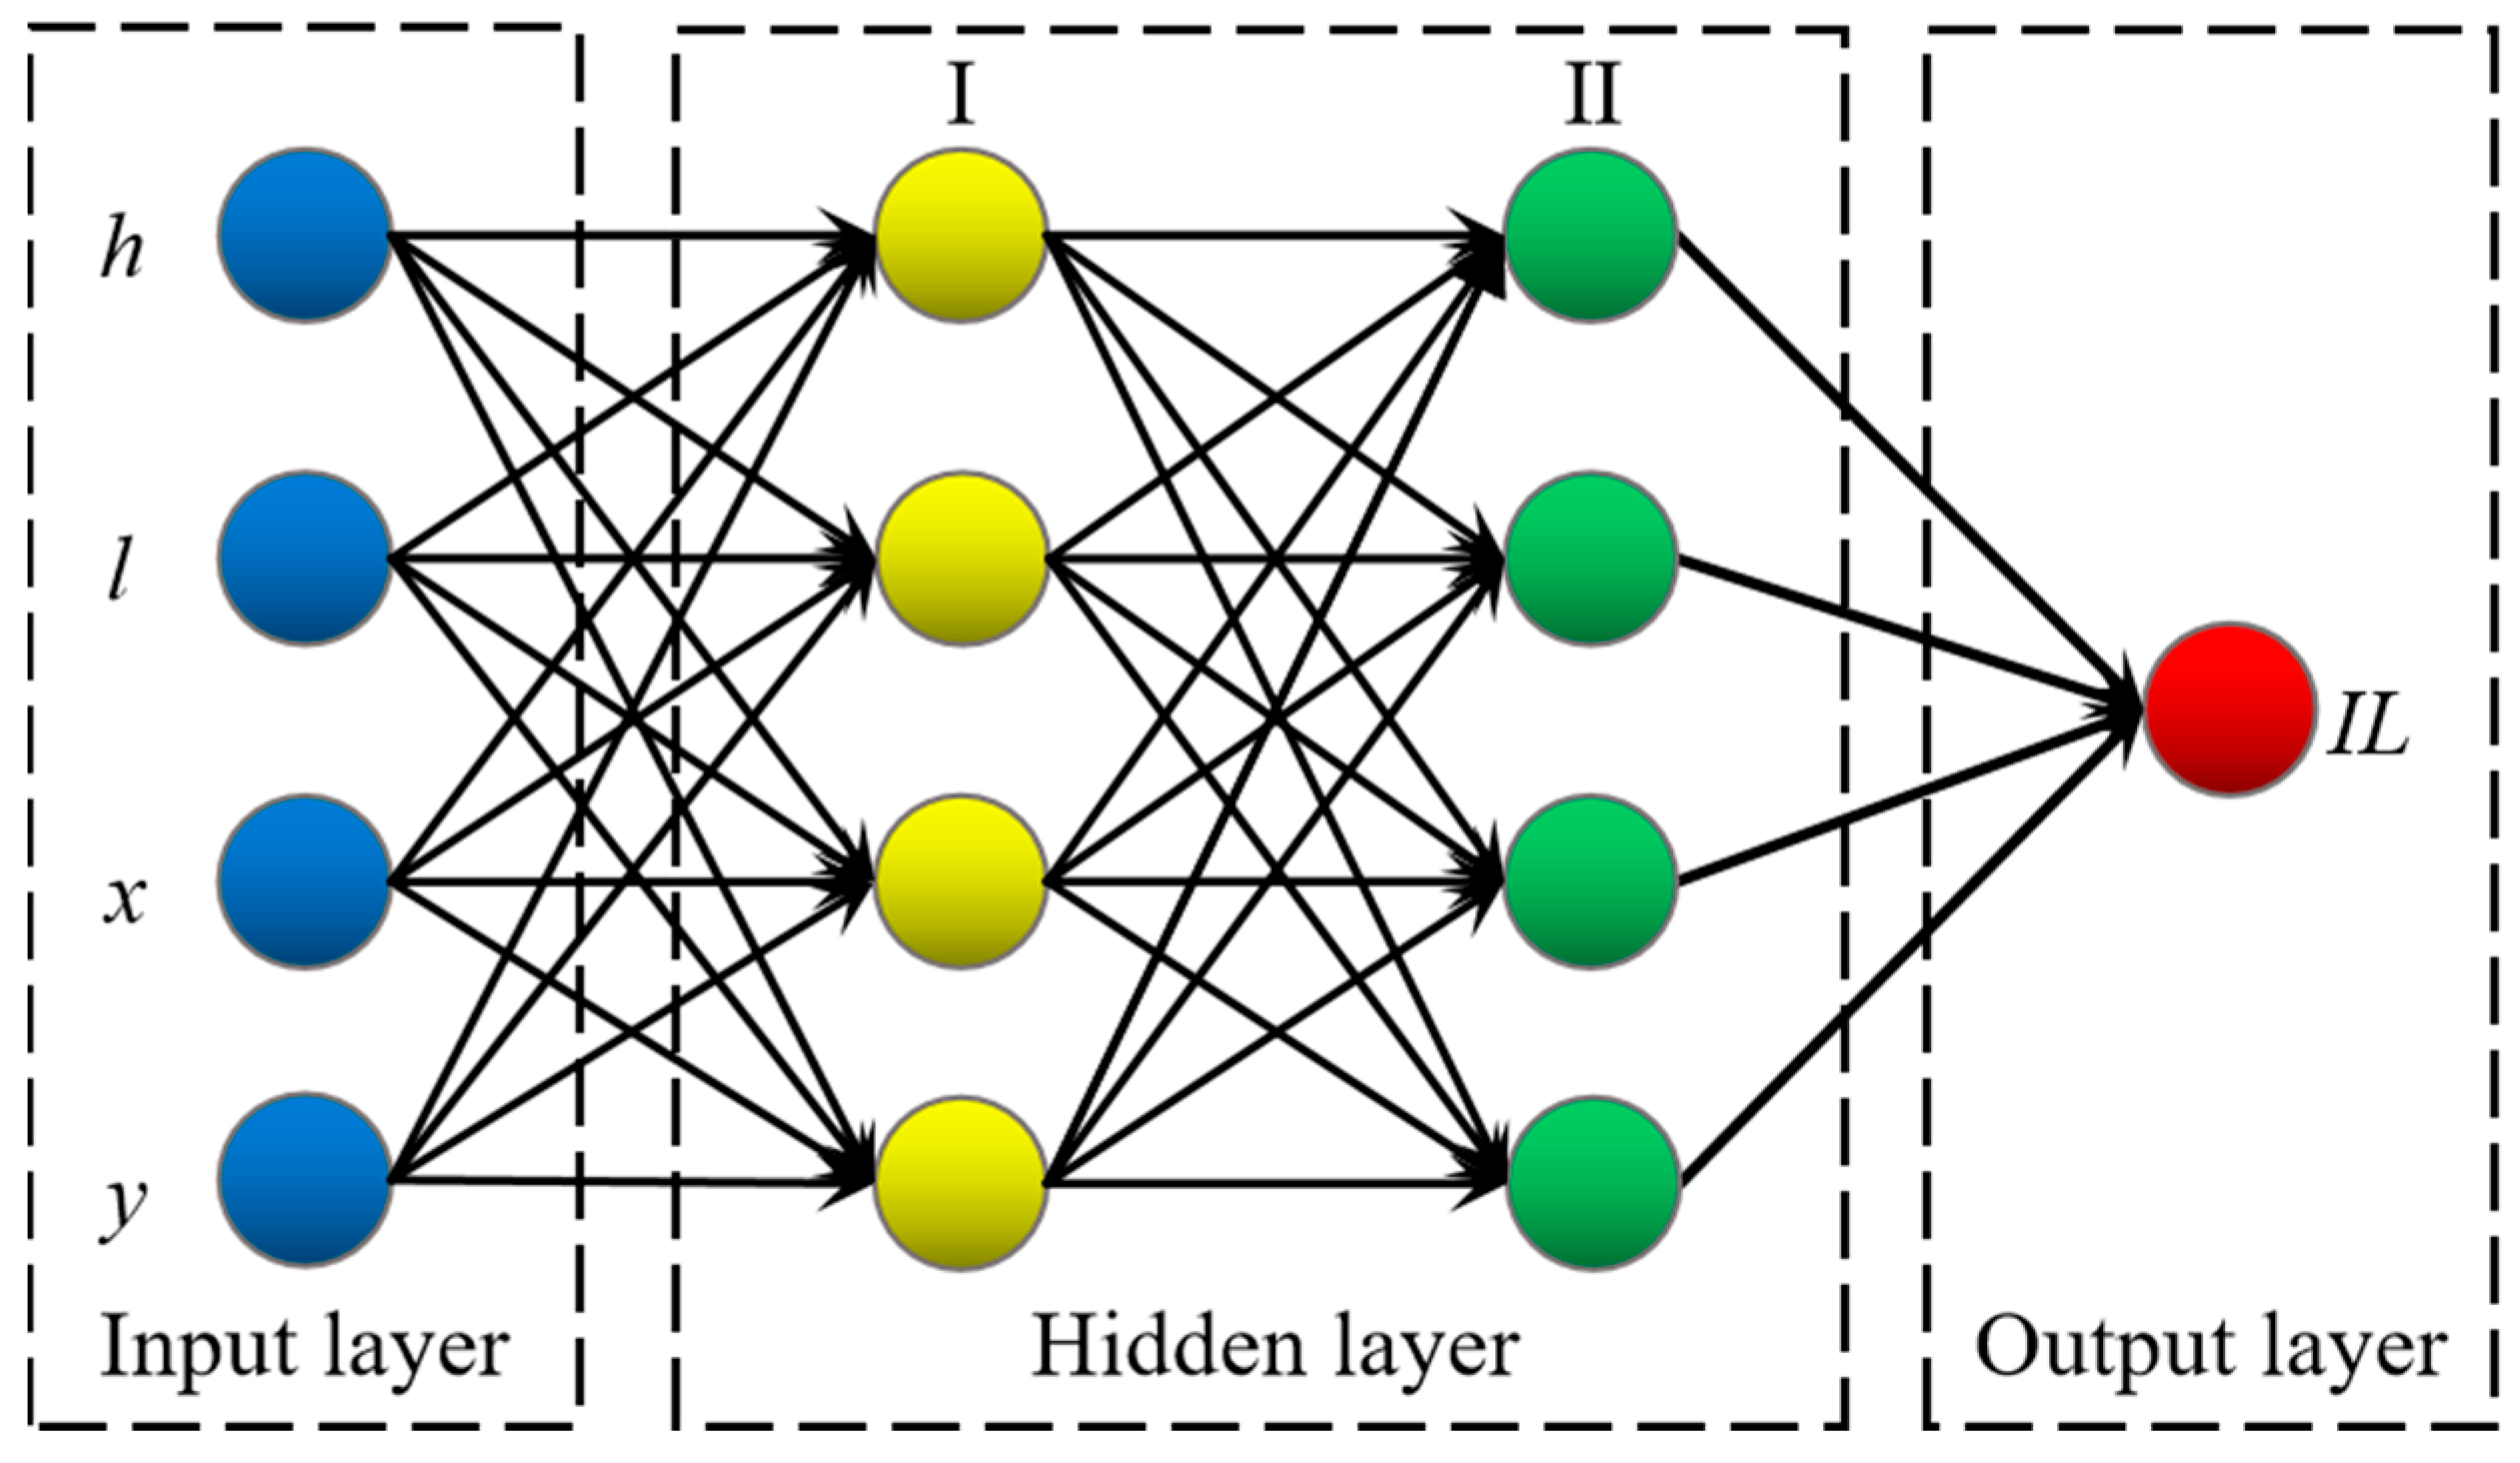
Figure 14, the adopted deep neural network (DNN) structure consists of the following four layers: an input layer, two hidden layers, and an output layer. It was implemented to establish a multivariate nonlinear relationship between four input parameters and one output variable. The following input parameters were included: (1) vertical noise barrier height (h), (2) horizontal distance from track centerline (L), (3) x-coordinate of the evaluated location, and (4) y-coordinate of the evaluated location. The origin of the x and y coordinates is positioned 6.5 m from the track centerline at the upper surface of the bridge deck, with the positive
x-axis direction oriented away from the track centerline and the positive
y-axis direction upward from the bridge deck. The network output corresponds to the insertion loss value at the specified configuration and evaluated location.
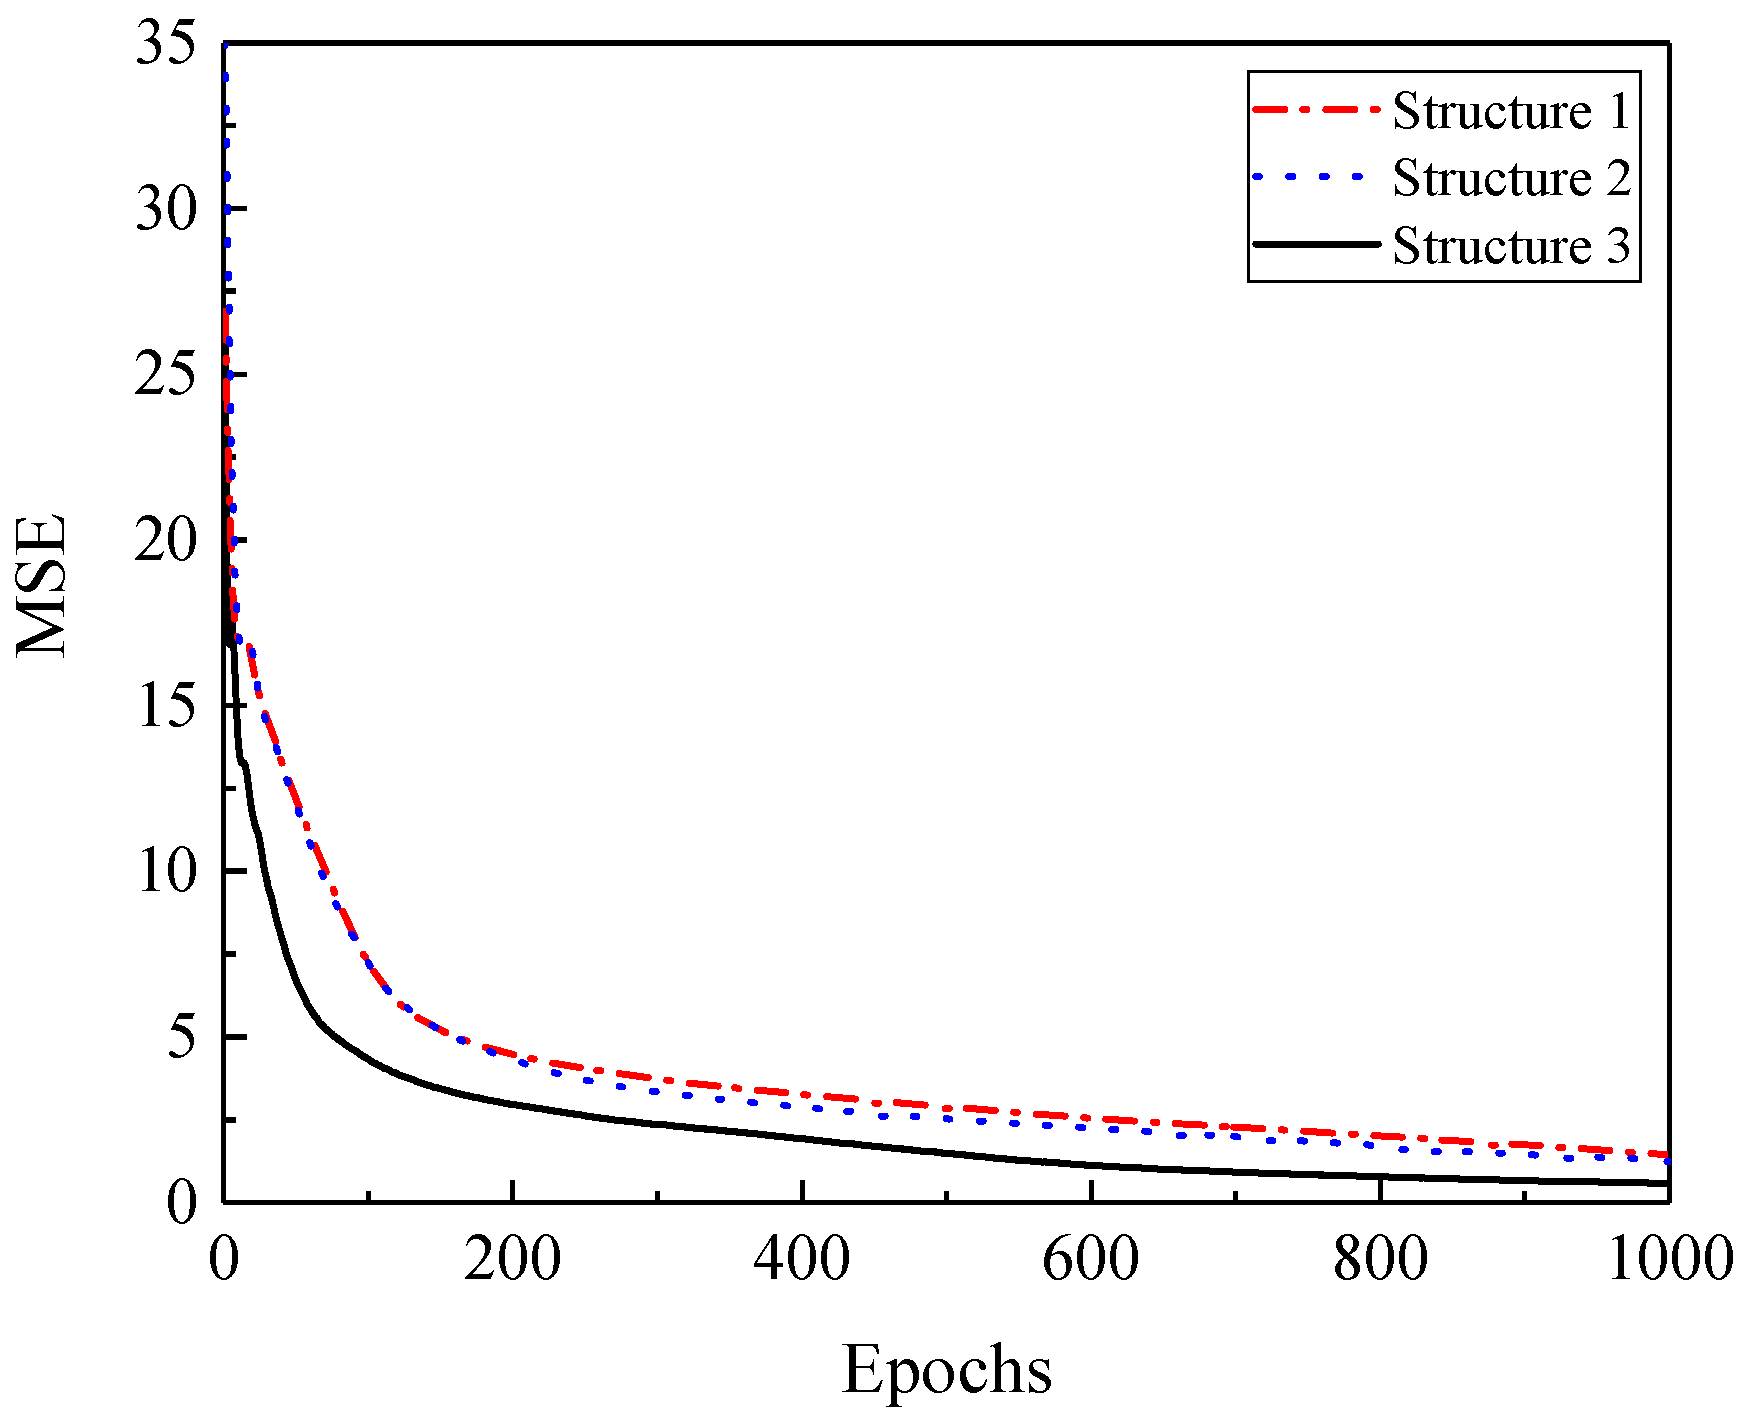
Table 2 presents the comparative analysis of three distinct neural network architectures evaluated in this study. The first architecture (Structure 1) consisted of an input layer (four neurons), followed by two hidden layers (64 and 32 neurons respectively), and an output layer (one neuron). Structure 2 maintained the same input and output dimensions while expanding to two 64-neuron hidden layers. Structure 3 further increased the complexity with two 128-neuron hidden layers. All architectures employed a consistent learning rate of 0.001 during training.
Performance evaluation metrics, including the training set R2 and test set Mean Squared Error (MSE), revealed a clear positive correlation between model complexity and predictive accuracy. Structure 1 achieved moderate performance with an R2 of 0.9133 and test MSE of 0.8339 after 1000 training epochs. Structure 2 showed improved performance, attaining an R2 of 0.9026 and test MSE of 0.9369 with the same training duration. The most complex architecture (Structure 3) demonstrated superior performance, reaching an R2 of 0.9094 after 1000 epochs while achieving the test MSE of 0.8711.
Figure 15 presents the training evolution of the above three DNN architectures, showing the mean squared error as a function of training epochs. The plot spans 0 to 1000 epochs on the horizontal axis and displays MSE values ranging from 0 to 35 on the vertical axis. The training curve reveals the following three distinct phases: an initial rapid descent phase where the MSE decreases sharply, indicating efficient early learning; a subsequent gradual improvement phase where the convergence rate slows; and finally, a stable phase where the MSE plateaus near zero after approximately 800 epochs. The smooth, monotonically decreasing trajectory without any sudden fluctuations suggests stable learning dynamics and absence of overfitting. The overall training behavior confirms the effectiveness of the adopted DNN architecture and learning configuration. Based on the experimental results, Structure 3 was selected as the final model owing to its optimal trade-off between training accuracy and generalization performance, demonstrating consistently low MSE values for both training and test datasets without exhibiting signs of overfitting.
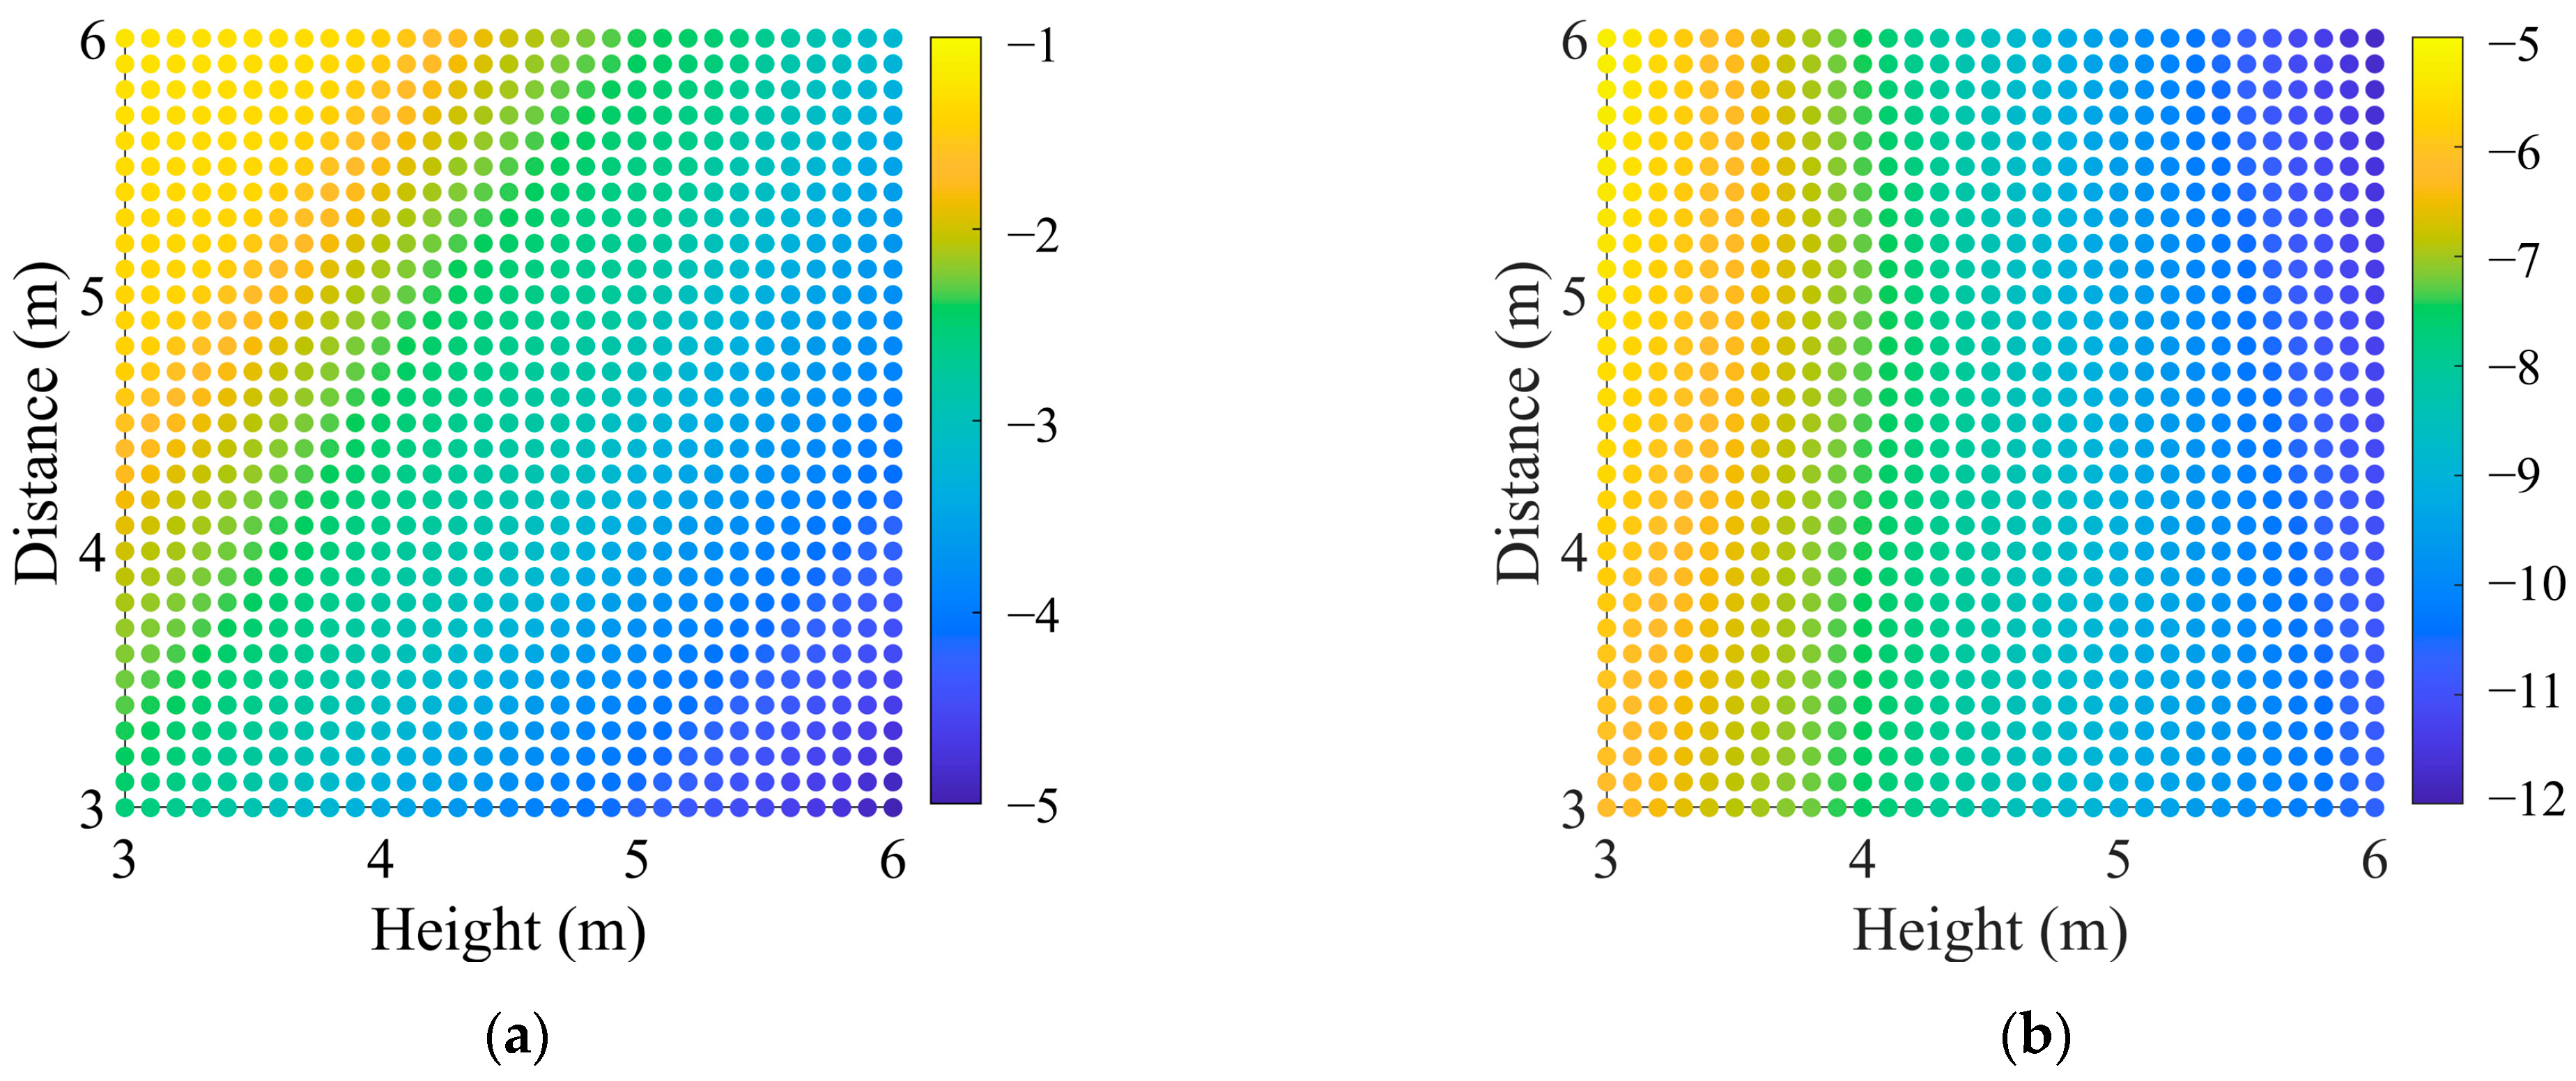
The trained model enables efficient optimization of vertical noise barrier geometric parameters to maximize insertion loss at targeted noise-sensitive locations.
Figure 16 demonstrates this optimization capability through insertion loss variation analysis for two representative receiver positions, which are (15 m, 3 m) in
Figure 16a and (2 m, 2 m) in
Figure 16b. The color maps employ a gradient from yellow (minimum noise reduction) to blue (maximum noise reduction) to visualize insertion loss magnitudes.
For the (15 m, 3 m) position, parametric analysis reveals an optimal configuration with a 6 m barrier height and a 3 m installation distance from the track centerline, achieving a maximum insertion loss of approximately −5 dB. The (2 m, 2 m) location shows different optimal parameters, with a 6 m height and a 6 m distance producing superior performance, with an approximately −12 dB insertion loss. These findings highlight the importance of location-specific parameter optimization for effective noise control.
6. Conclusions
This study presents a comprehensive investigation of noise barrier performance for elevated subway lines through integrated experimental measurements, numerical simulations, and deep learning optimization. The principal findings are summarized below:
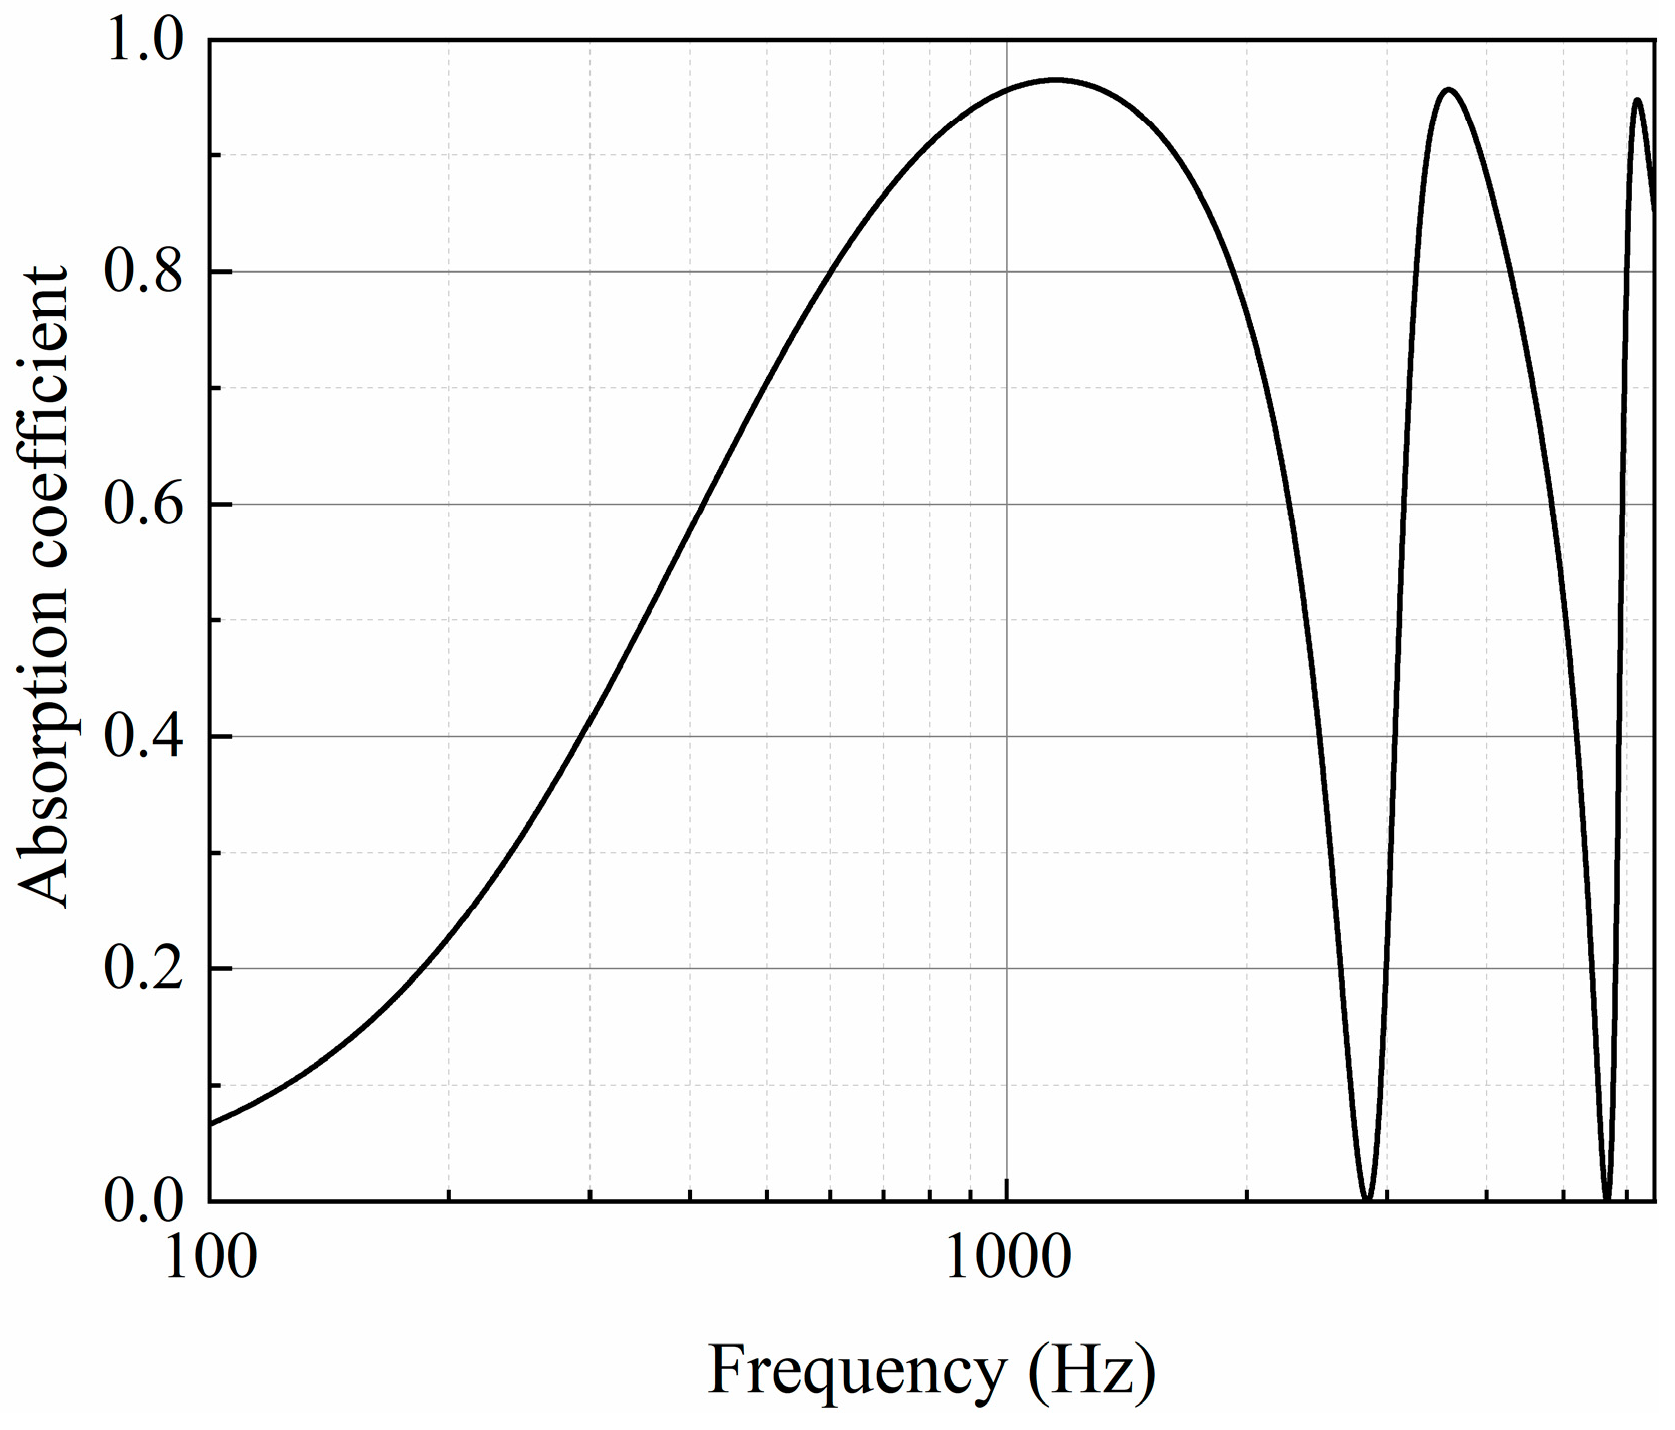
(1) The SEA model simulations quantified significant near-field noise amplification effects, particularly within the 400–2000 Hz frequency range. Fully enclosed barriers demonstrated the most substantial amplification, reaching up to 4.13 dB(A) in critical areas. Implementation of micro-perforated panel absorbers (d = 0.1 mm, t = 2 mm, D = 60 mm) could effectively mitigate these adverse effects, achieving peak sound absorption coefficients (α > 0.8) at 1600 Hz.
(2) A neural network-based surrogate modeling approach with two 128-neuron hidden layers was successfully developed, achieving an R2 of 0.9094 on the training set and test MSE of 0.8711. Parametric optimization revealed that barrier height and installation distance collectively determine noise reduction performance, with optimal configurations achieving up to 12 dB insertion loss at sensitive locations (2 m horizontal and vertical distance from barrier).
(3) For practical applications, fully enclosed sound-absorbing barrier designs are recommended to minimize reflection effects, coupled with surrogate model-assisted geometric optimization.
Future research should expand this framework to incorporate cost analysis and sustainability considerations, enabling comprehensive multi-objective optimization for urban rail noise control systems.


