Abstract
This study investigates the electromagnetic analysis and optimal design of outer rotor type brushless DC (BLDC) motors for fan filter applications. The primary objective is to develop a method that integrates three-dimensional (3D) structural effects with efficient two-dimensional (2D) equivalent analysis. This study proposes a 2D equivalent analysis method that addresses the unique features of outer rotor type BLDC motors, particularly the permanent magnet (PM) overhang structure. This approach transforms the operating point on the B–H curve to facilitate accurate modeling in a 2D framework, overcoming traditional analysis limitations. An analytical method using spatial harmonics is introduced to derive essential electromagnetic quantities, namely flux linkage and back electromotive force (EMF). The method compensates for slot effects using the Carter coefficient, ensuring precise evaluation of circuit parameters and electromagnetic losses. To optimize motor performance, a multi-objective optimization technique is implemented using the Non-dominated Sorting Genetic Algorithm-II (NSGA-II), aiming to maximize both efficiency and power density. The research validates the proposed analytical approach against the finite element analysis method (FEM) results to confirm its accuracy.
1. Introduction
The transition in power source operation methods aimed at reducing greenhouse gas emissions is a key factor driving new developments in industrial sectors. Consequently, industrial components are being electrified. Brushless DC (BLDC) motors have become increasingly prominent among industrial electric machines owing to their benefits over mechanically commutated DC motors, including greater operational reliability and service life, decreased need for maintenance, and enhanced performance consistency [1,2,3,4,5,6,7].
Outer rotor type BLDC motors have a rotor that is positioned outside the stator, providing more space to accommodate magnets than inner rotor type BLDC motors. This allows for the use of ferrite permanent magnets (PMs), which have the advantages of a lower cost and abundant reserves, as opposed to rare-earth PMs, which have significant drawbacks such as supply monopolies and high prices [8].
Outer rotor type BLDC motors are commonly designed with a PM overhang to suppress leakage flux originating from the end-region of the stator coils. In addition, the rotor yoke can be accommodated on the outer surface, allowing for a reduction in the rotor yoke thickness. However, because the motor has an inherently three-dimensional (3D) structure that cannot be fully represented in two dimensions, conventional two-dimensional (2D) analysis, which assumes that the axial lengths of the stator and rotor are identical, fails to provide accurate predictions. Owing to this limitation, 3D analysis is essential; however, it has the drawback of a significantly increased analysis time. Therefore, an equivalent analysis method that can account for the 3D structure within a 2D analysis is required [9,10,11,12,13,14].
The initial design and analysis methods for permanent magnet synchronous motors (PMSMs) primarily include the finite element analysis method (FEM), which utilizes numerical analysis, and the analytical method, which employs the space harmonic method. The FEM performs simulations using specialized software and provides highly accurate results. However, its accuracy and efficiency depend on the specific software used and the experience level of the designer. In contrast, the analytical method analyzes the electromagnetic characteristics of PMSMs based on Maxwell’s equations. This method employs Fourier-series-based magnetization modeling and derives partial differential equations from Maxwell’s equations and the magnetic vector potential. By applying boundary conditions across the different domains of the machine, the resulting solution provides the flux density variation in the air gap. The analytical approach offers relatively high accuracy and significantly faster analysis times compared with the FEM, making it an efficient alternative for electromagnetic analysis [15,16].
By design, outer rotor type machines necessarily exhibit an increased rotor yoke volume and, therefore, a distinctly 3D flux path that cannot be captured by purely 2D approaches. To date, very few studies combine an analytic treatment of this extra yoke thickness with a full characteristic analysis of performance and saturation. Our work fills this gap by introducing a B–H operating-point transformation to compensate for the additional magnetic energy stored in the 3D yoke and validating its accuracy through both 3D FEM comparison and experimental data. This dual analytic–experimental framework is, to our knowledge, novel and essential for faithfully modeling outer rotor type topologies.
For most PMSMs, an optimal design is essential for improving various objective functions, including efficiency, power density, torque ripple, cogging torque, and PM usage. Among these, multi-objective optimization, which involves multiple objective functions, typically selects parameters that exhibit an inverse relationship. The optimal design methods for PMSMs can be broadly categorized into surrogate model-based and probabilistic optimization algorithms. Surrogate model-based optimization constructs an approximation model that reduces the analysis time compared with directly linking the algorithm with the simulation tool. The time required for the design process can be significantly reduced by utilizing an approximation model. However, because surrogate models are approximations of the actual objective function, discrepancies between the model and real motor characteristics are inevitable [17]. Probabilistic optimization algorithms require longer analysis times but possess global optimization capabilities, allowing them to find optimal solutions even for nonlinear characteristics. Because electrical machines inherently exhibit nonlinear behavior, employing global optimization techniques is necessary to achieve a valid and effective optimal design [18,19].
This paper proceeds as follows. First, the 2D equivalent model of the PM overhang structure is formed by adjusting the operating point of the PM on the B–H curve. In addition, to prevent rotor yoke flux saturation in the 2D model, the yoke thickness is increased accordingly. Second, to simplify the analysis model, a slotless assumption is made, and an analytical method utilizing the space harmonic method is employed to derive the rotor flux linkage, back electromotive force (EMF), and stator armature reaction. The slot effect is compensated for using the Carter coefficient. Third, the efficiency and power density, which exhibit an inverse relationship, are selected as the objective functions. The optimization is then performed using a genetic algorithm, which is a probabilistic optimization technique. Finally, the optimized 2D equivalent model is converted into a 3D model with the same performance, followed by prototyping and experimental validation. The experimental prototype was manufactured by Shinsung ENG (Gwacheon-si, Republic of Korea) and is currently utilized in industrial applications in Korea. The comparative 3D finite element analysis was performed using Ansys Electronics Desktop (EM) 2023 R2 (Ansys Inc., Canonsburg, PA, USA). This study confirms the effectiveness of the proposed approach through a comparison between experimental outcomes and the predictions of the optimized model.
2. Two-Dimensional Equivalent Analysis Method Using Operating Point Conversion
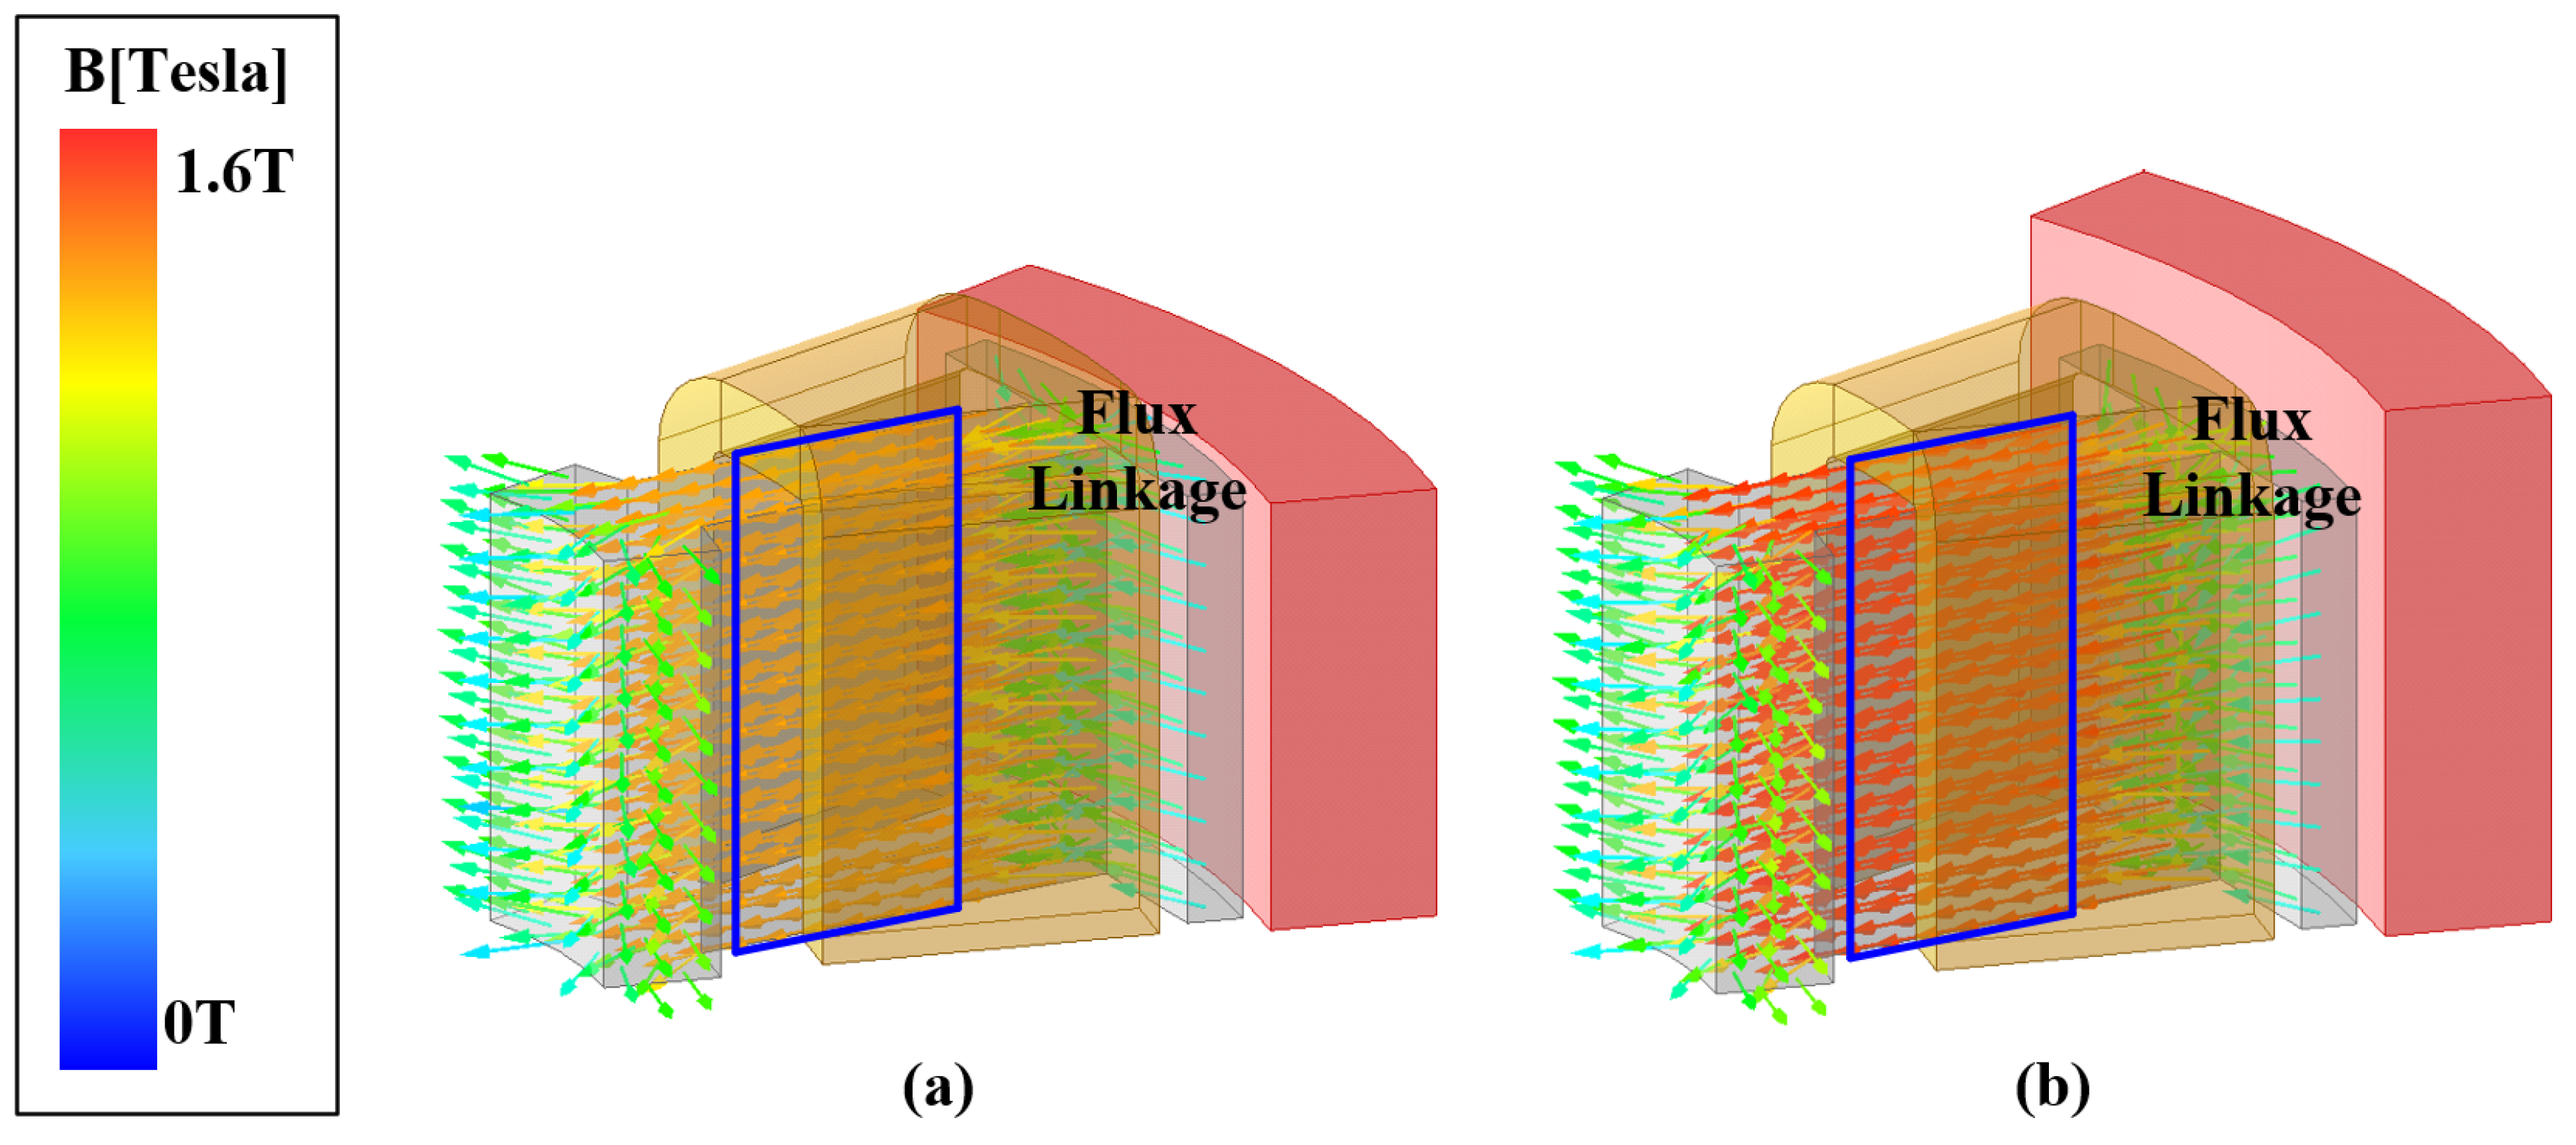
The magnetic flux generated by the PMs in a PMSM is linked to the stator windings and flows into the core. The PM overhang structure plays a role in increasing this flux linkage. With increased flux linkage, flux saturation within the stator teeth intensifies. The flux density is higher in the presence of the overhang structure. This phenomenon is illustrated in Figure 1.

Figure 1.
Stator core flux linkage: (a) general model and (b) model with overhang structure applied.
Therefore, the overhang structure is commonly employed in outer rotor type motors because it enables accurate analysis through 3D simulations. However, 3D FEM requires a long analysis time. To overcome this limitation, this study proposes a 2D equivalent analysis method that transforms the operating point of the PM on the B–H curve. Figure 2 illustrates the process of the proposed analysis method based on this operating point conversion.
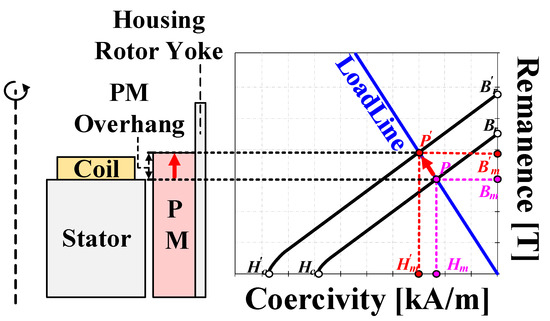
Figure 2.
Operating point conversion process on the B–H Curve.
The proposed method considers the PM overhang structure in 2D analysis by increasing the energy product of the PM material in the 2D-equivalent model by an amount that corresponds to the overhang structure. This ensures that the magnetic field energy in the proposed 2D analysis is equivalent to that in the 3D analysis. This process is represented as follows:
Bm and Hm represent the magnetic flux density and coercive force at the operating point of the permanent magnet, respectively, and V represents the volume of the permanent magnet. The left side is the three-dimensional analysis model, and the right side is the magnetic field energy of the proposed analysis model.
The material values of the proposed analysis model are used to derive the material properties of the 3D analysis model. For this purpose, the load line gradient must be determined, which is expressed as:
where PC, μ0, fLKG, lPM, g′, Ag, and Am represent the load line gradient, permeability of vacuum, leakage factor, PM thickness, effective air gap length, flux-conducting area of the air gap, and cross-sectional area of the PM, respectively. In addition, the flux density at the operating point of the PM is derived as follows:
where μrec and Br represent the relative permeability and remanence, respectively. Consequently, the flux density and coercive force at the operating point of the PM of the proposed analysis model are derived as follows:
The remanence can be obtained by an inverse calculation using Equation (3). The PM data derived using the proposed analysis method are listed in Table 1.

Table 1.
PM material data of the 3D analysis model and the proposed analysis model.
Figure 3a depicts the flux density saturation of the integrated rotor yoke during the no-load analysis of the 3D model. The flux density saturation is high in the radial direction of the core along the z-axis, whereas the axial direction of the core remains mostly unsaturated. This is because the actual rotor flux distribution is more concentrated in the radial direction than in the axial direction, as shown in Figure 3b.
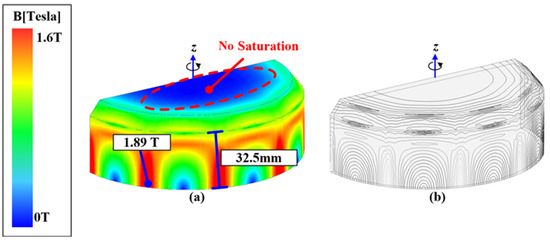
Figure 3.
Integrated rotor yoke: (a) flux density saturation and (b) flux line distribution.
Therefore, the rotor yoke thickness of the proposed analysis model is determined based on the axial extent of the core, where the flux density saturation is high. Using this method, when the integrated rotor is equivalently modeled in a 2D analysis, the flux density saturation closely matches that of the 3D analysis model, as shown in Figure 4. In contrast, the conventional 2D model, which does not consider the increased rotor thickness, exhibits a higher level of rotor flux saturation compared to the 3D model. Furthermore, the effectiveness of the equivalent modeling technique is verified by comparing the rotor thickness and flux density shown in Table 2.
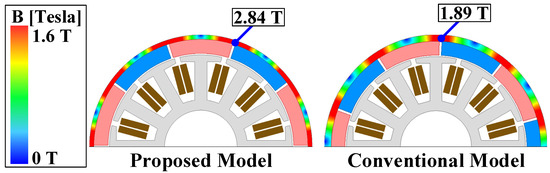
Figure 4.
Flux density saturation of the proposed and conventional models.
Table 2.
Three-dimensional model and rotor specifications of the proposed model.
3. Electromagnetic Characteristic Analysis of a BLDC Motor
3.1. Electromagnetic Characteristic Analysis of the Motor Using Analytical Methods
3.1.1. No-Load Flux Linkage and Back EMF
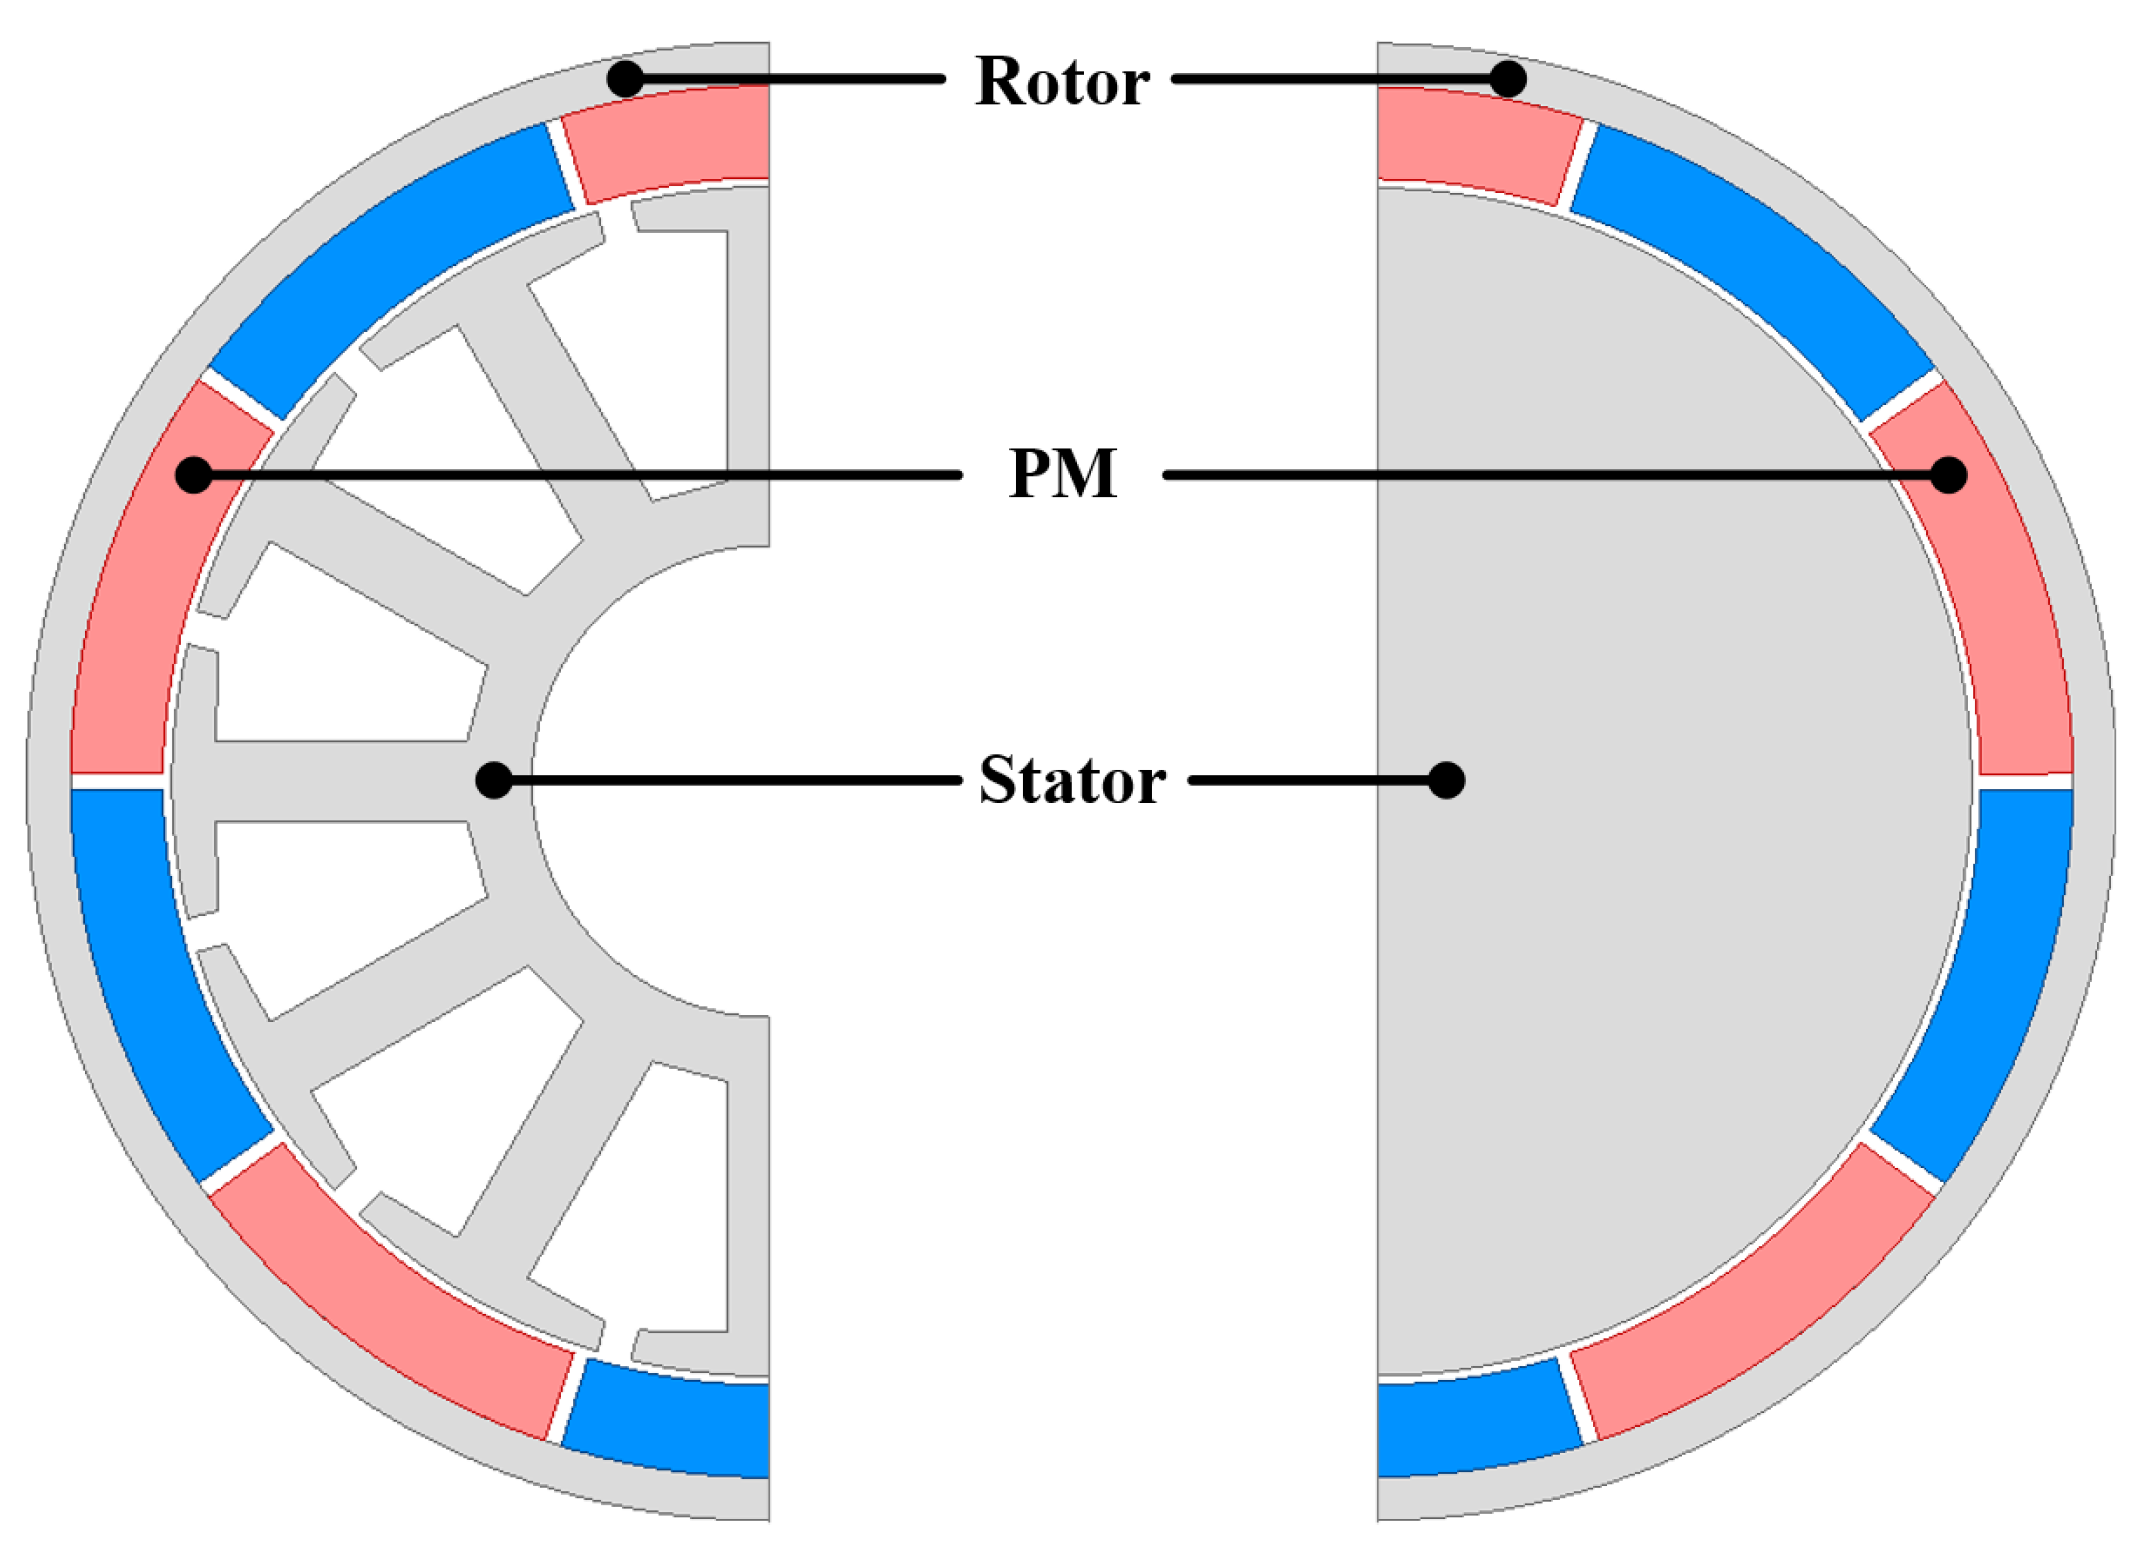
Figure 5 shows the shape of the BLDC motor for fan filter applications, along with a simplified analysis model for the convenience of the analytical method.
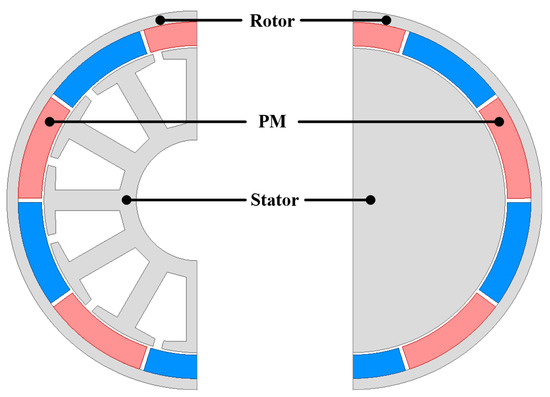
Figure 5.
A simplified analysis model of an outer rotor type BLDC motor.
The following assumptions are necessary to evaluate the electromagnetic performance of the simplified model using the analytical method:
- The magnetic effects caused by the stator slots are corrected using the Carter factor.
- The stator and rotor cores are considered to have infinite magnetic permeability.
- The permeability of the PM is considered equal to the permeability of air.
- The stator current is modeled using a surface current density function.
Equation (6) represents the magnetization modeling of a PM, which is represented using a Fourier series for both the radial and tangential directions. Here, q corresponds to np, where n is the harmonic order and p represents the pole-pair number. Equations (7) and (8) represent the governing equations in the air gap (I) and PM (II) regions, respectively, as shown in Equation (7):
Region I has no magnetization components; therefore, it can be expressed by the Laplace equation, whereas Region II contains magnetization components and is described by the Poisson equation. Solving the equations for each region leads to the derivation of the magnetic vector potential, as shown in Equations (9) and (10). Using the magnetic flux density expression in Equation (11), this formulation is further refined into Equations (12)–(15).
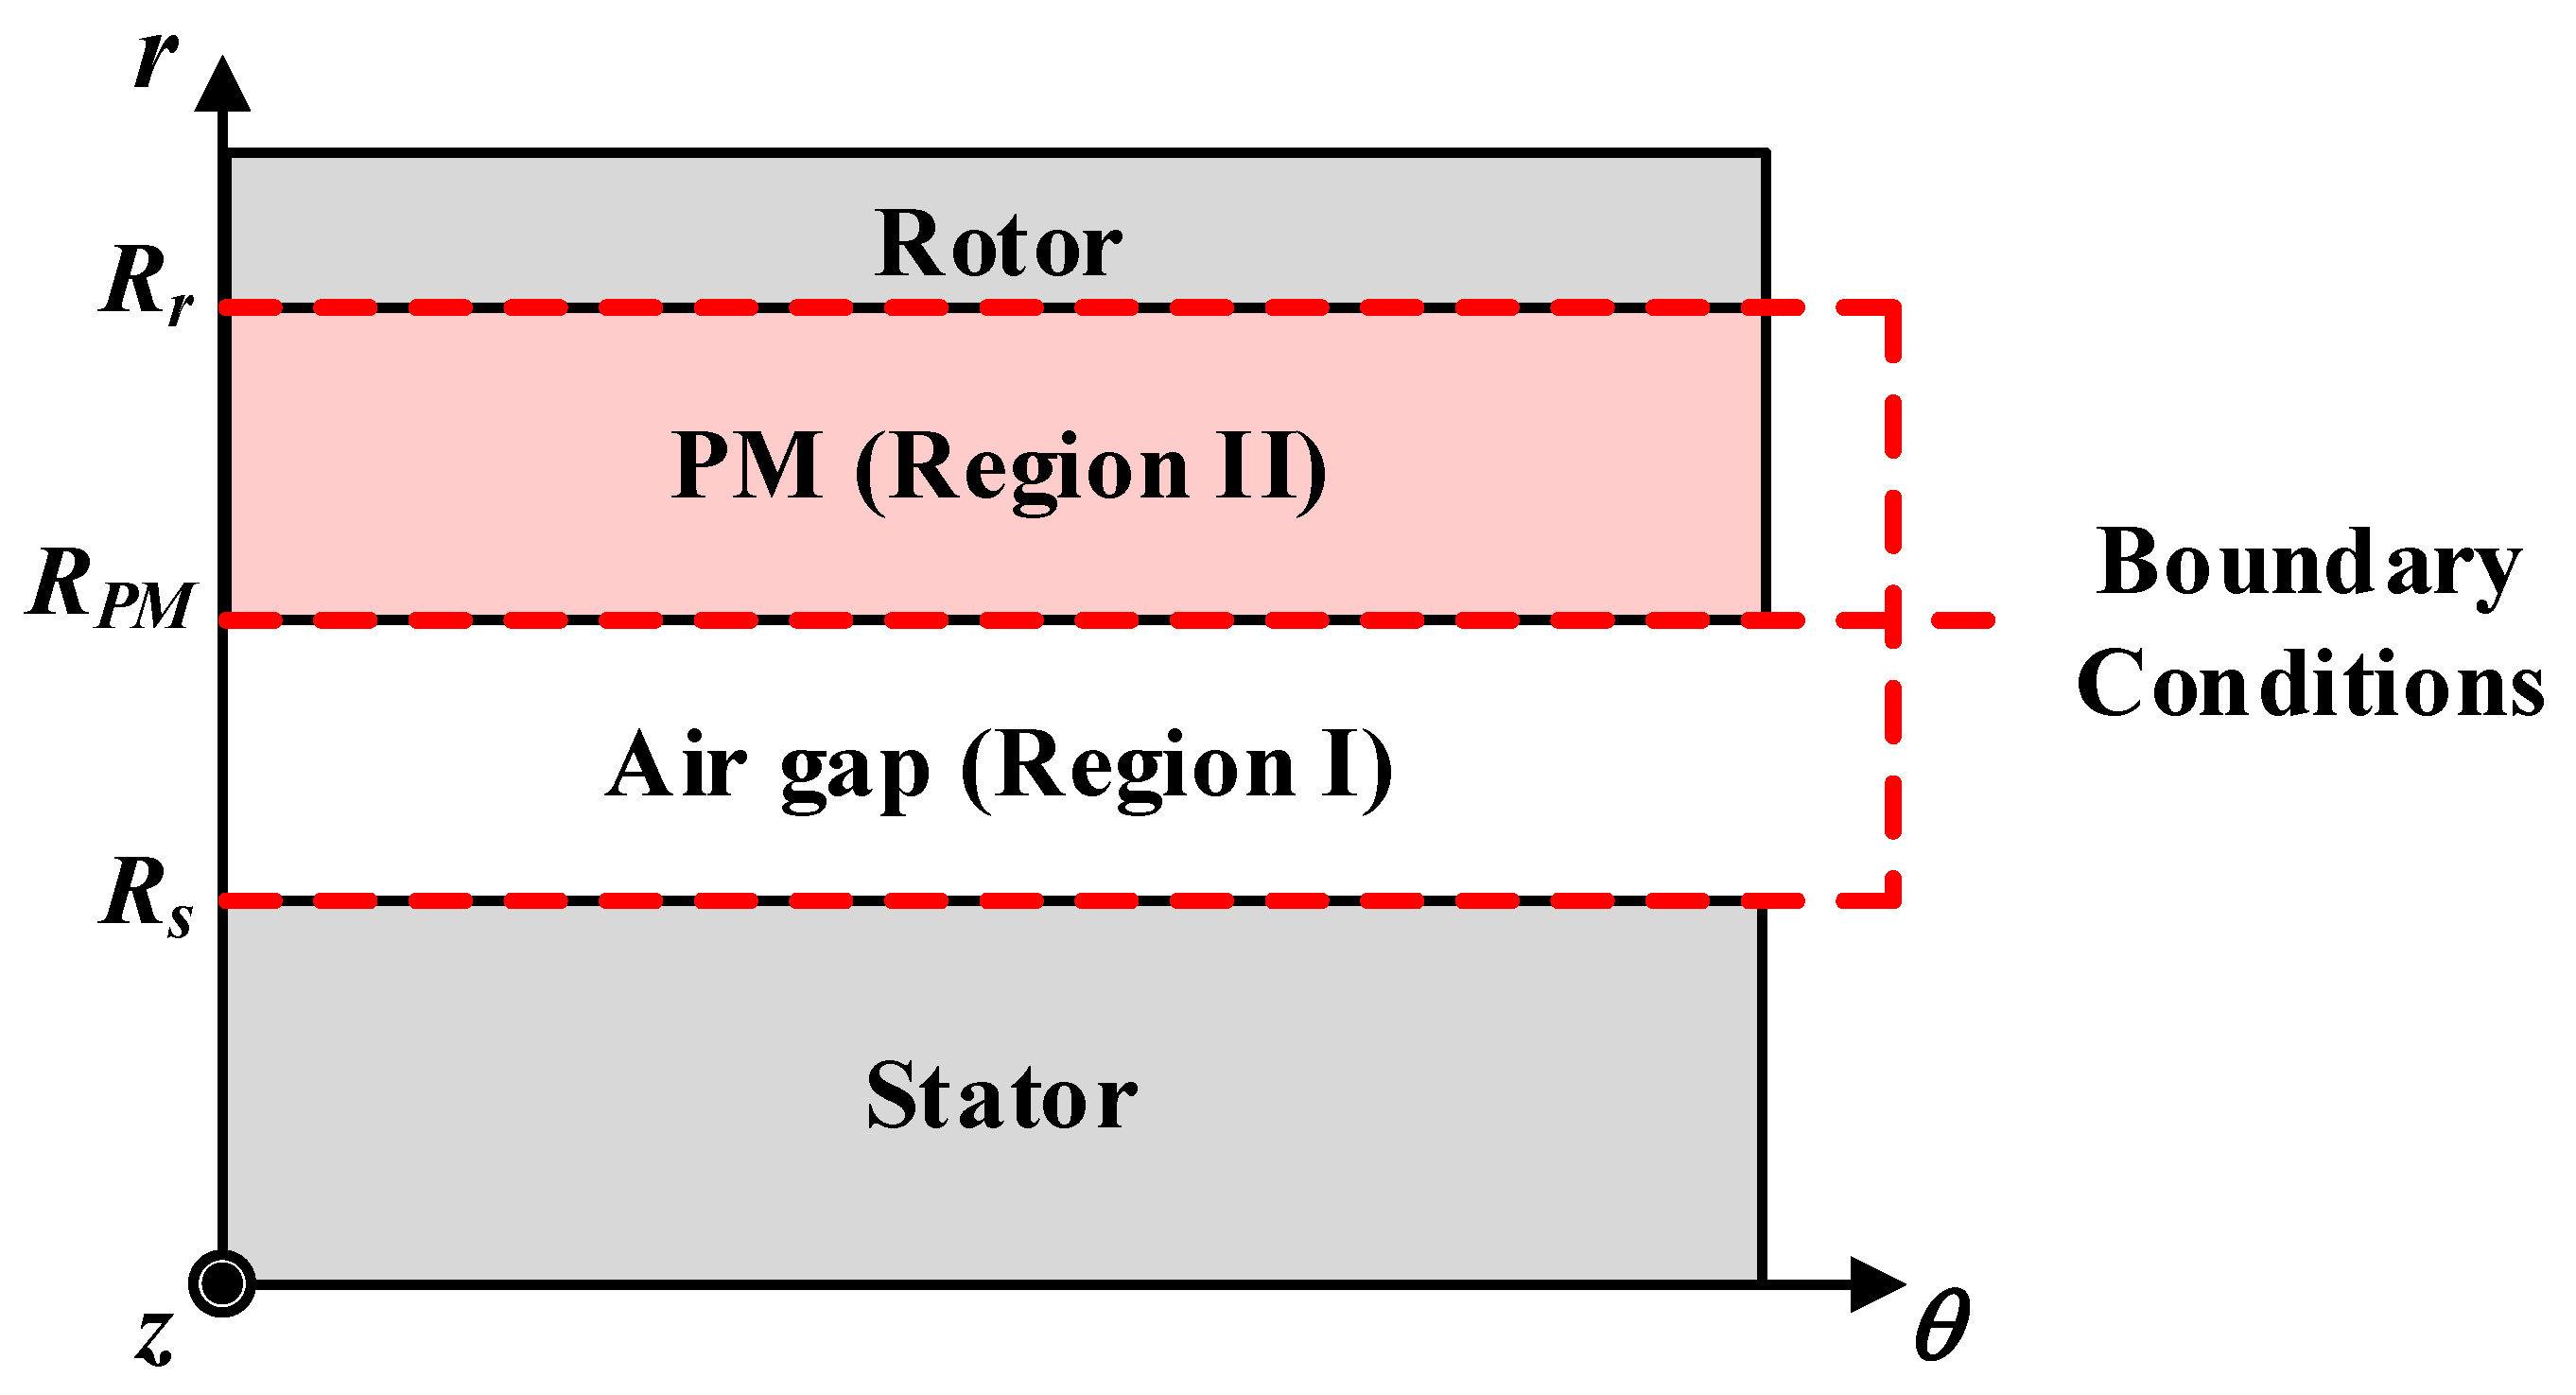
The boundary conditions between each region in Figure 6 can be identified from Equations (16)–(18). The unknown coefficients can be determined by substituting the magnetic flux density equations for each region.
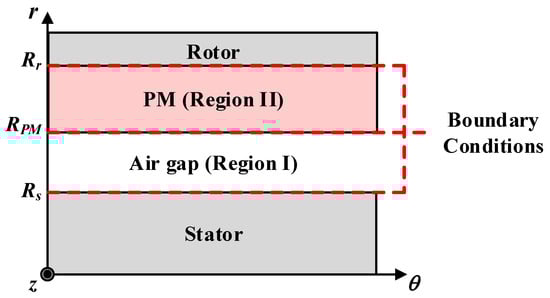
Figure 6.
Shape equivalence and boundary conditions for analytical methods.
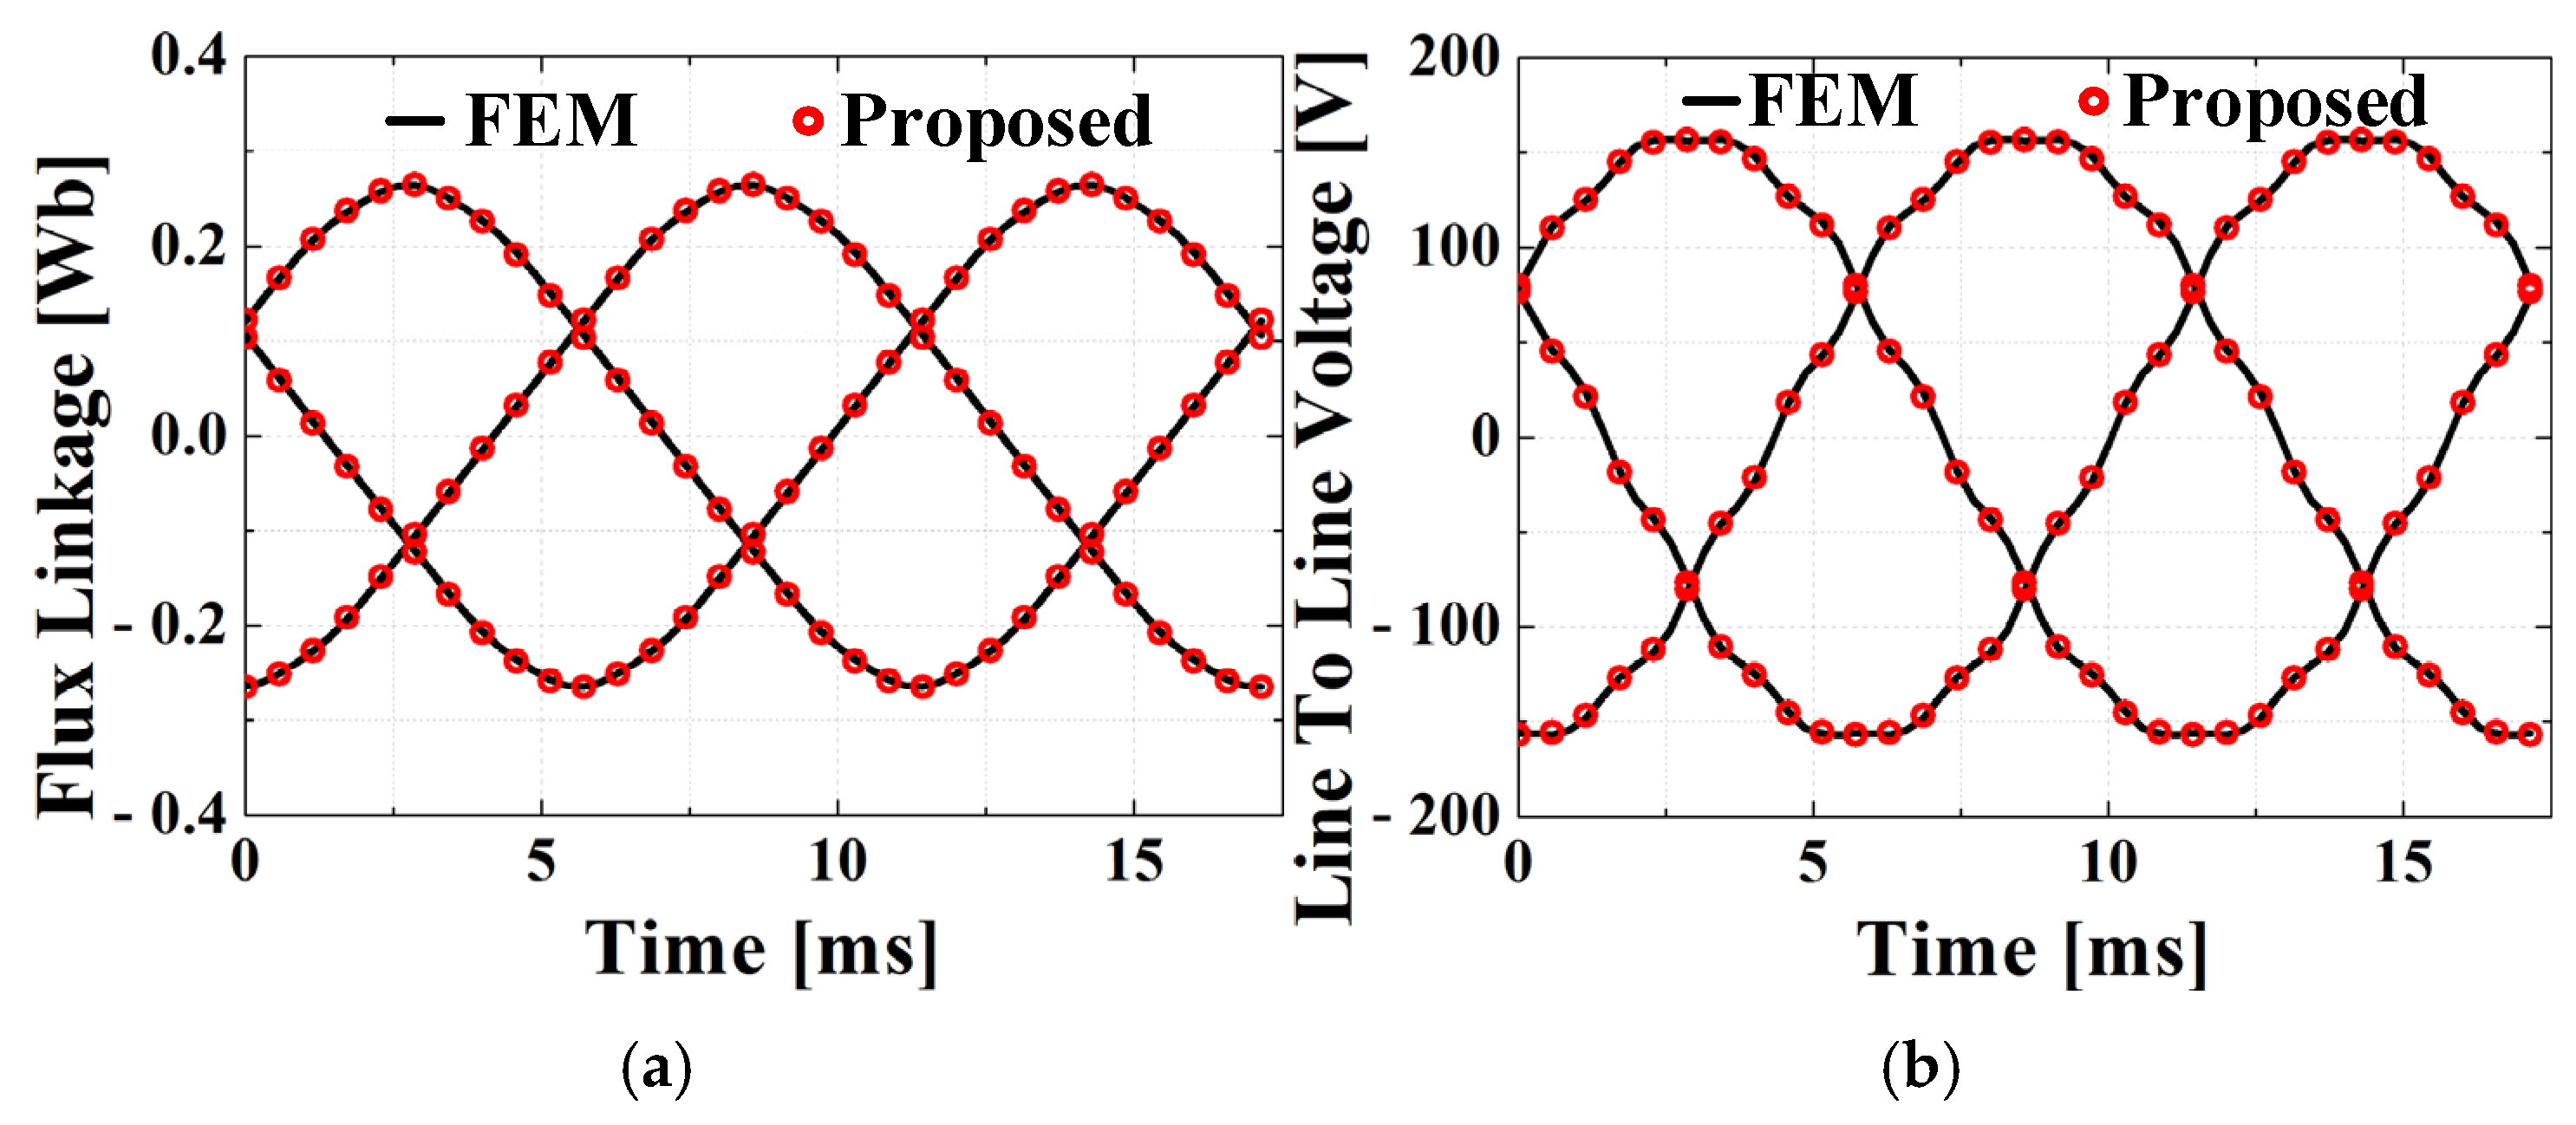
The flux linkage is calculated through the integration of the flux density across the air gap over one coil pitch. The EMF generated by the PM can be expressed based on Faraday’s law. As shown in Figure 7, the derived results closely match the FEM and experimental results, thereby validating the proposed 2D equivalent and analytical methods.
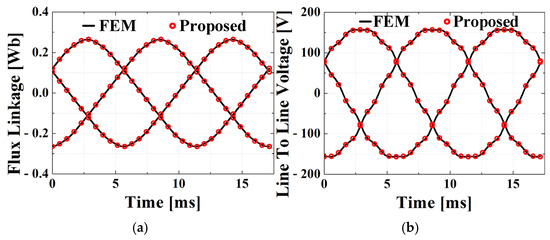
Figure 7.
By PMs: (a) flux linkage and (b) line-to-line EMF.
3.1.2. Stator Armature Reaction
The magnetic field characteristics caused by the armature reaction of the stator winding are essential for predicting the inductance, which is a key parameter in the equivalent circuit of an electric motor. To derive these characteristics analytically, the magnetization components of the PM are assumed to be absent. Equation (19) expresses the current density distribution on the stator surface using a Fourier series. As with the expressions obtained for the PM case, the magnetic induction due to the armature effect is derived based on the magnetic vector potential, as presented in Equations (20) and (21).
The boundary conditions between the regions can be identified from Equations (22) and (23). The unknown coefficients can be determined by substituting the magnetic flux density equations for each region.
3.1.3. Carter Coefficient
The electric motor has slots that result in leakage flux. As the equivalent air gap increases, the alteration in the magnetic flux distribution across the gap leads to variations in electromagnetic characteristics such as the back EMF. The slot effect can be considered by applying the Carter coefficient to the magnetic flux in the air gap, as presented in Equations (24)–(26).
In the above equations, Bso, τ, g, and geff represent the slot opening, slot pitch angle, and the nominal and effective air gap lengths, respectively. The equivalent air gap length is corrected by applying the Carter factor to compensate for the influence of stator slotting.
3.2. Circuit Constant
The flux linkage for an individual coil is calculated by integrating the flux density across the air gap over one coil pitch. The analysis model consists of a 10-pole, 12-slot concentrated winding with a coil pitch of 1. The air gap flux density and flux linkage are expressed with respect to the rotor angle in the following equations.
Here, Nc represents the number of turns in one phase, Rs represents the stator outer diameter, Lstk represents the axial length, and Bn represents the magnetic flux density.
The back EMF is obtained by differentiating the flux linkage of the winding with respect to time and is expressed as follows:
The method for calculating the conductor length is shown in Figure 8, and the resistance per phase of the winding is determined using the following equations:

Figure 8.
Winding length calculation method.
lendturn indicates that the end turns at both ends of the stator are assumed to be circles, where Nph represents the equivalent number of slots, Nturn is the number of turns, ρc denotes the resistivity, Ac represents the area of one conductor’s cross section, Nsn is the number of strands per conductor, Nparallel is the number of parallel circuits, and la is the total length of the equivalent coil.
The inductance, which represents the flux linkage per unit current, can be determined using the armature reaction field. It consists of self-inductance and mutual inductance and can be expressed by the following equation:
3.3. Electromagnetic Loss
3.3.1. Core Loss
The core loss constitutes a significant portion of the electromagnetic losses in electric motors and must be carefully considered. The core loss consists of the hysteresis loss, which arises from variations in magnetic field intensity and flux reversal within the steel; the classical eddy current loss, resulting from the alternating magnetic flux and induced voltage in the steel sheets; and the abnormal eddy loss, which is attributed to the magnetic domain thickness and externally applied mechanical stress on the electrical steel sheets. The core loss can be estimated using the Steinmetz equation, derived from the experimentally obtained coefficients for each type of core loss.
where Kh, Kc, and Ke correspond to the hysteresis loss, classical eddy current loss, and excess loss coefficients, respectively, which are derived from the experimental data provided by the silicon steel manufacturer. f and Bm denote the frequency of the magnetic flux density and the m-th harmonic, respectively. In the motor, the stator core is formed by stacking thin sheets of steel; thus, the eddy current losses are minimal, and the hysteresis loss constitutes the dominant portion of the core loss. The total core loss in the stator core can be derived by calculating the core loss in a single tooth and yoke and then multiplying it by the number of slots. The core loss in the tooth is derived by evaluating the integral of the air gap flux density over the angular section occupied by the tooth and then multiplying it by the lamination length to obtain the flux crossing the tooth. An FEM-based approach is required to derive the flux crossing the yoke analytically.
The flux crossing the teeth and yoke has a consistent ratio depending on the pole slot combination of the motor. In this study, this ratio (TY-ratio) is determined based on the ratio of peak magnetic flux magnitudes through the teeth and yoke. The model used in this study, which has 10 poles and 12 slots, shows that the flux density in the teeth is higher than that in the yoke, as shown in Figure 9.

Figure 9.
Initial model: (a) flux diagram in the stator core and (b) comparison of the results of deriving flux linkage using analytical method and FEM.
In this model, the flux crossing the stator yoke is obtained by multiplying the flux crossing the stator tooth by the TY ratio using an analytical method. The flux crossing the stator tooth and yoke, depending on the rotor position, can be derived using the following equations:
where Rs and Tw represent the stator radius and tooth thickness, respectively, while θt is the angle subtended by a single stator tooth. The total core loss in the stator core can be calculated based on the derived flux crossing the teeth and yoke. As shown in Table 3, the method for deriving the core loss in this section is valid.
Table 3.
Core loss analysis results.
3.3.2. Copper Loss
When a current is applied to the stator winding of a PM motor, heat is generated owing to the resistance, which is referred to as copper loss. The copper loss can be broadly classified into AC and DC copper losses. AC copper loss occurs because of the skin effect. As the frequency of the current increases, the current in the center of the winding is offset, and the current density on the surface of the winding increases. This results in an increase in the effective resistance. However, because the model in this study does not operate at high rotational speed and the strand conductor diameter is small, this effect is not considered. The DC copper loss is determined using the RMS value of the current flowing through the winding and the phase resistance of the winding, as shown below. The analytical results are presented in Table 4.
where Irms denotes the effective value of the phase current, and Rph represents the resistance of a single phase winding
Table 4.
Copper loss analysis results.
4. Optimal Design Using Multi-Objective Genetic Algorithm
4.1. Initial Design Specifications of the Outer Rotor BLDC Motor
The torque of the motor consists of magnetic and reluctance torques. In the case of an SPMSM without saliency, only magnetic torque is utilized. The magnetic torque is defined as the product of magnetic flux loading and electric current loading, where the magnetic flux loading is affected by the characteristics of the PMs. The corresponding design variables of the rotor and PMs are shown in Figure 10a. In this case, Tr and Tm represent the thicknesses of the rotor yoke and PM, respectively, whereas θτ and θem indicate the pole pitch and pole arc ratio, respectively. Rro denotes the outer radius of the rotor. Once the specific magnetic loading is determined, the specific electric loading must be designed. The maximum phase current required to satisfy the required torque and number of turns in the stator winding are derived using the parameters influenced by the selected specific magnetic loading, as shown in Equations (38) and (39). In these equations, Emax and Φmax represent the back electromotive force and flux linkage under no-load conditions, respectively, while we denotes the electrical angular velocity. Imax refers to the maximum phase current, and Treq represents the required torque. The maximum values of the back EMF and applied power are expressed as follows:
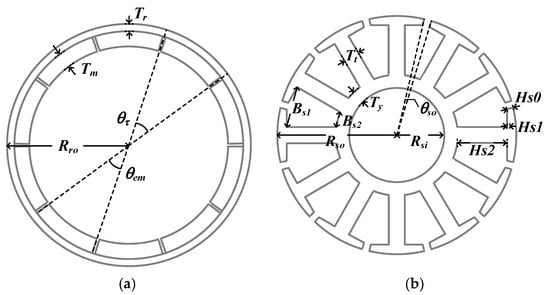
Figure 10.
Outer rotor type motor design: (a) rotor and (b) stator.
The slot area is determined by calculating the stator tooth and yoke thickness based on the flux density saturation limit of the teeth. The corresponding design variables of the stator are presented in Figure 10b, where Tt and Ty represent the thicknesses of the stator tooth and yoke, respectively. Hs0, Hs1, and Hs2 denote the lengths of shoe 1, shoe 2, and the tooth, respectively. Bs1, Bs2, and θso indicate the upper and lower widths of the slot and slot opening angle, respectively. In addition, Rsi and Rso refer to the inner and outer radii of the stator, respectively.
4.2. Optimal Design Process of Outer Rotor Type BLDC Motor
In the input stage, the outer diameter of the motor, stator flux density saturation, current density, fill factor, and rated power are considered constraints. The material of each structure, pole slot combination, air gap length, and coil pitch are treated as fixed variables. These selected constraints and fixed variables are presented as initial conditions.
In this optimization process, a population consisting of random combinations of design variables within the specified rotor shape variable range of the Non-dominated Sorting Genetic Algorithm-II (NSGA-II) is generated. Subsequently, the performance of each design variable combination is evaluated using a simulation model, and the objective function values are calculated. In this study, the power density and efficiency are used as objective functions. Individuals with better performance according to the evaluation function are chosen, and next-generation populations are created via genetic operations such as crossover and mutation. The algorithm proceeds through a fixed number of evolutionary cycles, progressively identifying better solutions in each cycle. Ultimately, a Pareto front, which is a set of Pareto optimal solutions showing various trade-off relationships, is derived.
In the modeling stage, the stator design process is performed according to the rotor specifications proposed by the NSGA-II. The performance of the designed motor model is evaluated, and the results are fed back into the NSGA-II. Assessment is conducted using the fitness, which is determined by the values of the objective functions. If the requirements are not met, a penalty is applied to the fitness, prompting the NSGA-II to recognize the model as unsuitable.
In this study, the multi-objective optimization was performed using the Non-dominated Sorting Genetic Algorithm II (NSGA-II). The population size for each generation was set to 100, and the optimization process was carried out for 20 generations, which served as the stopping criterion. The crossover rate was fixed at 0.9, while the mutation rate was set to 0.01. These parameter values were selected based on commonly adopted practices in multi-objective optimization studies and were found to provide a good balance between convergence speed and solution diversity in preliminary tests. All optimization procedures were implemented using MATLAB R2023b, and the same random seed was used for reproducibility.
In the optimization stage, the optimal model is selected from the Pareto front derived in the previous steps. The Pareto front represents the set of all optimal solutions, and the optimal point is selected based on the priority and importance of the design objectives [20].
In our approach, we first define all design constraints (outer diameter, stator flux-density saturation limit, current density limit, slot fill factor, rated power) and fixed variables (material selections, pole slot combination, air gap length, coil pitch). NSGA-II then generates an initial population by randomly sampling design variables—rotor yoke thickness, magnet overhang, pole–arc ratio, axial length, etc.—within their allowable ranges. Each candidate is converted to the 2D equivalent model (Section 2) and analyzed (Section 3) to compute its power density and efficiency and to check constraint compliance. After evaluation, non-dominated sorting assigns Pareto fronts, and crowding-distance operations preserve diversity. Selected individuals undergo crossover and mutation to form the next generation. This loop continues until a preset number of generations is reached or no further improvement occurs. Finally, the converged Pareto front is presented, and the optimal design is chosen based on the relative importance of efficiency versus power density. The aforementioned optimization process is shown in Figure 11.
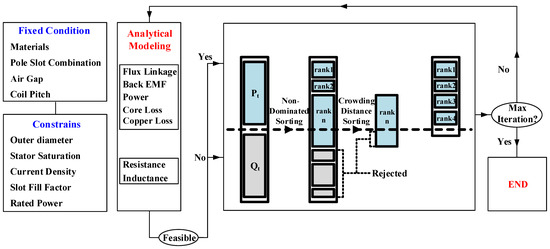
Figure 11.
Optimal design flow chart of outer rotor type BLDC motor.
4.3. Optimized Design Strategy for Outer Rotor Type BLDC Motors
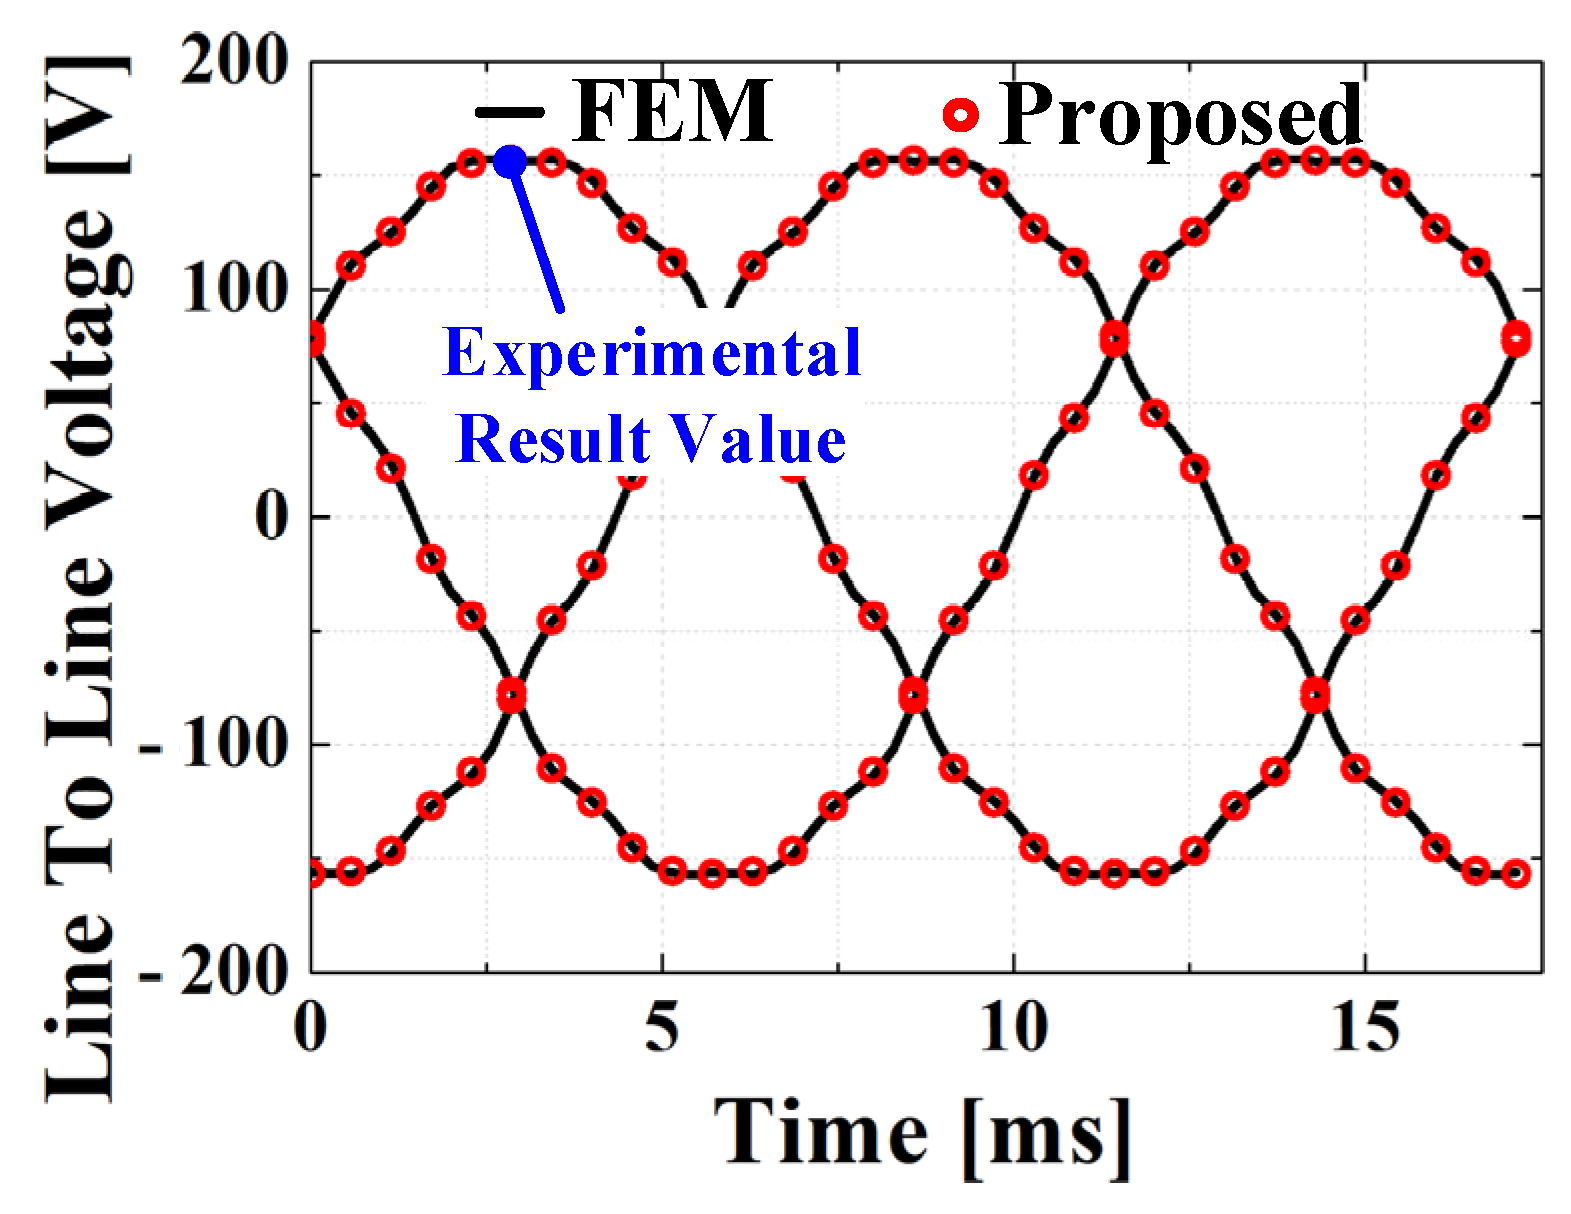
Figure 12 shows the manufactured model of the outer rotor type BLDC motor and configuration of the back EMF experimental setup. The experimental setup shown in Figure 12b consists of the manufactured outer rotor BLDC motor, a programmable DC power supply, and an inverter drive. Back EMF was measured under no-load conditions using an oscilloscope across two phases while the rotor was driven by an outer rotor type motor at a rated speed. The motor’s mechanical speed was maintained at 1500 rpm and monitored using an optical encoder. Figure 13 compares the electromagnetic analysis results of the 2D equivalent analysis method and space harmonic method, proposed in this study through operating point transformation with the FEM analysis results and experimental data. In comparison to the experimental data, both the FEM and analytical method yield very similar results, suggesting the validity of the proposed approach.
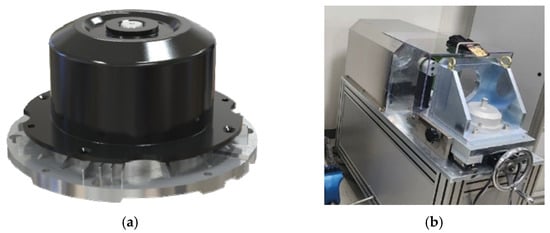
Figure 12.
Outer rotor type BLDC motor: (a) manufactured model and (b) experimental set.
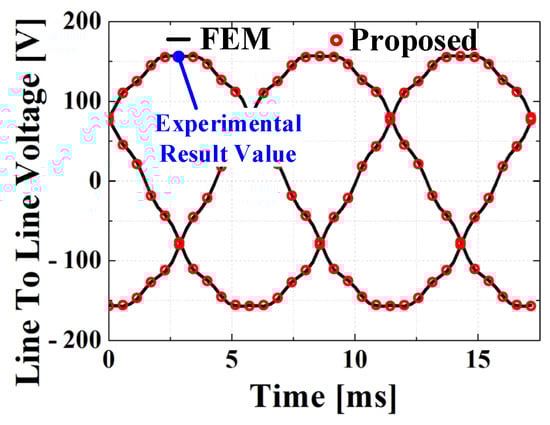
Figure 13.
Comparison of the proposed method and experimental results using back EMF.
In addition to its accuracy, the proposed analytical method significantly reduces the computational burden. In our test environment (Intel i7 CPU, 128 GB RAM), a single evaluation using the analytical method took approximately 10 s, while a 2D FEM simulation under similar conditions required about 15 min. This corresponds to a reduction in computation time of over 95%. This improvement becomes especially important during the multi-objective optimization process using NSGA-II, where hundreds of design candidates are evaluated per generation. As such, the proposed method enables fast and practical optimization without compromising accuracy.
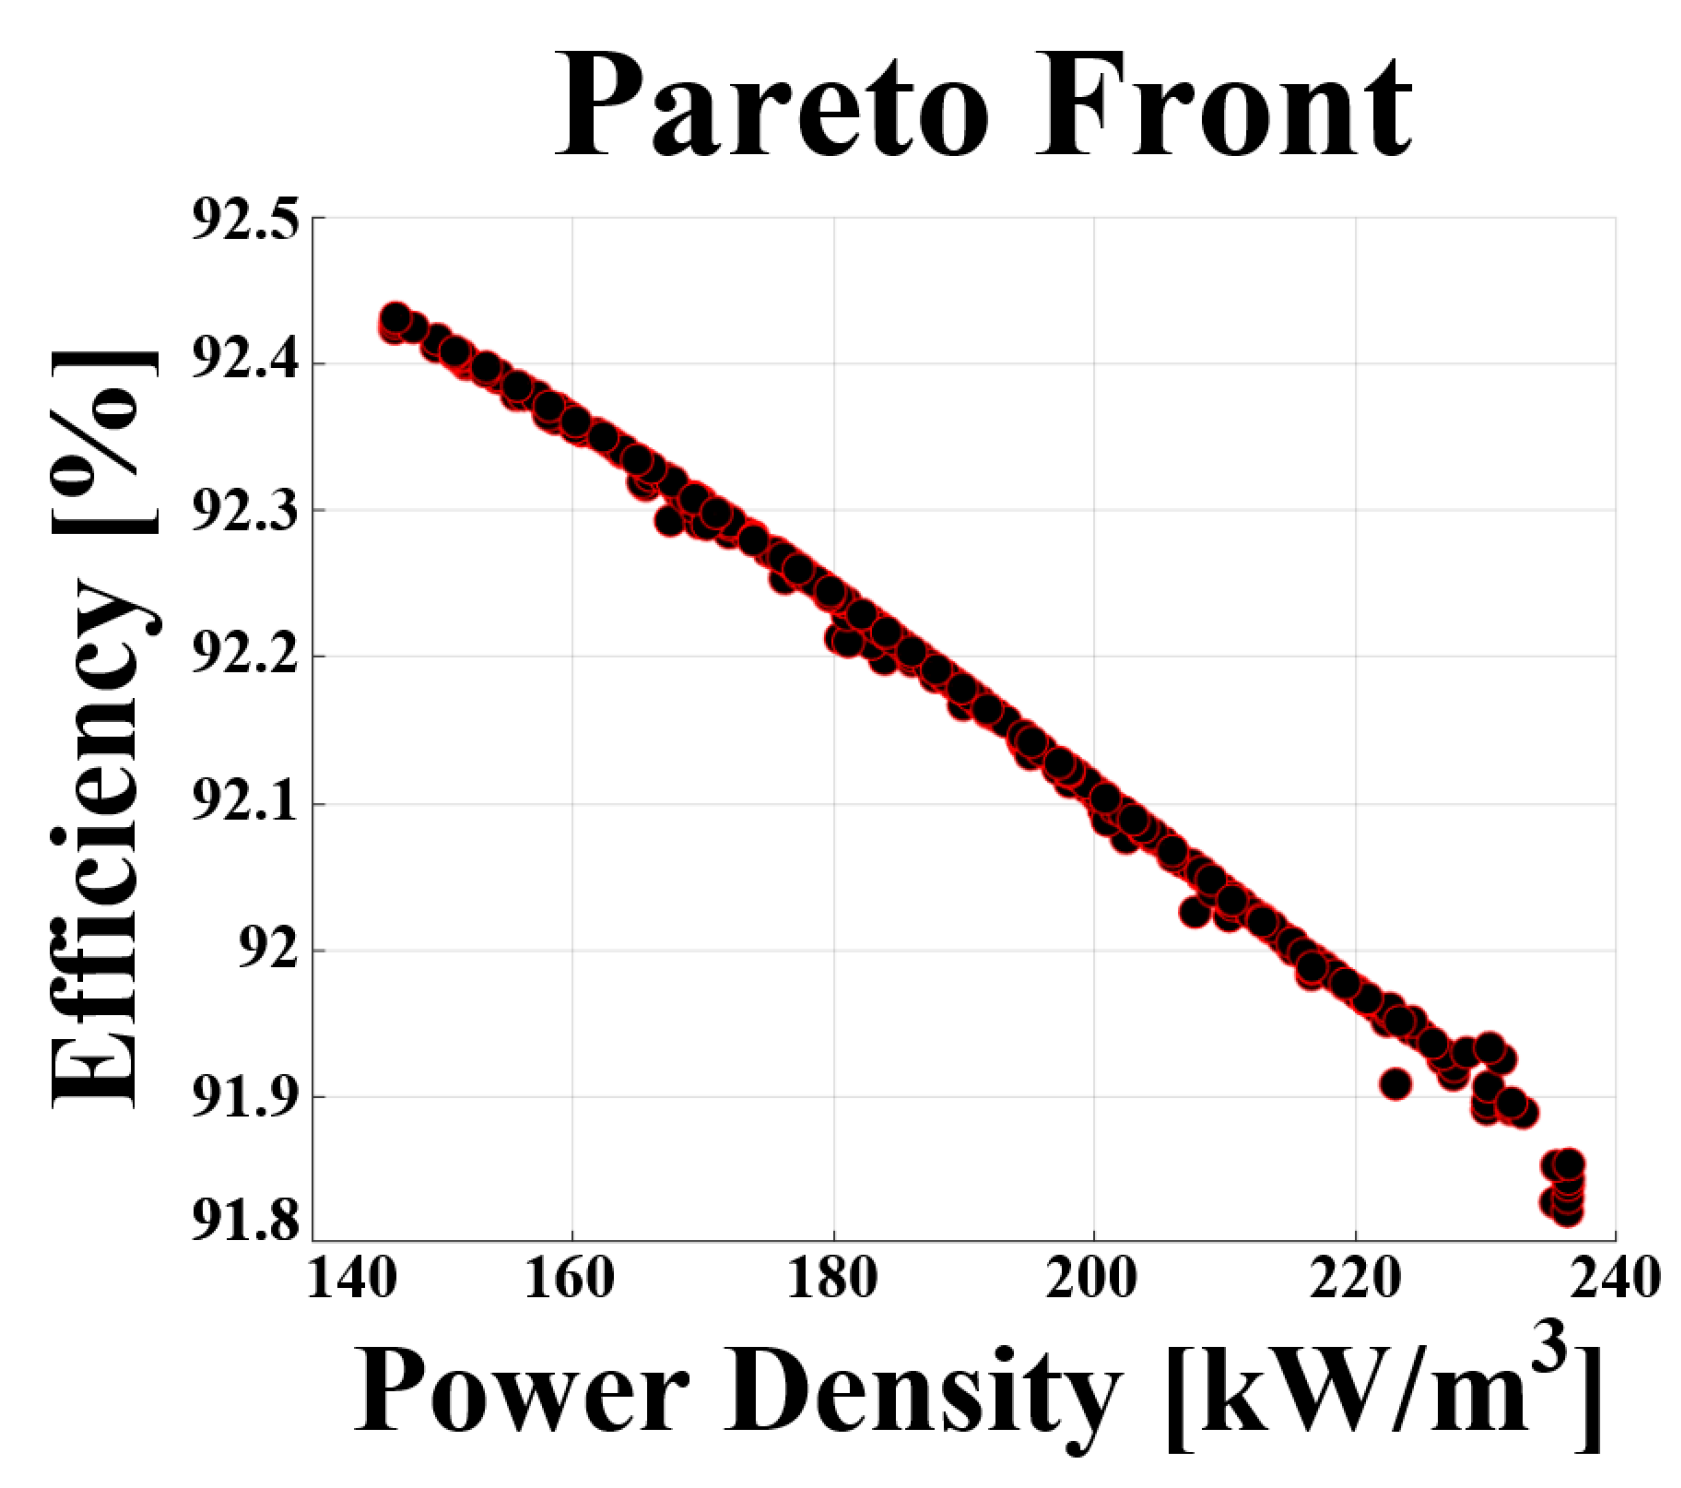
In this study, a multi-objective optimization technique was applied to optimize the efficiency and power density simultaneously, with the aim of finding a balance between these two performance metrics. As a result of deriving the Pareto front with the efficiency and power density as objective functions, it can be observed from Figure 14 that the two objective functions have an inverse relationship.

Figure 14.
Optimal design results derived from Pareto front.
Efficiency and power density are considered key performance indicators in motor design. During the process of optimizing these two objective functions simultaneously, the weight setting plays a significant role in the final design results. The higher the power density, the smaller the size that is required to achieve the same power. This refers to the amount of power generated per unit volume of the motor. As motor power increases and the housing size decreases, the power density increases. Therefore, in this study, a higher weight was assigned to the power density to optimize the motor. Lstk, Rro, and Thick PM represent the axial length, external radius of the motor, and PM thickness, respectively. Figure 15 compares the shapes of each initial model and the optimal model.
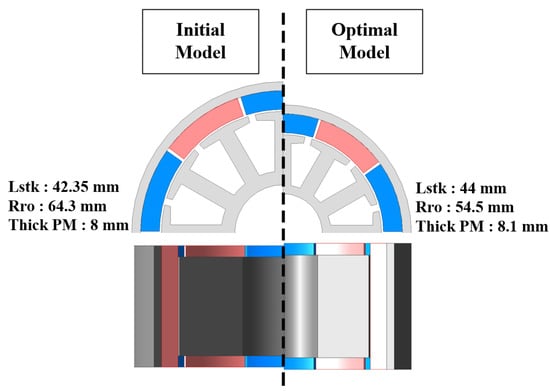
Figure 15.
Comparison of initial and optimal design shapes.
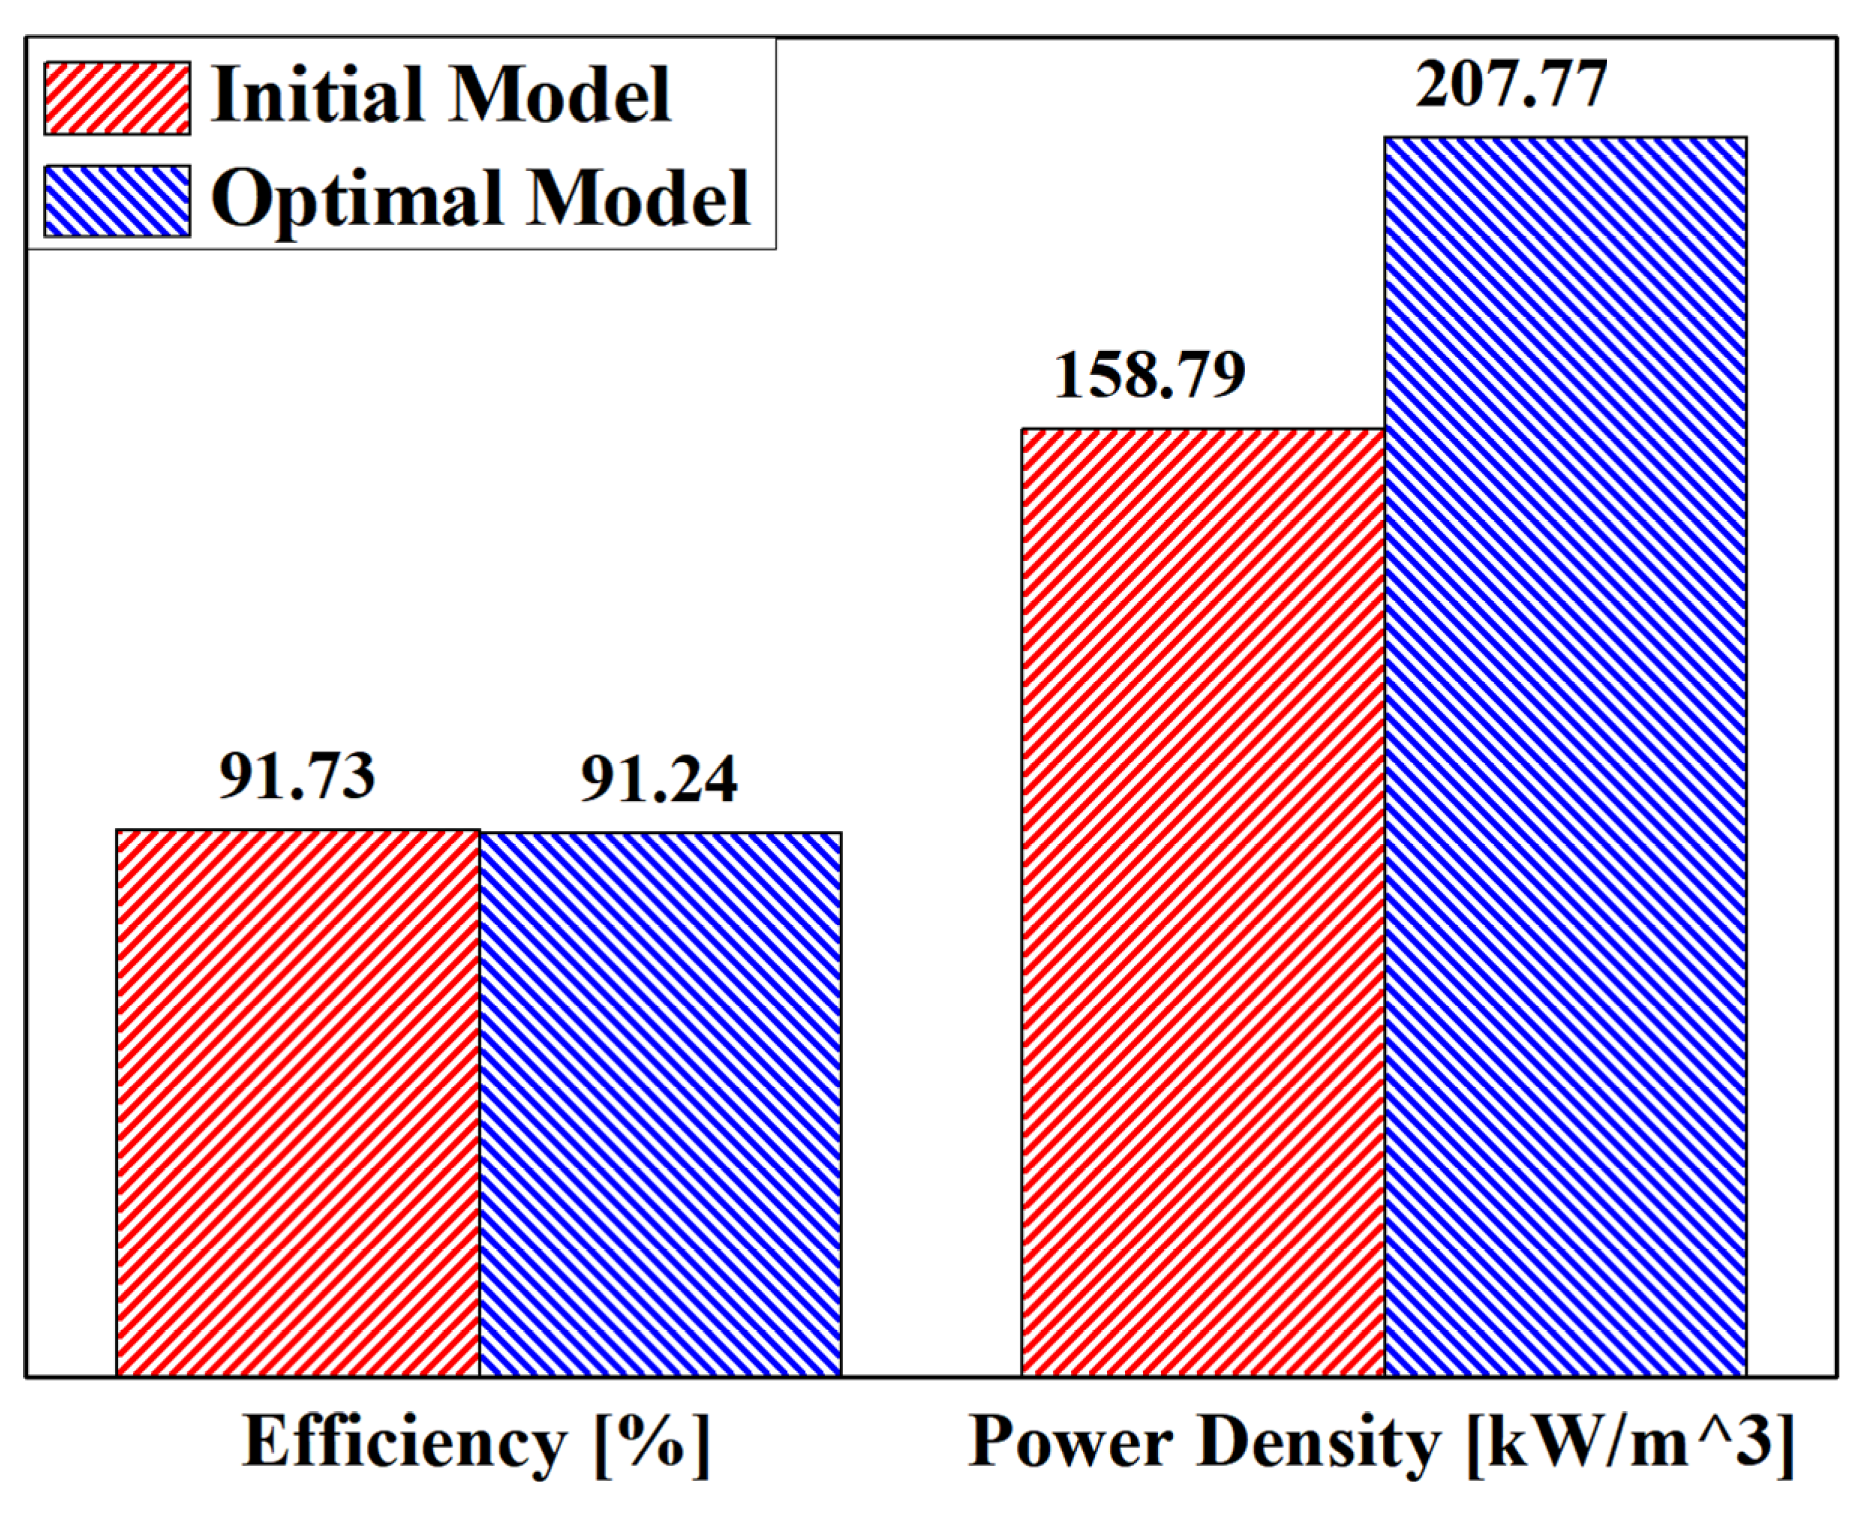
Figure 16 shows the electromagnetic analysis results for the initial and optimal design models. While the efficiency remained at the same level, the power density improved by approximately 30.8% compared with the initial model. The material usage of the initial and optimal models is shown in Table 5. To verify the validity of the proposed optimal design model, a comparative analysis of the analytical method and FEM results was conducted. The results are presented in Table 6. Based on key performance indicators such as efficiency and power, the error between the two methods was found to be within 1%. Specifically, the power predicted by the analytical method was 104.23 W, whereas that calculated by the FEM was 104.87 W, with a difference of only approximately 0.61%. In terms of efficiency, the analytical method predicted 91.99% and the FEM predicted 91.24%, showing a minor difference of approximately 0.82%. In conclusion, the high similarity between the proposed analytical method and FEM supports the validity and practicality of the proposed optimal design model. This method is expected to be useful for the future design and optimization of related fields.
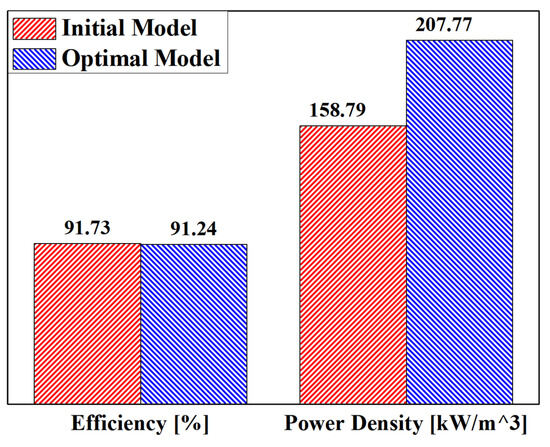
Figure 16.
Comparison of initial and optimal design electromagnetic analysis results.
Table 5.
Comparison of material usage between initial and optimal models.
Table 6.
Comparison of electromagnetic analysis results between the proposed method and the optimal model of FEM.
5. Conclusions
This study has proposed an analytical method using 2D equivalent analysis and the space harmonic method, considering the 3D structure of outer rotor type BLDC motors, as well as an optimal design method using the NSGA-II.
To account for the commonly applied 3D structure of the PM overhang in outer rotor type BLDC motors, a 2D equivalent analysis method using an operating point transformation was introduced. In addition, to model the integrated rotor yoke equivalently, the distribution of the actual rotor flux was considered, and the rotor yoke for the 2D model was selected. This approach addresses the issue of long analysis times in 3D analysis.
Next, the electromagnetic characteristics of the outer rotor type BLDC motor were analyzed using the space harmonic method. The flux linkage, back EMF, and air gap flux density owing to the stator–armature reaction were derived.
Finally, multi-objective optimization design was carried out using the NSGA-II. The power density and efficiency were set as objective functions, and the Pareto front was derived to select the optimal model.
The experimental results of the manufactured model were compared with the FEM analysis results to validate the proposed method. The proposed method was confirmed to be highly accurate. This implies that the proposed methods for analysis and optimization are effective tools in the development of outer rotor type BLDC motors.
Author Contributions
Conceptualization, T.-S.K., J.-W.Y., K.-H.S., G.-H.J. and J.-Y.C.; methodology, T.-S.K.; validation, T.-S.K.; writing, T.-S.K.; writing—review and editing, J.-W.Y., K.-H.S., G.-H.J., C.H. and J.-Y.C.; supervision, K.-H.S. and J.-Y.C. All authors have read and agreed to the published version of the manuscript.
Funding
This work was supported by Korea Institute of Energy Technology Evaluation and Planning (KETEP) grant funded by the Korean government (MOTIE) (20223A10100040, development of design technology for converting retired thermal plants into synchronous condenser plants).
Data Availability Statement
Data are contained within the article.
Conflicts of Interest
The author Cheol Han was employed by the Advance E&E BLDC Motor Team Hanonsystems. The remaining authors declare that the research was conducted in the absence of any commercial or financial relationships that could be construed as a potential conflict of interest.
References
- Shao, J. An Improved Microcontroller-Based Sensorless Brushless DC (BLDC) Motor Drive for Automotive Applications. IEEE Trans. Ind. Appl. 2006, 42, 1216–1221. [Google Scholar] [CrossRef]
- Pillay, P.; Krishnan, R. Application characteristics of permanent magnet synchronous and brushless DC motors for servo drives. IEEE Trans. Ind. Appl. 1991, 27, 986–996. [Google Scholar] [CrossRef]
- Park, S.J.; Park, H.W.; Lee, M.H.; Harashima, F. A new approach for minimum-torque-ripple maximum-efficiency control of BLDC motor. IEEE Trans. Ind. Electron. 2000, 47, 109–114. [Google Scholar] [CrossRef]
- Damiano, A.; Floris, A.; Fois, G.; Marongju, I.; Porru, M.; Serpi, A. Design of a High-Speed Ferrite-Based Brushless DC Machine for Electric Vehicles. IEEE Trans. Ind. Appl. 2017, 53, 4279–4287. [Google Scholar] [CrossRef]
- Bianchi, N.; Bolognani, S.; Luise, F. Analysis and Design of a PM Brushless Motor for High-Speed Operations. IEEE Trans. Energy Convers. 2005, 20, 629–637. [Google Scholar] [CrossRef]
- Kim, H.K.; Hur, J. Dynamic Characteristic Analysis of Irreversible Demagnetization in SPM- and IPM-Type BLDC Motors. IEEE Trans. Ind. Appl. 2012, 53, 982–990. [Google Scholar] [CrossRef]
- Kim, T.-H.; Ehsani, M. Sensorless Control of the BLDC Motors From Near-Zero to High Speeds. IEEE Trans. Power Electron. 2004, 19, 1635–1645. [Google Scholar] [CrossRef]
- Liu, H.-C.; Kim, H.W.; Jang, H.K.; Jang, I.-S.; Lee, J. Ferrite PM Optimization of SPM BLDC Motor for Oil-Pump Applications According to Magnetization Direction. IEEE Trans. Appl. Supercond. 2020, 30, 1–5. [Google Scholar] [CrossRef]
- Azzouzi, J.; Barakat, G.; Dakyo, B. Quasi-3-D Analytical Modeling of the Magnetic Field of an Axial Flux Permanenet-Magnet Synchronous Machine. In Proceedings of the IEEE International Electric Machines and Drives Conference, IEMDC’03, Madison, WI, USA, 1–4 June 2003; IEEE: Pictasaway, NJ, USA, 2003; Volume 3, pp. 1941–1947. [Google Scholar] [CrossRef]
- Kim, K.-C.; Koo, D.-H.; Lee, J. The study on the overhang coefficient for permanent magnet machine by experimental design method. IEEE Trans. Magn. 2007, 43, 2483–2485. [Google Scholar] [CrossRef]
- Ko, Y.-Y.; Song, J.-Y.; Seo, M.-K.; Han, W.; Kim, Y.-J.; Jung, S.-Y. Analytical method for overhang effect of surface-mounted permanent-magnet motor using conformal mapping. IEEE Trans. Magn. 2018, 54, 1–5. [Google Scholar] [CrossRef]
- Woo, D.-K.; Lim, D.-K.; Yeo, H.-K.; Ro, J.-S.; Jung, H.-K. A 2-D finite-element analysis for a permanent magnet synchronous motor taking an overhang effect into consideration. IEEE Trans. Magn. 2013, 49, 4894–4899. [Google Scholar] [CrossRef]
- Lee, T.-Y.; Seo, M.-K.; Kim, Y.-J.; Jung, S.-Y. Motor Design and Characteristics Comparison of Outer-Rotor-Type BLDC Motor and BLAC Motor Based on Numerical Analysis. IEEE Trans. Appl. Supercond. 2016, 26, 1–6. [Google Scholar] [CrossRef]
- Shin, H.-S.; Shin, K.-H.; Jang, G.-H.; Cho, S.-K.; Jung, K.-H.; Choi, J.-Y. Experimental Verification and 2D Equivalent Analysis Techniques of BLDC Motor With Permanent Magnet Overhang and Housing-Integrated Rotor Core. IEEE Trans. Appl. Supercond. 2020, 30, 1–5. [Google Scholar] [CrossRef]
- Kim, K.-H.; Park, H.-I.; Jang, S.-M.; Choi, J.-Y. Comparison of Characteristics of Double-Sided Permanent-Magnet Synchronous Motor/Generator According to Magnetization Patterns for Flywheel Energy Storage System Using an Analytical Method. IEEE Trans. Magn. 2015, 51, 1–4. [Google Scholar] [CrossRef]
- Lee, H.K. Characteristic Analysis and Analytical Study of the Permanent Magnet Synchronous Motor According to Rotor Eccentricity. Master’s Thesis, Chungnam National University, Daejeon, Republic of Korea, 2020. [Google Scholar]
- Lim, D.-K.; Woo, D.-K.; Kim, I.-W.; Ro, J.-S.; Jung, H.-K. Cogging Torque Minimization of a Dual-Type Axial-Flux Permanent Magnet Motor Using a Novel Optimization Algorithm. IEEE Trans. Magn. 2013, 49, 5106–5111. [Google Scholar] [CrossRef]
- Kim, W.H. Multi-Objective Optimal design of SPMSM for electric compressor using analytical method and NSGA-II algorithm. Master’s Thesis, Chungnam National University, Daejeon, Republic of Korea, 2022. [Google Scholar]
- Jo, S.T. Optimal Design of High-Speed Permanent Magnet Synchronous Generator for Supercritical Organic Rankine Cycle Power System. Master’s Thesis, Chungnam National University, Daejeon, Republic of Korea, 2023. [Google Scholar]
- Deb, K.; Pratap, A.; Agarwal, S.; Meyarivan, T. A fast and elitist multiobjective genetic algorithm: NSGA-II. IEEE Trans. Evol. Comput. 2002, 6, 182–197. [Google Scholar] [CrossRef]


Disclaimer/Publisher’s Note: The statements, opinions and data contained in all publications are solely those of the individual author(s) and contributor(s) and not of MDPI and/or the editor(s). MDPI and/or the editor(s) disclaim responsibility for any injury to people or property resulting from any ideas, methods, instructions or products referred to in the content. |
© 2025 by the authors. Licensee MDPI, Basel, Switzerland. This article is an open access article distributed under the terms and conditions of the Creative Commons Attribution (CC BY) license (https://creativecommons.org/licenses/by/4.0/).