Passenger safety is a critical issue in elevator systems. The occurrence of various types of failure in PMSMs can affect the overall operation of the system. Many research efforts have focused on proper inverter control to ensure uninterrupted operation of the machine, even in the event of a simple short-circuit.
3.1. Mech Sensitivity Analysis in a PMSM
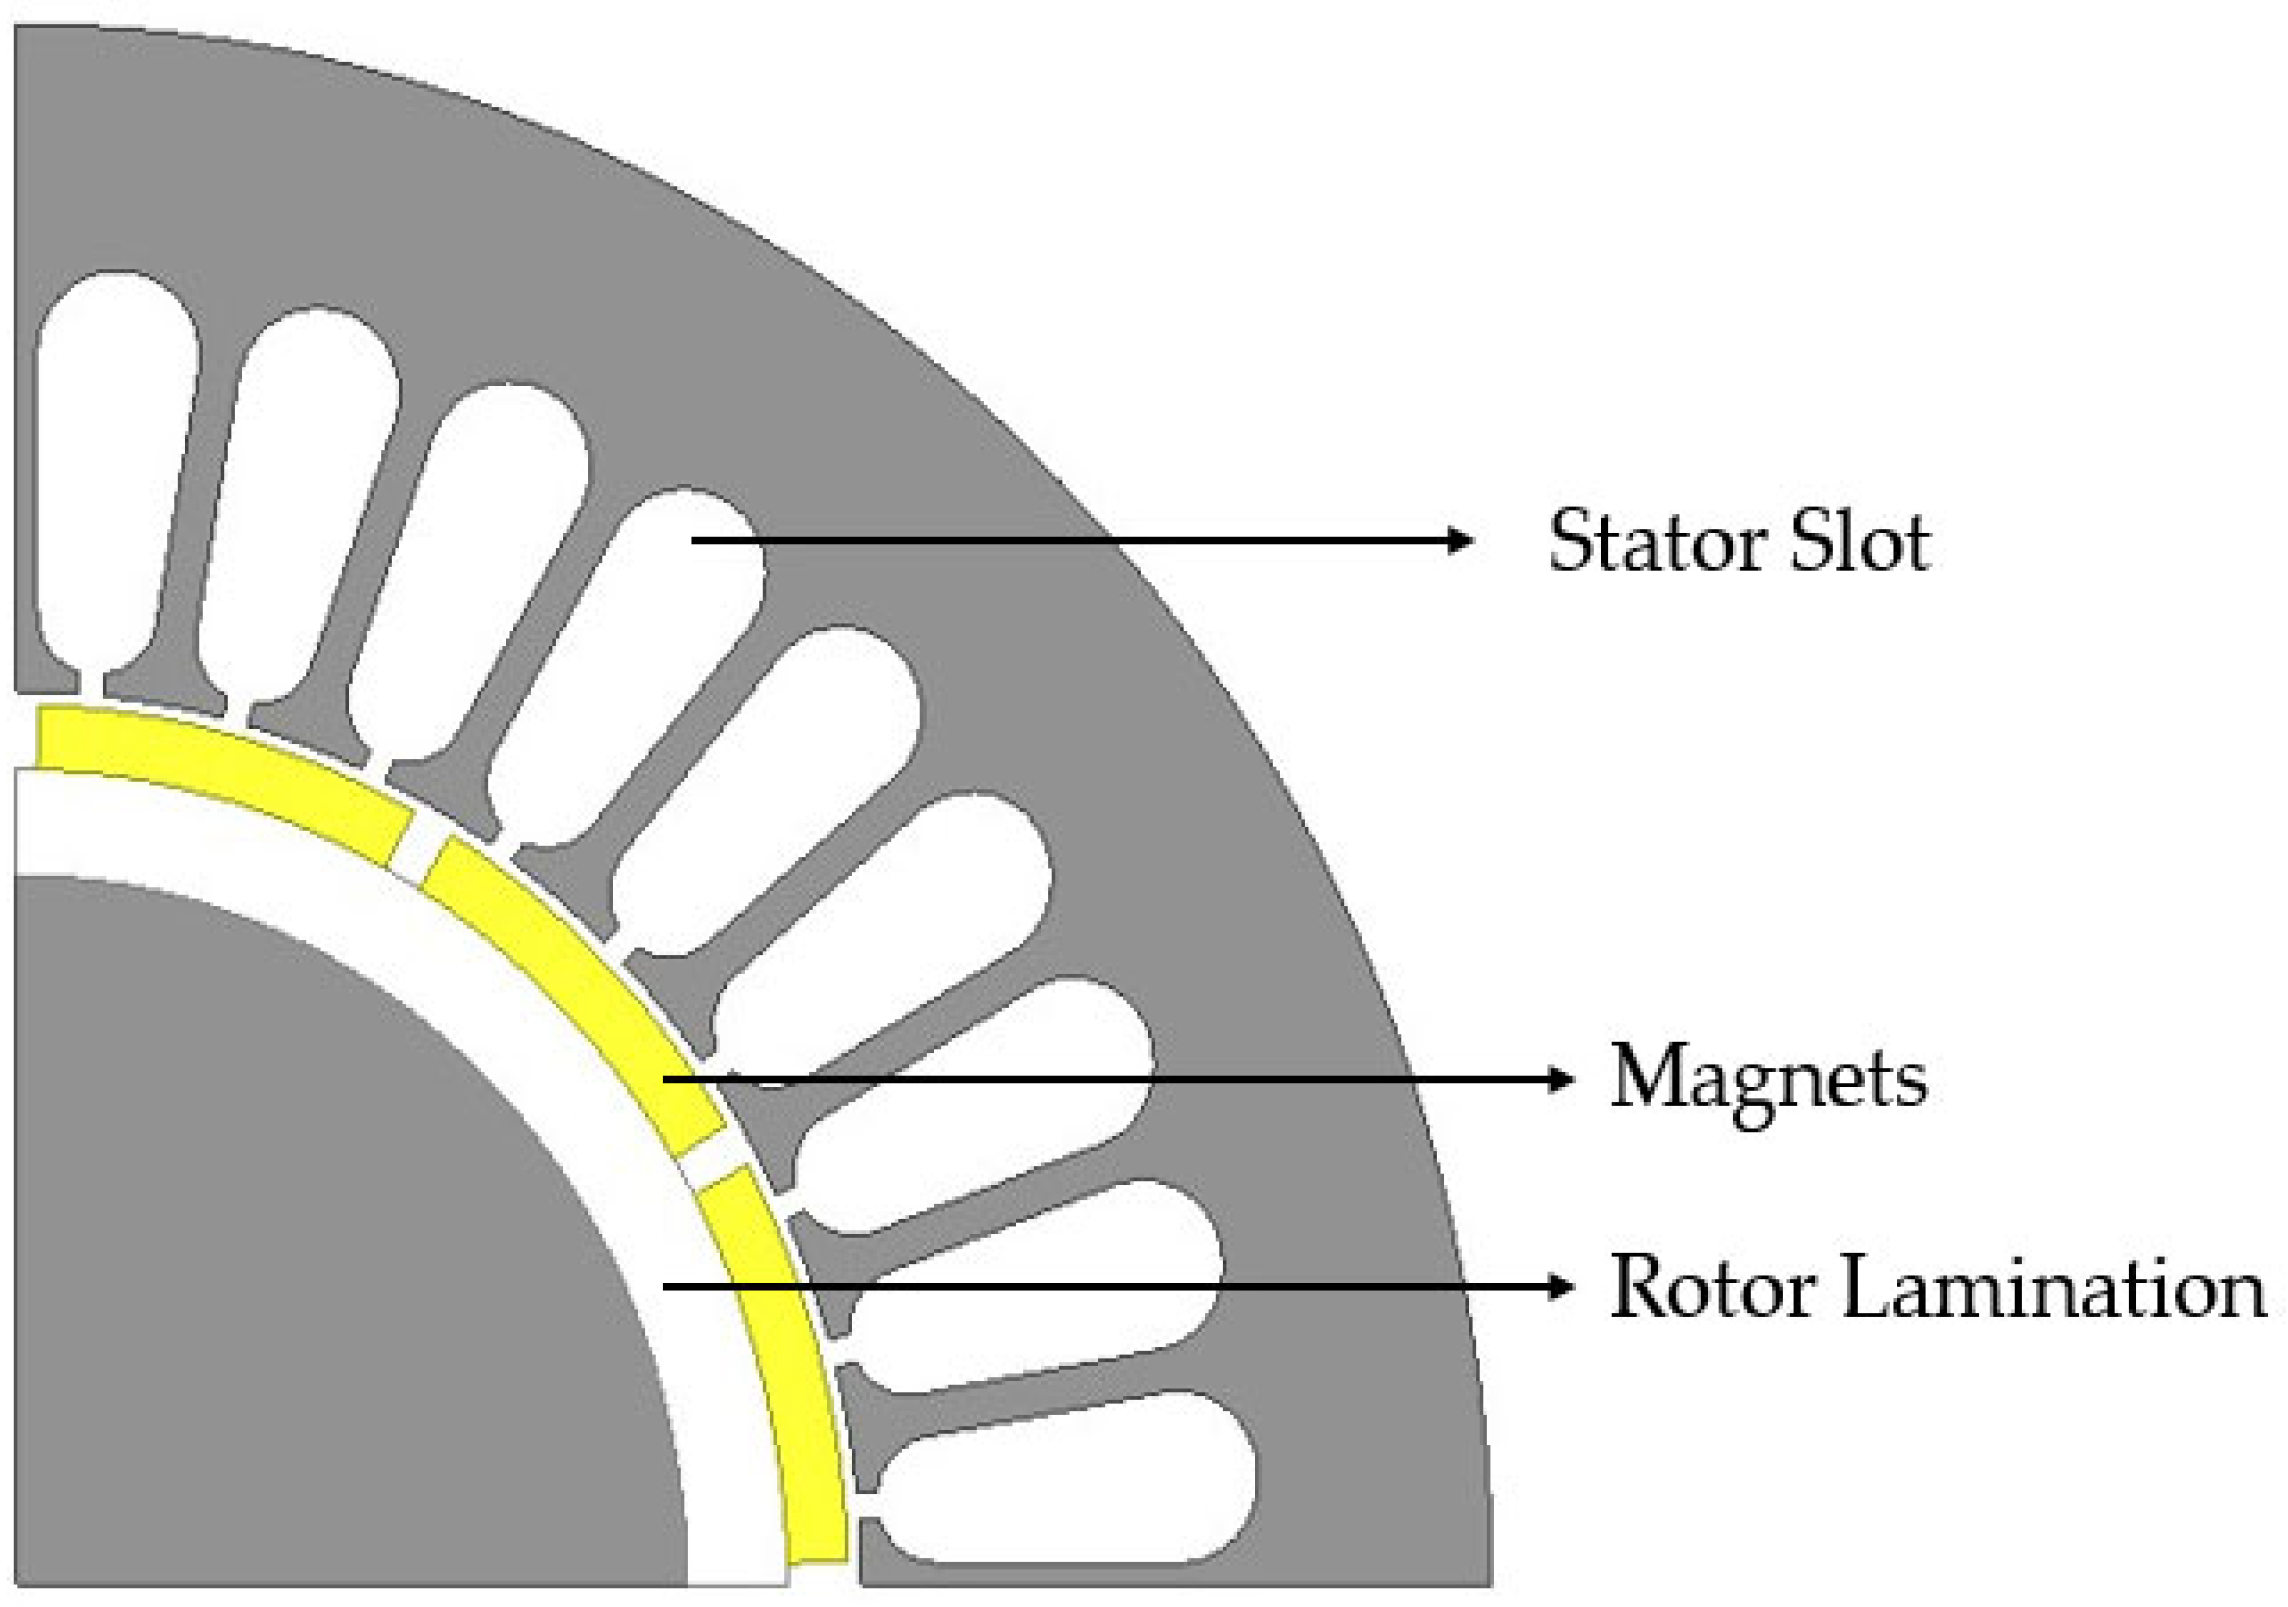
The occurrence of electrical faults (open-phase and short-circuit) can cause abrupt and localized changes in the electromagnetic field, creating flow asymmetries in critical design regions such as the airgap, thereby making the system highly sensitive to numerical deviations. A similar technique is applied in modern generators, where gradual improvement is adopted until numerical results are stabilized. Special emphasis is given to the airgap, as proper separation, uniform node subdivision, and the selection of a dense grid contribute to accurate current distribution [
38].
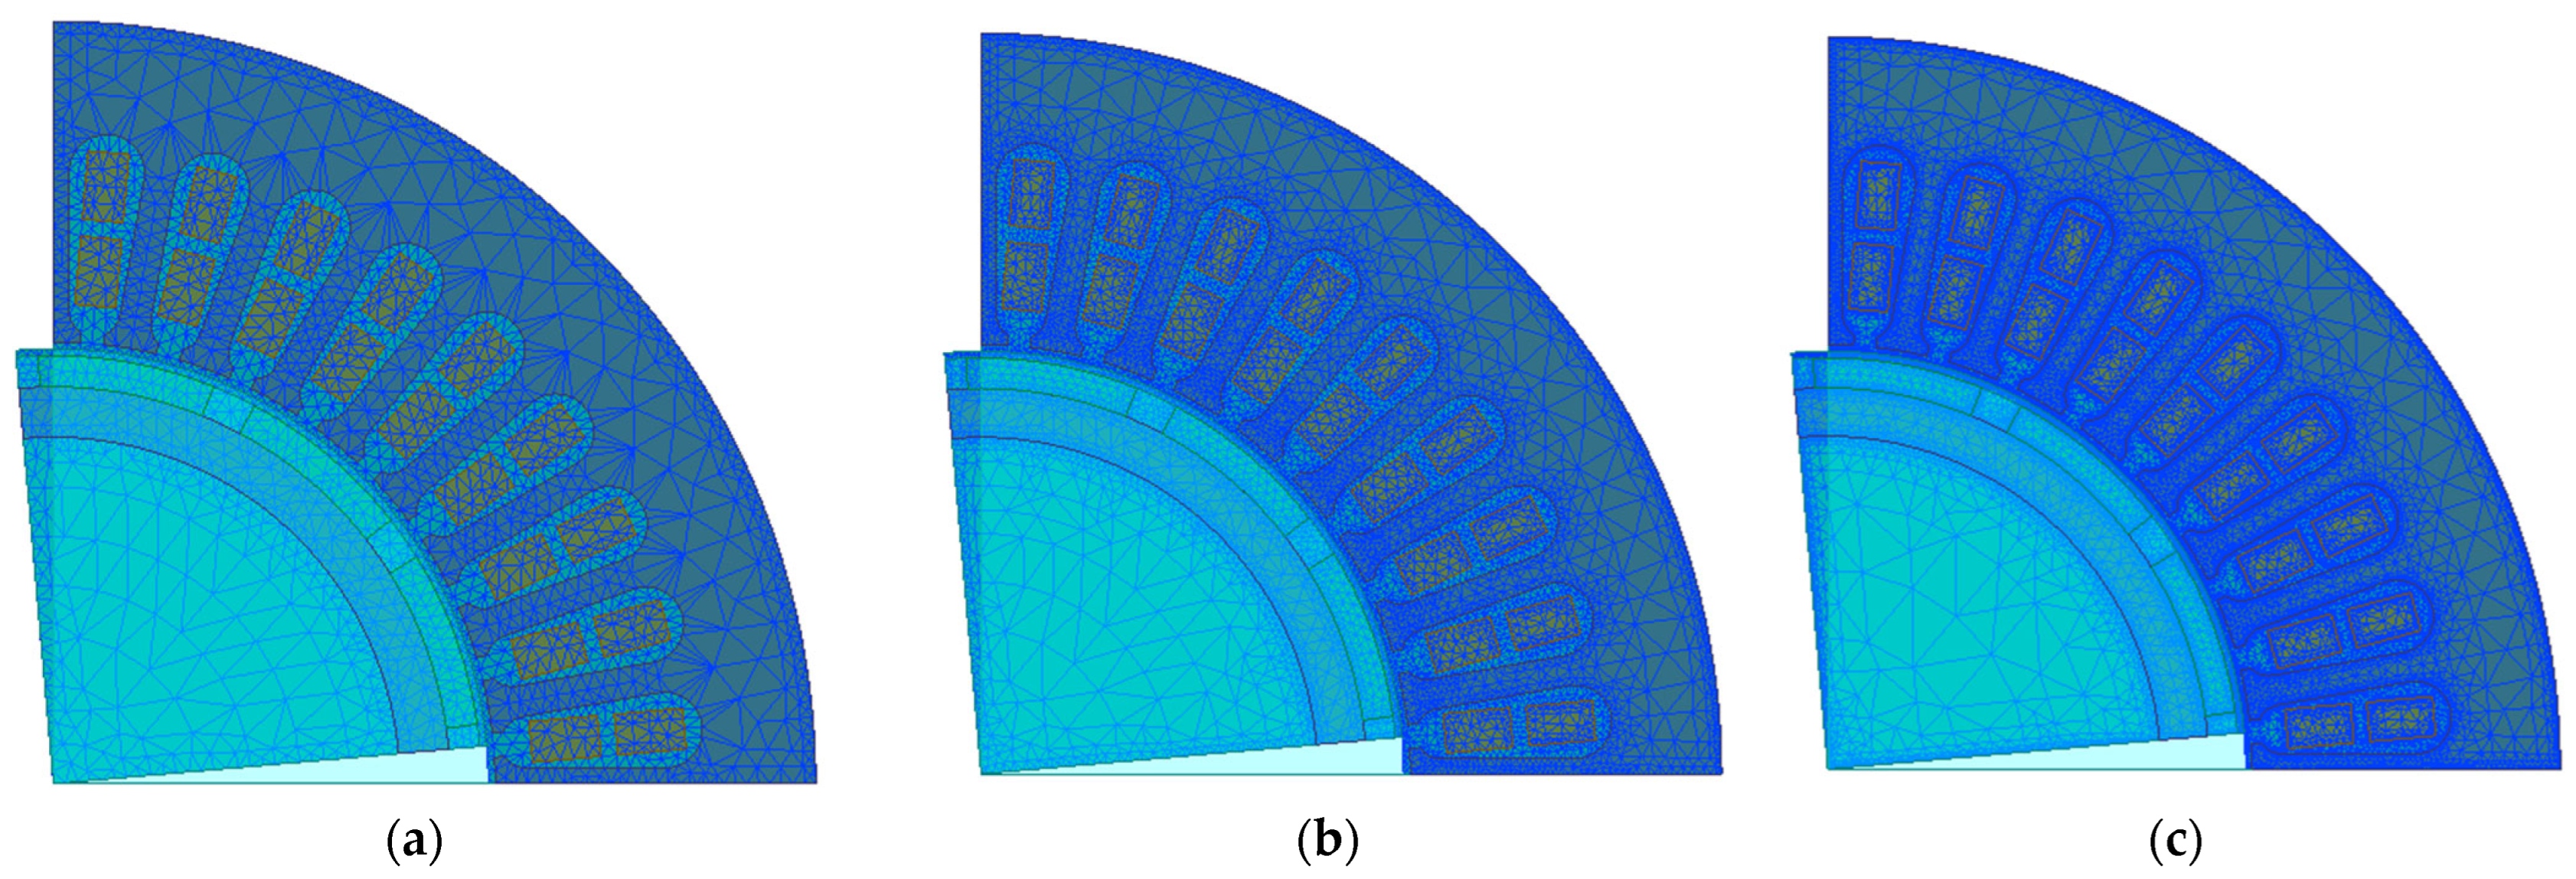
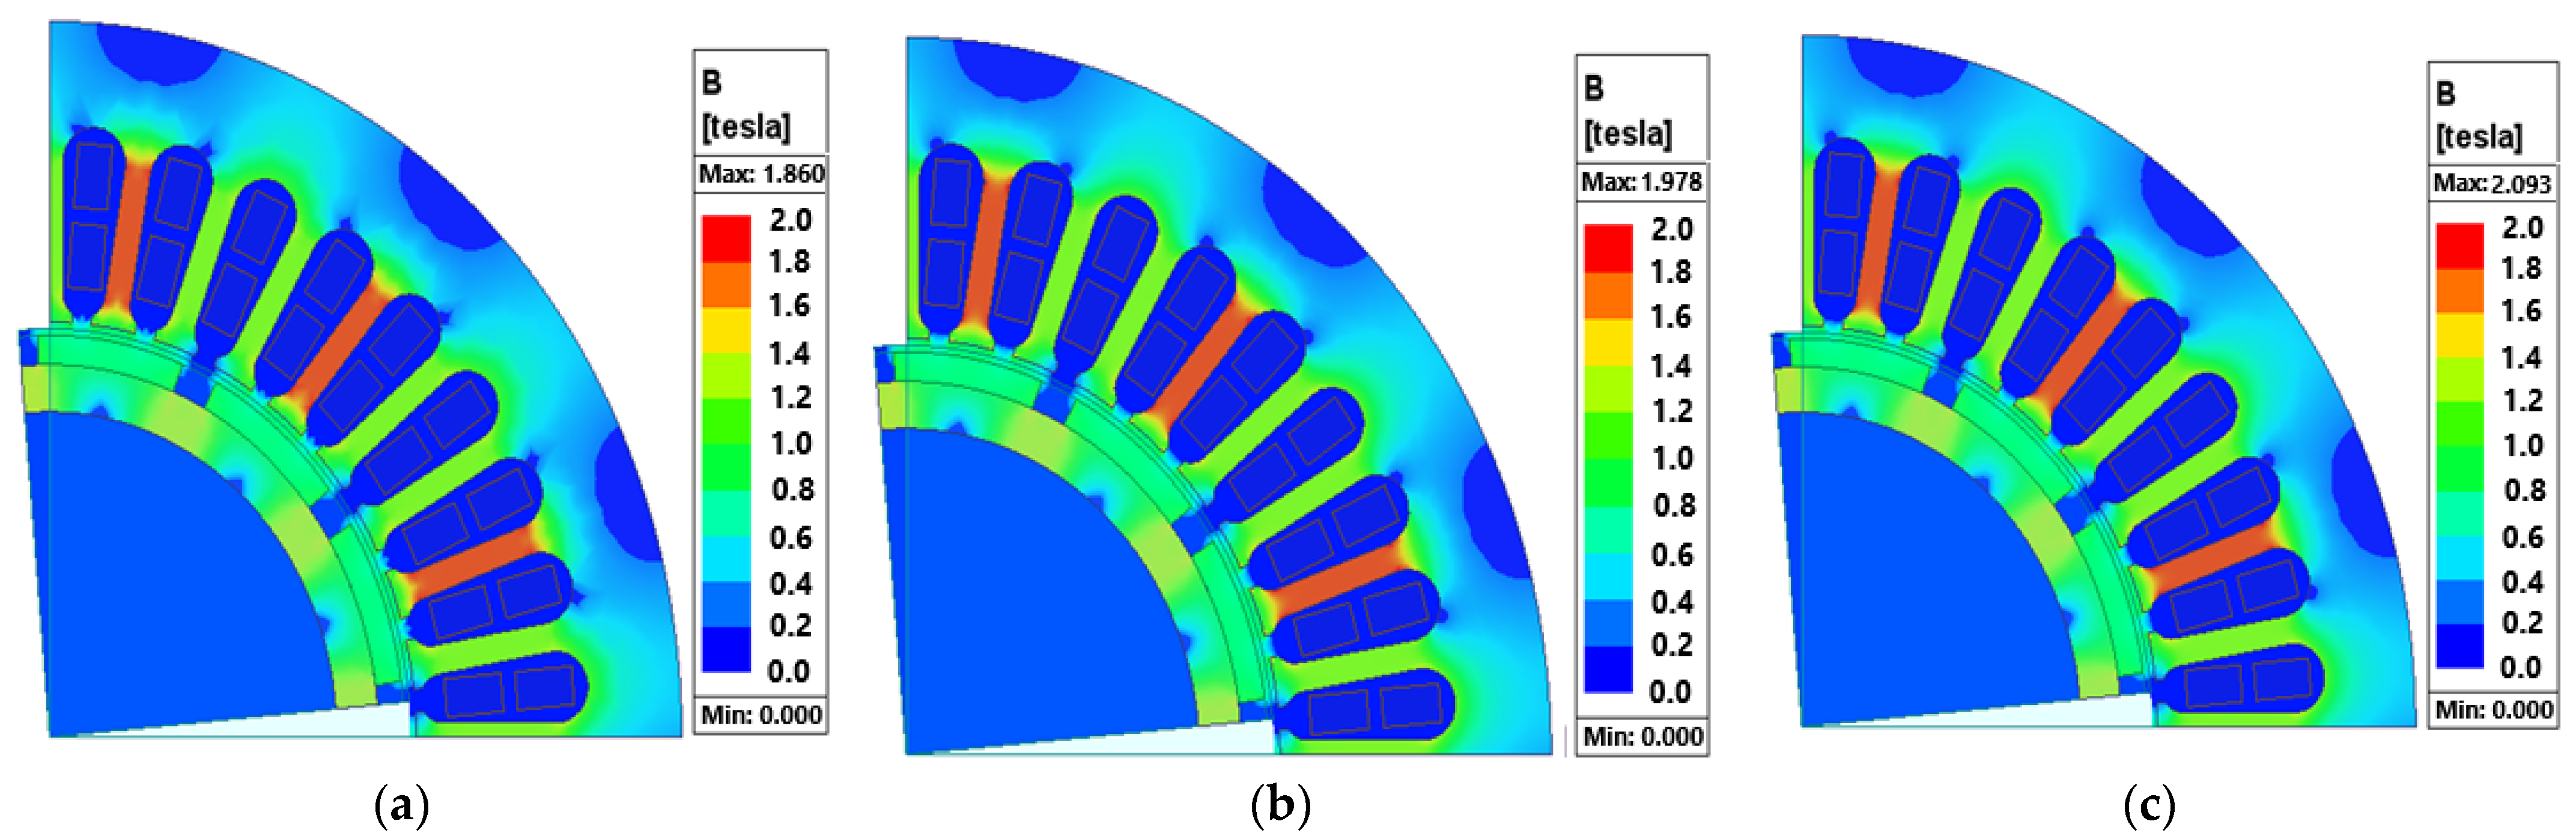
Our research focused on mech sensitivity analysis to evaluate the numerical stability and independence of results with respect to mech discretization. As shown in
Figure 11, three cases with different mesh densities were considered: coarse (2 mm), medium (1 mm), and fine (0.5 mm).
Figure 12 presents the main electromagnetic parameters, such as average torque, magnetic flux, and maximum magnetic field value, as a function of mesh variation.
In the coarse mesh case, sparce discretization is observed in critical regions such as the airgap, stator tooth edges, and areas near the magnets. While suitable for initial estimates, it underestimates magnetic field peaks. The medium mesh offers denser discretization throughout the motor, with clear improvements in the gap and magnet regions, achieving a good balance of reliability and computational efficiency. As shown in
Figure 11c, the fine mesh is characterized by very small elements across the entire model. It is ideal for accurately capturing field distributions and losses.
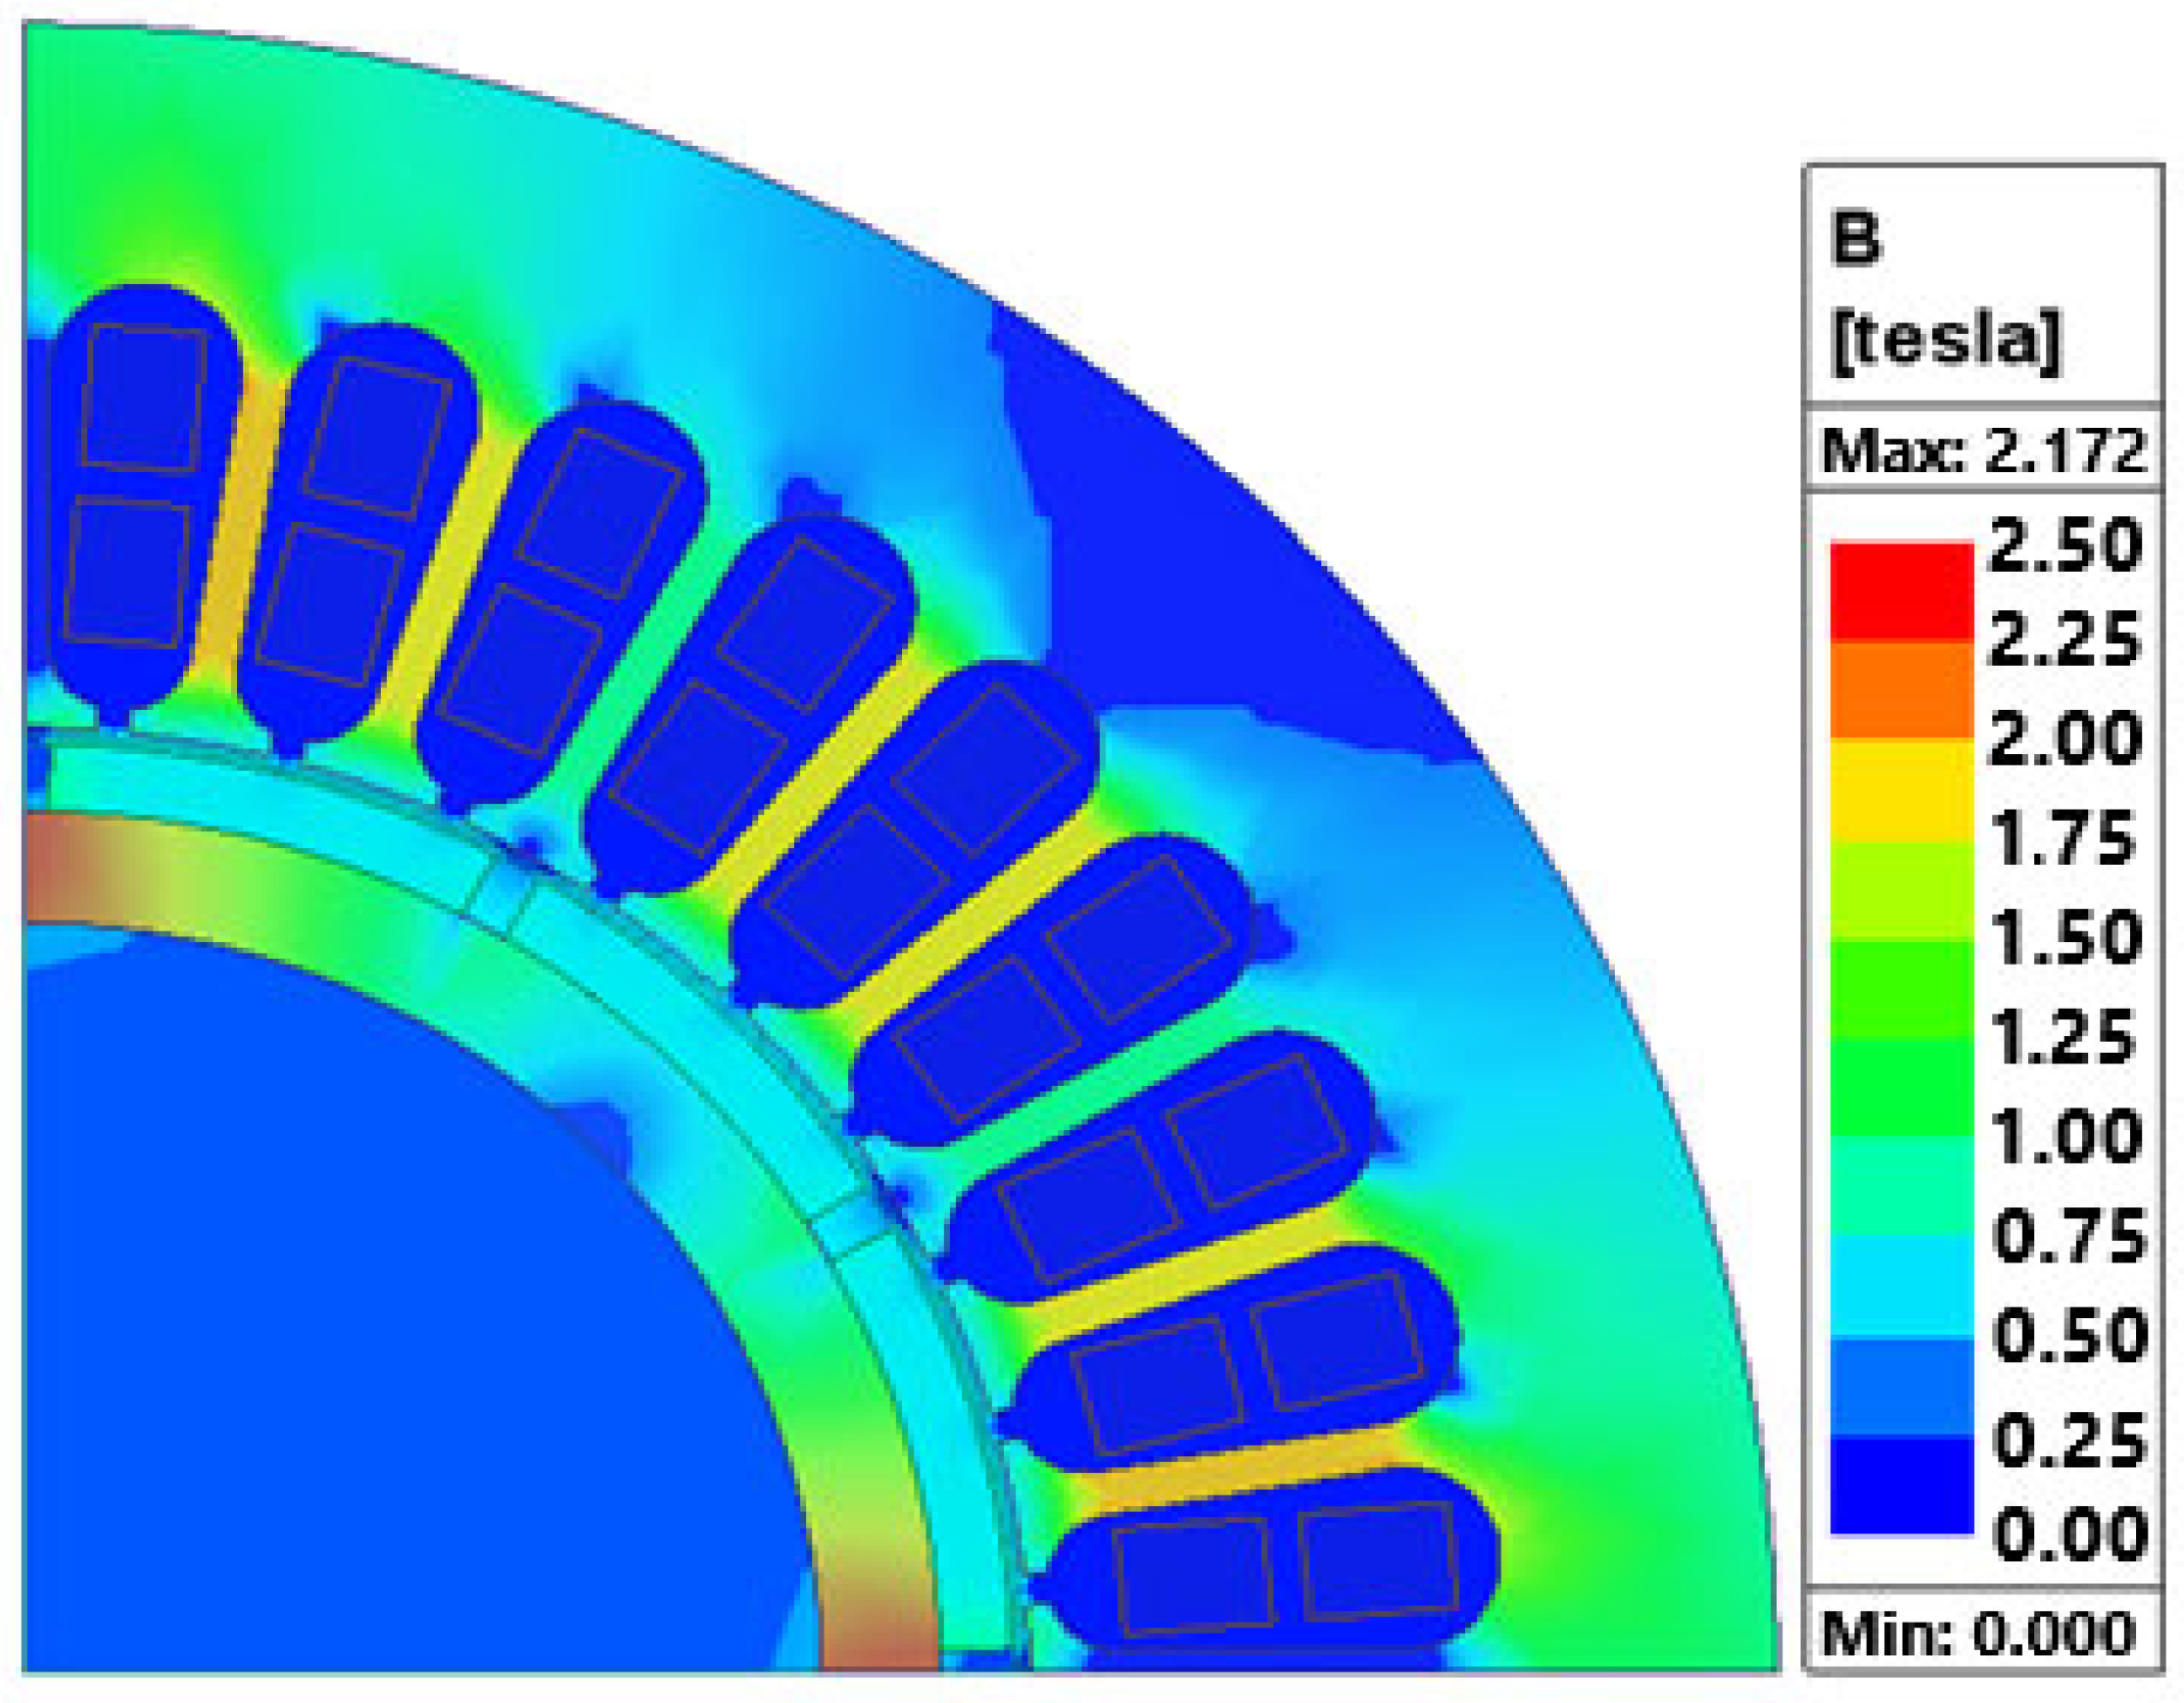
Utilizing the Finite Element Method (FEM) enables a more comprehensive analysis of a magnetic field in each PMSM case studied, as depicted in
Figure 12a–c. Despite the higher computational cost, the fine mesh provides clean, detailed results and captures flow transients, making it ideal for saturation analysis and fault conditions. Visually, the general magnetic field distribution remains stable across mesh variations, with magnetic axes, stator teeth, and saturation regions appearing at consistent locations and extents. The main difference lies in the maximum value of magnetic flux density (B), where improved peak clarity from the finer mesh provides a more complete physical picture.
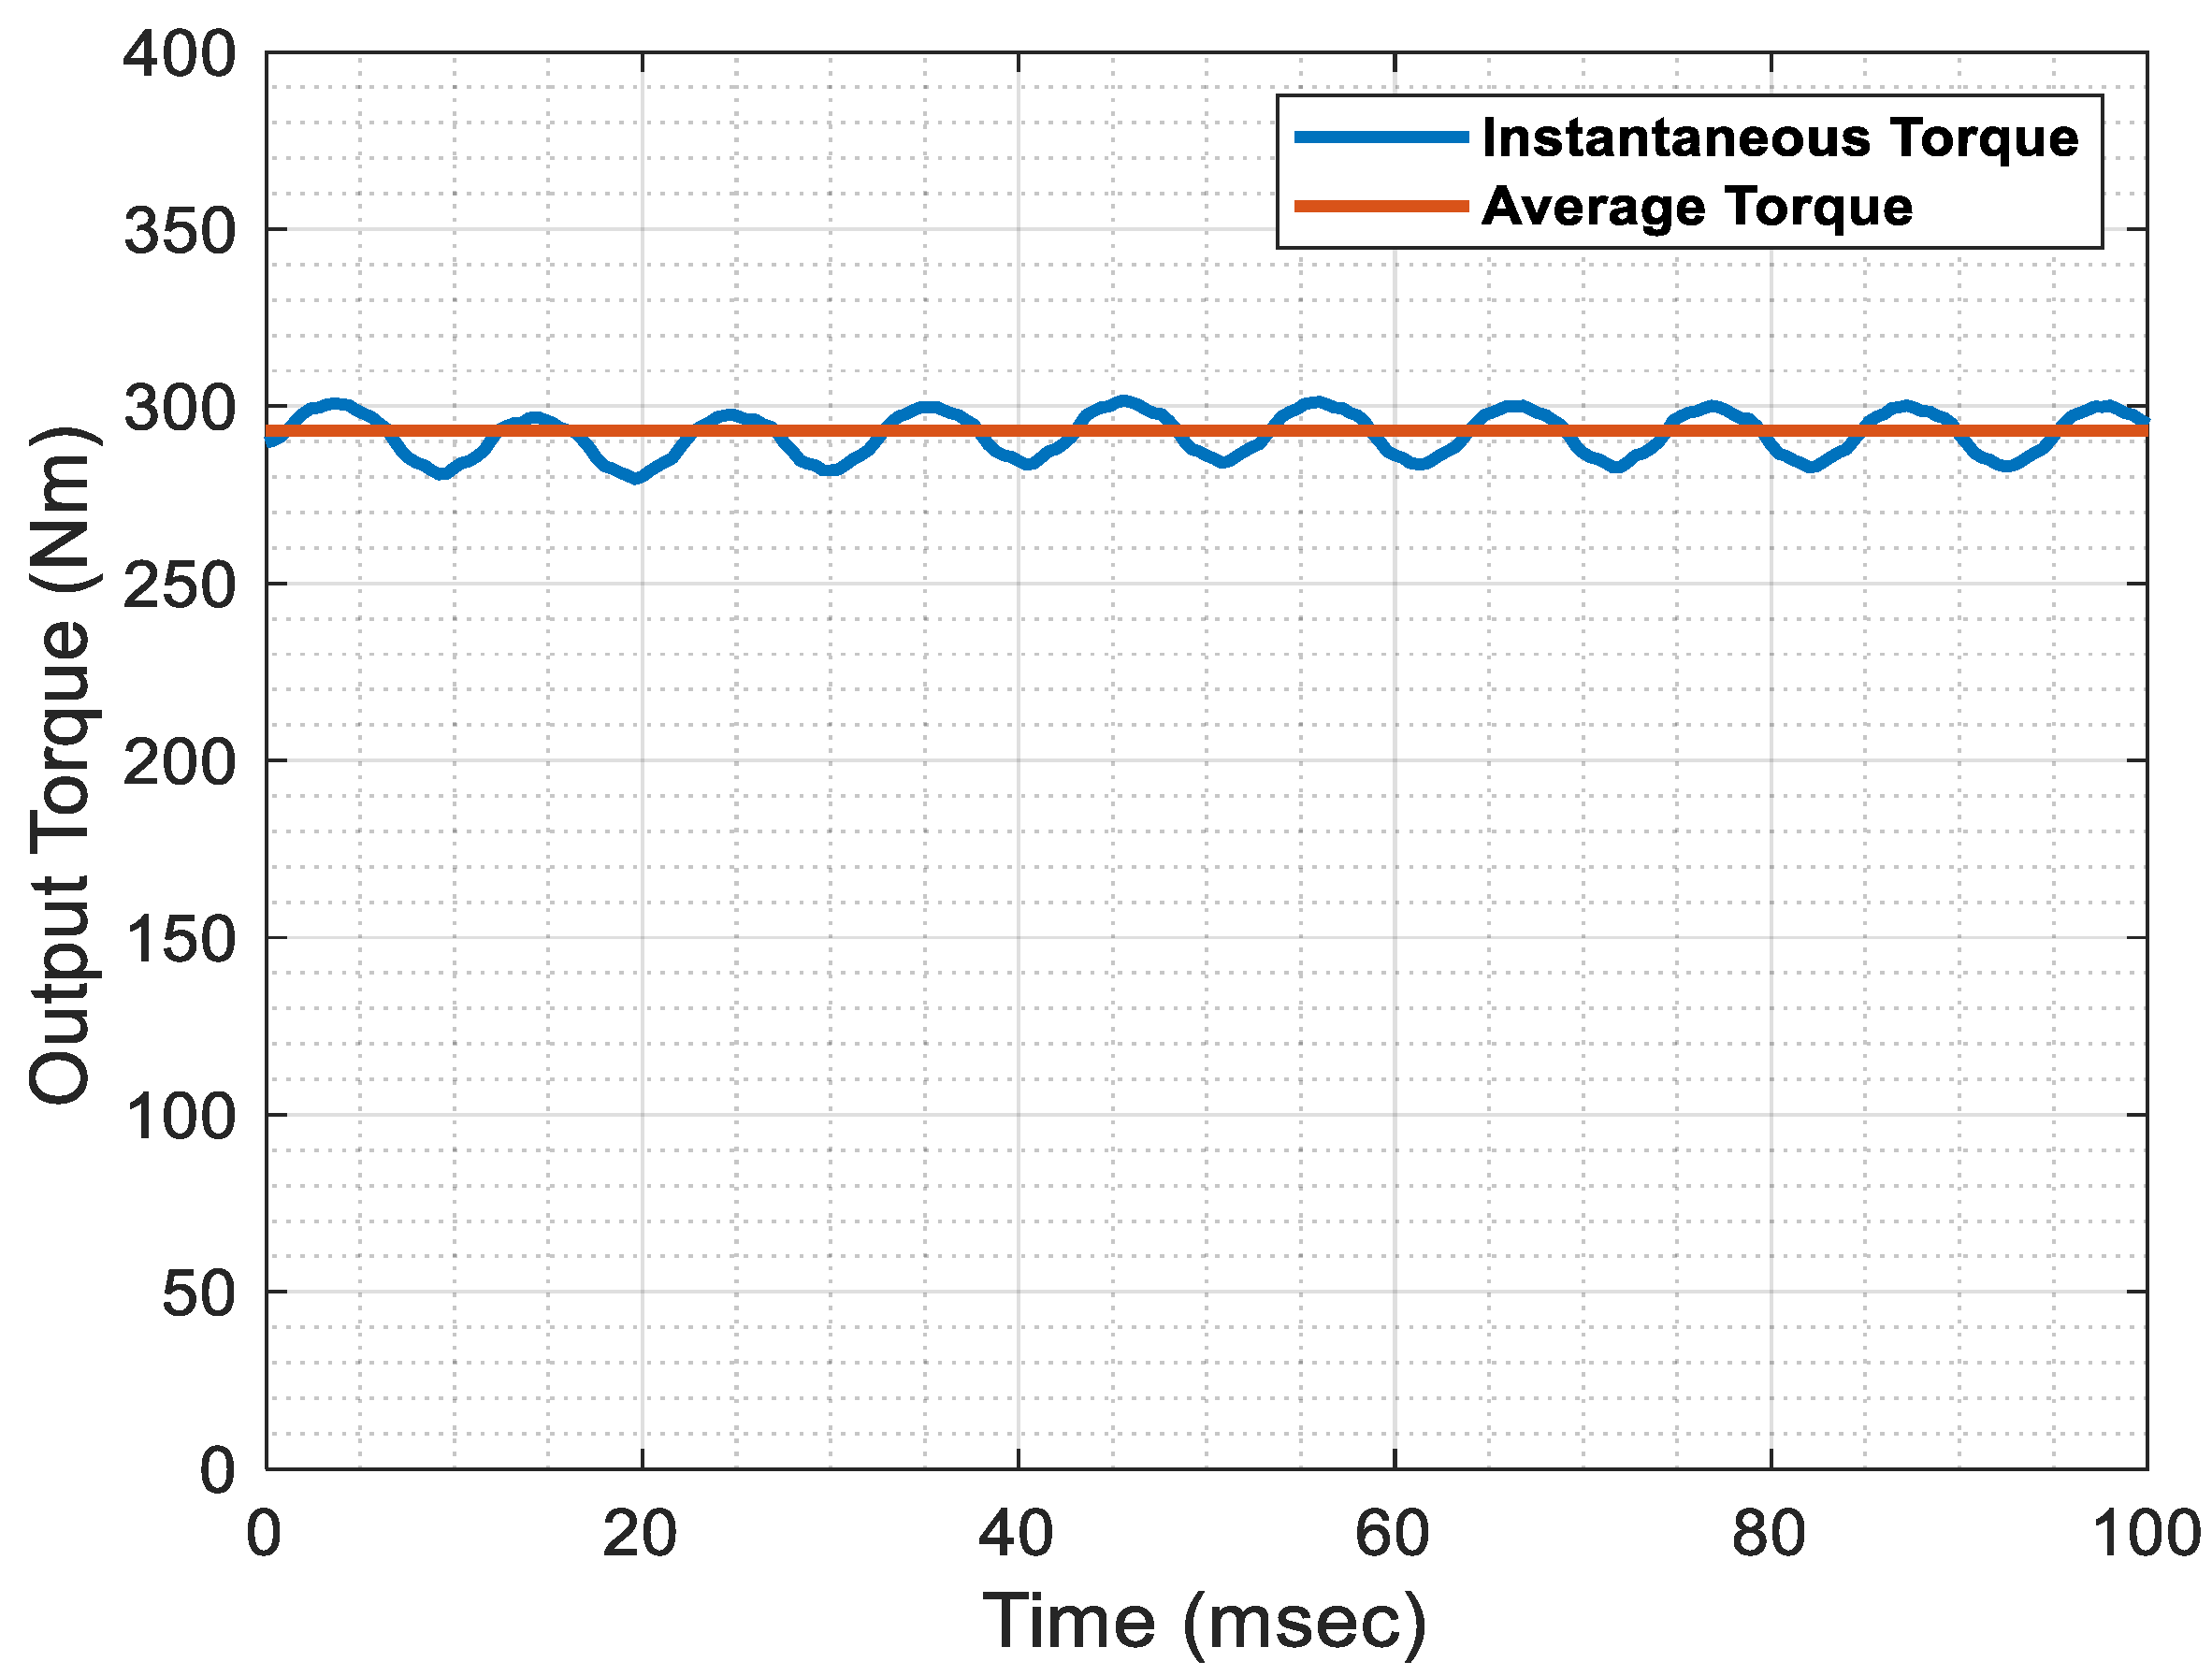
Figure 13a,b show the primary variations in electromagnetic quantities as a function of mesh density. The average torque exhibited minimal changes (less than 0.3%) across different discretizations, suggesting numerical convergence. The magnetic flux showed a small but expected decrease, as the finer grid more accurately accounts for local flux leakages.
3.2. Elevator System Fault-Tolerance Capabilities
To ensure the correct operation of the drive system, the performance of the motor under both healthy and faulty conditions was investigated. The analysis included vibration and current signals under short-circuit conditions. Several system loading experiments were conducted, in accordance with IEC 60034-2-1 standards [
39], at 25%, 50%, 75%, and 100% load levels.
Table 8 presents the nominal characteristics of the tested elevator.
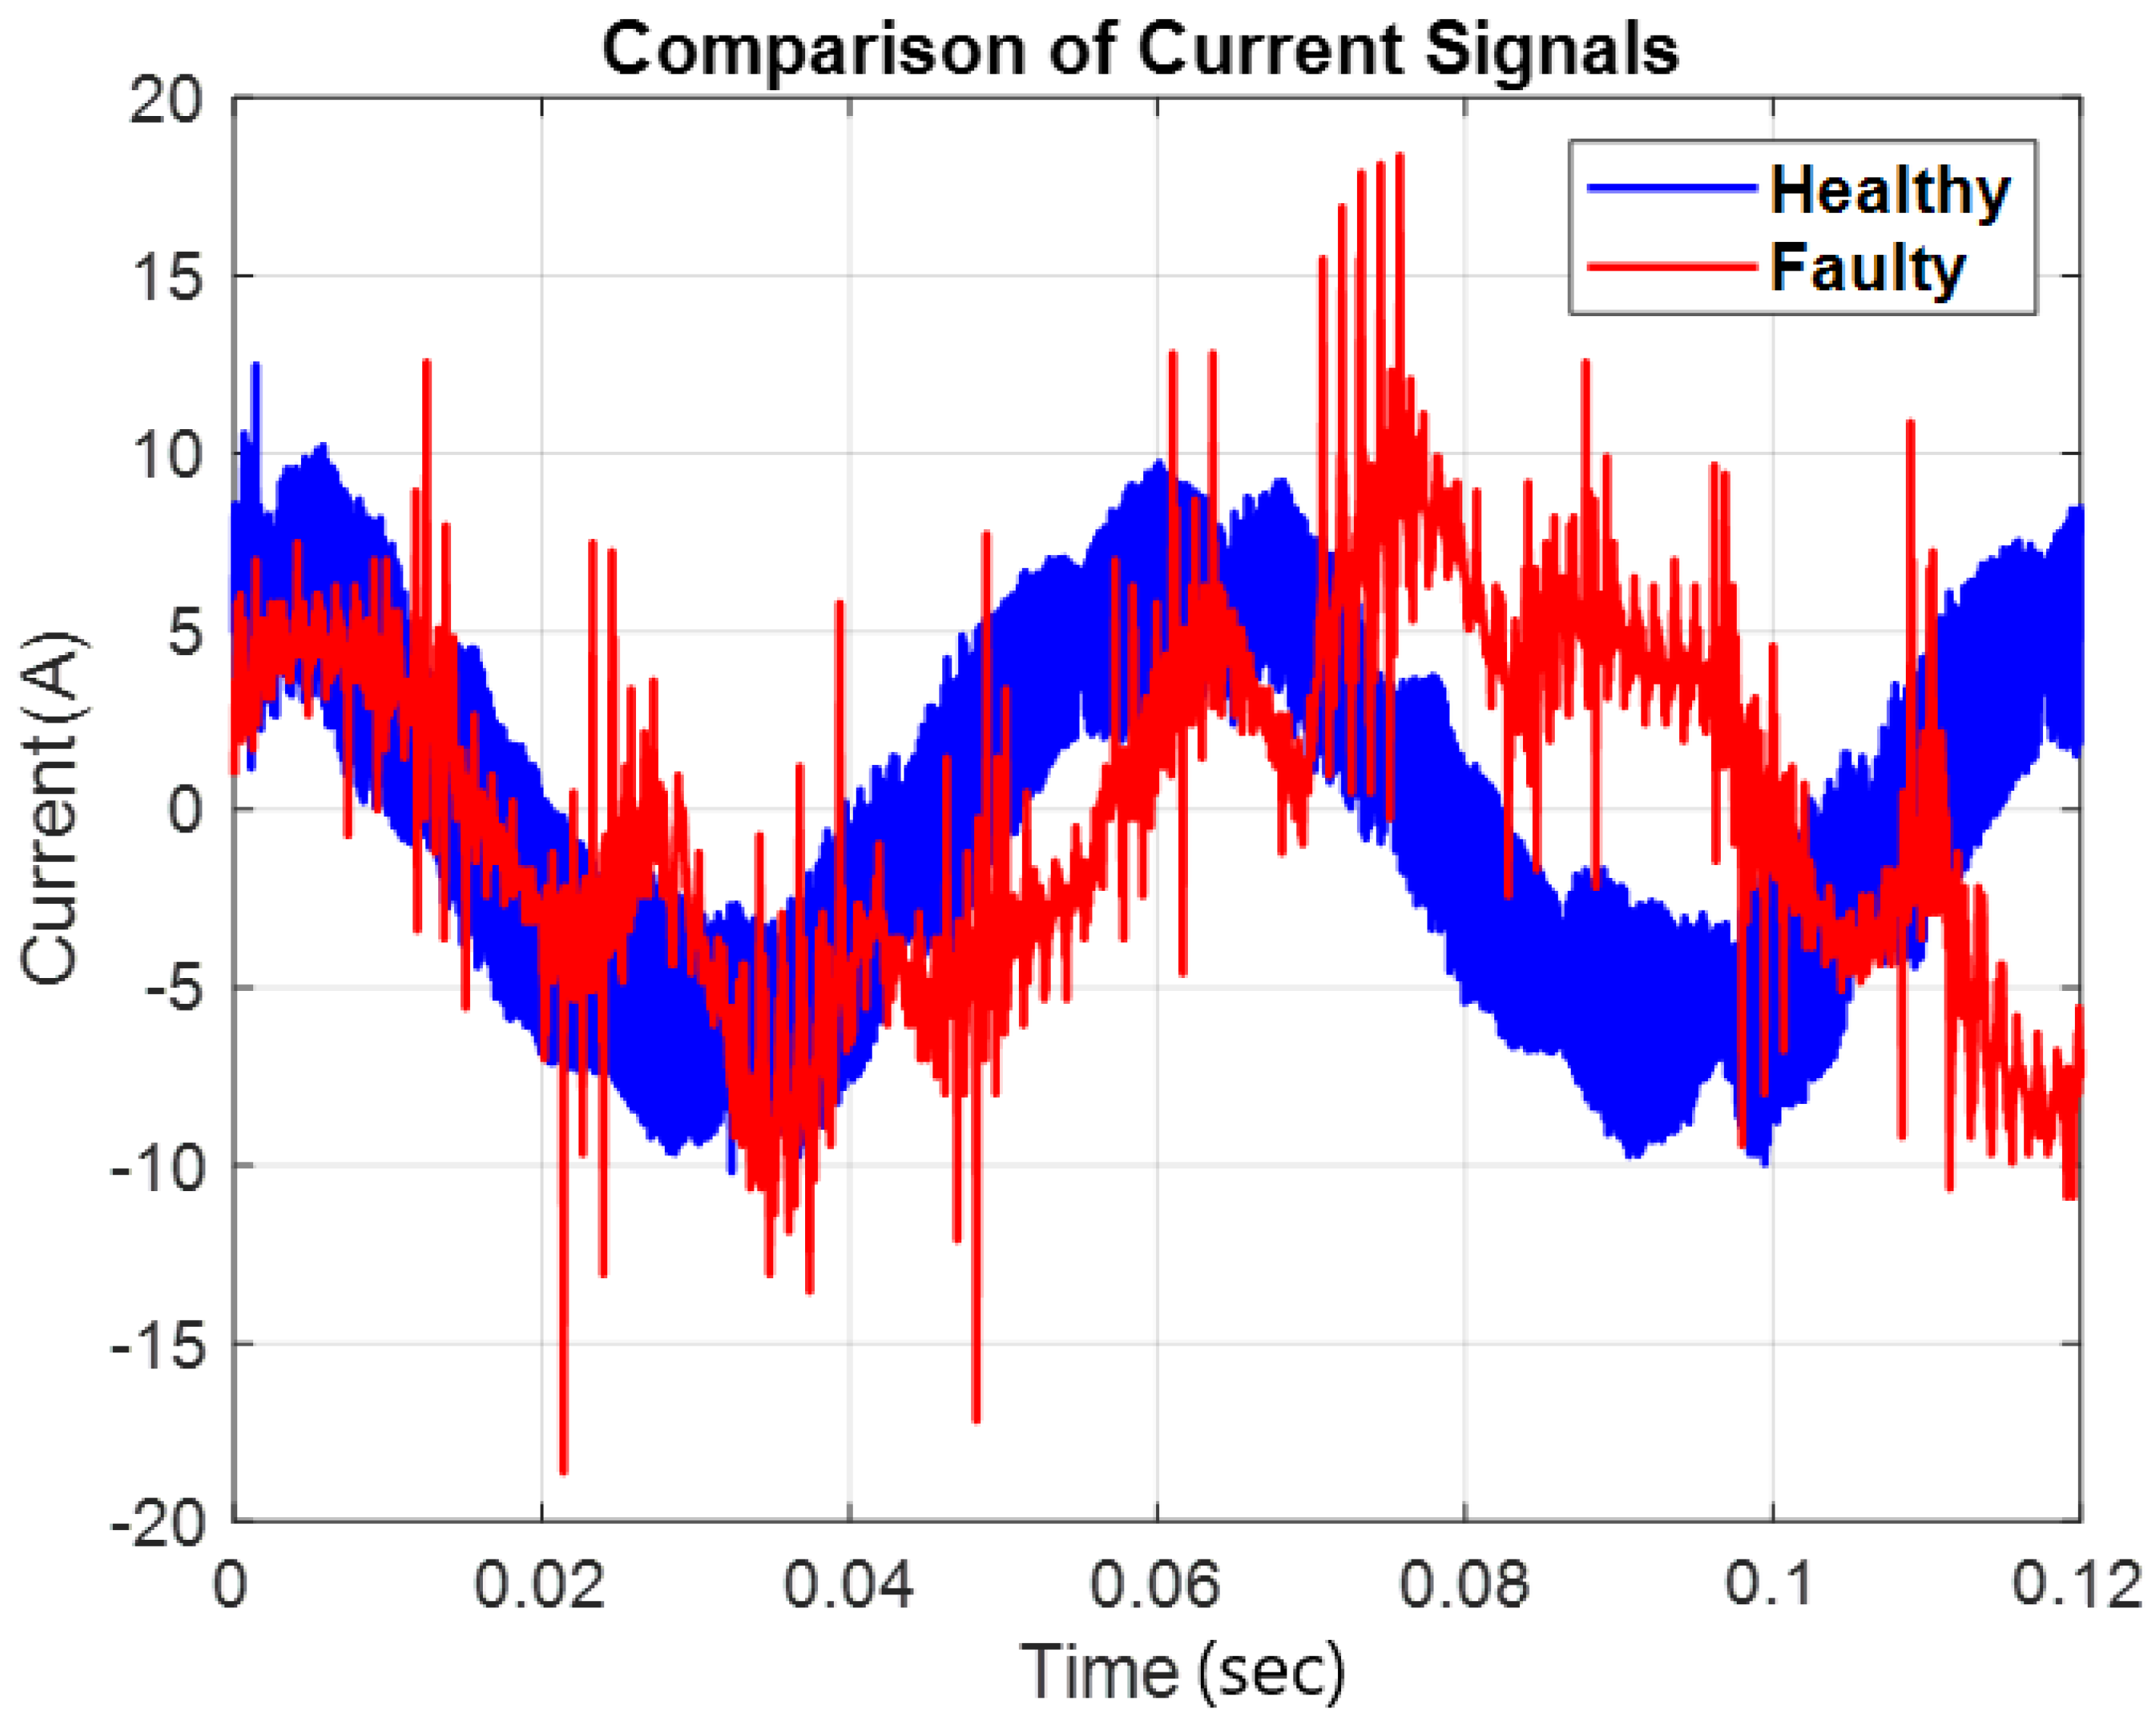
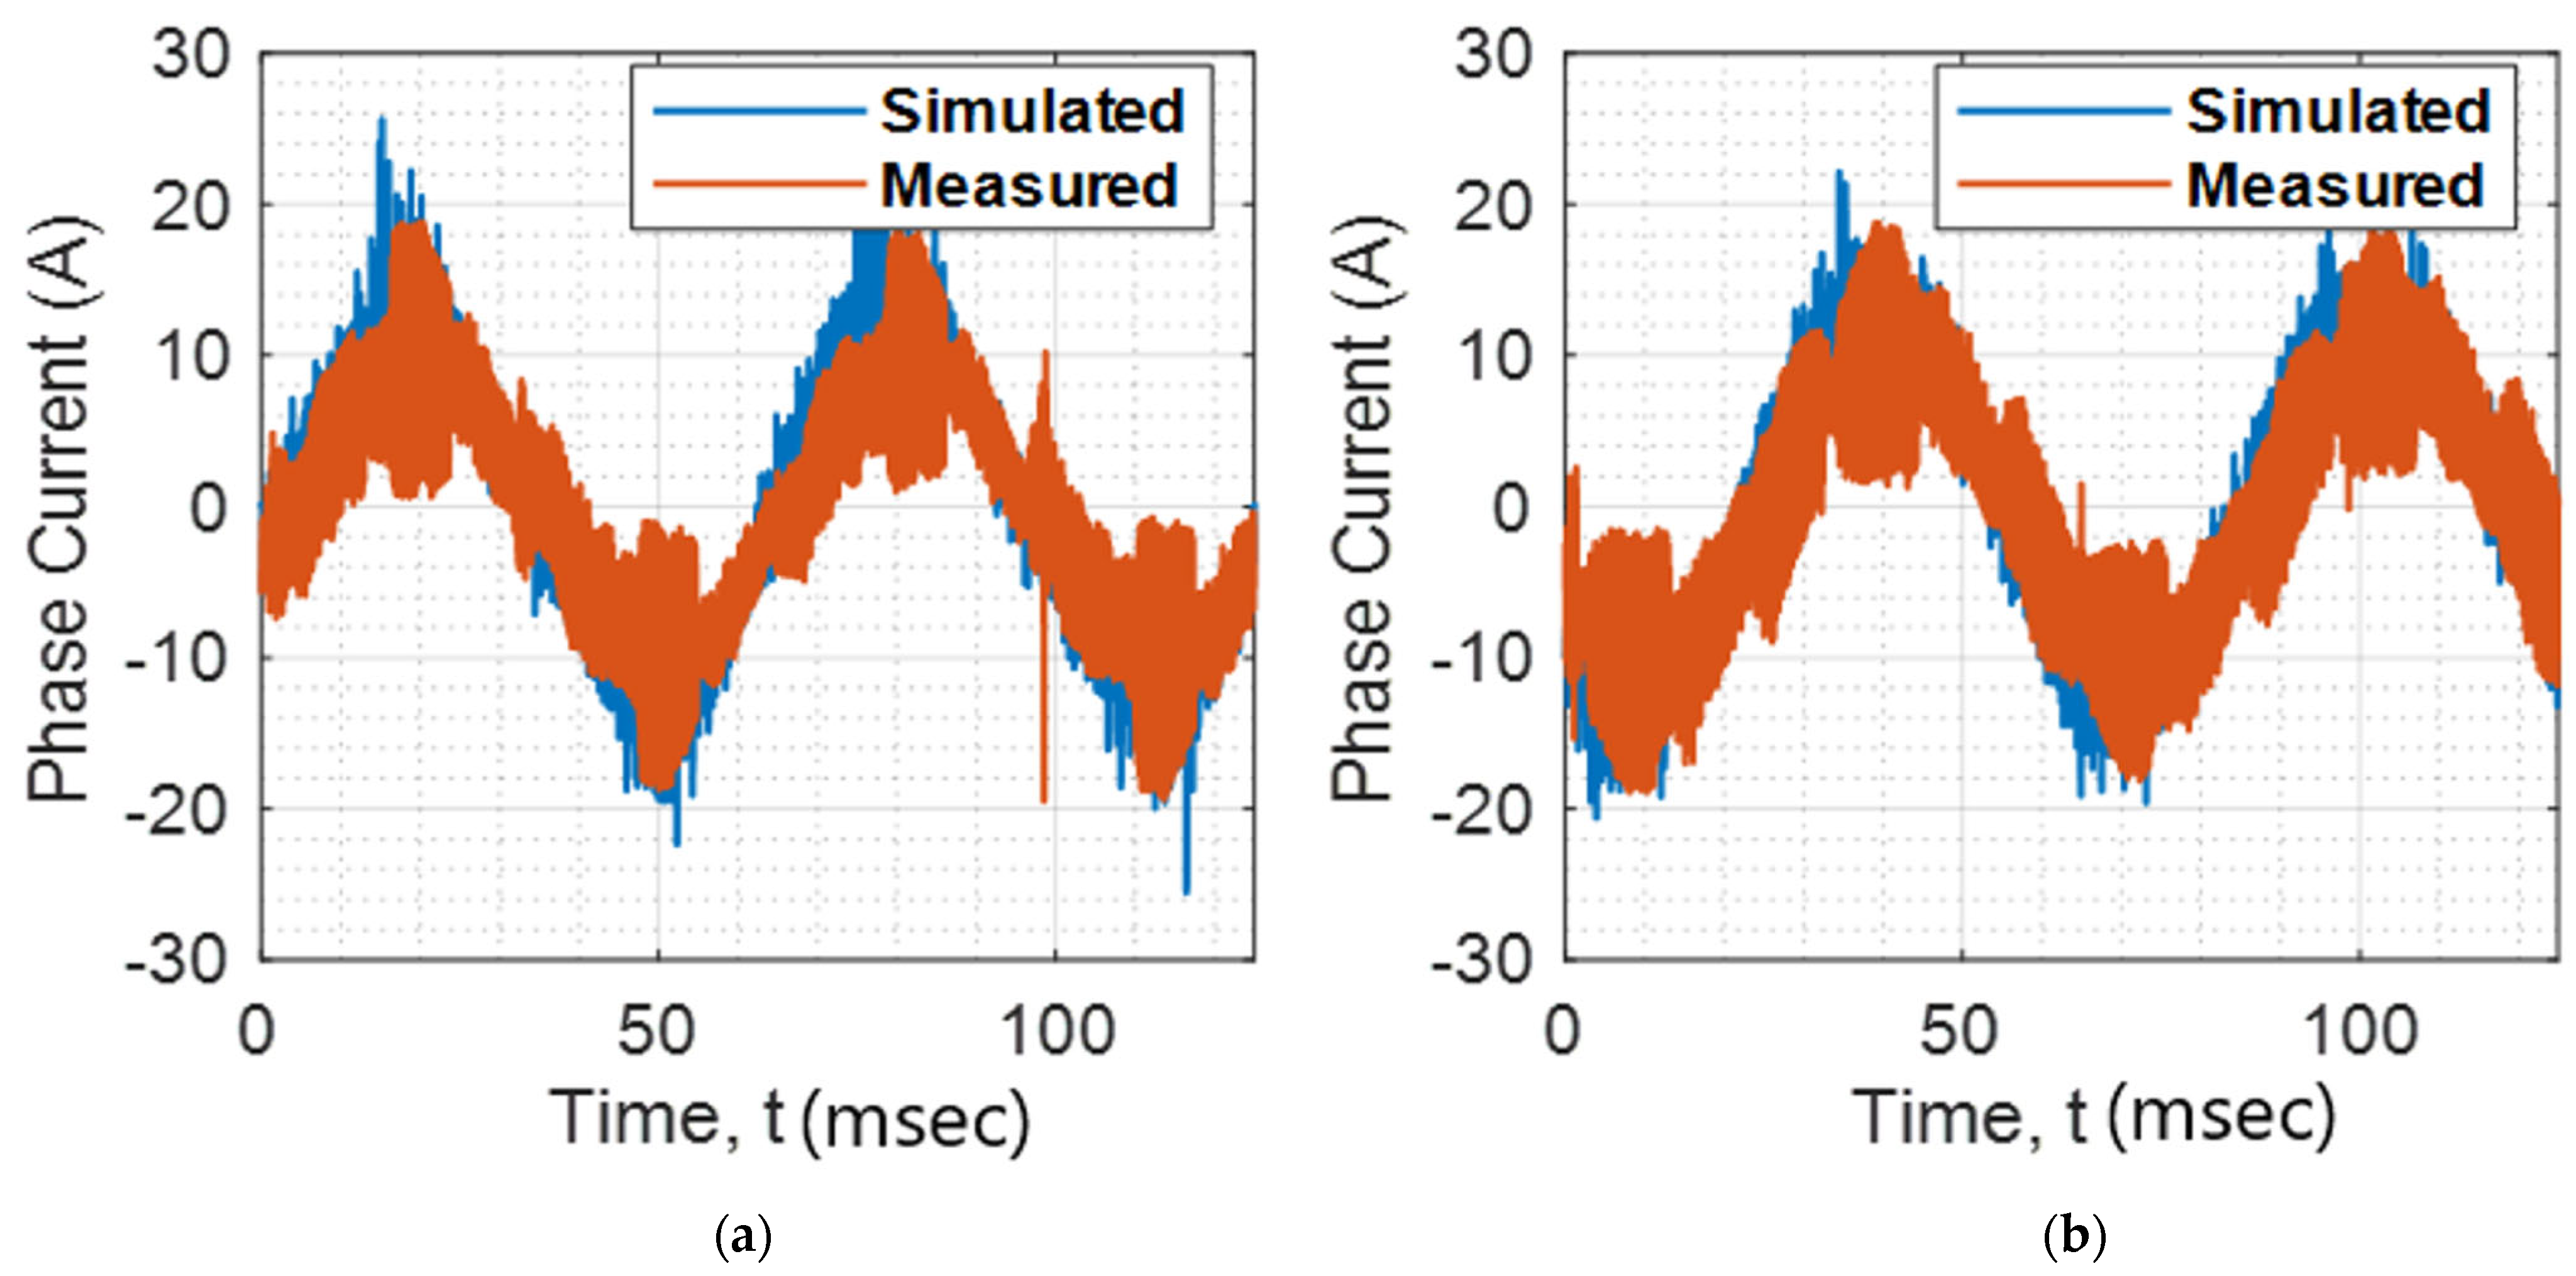
Figure 14a,b show the comparison between measured and simulated current waveforms for both healthy and faulty motor conditions, using switching frequencies of f₁ = 12 kHz and f₂ = 5 kHz. The results demonstrate good agreement between experimental and simulation data.
The comparative current plots in
Figure 15a,b illustrate the limits and loads the motor can handle under various operating conditions. The highest current intensity occurs at full load during ascent and under no load during descent. For half the rated load, approximately equal current and power levels are observed in both directions, indicating that the motor primarily covers mechanical and core losses. Additionally, at load levels around zero active force, such as 200 Kg to 300 Kg, the current intensity does not exceed 5.5 A (rms) during either ascent or descent, confirming that the elevator operates safely under these conditions.
The maximum effective mass acting on the elevator motor is 225 kg, independent of the direction of movement. This value results from adding the nominal load (450 kg) and the empty cabin weight (495 kg), then subtracting the counterweight, which equals the cabin plus half the nominal load (720 kg). This configuration reflects the worst-case loading scenario. By multiplying this mass by the nominal acceleration of 0.19 m/s2, the total force exerted on the motor during acceleration is calculated to be approximately 42.75 N.
3.3. Condition Monitoring and Fault Detection in a PMSM
The proposed methodology is based on continuous monitoring and data acquisition for both the motor and inverter, which are crucial for the uninterrupted operation of the elevator. Through the digital platform and experimental setup, a dynamic PMSM model was developed (shown in
Figure 16) with validated accuracy capturing key characteristics of both the inverter and the motor. Utilizing vector control in the Simulink/Matlab R2023a environment enabled effective PMSM operation modeling [
40].
Figure 17a,b illustrate the inverter output current waveforms and motor electrical currents compared with simulation results, demonstrating convergence.
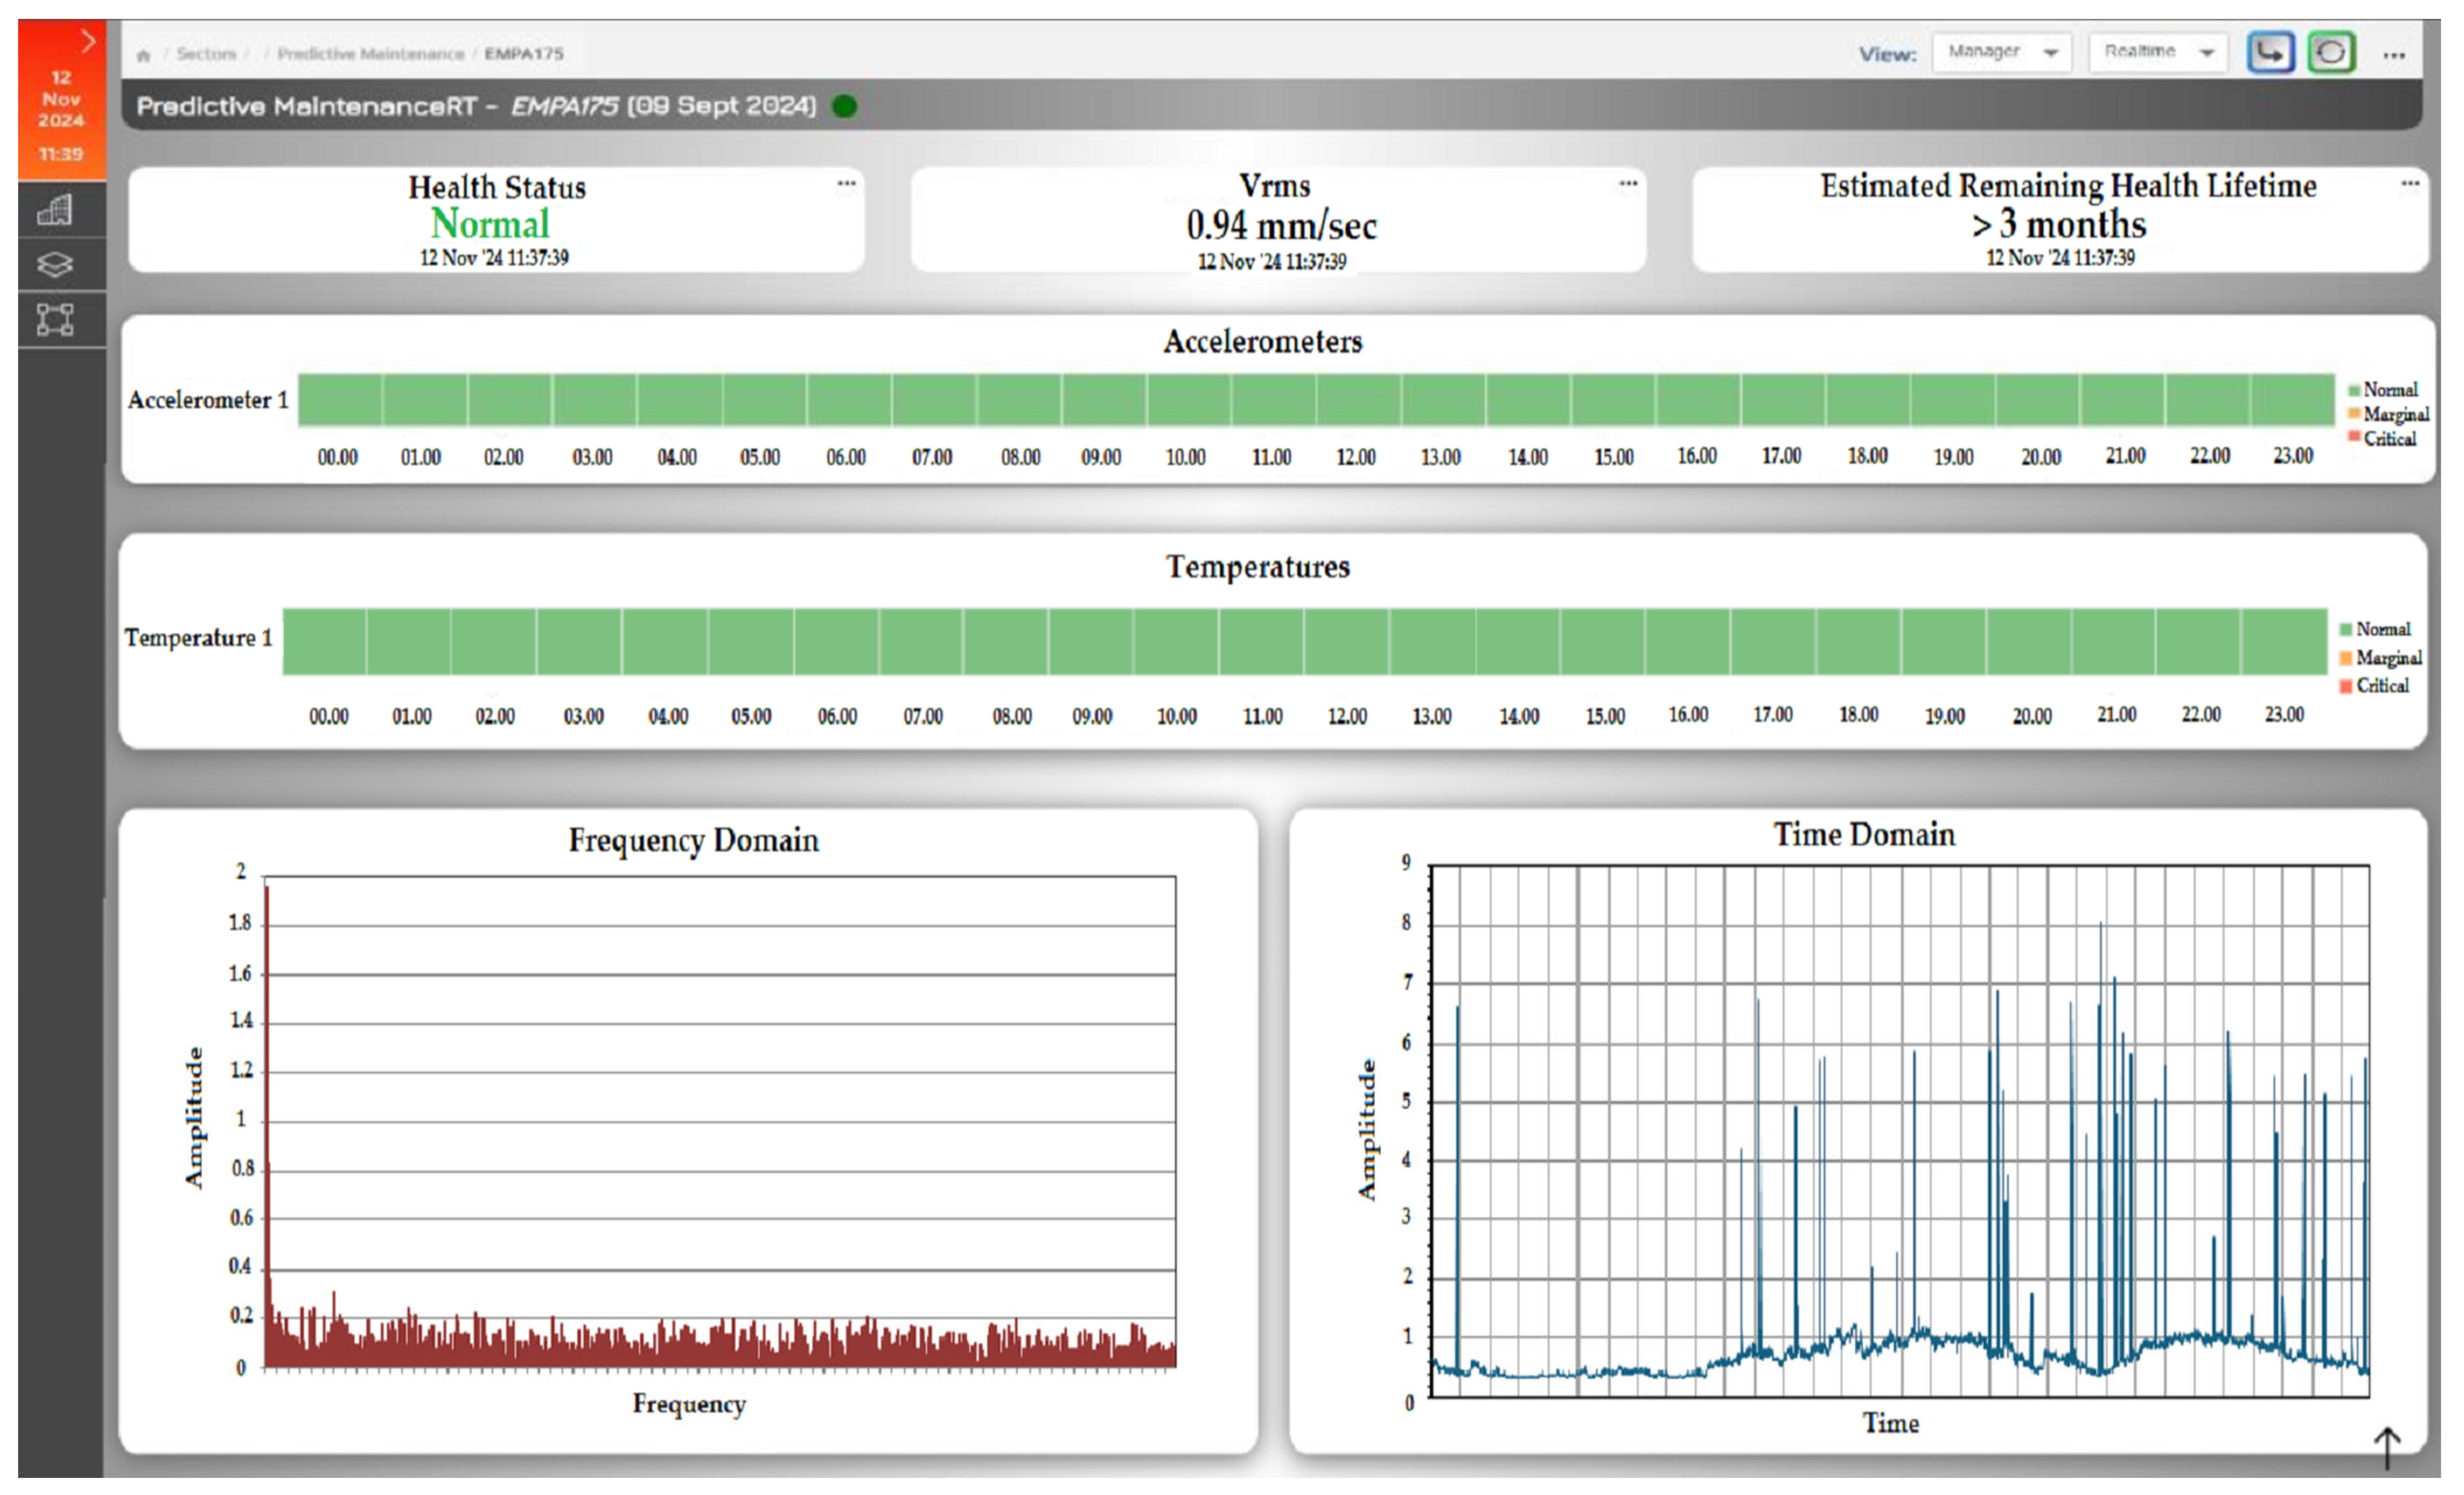
Continuous heavy loading in elevators can lead to significant mechanical issues affecting the drive system. Increased pulley friction and high inertia are major causes of eccentricity and bearing wear. The designed digital platform is based on ISO 20816-3 standards and uses vibration signal processing. According to
Figure 18, the motor’s operating condition, estimated health status, and high RMS speed values during operation are presented. To facilitate diagnosis, a color-coded scheme distinguishes different operational states.
Based on the predictive maintenance results, the “healthy” state is classified as normal, indicating acceptable equipment operation. The vibration velocity measurement of 0.94 mm/s () classifies the motor as “Newly Commissioned Machinery” requiring no immediate intervention. Considering temperature variation, the estimated remaining service life is over three months, a highly positive indicator of machine functionality.
To test the model’s accuracy, statistical faulty data from PMSMs were used.
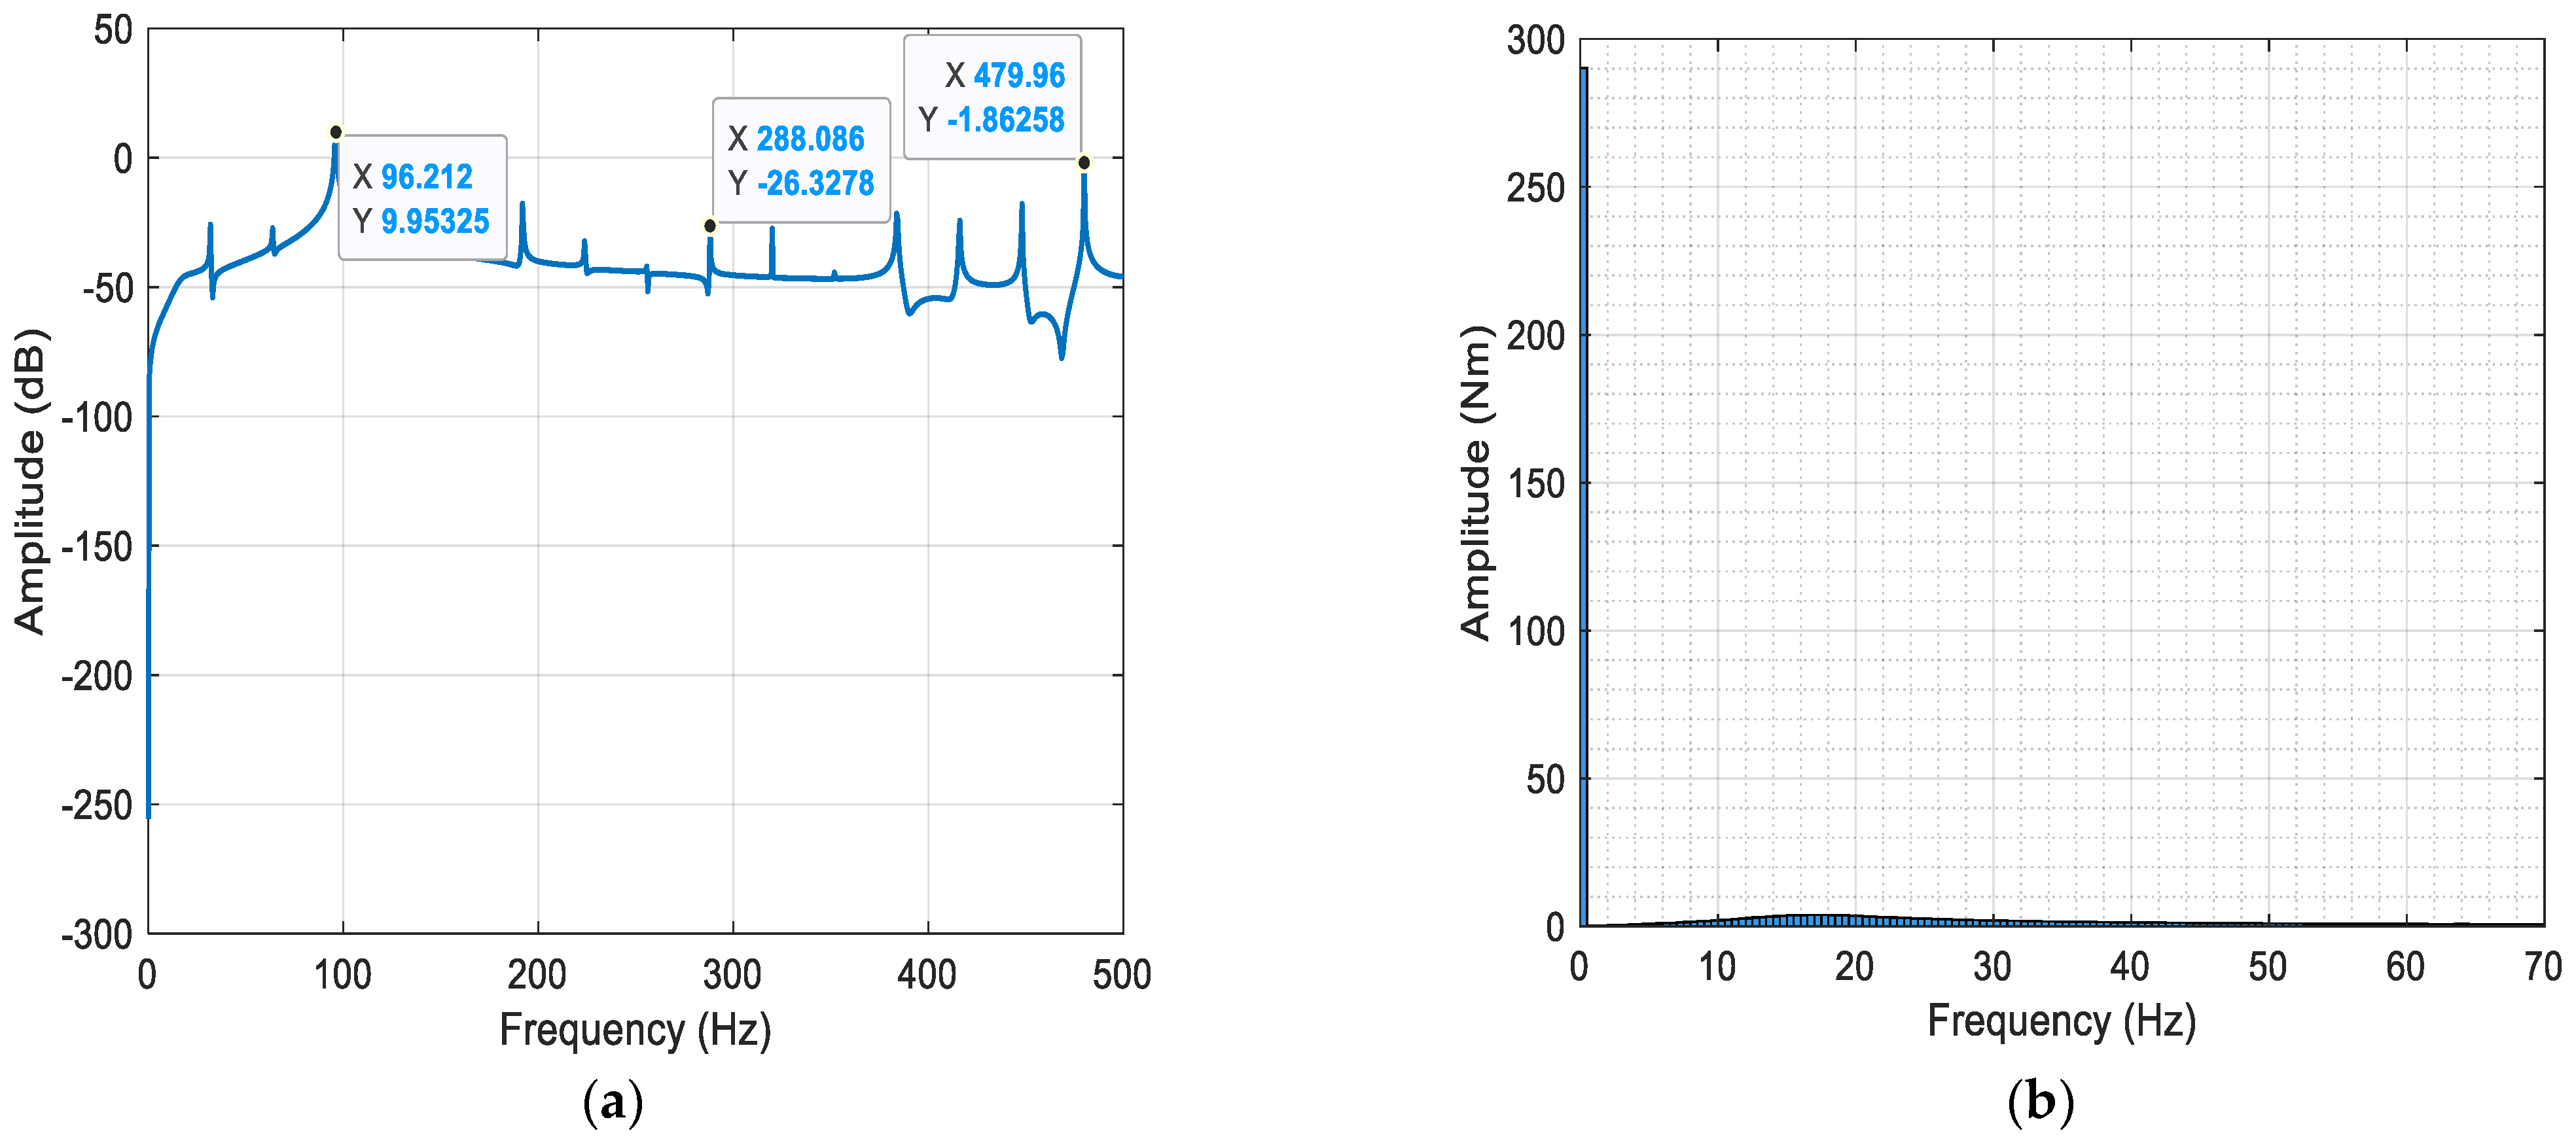
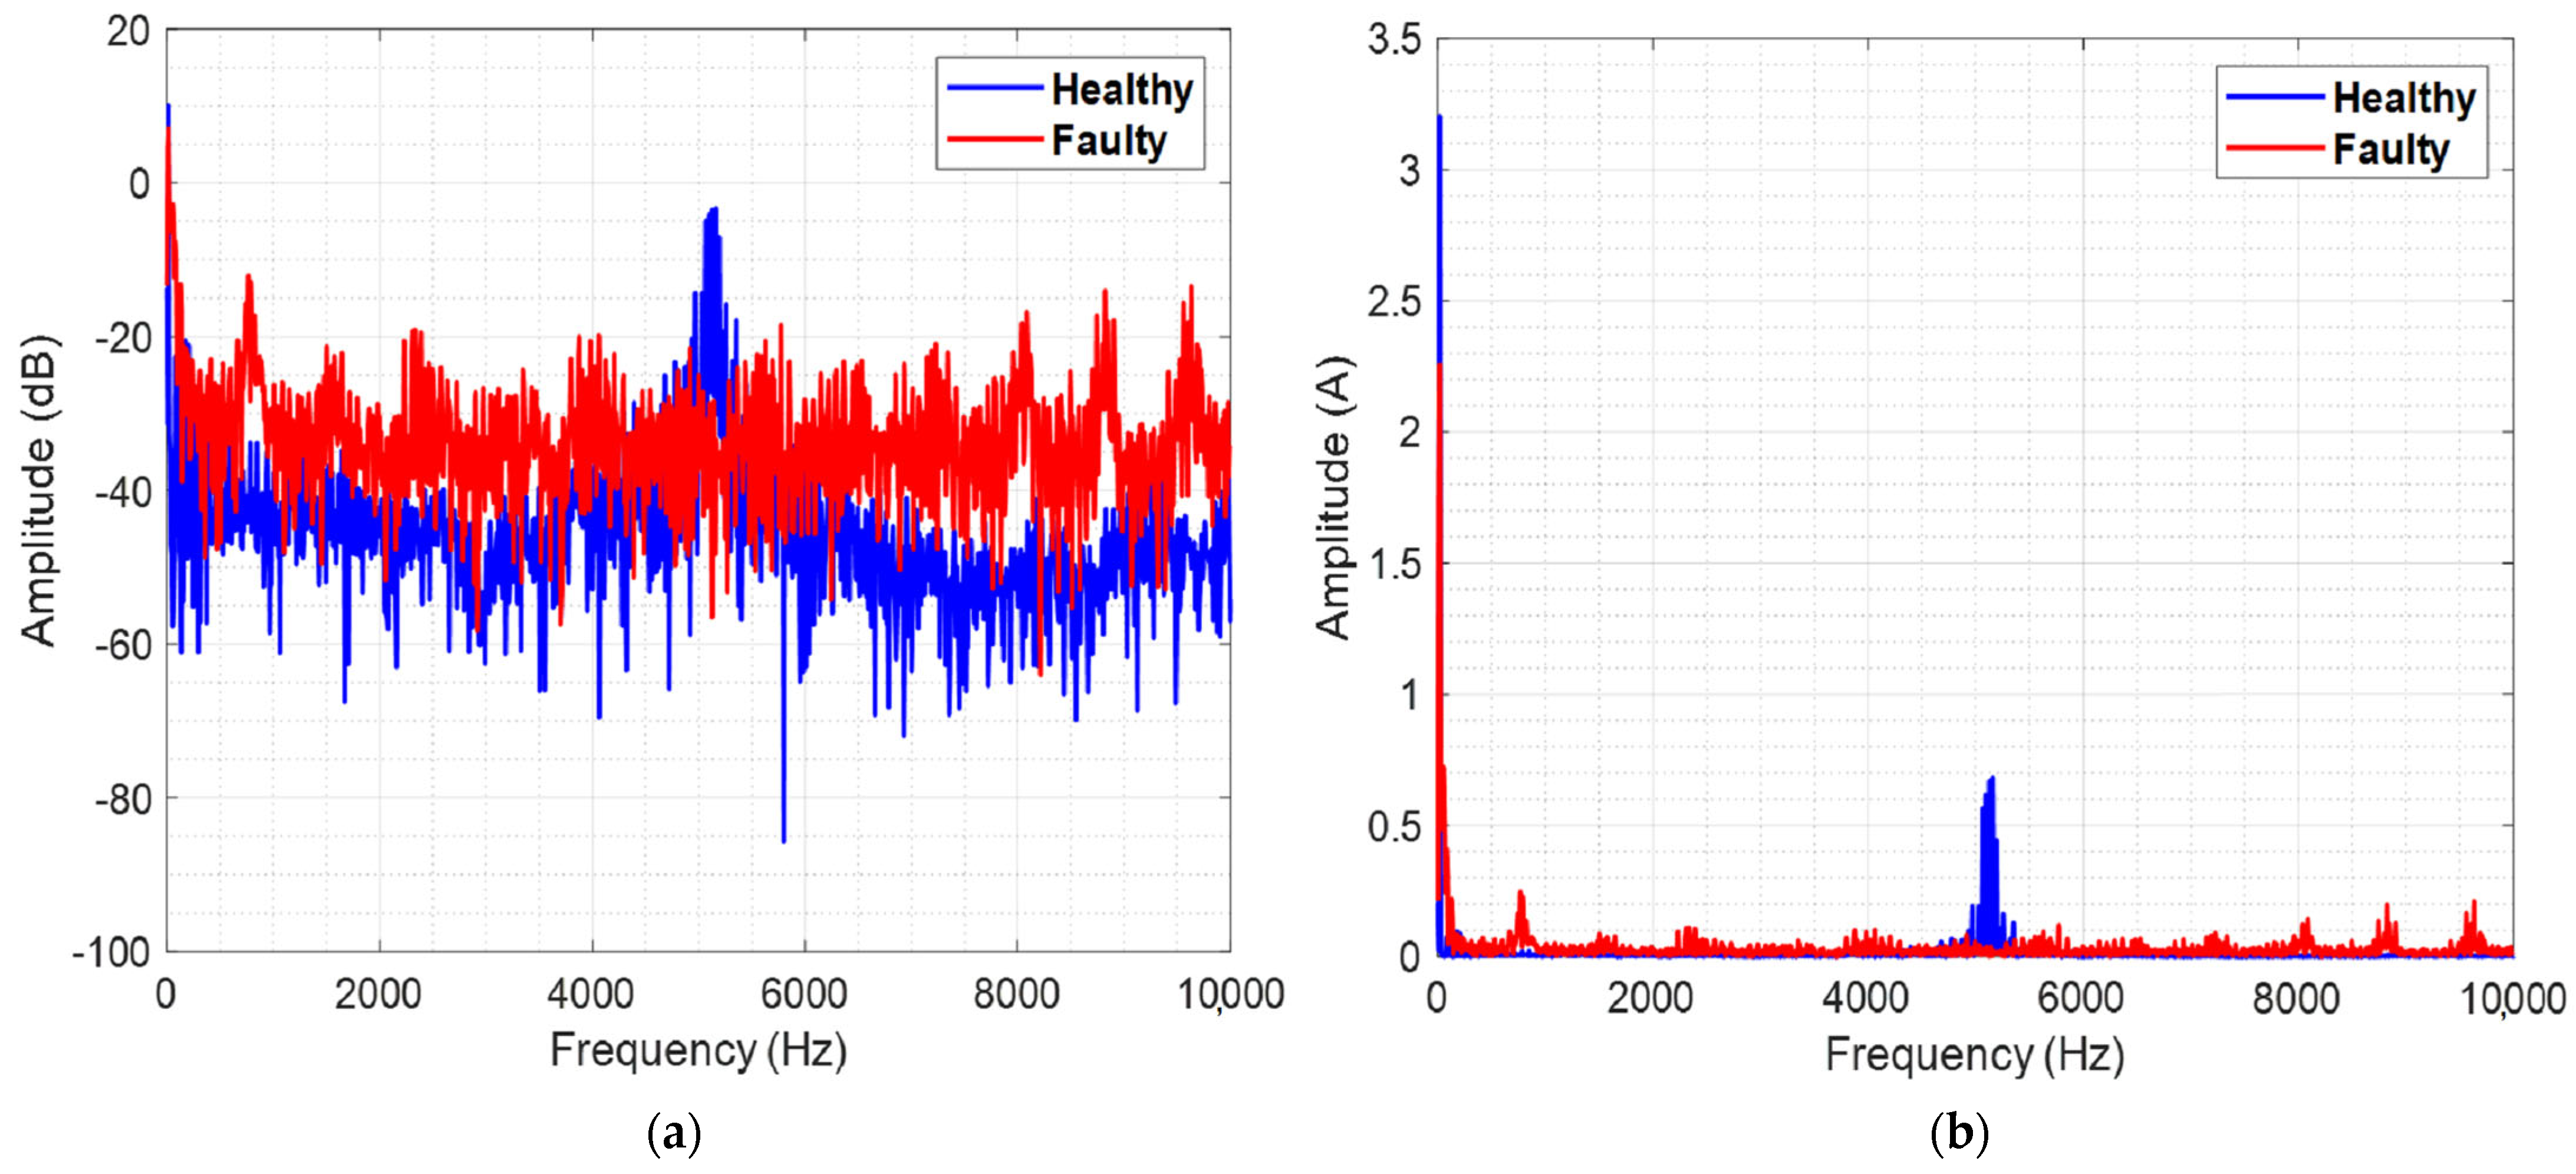
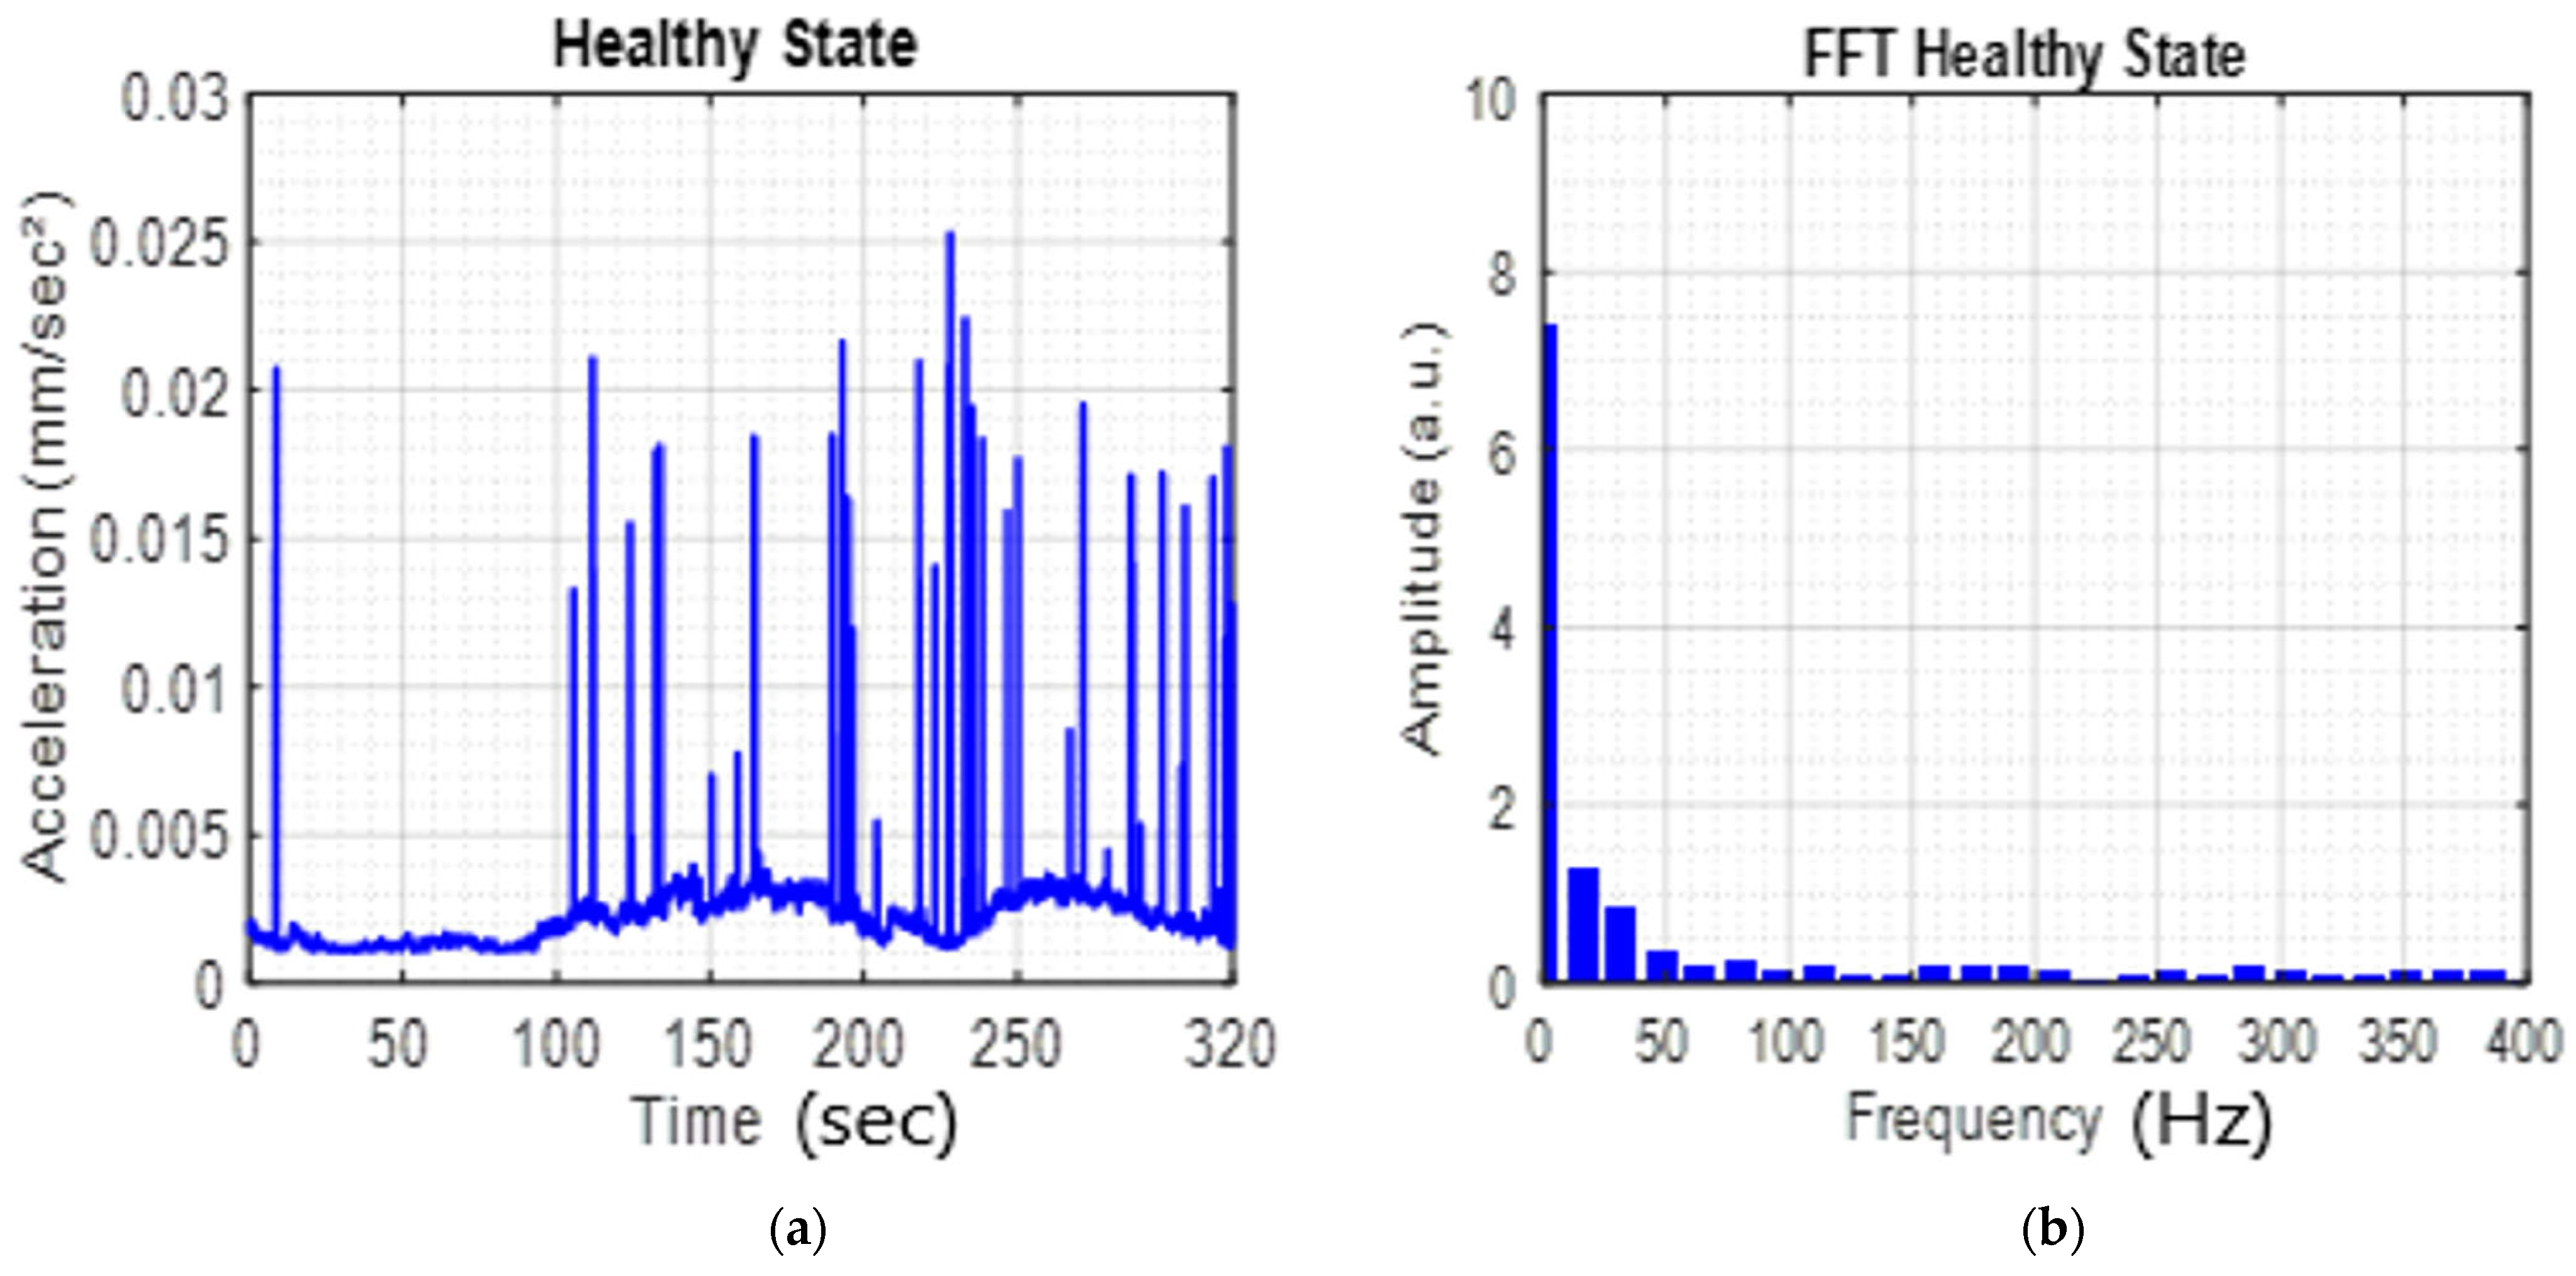
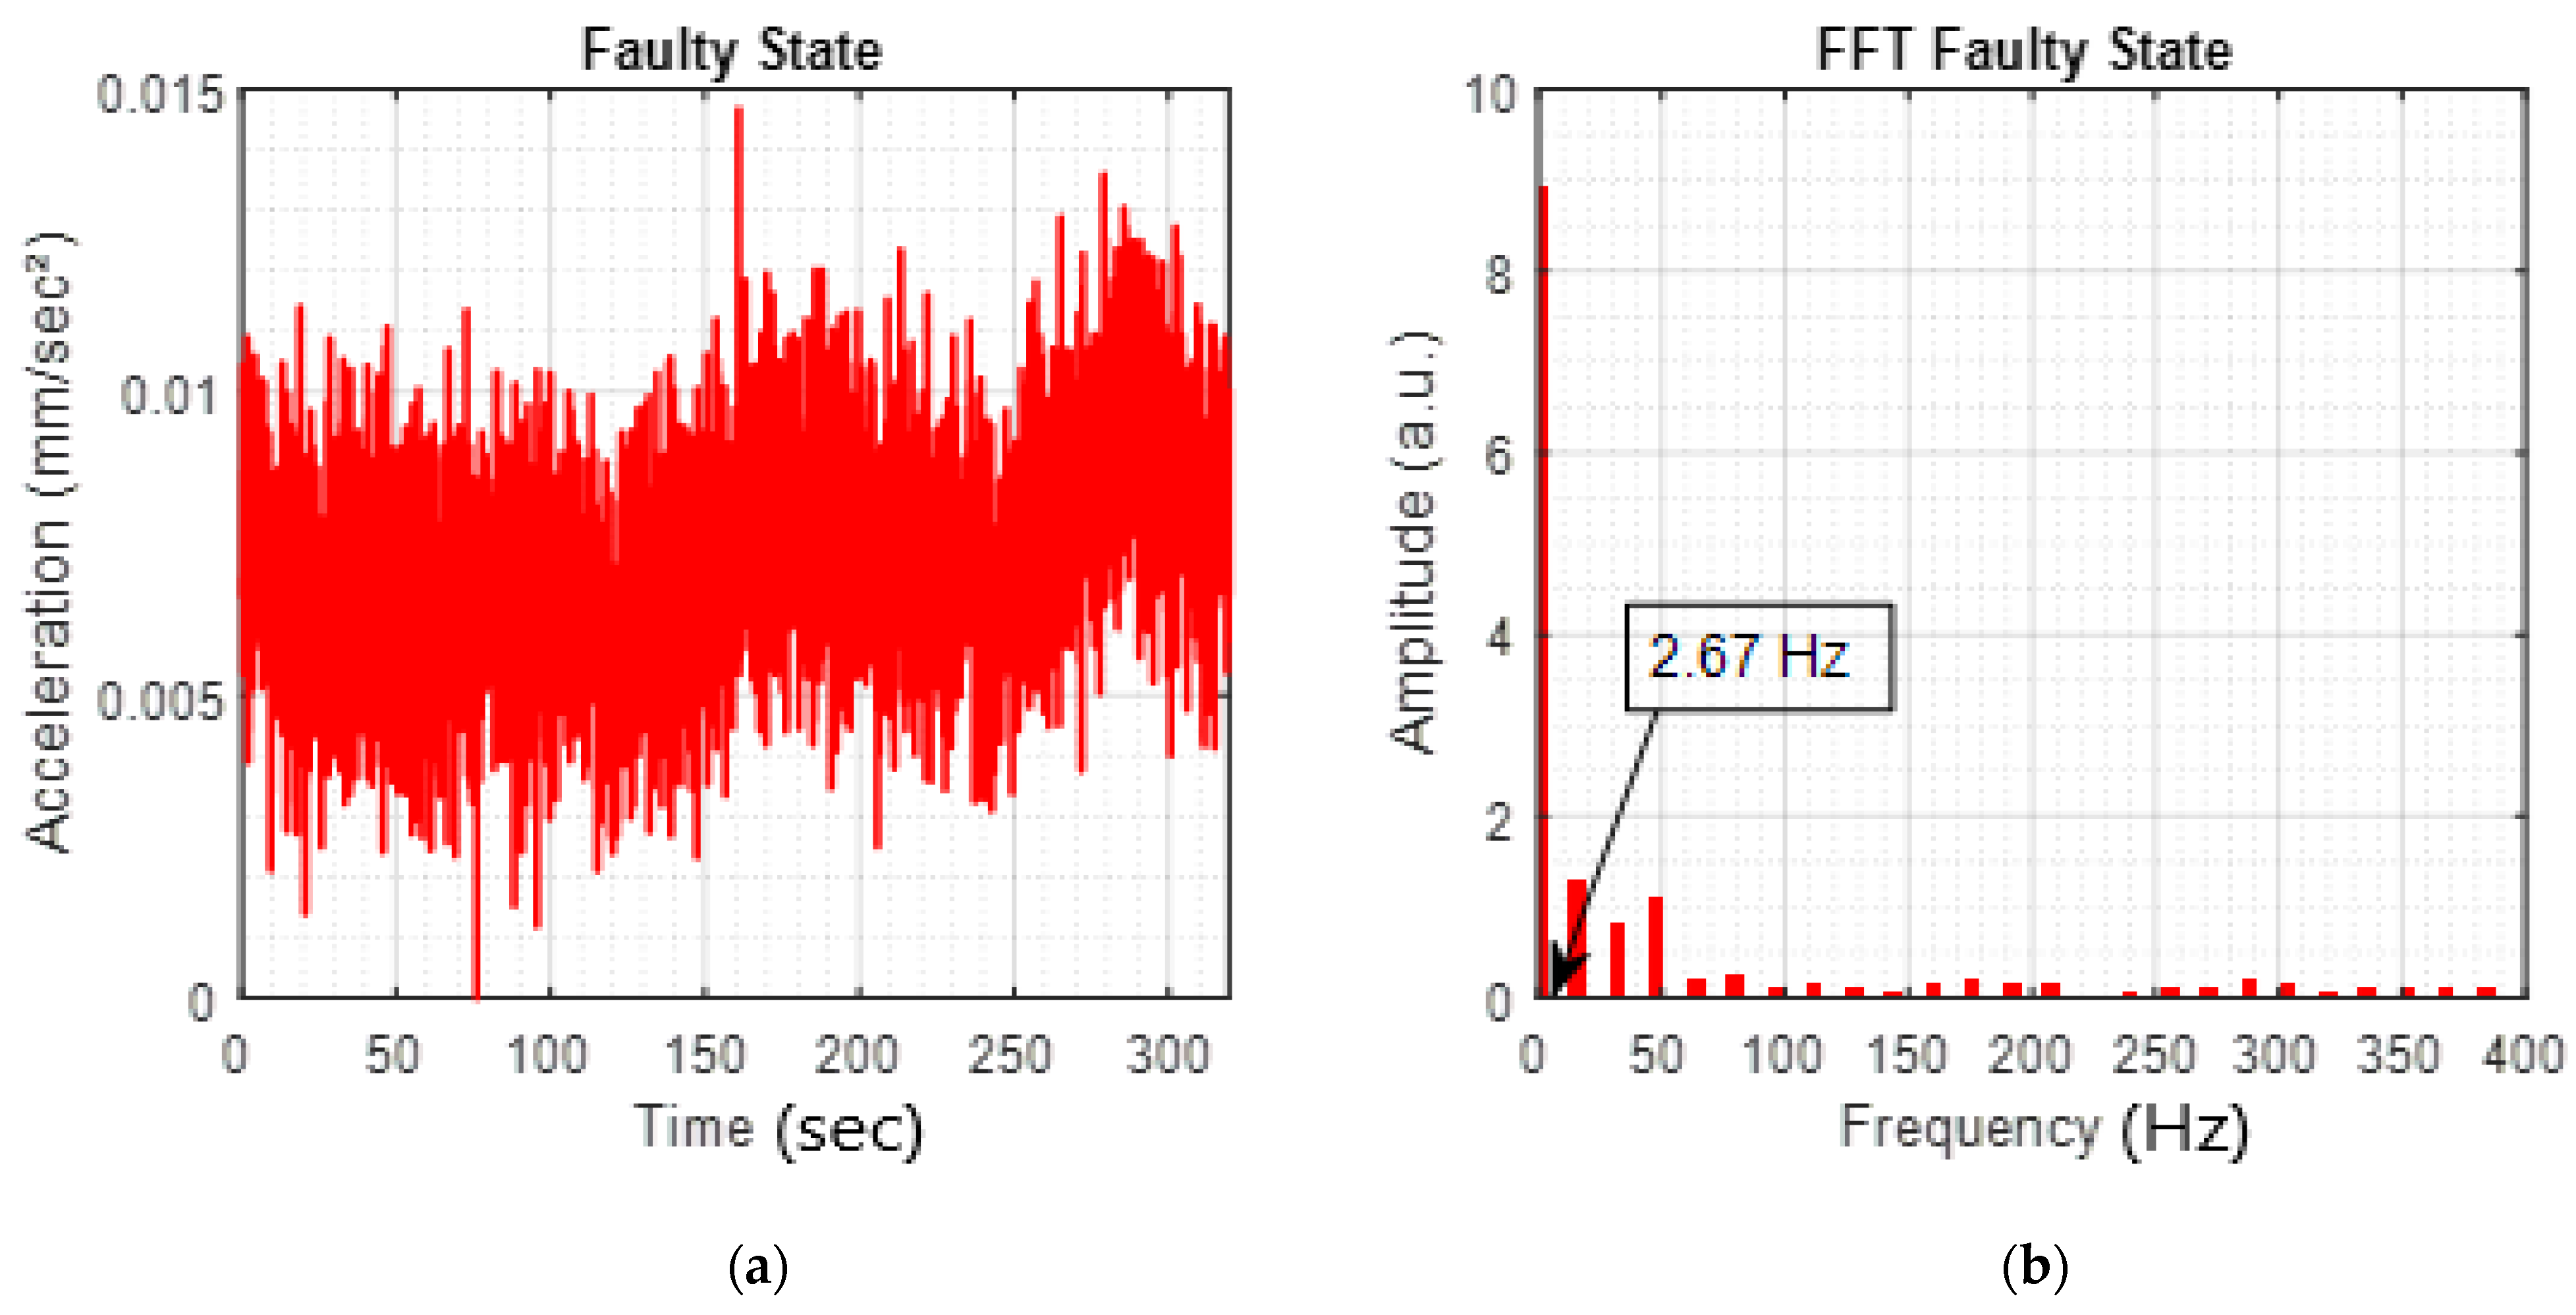
Figure 19a,b and
Figure 20a,b show healthy and faulty vibration signals along with FFT analyses, which help identify the frequencies associated with faults. The faulty signal has lower amplitude compared to the healthy one but displays strong motor vibration fluctuations. The RMS value of 1.42 mm/s corresponds to “Unrestricted Operation”, a Marginal condition requiring maintenance within one month.
Harmonic analysis of the faulty signal provides key insights into fault occurrence. A distinct peak at 2.67 Hz is associated with eccentricity, indicating bearing wear, supported by additional peaks at 32 Hz (2d harmonic), 48 Hz (3rd harmonic), and 96 Hz (6th harmonic). Notably, the absence of high frequencies (>200 Hz) suggests that the fault is at an early stage and corrective action should be taken to prevent severe secondary damage.
3.4. Proposed Methodology for Elevator Fault Prediction
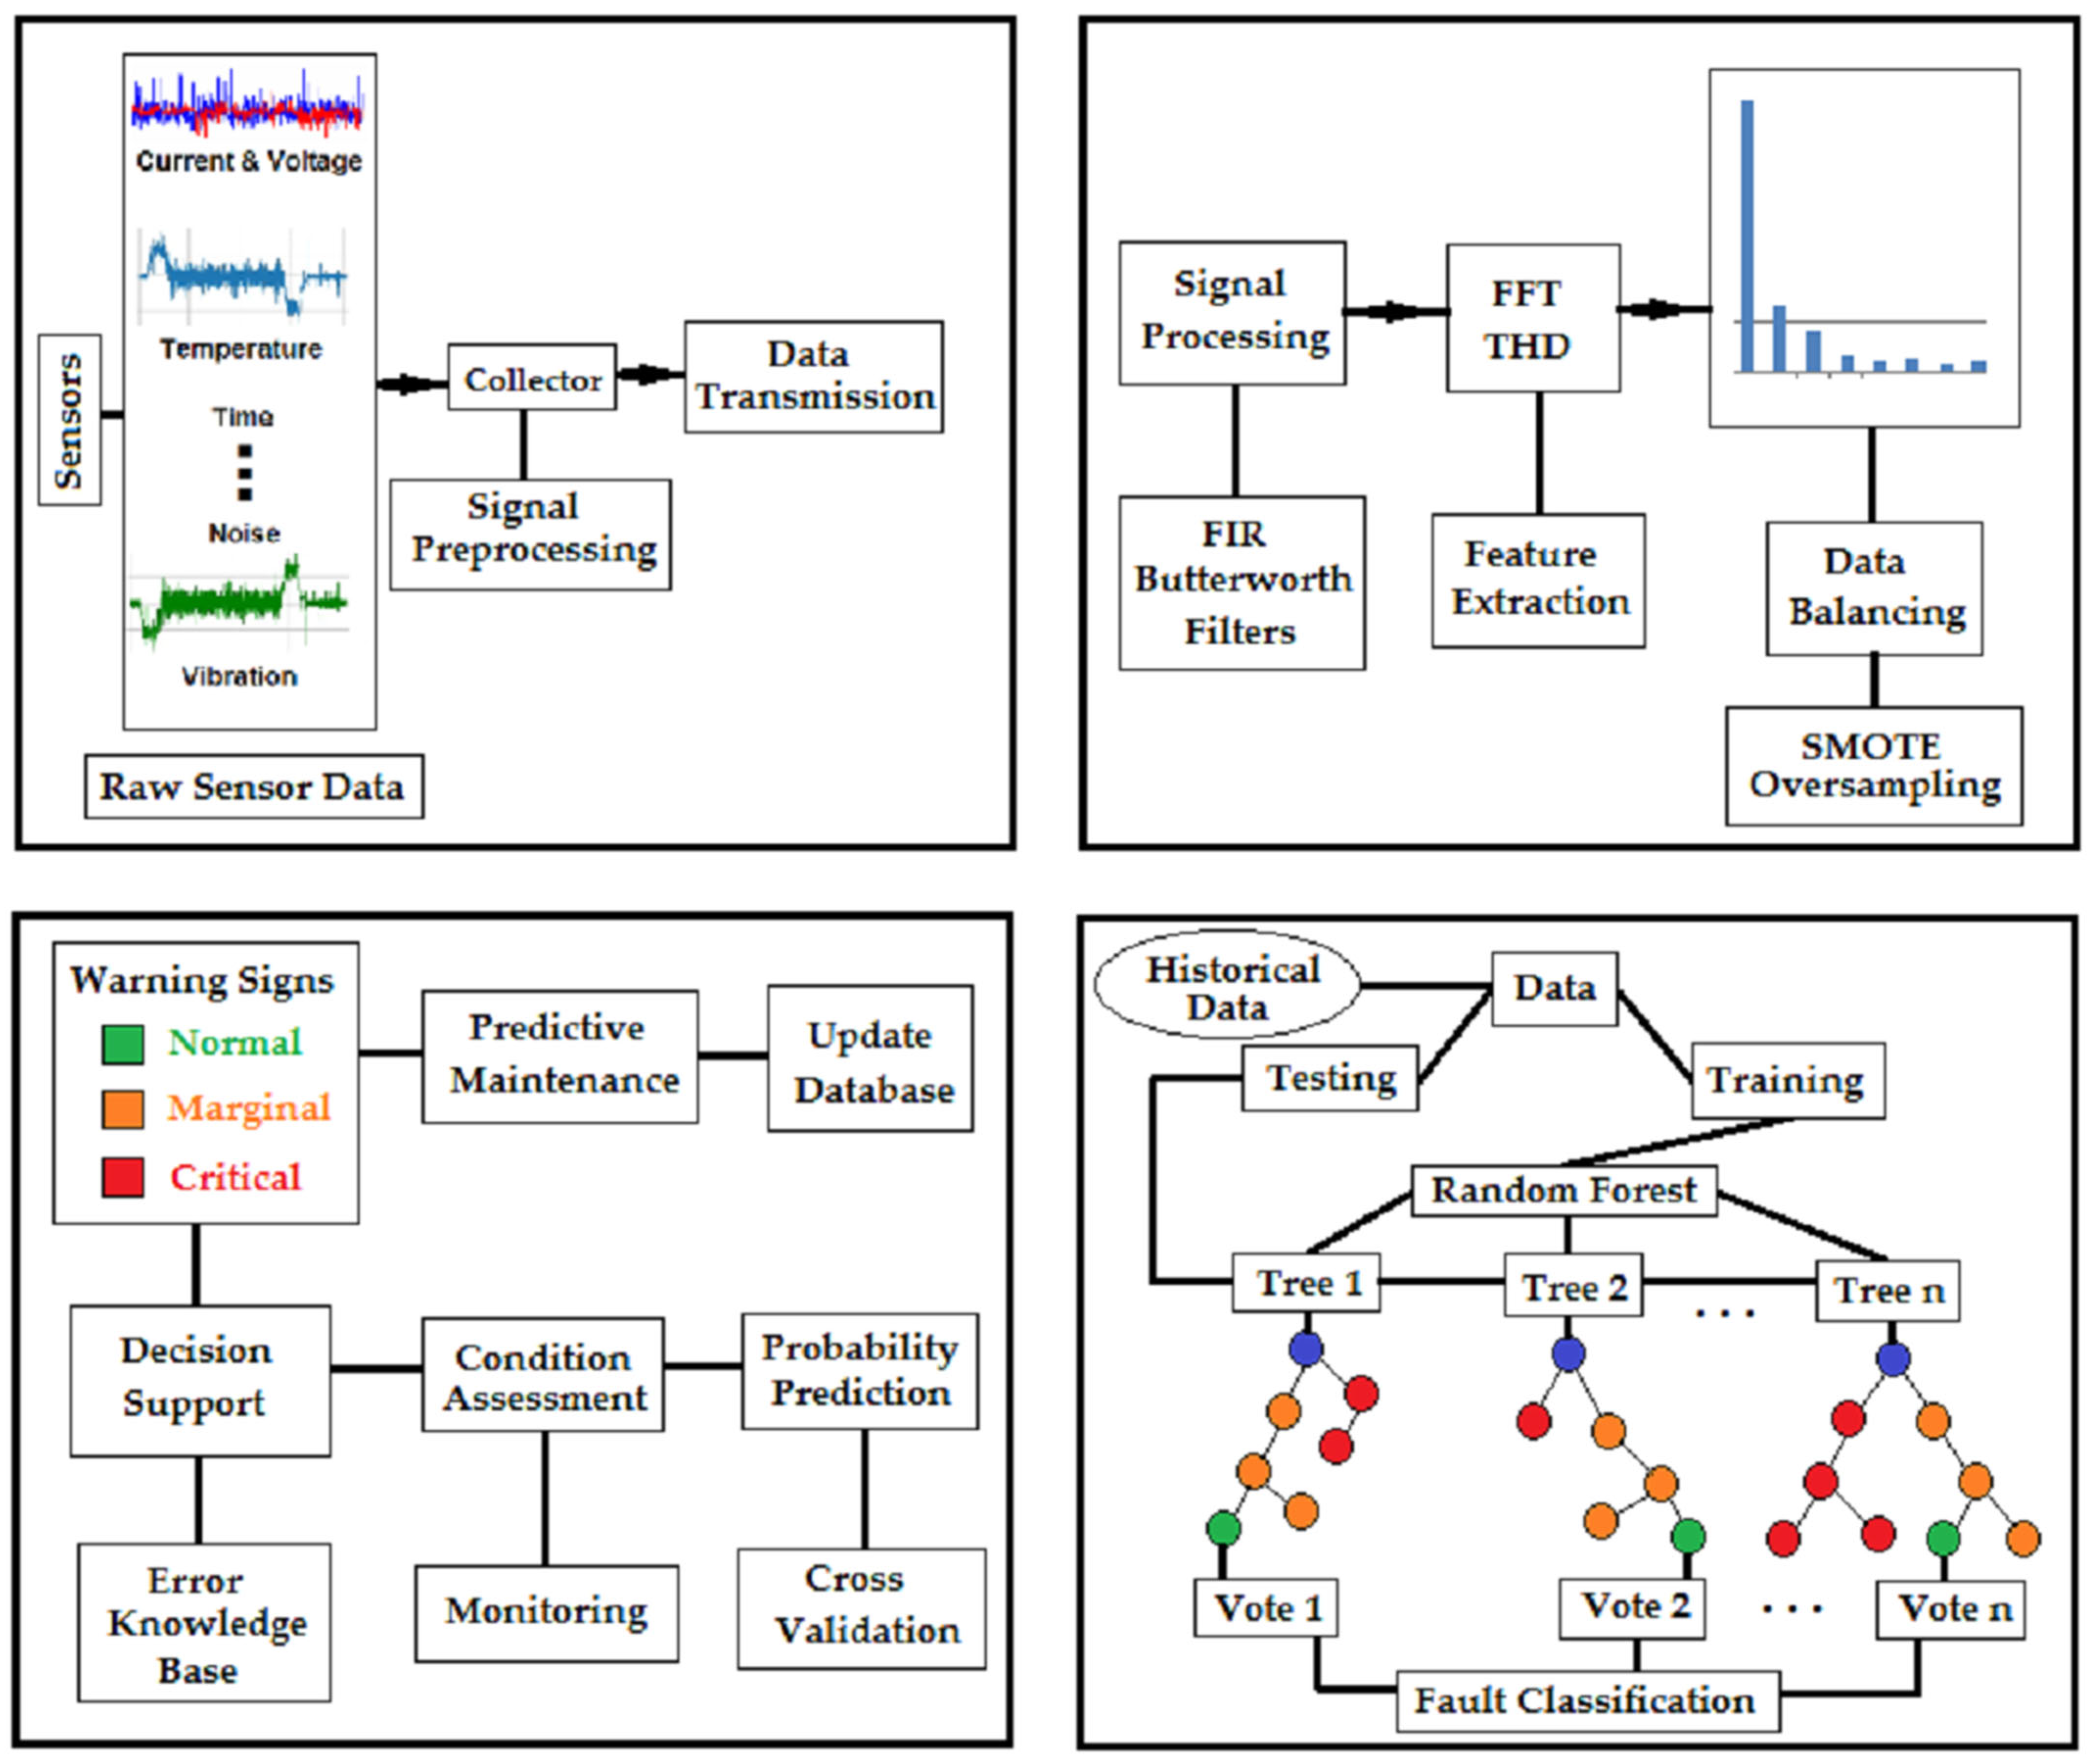
The proposed methodology concerns elevator fault prediction focusing on the electric motor. It incorporates sensor data, preprocessing, feature extraction, and classification based on machine-learning model development to support an effective decision-making mechanism. The process is illustrated in
Figure 21 and includes four interconnected modules, ensuring comprehensive monitoring and fault prediction.
The first stage of the methodology involves collecting data from multiple sensors placed at different locations on the machine. Once collected, the data are transmitted to a central processing unit via a secure communication system. Preprocessing of the signal is then applied using appropriate Finite Impulse Response (FIR) and Butterworth filters to eliminate high-frequency noise and any fluctuations. The preprocessing stage utilizes techniques such as Fast Fourier Transform (FFT), Total Harmonic Distortion (THD), and statistical analysis to extract and differentiate key characteristics of healthy and faulty motor operation.
The Butterworth filter, used for signal preprocessing, was designed to attenuate high-frequency components, while preserving essential low-frequency information. Its mathematical formulation is presented in Equation (10). Application of the Butterworth filter, as illustrated in
Figure 22, highlights the smooth sinusoidal waveform of the healthy current. The filter response confirms that the current is confined to low frequencies, indicating stable and normal operation. Conversely, the faulty signal exhibits strong deviations and distortions, pointing to abnormal motor winding behavior, reflected by the presence of higher frequencies.
A machine-learning algorithm was developed using the Random Forest (RF) technique. This choice was based on the ability of RF to handle high dimensional data and deliver reliable predictions even under strong data noise. The process includes three phases: data segmentation, model training using selected features, and a voting mechanism to classify the input data. The final stage involves fault prediction, where each data segment processed by the RF algorithm outputs a failure probability, enabling continuous monitoring of the motor’s operational status and generating appropriate preventive maintenance alerts.
The accuracy of the model’s predictions is significantly influenced by several factors, including the quantity of available data across all operating states, the effectiveness of signal filtering, and the quality of model training. The reliability of the proposed methodology in accurately classifying current signals and predicting motor health conditions depends on the volume and diversity of the training data, which must adequately represent both normal and faulty operating scenarios. To support this, the monitoring platform was designed for continuous data acquisition at varying current levels under both healthy and degraded conditions. Furthermore, voltage measurements were also collected in parallel to capture potential variations that could influence current behavior, thereby enabling a more robust and holistic analysis.
To train and evaluate the proposed Random Forest classifier, the collected dataset was divided into training and testing sets using an 80/20 stratified split. This ensured that all three machine states (Normal, Marginal, and Critical), were proportionally represented in both sets. The 80/20 split was chosen to provide sufficient training samples while preserving a reliable testing subset for performance validation. To improve robustness and avoid overfitting, five-fold cross-validation was performed during training. Performance metrics were averaged across folds and used for final reporting.
Although the dataset was obtained from a single elevator installation, the system was evaluated under varying operational scenarios, including ascending and descending motion at 25%, 50%, 75%, and 100% load levels, with injected electrical and mechanical faults. This variety of conditions ensures a rich data structure but also motivates future work involving datasets from different elevators and environments to enhance generalization capabilities.
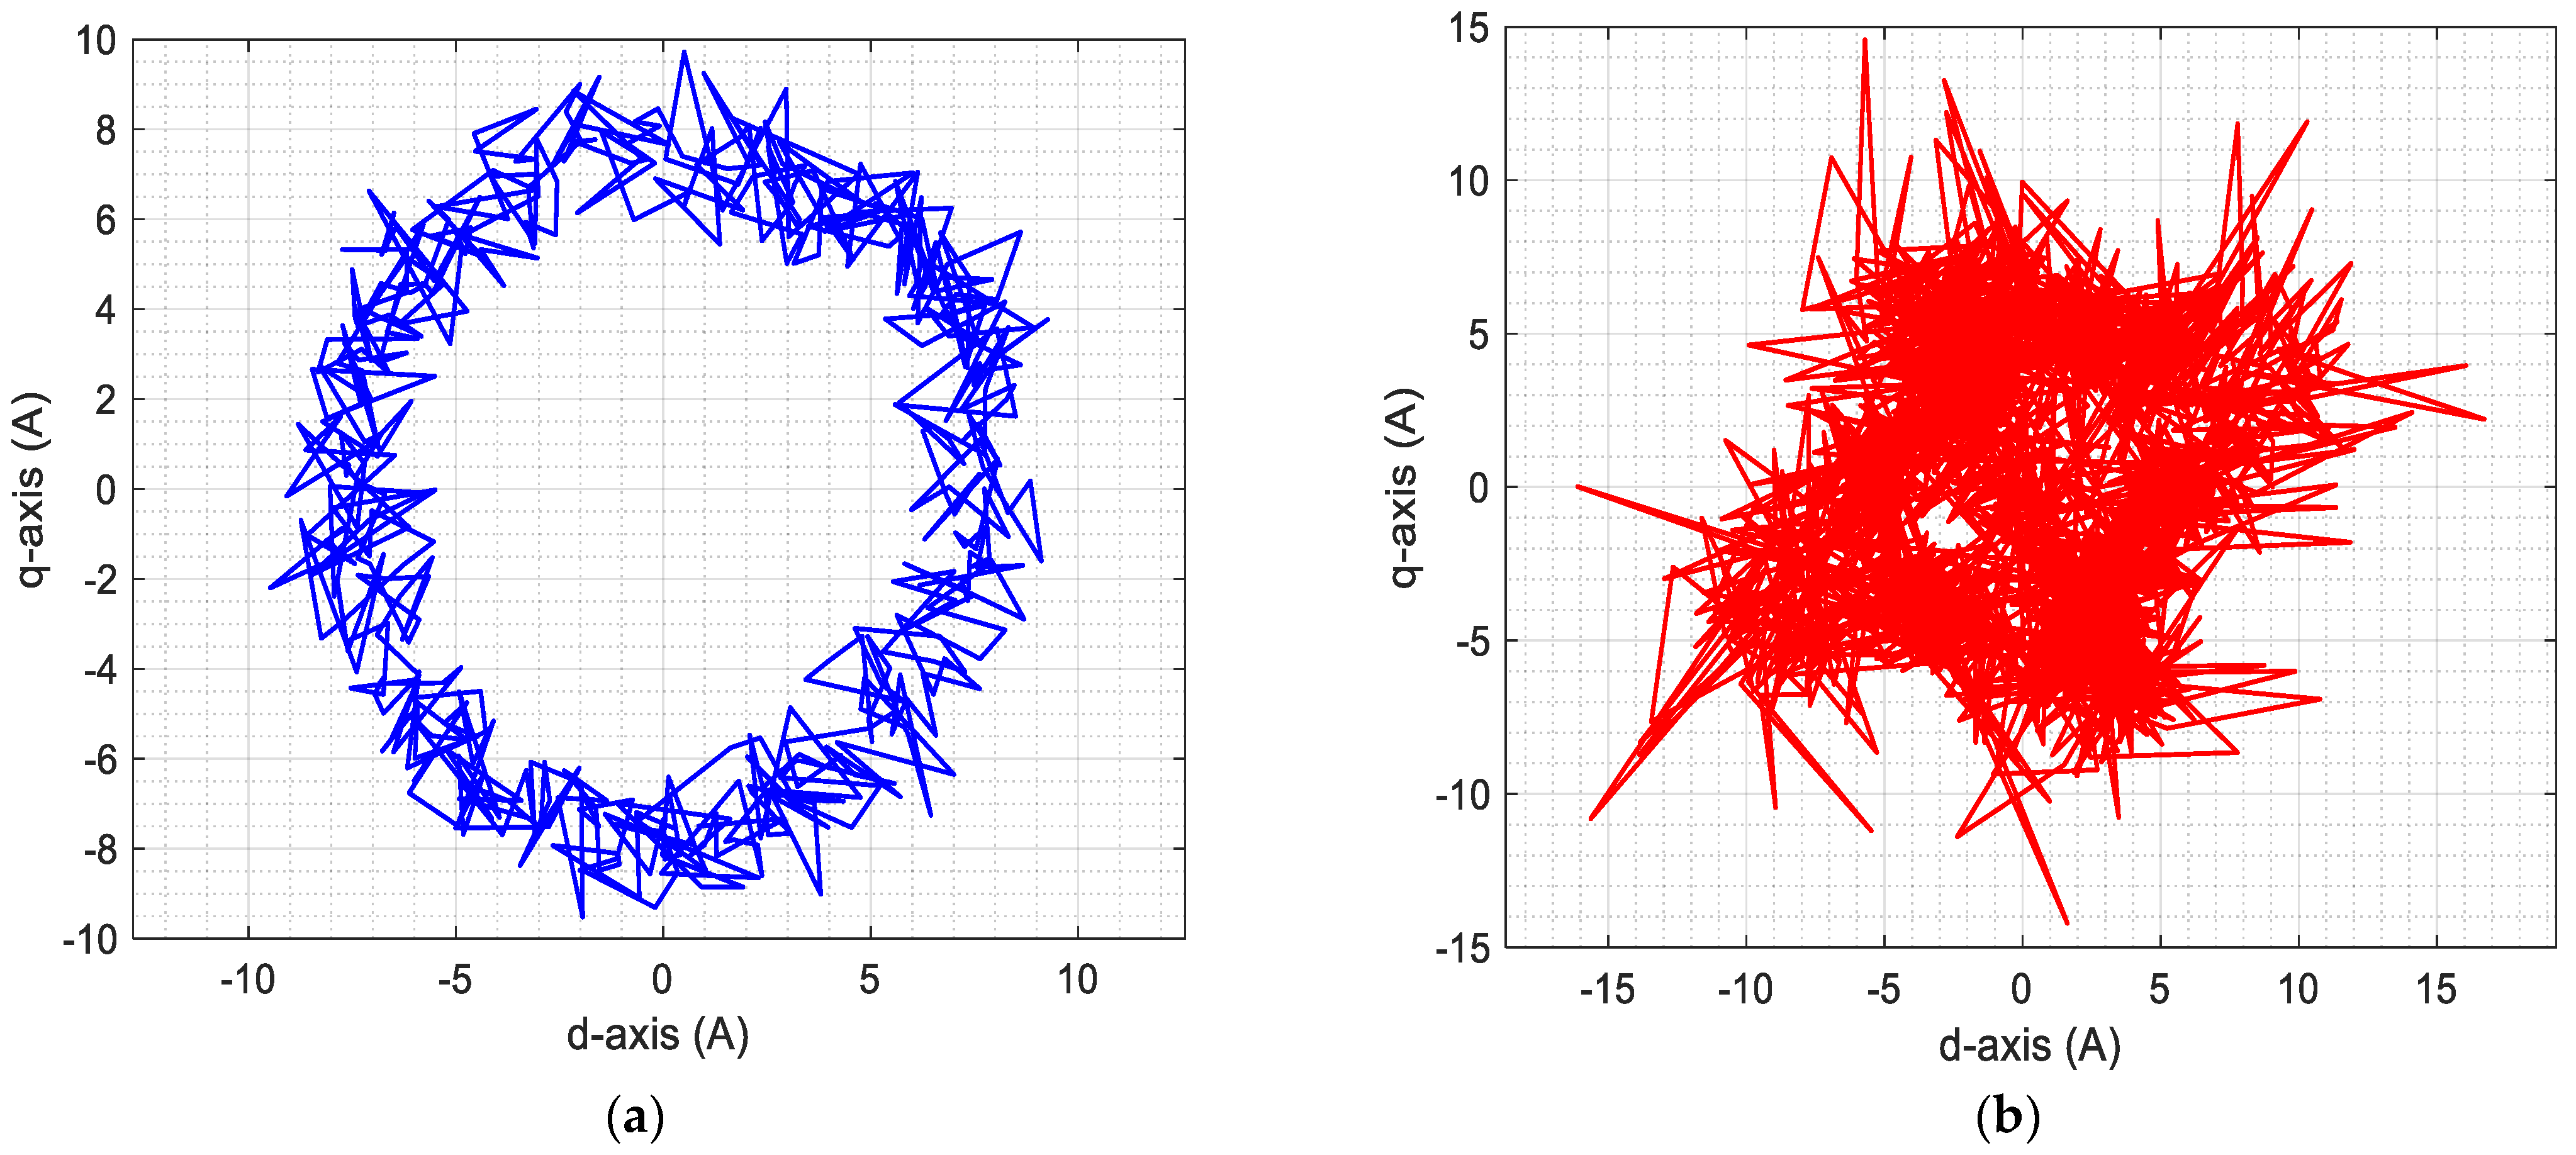
The input feature vector included both time-domain and frequency-domain characteristics extracted from current and vibration signals. These features comprised time-domain attributes such as Root Mean Square (RMS), peak-to-peak value, skewness, kurtosis, and signal energy and frequency-domain features including Total Harmonic Distortion (THD), dominant FFT peaks, and sideband counts, as well as statistical metrics such as park vector variances and zero-sequence indicators.
All features were normalized prior to training to ensure scale invariance. The Random Forest model was built using 100 estimators with Gini impurity as the split criterion and a maximum depth of 15, empirically selected to balance complexity and accuracy. To address class imbalance, especially for the Critical class, class weighting was applied during training to reduce the penalty of misclassifications in underrepresented categories. Outlier filtering was also applied to remove artifacts caused by transient anomalies.
The classification performance was evaluated using standard metrics, such as Precision, Recall, F1-Score, and Accuracy. This categorization of current signals provides a clearer representation of the machine’s operational condition, offering accurate monitoring with clear distinctions between Normal, Marginal, and Critical. The results on the machine-learning algorithm are summarized in
Table 9, showing 94% accuracy, which reflects its effectiveness in correctly classifying the signals. The Marginal class achieved perfect recall, ensuring early-stage degradation is reliably detected. Both Normal and Critical states demonstrate high precision, indicating the model’s ability to minimize false positives and support effective predictive maintenance. As a result, it detects conditions requiring immediate attention while enabling planned maintenance, reducing false alarms and enhancing system reliability.
To benchmark the RF model, alternative classifiers were trained using the same dataset and features: Support Vector Machine (SVM), k-Nearest Neighbors (k-NN), and Decision Tree (DT).
Table 10 shows the comparative performance using the same five-fold cross-validation procedure.
Among all classifiers, Random Forest consistently achieved the best results in terms of accuracy and F1-score, demonstrating superior robustness under noisy and complex signal conditions.
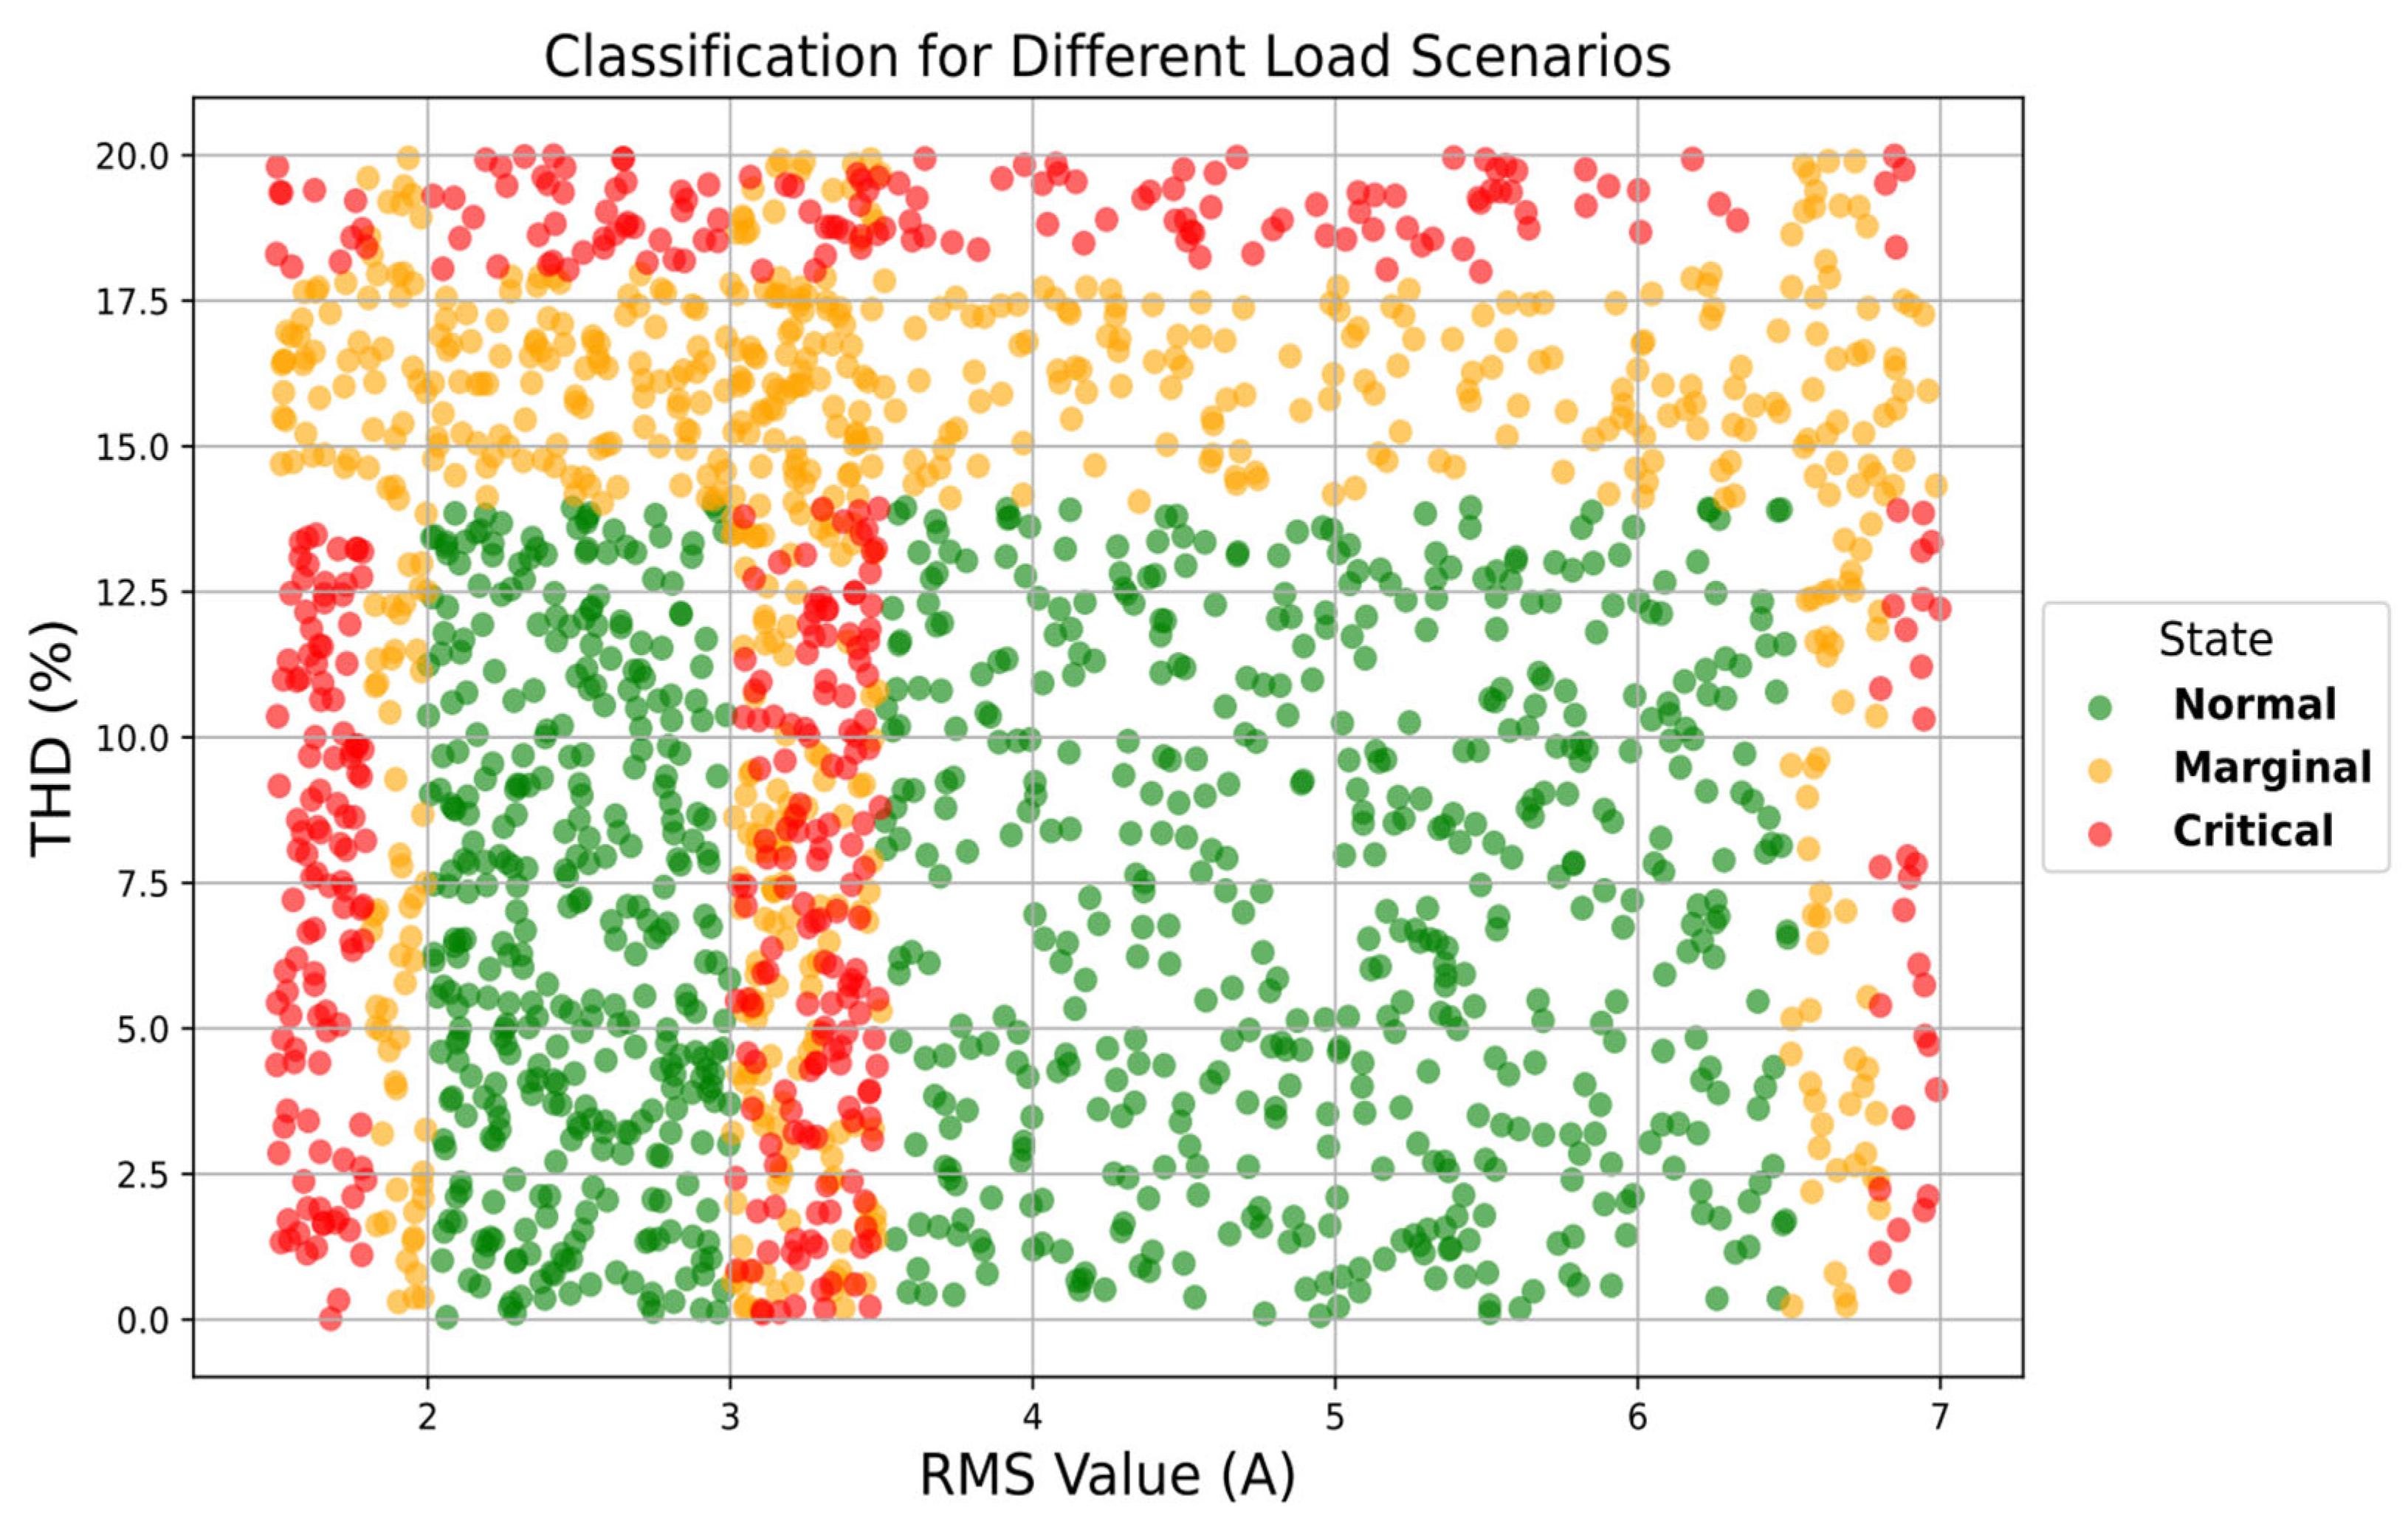
Total Harmonic Distribution (THD) is a reliable indicator for monitoring the condition of an electric machine.
Figure 23 presents a relationship diagram between current values and THD (%), showing how different machine operating states correspond to variations in THD. A correlation is observed between increasing current and THD, consistent with studied load scenarios. Using Motor Current Signal Analysis (MCSA) reveals the filter’s behavior, where healthy current is confined to low frequencies, while faulty signals reflect high-frequency content.
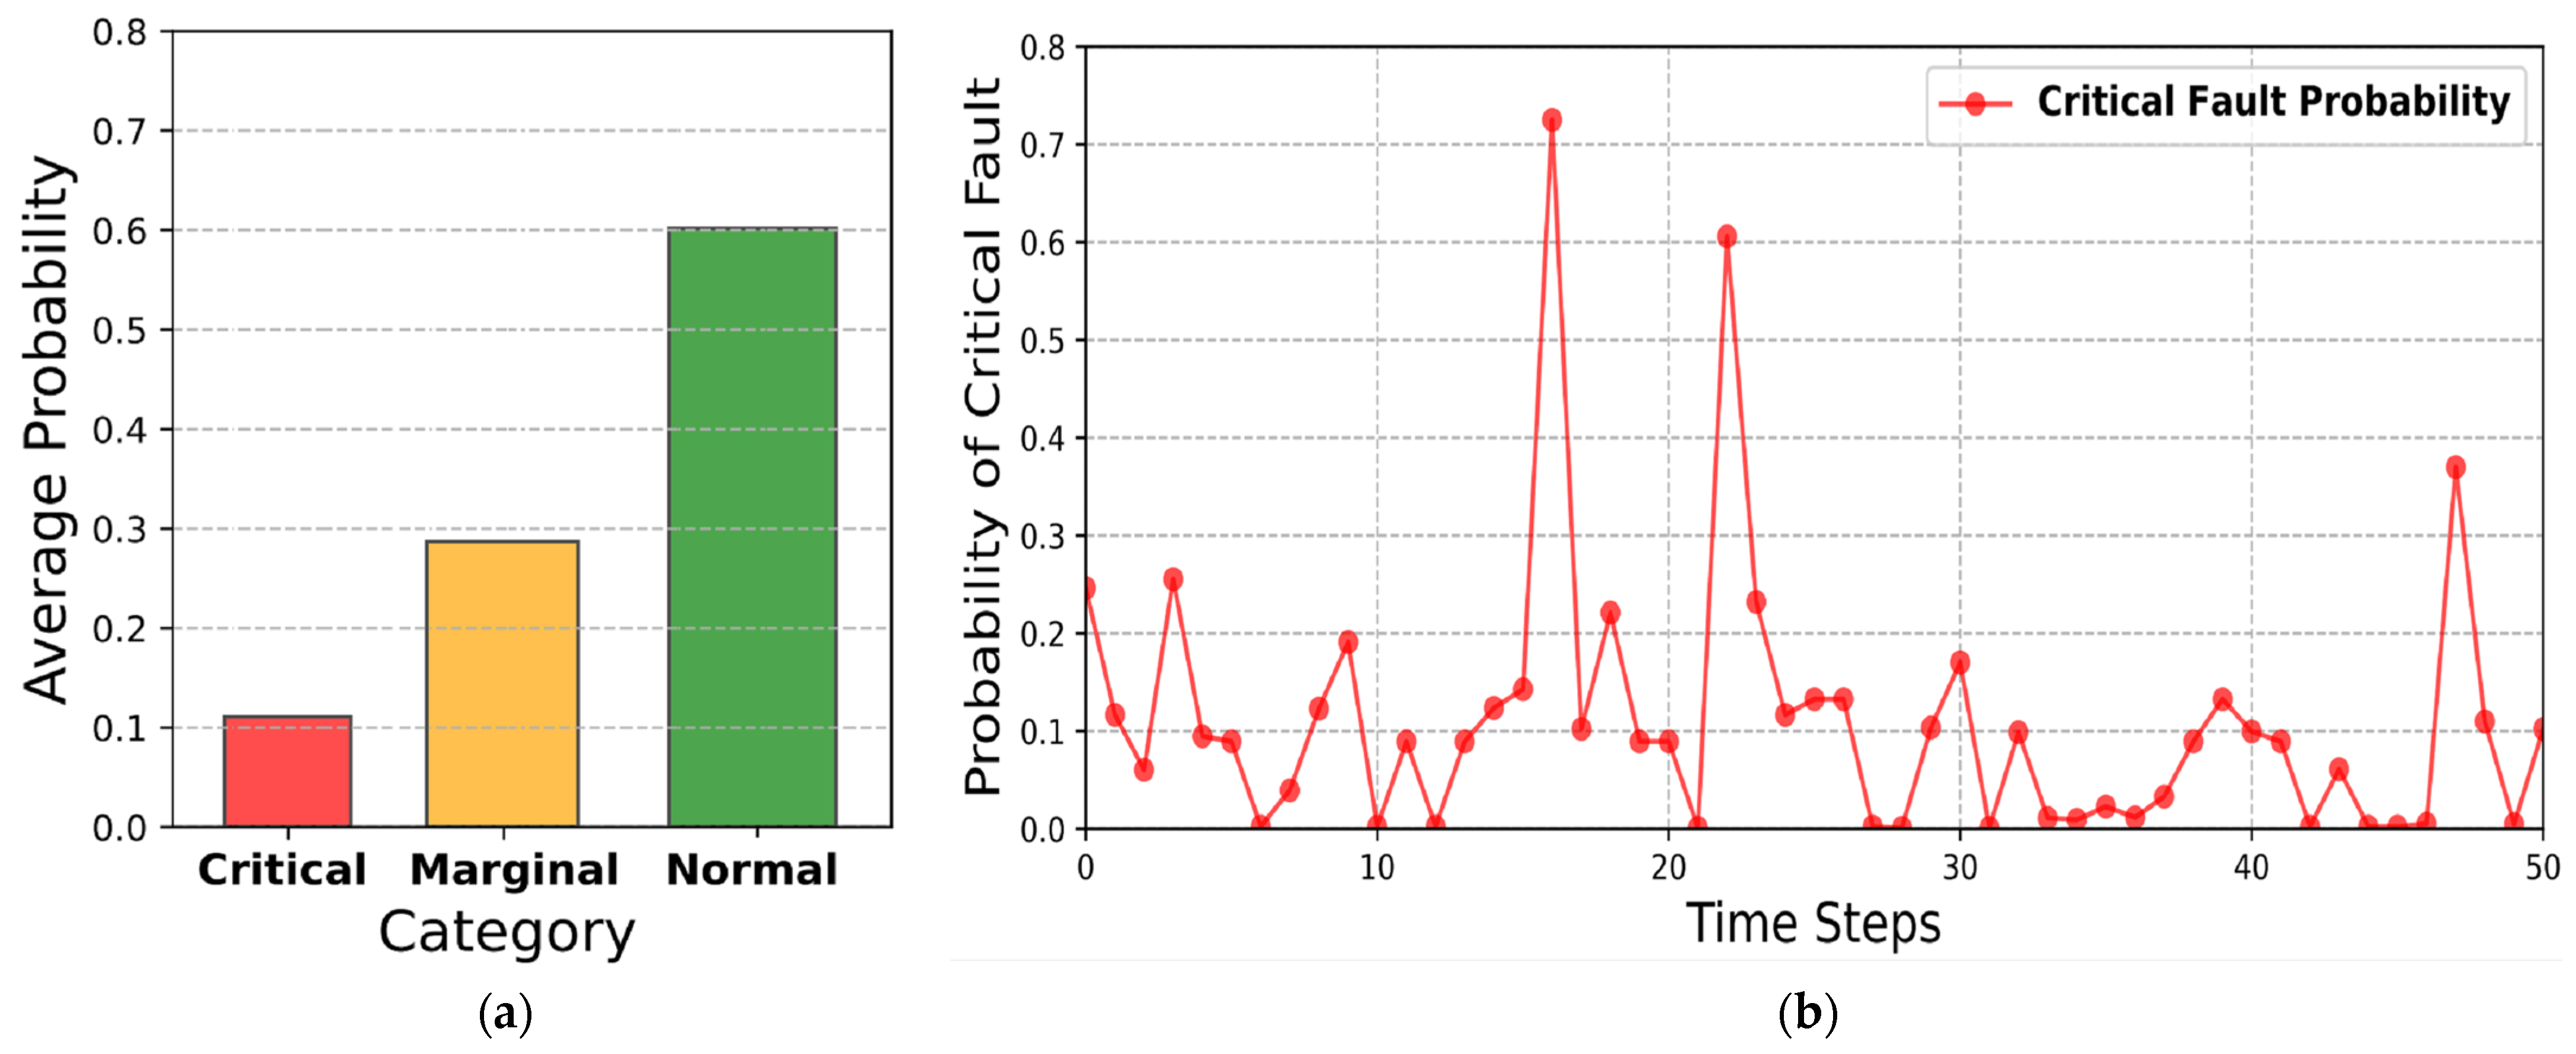
The predictive maintenance outcomes are illustrated in
Figure 24.
Based on
Figure 24a, the Normal category shows the highest probability, indicating that most data are classified as normal by the model. The Marginal state has a moderate fault probability (~0.3), while the Critical state has the lowest probability, which reflects strong equipment reliability. In
Figure 24b, most values cluster near zero, indicating a low risk of critical failure over time. However, the presence of occasional spikes highlights moments when failure probability increases significantly, serving as key indicators for predictive control interventions at those points.


