1. Introduction
Electrified transportation is calling for significant innovation in electrical insulation system design and diagnostics. The higher levels of electrothermal stresses, with unconventional voltage supply waveforms (power electronics, like PWM or AC with harmonics, can cause accelerated aging and premature failure [
1,
2,
3,
4,
5,
6]. Consequently, the design of insulation systems, e.g., for rotating machines, needs innovative procedures and materials, as well as the support of adequate design and quality control tests. Special attention must be due to the risk of inception of the most harmful insulation accelerated (extrinsic) aging phenomenon, that is, partial discharges. They can cause extrinsic aging rate increases, with failure occurring in much shorter times than design life, especially for organic (Type I) insulation (while Type II insulation can withstand “normal”, i.e., low-level PD activity for the whole design life [
7,
8]). IEC 60034-18-41 and 42 explicitly deal with the design of the insulation system for rotating machines from LV to MV voltage, referring to the concept of PD-free design for Type I (organic) insulation and accelerated life testing under PD for Type II (mixed organic–inorganic) insulation. However, also due to the lack of available commercial products for voltage supply devices (providing repetitive impulses or PWM-like waveforms) and PD detection and analysis under such waveforms, even the IEC standard allows testing insulation systems under AC sinusoidal voltage. In principle, therefore, design and quality control of insulation systems of adjustable speed drives, and even commissioning or diagnostics, can be developed without experiencing the real effect of power electronics supply.
Under these premises, evaluating whether AC sinusoidal voltage can provide close information to PWM in the evaluation of insulation system design, as regards at least the PD-free concept, when changing design and/or materials, seems to have some merit.
The purpose of this paper is twofold. On the one hand, a procedure for the comparison between two insulation solutions for a PD-free design is presented, referring to motorettes of a MV speed-controlled motor. Inside this procedure, and this is the second major topic, an evaluation of the most effective testing waveform, from AC sinusoidal to AC modulated (PWM), varying for the latter number of inverter levels and switching the slew rate, is carried out. Testing objects and procedures for PDIV studies under sinusoidal and power electronics waveforms are dealt with in
Section 2 and
Section 3, respectively. PD measurements are performed using innovative PD monitoring system, which is presented in
Section 4, and the experimental results are presented and discussed in
Section 5, leading to conclusion in
Section 6.
2. Test Objects
The test objects used in this study are motorettes (pair of coils for stator winding) under the ARPA E project ASCEND (Aviation-class Synergistically Cooled Electric-motors with Integrated Drives) looking for design and manufacturing of a 250 kW, 5000 rpm surface permanent magnet (SPM) synchronous machine integrated power electronics drive [
9,
10]. This machine is composed of 18 additively manufactured (AM) coil pairs, each integrated with heat pipes for improved thermal management, as shown in
Figure 1. In the figure, a half-view of the stator structure is presented, displaying a coil pair with visible cooling channels. The section of the stator highlighted in a single color represents one coil pair. Considering modular nature of the machine design, each coil pair is directly connected to an H-bridge converter of the motor drive. The fundamental frequency used for this motor is 1250 Hz, while the switching frequency is 20 kHz. The design of motorette is being studied in the perspective of developing a high-power density motor for drive train of the aerospace propulsion system.
In order to investigate a PD-free design, three different insulation systems must be taken into account, i.e., coil-to-ground, coil-to-coil and turn-to-turn insulation. The partial discharge inception voltage, PDIV, is the main quantity that must be estimated and measured to reduce the likelihood of inception of the most harmful extrinsic accelerated aging mechanism, that is, partial discharges: operating voltage must be <PDIV.
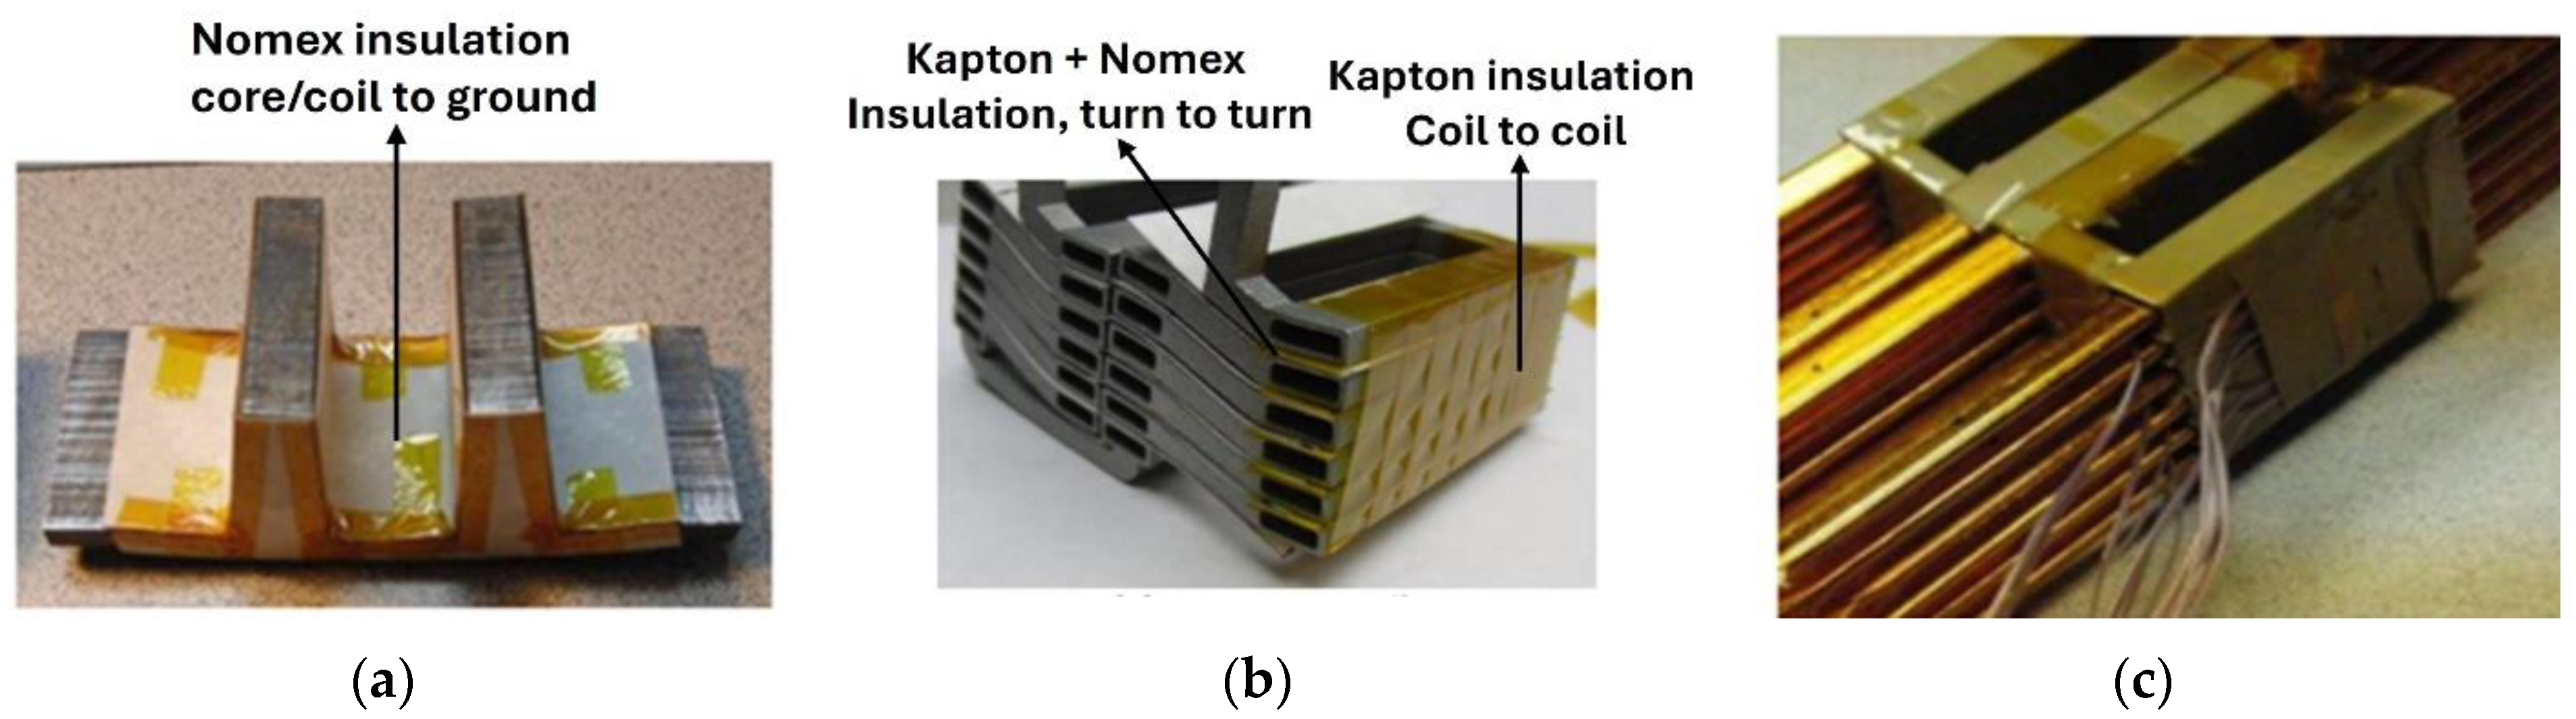
Figure 2 shows the components of the motorette.
Figure 2a depicts the stator core having Nomex paper as coil-to-ground insulation. Coils, displayed in
Figure 2b, consist of layers of solid and hollow conductors, where the hollow conductors manage motor cooling. The insulation between coils is obtained by wrapping PD-resistant Kapton (Kapton CR) around the hollow conductors, as highlighted in
Figure 2b. Similarly, Nomex is used for turn-to-turn insulation. Two insulation technologies were considered in motor development, differing mainly in insulation thickness (
Figure 3).
Motorette insulation technology 1:
Coil-to-ground: Nomex film with thickness 0.23 mm;
Coil-to-coil: Kapton CR (corona resistant) film with a thickness of 25.4 µm;
Turn-to-turn: Nomex film with thickness 0.23 mm.
The thickness of the insulation of the insulation sub-systems considering motorette insulation technology 2 was doubled and more effective reduction in gas pockets in coil-to-coil and turn insulation was achieved, as highlighted below.
Motorette insulation technology 2:
Coil-to-ground: Nomex film with thickness 0.46 mm;
Coil-to-coil: Kapton CR (corona resistant) film with a thickness of 50.8 µm;
Turn-to-turn: Nomex film with thickness 0.46 mm.
3. Experimental Investigation of Motorette Under AC Sinusoidal and PWM Supply
A global test scheme is illustrated in
Figure 4, where the three insulation sub-systems characterized in terms of partial discharge inception voltage (PDIV) are highlighted. Notably, tests were performed at different pressures (since the design and manufactured motor prototype were meant for aircraft applications), but this paper focuses on the results obtained at standard atmospheric pressure (SAP).
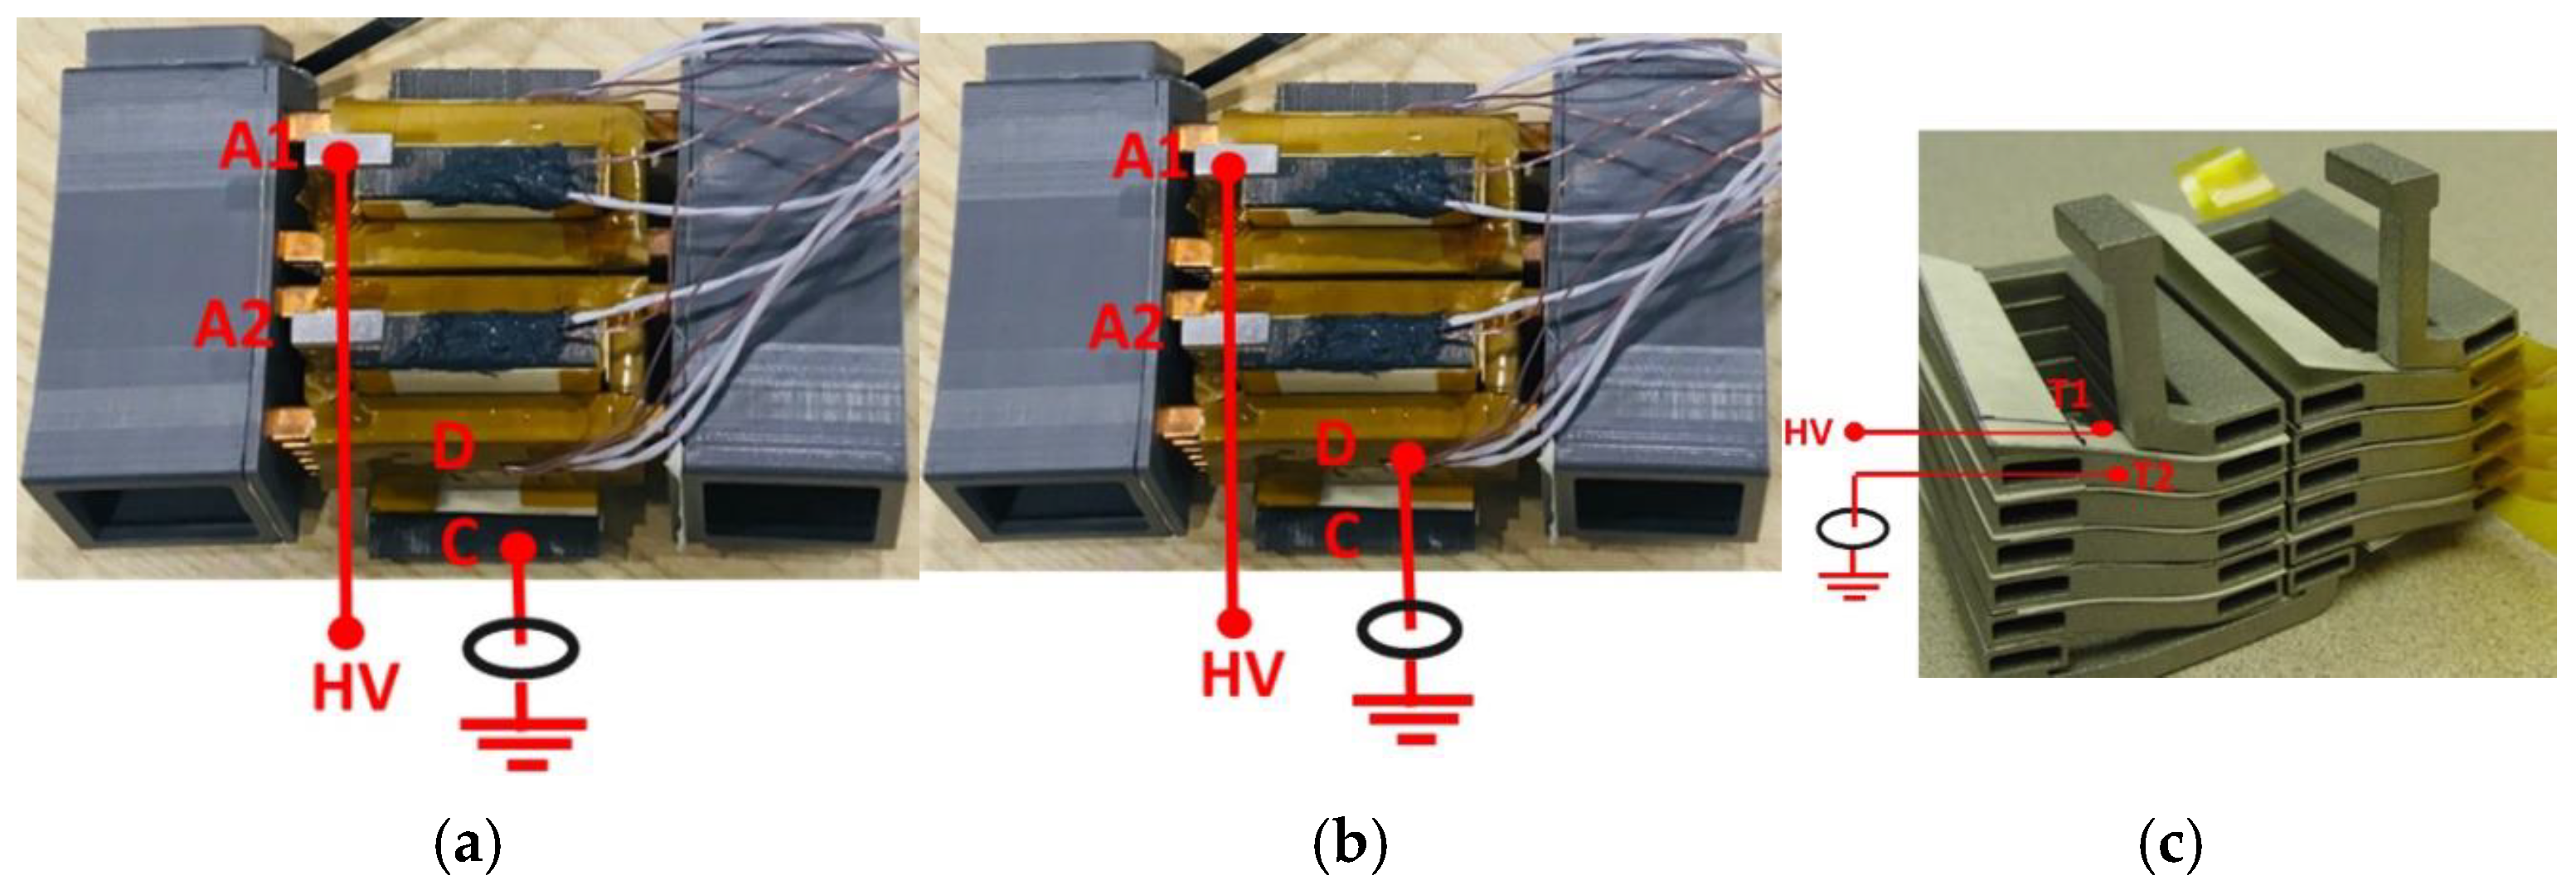
To conduct the PD study on the motorette insulation, key connection points for HV and ground were defined, as illustrated in
Figure 5.
For the coil-to-ground PD study, HV is applied to one terminal of a coil, while the stator core is grounded,
Figure 5a. In the coil-to-coil study, HV is applied to one terminal of the coil, and the ground is connected to the adjacent coil on the surface of the Kapton insulation,
Figure 5b. As regards turn-to-turn insulations, the motorette prototype does not provide suitable connection points. Therefore, PD testing was conducted on an unfinished structure (prior to insulation wrapping), where HV is applied to the metallic part of a turn, and the ground is connected to the insulation between this turn and its adjacent one, as shown in
Figure 5c.
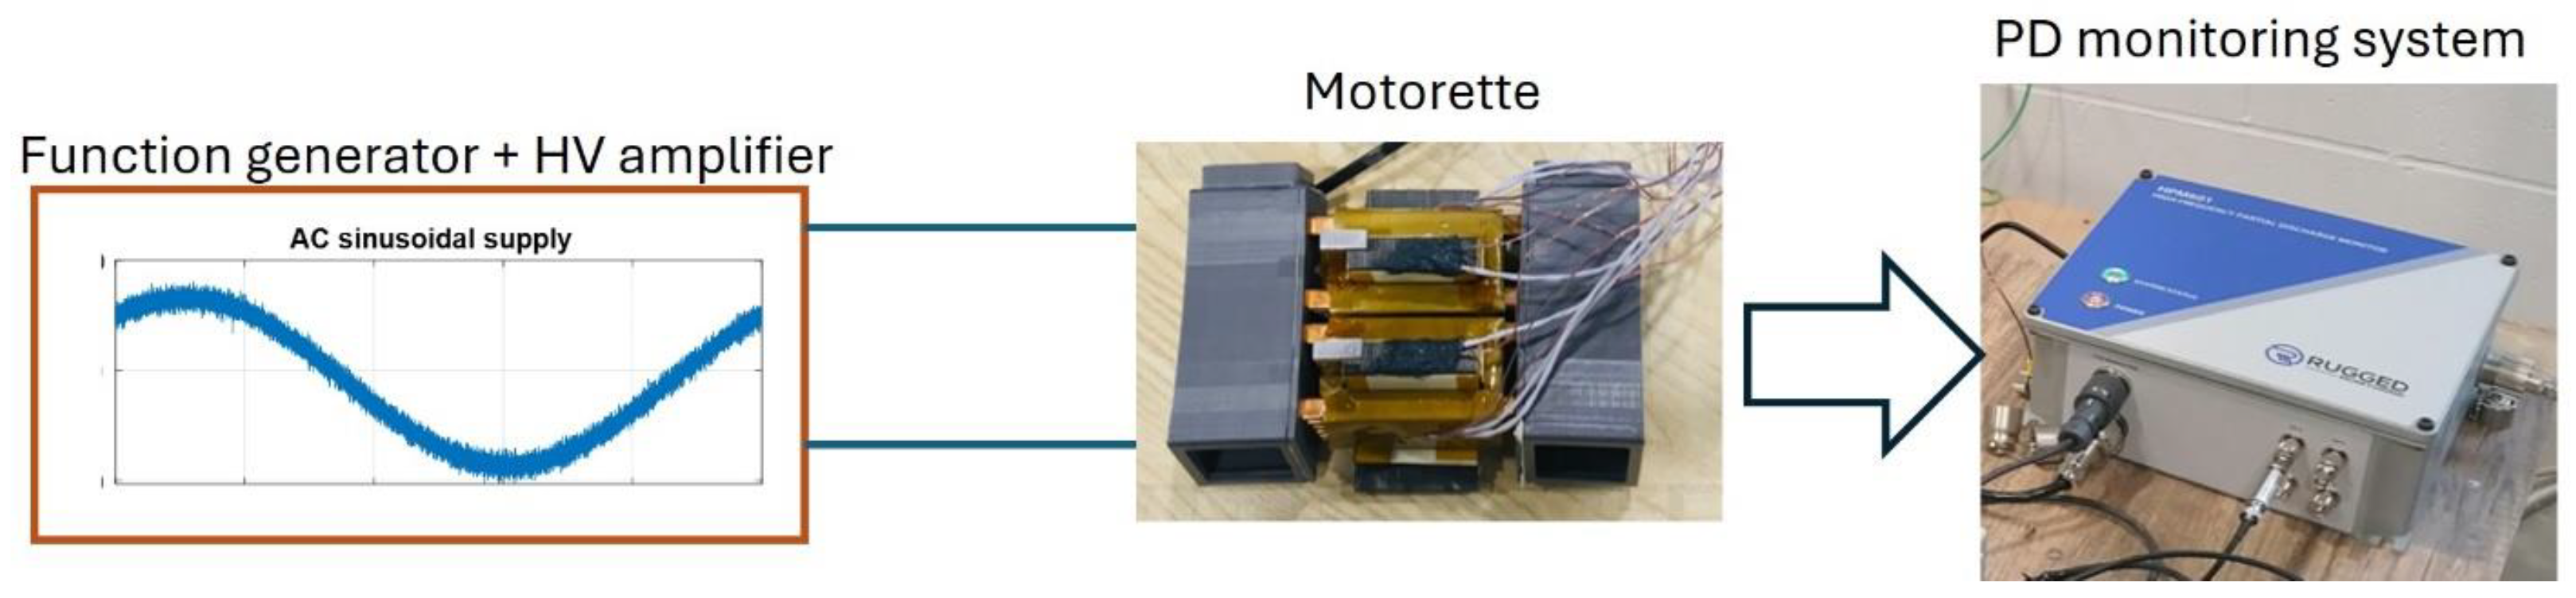
PDIV was measured using similar procedure and circuit for both AC sinusoidal and AC modulated (PWM) waveforms. The experimental setups are shown in
Figure 6 and
Figure 7. AC sinusoidal voltage was provided through a function generator plus high voltage amplifier, so that frequency and voltage could be easily changed. PWM source was provided by a suitable device build in authors’ lab, with variable modulation and carrier frequencies, number of inverter levels and switching the slew rate. Detailed experimental setups are presented in next section.
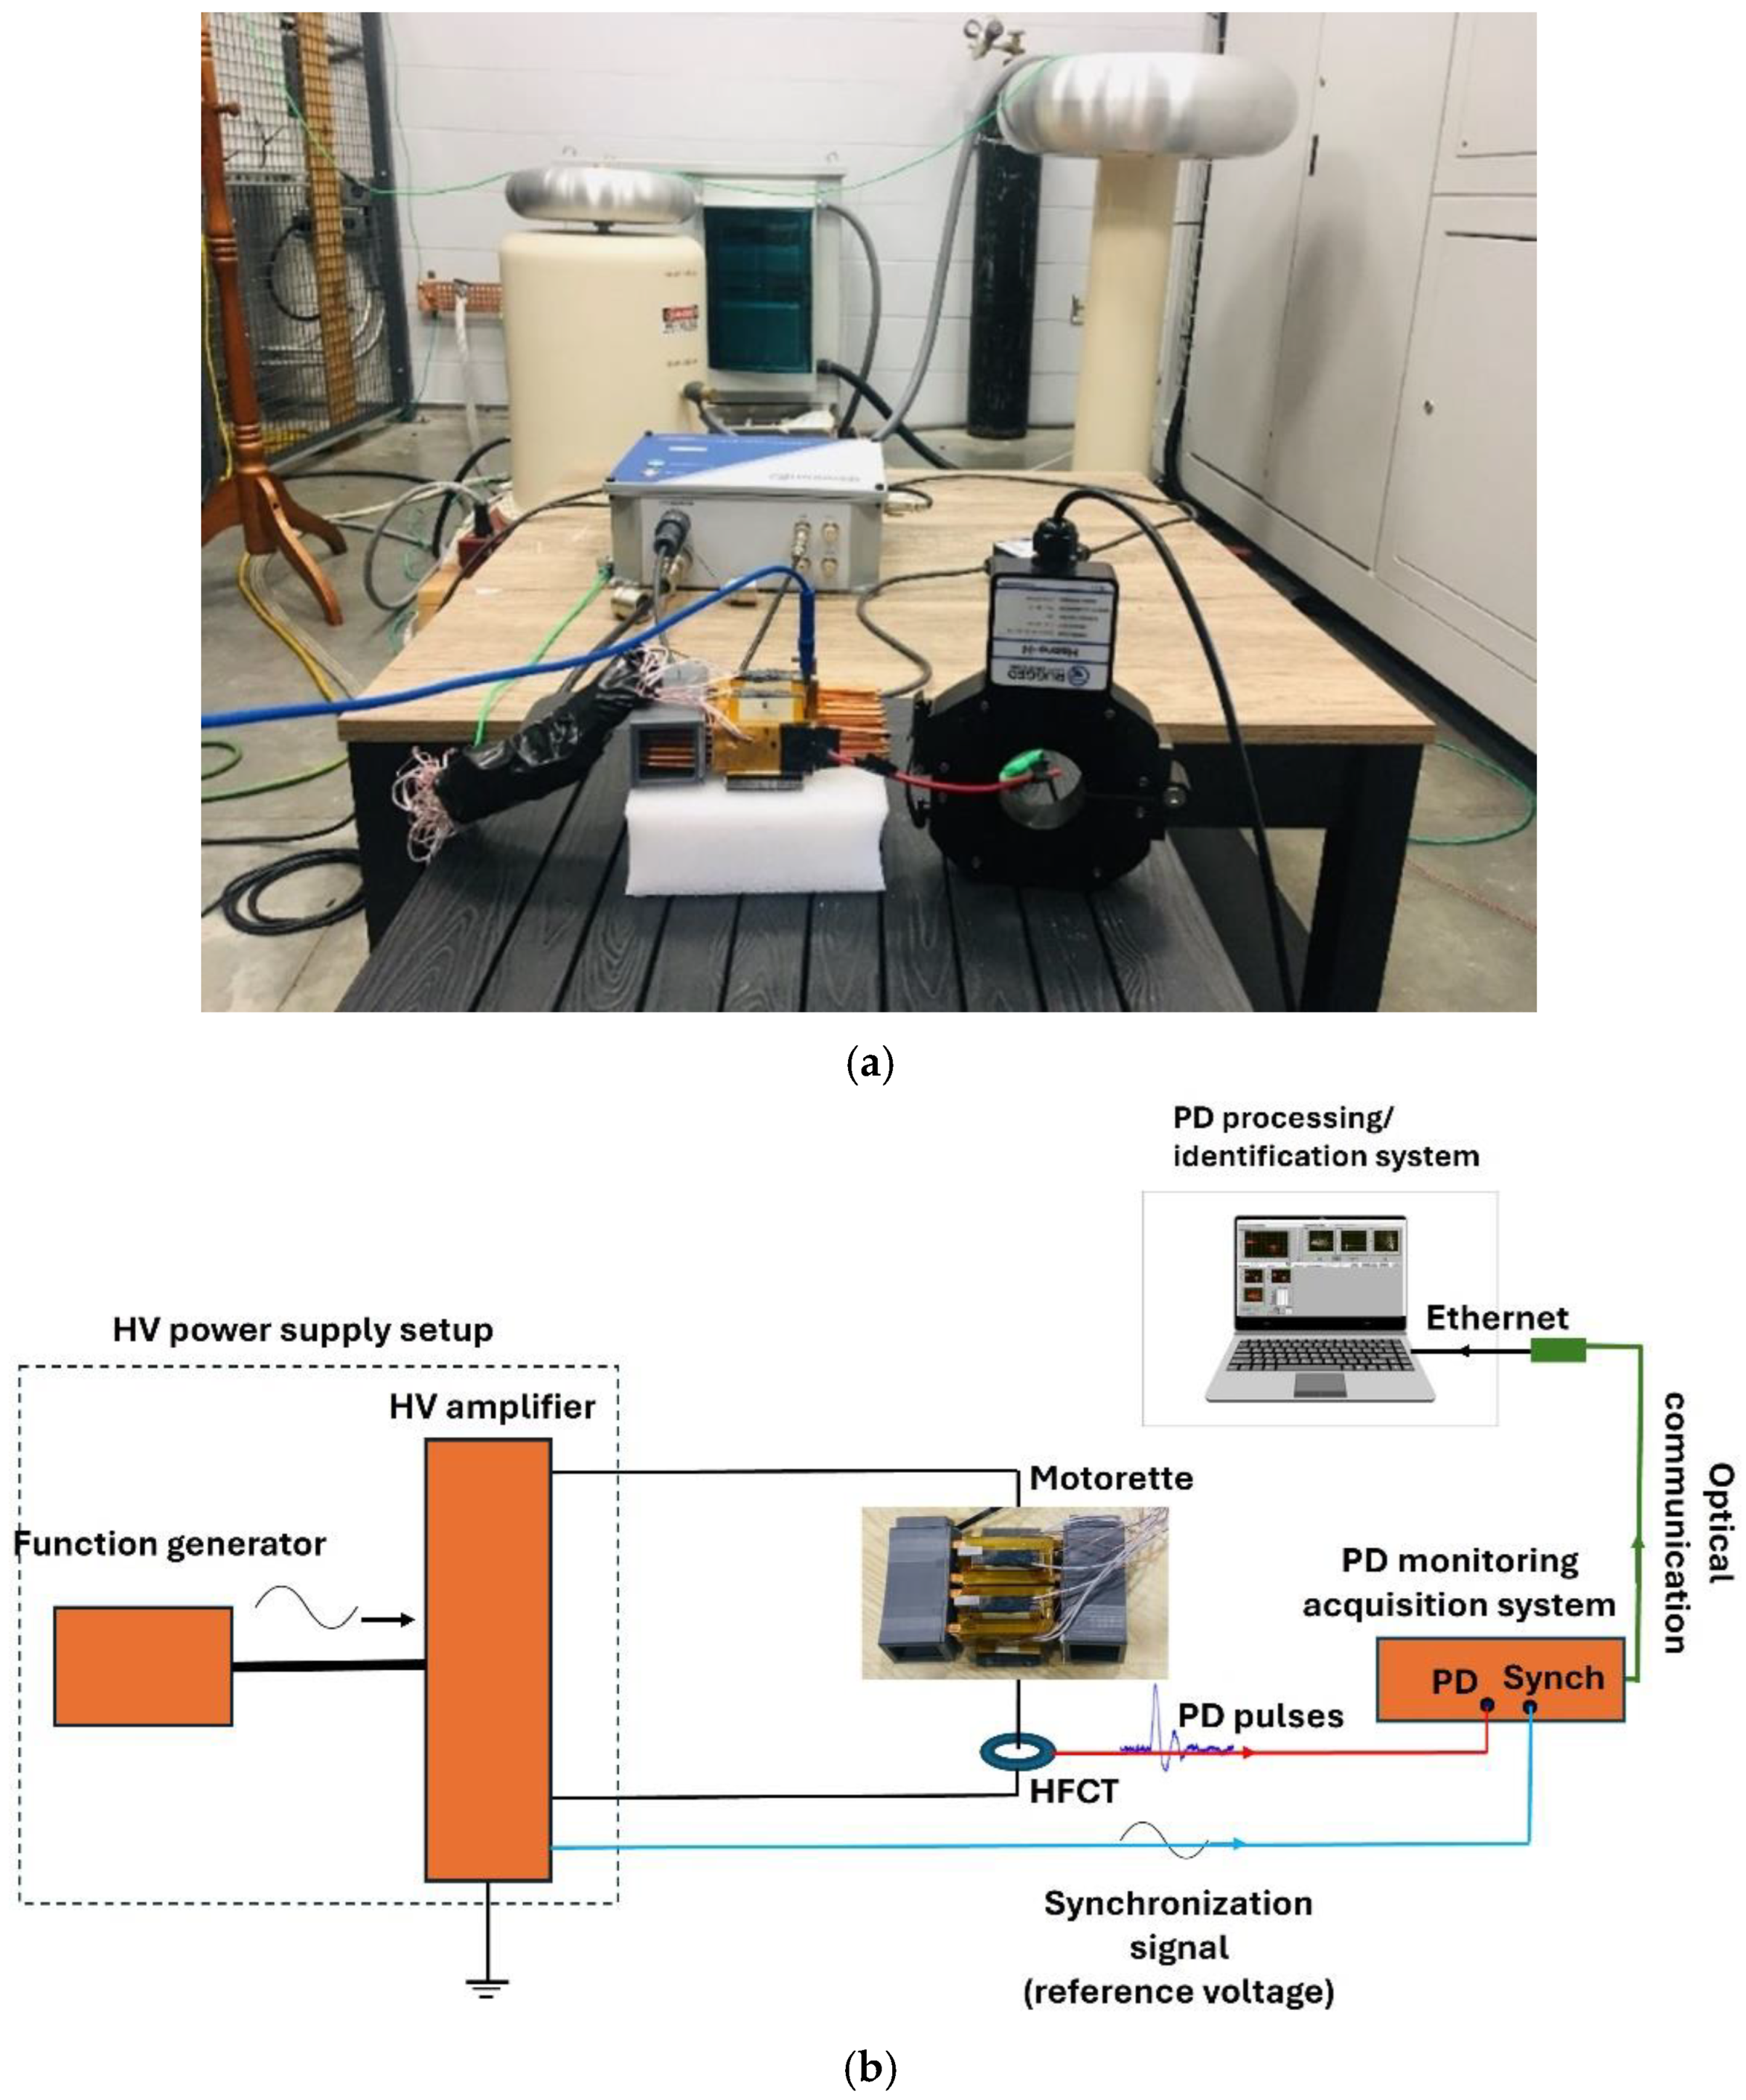
3.1. Experimental Setup for PDIV Study Under AC Sinusoidal Supply
Figure 8a displays a photo of the experimental setup, while
Figure 8b provides the electrical layout of the setup. The synchronization (AC reference) signal for PD measurement, needed to build the phase-resolved partial discharge (PRPD) pattern was taken from the HV amplifier. A high-frequency current transformer, (HFCT) connected to the ground connection, i.e., in series with the motorette, was used as PD measurement sensor.
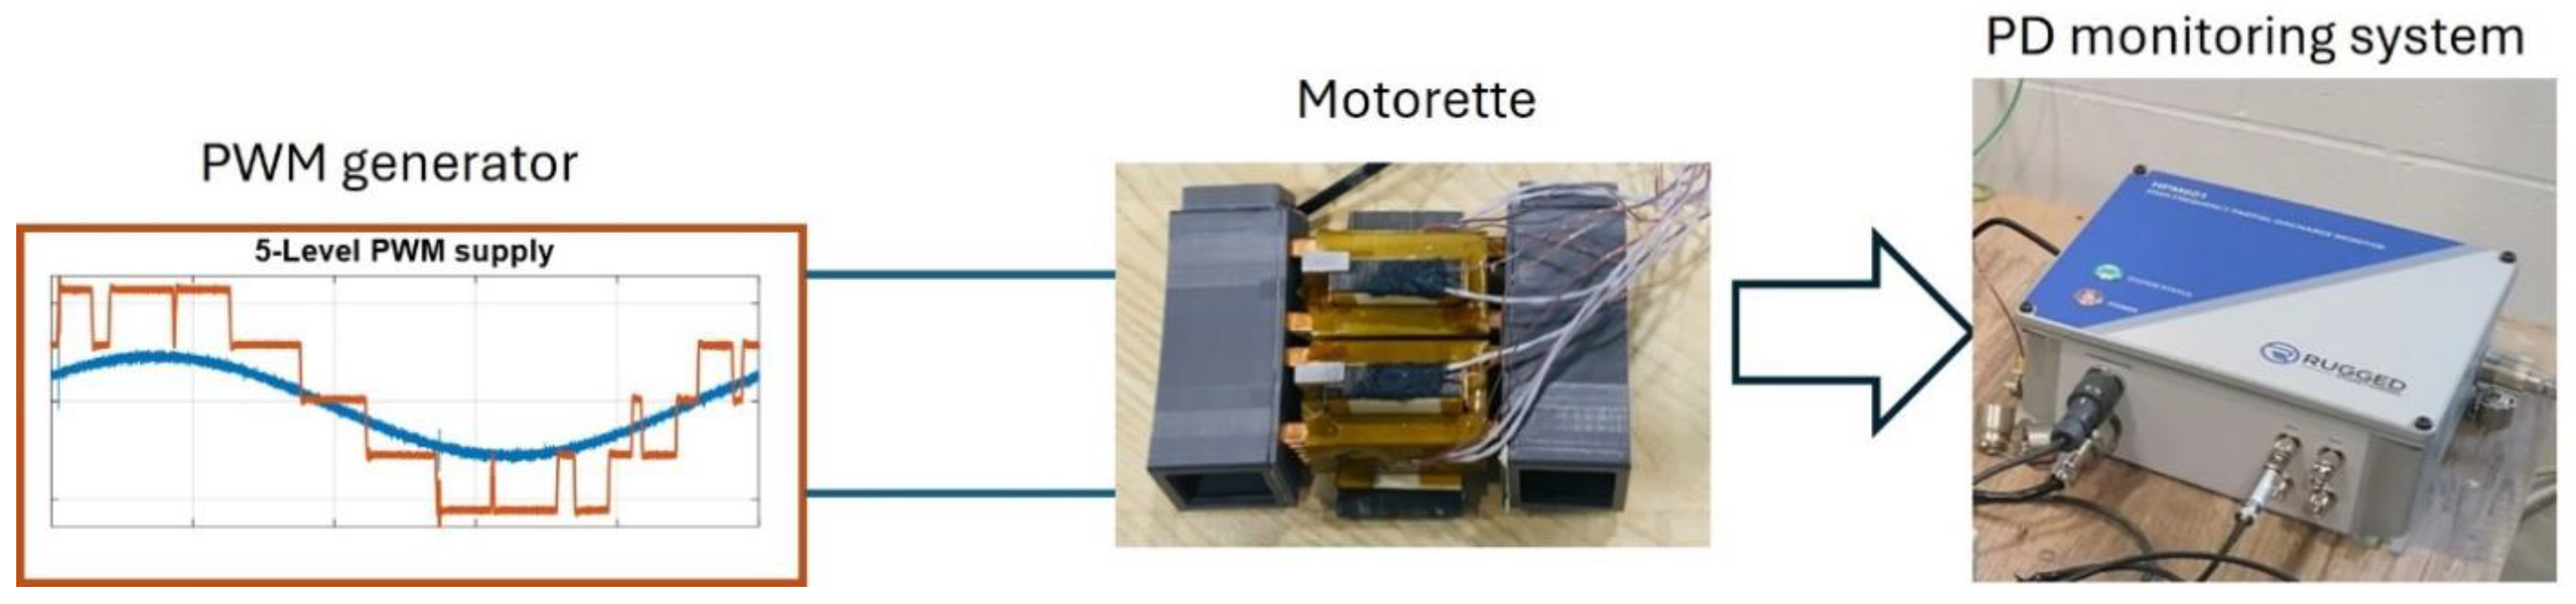
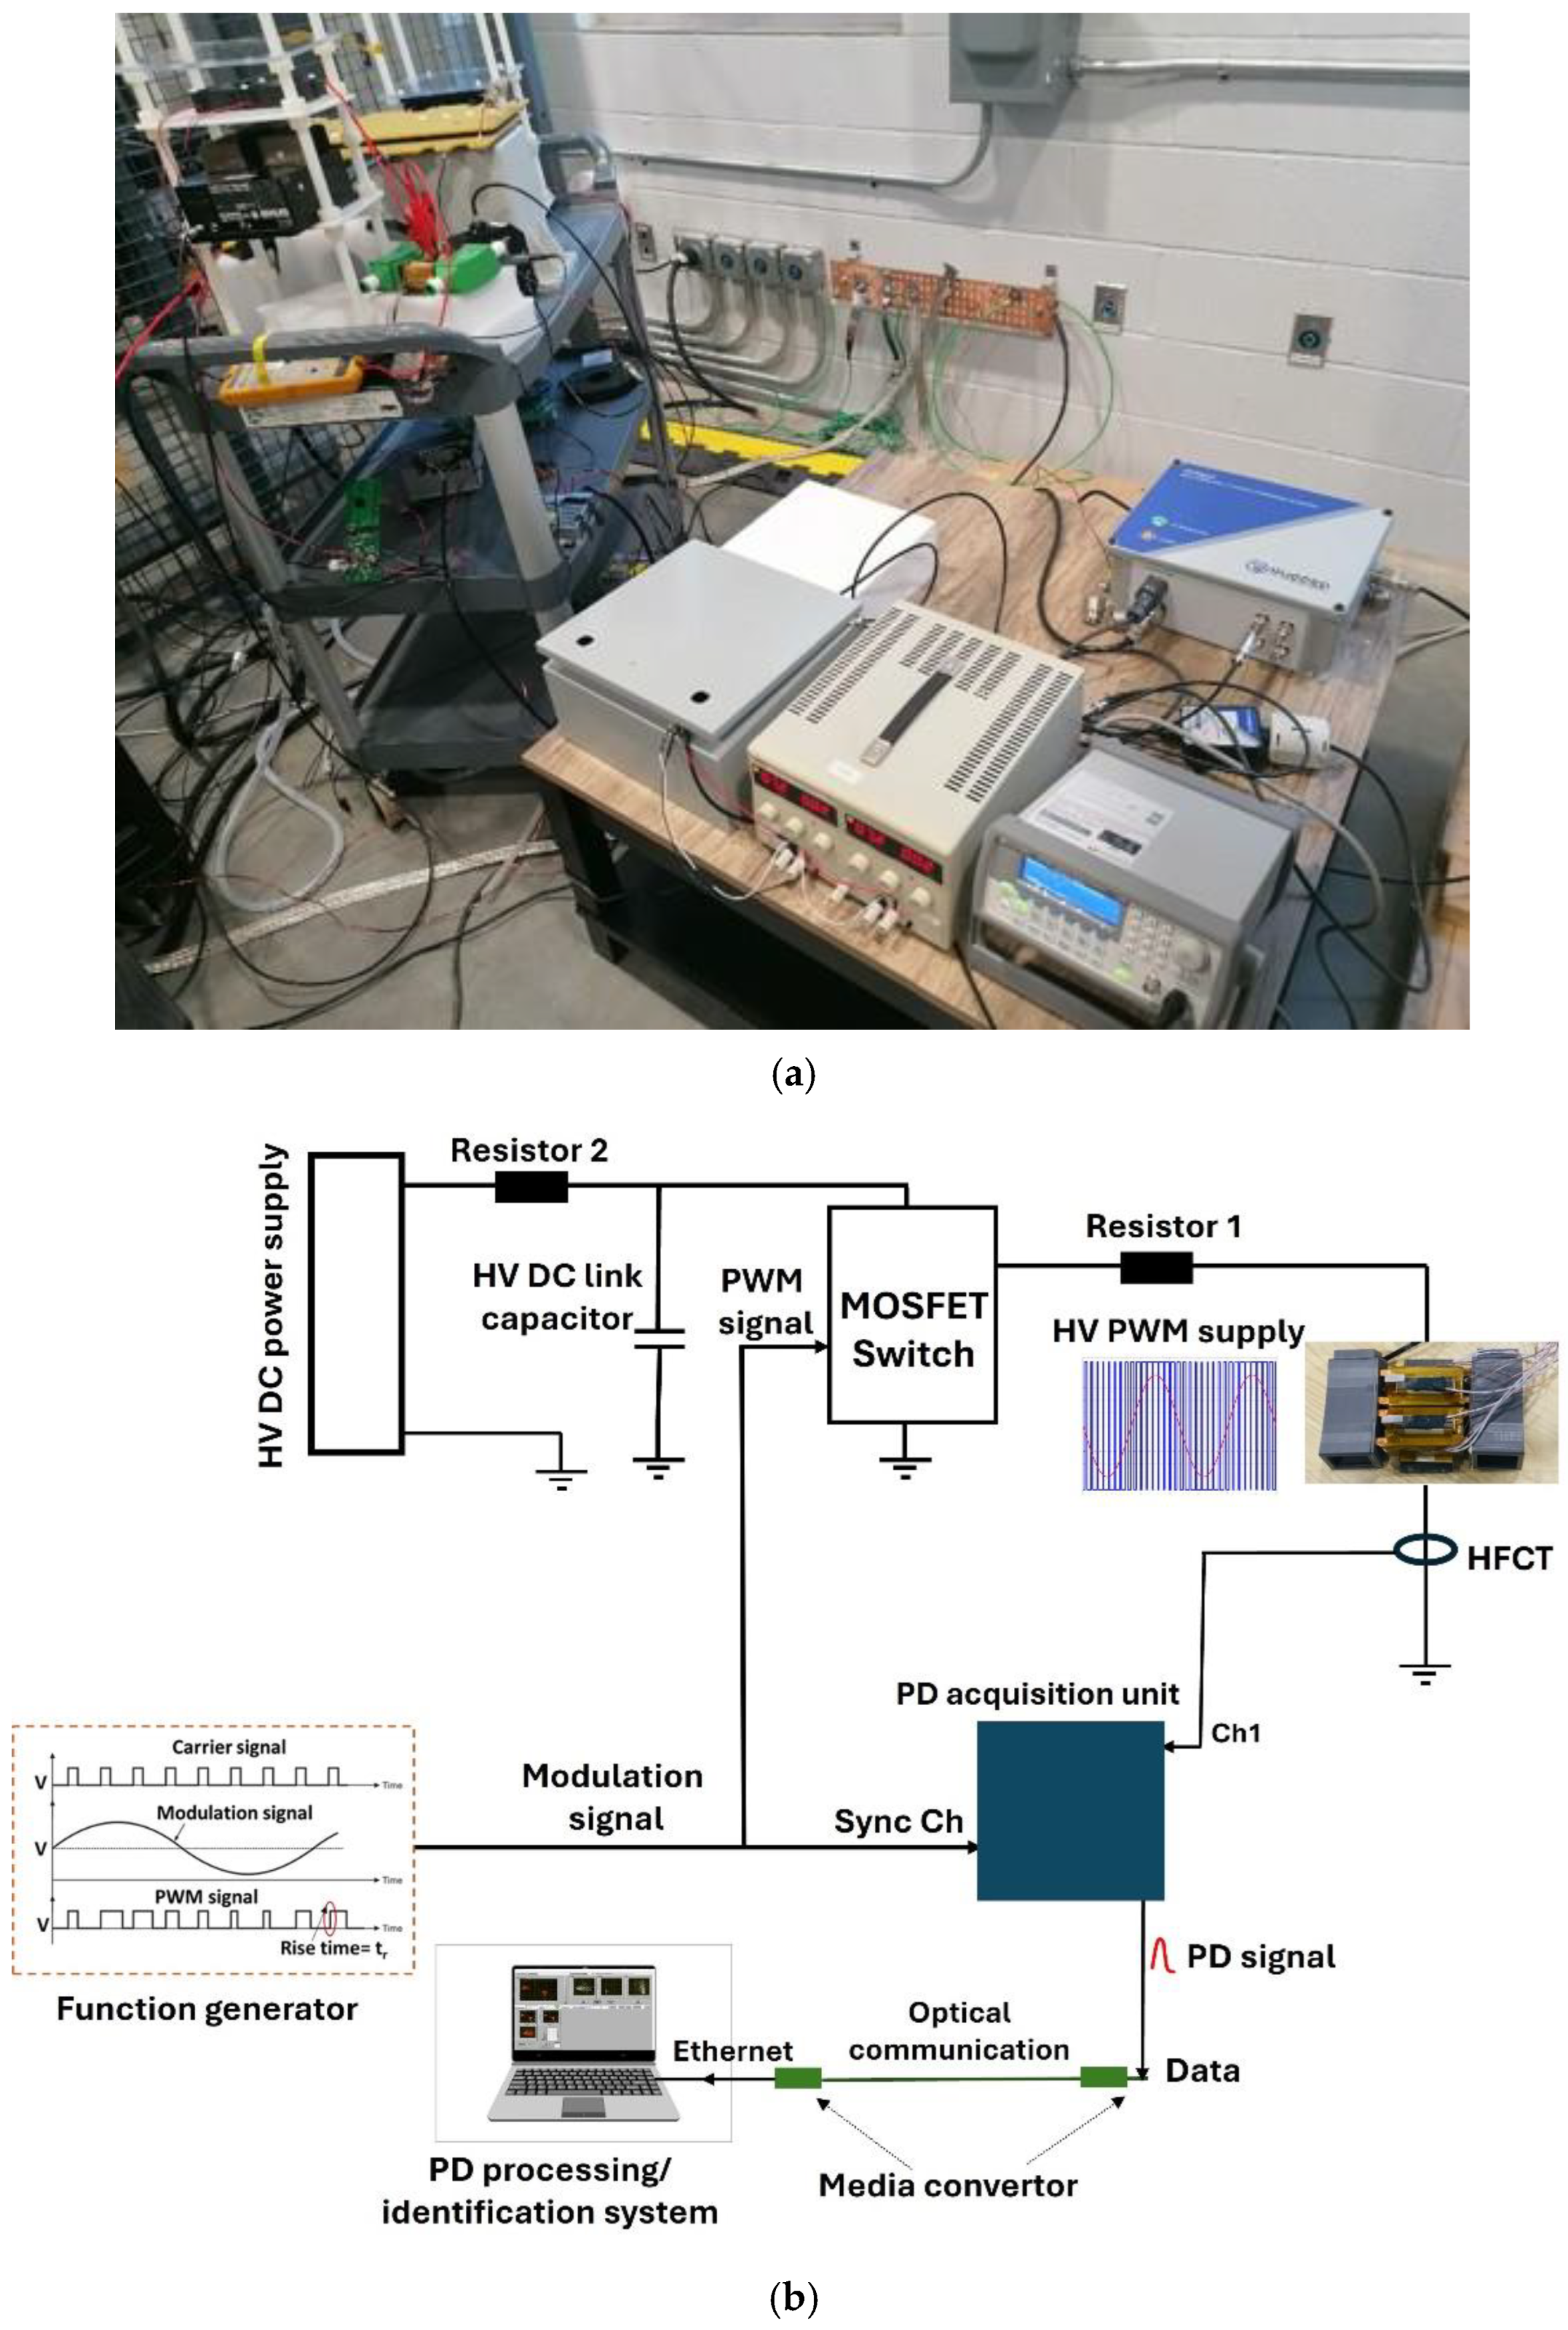
3.2. Experimental Setup for PDIV Study Under PWM Supply
Photo of the experimental setup and scheme are reported in
Figure 9. The characteristics of the PWM generator are:
PWM output voltage range ±10 kV,
2 to 5 levels,
Modulation frequency up to 5 kHz,
Carrier frequency up to 20 kHz, and
Maximum slew rate 100 V/ns.
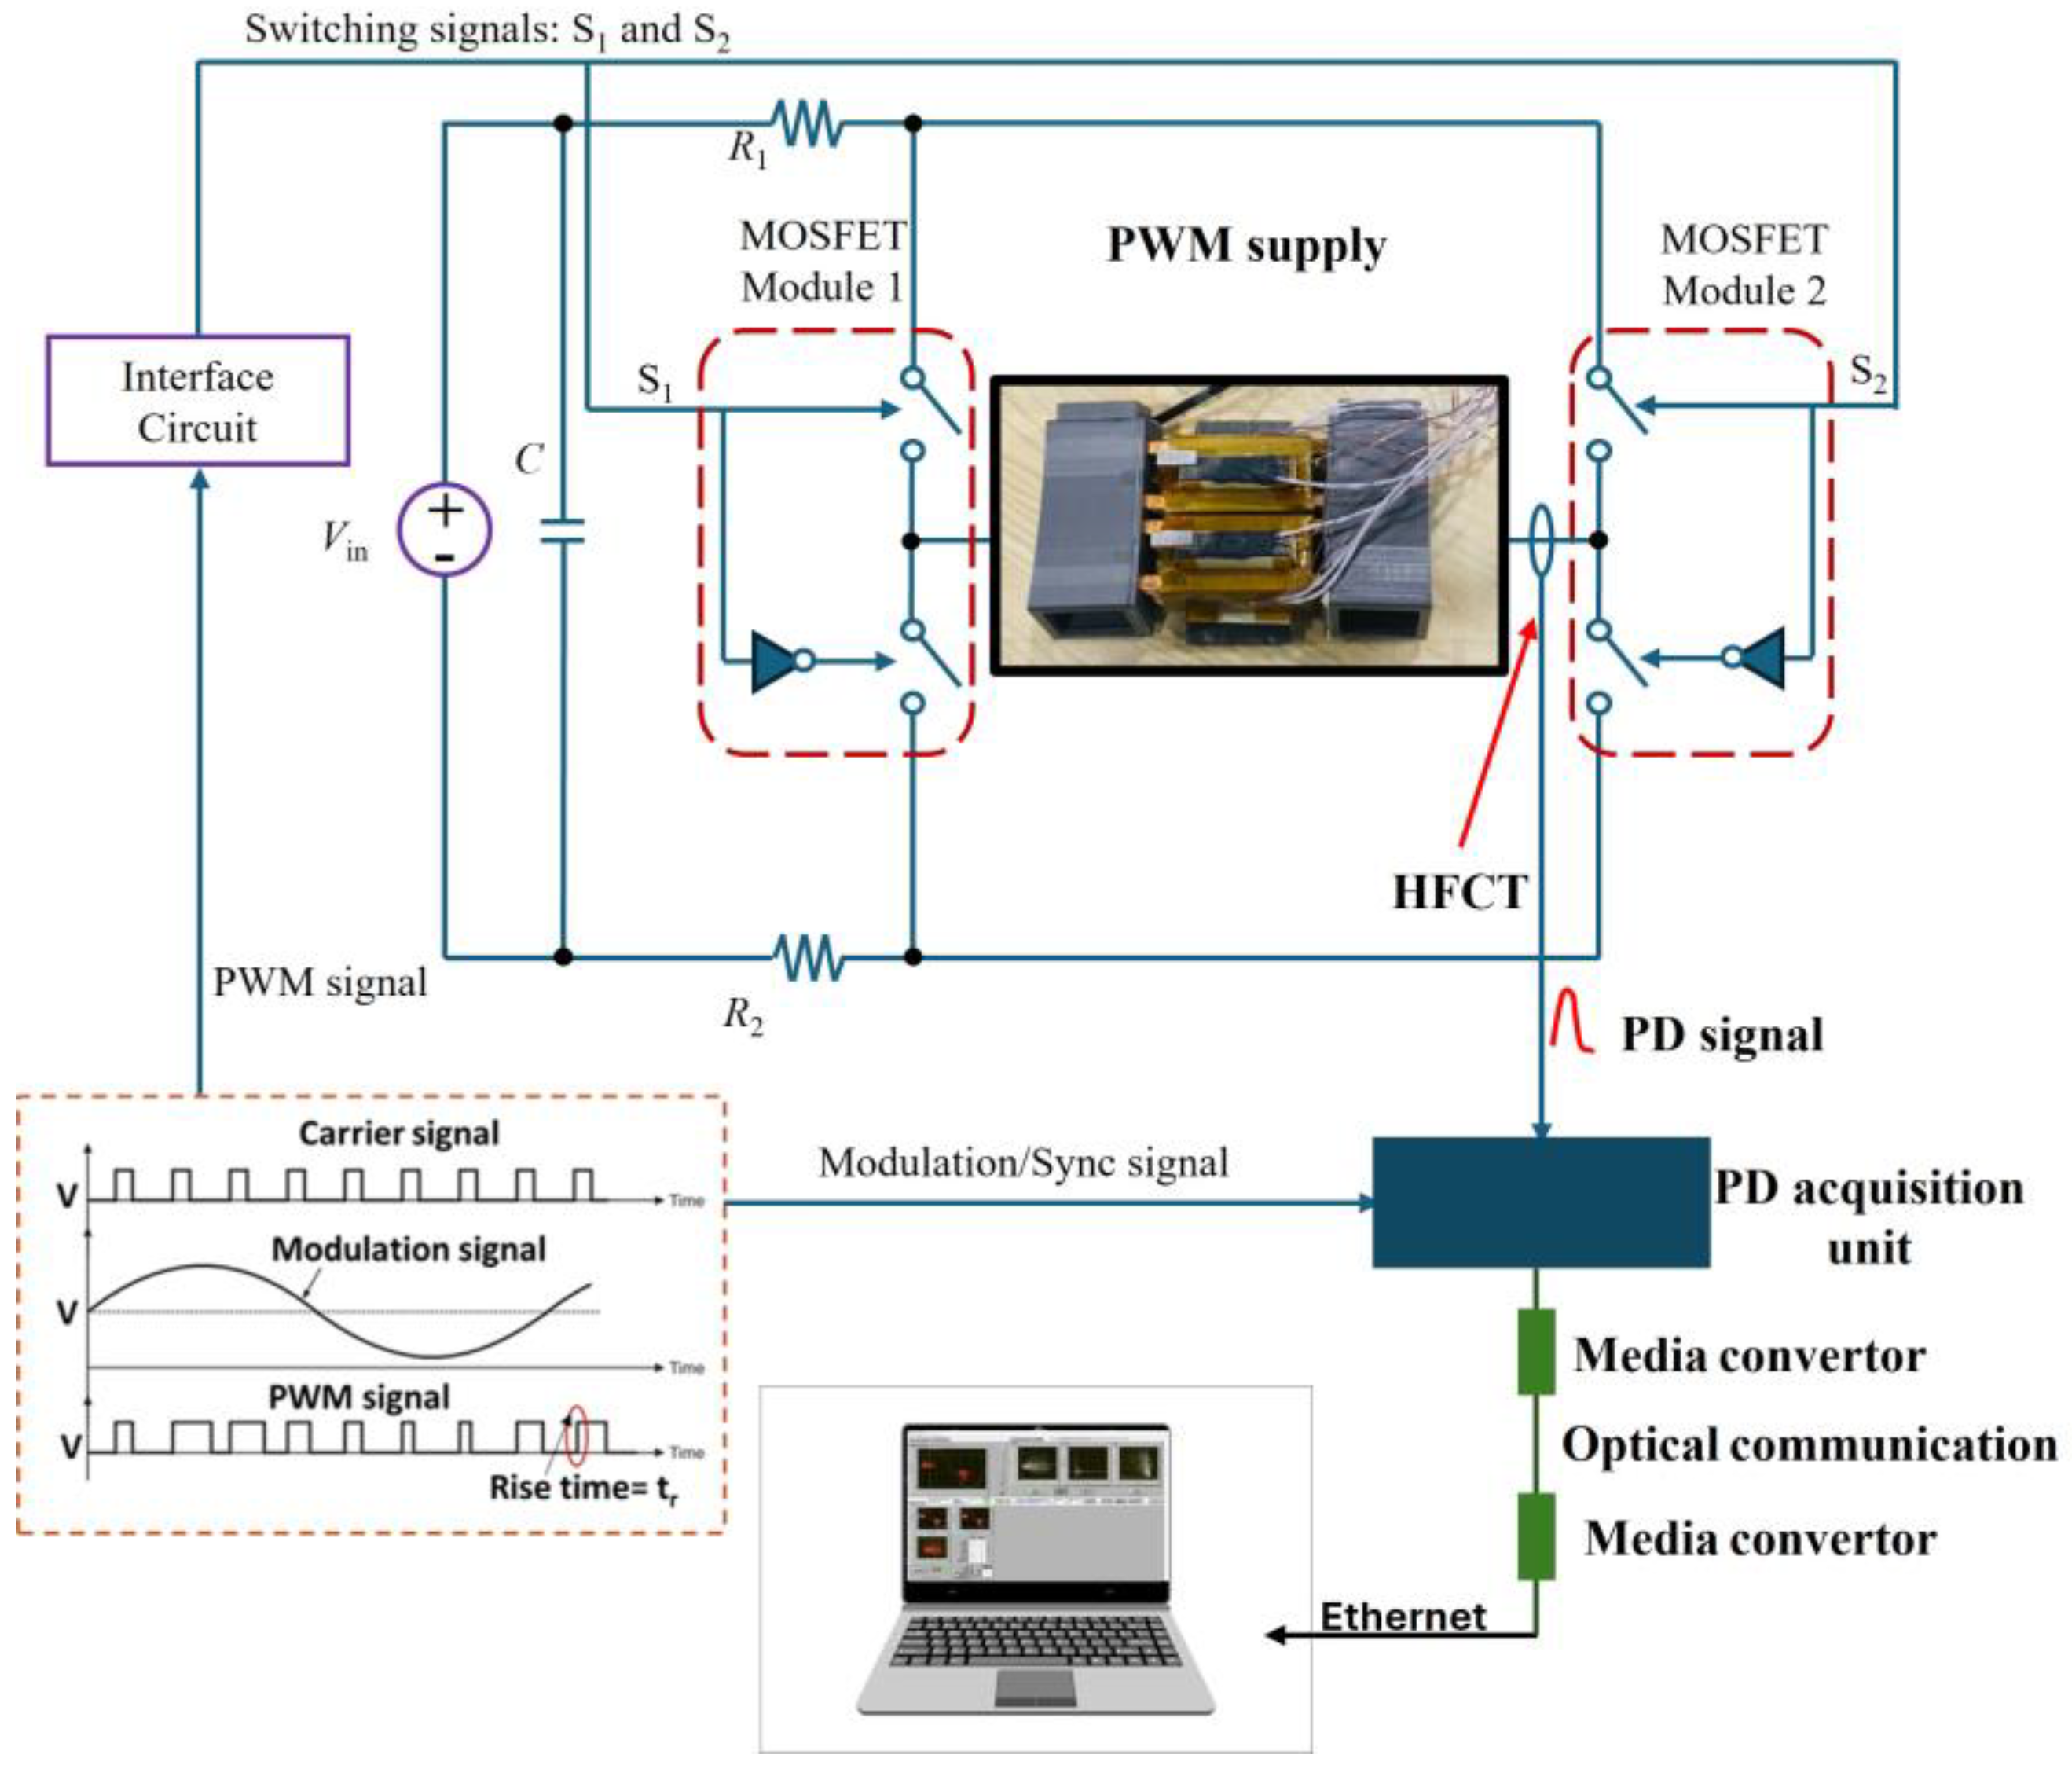
The schematic of the 2- and 3-level converters used in this work is shown in
Figure 10. A generator produces two signals: a modulated AC (PWM) one and its fundamental component. The modulated signal is transmitted via optical fiber to a PWM generator, which is based on MOSFET half-bridge modules. The test object, i.e., the motorette, is connected in between the mid-point of each module, being supplied therefore by an inverter with 2-level and 3-level output capability. An HFCT is installed on the grounded wire of the test object to sense PD pulses. Both detected PD pulses signal and fundamental wave from the signal generator are acquired by PD detector/acquisition unit (Rugged Monitoring, 1415 Frank-Carrel, Suite 230, Quebec, QC-G1N 4N7, Canada).
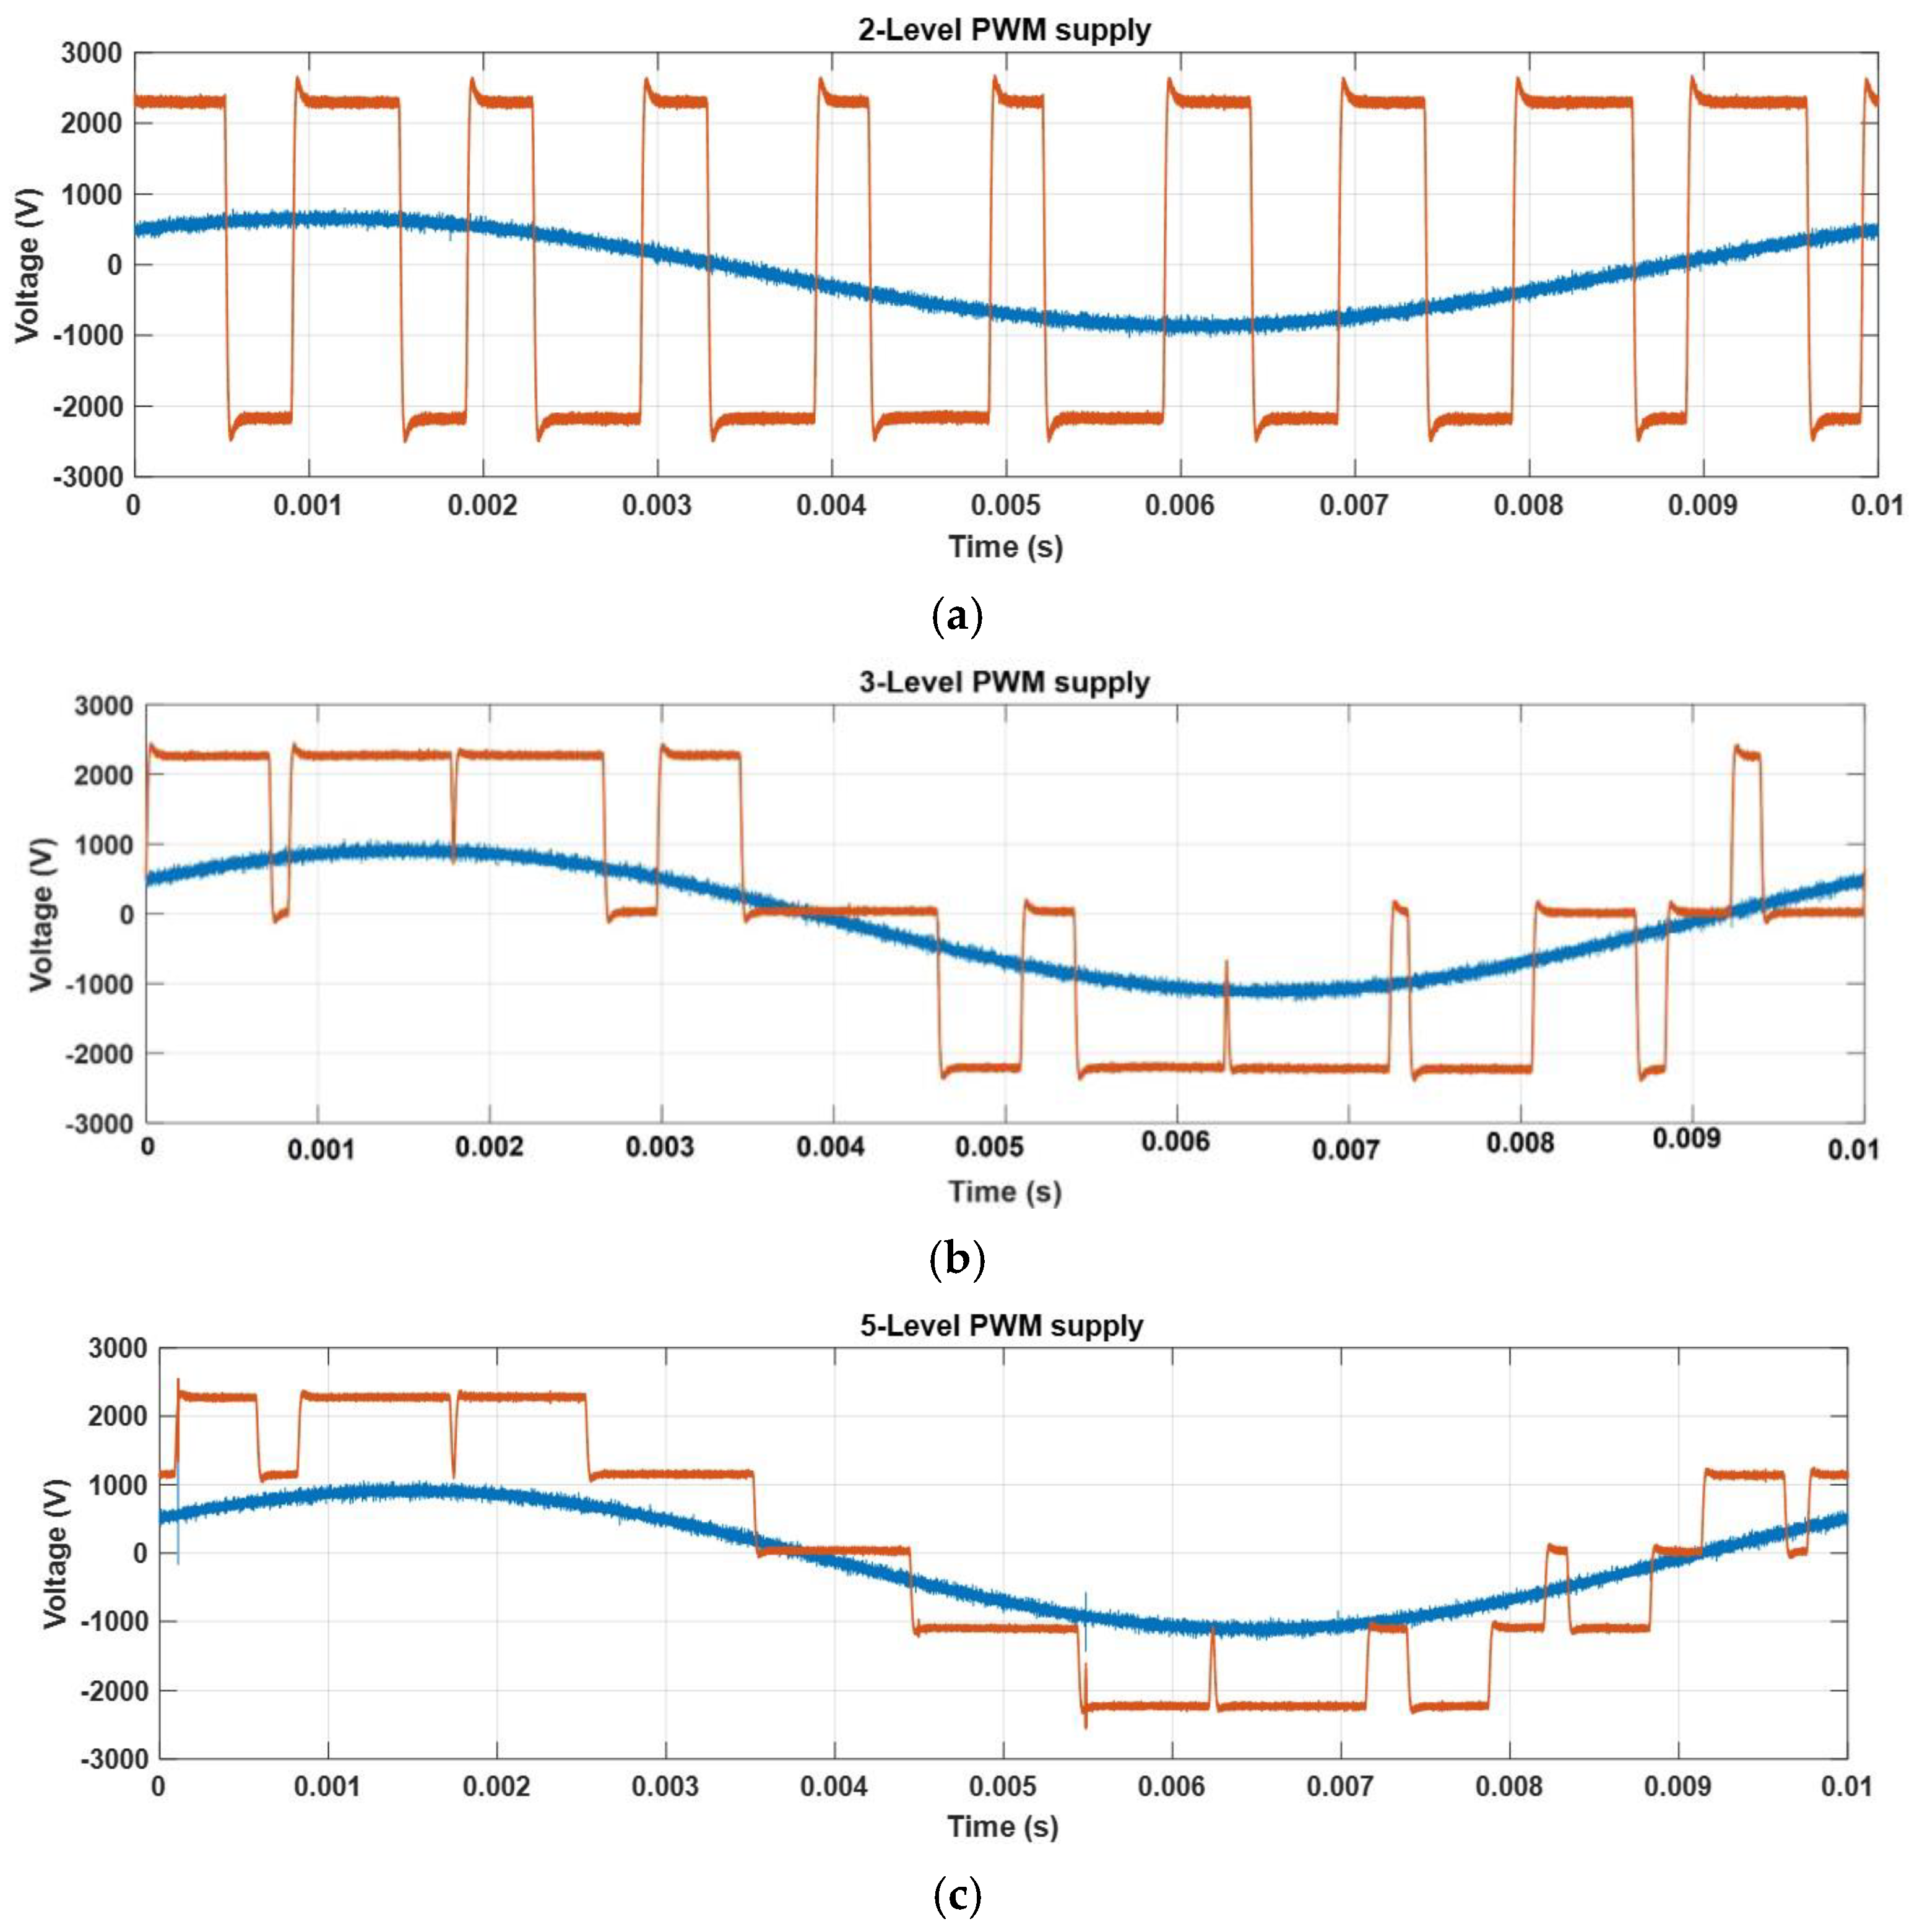
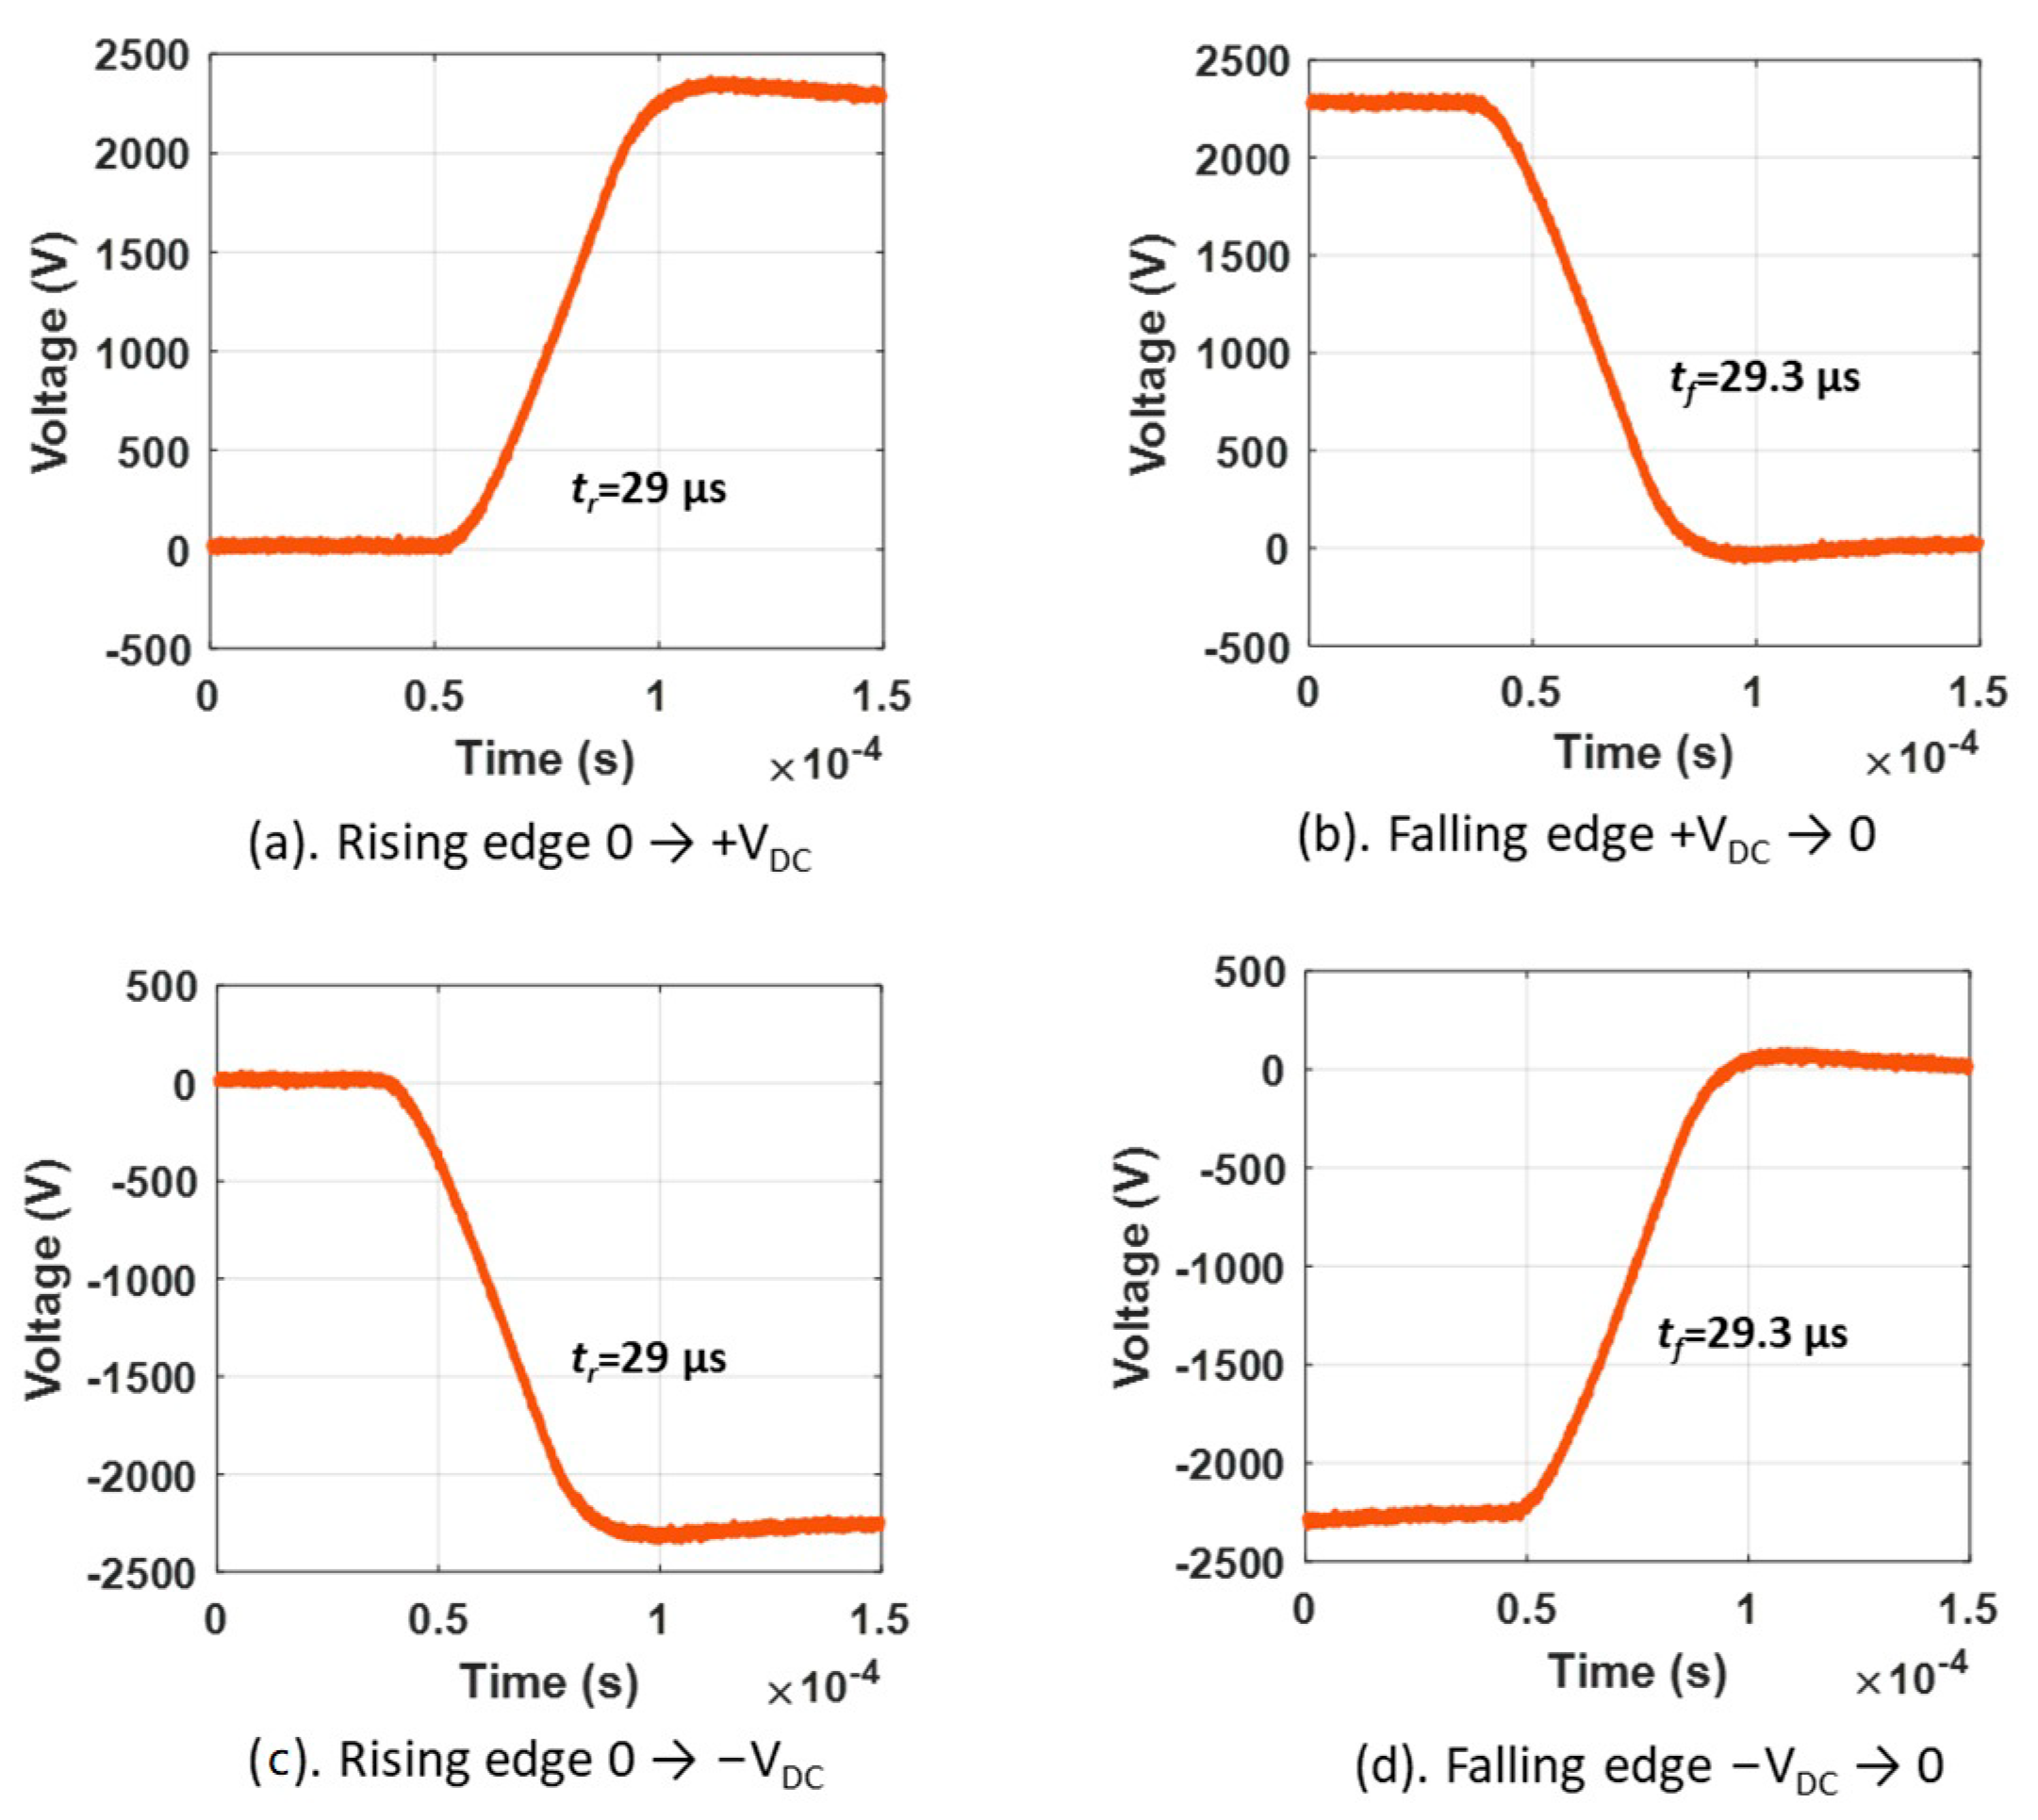
Examples of obtained waveforms using different PWM level signals and rise times are displayed in
Figure 11, zooming on rise and fall times for 3-level PWM in
Figure 12.
4. The PDIV Measurement Technique/System Under Sinusoidal and PWM Voltage
PDIV was recorded as the mean values, over 3 to 5 measurements, of the voltage at which PD are steadily established on the object under test (according to IEC 60270 [
11]). The RPDIV, i.e., repetitive partial discharge inception voltage concept defined in [
8] was also estimated.
In order to measure PD, an innovative PD detector, for both AC and PWM, was used providing fully automatic acquisition and analytics (the latter according to the SRI, Separation, Recognition, Identification, approach [
12,
13,
14]). The output is not only PD magnitude and repetition rate, but also effective noise rejection (through separation and recognition) and PD typology (internal, surface, corona in descending order of harmfulness) identification, relying upon AI (fuzzy logic) algorithms.
Noise, that is always an issue for PD measurements whatever the voltage waveform, becomes a cumbersome issue under power electronics, especially when switching components have very fast commutation [
15,
16]. Going towards MOSFET and GaN technologies, switching times of few tens on ns are becoming common, and the switching related noise can be so high to largely exceed PD pulse magnitude [
17]. In addition, with fast rise times and /or overvoltage compared to PDIV, PD pulses tend to occur during rise and fall times, thus the S/N ratio to make PD practically undetectable.
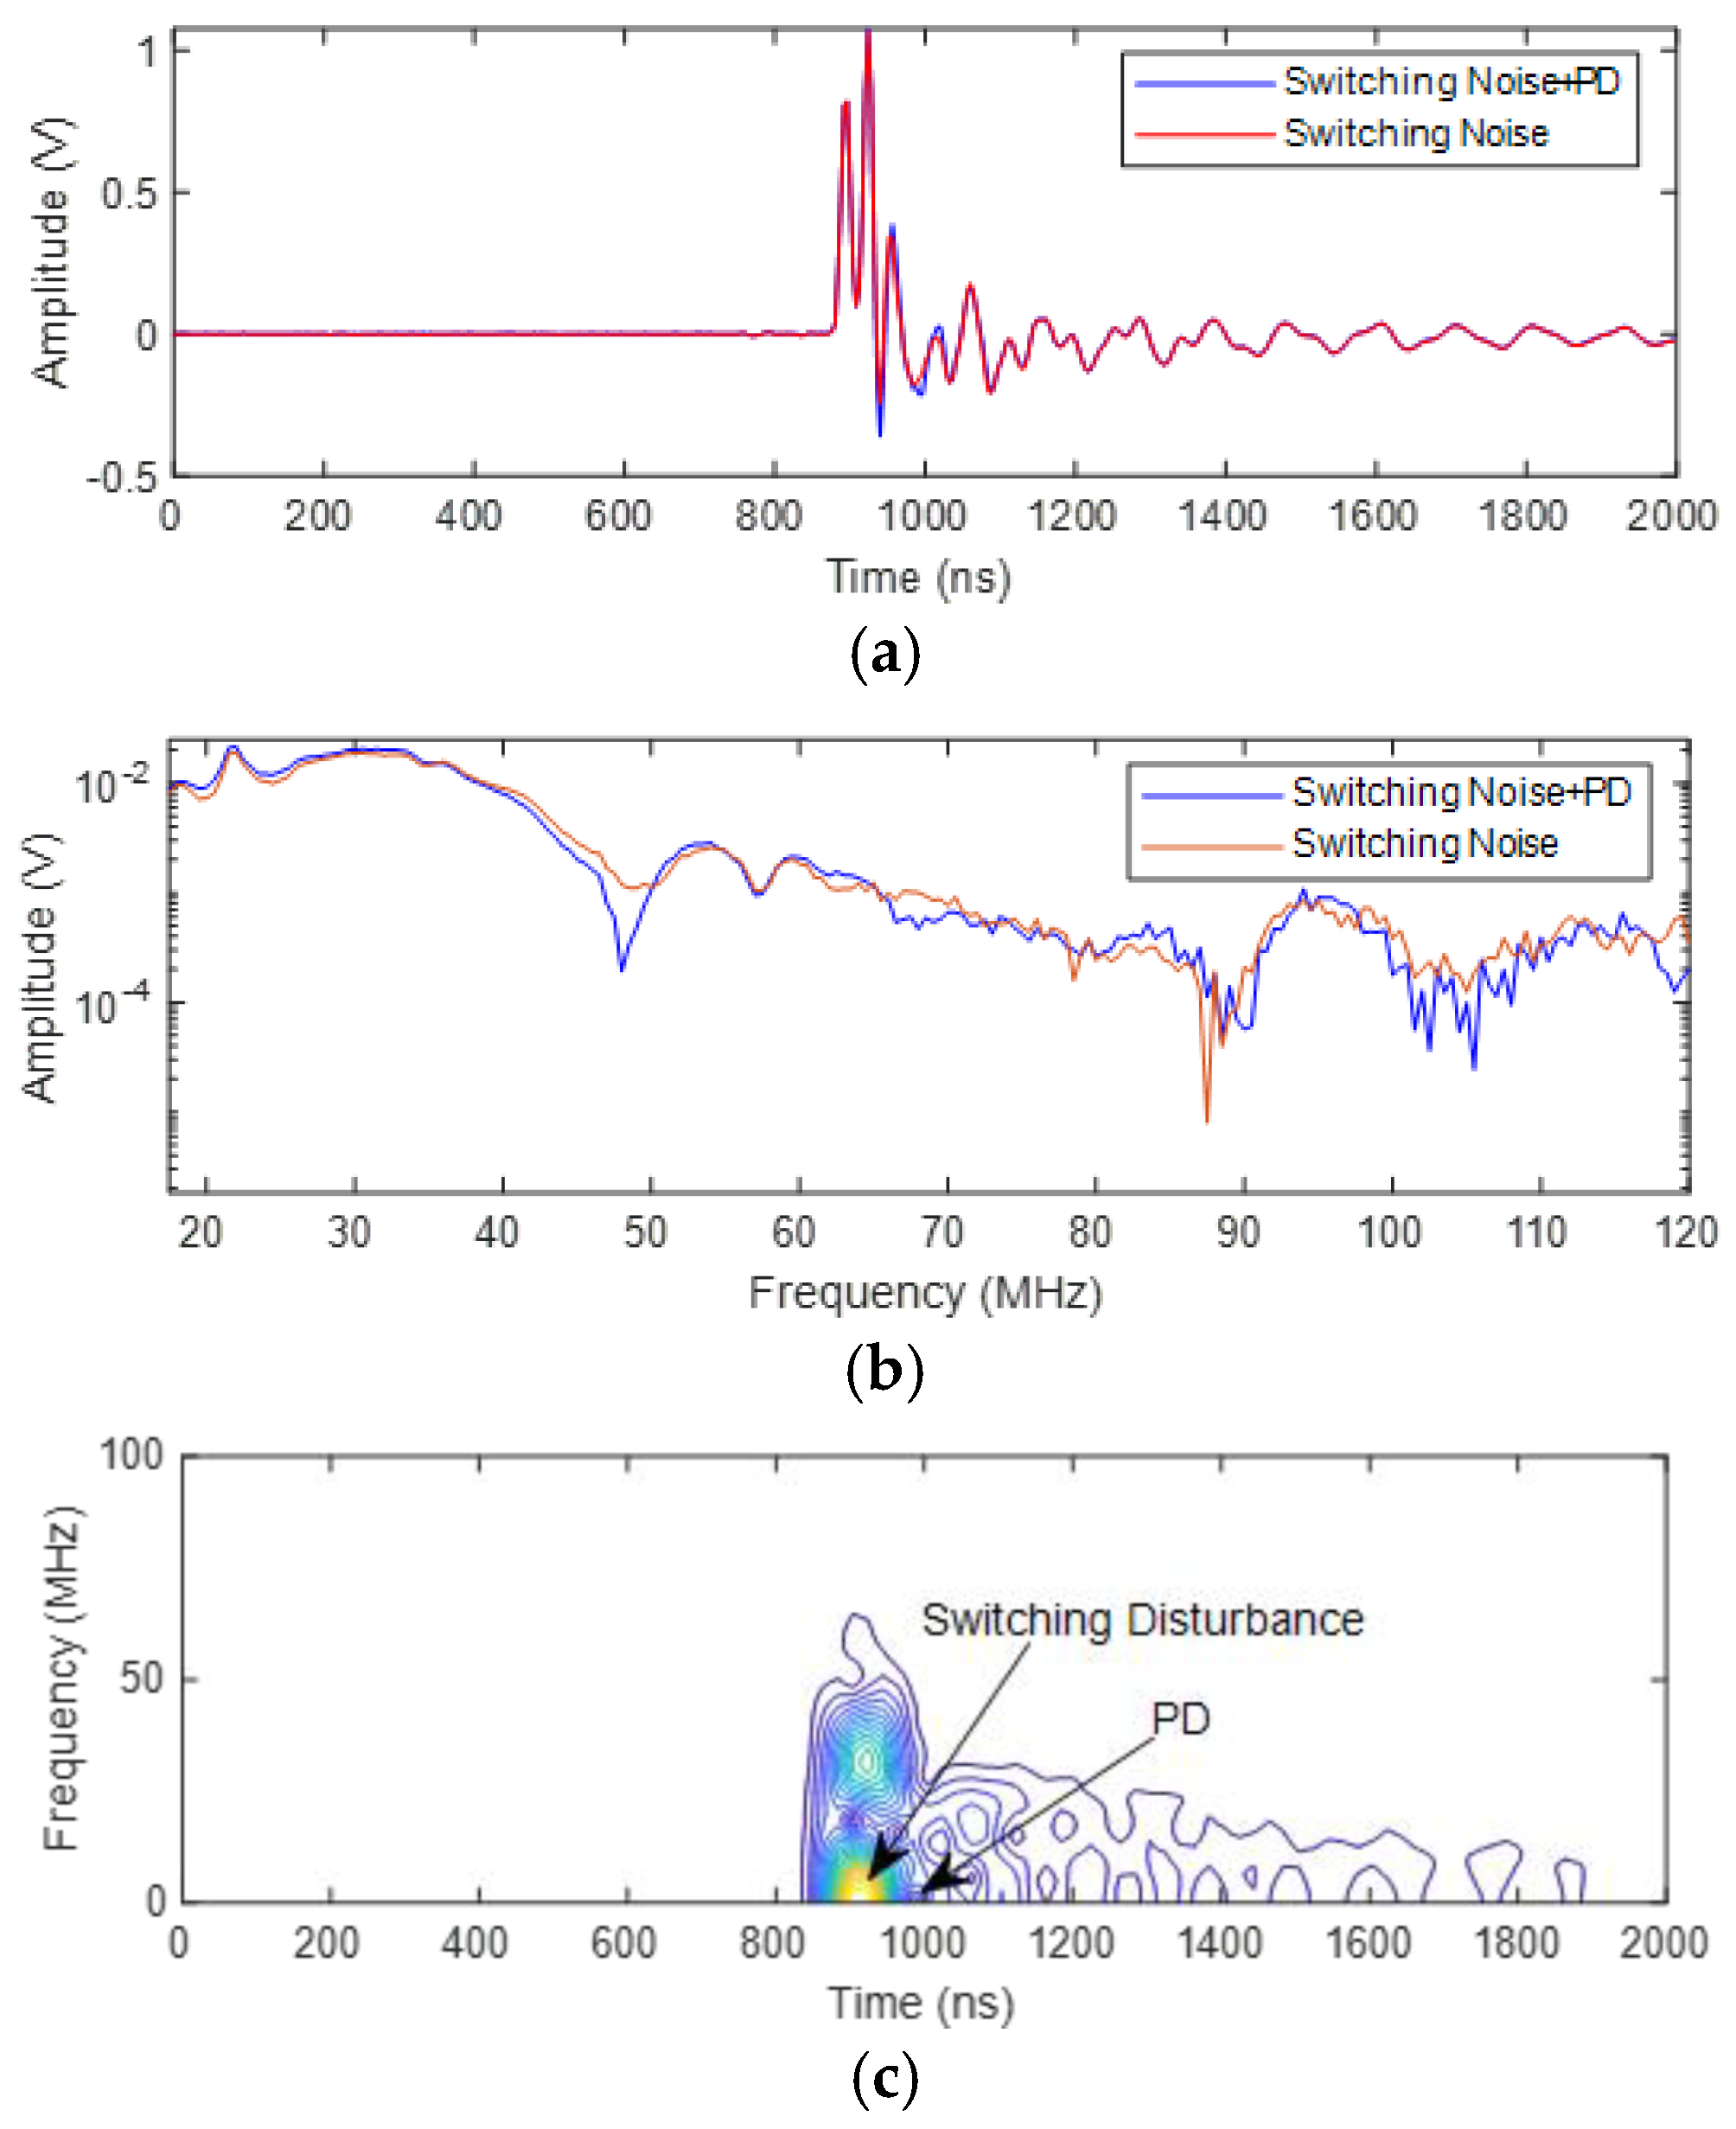
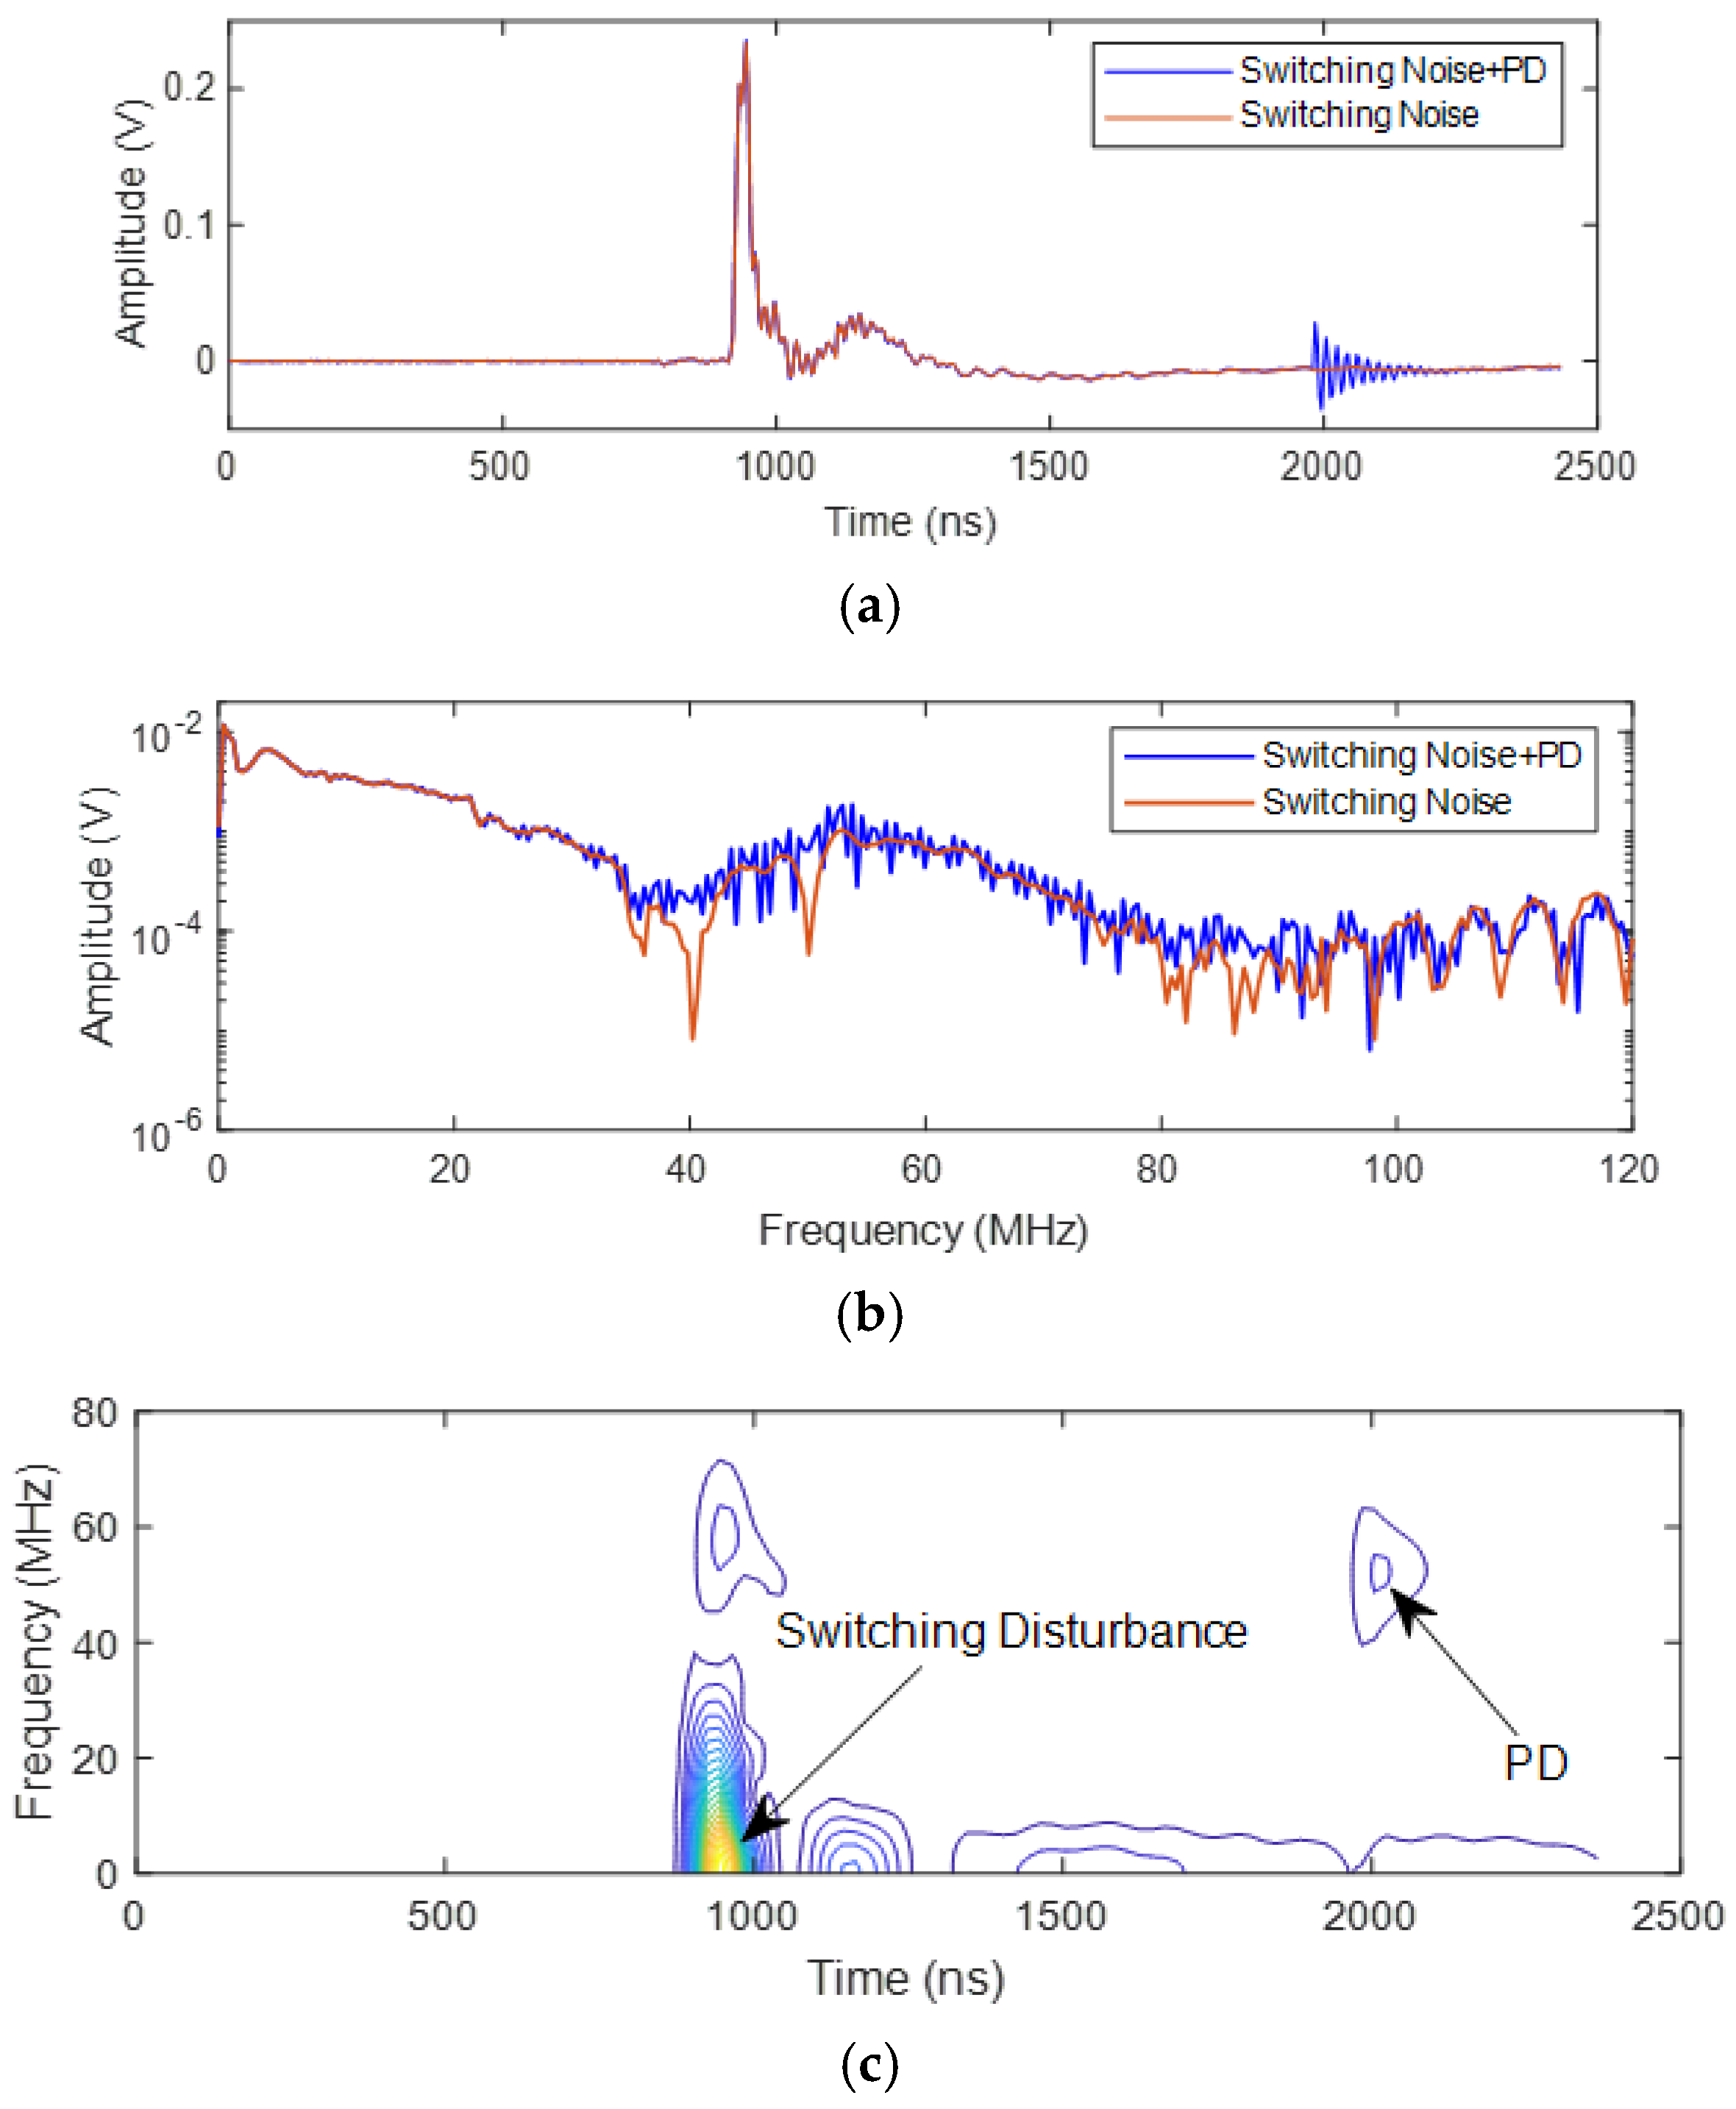
Figure 13 highlights that with a high slew rate, the bandwidth of switching can become so small noise and PD pulses can be almost overlapping unlike what happens with a low slew rate, see
Figure 14. In the latter case, hardware filters, designed as in [
17], can be effective to reduce switching noise and improve S/N, while in the former case hardware filters would attenuate both PD pulses and switching noise, in any frequency interval. Therefore, alternative solutions are needed to handle such a PWM-related issue.
An innovative approach for improvement of S/N with fast power electronics switches is presented in [
18]. It is based on a new idea: considering that switching noise impulses are almost deterministic, while PD pulses have stochastic components (in magnitude and occurrence time), subtracting the mean deterministic component on a time series of acquisitions should prompt PD pulse extraction, even when PD amplitude is much lower than noise magnitude.
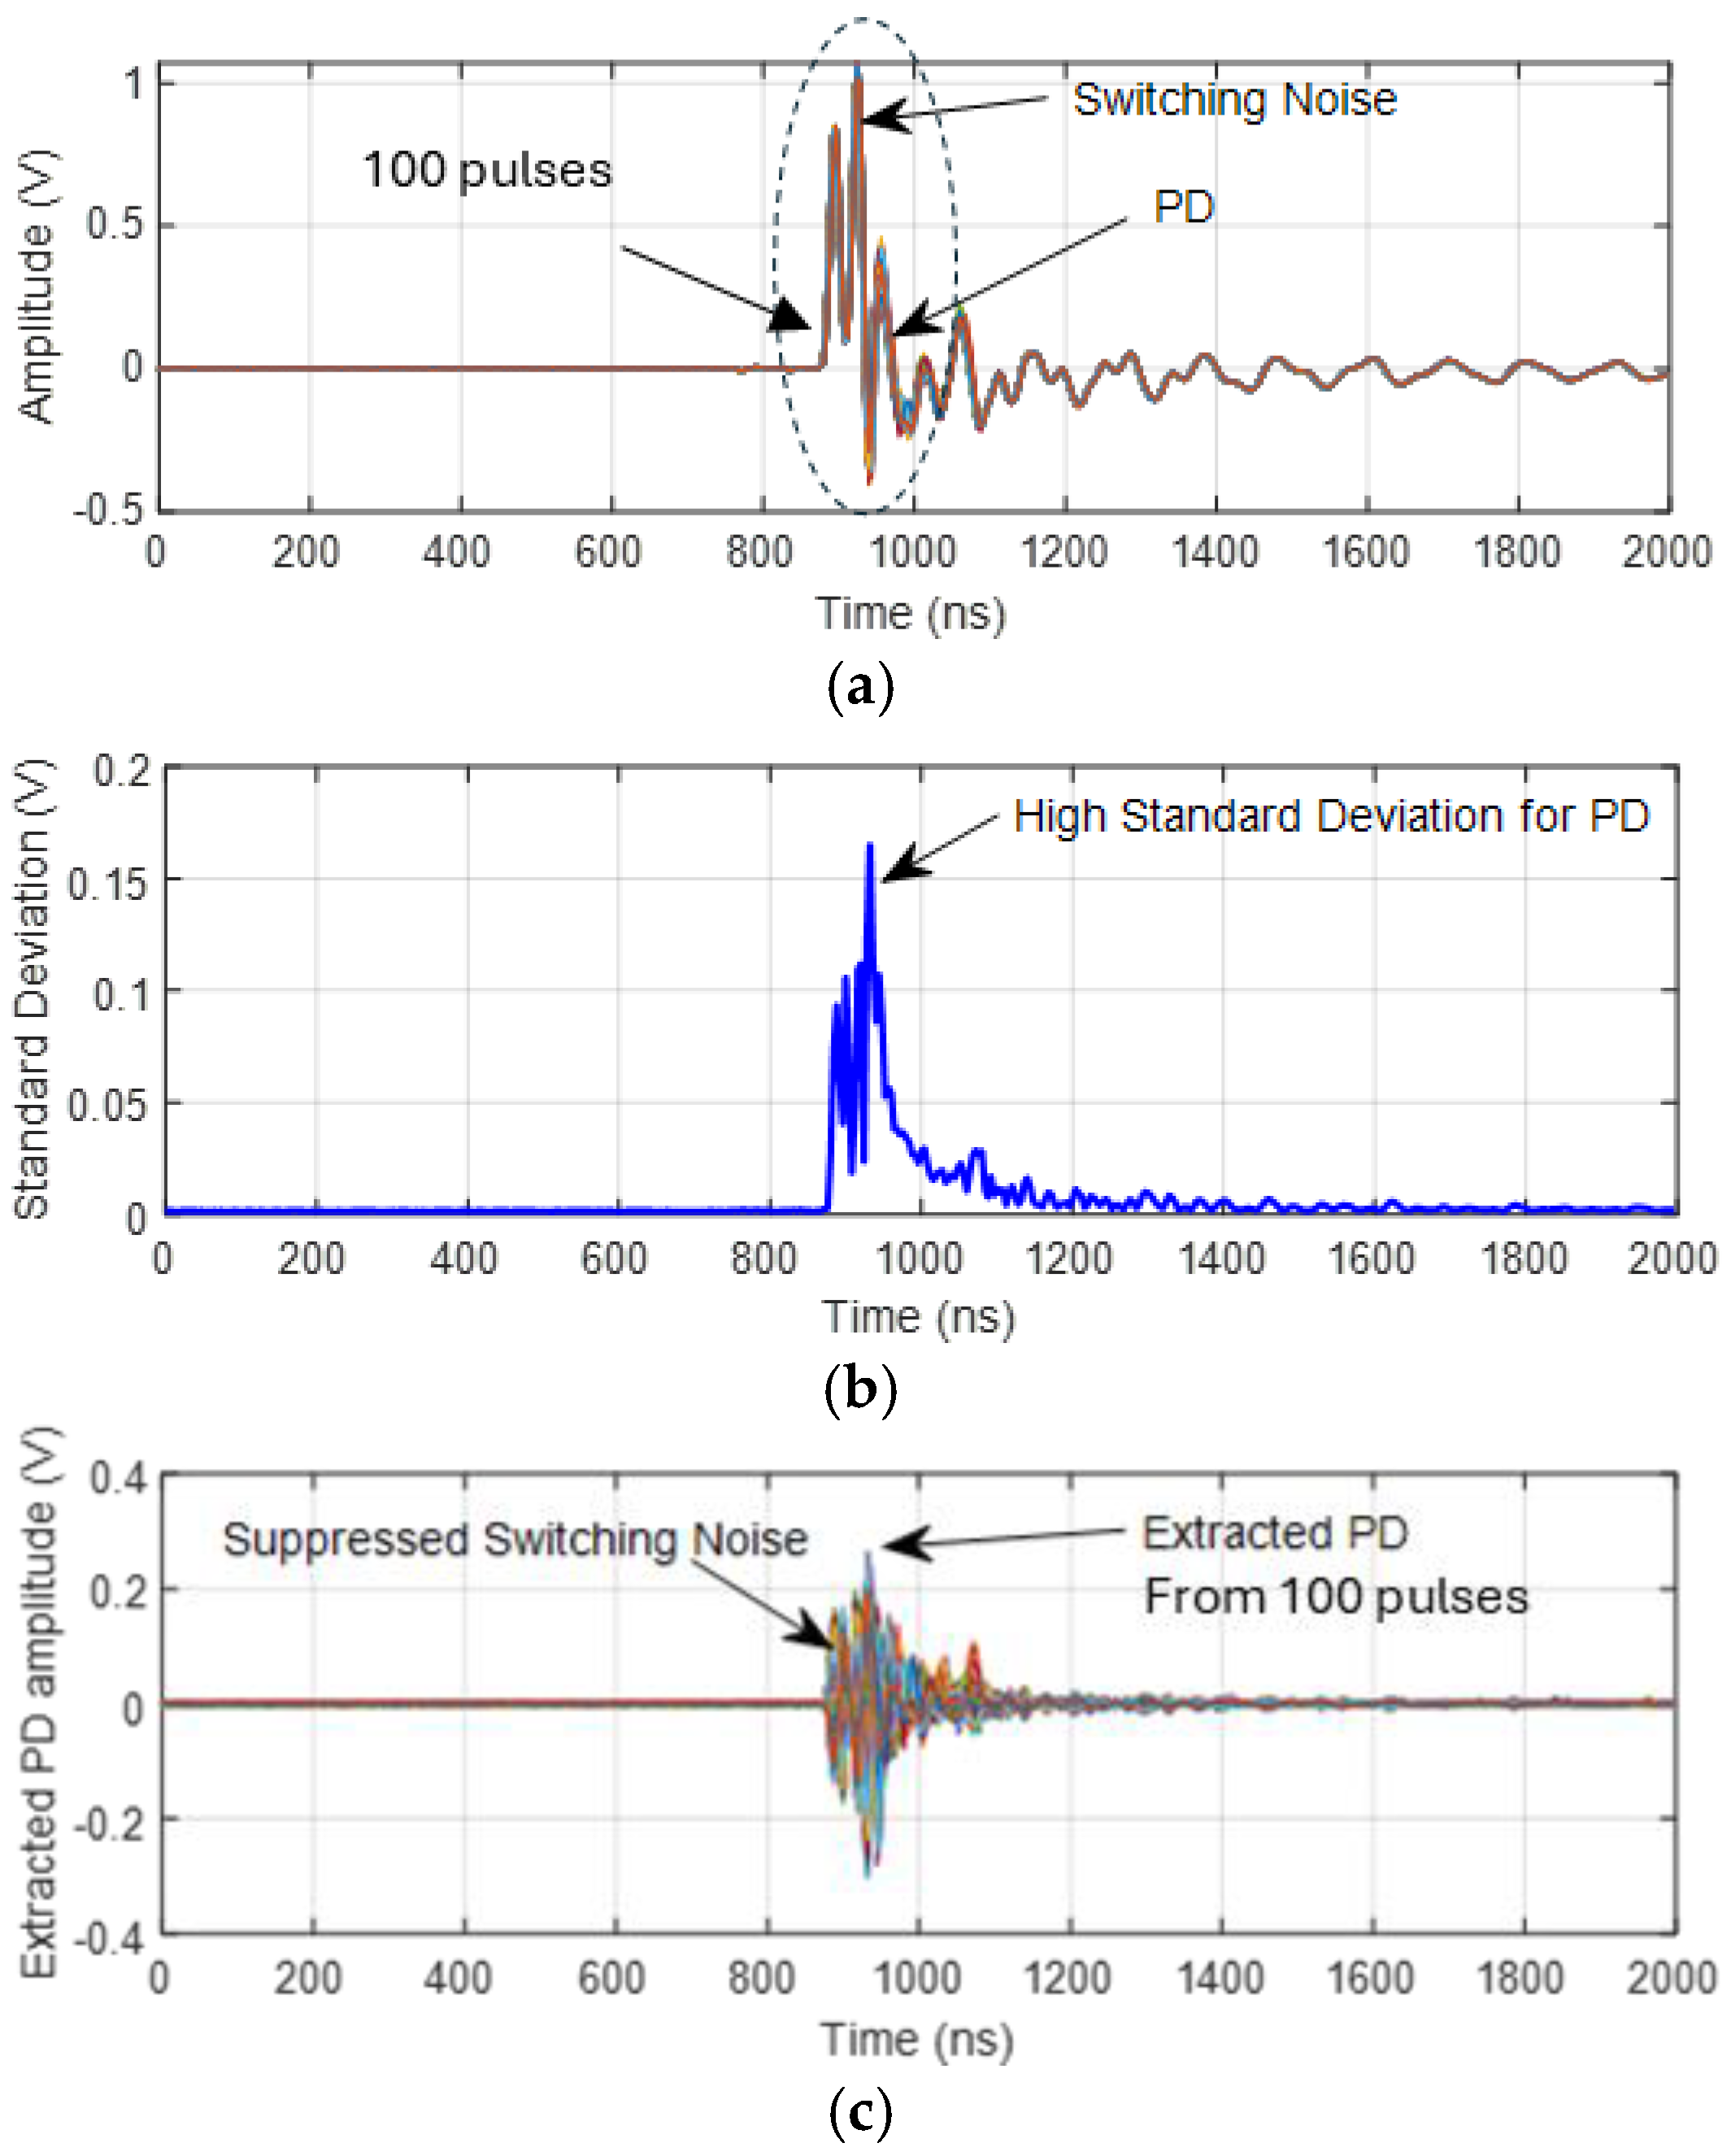
Figure 15 illustrates synthetically how the time domain filter works and how PD pulses can be automatically extracted once pointed out by a standard deviation test.
Figure 15a contains multiple acquisitions (100 in this specific case), each one comprising switching noise and possible PD pulses. Furthermore,
Figure 15b presents the standard deviation across these pulses, while
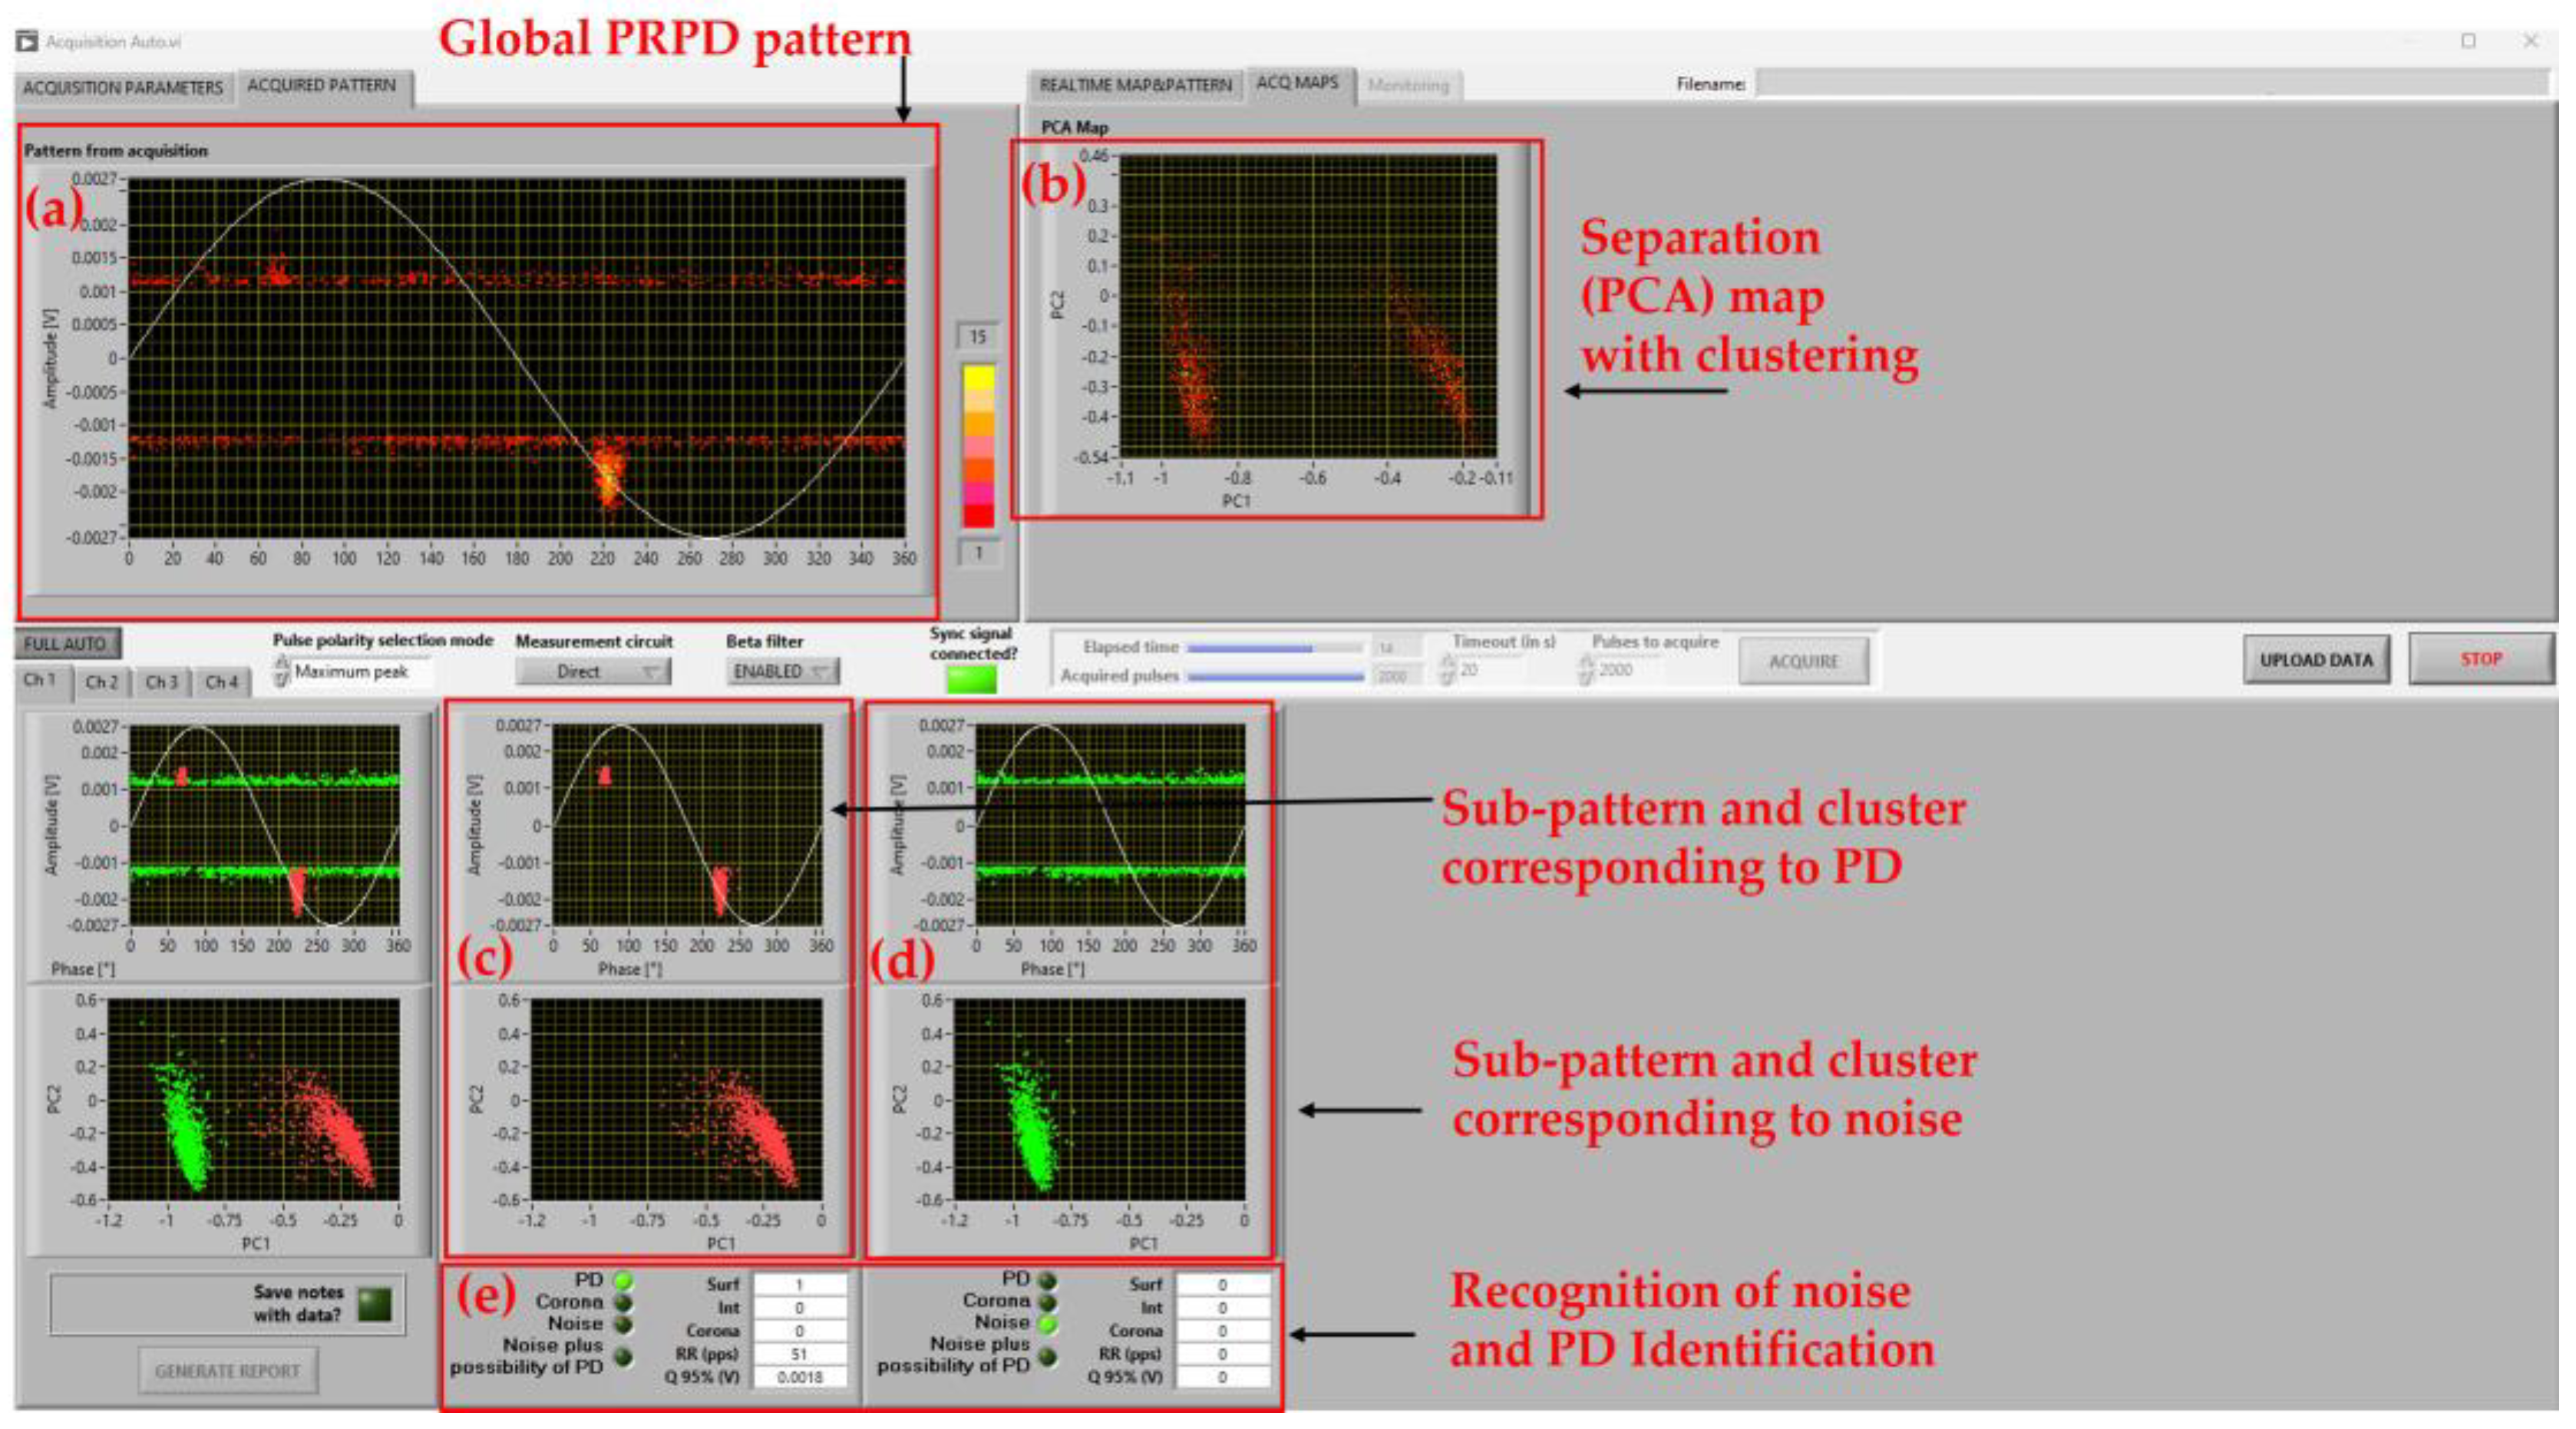
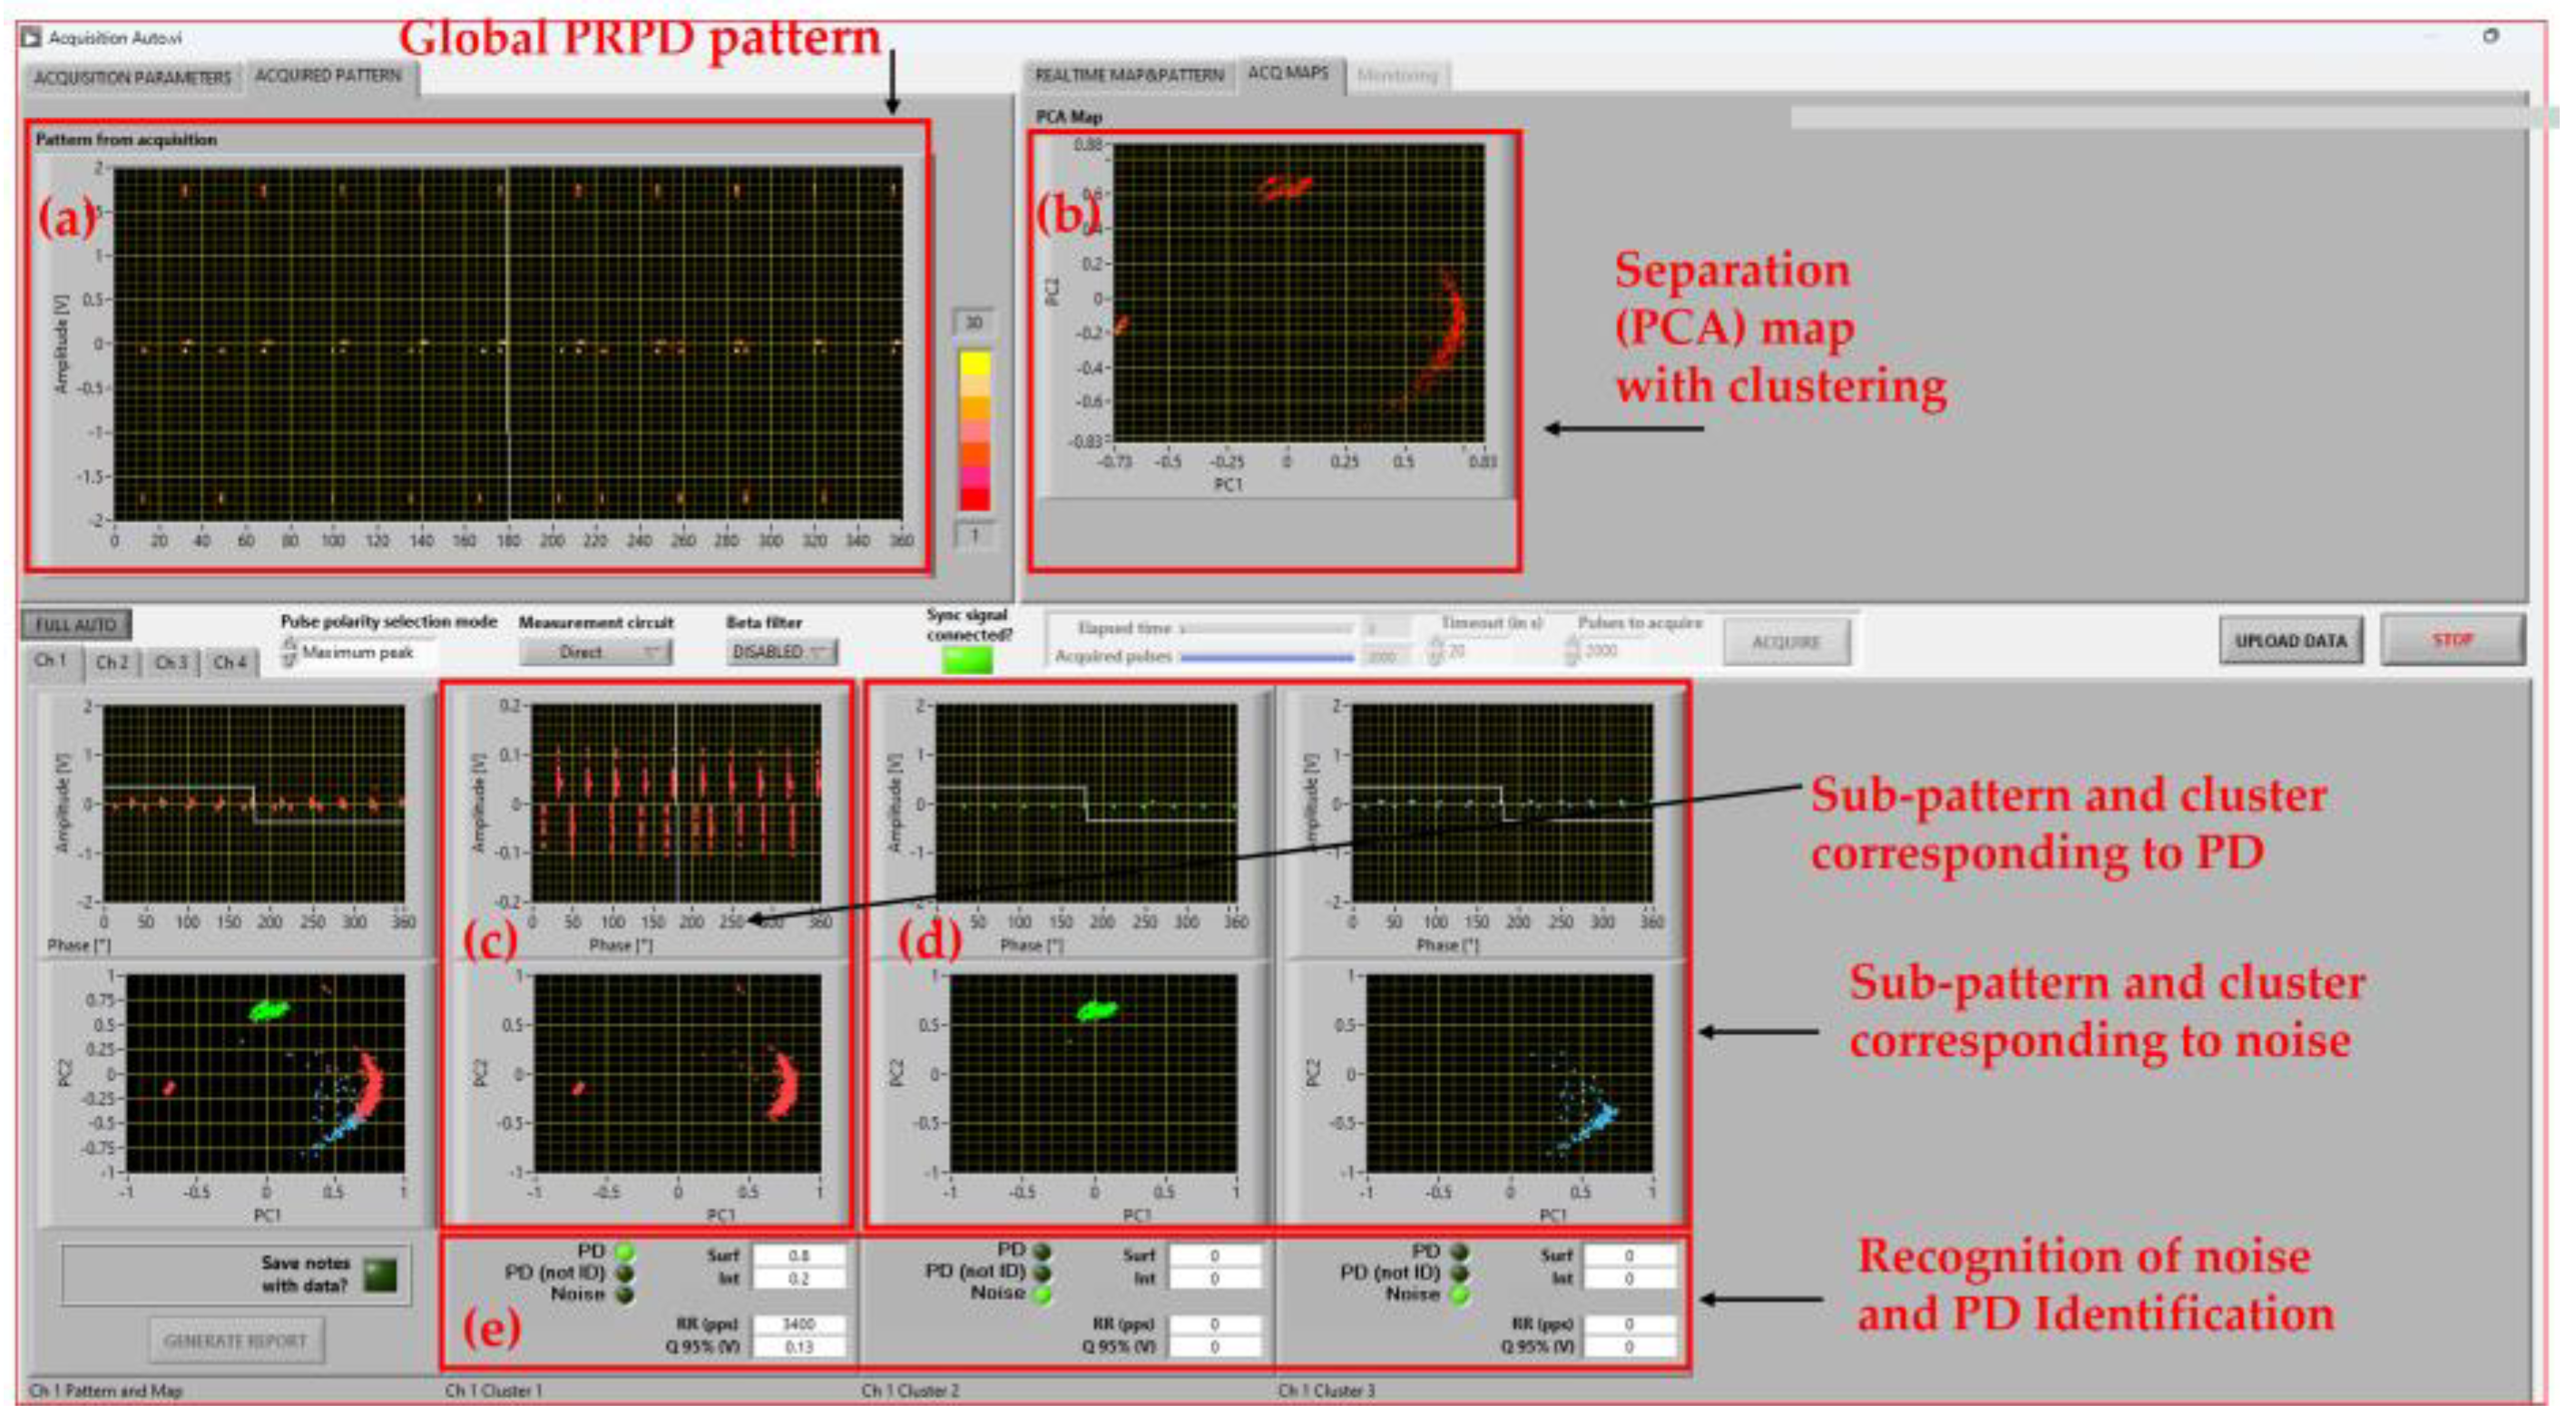
Figure 15c displays the extracted PD pulses. After time-domain filtering, the SRI approach is applied, as for AC, in order to separate and reject residual noise, and identify the type of PD source (internal or surface). And example of software screenshot is displayed in
Figure 16 and
Figure 17, referring to PD tests carried out on the motorette insulation technology 2 under AC sinusoidal and PWM waveforms, respectively (the latter in two-level configuration, slew rate 10.6 kV/µs modulation and carrier frequencies as 100 Hz and 1 kHz, respectively). Figures contain explanation of SRI application, and it can be seen that identification is, in both cases, prevailingly surface PD (identification of PD typology uses AI and it provides its likelihood).
Since the measurement was carried out above the PDIV, the global pattern was expected to contain the switching pulses along with PD pulses and background noise. Considering the SRI capabilities of the monitoring system/software (described above), it was expected that the PD pulses will be extracted from the switching noise (by the time domain filtering), then PD signals and background noise be separated, which has been performed by the software successfully, as shown in
Figure 17. In addition, it was confirmed that the insulation electrode interface was initiating surface discharges at PDIV, which is confirmed by the identification of the extracted PD activity as surface PD with likelihood of 80%.
Similarly, referring to
Figure 16, considering PD measurement under AC, the global PD pattern was expected to contain both the PD signals and noise, that was separated as noise and PD, and then identifying the PD typology as predominantly surface PD, as shown in
Figure 16.
5. Experimental Results and Discussion
A summary of experimental results is collected in
Table 1. The mean PDIV values under AC sinusoidal and modulated, under two-level PWM configuration are summarized in order to highlight some major takeovers. PWM testing is carried out with modulation frequency = 100 Hz, carrier frequency = 1 kHz, and slew rate = 0.2 kV/μs, 2 levels. Onward in this paper, motorette insulation technology 1 and motorette insulation technology 2, will be mostly abbreviated as M1 and M2, respectively.
From a qualitative point of view, it can be seen that under both AC sinusoidal and AC modulated, PDIV shows a significant increase for M2, confirming the validity of the improved technology approach. Therefore, it can be speculated that both AC sinusoidal and PWM waveforms can provide qualitative evaluation of technology improvement in motorette/motor stator manufacturing. Both types of waveforms yield coherent indication that the performance of M2 is superior, for the considered insulation sub-systems of
Figure 5.
Table 1 highlights that under AC sine wave excitation, the M2 demonstrates higher PDIV across all three insulation sub-systems compared to the M1, indicating improved insulation performance. This was indeed expected, due to the increase in insulation thickness (by double, Kapton film wrapping) and the improvement of insulation wrapping to reduce air pockets. For coil-to-ground insulation, the PDIV increases by 41%, going from 3.4 kV (M1) to 4.8 kV (M2). Similarly, for coil-to-coil insulation, the PDIV increases from 4.2 kV (M1) to 6.5 kV (M2), that is, a 55% enhancement. In the case of turn-to-turn insulation, the PDIV rises by 35%, from 4.0 kV (M1) to 5.4 kV (M2).
Notably, the insulation performance of the M1 displays significantly lower PDIV values compared to its performance under AC sinusoidal supply, due to uneven electric field distribution caused by high frequency and slew rates. This uneven distribution increases stress on the first turns, reducing the voltage threshold for partial discharge inception. For example, at SAP, the coil-to-ground PDIV of the M1 under PWM is 2.2 kV compared to 3.4 kV under AC sine. The same trend can be seen for the M2 as well.
Although PDIV improvement because of increased thickness is anticipated, key objectives of this paper are to compare AC and PWM measurements in terms of the capability to provide qualitative and quantitative information on the capability of design modification of varying PDIV. For this purpose, two different design solutions were compared. Under PWM excitation, where the insulation is subjected to high-frequency voltage stress, the M2 again exhibits the most substantial rise in PDIV across all insulation systems. For coil-to-ground insulation, the mean PDIV improves from 2.2 kV (M1) to 3.9 kV (M2), a 77% increase. The coil-to-coil insulation experiences a notable enhancement, with PDIV increasing by 61%, from 2.6 kV (M1) to 4.2 kV (M2). For turn-to-turn insulation, the PDIV scores a 32% growth, from 2.5 kV (M1) to 3.3 kV (M2).
The motorette insulation technology 2 (M2) consistently exhibits higher PDIV across all insulation systems and test conditions, confirming that the improved technology effectively reduce partial discharge risk. The greatest improvement is observed in coil-to-ground insulation under PWM supply (77% increase), which is critical since PWM excitation imposes higher electrical stress particularly to coil and ground insulation. The results confirm that the M2 offers better insulation performance and reliability, particularly under high-frequency switching conditions seen in PWM-driven applications.
Table 2 presents mean PDIV values for M2 insulation systems, focusing on different PWM characteristics, and comparing them with those obtained under AC 60 Hz sinusoidal voltage. The study under PWM supply was carried out using different PWM level configurations (i.e., 2-level PWM, 3-level PWM, and 5-level PWM) and slew rates (SR). Under 2-level PWM configuration, PDIV is measured for two SR values, i.e., high SR and low SR, while for 3-level PWM and 5-level PWM, the PDIV is measured for slow SR.
As can be seen, the PDIV varies based on PWM level configuration and slew rate (SR). In a 2-level PWM system, a higher slew rate (9.8 kV/μs) results in a lower PDIV (3.7 kV), while a lower slew rate (0.059 kV/μs) determines an increase in PDIV to 4 kV. This indicates that higher slew rates impose greater electrical stress, lowering partial discharge inception voltage. The PDIV increases with the number of PWM levels, reaching 4.15 kV with 3-level PWM (slew rate of 0.057 kV/μs) and 4.3 kV with the 5-level PWM (slew rate 0.056 kV/μs).
The difference (decrease) in PDIV and RPDIV when increasing the number of PWM levels is critically investigated in [
19], showing that the reduction in level step magnitude, thus of the jump voltage [
8,
18], affects PD event distribution (especially considering RPDIV).
As regarding comparison with AC sinusoidal voltage, 60 Hz, it can be seen from
Table 2 that AC voltage yields the highest PDIV values for all sub-systems.
Overall, PDIV behavior is influenced by both PWM levels and the slew rate. Higher slew rates reduce PDIV, while multi-level PWM configurations increase PDIV of the insulation systems. In general, under AC supply, the PDIV is higher than the PWM supply system. However, when using 5-level PWM configurations, the difference of PDIV values diminishes. This also implies that for insulation systems that are exposed to PWM-driven voltages generated from a higher-level PWM (and lower slew rates), PDIV testing under AC can provide only a qualitative, rather than quantitative, PDIV estimation.
Summarizing, from the quantitative point of view it is clear that depending on PWM waveform characteristics, PDIV values can be sensibly different from results obtained under AC sinusoidal voltage, thus PWM waveform characteristics may have a significant impact on PDIV evaluation. In particular, the lower the slew rate and the higher the level number, the closer the estimates coming from PWM and AC sinusoidal (referring to the peak voltage). The mean PDIV values obtained by the five-level inverter supply almost coincident with those measured under AC sinusoidal. Those provided by the two-level inverter with a lower slew rate and carrier frequency are also near to AC sinusoidal PDIV, and they are higher than the PDIV values obtained using the two-level inverter with faster rise time and higher carrier frequency. This holds for the three insulation sub-systems of motorette. Therefore, it can be argued that testing motor stators for the purpose of quantitative PDIV estimates useful for quality control, commissioning and aging evaluation should be carried out, when off-line, by supply waveforms which replicate the service one.
6. Conclusions
As a summary and conclusion, it can be argued that while reasonable qualitative evaluations on technology modification (insulating materials, thickness, etc.) for motor stator insulation can be achieved also by using sinusoidal AC waveforms, quantitative estimates of PDIV, suitable for qualification and design improvement must resort to PWM supply waveforms that are as close as possible to the final application. This does not contradict IEC 60034-18-41 and 42, which still allow sinusoidal AC voltage to be used, but it indicates that quantitative PDIV estimations, as needed for insulation system design validation and modification, as well as for quality control and commissioning tests, should be carried out referring to the real operating supply motor waveform.
Specifically, the study presented here shows that the PDIV is affected by both the slew rate and the number of PWM levels, which can be assessed only through real PWM supply. The difference in PDIV and RPDIV between AC sinusoidal and PWM supply diminishes as the number of PWM level increases.


