1. Introduction
High-voltage induction motors are fundamental to industrial operations, especially in power plants where operational reliability is closely linked to economic performance. Insulation failures in the stator windings of such motors can lead to severe cascading faults, potentially resulting in extensive operational disruptions and substantial economic losses. These issues highlight the necessity for in-depth academic analysis of insulation systems and systematic research into effective maintenance strategies to ensure operational stability [
1].
Previous academic studies have extensively focused on complete rewinding procedures supported by various insulation diagnostic techniques, including online insulation monitoring, predictive maintenance using big data, thermal aging assessments, and partial discharge (PD) pattern analysis [
2,
3,
4,
5,
6]. While these approaches provide significant insights into the optimal timing for comprehensive rewinding, they often lack a theoretical exploration of cost-effective partial maintenance strategies that can extend the operational lifespan of motors without complete disassembly. Moreover, existing research does not sufficiently address localized arc discharge issues at the stator winding slot ends, which frequently result from contamination and structural misalignments. These gaps highlight the need for targeted maintenance approaches that are capable of addressing localized insulation degradation without incurring unnecessary costs or prolonged downtime, thereby advancing our academic understanding of localized insulation failure mechanisms [
4,
5,
6,
7].
To systematically address these research gaps, this study proposes a novel partial maintenance strategy that integrates UV camera-based fault localization with felt-pad insulation reinforcement. This approach aims to provide an academically rigorous analysis of the partial discharge mechanisms and to investigate the impact of localized insulation defect elimination on overall insulation performance [
7]. The use of UV cameras allows for the real-time, non-invasive identification of arc discharge sites, facilitating precise, targeted insulation reinforcement [
8]. By focusing on defect-specific maintenance rather than complete rewinding, this method introduces a theoretically innovative approach to high-voltage motor maintenance [
1,
7].
Although previous research has validated conventional diagnostic methods such as PD analysis and dielectric loss factor (tan δ) measurements, few studies have systematically explored the application of UV camera technology for high-voltage motor maintenance from a theoretical perspective. In this context, the academic contribution of this paper lies in presenting the first documented case where stator winding insulation has been successfully restored through partial maintenance instead of complete rewinding [
4,
8].
This methodology provides experimental evidence linking the removal of localized insulation defects to improvements in insulation reliability, thereby offering a deeper academic understanding of maintenance strategies for electrical machines [
4].
Additionally, a comprehensive literature review has been conducted to establish a robust theoretical framework for this study. The review discusses existing maintenance strategies, including complete rewinding, resin injection methods, and machine learning-based predictive maintenance, and compares them with the proposed UV camera-guided partial maintenance approach [
8,
9]. This comparison demonstrates how the proposed strategy delivers a unique academic contribution by combining targeted defect elimination with advanced diagnostic techniques, which have not been systematically examined in previous studies.
The key academic contributions of this study are as follows:
A systematic review of the existing insulation diagnostic methods and maintenance strategies for high-voltage induction motors is presented, highlighting significant research gaps that are addressed by the proposed approach [
1].
- 2.
Innovative Maintenance Framework:
This study introduces a cost-effective partial maintenance procedure that combines UV camera-based fault detection with felt-pad insulation reinforcement, offering a strategic alternative that minimizes maintenance efforts without compromising reliability [
8].
- 3.
Experimental Validation:
The effectiveness of the proposed approach is validated through extensive diagnostic testing, including insulation resistance measurements, polarization index (PI) evaluations, dielectric dissipation factor (tan δ) tests, and partial discharge analyses. The post-maintenance results confirm a substantial reduction in partial discharge levels, demonstrating the practical and theoretical viability of the method [
7].
- 4.
Theoretical Implications:
Beyond its practical outcomes, this study provides significant academic insights by introducing a targeted maintenance approach that can contribute to the advancement of maintenance theories for high-voltage electrical machinery [
1].
The objective of this paper is to experimentally validate the effectiveness of partial maintenance in enhancing insulation performance and to theoretically explore the mechanisms by which partial discharge suppression can be achieved [
7]. The diagnostic procedures, maintenance methods, and post-maintenance evaluations were systematically designed to align with methodologies discussed in existing literature, thereby ensuring academic coherence and contributing new theoretical insights to the field of electrical machine maintenance.
This research focuses on the maintenance of four 11 kV, 1.5 MW high-voltage induction motors that had been in continuous operation for nine years at a thermal power plant. The diagnostic process involved insulation resistance measurements, polarization index (P.I) evaluations, AC current testing, dielectric dissipation factor (tan δ) measurements, partial discharge analyses, and UV camera inspections [
7,
8]. UV camera diagnostics identified arc discharge locations at the stator winding slot ends, which were addressed through felt-pad insulation reinforcement [
8]. Post-maintenance evaluations demonstrated a reduction in partial discharge levels by more than 80%, with the maintenance duration reduced from over one month to five days and the total cost lowered to approximately 1/50 of the conventional rewinding processes.
This study’s partial maintenance strategy presents an academically significant approach to high-voltage motor maintenance by providing experimental validation of localized defect elimination and theoretical insights into partial discharge suppression mechanisms. The successful outcomes demonstrate that this strategy can significantly enhance the operational reliability and insulation performance of high-voltage induction motors without complete rewinding.
Furthermore, the methodologies and findings discussed herein fill critical research gaps and contribute to the academic discourse on advanced maintenance strategies for electrical machines.
2. Test Methods
This study conducted insulation diagnostic tests on the stator winding of an 11 kV high-voltage motor that had been in operation for nine years at a thermal power plant. The primary diagnostic methods included insulation resistance measurements, AC and DC current testing, dissipation factor (tan δ) measurements, partial discharge testing, and a UV camera analysis. These comprehensive diagnostic techniques enable precise evaluation of the insulation condition and the extent of degradation in high-voltage motors [
7].
Initially, insulation resistance and the polarization index (PI) were measured by applying a 5 kV direct current to the stator winding using an insulation resistance tester. The results confirmed that there was no risk of insulation breakdown caused by moisture, allowing the subsequent tests to proceed. Following this, alternating current tests, dissipation factor measurements, and partial discharge tests were conducted sequentially. The insulation diagnostic tests were performed using a Schering bridge system provided by Tettex Instruments, consisting of a high-voltage supply unit (Type 5283), a bridge unit (Type 2818), and a resonating inductor (Type 5285). Among these, the partial discharge test is particularly significant as it provides critical data for inferring the locations of internal defects within the high-voltage motor through pattern analysis [
10].
To accurately identify the locations of partial discharges within the stator winding, an ultraviolet (UV) camera was employed. This method leverages UV emissions generated by the stator winding during partial discharge events, enabling precise and rapid identification of the defective areas. The corona detection system measured UV counts as the alternating voltage increased incrementally, utilizing the phenomenon of increasing UV emissions to accurately detect insulation defects.
Details regarding the methods for measuring the insulation resistance, polarization index, AC current, dissipation factor, partial discharge testing, and UV testing are described below [
11].
2.1. Insulation Resistance
The insulation resistance test was conducted to assess the moisture absorption or contamination status of the insulation material. It also verifies whether the insulation resistance meets the required level before and during operation, evaluates the extent of insulation resistance degradation due to operation, and determines if the insulation resistance is sufficient for applying high voltage during insulation degradation tests [
12].
- -
IEEE Std 43-2013 [
13] Recommended Practice for Testing Insulation Resistance of Electric Machinery.
- -
IEC 60034-27-4 [
14] Measurement of insulation resistance and polarization index of winding insulation of rotating electrical machines.
After separating the motor stator windings by phase, apply a DC voltage between the power input terminal and ground using an insulation resistance tester (Megger Tester) and measure the insulation resistance after one minute [
10].
For motors with a rated voltage of 6.6 kV, the test voltage should be set between 2500 and 5000 V; however, applying 5000 V is recommended to detect even minor insulation damage [
10]. Generators with phase separation capabilities allow for a phase-to-phase insulation assessment by grounding the other phases during a single-phase test. In contrast, motors—where phase separation is challenging—are tested on all three phases simultaneously. If the insulation material has absorbed moisture or is contaminated, ensure adequate drying and cleaning before performing the insulation resistance test [
12].
The evaluation criteria determine that the result is considered satisfactory if it meets or exceeds the reference values specified in
Table 1 [
13].
If the insulation resistance is measured to be low, it is essential to perform drying procedures before commissioning to ensure an adequate insulation resistance level for safe operation. If a space heater is available, it should be operated to dry the motor until the insulation resistance reaches a satisfactory level.
2.2. Polarization Index, PI
The direct current (DC) test, also known as the polarization index (PI) test, evaluates the insulation condition by observing the current–time characteristics when a DC voltage is applied to the insulation. This test is used to assess factors such as moisture absorption, the presence and creation of conductive impurities, contamination, and defects in the insulation. Since the magnitude of the current varies depending on the form and size of the sample, the insulation condition cannot be determined solely based on the current magnitude. When insulation deteriorates or absorbs moisture, the leakage current increases, resulting in a rise in the leakage current in the current–time characteristic curve and a decrease in the current decay rate. To indicate this time-dependent change in current, the polarization index (PI) is calculated using Equation (1), which serves as an indicator of moisture absorption and contamination in the insulation [
14,
15,
16].
- -
IEEE Std 43-2013 Recommended Practice for Testing Insulation Resistance of Electric Machinery.
- -
IEC 60034-27-4 Measurement of insulation resistance and polarization index of winding insulation of rotating electrical machines.
The test method follows the same circuit configuration and test voltage as the insulation resistance test. The test applies voltage for a duration of 10 min, during which insulation resistance values at the 1 min and 10 min marks are recorded to calculate the polarization index (PI). If the insulation resistance exceeds 5000 MΩ, the PI test results may be disregarded [
14].
Since the polarization index (PI) test is based on the ratio of the insulation resistance values at 1 min and 10 min after the voltage application, temperature correction is unnecessary, as the temperatures at these time points are nearly identical. When the insulation resistance is sufficiently high (exceeding 5000 MΩ), the leakage current becomes minimal, making the PI measurement less meaningful due to increased susceptibility to factors such as power supply conditions, contact resistance, and humidity. Therefore, if the insulation resistance exceeds 5000 MΩ, the PI can be disregarded. The reference values are specified according to the motor insulation class, as shown in
Table 2, and the results meeting or exceeding these reference values are considered satisfactory [
14].
2.3. AC Current Test
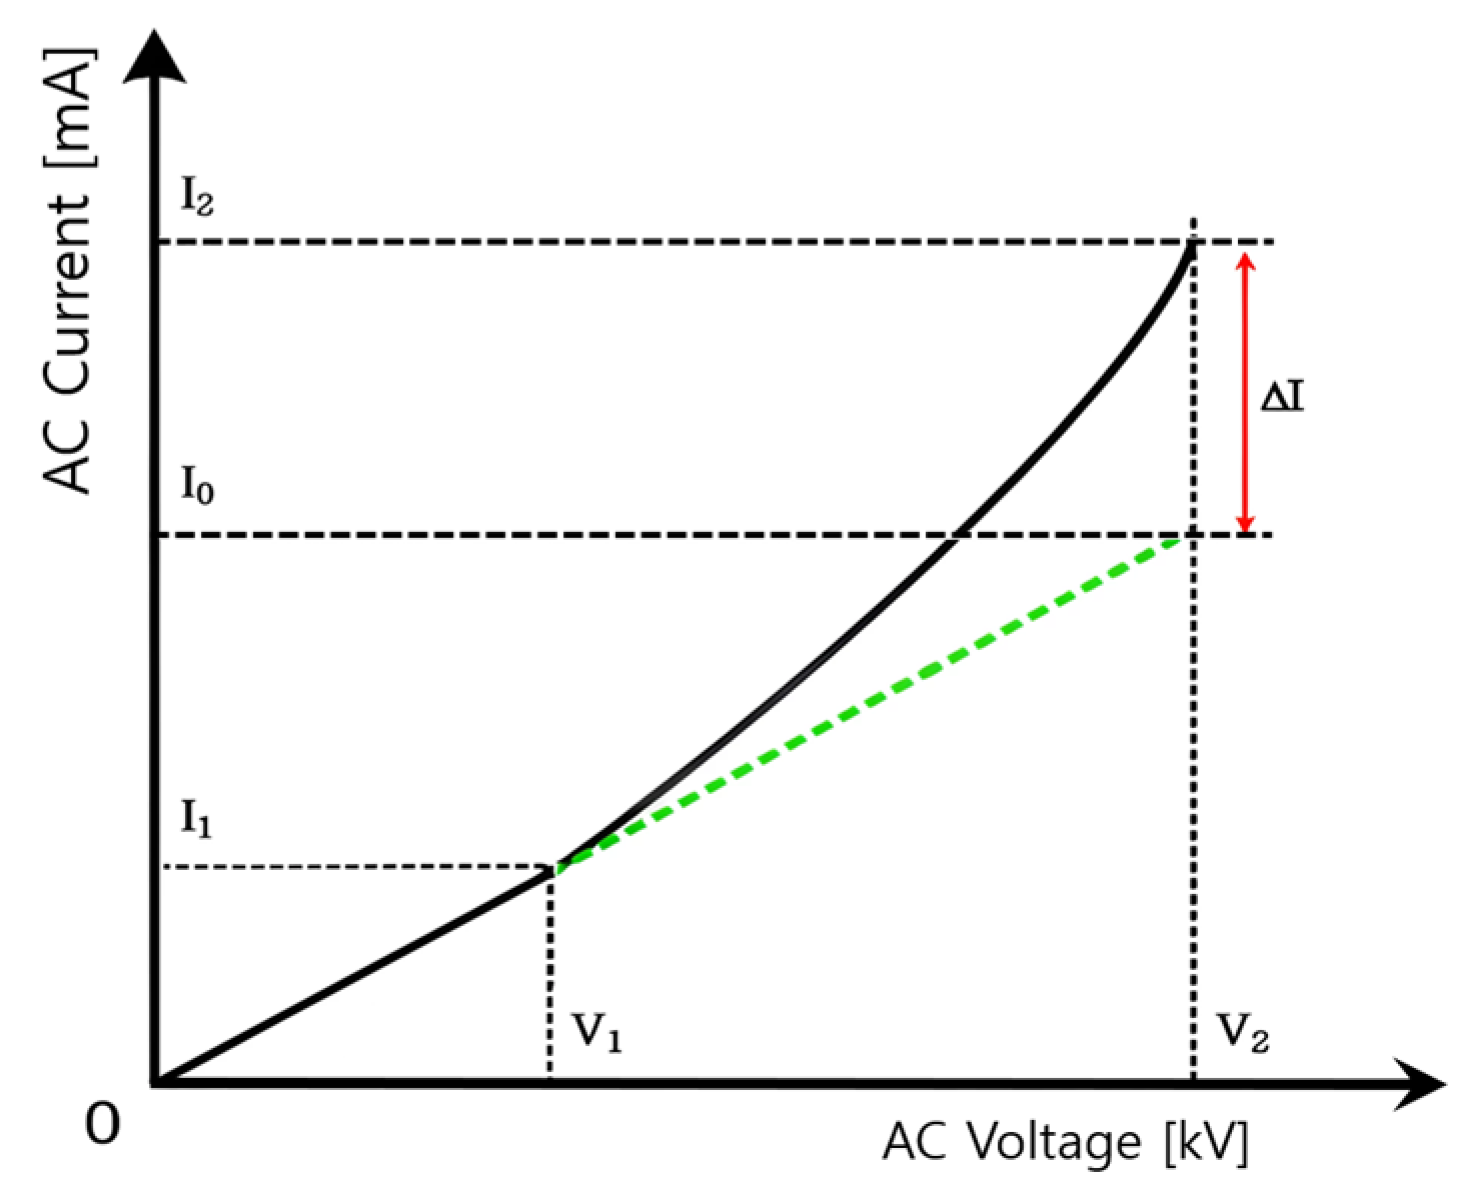
When an AC voltage is applied between the stator windings and ground, the current initially increases proportionally with the voltage at lower test voltages. However, as the test voltage continues to rise, partial discharges—momentary and transient short circuits—begin to occur within small voids in the insulation system or gaps between the stator windings and the core. Consequently, the current increases at a greater rate than the voltage. By analyzing the rate of current increase relative to the voltage increase, the condition of the insulation can be assessed [
15,
16,
17].
In this test method, an AC voltage is incrementally applied to the stator windings while measuring the current.
Figure 1 illustrates the rate of AC current increase (ΔI) as the test voltage is incrementally raised, indicating insulation degradation. The rate of current increase (ΔI), representing the difference between the current at the initial test voltage (approximately 20% of the rated voltage) and the current at the final test voltage, is calculated using Equation (2) to assess the condition of the insulation. A larger ΔI indicates a higher occurrence of partial discharge within the insulation system [
16].
- -
“Status and Issues of Insulation Diagnosis Technology for Large Rotating Machine Windings”, Central Research Institute of Electric Power Industry (CRIEPI), Japan, No. W87013, p. 13. [
16]
Generally, a ΔI value of 8.5% or 10% or less is considered acceptable for high-voltage motors. However, insulation characteristics vary depending on the manufacturer and year of production, making it challenging to apply a uniform standard to all equipment. Therefore, a trend analysis through comparisons with past test results is preferable, as it is rare for the ΔI value to increase more than twice the initial value [
16,
17].
2.4. Dielectric Dissipation Factor (tan δ) Test
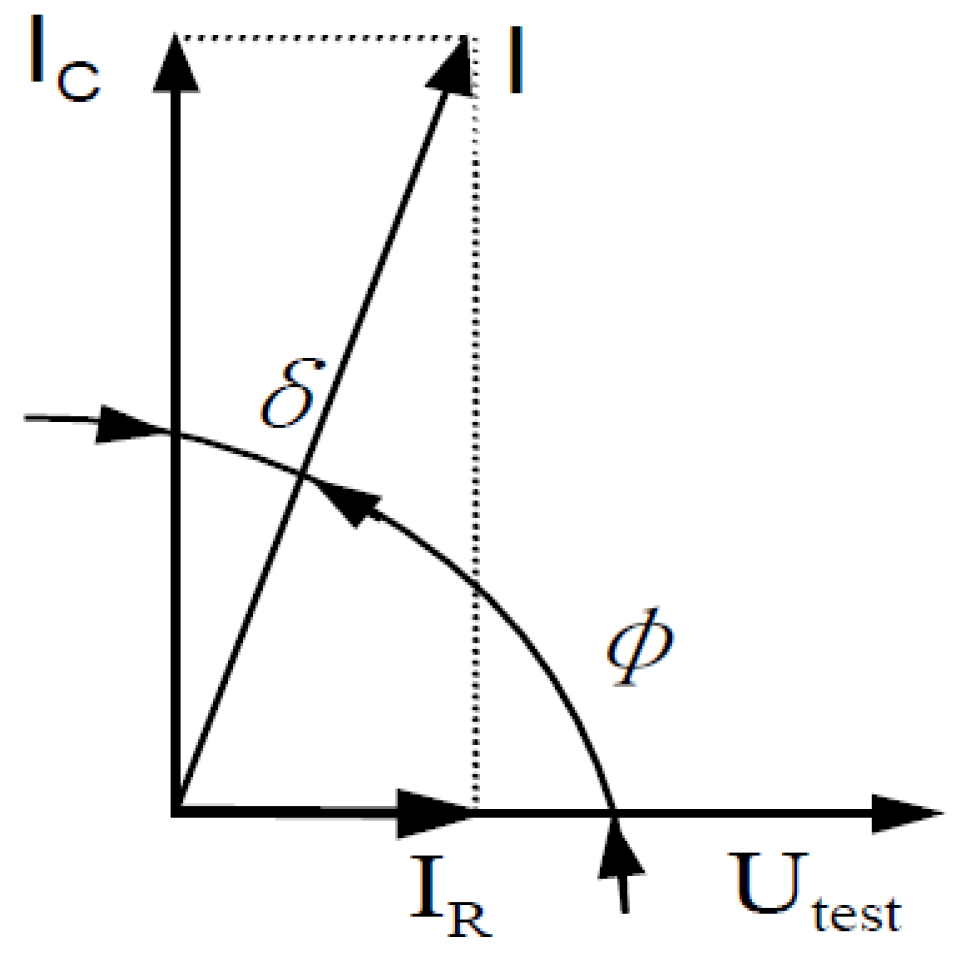
When an AC voltage is applied to an insulating material, the resulting current consists of the charging current, which leads the test voltage by 90°, and the leakage current, which is in phase with the voltage. The dielectric dissipation factor (tan δ) is defined as the ratio of the leakage current to the charging current. In an ideal insulator, no loss occurs, and only the charging current (IC), which leads the voltage by 90°, flows. However, in actual insulating materials, losses occur due to molecular vibrations, leakage current, and partial discharge, which generate light, sound, and electromagnetic waves, resulting in a leakage current (IR) [
17].
Figure 2 illustrates the current vector relationship between charging current, leakage current, and the resulting phase angle δ, which defines the dielectric dissipation factor (tan δ). As the leakage current (IR) increases relative to the charging current (IC), the dielectric dissipation factor (tan δ) value also increases. By utilizing this phenomenon, the increase in the tan δ value with respect to the applied voltage can be measured, and the resulting values can be substituted into Equation (3) below to evaluate the insulation condition [
17].
When the leakage current (
IR) increases more than the charging current (
IC), the dielectric dissipation factor (tan δ) value rises. This allows for the measurement of tan δ changes with respect to the applied voltage, thereby enabling an evaluation of the insulation condition. This test is aimed at assessing the overall insulation system between the stator winding conductors and ground by measuring the tan δ value to determine the average degradation state of the insulation [
18,
19,
20].
- -
IEC 60034-27-3-2015 [
18] Dielectric dissipation factor measurement on stator winding insulation of rotating electrical machines.
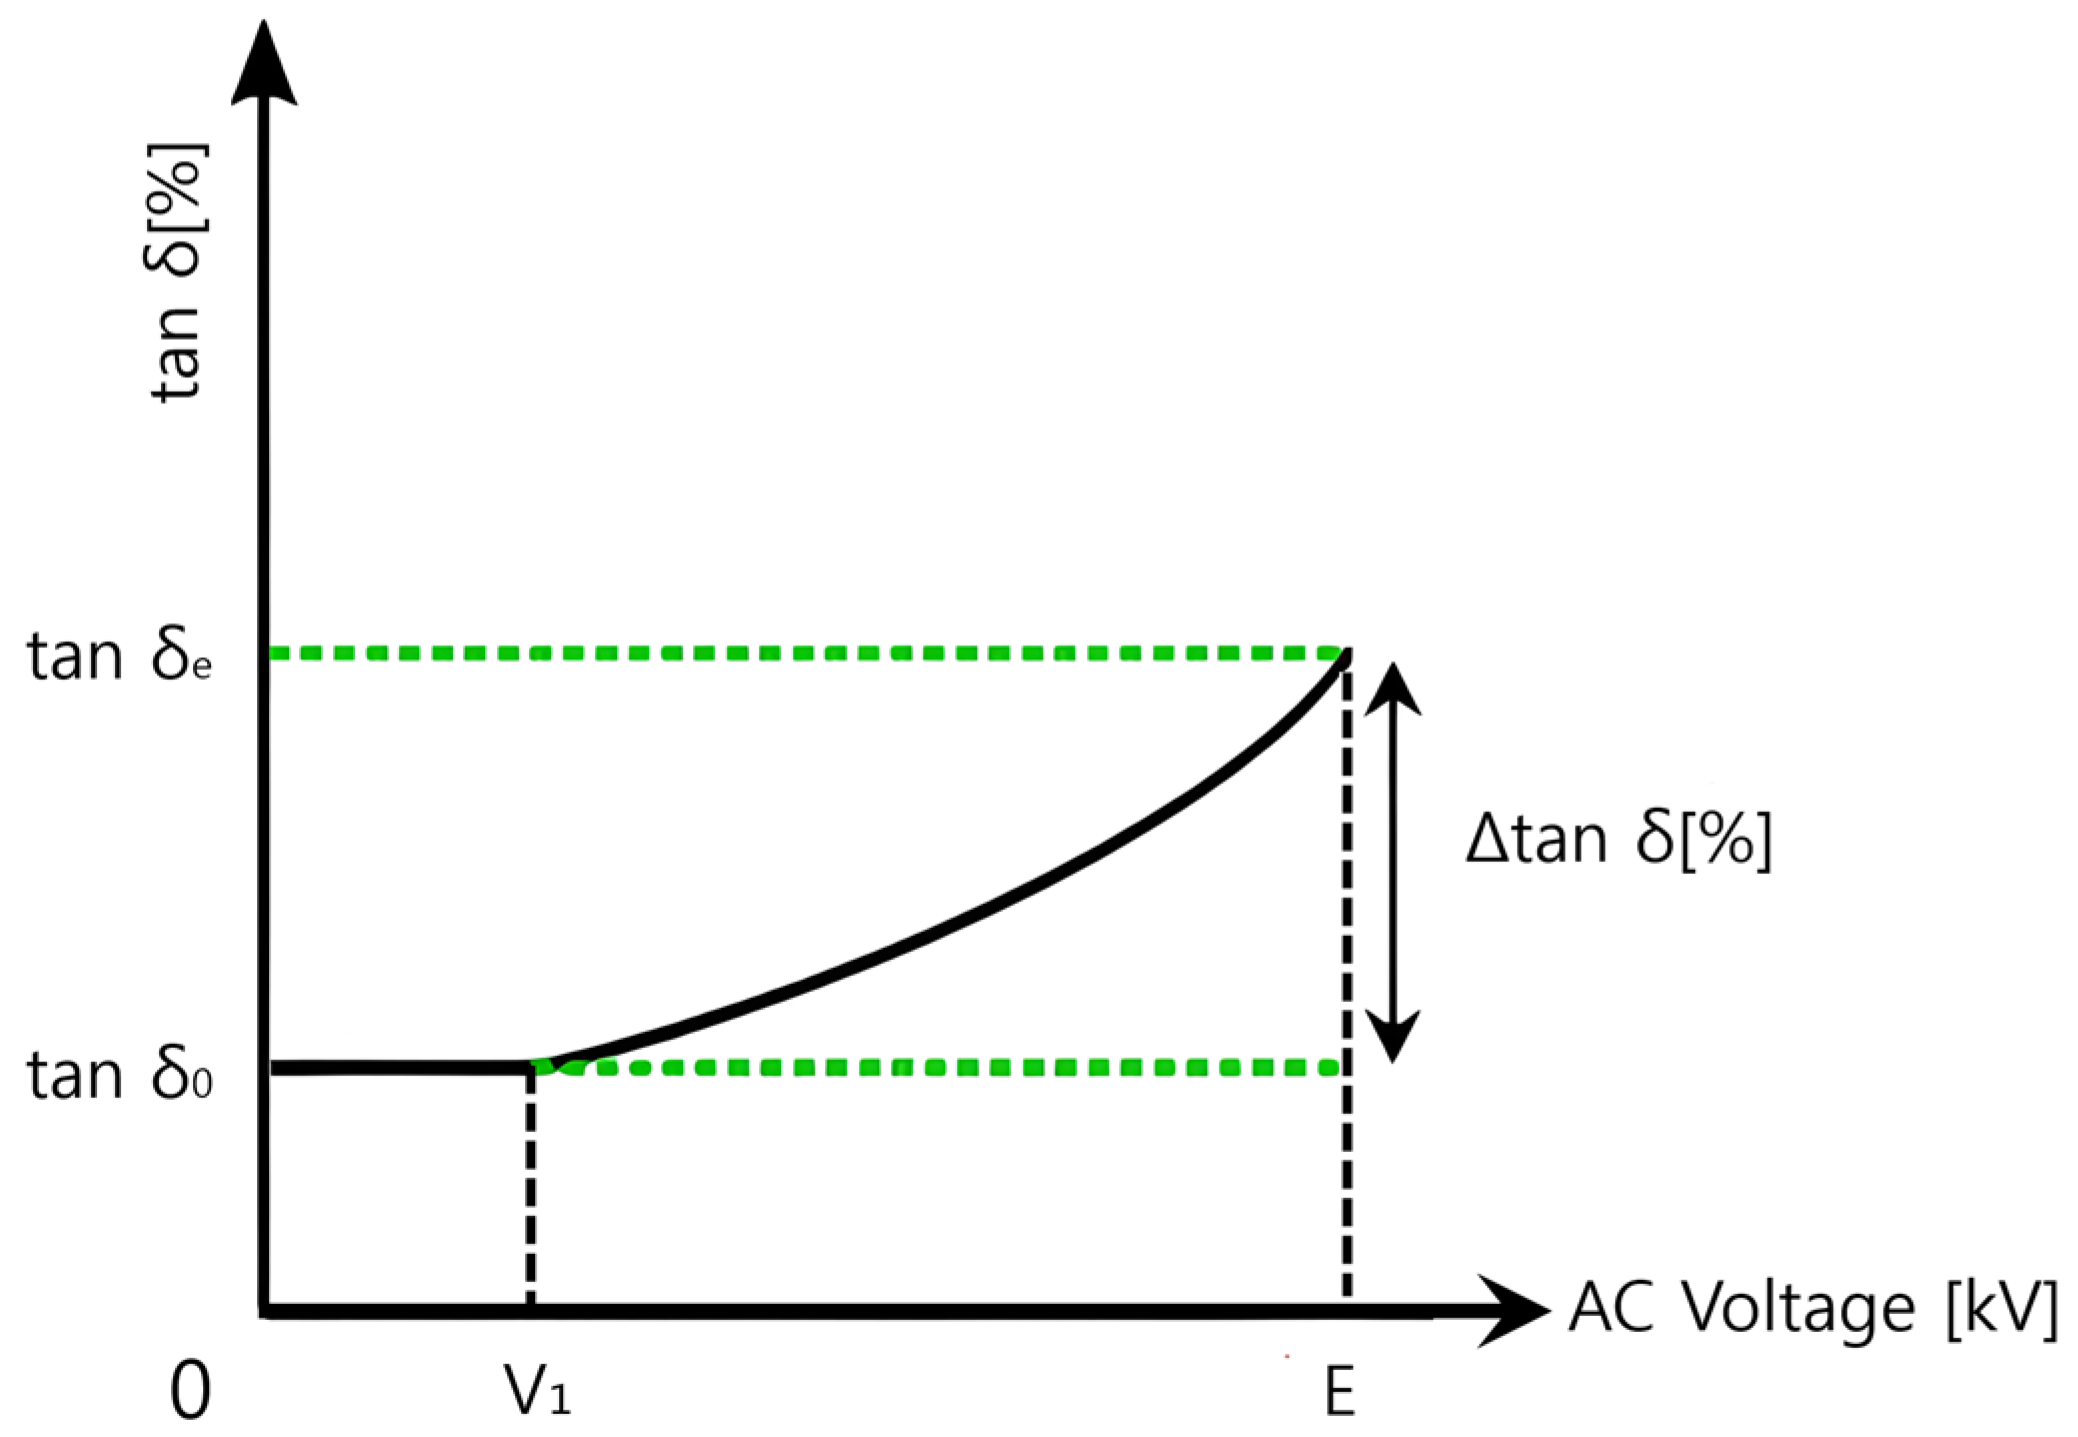
An AC voltage is incrementally applied to the stator windings up to the rated voltage to measure the dielectric dissipation factor (tan δ). The dielectric dissipation factor increase rate (Δtan δ) is then calculated by comparing the tan δ value at the rated voltage to the initial tan δ value measured at a lower test voltage (approximately 20% of the rated voltage). This increased rate provides an indicator for assessing the insulation condition [
18].
Figure 3 illustrates the increase in the dielectric dissipation factor (Δtan δ) with rising AC voltage, indicating insulation degradation. The dielectric dissipation factor increase rate (Δtan δ) can be calculated using Equation (4). A larger Δtan δ indicates that partial discharges are more likely to occur as the test voltage is increased.
If the stator windings have absorbed moisture or become contaminated, the leakage current may exceed the charging current, resulting in a high dielectric dissipation factor (tan δ) value even at low test voltages. For this reason, if an elevated initial dielectric dissipation factor (tan δ
0) is observed, the test should be conducted after thoroughly drying the equipment using devices such as a hot-air blower to achieve a more accurate insulation assessment. Typically, for well-dried equipment, an initial tan δ
0 value of no more than 3% is considered standard [
17,
19].
In international standards, no specific value is used as a criterion for judgment, as insulation processing methods for terminal windings vary by manufacturer, and standards differ among testing organizations. Generally, generators are considered to be in good condition if the dielectric dissipation factor increase rate (Δtan δ) is 2.5% or less when tested up to 125% of the phase voltage. For high-voltage motors, a Δtan δ value of 6.5% or 8.5% or less, measured at the rated voltage, is used as a reference. However, as international standards do not provide specific criteria for assessment, it is challenging to apply a single value as the standard for evaluating insulation conditions across all equipment. Therefore, a trend analysis through comparisons with past test results is recommended, as it is generally uncommon for the Δtan δ value to increase more than twice the initial value [
7,
13].
2.5. Partial Discharge (PD) Test
When a high voltage is applied to the stator windings of high-voltage rotating machinery, partial discharge—momentary and transient short circuits—occurs within small voids, cracks, delamination, and gaps between the windings and slots in the insulation system. This partial discharge generates current pulses, and by analyzing the magnitude and phase distribution of these pulses relative to the applied voltage, the extent and location of defects within the insulation system can be identified [
19].
The largest pulse among the partial discharge pulses is typically attributed to the most significant defect within the entire insulation system, allowing for an assessment of the severity of the most critical defect. Additionally, by analyzing the discharge pattern and the phase distribution of the discharges, it is possible to distinguish whether the discharges originate from small voids or delamination within the main insulation material or from the surfaces between the windings and slots [
20,
21,
22,
23,
24].
- -
IEEE Std 1434-2014 [
20] Guide for the Measurement of Partial Discharges in AC Electric Machinery.
After applying a reference pulse to the test equipment, a calibration process is conducted by confirming the applied pulse on the measuring instrument and storing its magnitude. Subsequently, noise that occurs before the application of the test voltage is measured. An AC voltage is then gradually applied between the stator winding and ground to determine the partial discharge inception voltage. After increasing the voltage to the phase voltage level and allowing the discharge values to stabilize, the discharge magnitude and discharge pattern are measured. If abnormal discharge patterns, such as gap discharges, are observed, the location of the discharge should be identified, and corrective actions should be taken before retesting. Methods for locating the discharge include visual inspection, grounding of RTD terminals, and discharge detection using a corona camera [
20].
In international standards, no specific judgment criteria are provided in terms of particular values, as the insulation treatment methods for stator windings vary by manufacturer, and the standards may differ between organizations. In Korea, commonly used criteria for high-voltage motors involve measuring a partial discharge at phase voltage or 125% of phase voltage, with values categorized as satisfactory if ≤10,000 pC and caution if ≤30,000 pC. In this test, a trend analysis through comparisons with past results is equally important, as a stable discharge level, even if exceeding the specified threshold, is generally not considered a significant issue [
20,
22,
23].
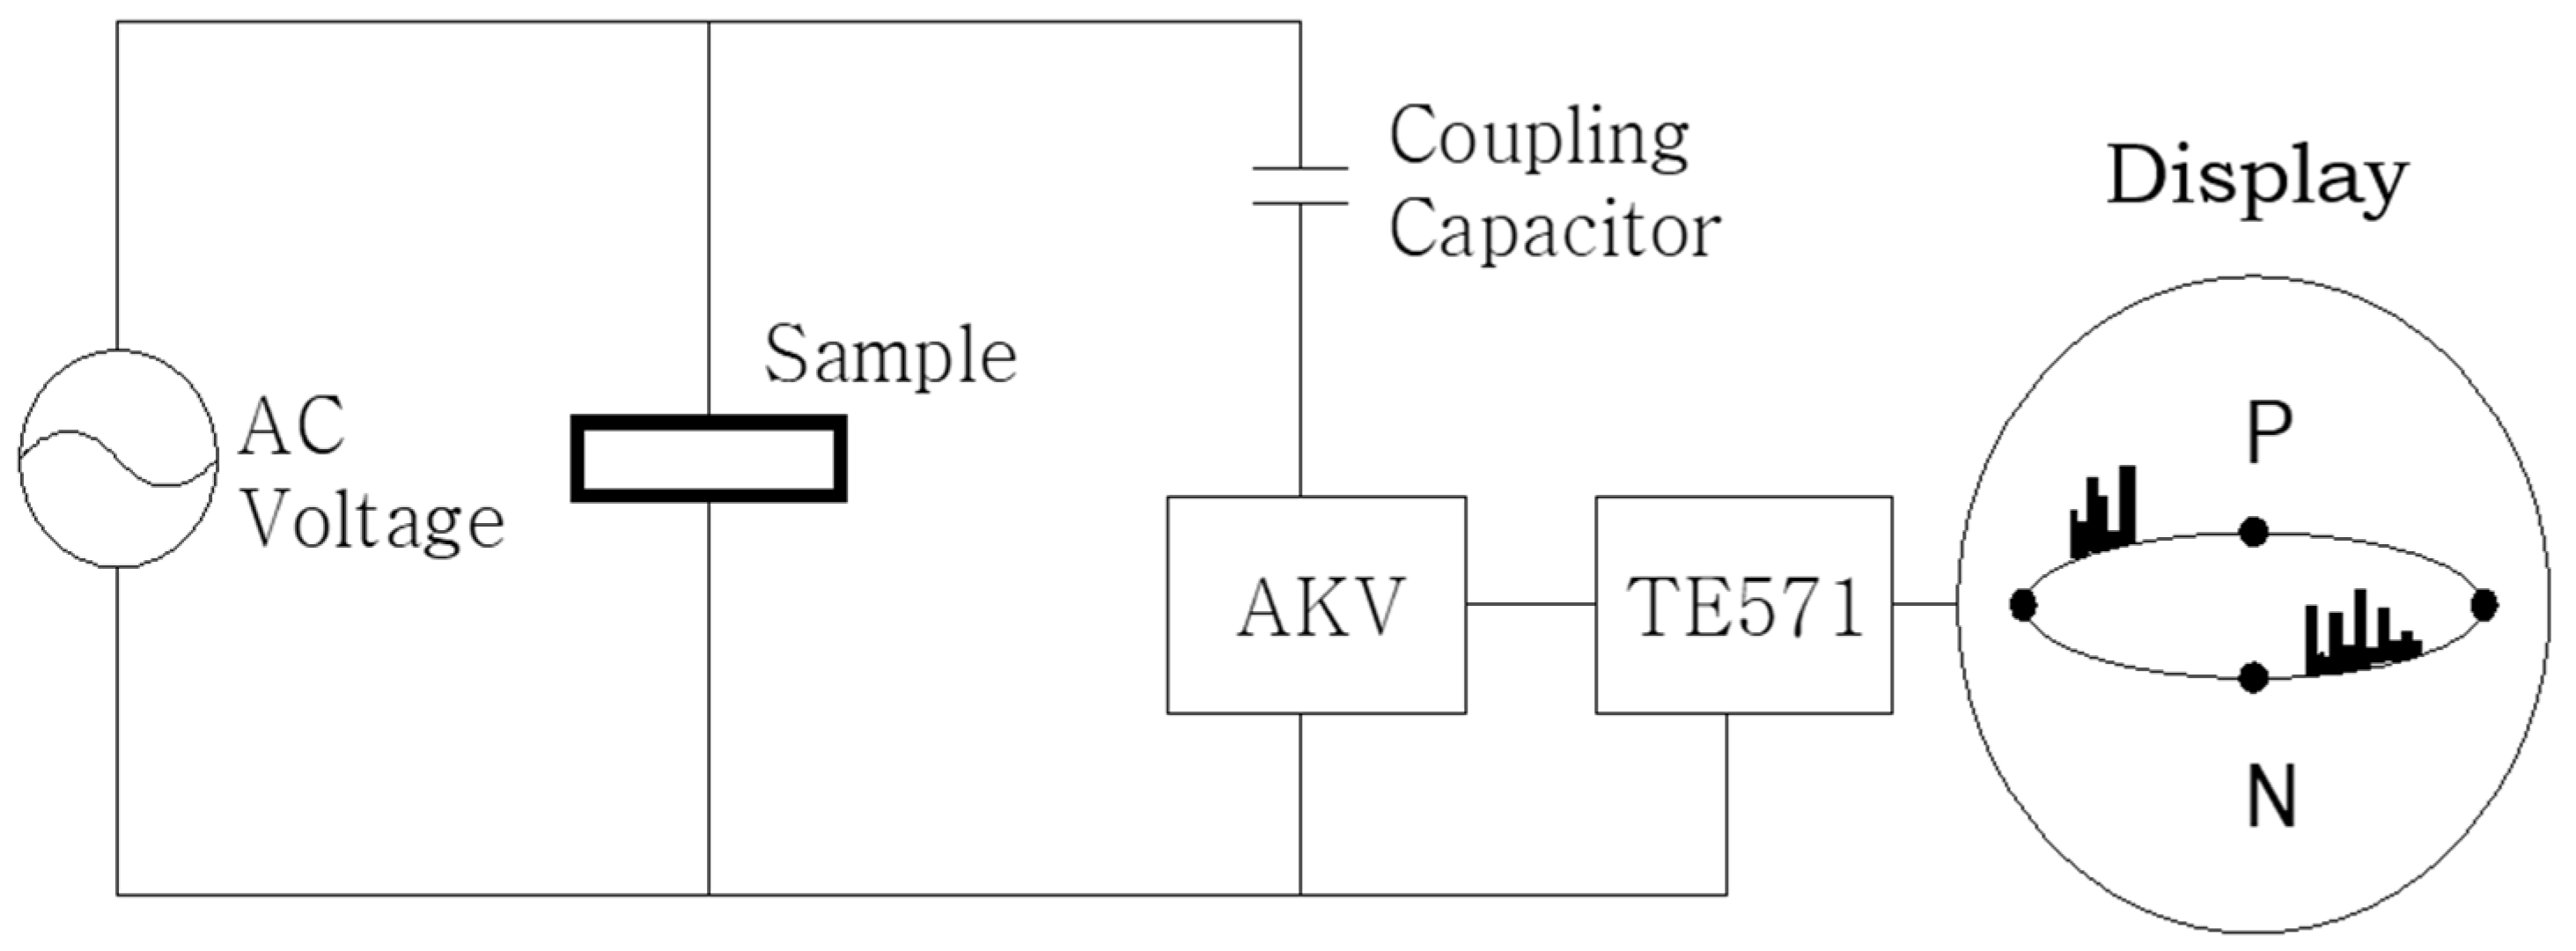
Figure 4 illustrates the circuit diagram for measuring partial discharge in the stator winding of a high-voltage rotating machine. The test employs a Schering Bridge, a coupling capacitor, and a digital partial discharge detector [
7,
13].
An AC voltage is applied to the stator winding by connecting a Schering Bridge (Tettex Instruments, Zurich, Switzerland). The sensitivity of the measurement circuit is then adjusted using a coupling capacitor (Tettex Instruments, 4000 pF). Partial discharge pulses transmitted through this capacitor are sent to a coupling unit (Tettex Instruments AKV 572) for amplification, and the discharge pattern is analyzed by a digital partial discharge detector (Tettex Instruments TE 571).
Figure 5b represents the AC cycle waveform of
Figure 5a in an elliptical form, illustrating the partial discharge pulses occurring in both the positive half-cycle (0–180°) and the negative half-cycle (180–360°) [
21,
22,
23].
By analyzing the polarity of partial discharge pulses in this manner, the degradation characteristics of the stator winding in a rotating machine can be assessed. If the partial discharge pulses are large in magnitude and predominantly occur in the positive half-cycle of the AC waveform, it indicates that partial discharge is occurring in the copper conductors, suggesting separation between the insulating material and the conductor [
21,
22,
24].
2.6. UV Test
Partial discharge refers to a localized electrical discharge that occurs within or on the surface of an insulator, during which various forms of energy, such as electromagnetic waves, heat, sound, gas, and light, are emitted. Particularly in partial discharge types like corona discharge, ultraviolet (UV) light is emitted. By detecting these UV emissions, the presence of partial discharge can be visually confirmed. A UV camera is a device designed to detect and visualize UV light emitted during partial discharge events. Using a highly sensitive UV detector, even minute UV emissions can be captured, enabling the real-time monitoring of UV emissions from phenomena such as a corona discharge [
8,
10].
The diagnostic process for partial discharge using a UV camera involves several stages. First, the readiness of the target power equipment for testing is checked, and the operational status of the UV camera is verified prior to starting the diagnosis. Next, test voltage is applied to the target equipment, and the UV camera is used to capture images of the equipment. During this process, areas suspected of discharges are prioritized for inspection, and the camera’s sensitivity and focus are adjusted to obtain optimal images. This ensures high-quality data for clear detection of UV emissions. Simultaneously, the recorded UV images are analyzed to confirm the presence of discharge activity. If UV emissions are detected, the location and intensity of the discharges are accurately identified to evaluate the severity of the observed discharges. Finally, the analysis results are compiled to document the location, intensity, and type of the discharges in detail. Based on these findings, the condition of the equipment is assessed, and recommendations for necessary actions are proposed to conclude the diagnostic process [
10].
UV Camera Detection Threshold and Calibration Procedure
To ensure the accurate detection of arc discharges, the UV camera used in this study underwent a predefined calibration process. The detection capability of the UV camera can be influenced by discharge intensity, environmental conditions, and background noise levels. In this study, the camera was calibrated to detect a range of discharges, from low-intensity corona discharges to high-intensity arc discharges.
The calibration procedure involved the following steps:
Baseline Noise Measurement
Before initiating the experiments, background UV noise levels were measured under normal operating conditions without partial discharge activity. This step ensured that low-level signals originating from ambient conditions were not misinterpreted as discharge events.
Reference Source Calibration
The UV camera was calibrated using a known UV emission source, allowing the instrument to adjust its detection sensitivity to different levels of discharge intensity. This step ensured that the camera was correctly identifying UV emissions corresponding to partial discharges in high-voltage environments.
Cross-validation with PD Detector
To verify the reliability of UV-based detection, the camera’s UV count measurements were cross-validated against the partial discharge data obtained from a conventional PD measurement system. This ensured that the UV emissions detected by the camera correlated with the expected discharge magnitudes.
Through this calibration process, the UV camera was configured to detect both low-intensity corona discharges and high-intensity arc discharges, enabling the precise localization of insulation defects.
3. Test Results and Discussion
To initially assess the condition of the high-voltage motor windings, the previously described insulation diagnostic tests and a visual inspection were conducted. Subsequently, defective areas within the windings were identified using a UV camera, and appropriate partial repairs will be applied to those areas. After the repairs, insulation diagnostics were repeated to confirm any improvements in the diagnostic values.
Table 3 provides the specifications for four weather-protected high-voltage motors, each rated at 1500 kW and 11 kV, which have been in operation at a thermal power plant for nine years.
3.1. Visual Inspection
Figure 6 shows that the stator windings of four weather-protected high-voltage motors exhibited similar damage that was attributed to dust accumulation from an external cooling airflow. A visual inspection confirmed dust deposition on the winding surfaces, after which cleaning procedures were carried out.
3.2. AC Current Test, Dissipation Factor (tan δ) Measurement, and Partial Discharge Analysis Before Maintenance
As shown in
Table 4, the insulation resistance values of the stator windings for the high-voltage motors 1 through 4 were recorded at 25.1 GΩ, 22.1 GΩ, 24.0 GΩ, and 8.64 GΩ, respectively, with polarization indexes of 3.88, 4.04, 4.08, and 3.17, with all considered satisfactory. To further assess the insulation condition, three-phase power from an external source was applied to the high-voltage motor stator windings. During this process, alternating current tests, a dissipation factor (tan δ), and capacitance were measured as the AC voltage was incrementally raised from 1 kV up to the motor’s rated 11 kV. The rate of current increase (ΔI) and dissipation factor increase (Δtan δ) were also calculated; for 11-kV-class high-voltage motors, a ΔI of 8.5% or more at the rated voltage indicates a defect, as does a Δtan δ increase of 6.5% or greater.
To evaluate the insulation condition of high-voltage motors, ΔI was calculated from the data gathered at the rated voltage of 11 kV based on the established criteria. As shown in
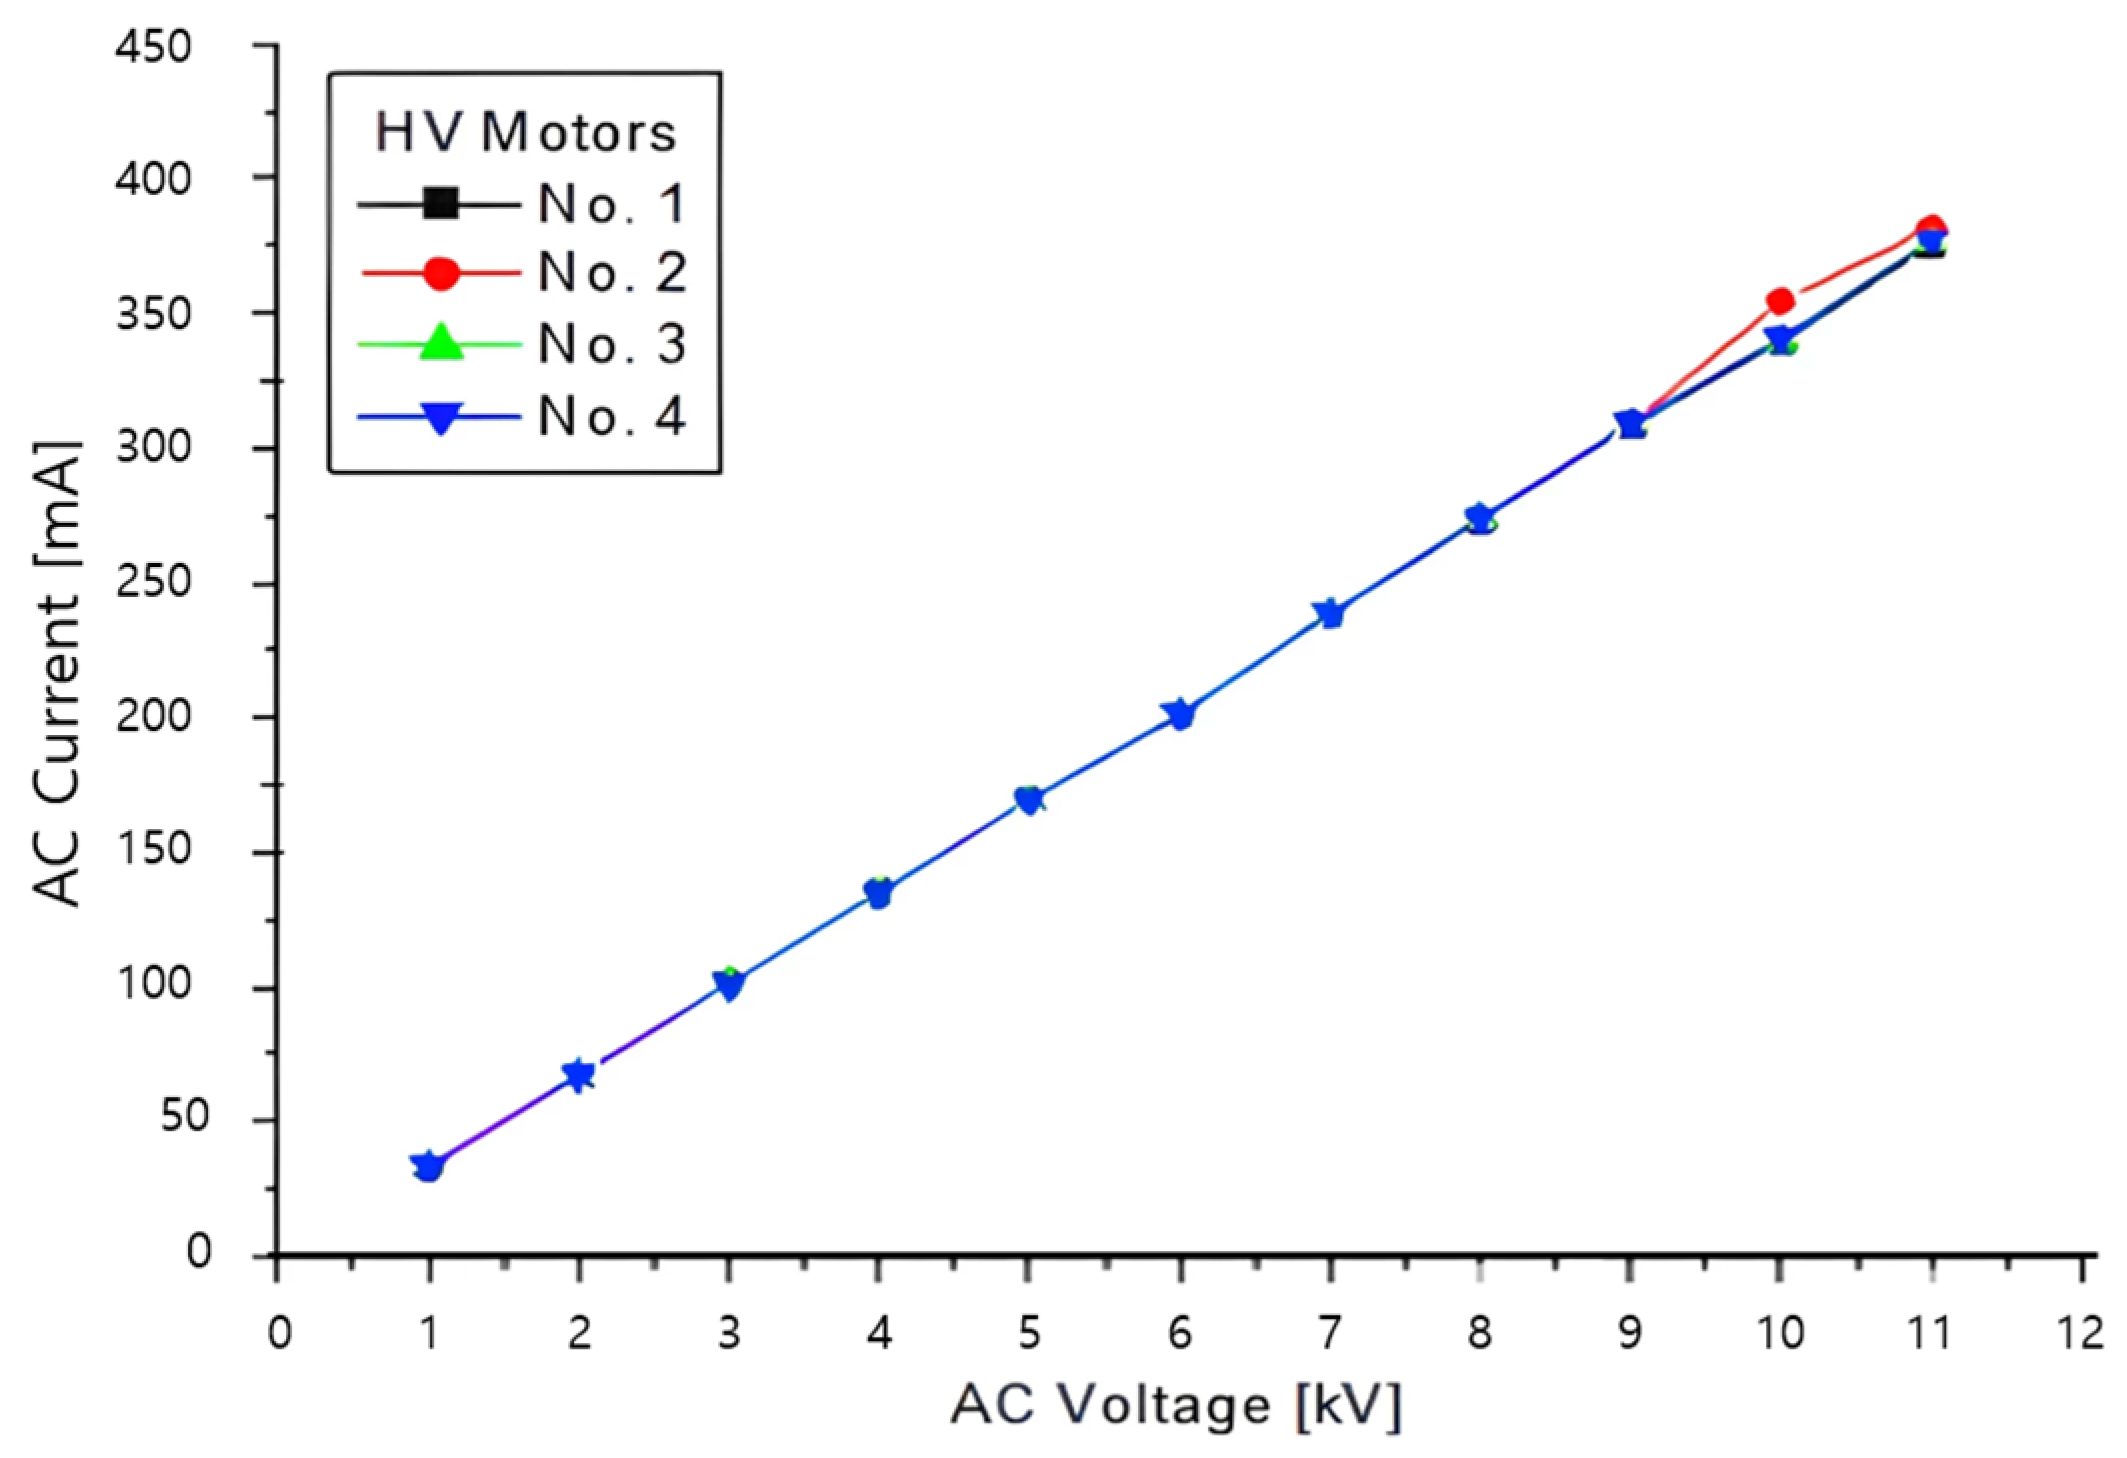
Table 4, the ΔI values for the stator windings of high-voltage motors 1 through 4 were measured at 1.92%, 2.66%, 1.91%, and 2.45% at 11 kV, respectively, with all assessed as satisfactory. The change in capacitance (ΔC) closely mirrored the ΔI values.
Figure 7 presents the results of the AC current–voltage tests conducted on four high-voltage motors. The test involved measuring current variations while gradually increasing the AC voltage applied to the stator winding in three phases, starting from 1 kV up to the rated voltage of 11 kV in 1 kV increments. As shown in the graph, the AC current–voltage characteristics exhibit a consistent increase without any noticeable changes in the trend. This indicates that the AC current–voltage test results show no abnormalities.
As shown in
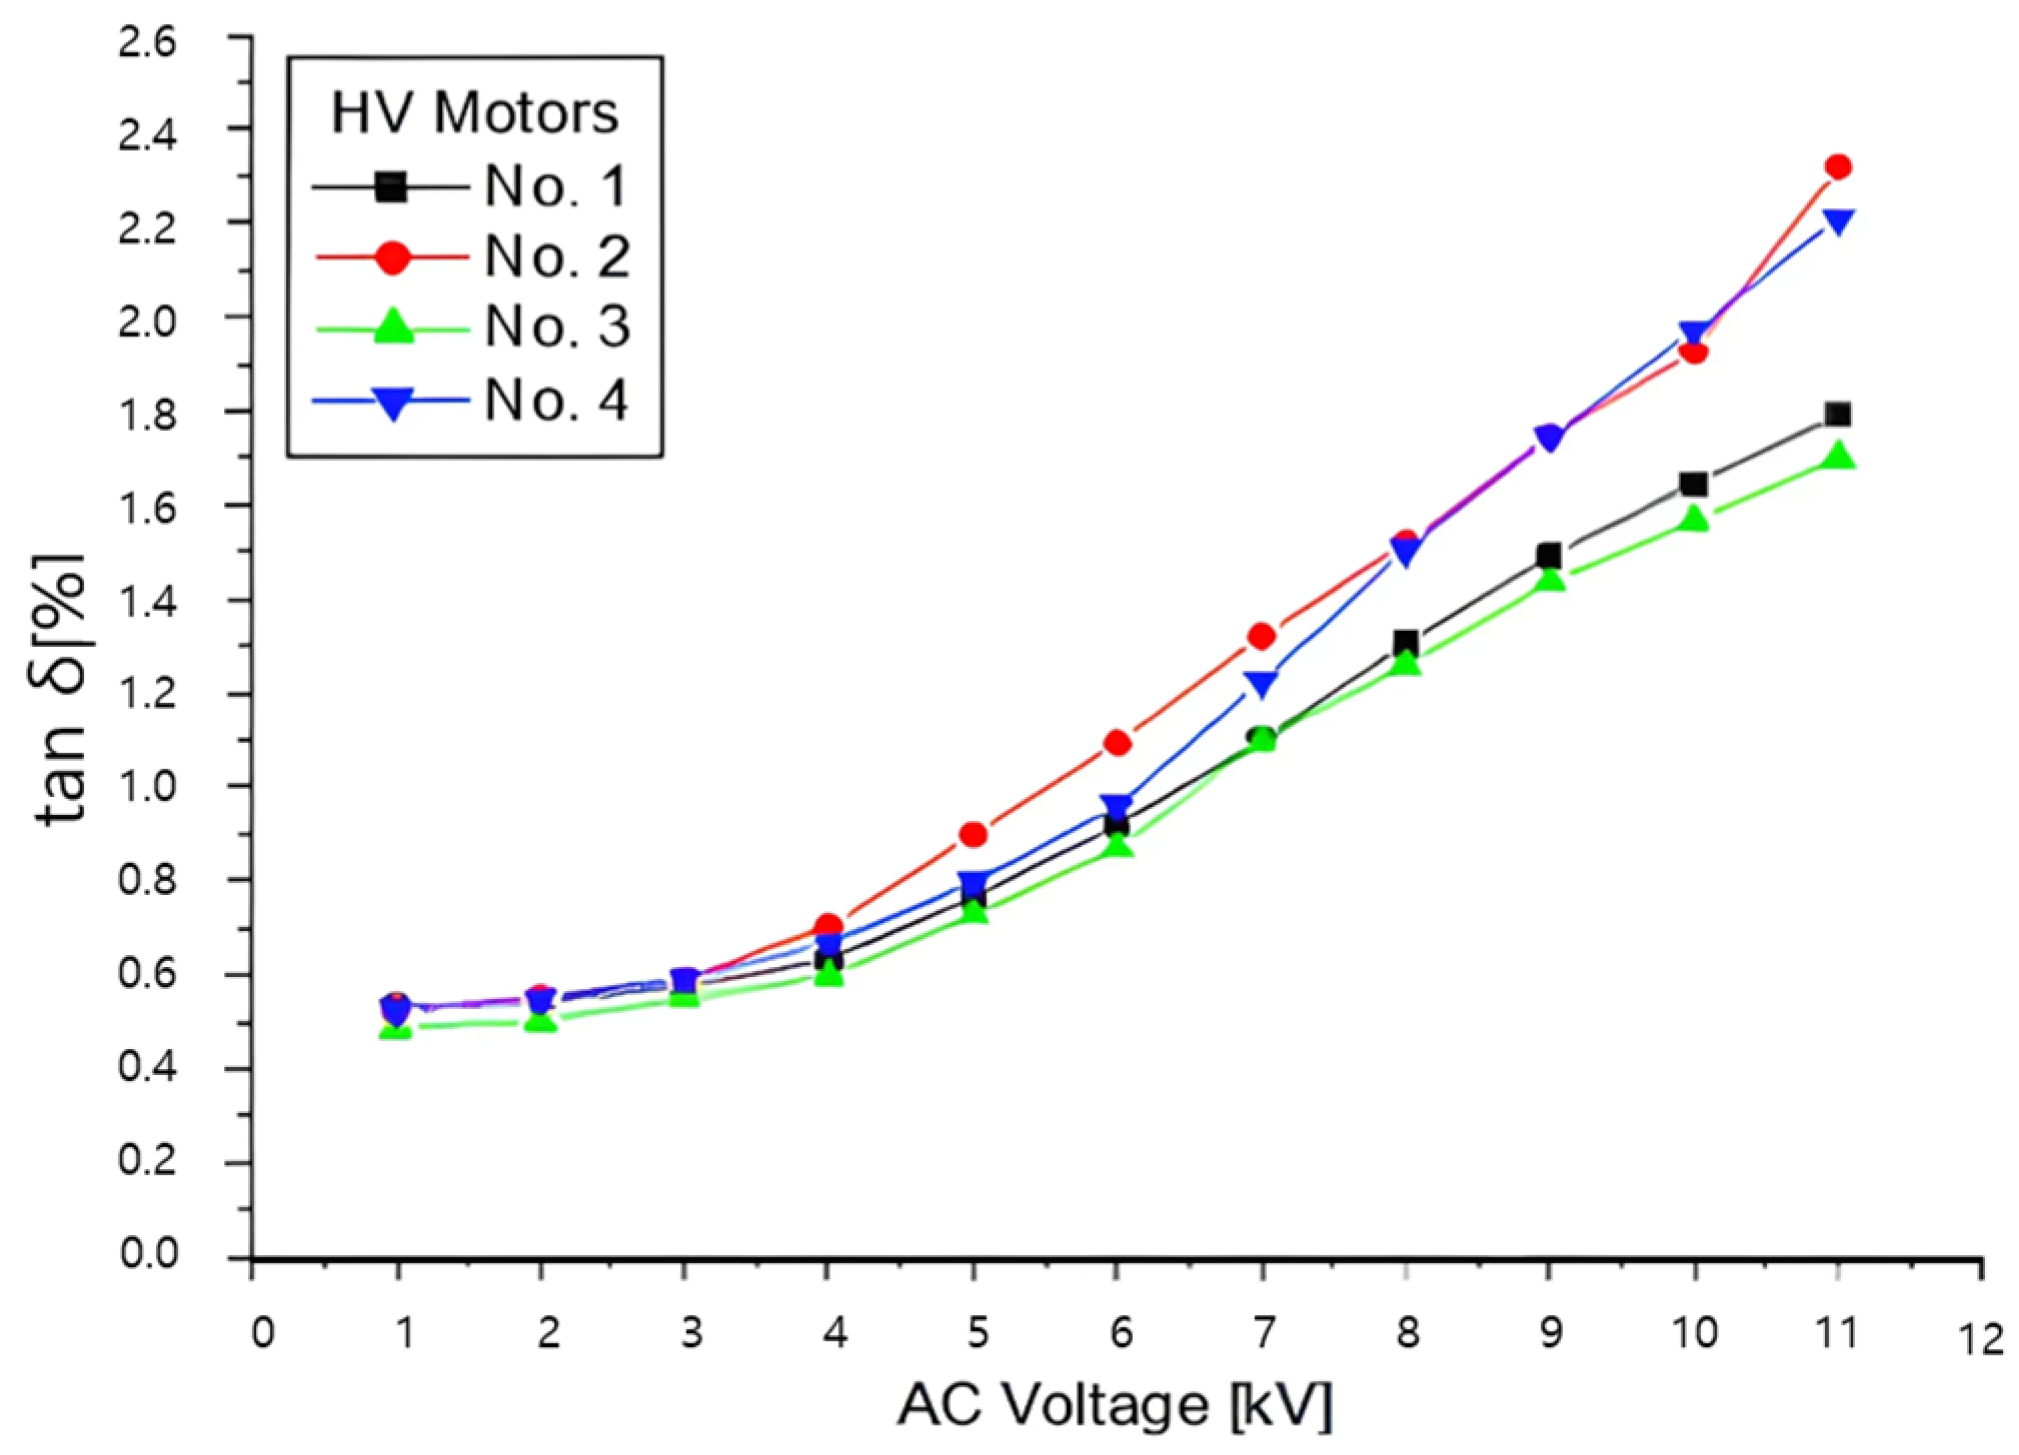
Figure 8, the dissipation factor (tan δ) of the high-voltage motor stator winding was assessed by gradually increasing the three-phase AC voltage from an external power supply, starting at 1 kV and rising in 1 kV increments to the rated voltage of 11 kV. At the rated voltage, the Δtan δ values for motors 1 through 4 were calculated at 1.244%, 1.585%, 1.199%, and 1.661%, respectively, and were deemed satisfactory. Typically, a high tan δ measurement signals significant damage to the stator winding of a high-voltage motor, but the relatively low tan δ values, in this case, indicate that contamination had not notably impacted the dissipation factor.
The tan δ generally shows a gradual increase from 1 to 3 kV but rises more sharply above 3 kV. This trend suggests that the onset of partial discharge can be expected around 3–4 kV.
As shown in
Figure 9, the stator winding capacitance was measured by gradually raising the three-phase AC voltage from 1 kV to the rated 11 kV in 1 kV steps using an external power supply. The capacitance increased steadily from 1 to 3 kV, then more sharply above 3 kV. This pattern closely resembled the dissipation factor (tan δ) trend observed as the voltage rose. Similar patterns were observed when comparing the capacitance–voltage and dissipation factor–voltage profiles. At 11 kV, the ΔC values for motors 1 to 4 were 1.93%, 2.61%, 1.92%, and 2.49%, respectively.
3.3. Partial Discharge Characteristics
The partial discharge inception voltage (PDIV) is defined as the voltage level at which the partial discharge reaches 1000 pC, measured by incrementally increasing the AC voltage in an environment with external noise levels ranging from hundreds of pC. According to the data in
Table 5, external noise was recorded between 200 pC and 230 pC, while the PDIV for motors 1 through 4 was measured at 3.5 kV, 2.0 kV, 2.1 kV, and 1.9 kV, respectively.
This value is lower than the predicted range of 3–4 kV based on the AC current and tan δ characteristics, which is attributed to residual foreign substances on the lower windings even after the cleaning process, indicating a persistent deterioration in insulation condition. These results reaffirm the correlation between the cleanliness of the windings and insulation performance, emphasizing the importance of thorough removal of foreign substances during maintenance activities.
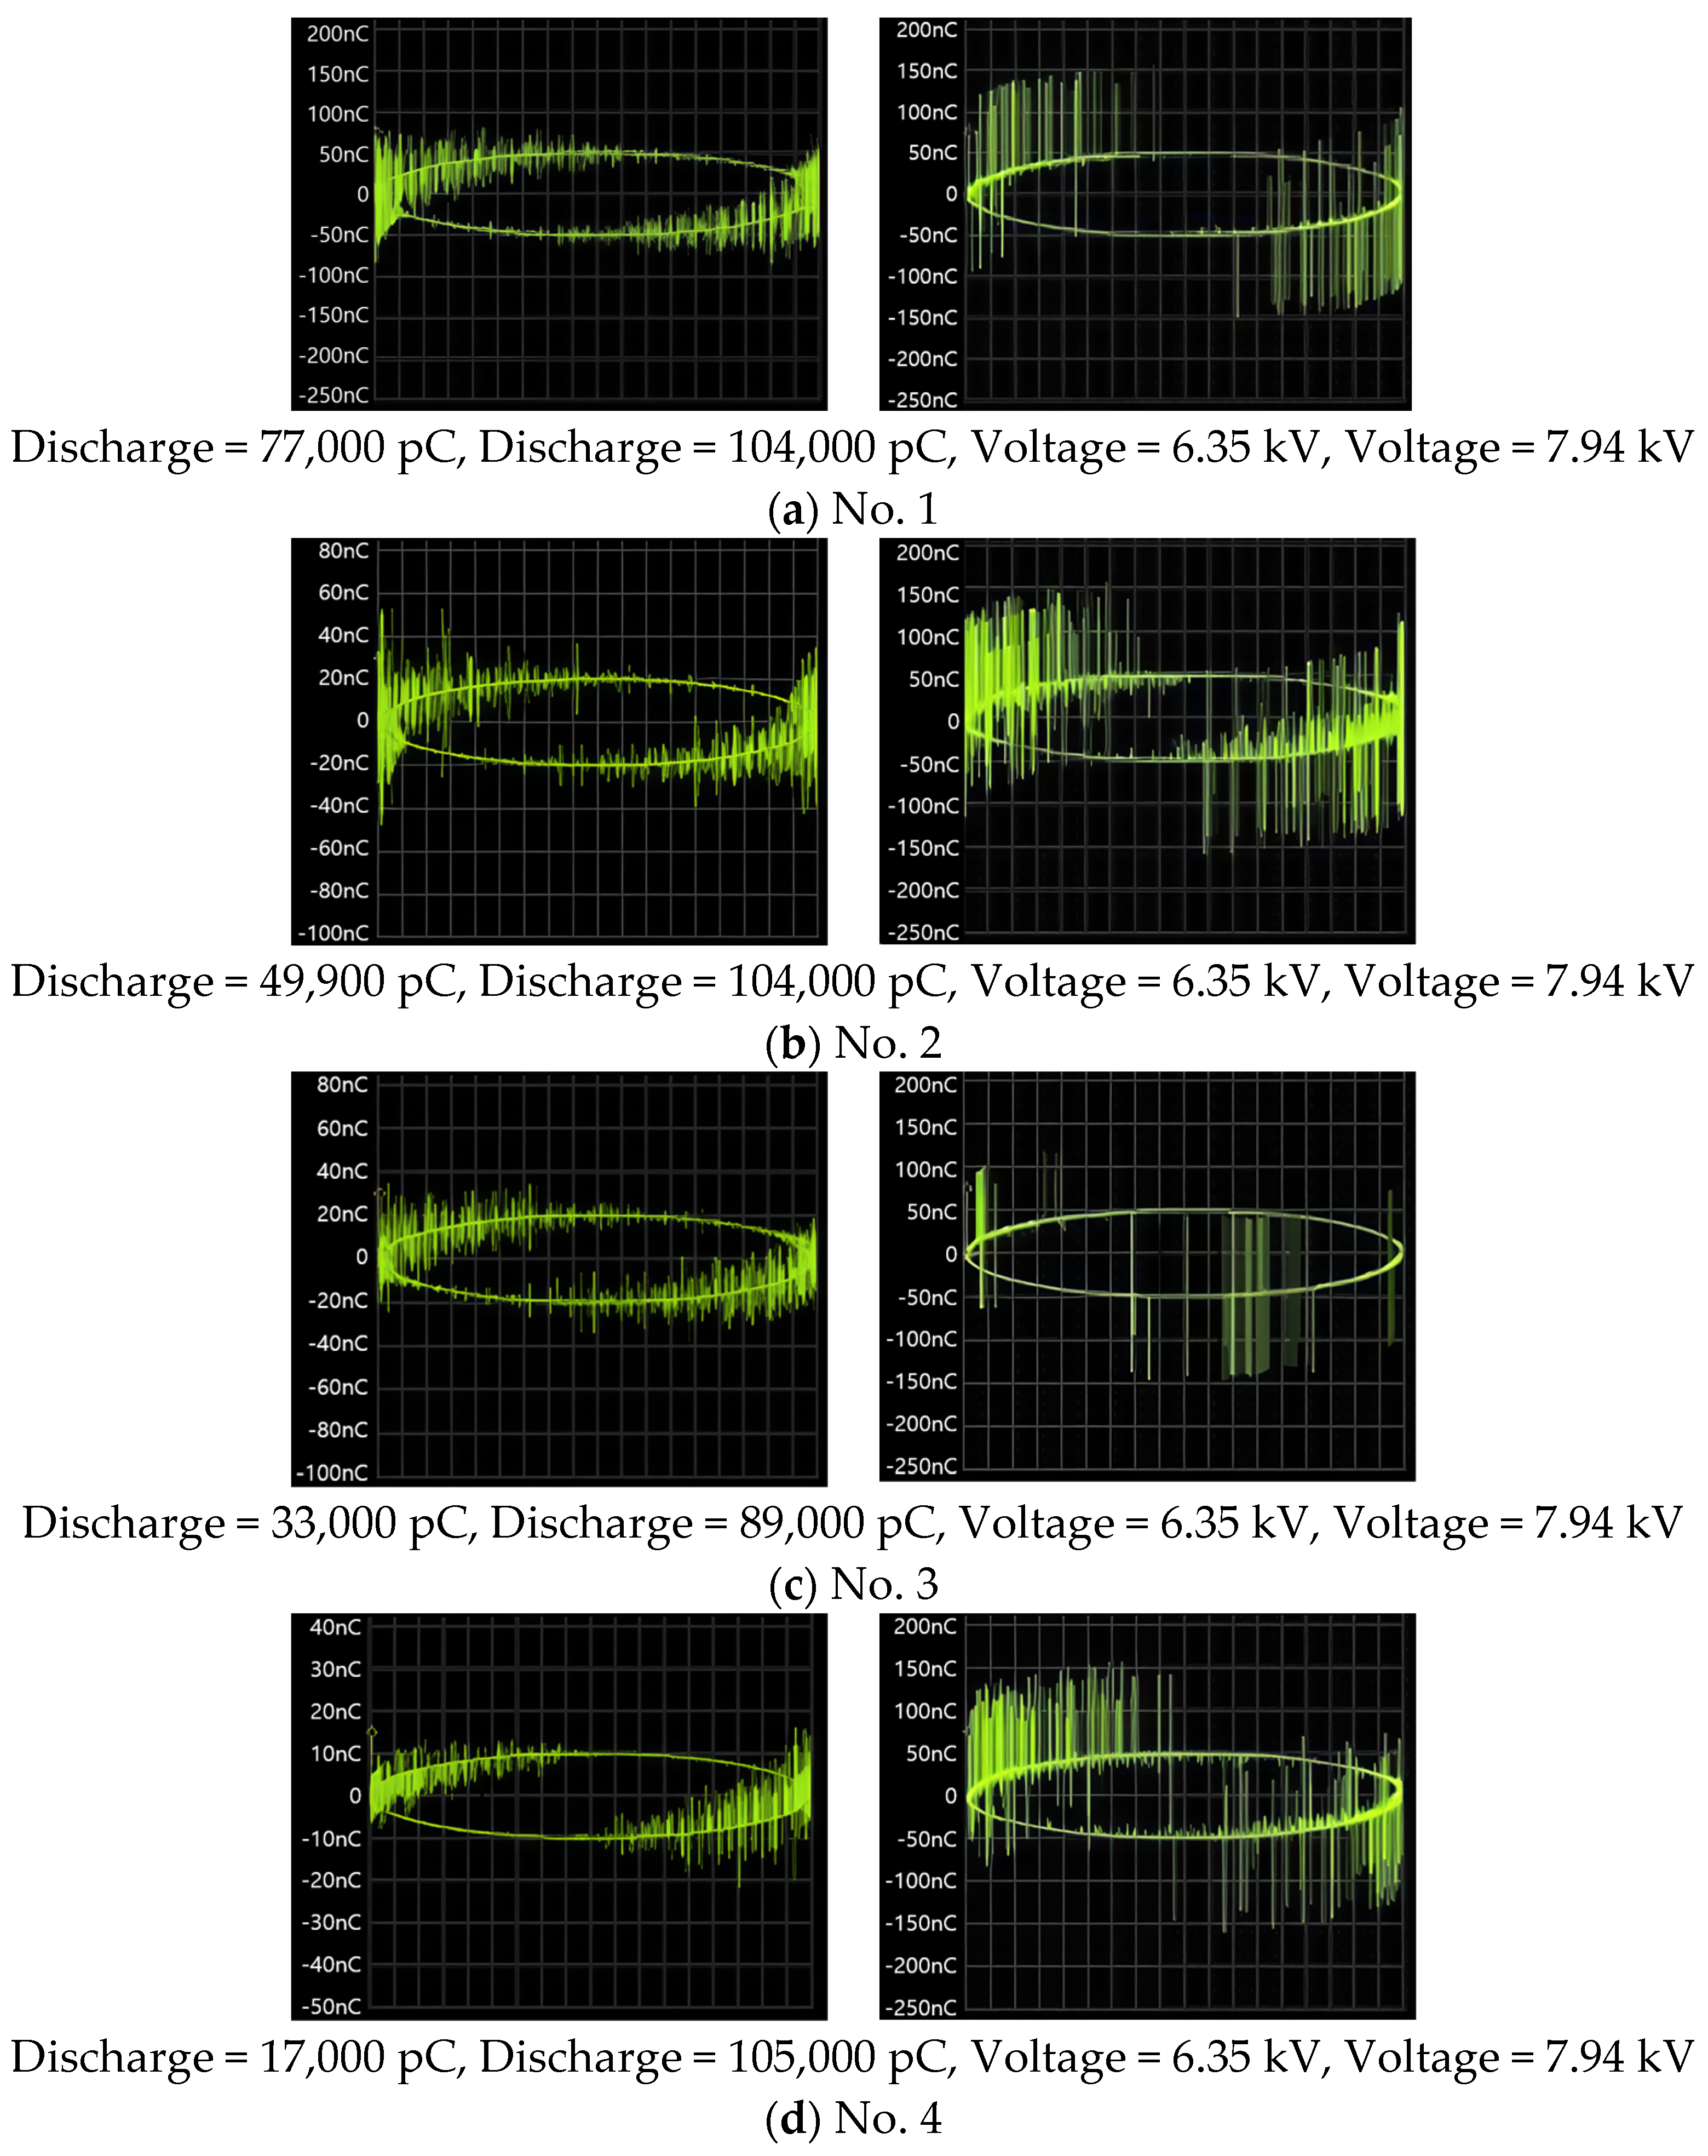
Additionally, the partial discharge magnitudes measured at the phase voltage (6.35 kV) and 1.25 times the phase voltage (7.94 kV) were 77,000 pC and 104,000 pC for No. 1, 49,900 pC and 107,000 pC for No. 2, 33,000 pC and 89,900 pC for No. 3, and 17,000 pC and 105,000 pC for No. 4, respectively. Based on the partial discharge magnitudes measured at 6.35 kV, the evaluation classified the No. 1–3 motors as defective and No. 4 as cautionary. These findings highlight the necessity of differentiated maintenance strategies for each motor and underscore the importance of precise management to improve the performance of high-voltage motors.
3.4. Analysis of Partial Discharge Increase and Pattern
The partial discharge test results for high-voltage motors No. 1 to No. 4 were compared with the partial discharge test results conducted five years ago, as shown in
Table 6 and
Table 7.
It was confirmed that the partial discharge magnitudes in most high-voltage motors have increased significantly compared to the results from five years ago. To identify the causes of the sharp increase in partial discharge over the past five years, an investigation was conducted.
During the partial discharge tests, severe corona noise was detected, and arc discharge phenomena were observed around the stator winding slots when the voltage was raised above the phase voltage. It is presumed that these arc discharges contributed to the significant increase in partial discharge magnitudes.
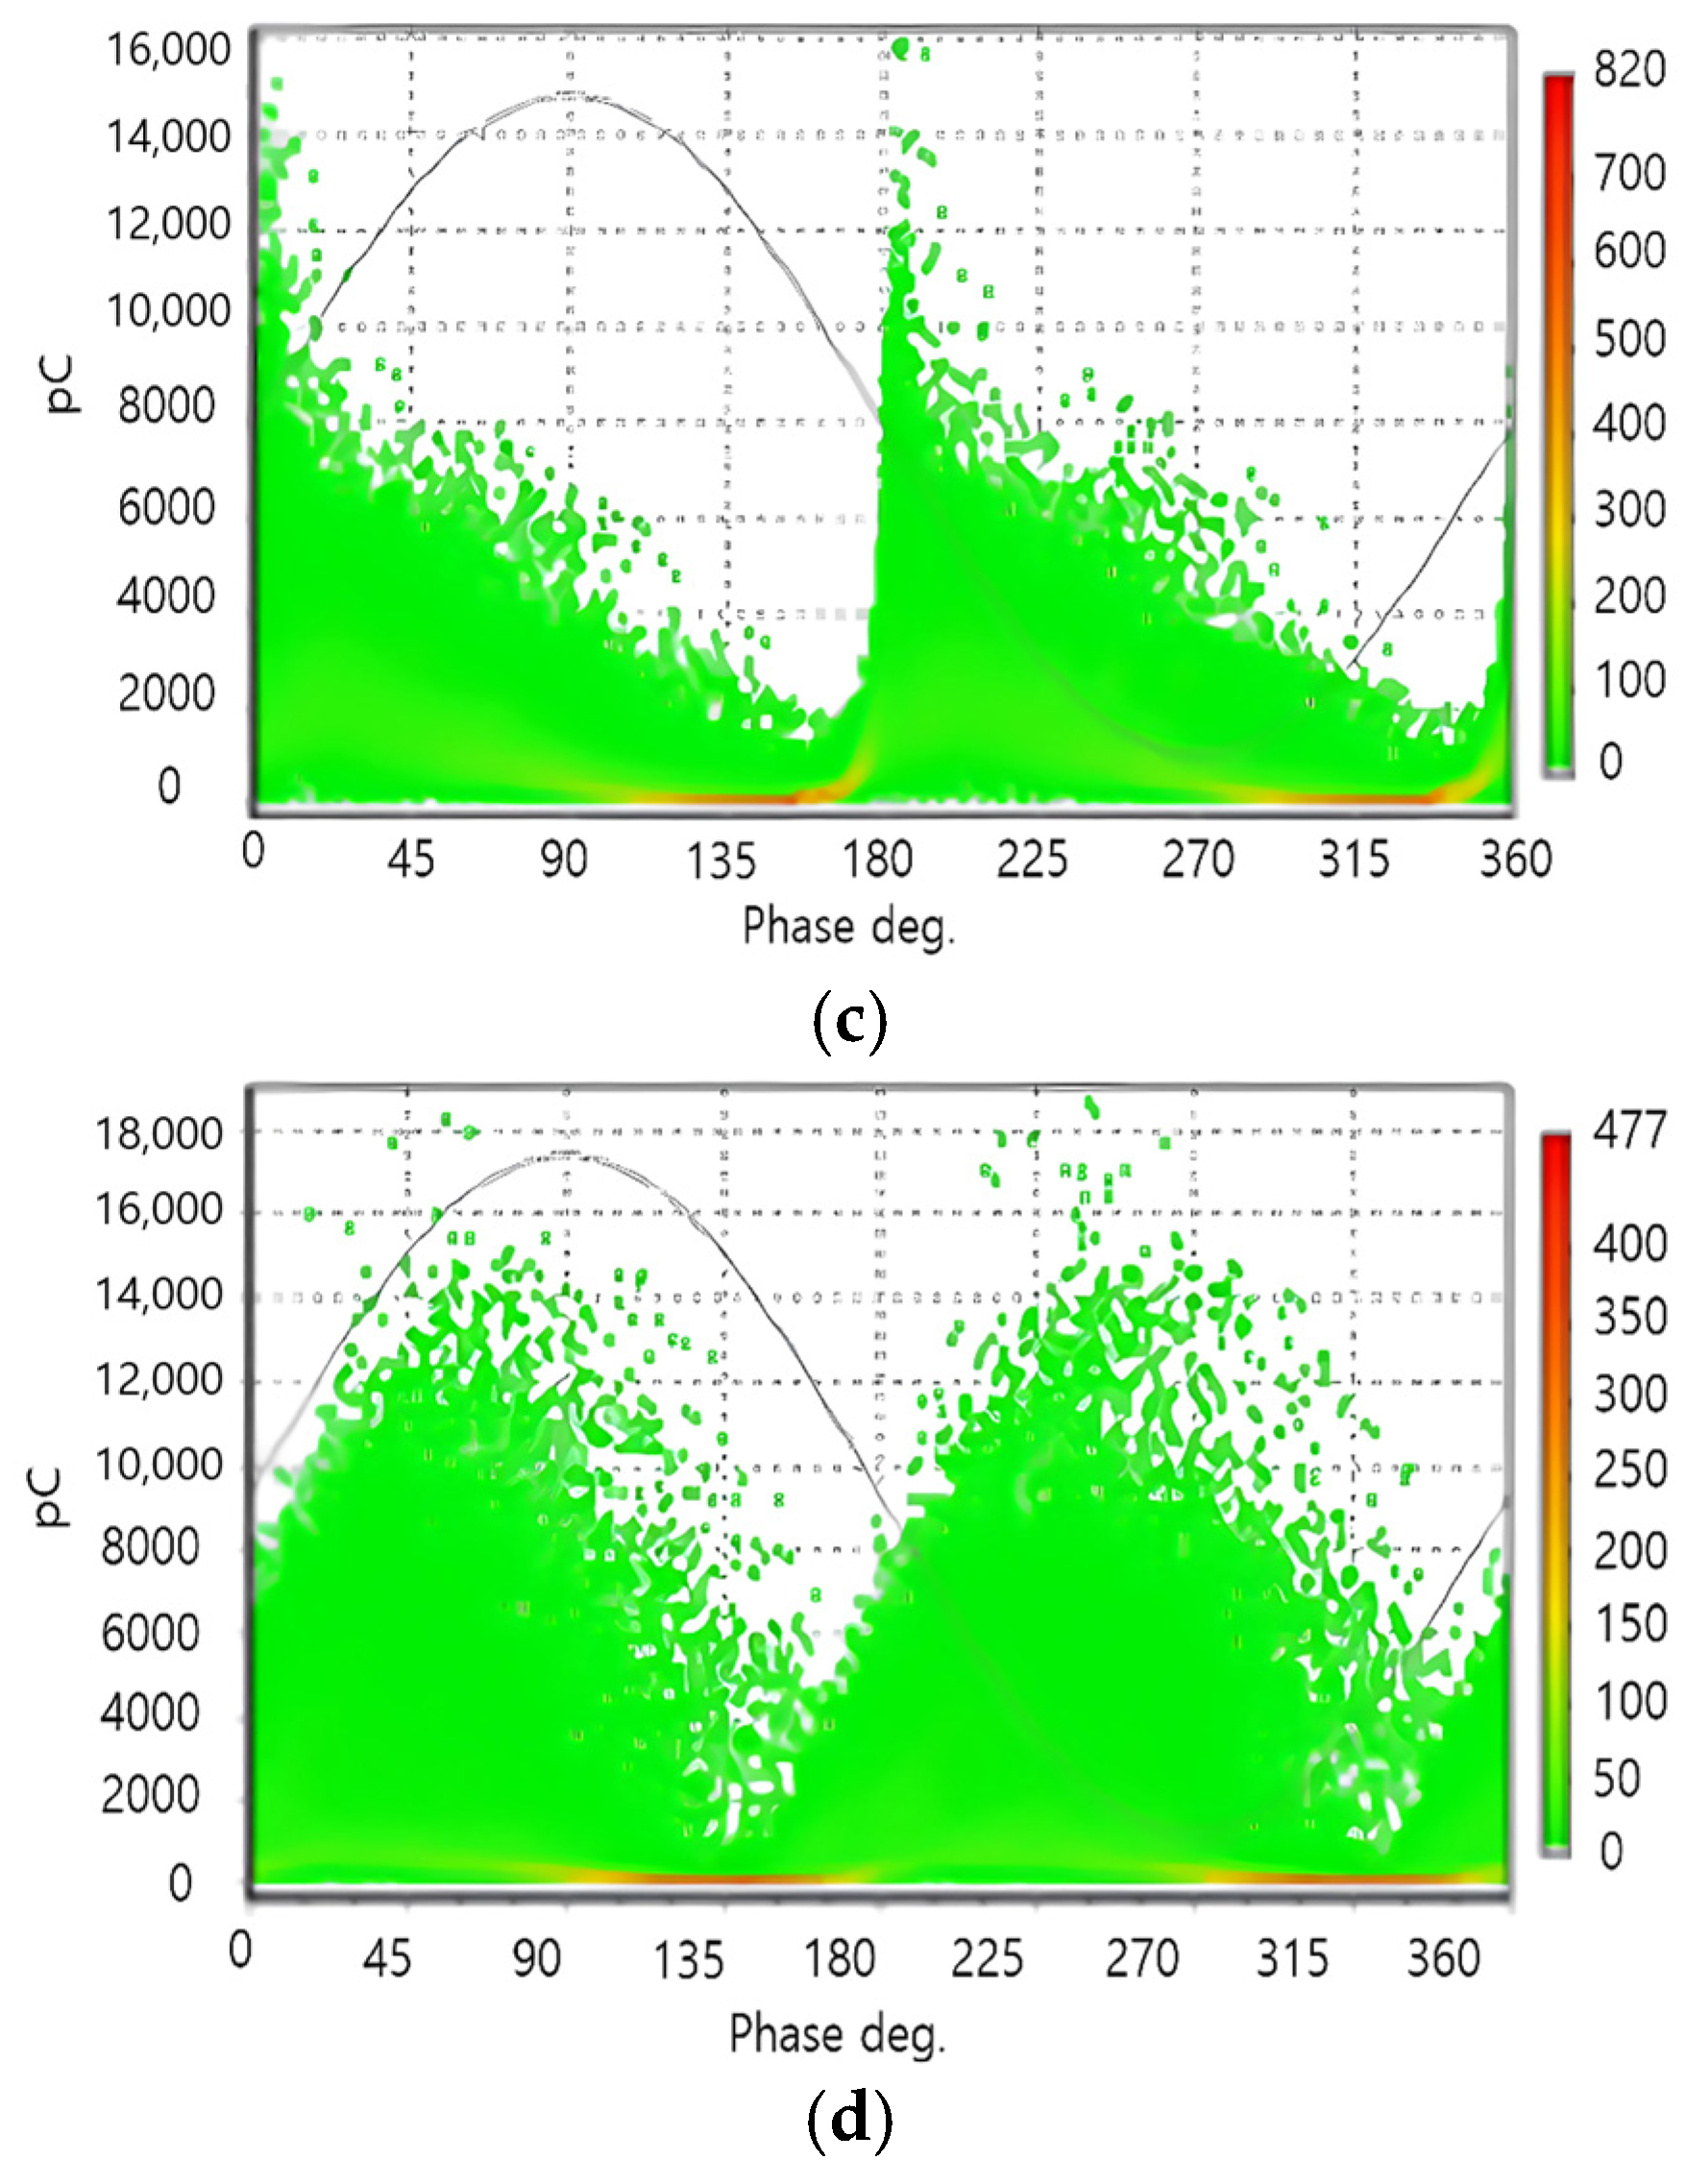
Figure 10 shows pre-maintenance partial discharge patterns at 7.94 kV. The analysis revealed a complex discharge (10% internal, 90% surface) due to arcing between the winding at the slot end and the finger plate, which is visible at both slot ends.
For 11-kV-class high-voltage motors, a partial discharge value at a phase voltage (6.35 kV) below 10,000 pC is considered acceptable, values between 10,000 pC and 30,000 pC are cautionary, and values exceeding 30,000 pC are classified as defective. Accordingly, at 6.35 kV, motors 1–3 were assessed as defective, while motor 4 was rated as cautionary.
3.5. Mathematical Model Analysis
Partial discharge can result from various factors, including corona discharge at protruding insulation parts, surface discharge or tracking on the insulation surface, and internal defects such as voids or impurities. Partial discharge caused by these defects resembles the behavior of a capacitor, where electric charges are repeatedly charged and discharged; thus, its equivalent circuit can be represented using a capacitor model [
20,
25].
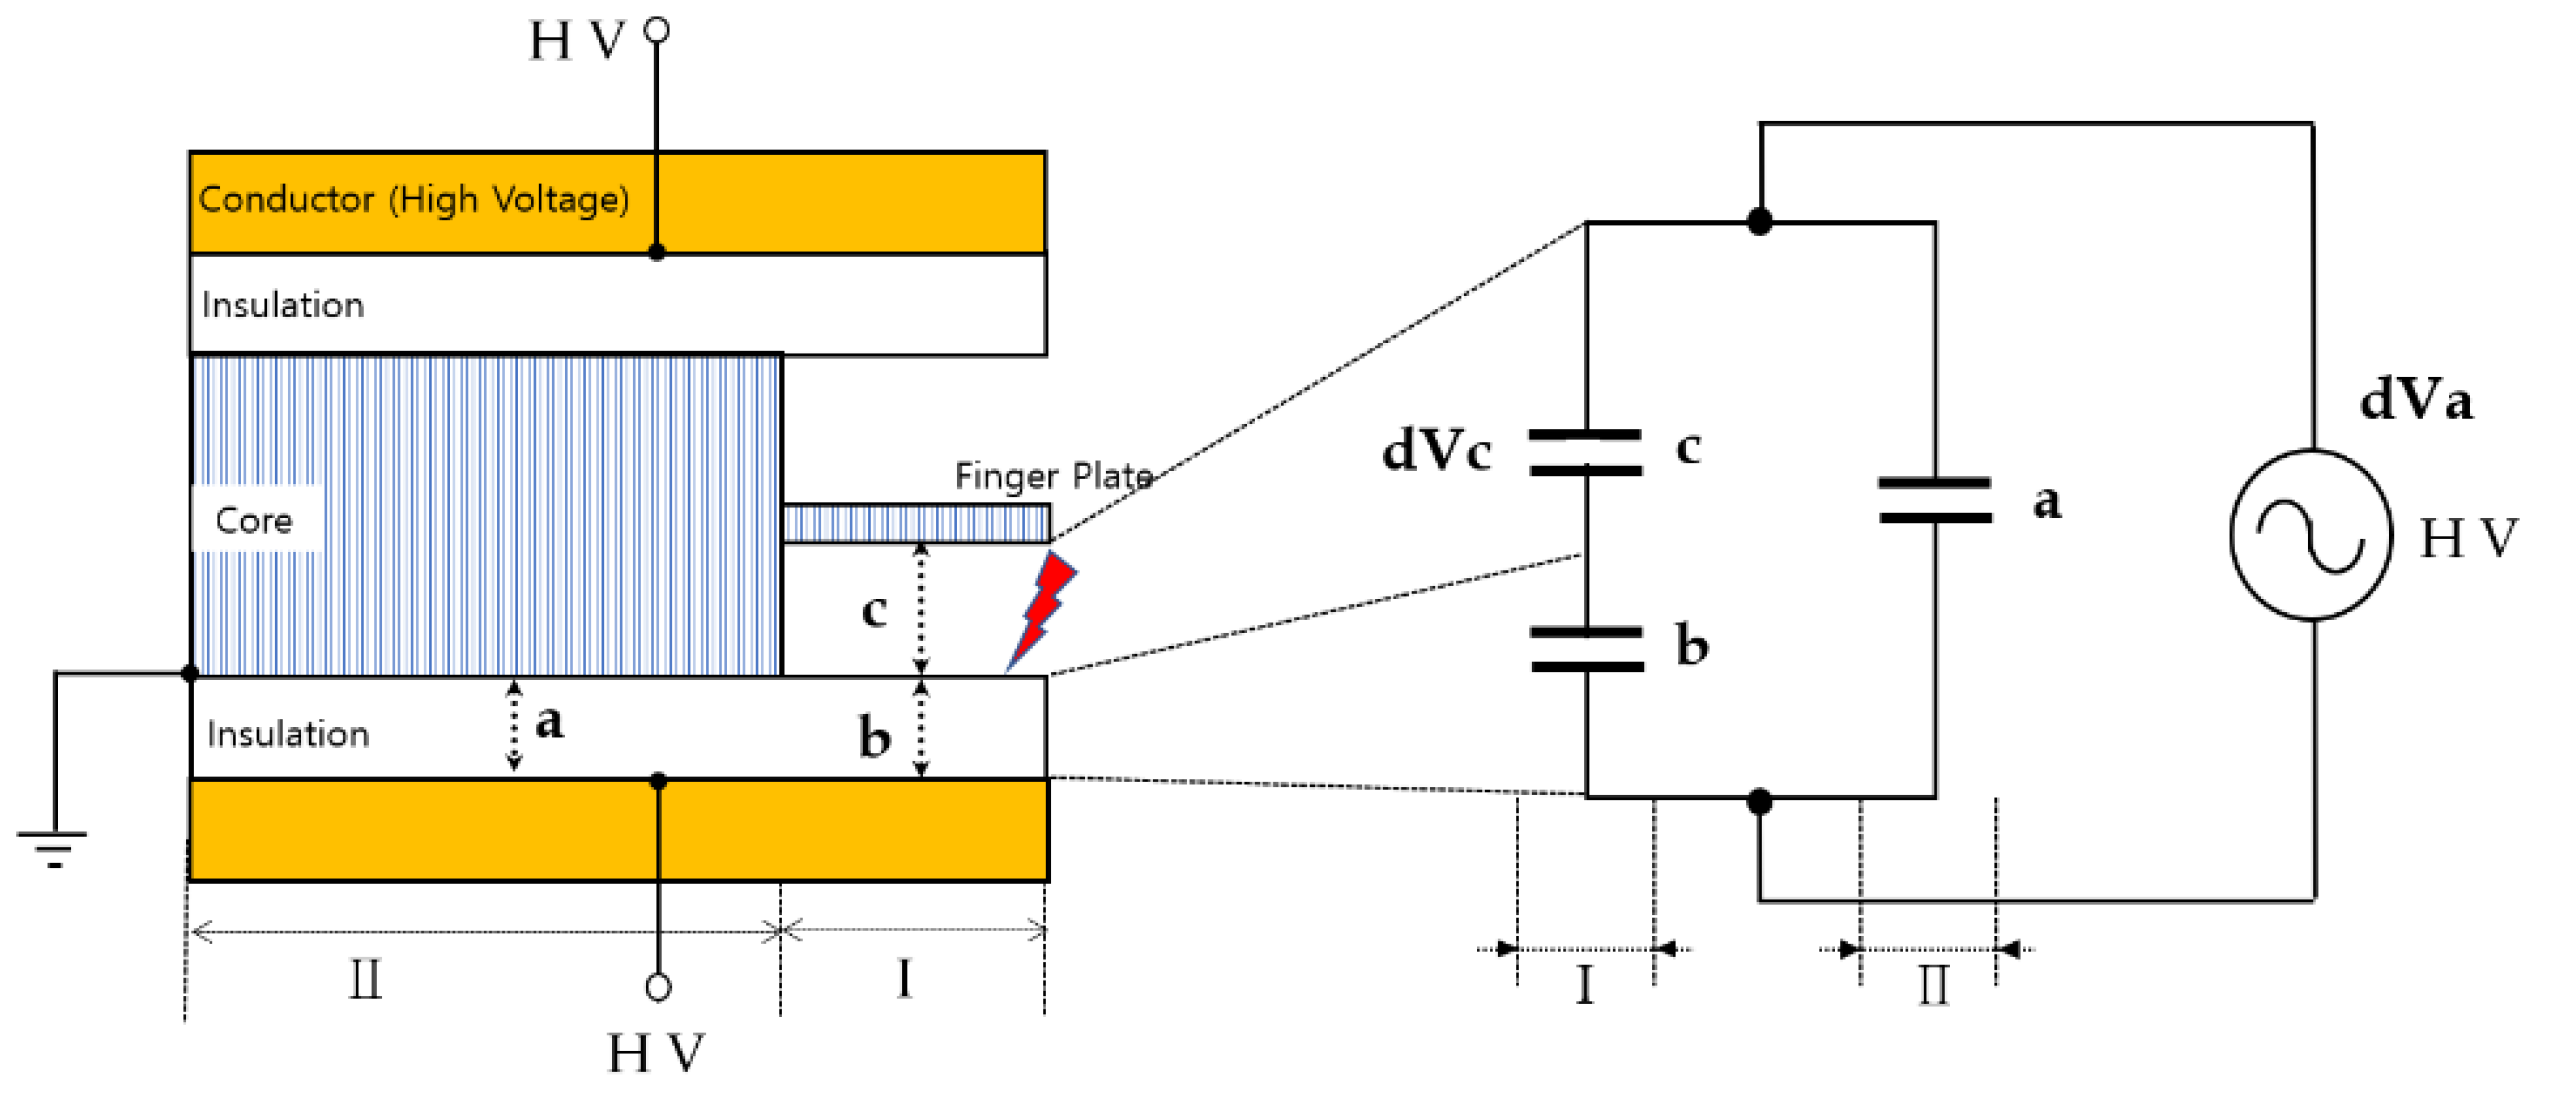
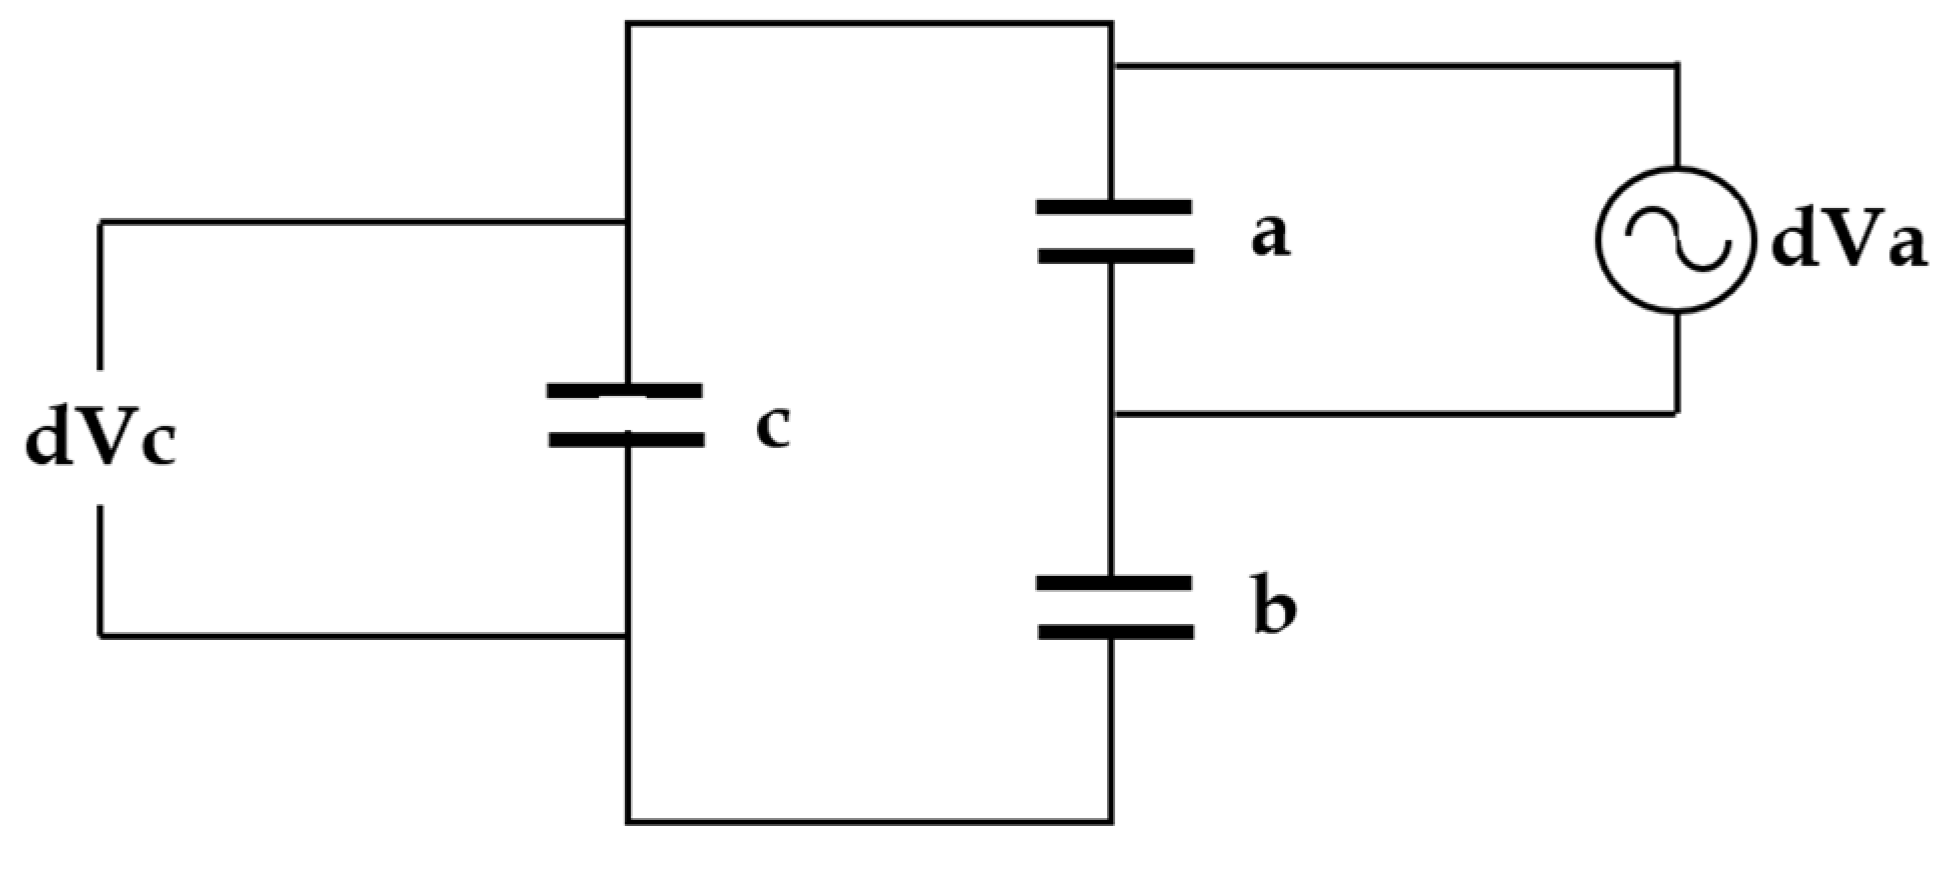
In this model, regions I and II indicate the spatial distribution of the insulation system, with I representing the vicinity of the defect and II indicating the bulk intact insulation. The charge accumulated within an insulation defect is represented by capacitor c, the charge in the surrounding areas on both sides of C by capacitor b, and the charge passing through intact insulation by capacitor a. Using these representations, an equivalent circuit is illustrated in
Figure 11.
The equivalent circuit diagram of insulation defects and electric charge distribution demonstrates how a defect within the insulation functions as a capacitor c, while the surrounding and intact regions of the insulation are represented by capacitors B and A, respectively.
In this model:
Capacitor a represents the intact insulation through which charge flows, contributing to the overall dielectric properties.
Capacitor b represents the surrounding regions near the defect that influences charge distribution.
Capacitor c represents the defective region where partial discharge occurs, storing charge locally.
This capacitor model effectively visualizes how insulation defects contribute to partial discharge phenomena by likening the system to an interconnected capacitor network based on affected insulation regions.
The actual discharge charge within insulation voids during partial discharge can be expressed as shown in Equation (5).
Capacitor c represents the defective region where partial discharge occurs, storing charge locally. Capacitor b represents the surrounding regions close to the defect that also influence the charge distribution. Capacitor a represents the healthy insulation through which the charge passes, contributing to the overall dielectric behavior. This model helps visualize how defects in insulation contribute to partial discharge phenomena by comparing the system to a network of interconnected capacitors based on the regions of insulation affected. The actual discharge charge amount during the partial discharge occurring in the voids of the insulation can be expressed as shown in Equation (5).
In Equation (5),
represents the actual charge responsible for the discharge while
denotes the apparent charge amount. Since the charging and discharging phenomena that lead to partial discharge occur at
, an equivalent circuit can be constructed based on
, as illustrated in
Figure 12.
However, it is not possible to directly measure
within the void. Since only the voltage change in the power supply due to
denoted as
, can be measured, the actual value recorded during partial discharge is
. Equation (6) demonstrates how the charge during partial discharge in the equivalent circuit of
Figure 12 influences
, which is derived from the main power supply.
In , represents the apparent charge, indicating that the discharge charge is stored in capacitor b.
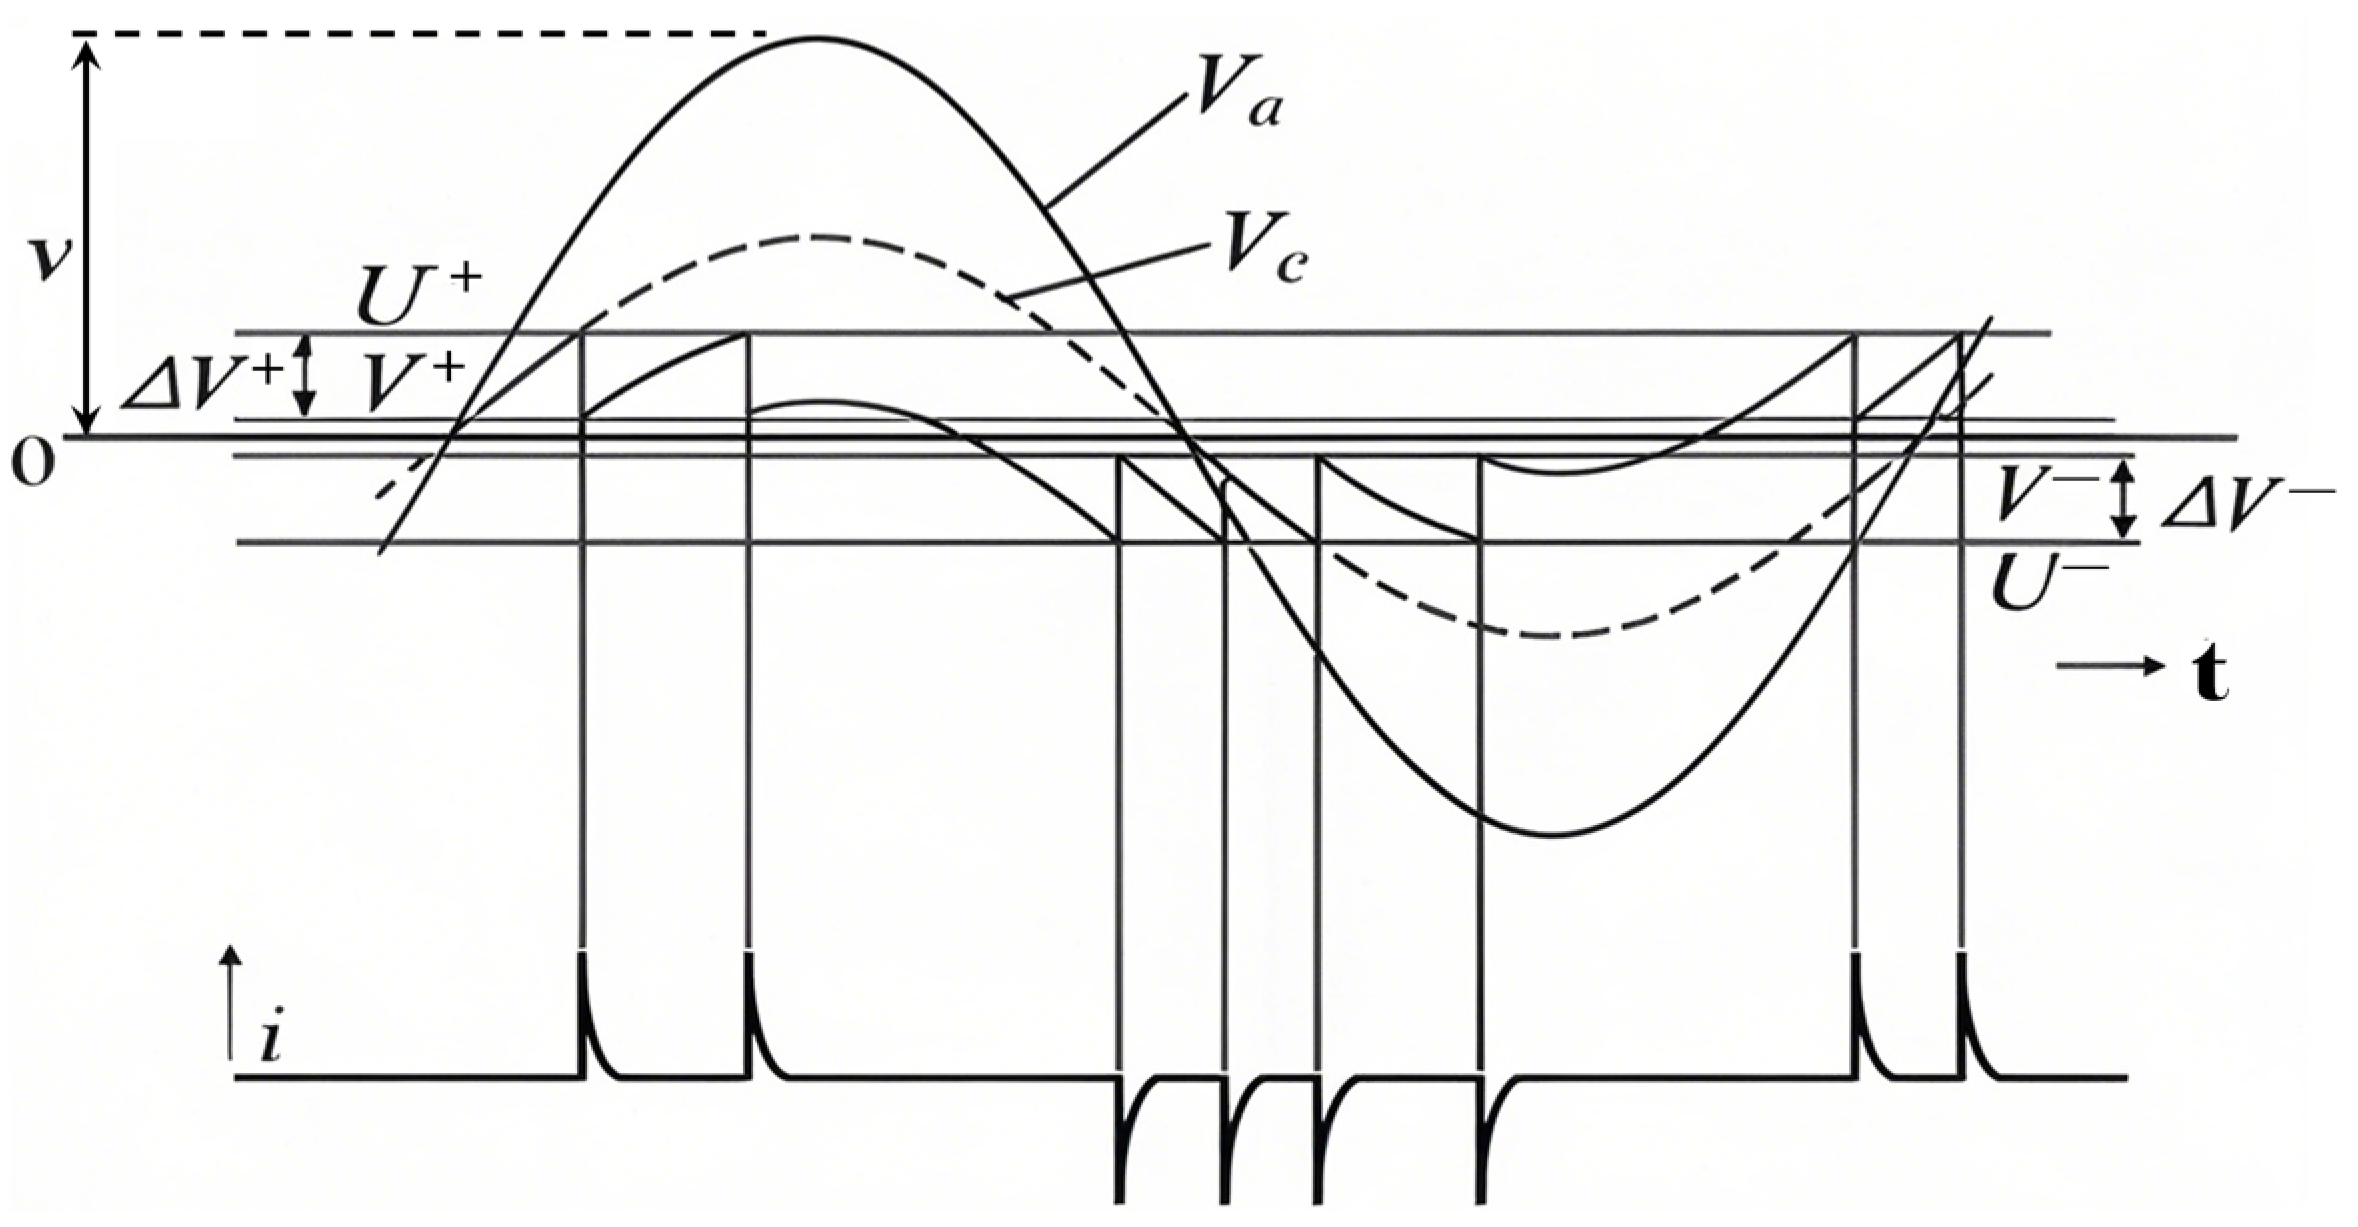
The partial discharge waveform in
Figure 13 illustrates the generation of current
during a partial discharge event. This discharge waveform forms when the electric field within the insulation exceeds a critical level (
, triggering a localized breakdown in defect areas, such as voids. As partial discharge occurs, rapid changes in charge distribution produce a current pulse
, creating the discharge waveform. This waveform typically consists of short-duration pulses, detectable as indicators of partial discharge. The shape and amplitude of the waveform offer insights into the severity and nature of the discharge within the insulation material [
26,
27].
3.6. Analysis of the Causes of Arc and Partial Discharge Occurrence
As shown in
Table 6, the partial discharge values of the four high-voltage motors have significantly increased compared to the measurements taken five years ago. To identify the root cause of this substantial increase, an investigation was conducted, and it was determined that the primary reason was the accumulated insulation degradation of the stator windings over the five-year period.
During partial discharge testing, severe corona noise was detected, and arc discharge phenomena were observed around the stator winding slots when the voltage exceeded the phase voltage. The primary causes of arc discharge are hypothesized to be attributable to the following two factors [
28,
29,
30].
- -
Degradation at the boundary between semiconductive and grading coatings.
- -
Weakening of the corona discharge prevention function and the improper positioning of finger plates.
The first suspected cause is the degradation at the boundary between the semiconductive and grading coatings. A rapid increase in the potential gradient on the surface of the coil insulation at the slot end, where the core ends, can make it vulnerable to corona generation and insulation breakdown [
21]. To prevent this, curved surface design, overlap insulation, and grading coatings are applied during manufacturing.
Figure 14 illustrates the insulation treatment applied at the stator coil ends to prevent corona generation [
9].
The boundary where the stator winding exits from within the slot into the air is a location of high electrical stress. Over time, as degradation progresses, the grading coating loses its grounding function, leading to spark generation [
9].
Stress and Vibration Occurrence at the Stator Winding Boundary
- →
Degradation of the semiconductive layer and grading coating.
- →
Loss of function in the low-resistance grading coating.
- →
Charged particles on the insulation surface lose their conduction path and discharge to the surrounding area.
The degree of degradation at the slot end of the stator winding can be evaluated by observing if it is whitening, which appears as a powder-like transformation, and if it is visible on the winding surface [
23,
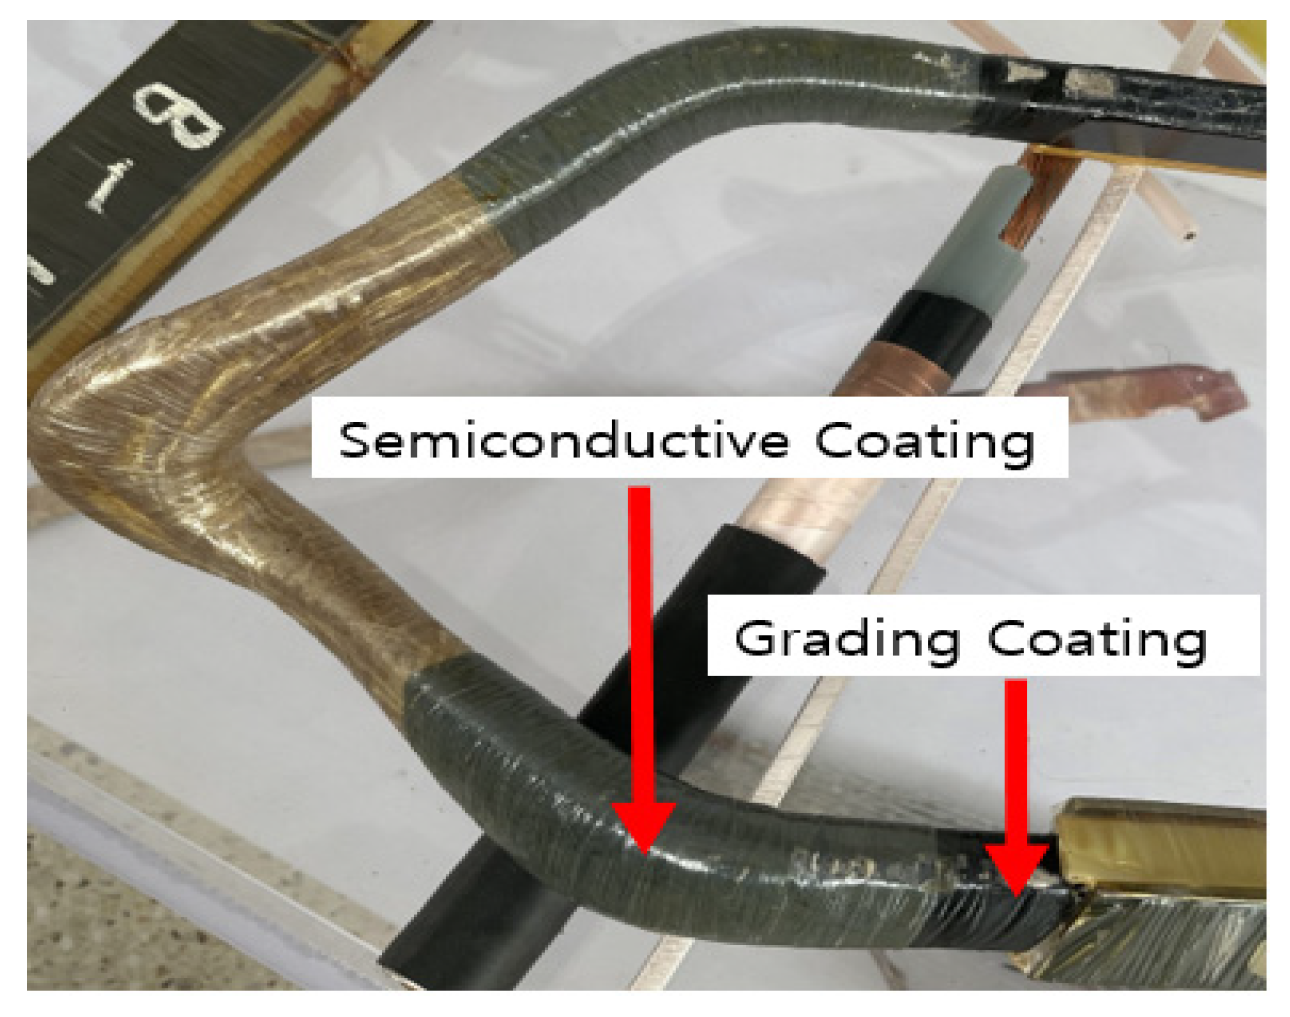
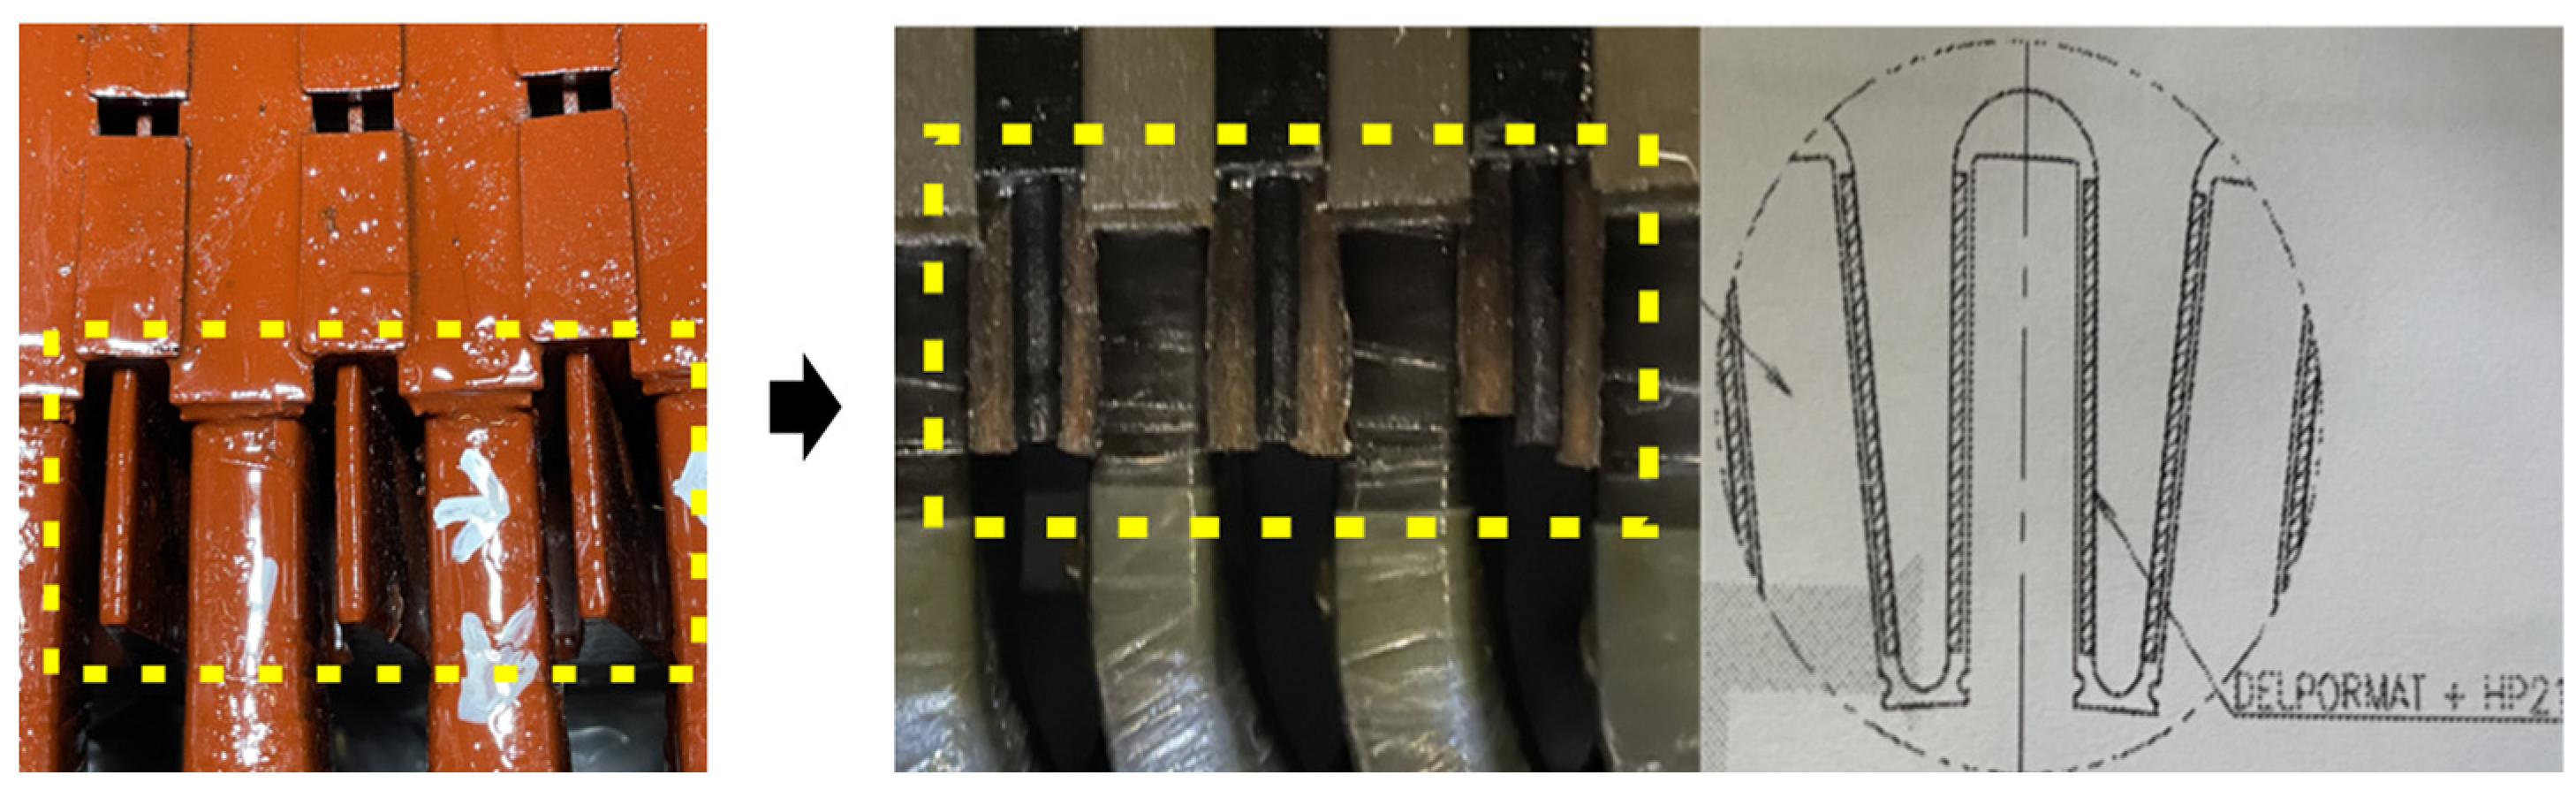
31]. Another significant suspected cause of degradation is the reduced effectiveness of the corona prevention function and the potential misalignment of the finger plate. As previously detailed, a semiconductive coating along with a grading coating is applied to the outer insulation layer at the stator winding boundary at the slot end to minimize surface-charged particles and effectively prevent corona discharge, as illustrated in
Figure 15 [
9].
The corona onset voltage, also known as the air insulation breakdown voltage, is typically 30 kV/cm for direct current and 21 kV/cm for alternating current (RMS) under standard atmospheric conditions, with a temperature of 20 °C and a pressure of 760 mmHg [
24]. In situations where an arc forms between the insulation of the winding and its structural support, the arc distance can be measured, which allows for the calculation of the potential charge present on the insulation surface.
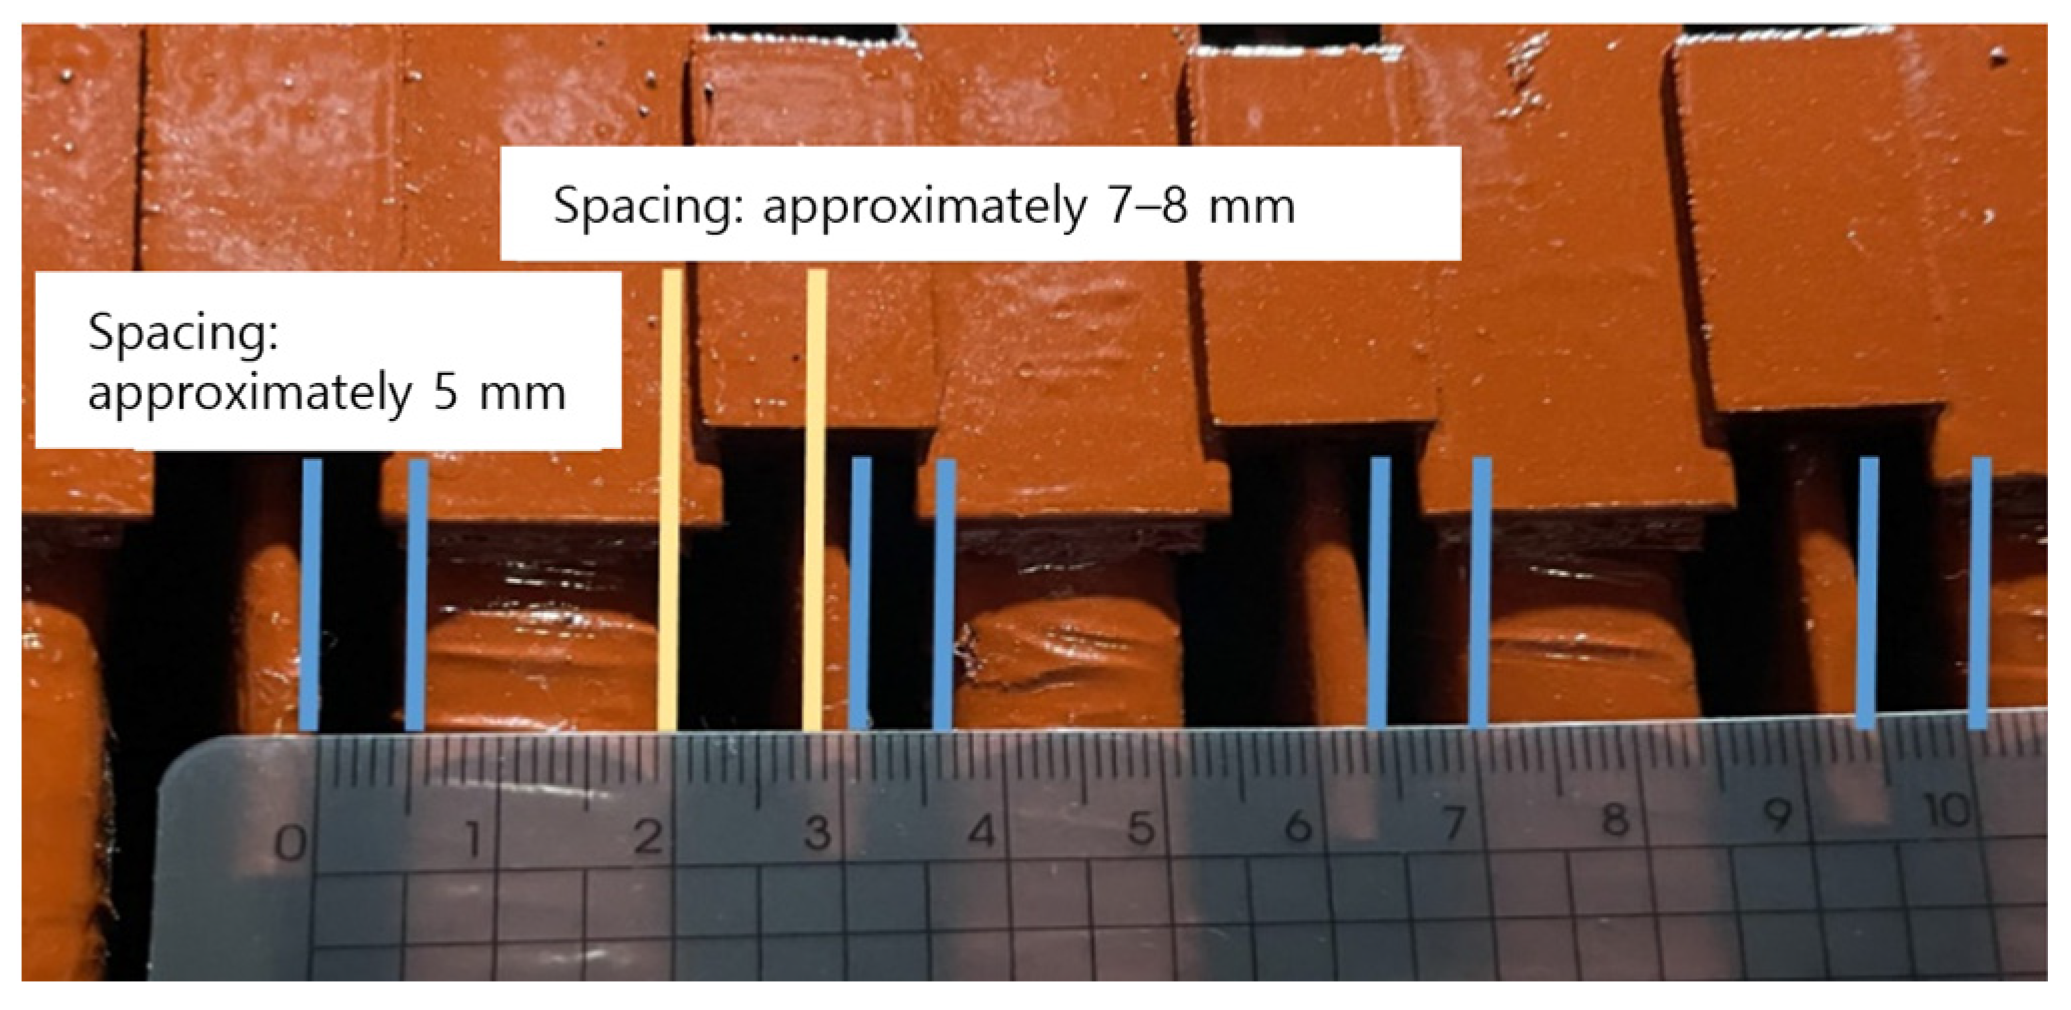
As illustrated in
Figure 16, the minimum gap between the finger plate and the winding insulation is measured at approximately 5 mm. Given that the corona onset voltage for alternating current (RMS) is 21 kV/cm, the estimated potential generated due to surface charging on the insulation is calculated to be around 10.5 kV. This value provides an essential reference for evaluating the insulation’s ability to withstand high-voltage stress under operational conditions.
The breakdown threshold potential gradient for air insulation on the surface of an insulator is influenced by several key factors, including the condition of the surface, the insulation’s thickness, the insulation distance, and the gap between the insulator and its supporting structure. These factors collectively impact the insulation’s capacity to withstand high-voltage stress. Ultimately, the potential charge accumulated on the insulation surface is governed by design parameters, such as the thickness and overall condition of the insulation material, as well as the precise distance between the insulation layer and its support. This relationship strongly suggests a close connection with the likelihood of corona discharge occurring, as each of these design factors plays a critical role in determining the insulator’s resilience against surface breakdown and discharge initiation.
Additionally, the gap between the insulation and the finger plate is uneven, measuring approximately 7–8 mm on the left side and 5 mm on the right side relative to the finger plate. This uneven spacing likely led to arc discharge on the side with the shorter gap. If the finger plate had been positioned centrally relative to the insulation, with a uniform gap of approximately 6–6.5 mm on each side, air insulation breakdown may not have occurred at the motor’s maximum operating voltage of 11 kV.
Figure 17 illustrates an example of design improvements to prevent arc discharge between the finger plate and the insulation.
In summary, the following conclusions can be drawn. High electrical stress at the boundary of the stator winding slot end led to insulation degradation, resulting in damage or wear to the semiconductive layer and grading coating. Consequently, the grounding function of the grading coating deteriorated, and the electric potential on the insulation surface of the winding end gradually increased, eventually exceeding the air insulation breakdown threshold. This ultimately led to an arc-like discharge to the adjacent finger plate.
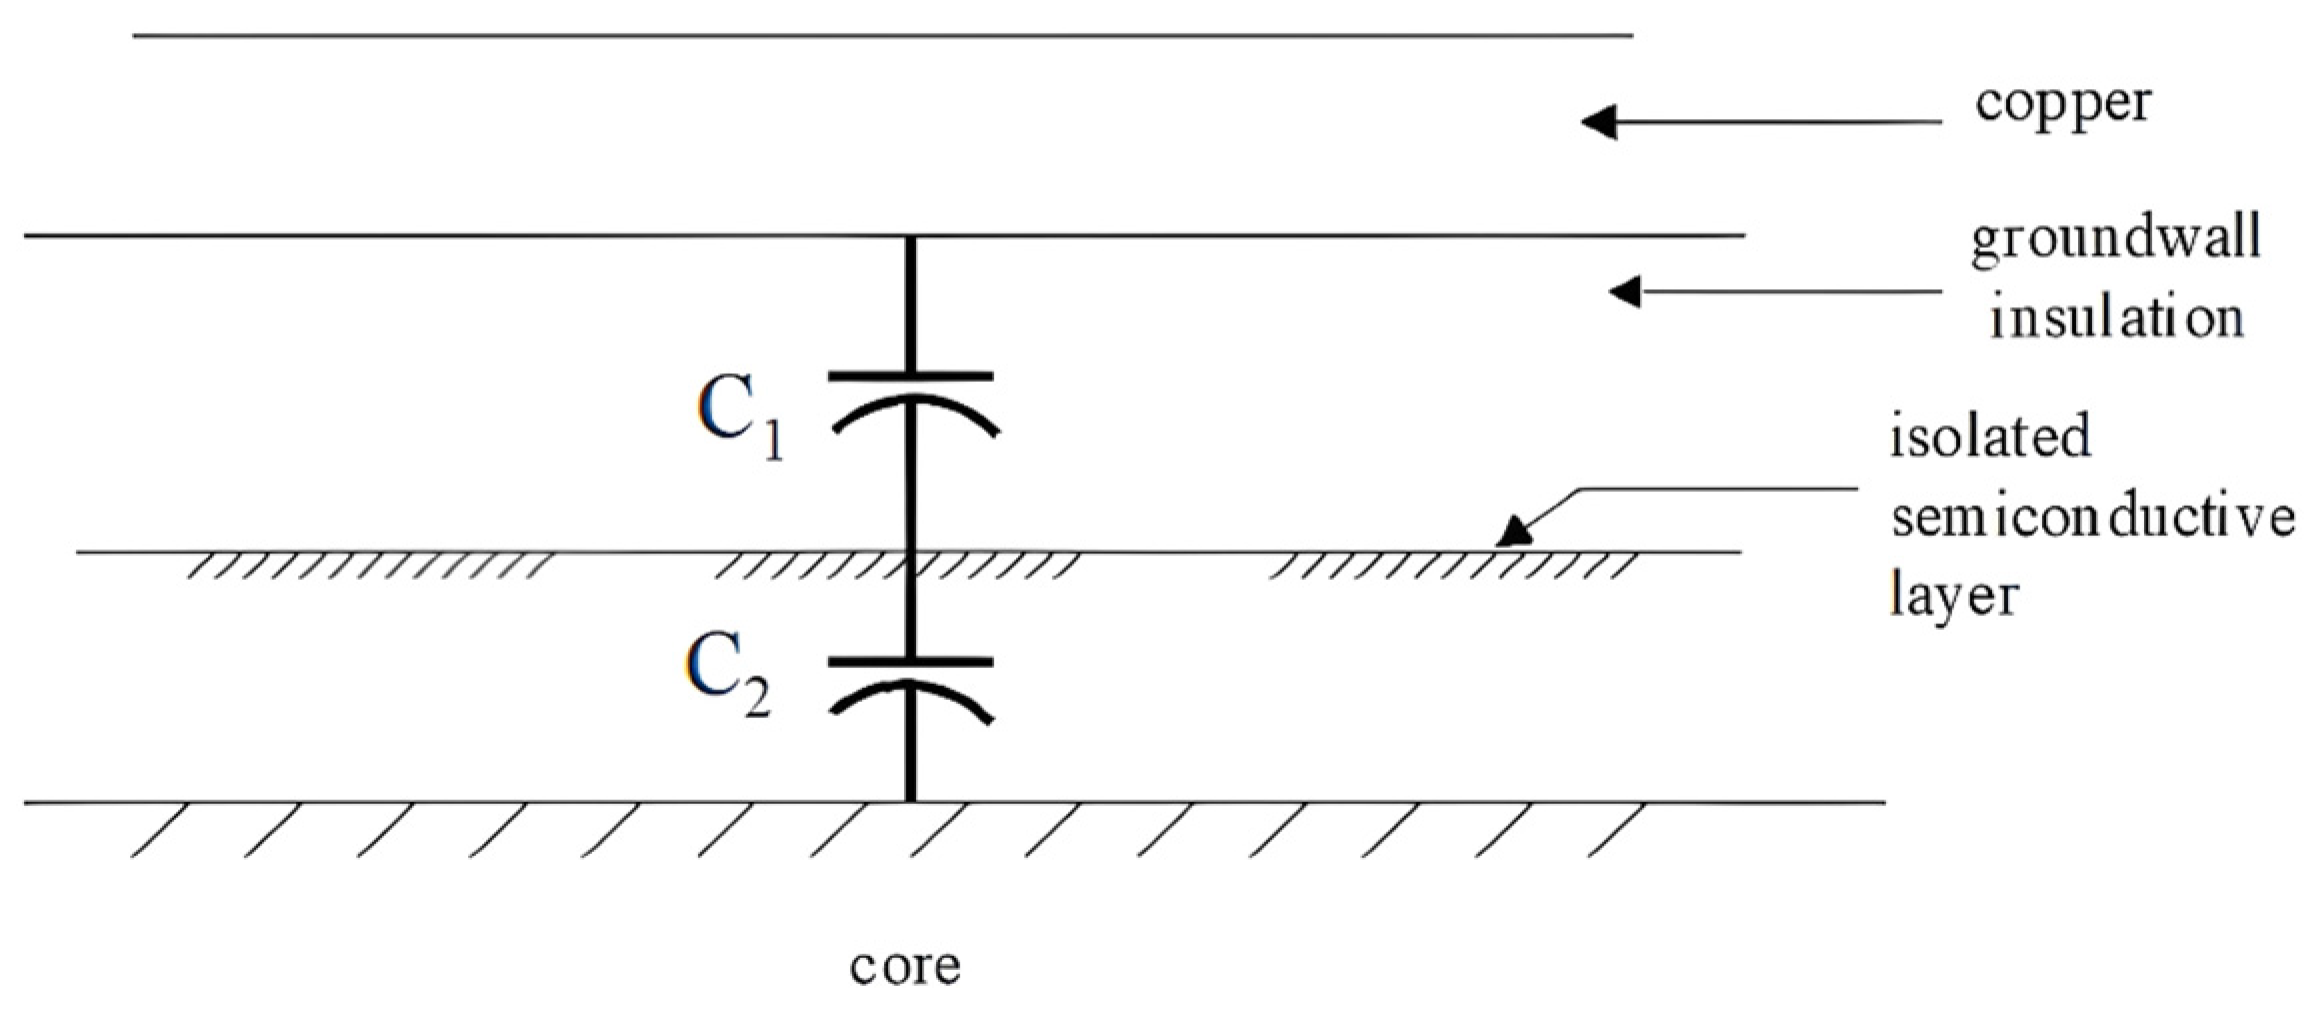
Furthermore, if the semiconductive layer on the insulation surface becomes worn and damaged due to relative movement between the coil and the slot on the stator winding surface, slot discharge may occur, as shown in
Figure 18.
If the semiconductive layer is damaged, resulting in charge accumulation on the winding surface and causing slot discharge between the core and the winding, insulation reinforcement is deemed necessary.
3.7. UV and Partial Discharge Analyses Before Maintenance Work
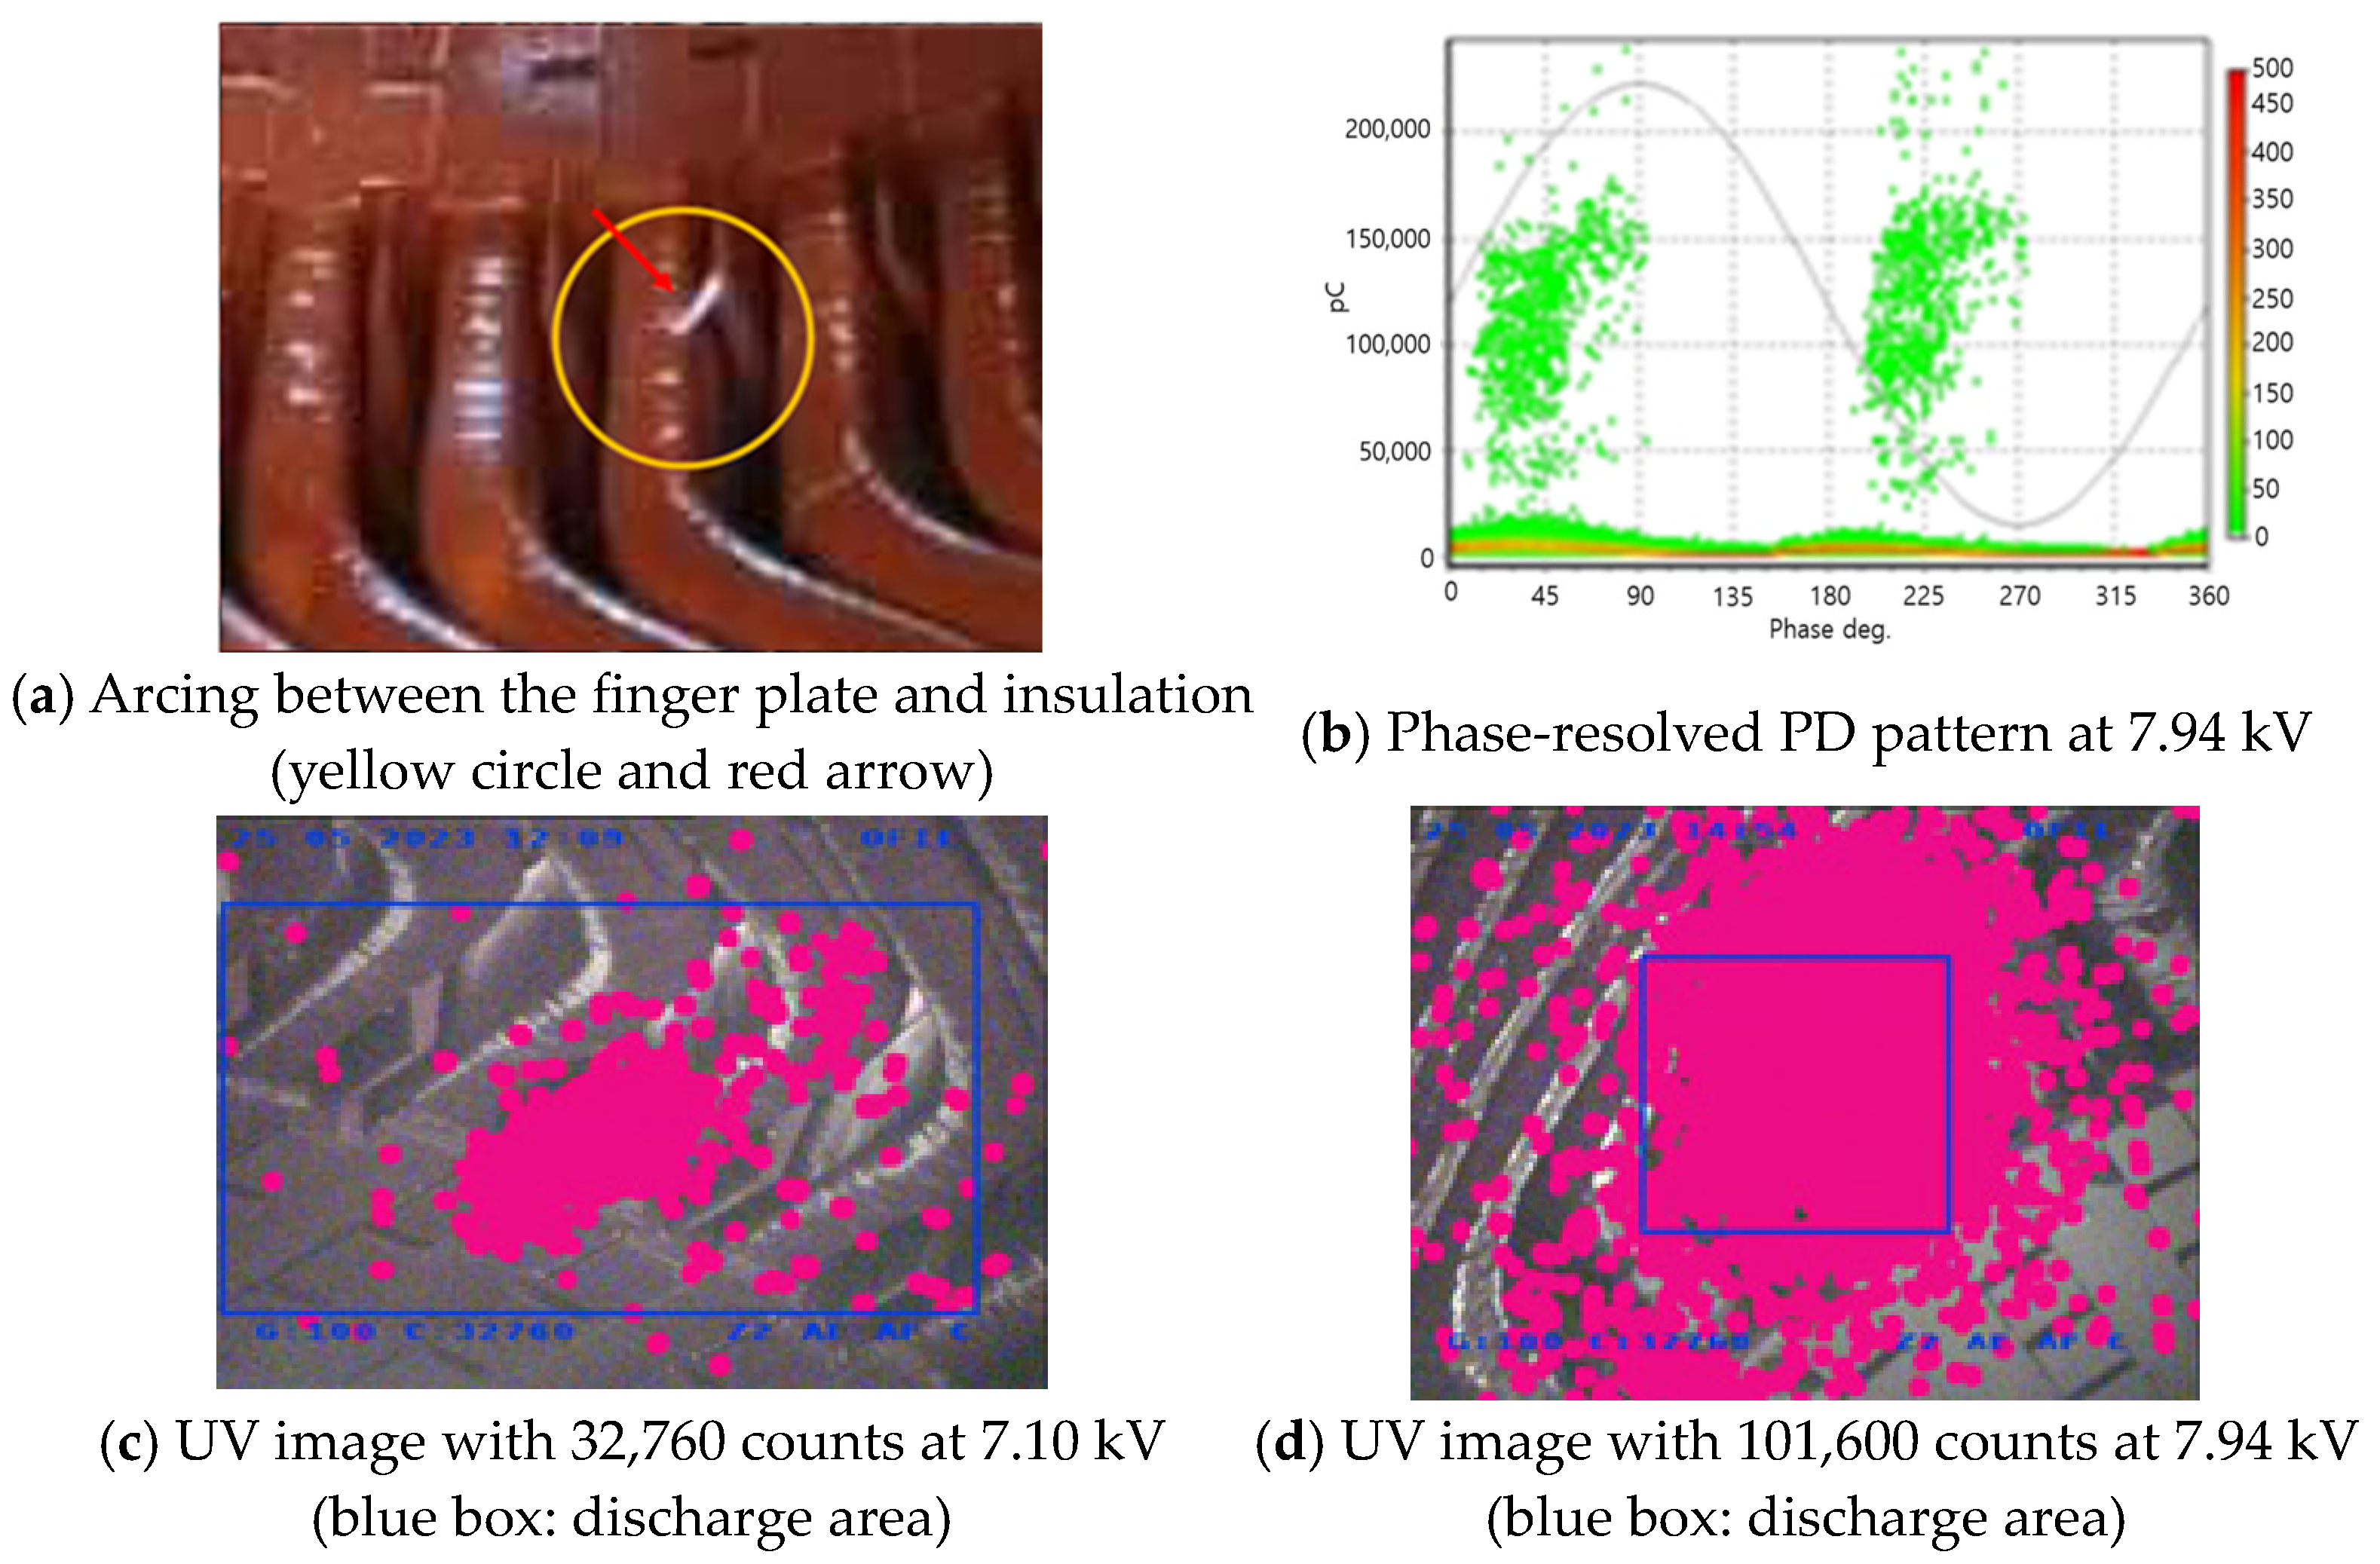
As depicted in
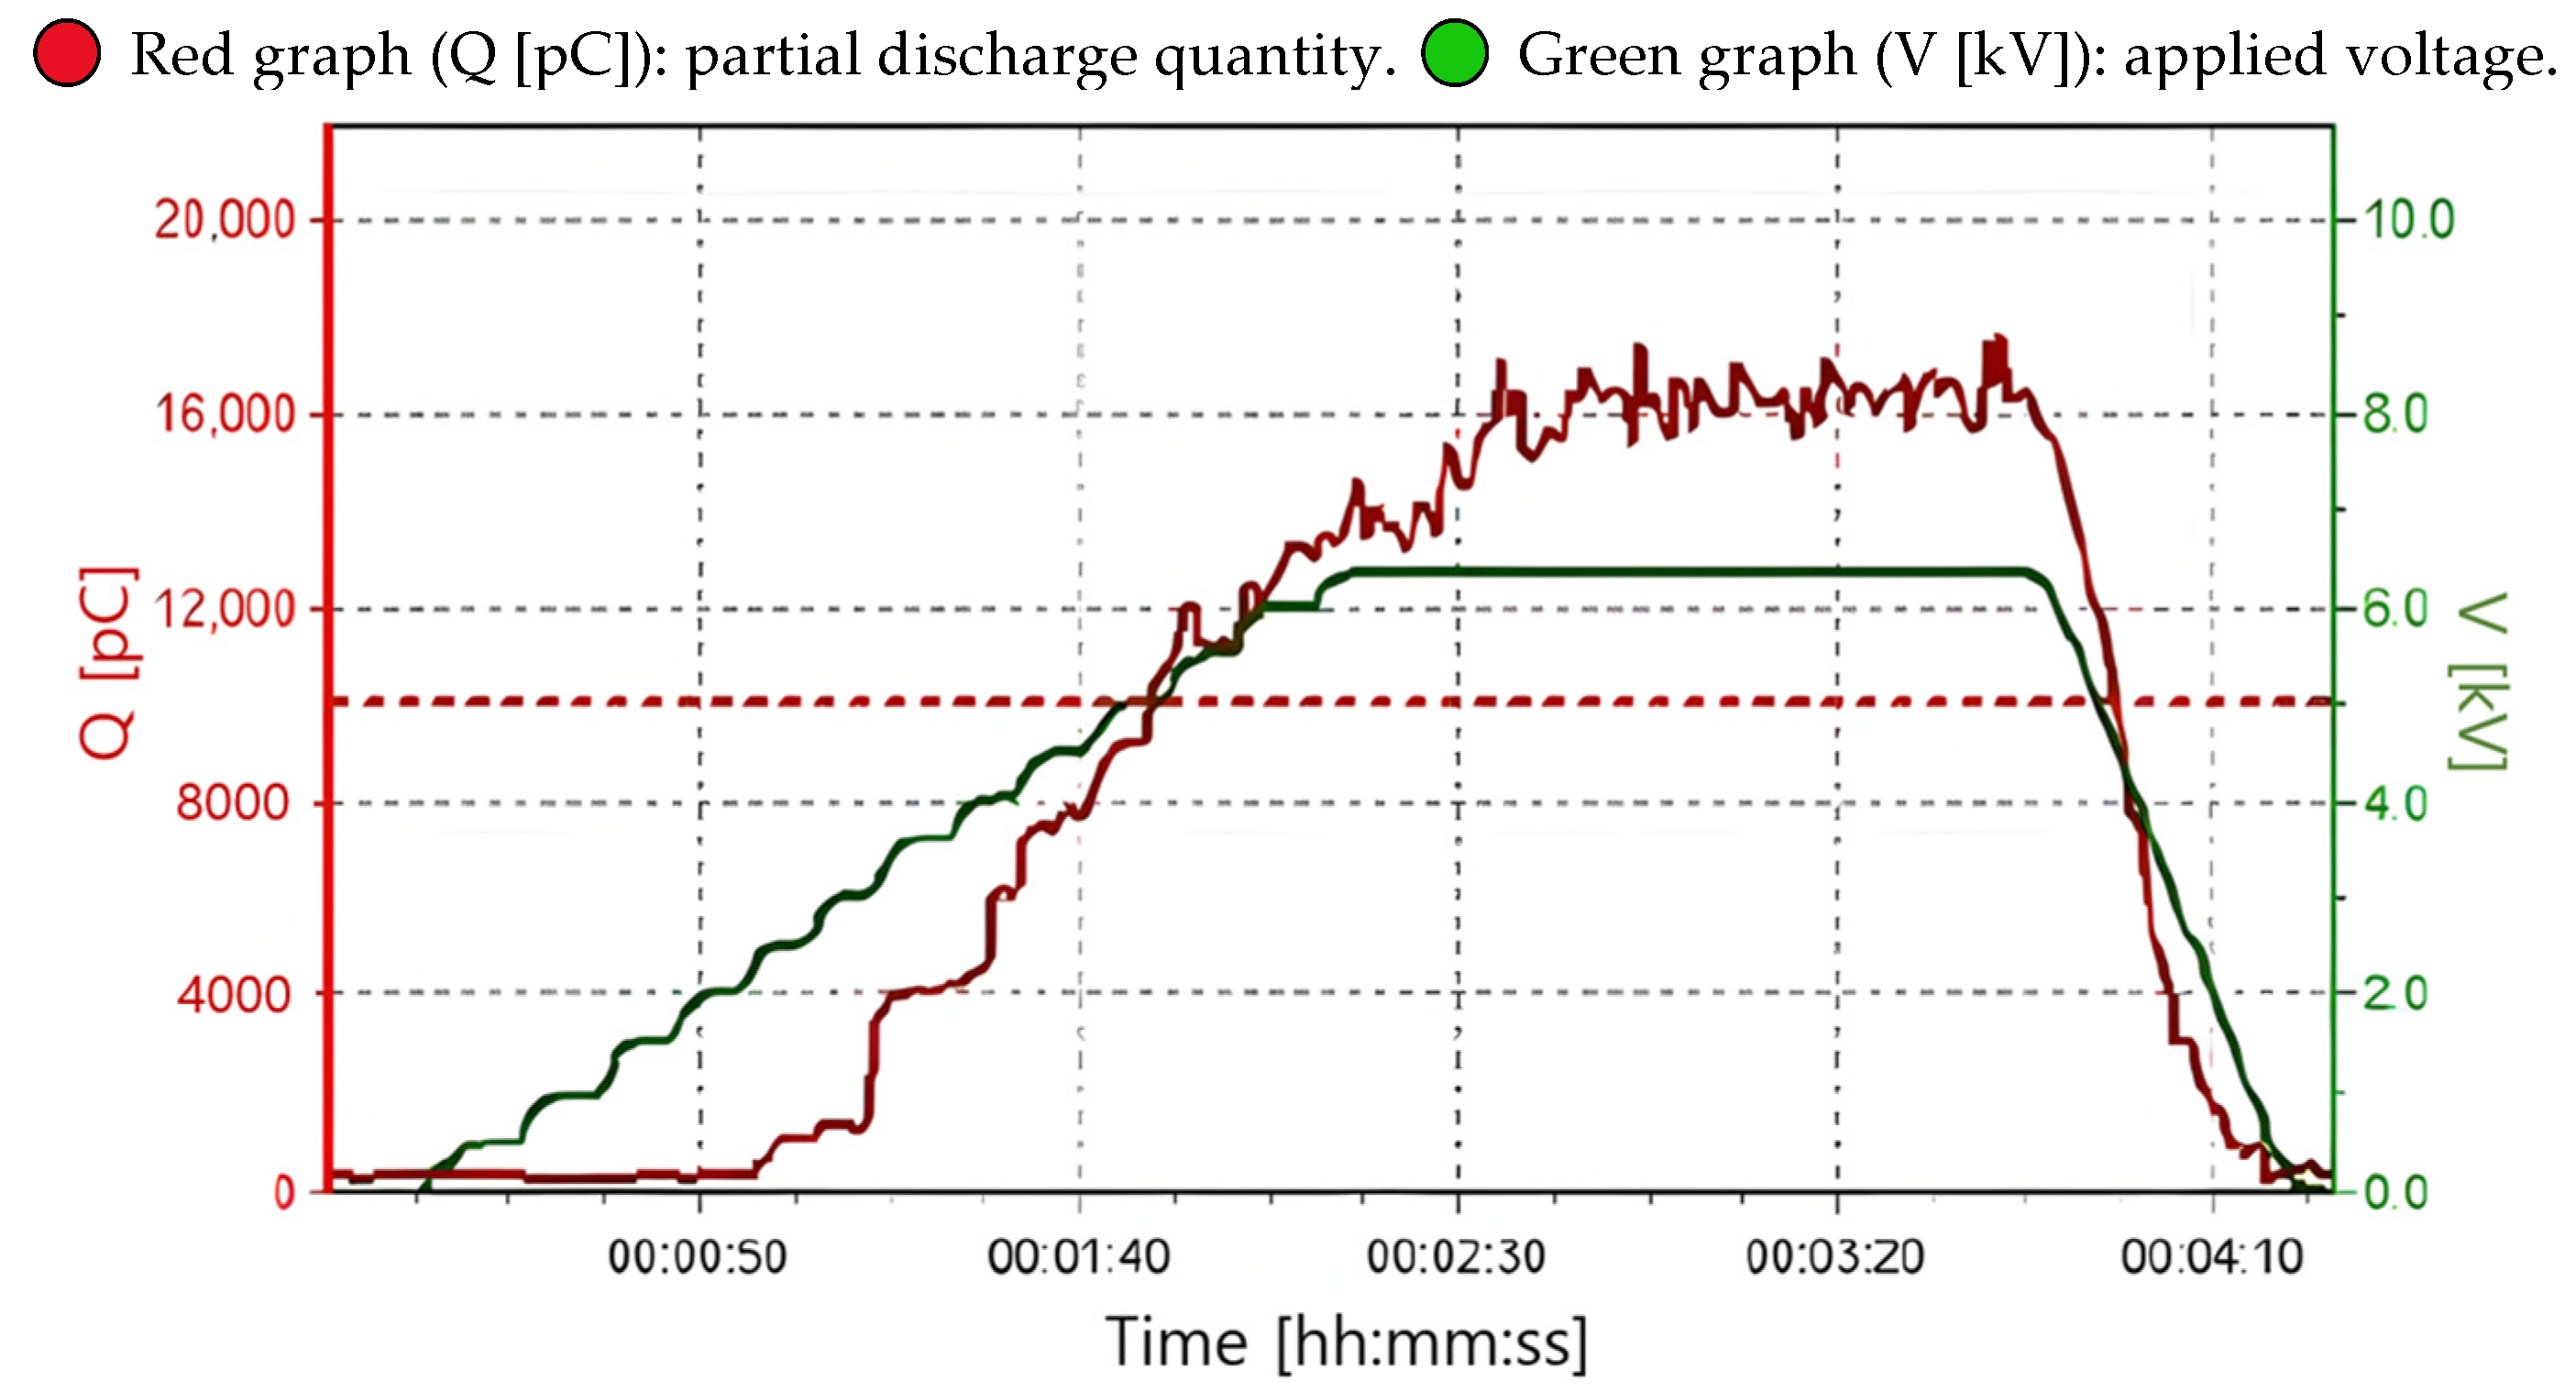
Figure 19a–d, a UV camera was used to accurately identify the partial discharge locations within the stator winding of a high-voltage motor by measuring the UV counts as the AC voltage gradually increased. At 1.25 times the phase-to-phase voltage (7.94 kV), as shown in
Figure 19a, an arc was visually observed between the end winding and the finger plate, with the corresponding discharge pattern illustrated in
Figure 19b. UV counts were measured at two test voltages, 7.10 kV and 7.94 kV, with recorded values of 32,760 and 101,600, respectively. These data show a significant rise in UV counts with the increasing voltage, indicating an almost threefold increase at 7.94 kV relative to 7.10 kV. The correlation between higher voltage levels and increased discharge activity provides insight into the insulation performance under elevated electrical stress, highlighting areas at greater risk of insulation degradation.
3.8. Maintenance Methods
As confirmed in the text, partial discharge values resulting from corona discharge at the stator winding end were identified as primary contributors to the observed partial discharge levels, with arc discharge occurring specifically between the edges of some press fingers and the adjacent insulation layers. The high partial discharge measurements recorded were largely attributed to the peak values generated by these arc discharges; hence, it was expected that removing the arc discharge source would lead to a noticeable reduction in partial discharge levels.
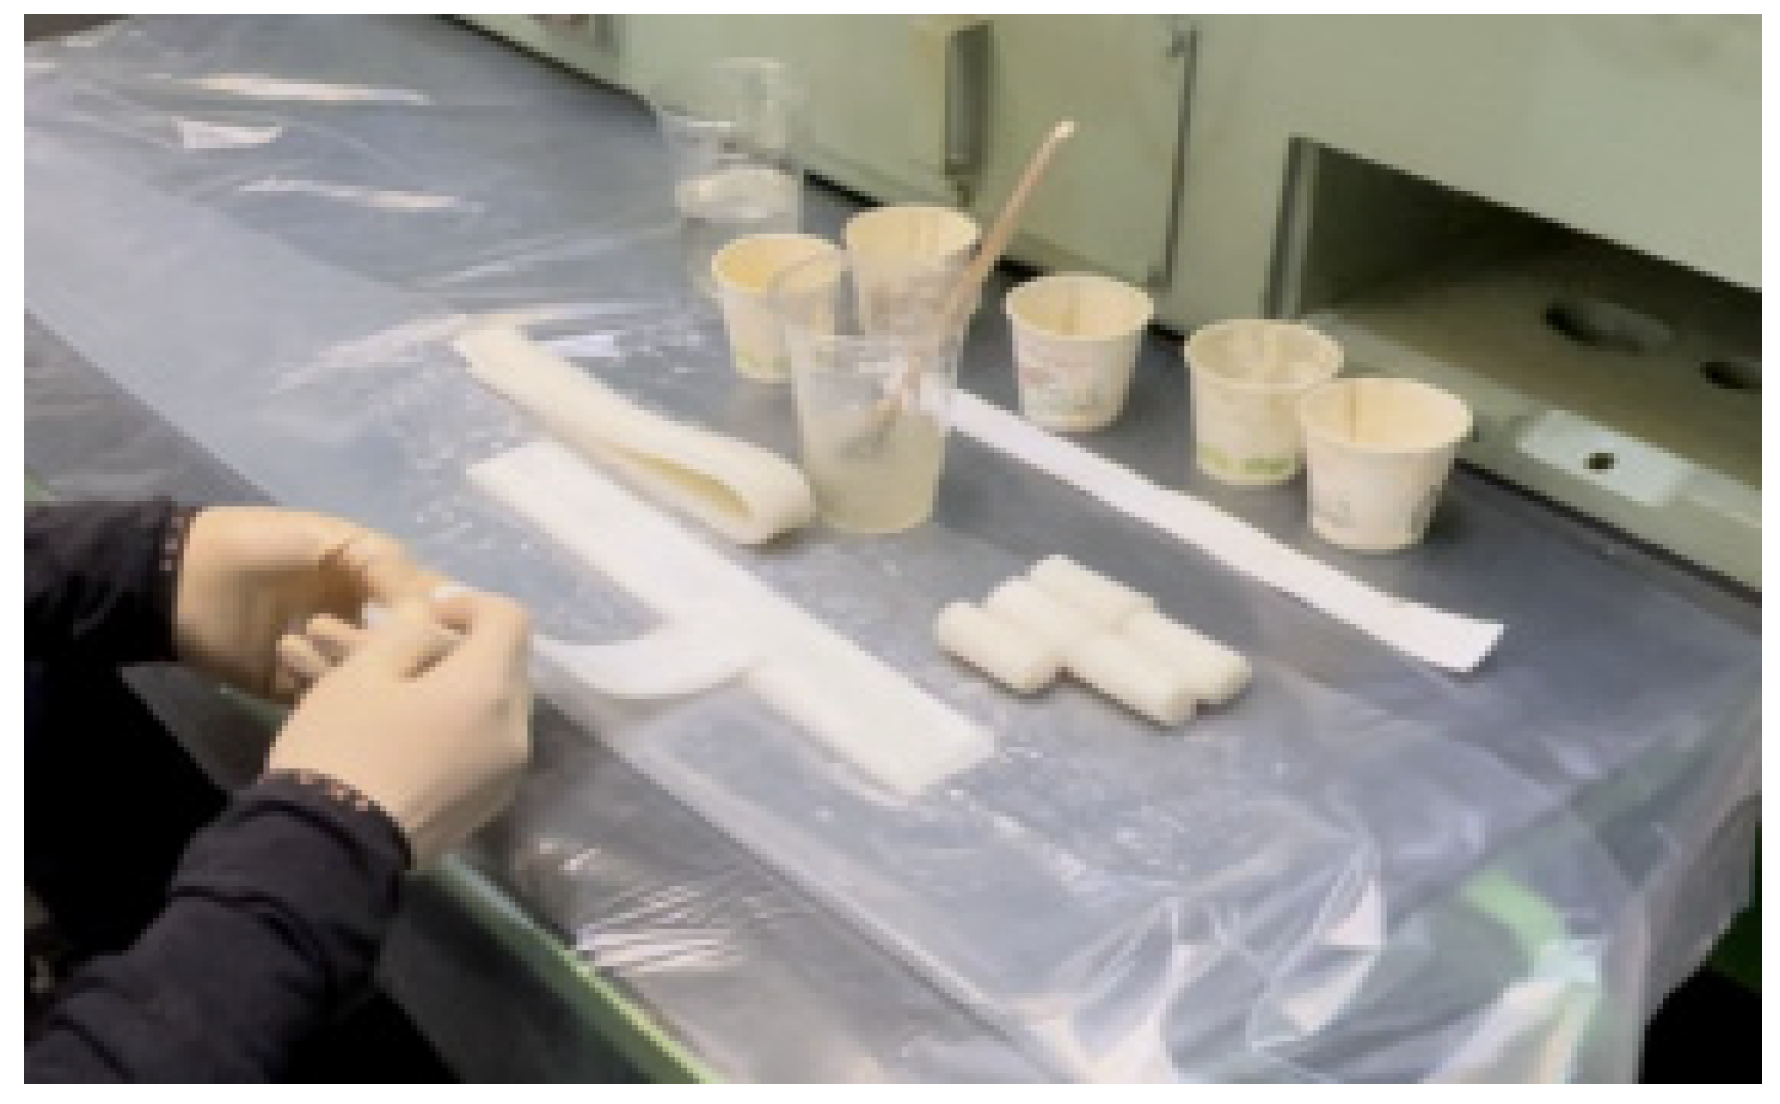
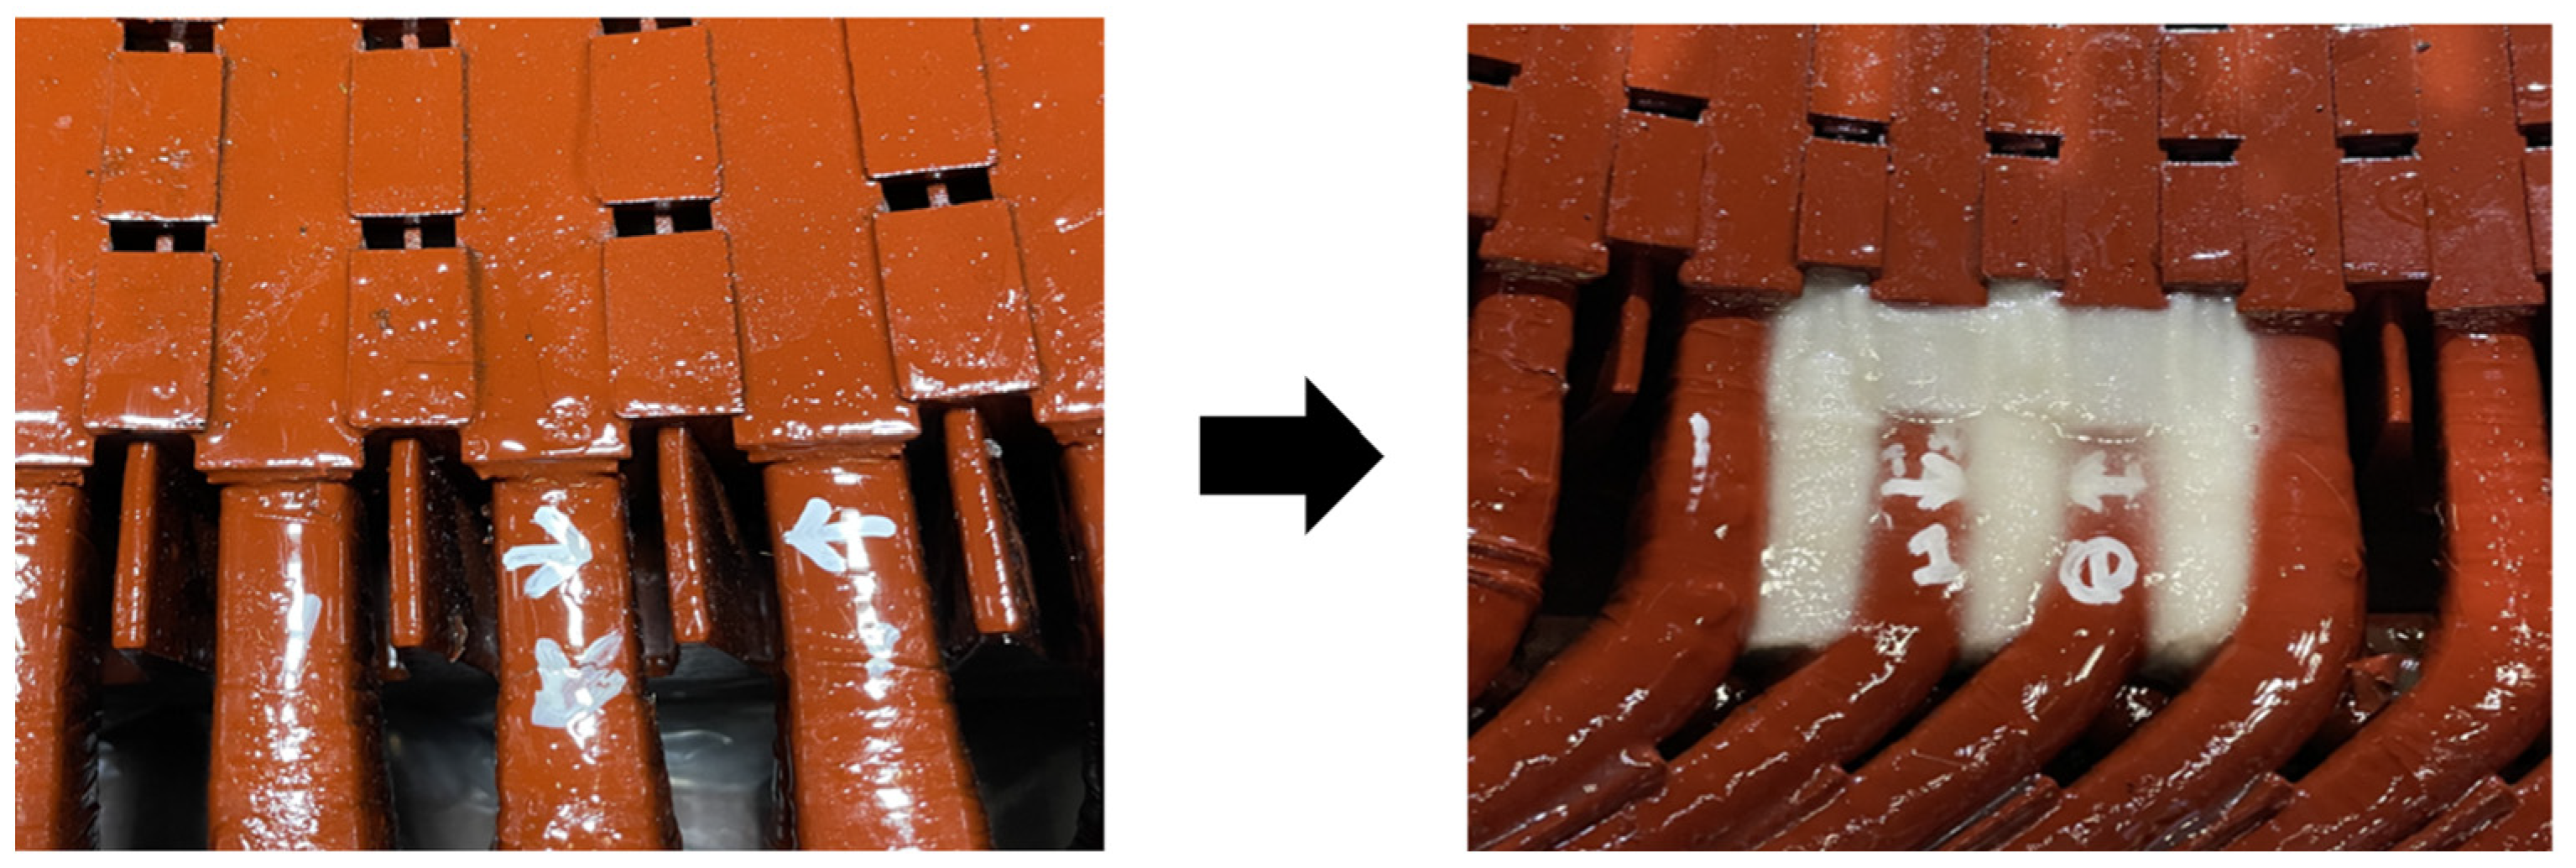
As a maintenance approach to prevent arc discharge, the insulation was reinforced at points between the finger plates and the insulation layer, and varnish was selectively applied and left to dry naturally to enhance insulation durability. The specific insulation reinforcement technique is illustrated in
Figure 20, where polyester (HP21, felt pad) material was precisely cut to fit between the press finger and insulation. This material was soaked in varnish, carefully inserted at the identified arc discharge points, and allowed to dry naturally, ensuring a robust and effective reinforcement layer.
As shown in
Figure 21, the comparison between the conditions before and after insulation reinforcement using the partial maintenance method with polyester can be observed.
Figure 22,
Figure 23,
Figure 24 and
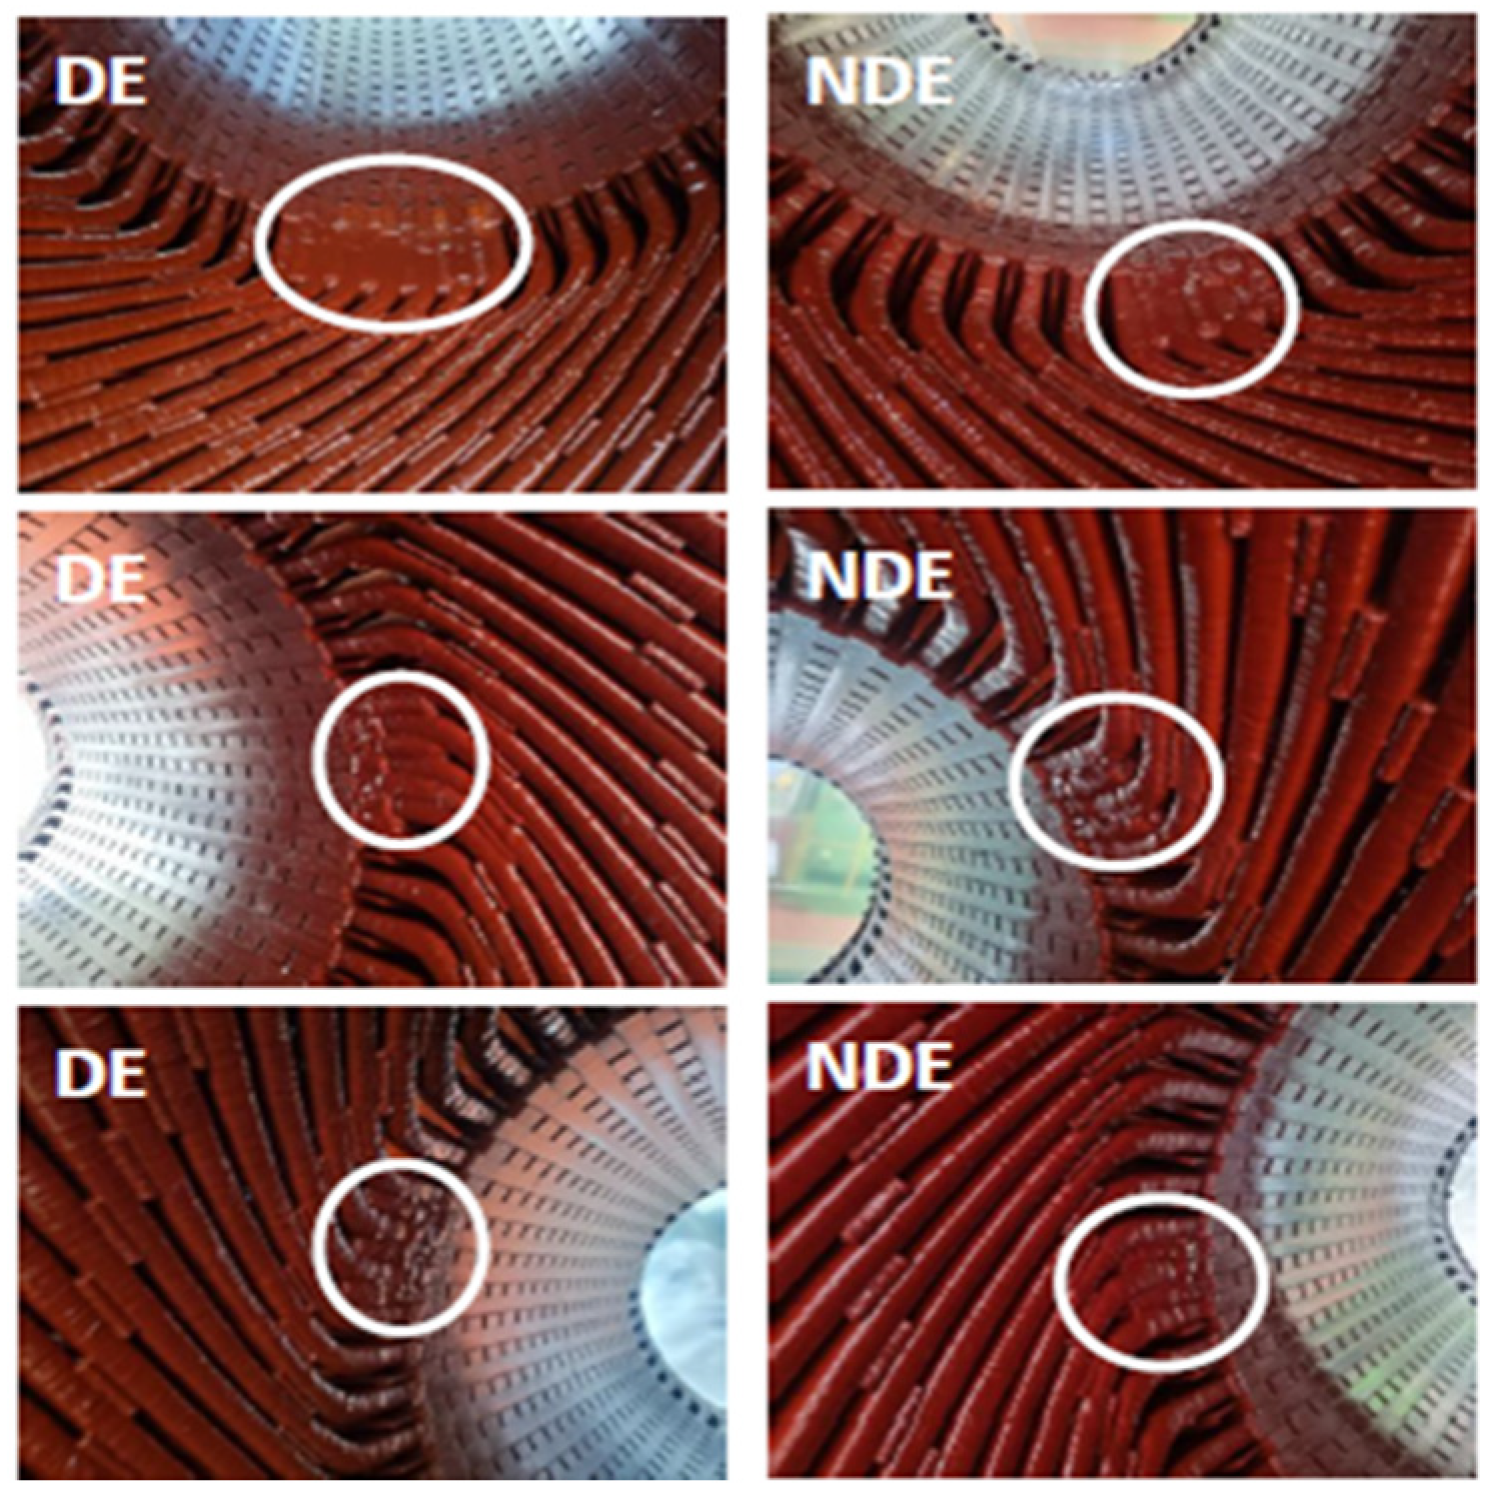
Figure 25 illustrate the maintenance locations for each high-voltage motor after partial insulation reinforcement was performed to address the arc-induced partial discharge issues. Although the motors differ, the same partial maintenance process was conducted for all units. The maintenance involved inserting varnish-soaked felt pads between the stator winding insulation and the finger plates at points identified by the UV camera diagnostics as arc discharge sources. This blocking technique was intended to prevent arc-induced partial discharge without requiring complete rewinding of the stator windings.
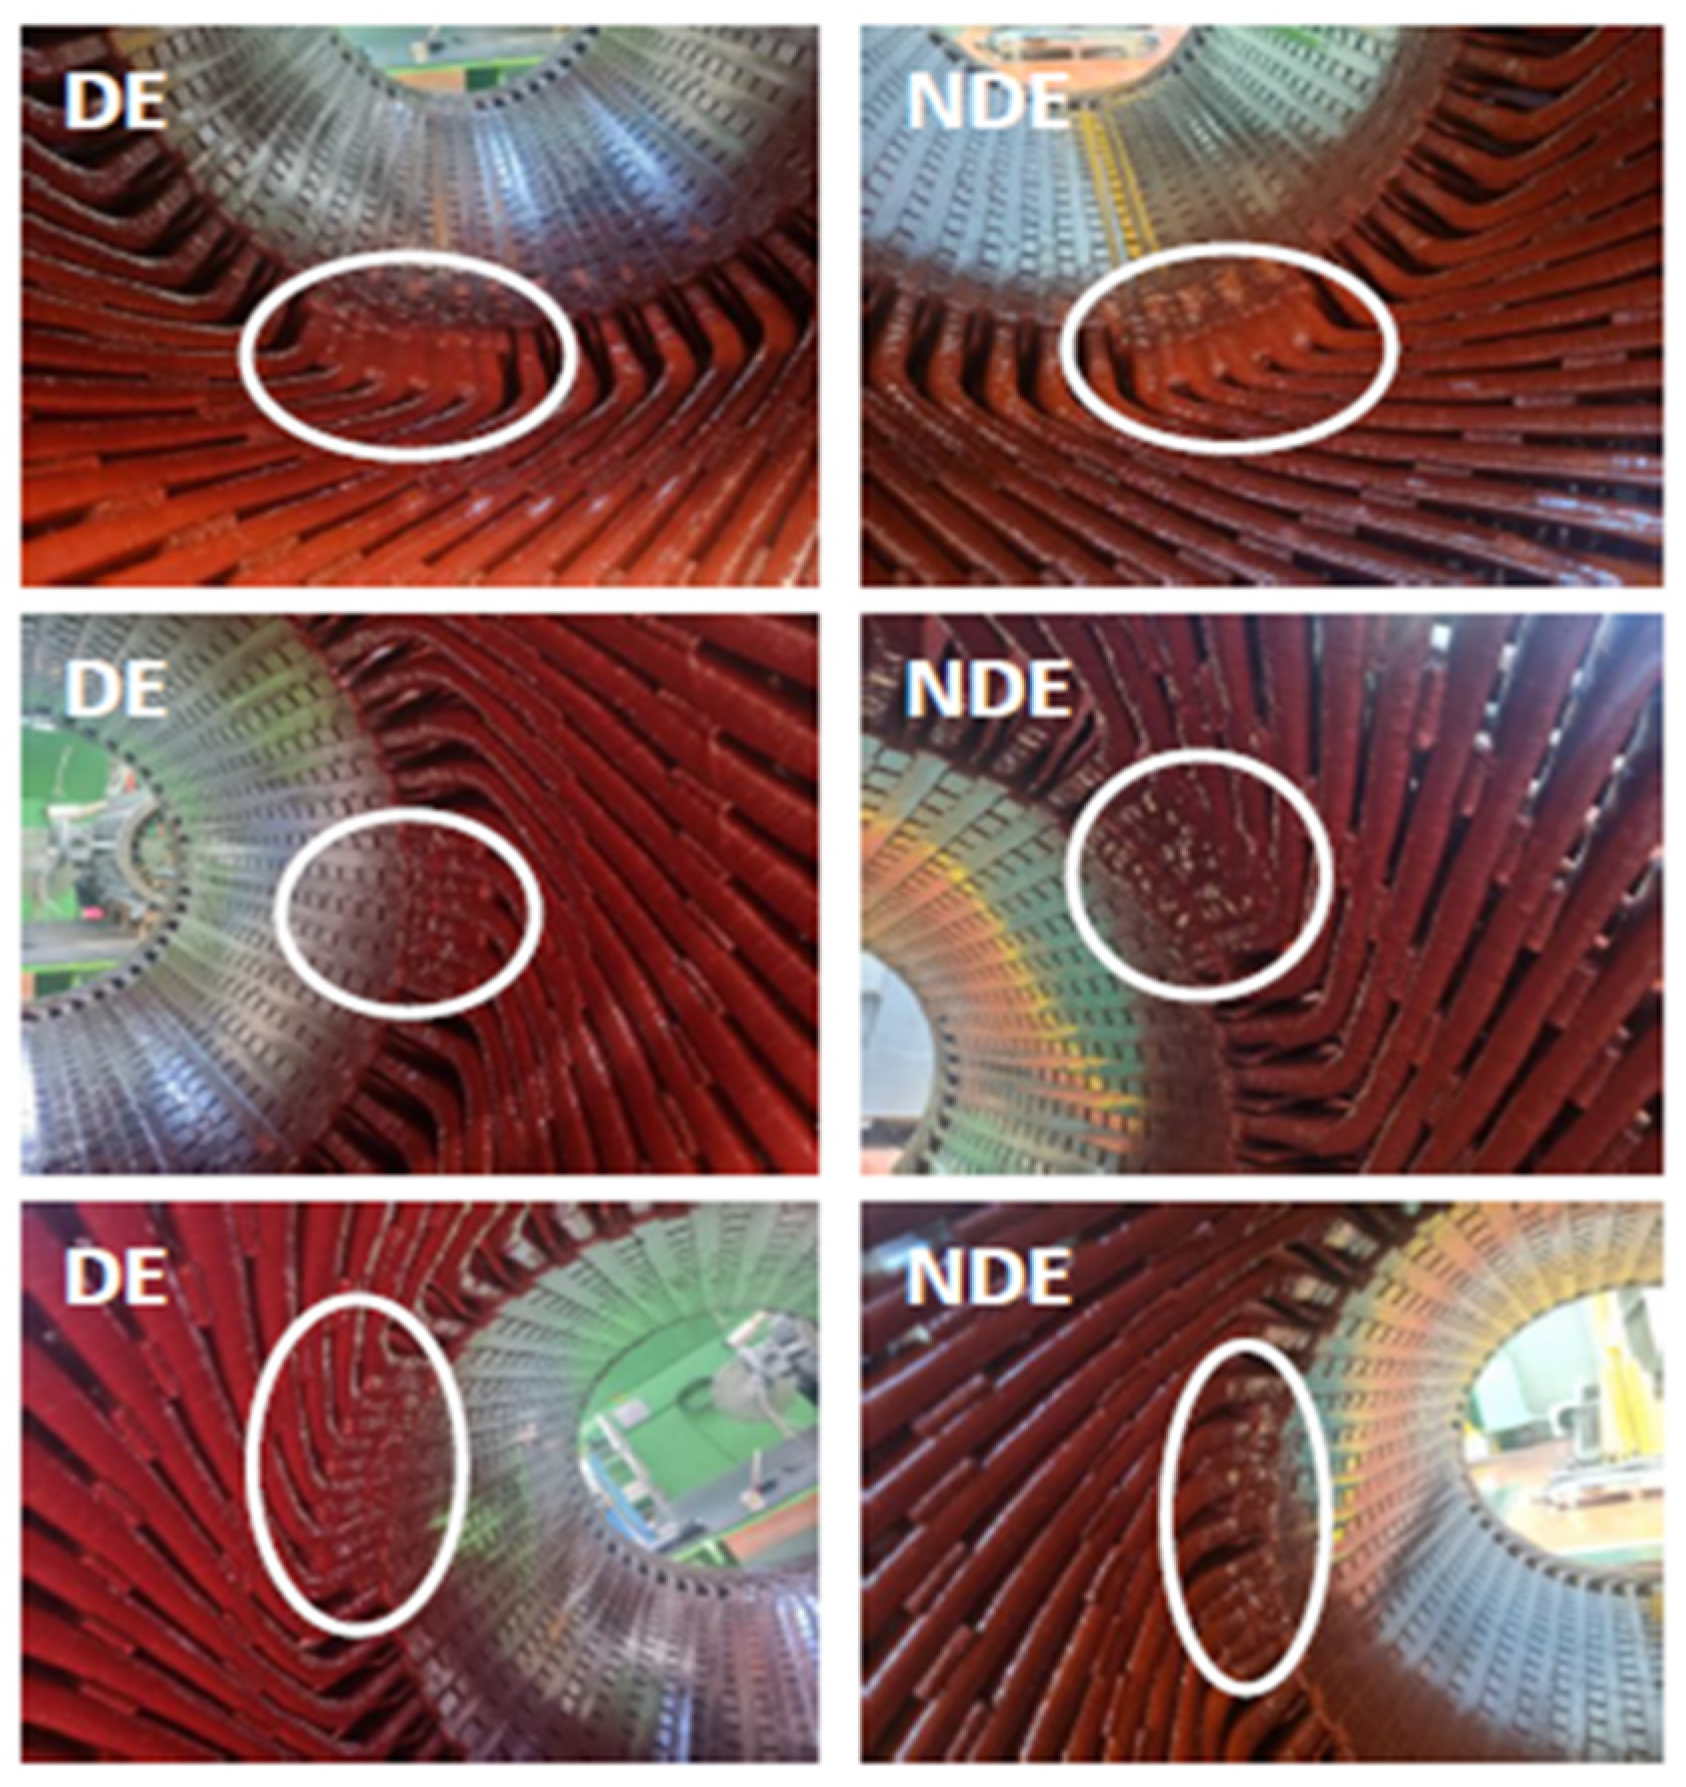
Specifically,
Figure 22 shows motor No. 1, where partial maintenance was conducted at a total of 20 locations, including 13 locations on the drive end (DE) side and 7 locations on the non-drive end (NDE) side. Post-maintenance partial discharge measurements at 6.35 kV showed a substantial reduction from 77,000 pC to 9500 pC, representing an 87.7% decrease, as detailed in
Table 8. The circles in the figure indicate the specific locations where insulation reinforcement was applied.
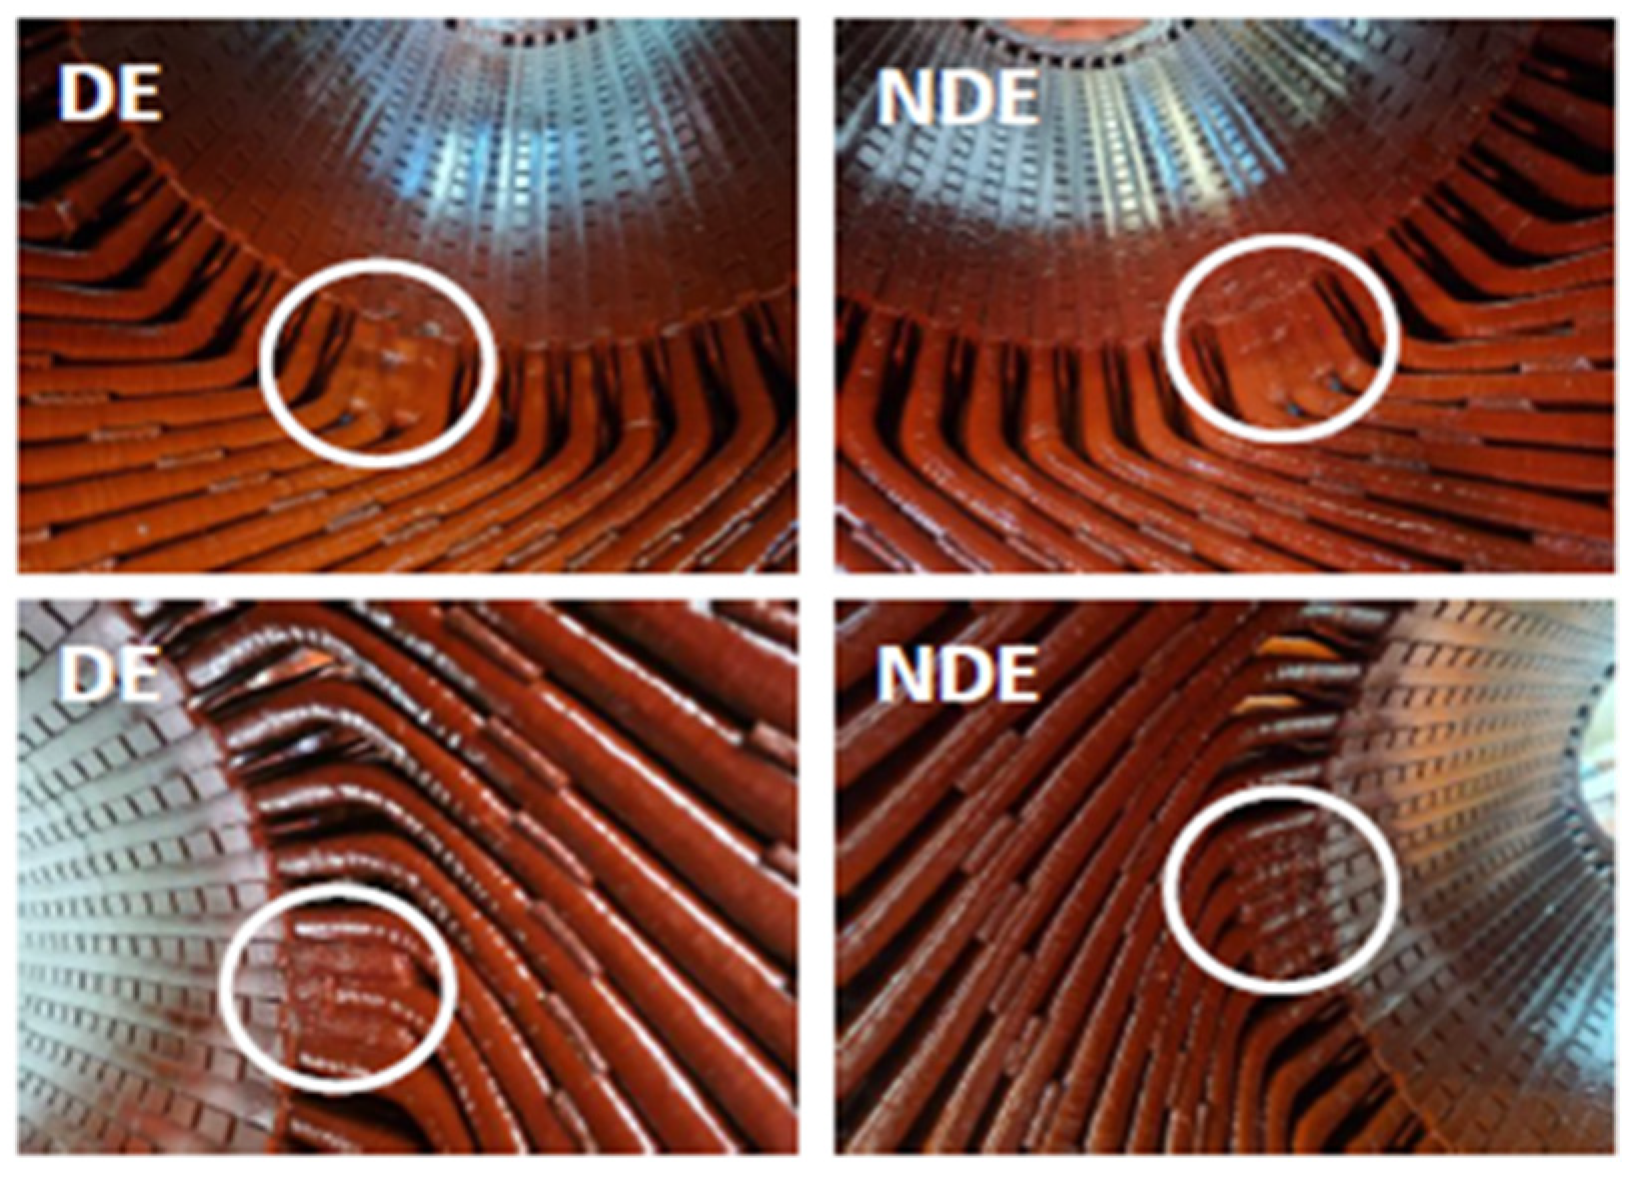
Figure 23 presents motor No. 2, which underwent partial maintenance at 11 locations (six on the DE side and five on the NDE side). After the maintenance, the partial discharge level at 6.35 kV decreased from 49,900 pC to 17,000 pC, demonstrating a 65.9% reduction.
Figure 24 depicts motor No. 3, where 10 locations were maintained (four on the DE side and six on the NDE side). The partial discharge magnitude reduced from 33,000 pC to 11,500 pC at 6.35 kV, marking a 65.2% decrease.
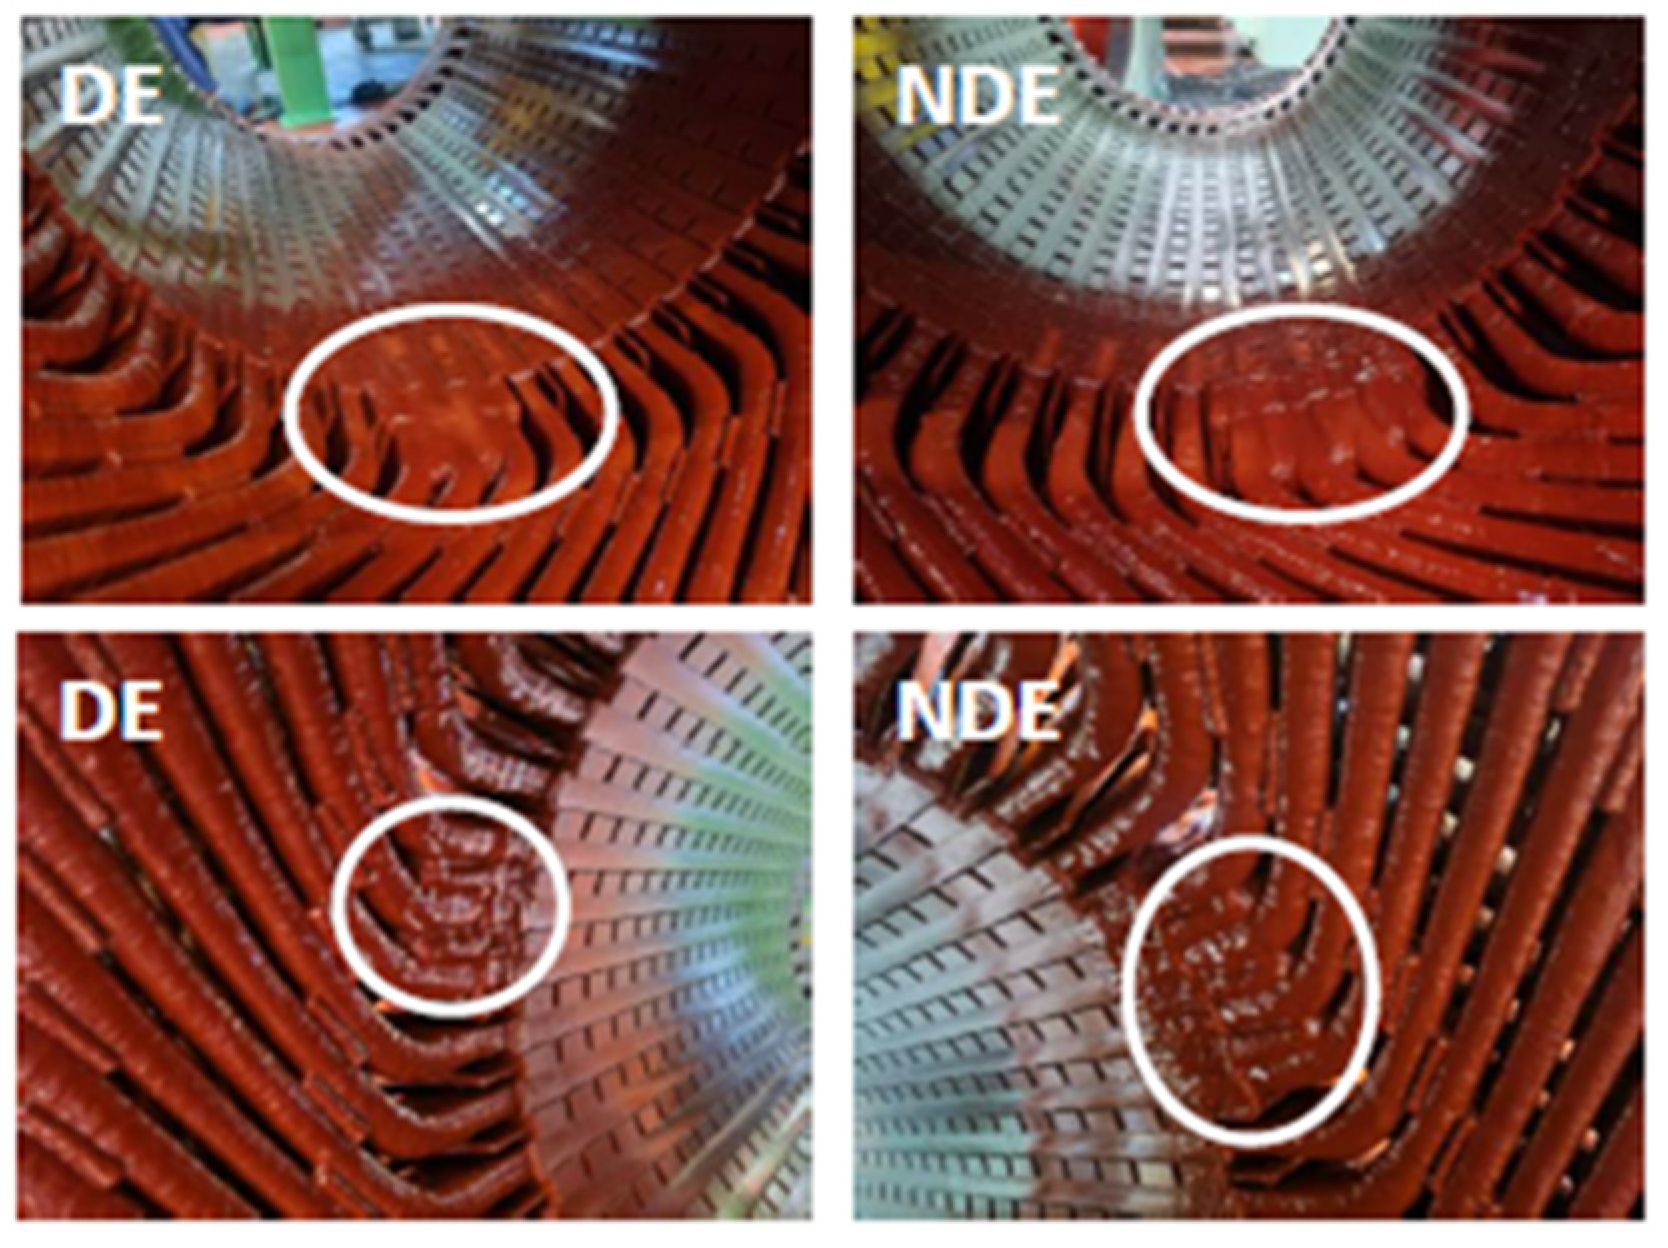
Figure 25 shows motor No. 4, which had the most extensive maintenance, covering 24 locations (13 on the DE side and 11 on the NDE side). Although the partial discharge level at 6.35 kV remained at 17,000 pC before and after maintenance, further analysis revealed that arc discharge at the winding terminals observed at higher voltages was effectively eliminated.
The maintenance process applied in all four motors represents the first attempt to normalize stator windings through partial maintenance rather than complete rewinding. This approach provides significant cost and time savings, requiring only 1–10% of the time and cost compared to conventional rewinding methods. Additionally, the process demanded extreme precision due to the narrow gap between the finger plates and the winding insulation, which necessitated careful insertion of the felt pads to ensure complete arc-blocking without introducing new defects.
Overall, the results confirm that UV camera-guided partial maintenance is a highly effective and practical method for mitigating arc-induced partial discharges.
Table 8 provides detailed data supporting these findings, highlighting substantial reductions in the partial discharge levels and enhanced insulation performance. The success of this partial maintenance strategy offers a novel approach to improving the operational stability and reliability of high-voltage motors without resorting to complete rewinding.
Properties of Felt-Pad Insulation Reinforcement
The felt-pad insulation reinforcement used in this study was selected based on its high-voltage insulation performance and suitability for suppressing partial discharge (PD) in high-voltage motor stator windings. The polyester-based felt pad (HP21, felt pad) possesses key material properties that ensure its effectiveness as an insulating material in high-voltage applications.
The dielectric strength of the polyester felt pad used in this study is approximately 10–15 kV/mm, which meets the insulation requirements of high-voltage motor stator windings. To further enhance its insulation performance, the felt pad was impregnated with varnish, improving its surface insulation characteristics and maximizing its effectiveness in suppressing partial discharges.
- 2.
Thermal Stability
The felt pad exhibits excellent thermal stability, complying with the Class F (155 °C) and Class H (180 °C) insulation standards. Given that the operating temperature of high-voltage motor windings typically ranges between 100–130 °C, the selected material ensures long-term reliability in high-temperature environments.
- 3.
Aging Resistance
Polyester-based insulation materials are known for their high resistance to moisture and chemical contamination, reducing the likelihood of insulation degradation over time. Additionally, varnish impregnation enhances the mechanical strength of the felt pad, preventing surface discharges at insulation interfaces and minimizing insulation aging effects.
3.9. Insulation Diagnostic Analysis After Maintenance
After completing the maintenance work, insulation diagnostic tests were conducted on the stator windings of the high-voltage motors No. 1 through No. 4, and the results before and after the maintenance were compared and analyzed. The test results were utilized to evaluate the insulation condition of each motor and to assess the effectiveness of the maintenance work, providing insights into its impact on insulation performance.
Table 8 summarizes the data before and after the maintenance work, including the comparative figures for key diagnostic items. This allows for an objective assessment of the improvement in insulation performance following the maintenance and serves as an important criterion for evaluating the effectiveness of the maintenance work.
The analysis of the results presented in
Table 8 clearly demonstrates the effectiveness of the partial maintenance procedure in improving the insulation performance of high-voltage induction motors. The insulation resistance values measured after maintenance were found to be slightly lower than those measured before maintenance. This decrease can be attributed to environmental factors such as ambient temperature and moisture absorption in the stator windings at the time of measurement. However, the improvement in the polarization index (PI) results indicates a reduction in the amount of leakage current induced on the surface of the windings, suggesting that the maintenance process effectively restored the insulation performance.
The results of the AC current and dielectric dissipation factor (tan δ) tests also showed slight decreases after maintenance. Although the reductions were not substantial, these changes reflect improvements in the insulation strength and reliability. The restoration of the insulation layer and the elimination of internal degradation factors contributed to enhanced dielectric properties, which are critical for ensuring long-term operational stability and reducing electrical losses.
The most notable result is the significant reduction in the partial discharge levels, with decreases exceeding 80%. Under the phase voltage condition (6.35 kV), the partial discharge magnitudes were measured as follows: 9500 pC for motor No. 1, 17,000 pC for motor No. 2, 11,500 pC for motor No. 3, and 17,000 pC for motor No. 4. Based on these measurements, motor No. 1 was classified as being in a satisfactory condition at 6.35 kV, while motors No. 2, No. 3, and No. 4 were categorized as cautionary. These results indicate that localized defects were successfully eliminated and that arc discharge activity was effectively suppressed.
Overall, the substantial reduction in partial discharge levels and the improvements in key diagnostic parameters confirm that the proposed maintenance strategy significantly enhances the reliability and operational stability of high-voltage induction motors. Furthermore, this maintenance procedure offers a practical and efficient alternative to conventional rewinding methods by providing considerable cost savings and time reductions, thereby demonstrating its value in terms of both industrial applicability and maintenance efficiency.
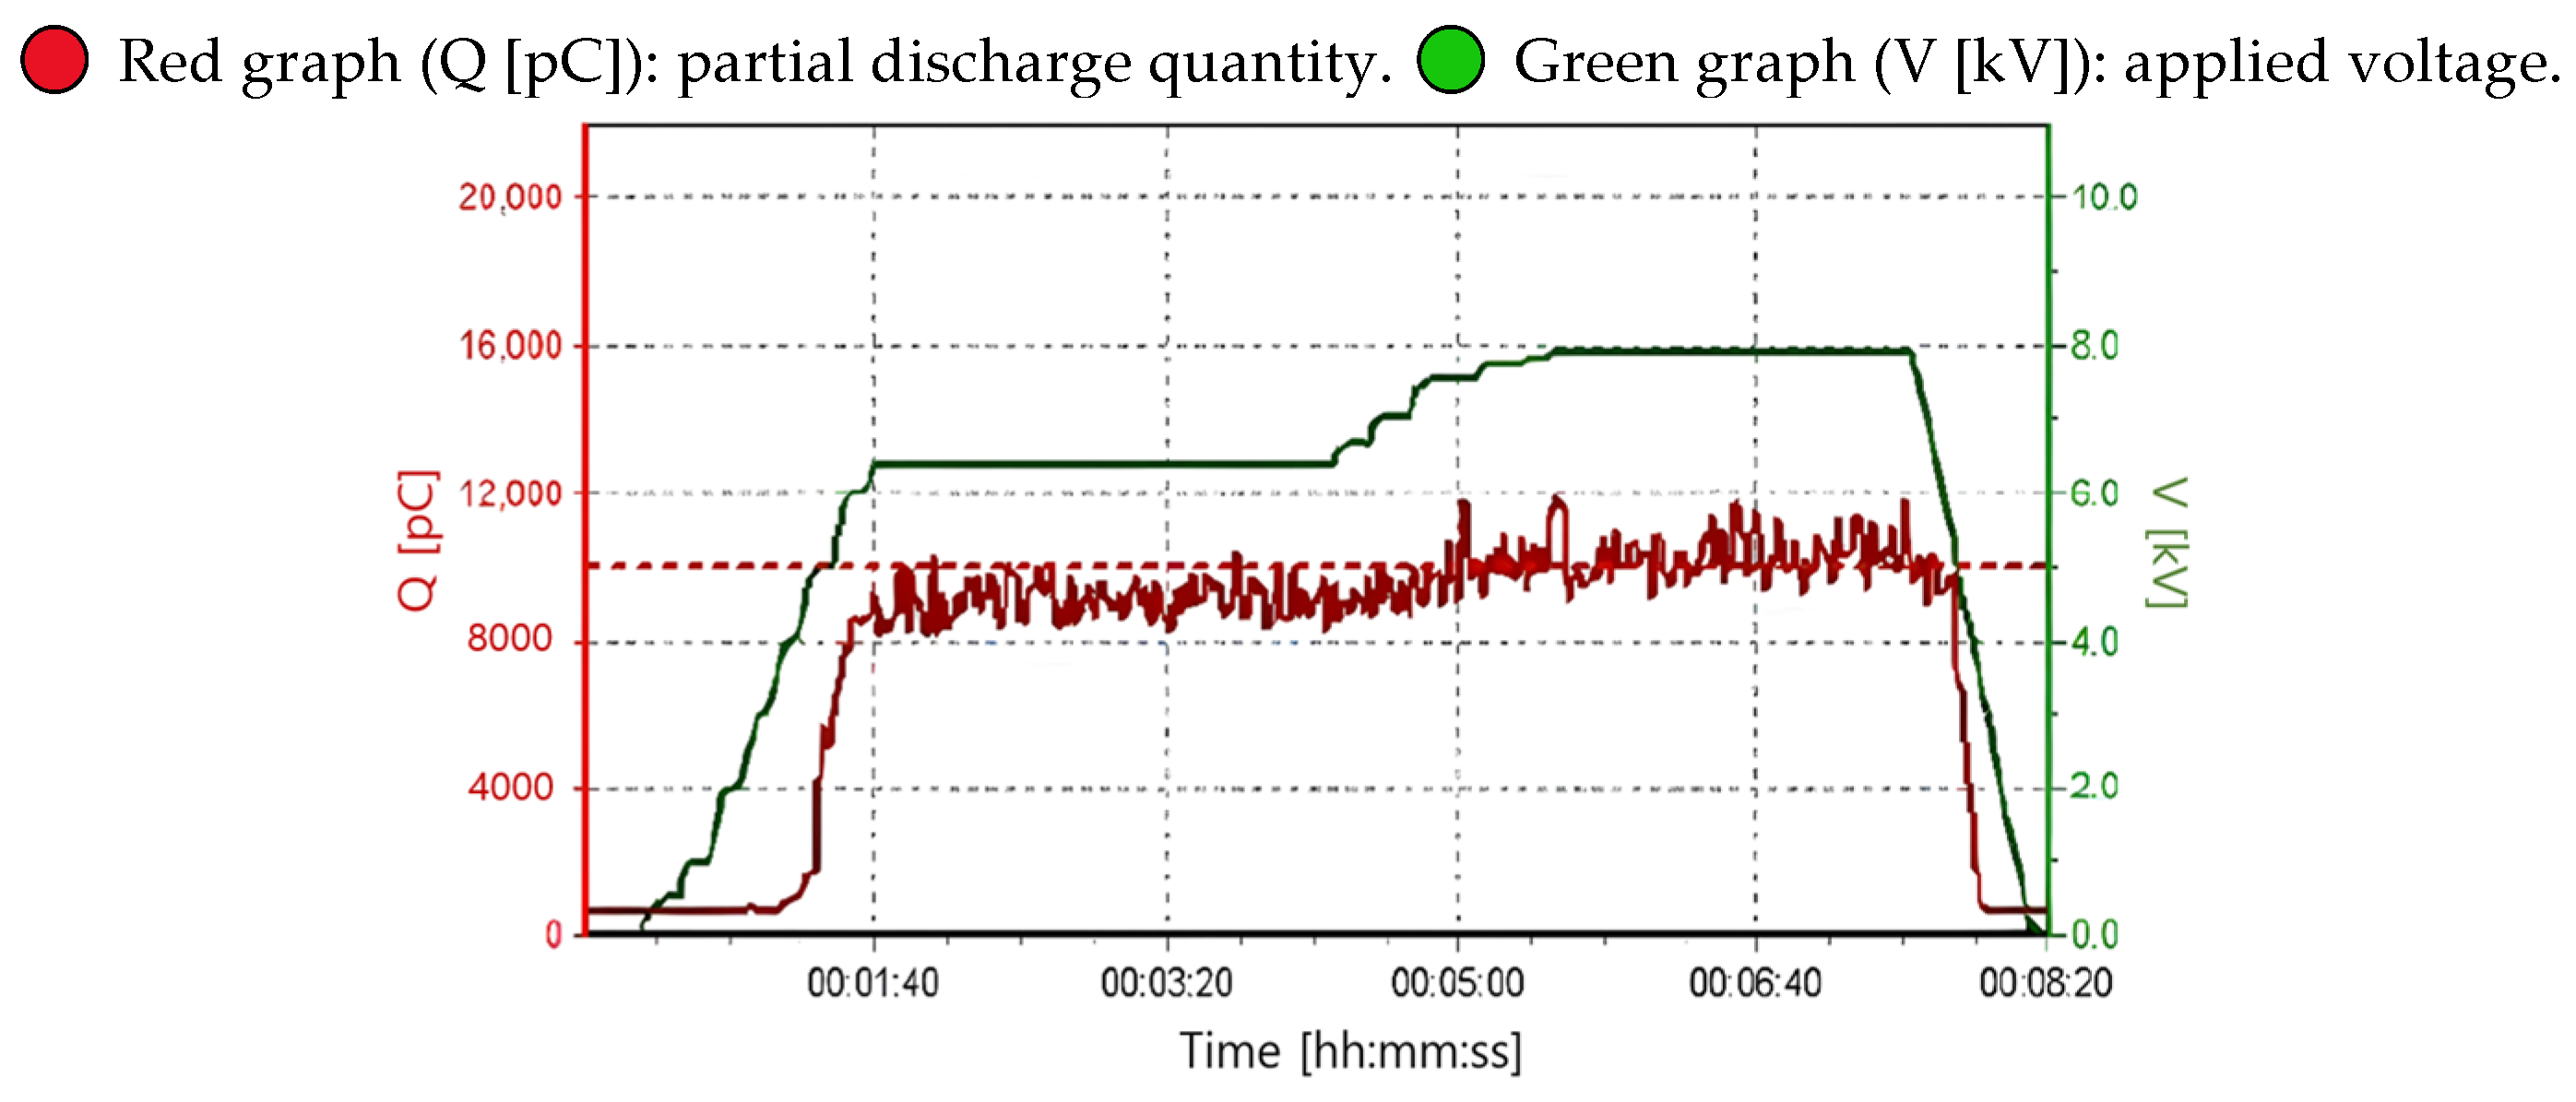
3.9.1. Partial Discharge Level of High-Voltage Motor No. 1
The partial discharge magnitude of high-voltage motor No. 1 was analyzed using a level graph, and the results showed that at the phase voltage of 6.35 kV, the partial discharge magnitude was approximately 9500 pC, indicating a stable and significantly reduced level. This serves as an important indicator of the improved insulation performance following the maintenance work.
Meanwhile, at 7.94 kV, which is 1.25 times the phase voltage, the partial discharge magnitude was measured at approximately 12,000 pC. Although this value was slightly higher than that at the phase voltage, it was still within the acceptable range. These results provide valuable quantitative insights into the partial discharge trend and are useful for evaluating the overall insulation condition of high-voltage motors.
The analysis results are visually presented in
Figure 26, clearly illustrating the degree of improvement before and after maintenance work. This allows for a detailed evaluation of the effectiveness of the maintenance in enhancing insulation performance and offers valuable reference data for future maintenance strategy development. The red dashed line in the figure represents the precautionary threshold (10,000 pC), above which the partial discharge level requires attention.
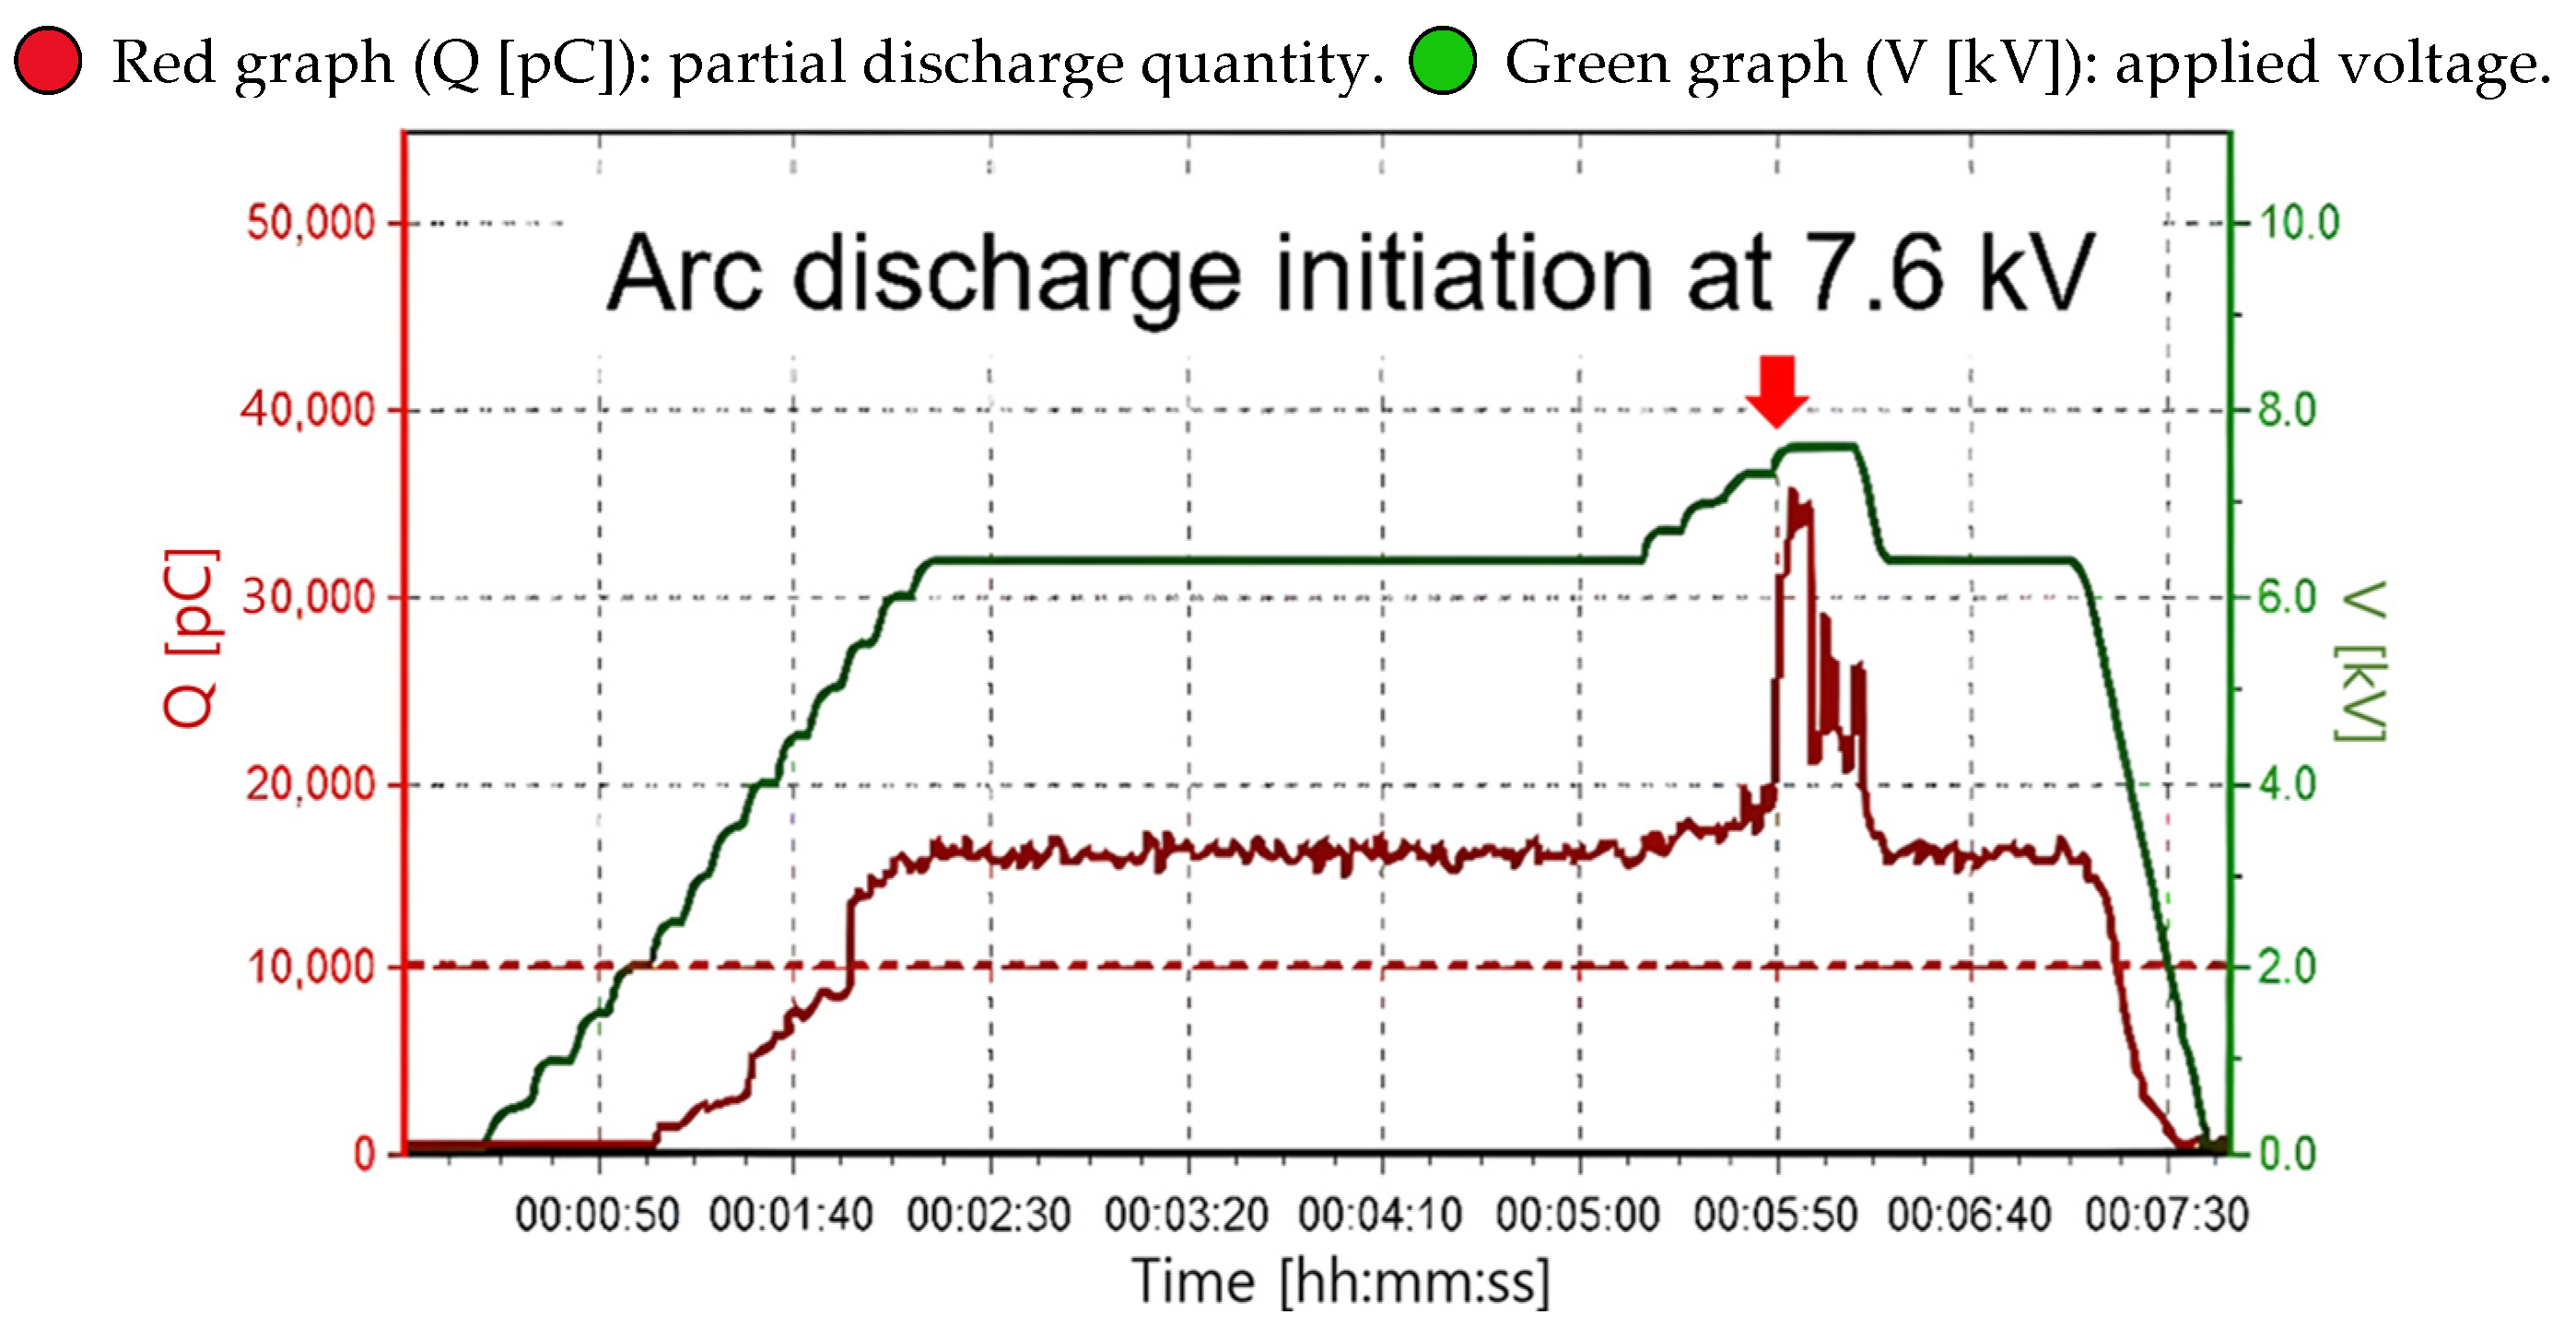
3.9.2. Partial Discharge Level of High-Voltage Motor No. 2
The partial discharge magnitude of high-voltage motor No. 2 was analyzed using a level graph, and the results showed that at the phase voltage of 6.35 kV, the partial discharge magnitude was approximately 17,000 pC, which was evaluated as a cautionary level. However, this value represents a significant decrease compared to the pre-maintenance level of 49,900 pC, confirming that the maintenance work had a partial effect in mitigating the issue.
Meanwhile, during the gradual increase in voltage to measure 1.25 times the phase voltage, a sharp rise in the partial discharge magnitude was observed at 7.6 kV. This suggests that the arc discharge pathways remaining at the winding terminal were not completely eliminated, indicating the need for additional precise inspections and supplementary maintenance work.
These measurement results are visually presented in
Figure 27, providing a clear illustration of the potential issues that remain even after the maintenance work and highlighting areas for further improvement.
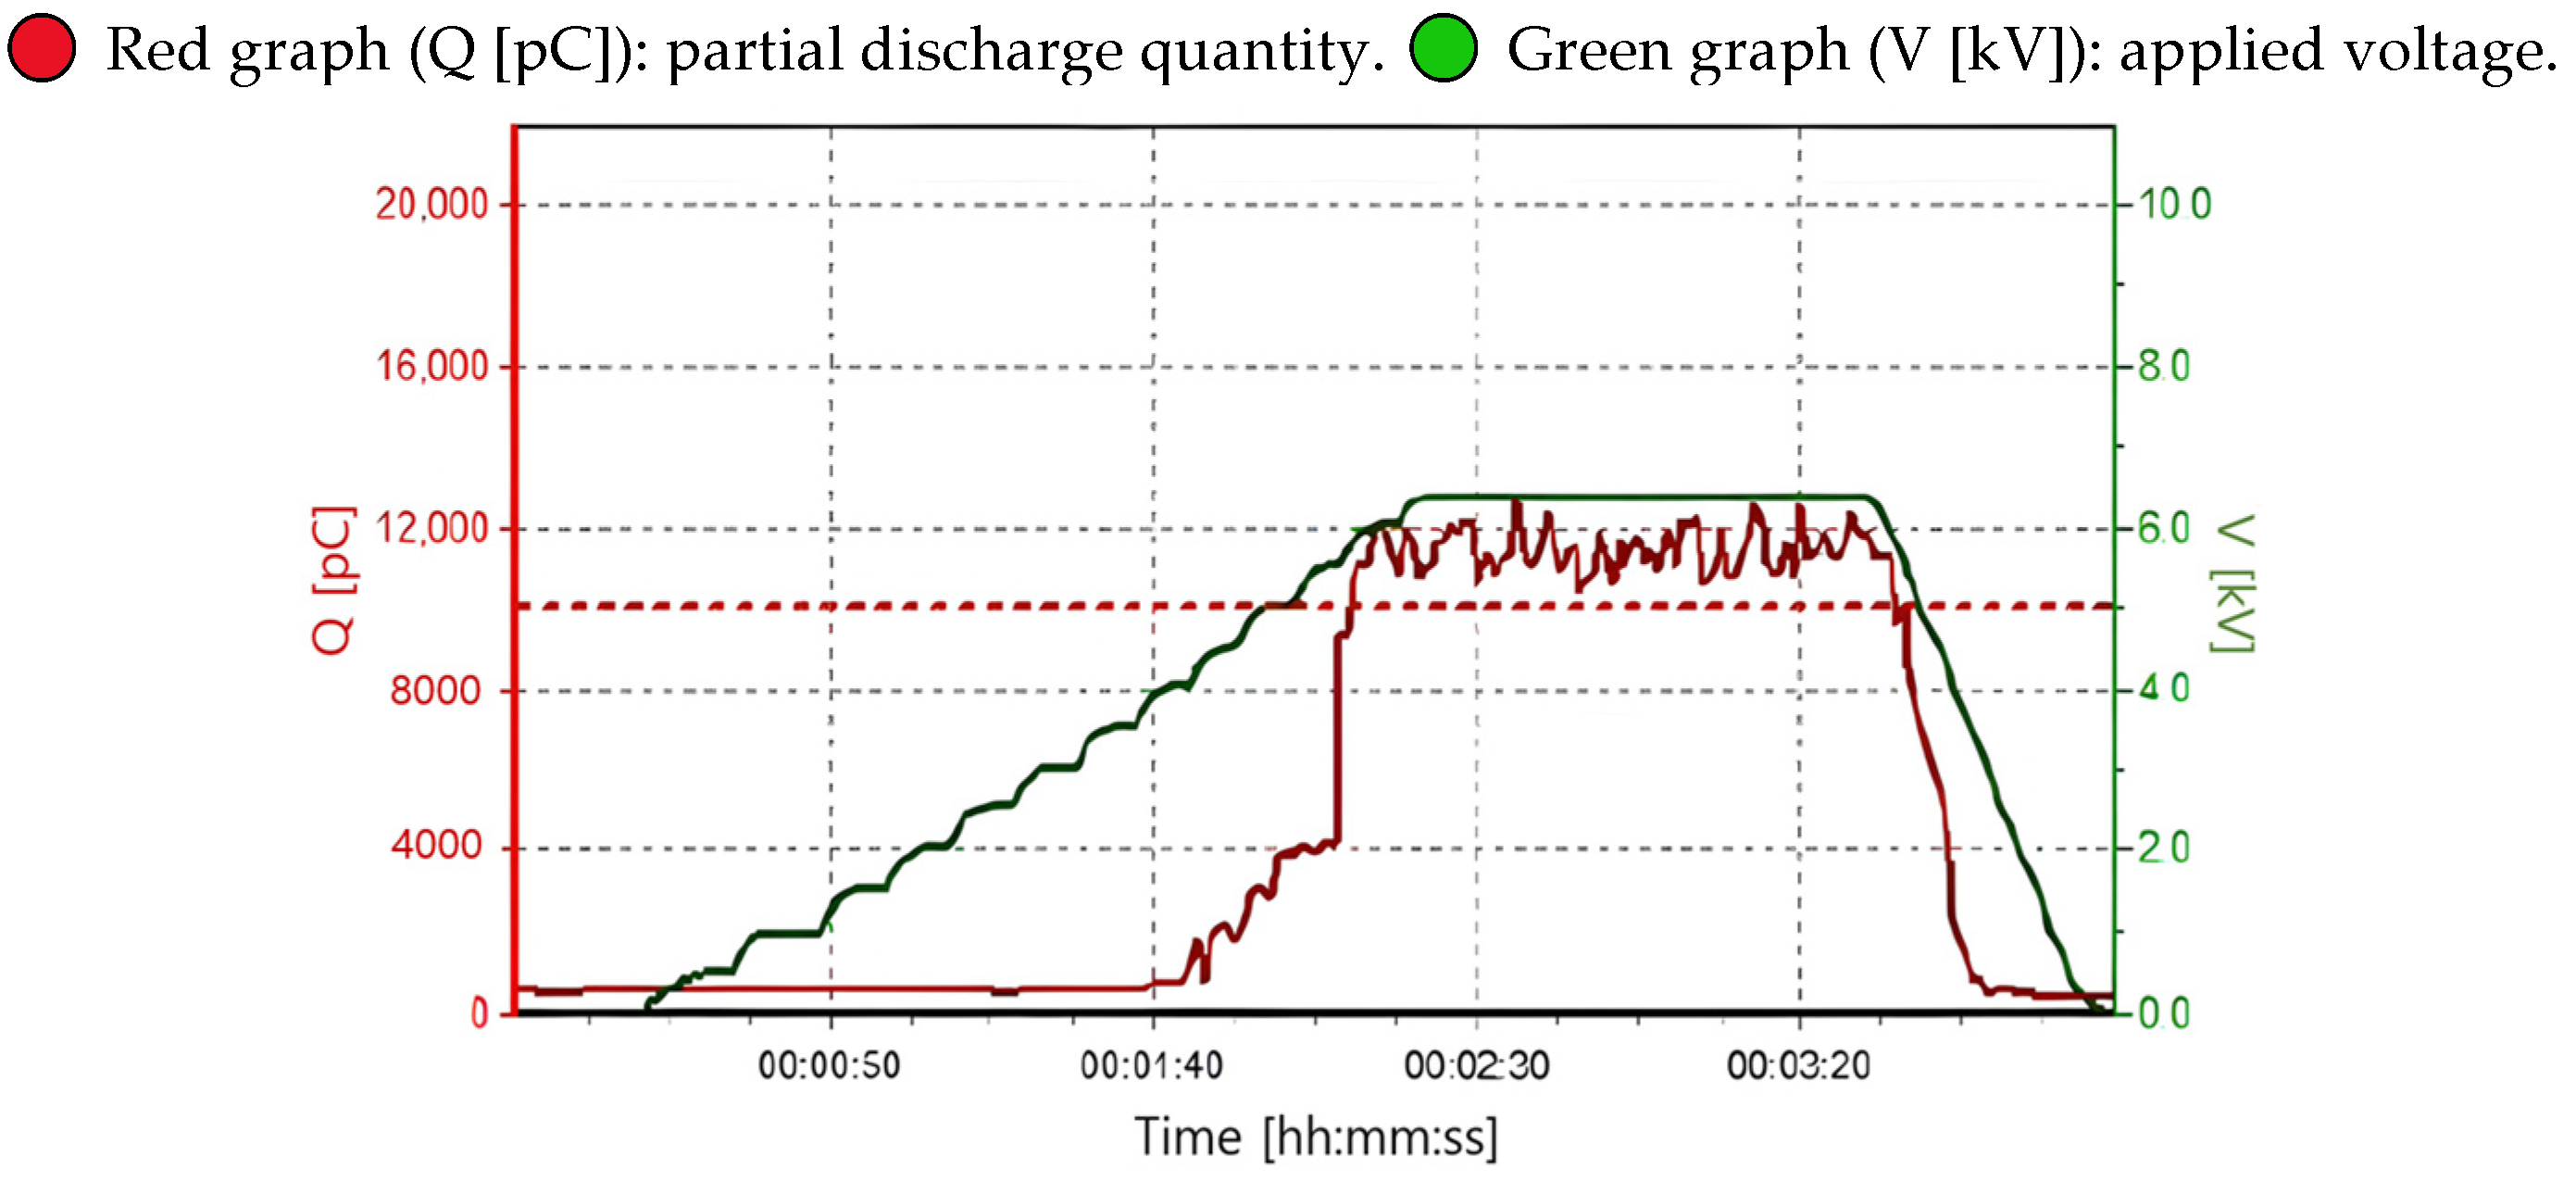
3.9.3. Partial Discharge Level of High-Voltage Motor No. 3
The partial discharge magnitude of high-voltage motor No. 3 was analyzed using a level graph, and the results showed that at the phase voltage of 6.35 kV, the partial discharge magnitude was approximately 11,500 pC, slightly exceeding the cautionary threshold of 10,000 pC. However, considering that the pre-maintenance partial discharge magnitude was 33,000 pC, it was confirmed that the partial discharge magnitude significantly decreased after the maintenance work.
These results indicate that the maintenance work had a meaningful impact on reducing partial discharge, demonstrating a partial improvement in the motor’s insulation performance. Nevertheless, as the value still exceeds the cautionary threshold, further maintenance and additional insulation reinforcement measures may be necessary.
The analysis results are presented in
Figure 28, providing a clear illustration of the changes before and after the maintenance work. This highlights the improvement achieved and emphasizes the areas that require additional attention.
3.9.4. Partial Discharge Level of High-Voltage Motor No. 4
The partial discharge magnitude of high-voltage motor No. 4 was analyzed using a level graph, and the results showed that at the phase voltage of 6.35 kV, the partial discharge magnitude was approximately 17,000 pC, which remains within the cautionary level. Compared to the pre-maintenance value, there was no significant reduction. However, it was confirmed that the arc discharge in the terminal winding observed at 7.94 kV (1.25 times the phase voltage) was eliminated through precise insulation diagnostics and reinforcement work.
These results indicate that while the maintenance work was effective in eliminating arc discharges, it was not fully successful in reducing the partial discharge magnitude to a satisfactory level.
Figure 29 visually illustrates the changes observed after the maintenance work.
3.10. Post-Maintenance Partial Discharge Pattern Analysis
The analysis of the partial discharge patterns at the phase voltage (6.35 kV) revealed that for No. 1 and No. 3, the discharge patterns consisted of a mixed discharge comprising 40% internal discharge and 60% surface discharge occurring between the winding surface and the finger plate at the slot end. In contrast, the patterns for No. 2 and No. 4 showed a 30% internal discharge and 70% surface discharge, also categorized as mixed discharge.
This analysis demonstrates that the combined occurrence of internal and surface discharge serves as a critical indicator for evaluating the condition of high-voltage motors and the effectiveness of maintenance efforts. The PRPD (Phase Resolved Partial Discharge) graph results, used to analyze these partial discharge patterns, are presented in
Figure 30.
3.11. Comparison Analysis of Partial Maintenance and Full Maintenance (Rewinding)
In cases where the insulation condition of the stator windings was deemed defective, the conventional maintenance approach primarily involved the complete replacement of the stator windings through a rewinding process. However, the rewinding process has the significant drawback of requiring substantial time and costs during the maintenance procedure. Specifically, if the entire facility ceases operation during the maintenance period of a high-voltage motor, it can result in significant economic losses for the company. This issue poses an even greater burden for enterprises operating large-scale facilities.
If the insulation defects in the stator windings can be resolved through partial maintenance rather than full replacement, it would not only significantly reduce the time and cost of the process but also greatly shorten the downtime of the equipment. This would minimize production losses and improve maintenance efficiency, thereby contributing significantly to enhancing the company’s competitiveness.
Table 9 presents a comparison of the costs and time required for partial maintenance using felt pads versus the conventional rewinding method. This comparison allows for an objective evaluation of the efficiency of both methods and clearly demonstrates the economic advantages and time-saving effects offered by partial maintenance.
4. Conclusions and Future Work
4.1. Conclusions
This study proposed a systematic and practical approach to addressing the issue of partial discharge escalation caused by arc discharge in the stator winding of high-voltage motors. Through the construction of a model circuit, the causes of arc discharge and its effect on increasing partial discharge were analyzed and experimentally validated. The findings demonstrated that interrupting the arc discharge pathway effectively reduces partial discharge levels.
To pinpoint the exact location of the arc discharge, a UV camera technique was employed, enabling the precise identification of fault sites. Based on this diagnosis, targeted partial maintenance was performed, incorporating felt-pad insulation reinforcement to enhance the insulation condition of the stator winding and successfully eliminate arc discharges. After maintenance, the insulation diagnostics showed a reduction in partial discharge levels by an average of more than 80% compared to the pre-maintenance levels, thereby proving the effectiveness of the proposed approach.
Traditional rewinding methods require the complete disassembly and replacement of the winding, which is costly and time-consuming. In contrast, the partial maintenance method proposed in this study simultaneously meets the demands for economic and time efficiency. Additionally, the use of UV cameras for fault detection offered high precision and reliability, minimizing the downtime of equipment and enhancing operational efficiency.
This research presented an innovative and practical solution for addressing insulation degradation and failure in the stator winding of high-voltage motors. The maintenance method leveraging UV cameras and felt pads demonstrated its potential to improve the stability and reliability of high-voltage motors while significantly reducing maintenance costs. These results provide a valuable foundation for establishing preventive maintenance strategies for high-voltage motors and highlight the necessity of further studies to expand the applicability and versatility of this technology across various operating environments.
In conclusion, the diagnostic and maintenance techniques proposed in this study are expected to play a critical role in accurately assessing the insulation condition of high-voltage motors and resolving issues effectively. Furthermore, these methods contribute substantially to maximizing the economic and technical efficiency of equipment operation, ensuring a higher level of reliability and sustainability in industrial applications.
- ◦
Partial Discharge Inception Voltage and Magnitude: The measured partial discharge inception voltage (PDIV) was 3.5 kV for the No. 1 MTR, 2.0 kV for No. 2, 2.1 kV for No. 3, and 1.9 kV for No. 4, respectively. The partial discharge magnitudes measured at 6.35 kV and 7.94 kV were 77,000 pC and 104,000 pC for No. 1, 49,900 pC and 107,000 pC for No. 2, 33,000 pC and 89,900 pC for No. 3, and 17,000 pC and 105,000 pC for No. 4, respectively. Thus, at 6.35 kV, No. 1–3 were rated as defective, while No. 4 was rated cautionary. Analysis of the partial discharge patterns at 7.94 kV showed that in all four motors, the stator windings exhibited a complex discharge pattern, with an approximately 10% internal discharge and 90% surface discharge occurring between the winding surface at the slot end and the finger plate.
- ◦
UV Count Measurement: When applying 7.94 kV, arcing between the motor’s end winding and the finger plate was visibly observed. At the same location, the UV counts measured at 7.10 kV and 7.94 kV were 32,760 and 101,600, respectively, indicating a threefold increase in the UV count as the AC voltage increased.
- ◦
Blocking Work Effectiveness: To eliminate the root cause of arc discharge, blocking work was conducted by inserting insulating material (felt pad) between the end winding surface and the finger plate. After maintenance, the partial discharge magnitudes measured at 6.35 kV were 9500 pC for No. 1, 17,000 pC for No. 2, 11,500 pC for No. 3, and 17,000 pC for No. 4, with No. 1. Subsequent testing at 7.94 kV confirmed the effectiveness of the blocking work, as no surface discharge from arcing was observed.
4.2. Future Research Directions and Strategies
This study confirmed the significant impact of insulation performance degradation caused by arcing and partial discharge in high-voltage motor stator windings on equipment stability. Based on these findings, further strategies and directions for improving the insulation performance and reliability of high-voltage motors are required.
Firstly, the issue of grading coating damage near the winding ends should be addressed by developing composite materials with enhanced durability and grounding strength. These materials must withstand vibrations and stress, ensuring the long-term stability of the grading coating.
Additionally, efforts should be made to strengthen the insulation’s performance to prevent the arcing caused by charge accumulation on the winding surface. This includes designing coatings that effectively manage surface potential and introducing high-dielectric-strength materials to reduce the risk of insulation failure.
Partial discharge pattern analysis technology needs further advancement. By utilizing machine learning-based data analysis techniques, algorithms should be developed to distinguish severe arcing from minor discharges, thereby improving diagnostic accuracy.
UV cameras are highly effective for detecting partial discharge locations. They should be further developed into real-time monitoring systems to continuously observe equipment conditions. Moreover, integrating UV data with current and voltage data will enable comprehensive insulation diagnostics.
Finally, a proactive maintenance system must be established. This involves developing fault prediction models based on partial discharge and arcing data and implementing systems that automatically propose maintenance strategies. These measures will enhance equipment reliability and prevent losses caused by unexpected shutdowns.
Such research is expected to contribute to improving the insulation performance of high-voltage motors, enhancing equipment reliability, reducing maintenance costs, and extending equipment lifespan, ultimately increasing efficiency in industrial operations.


