1. Introduction
Micro-/nano-positioning technology is one of the core supporting technologies in fields such as high-end equipment manufacturing, biomedical engineering, optical precision measurement, and semiconductor packaging. As the demand for multi-DOF coordinated operations in precision engineering continues to grow, parallel micro-positioning platforms that combine high precision with large travel ranges have become a research focus in recent years [
1,
2,
3,
4,
5]. Traditional serial positioning platforms can achieve large-stroke motion, but their cumulative errors and dynamic performance limitations restrict their application in sub-micron precision scenarios. The compliant parallel micro-positioning platform not only features a compact parallel mechanism with high stiffness and precision, but also benefits from the advantages of frictionless, gap-free, and lubrication-free flexure hinges, making it widely applied in the biomedical field. It is often used as a supporting mechanism for culture dishes and microscopy equipment, where its precise positioning performance is a crucial ratio affecting the success rate of cell operations [
6,
7,
8,
9,
10,
11]. Current research on micro-positioning platforms tends to focus on specific aspects such as positioning accuracy, repeatability, resolution, workspace, bandwidth, input/output coupling ratio, positioning stability, efficiency, speed, load, and cost [
12,
13,
14,
15]. Among the existing drive methods, piezoelectric actuators (PEAs) are widely used due to their high stiffness, high output force, and sub-nanometer resolution [
16]. However, their output displacements are limited by the inherent characteristics of the actuator, usually not exceeding 100
m. The current mainstream solution is to combine the PEA-based positioning system with a motor-based coarse adjustment system to extend the displacement range. However, while this method compensates for the limited workspace of the PEA, it also introduces issues such as structural complexity, increased costs, and amplified environmental noise.
An increasing number of micro-/nano-operation studies are raising the demands for the workspace of micro-positioning platforms, aiming to overcome the limitations of traditional “coarse–fine two-stage composite systems”. Therefore, the application of amplification mechanisms is crucial for enhancing the workspace of micro-positioning platforms. Several types of displacement amplification mechanisms, such as lever-type, bridge-type, and Scott Russell mechanisms, have been proposed. In the field of parallel micro-positioning platforms, Kim et al. [
17] proposed a self-guided displacement amplification mechanism with a bridge amplification function. Yuan et al. [
18] presented a micro-positioning platform with two degrees of freedom based on a lever amplification mechanism, achieving a displacement amplification ratio (DAR) of 21.8 and a workspace of 38.1
m × 41
m. In this paper, the displacement amplification ratio (DAR) is defined as the ratio of the output displacement of the end-effector to the input displacement at the input port. It will hereafter be referred to as the DAR. Zhang et al. [
19] designed a 3-DOF parallel micro-motion platform using a combination of bridge and lever amplifiers, with a workspace of 582
m × 517
m × 524
m. Kim et al. [
20] used a two-stage lever mechanism to design a micro-positioning platform with an amplification ratio of 4, achieving a workspace of ±110
m × ±110
m × 1.2 mrad. Wang et al. [
21] proposed a 3-DOF nano-positioning platform with three two-stage lever amplifications, with a workspace of 137.44
m × 152.28
m × 3.97 mrad.
Although existing platforms have achieved relatively high displacement amplification ratios (e.g., 21.8 as reported in [
18]), their workspace remains limited (e.g., <600
m as noted in [
19]). Moreover, there is still room for improvement in balancing structural compactness, motion decoupling, and range persist. In fact, due to the varying application scenarios of different micro-positioning platforms, designing a platform that balances various performance metrics with the overall structure of the practical application scenario presents a significant challenge. As microscopic operations become increasingly frequent, there is an important research significance in developing a 3-DOF parallel micro-positioning platform with a large stroke, compact structure, and low coupling ratio. This design could potentially reduce the cost burden associated with traditional “coarse–fine two-stage composite systems” and simplify the layout complexity of positioning systems in many practical application scenarios.
To address this, this paper proposes a 3-DOF parallel micro-positioning platform with a high DAR, large workspace, and compact structure. Compared with traditional micro-positioning platforms, the modular three-stage amplification structure designed in this work not only significantly enlarges the workspace of the end-effector (±875 m × ±757.8 m × 41.02 mrad), but also exhibits high structural symmetry and compactness, thereby enhancing the compatibility of the overall platform design with practical application scenarios. Specifically, the platform proposed in this paper adopts a modular configuration, where L-shaped, Z-shaped, and Π-shaped three-stage amplification mechanisms are serially integrated through flexure hinges, achieving single-branch three-stage amplification and effectively increasing the output displacements of PEAs. The platform employs three symmetric support branches in parallel to the end-effector, significantly enhancing the structural symmetry of the system and improving operational stability and precision.Notably, the proposed design eliminates traditional mechanical coarse adjustment by employing a purely flexure-based amplification mechanism, thereby avoiding assembly errors and environmental vibrations while simultaneously simplifying the structure and reducing costs.
The remainder of this paper is organized as follows.
Section 2 provides a detailed description of the structural design and working principle of the micro-positioning platform. Kinematic and dynamic modeling are presented in
Section 3 and
Section 4, respectively.
Section 5 validates the performance metrics of the micro-positioning platform through finite element simulations, and
Section 6 concludes the paper.
3. Kinematic Modeling
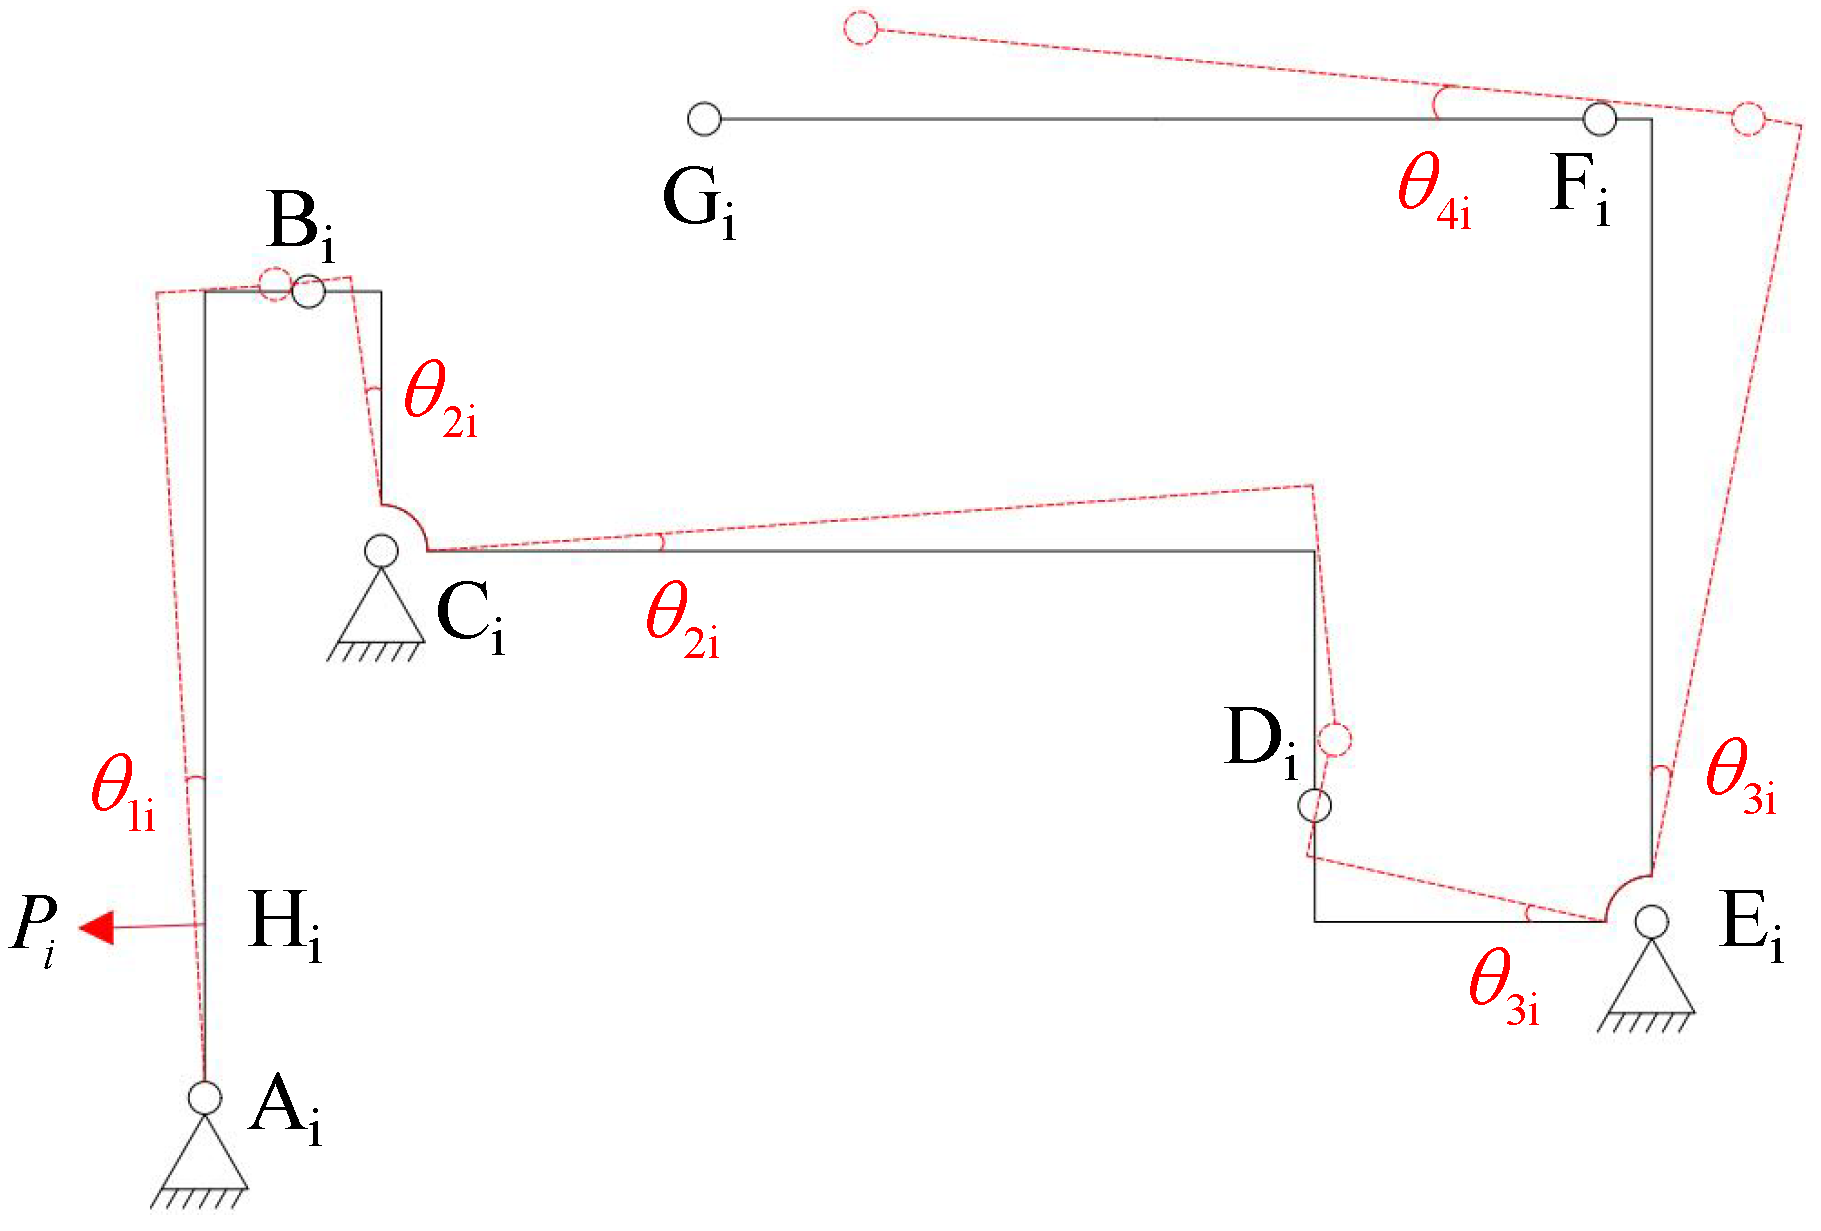
A motion schematic of the 3-DOF parallel micro-positioning platform designed in this paper is shown in
Figure 6. Points
, and
represent the double-notch straight circular flexure hinges (i = 1∼3), while points
and
represent the wheel-shaped flexure hinges. The drive points of each branch are labeled as
. The first-stage lever mechanism is composed of the rod
, with point
serving as the rotation point of the lever, fixed on the positioning platform. The second-stage Z-shaped amplification mechanism consists of the rods
and
, where point
is flexibly connected to the first-stage lever mechanism, and point
serves as the rotation point of the second-stage Z-shaped amplification mechanism, fixed on the positioning platform. The third-stage L-shaped amplification mechanism consists of the rods
and
, with point
flexibly connected to the second-stage Z-shaped amplification mechanism. Point
serves as the rotation point of the third-stage L-shaped amplification mechanism, fixed on the positioning platform, and point
is flexibly connected to the link
. The other end of the link
is connected to the end-effector via the flexure hinge
.
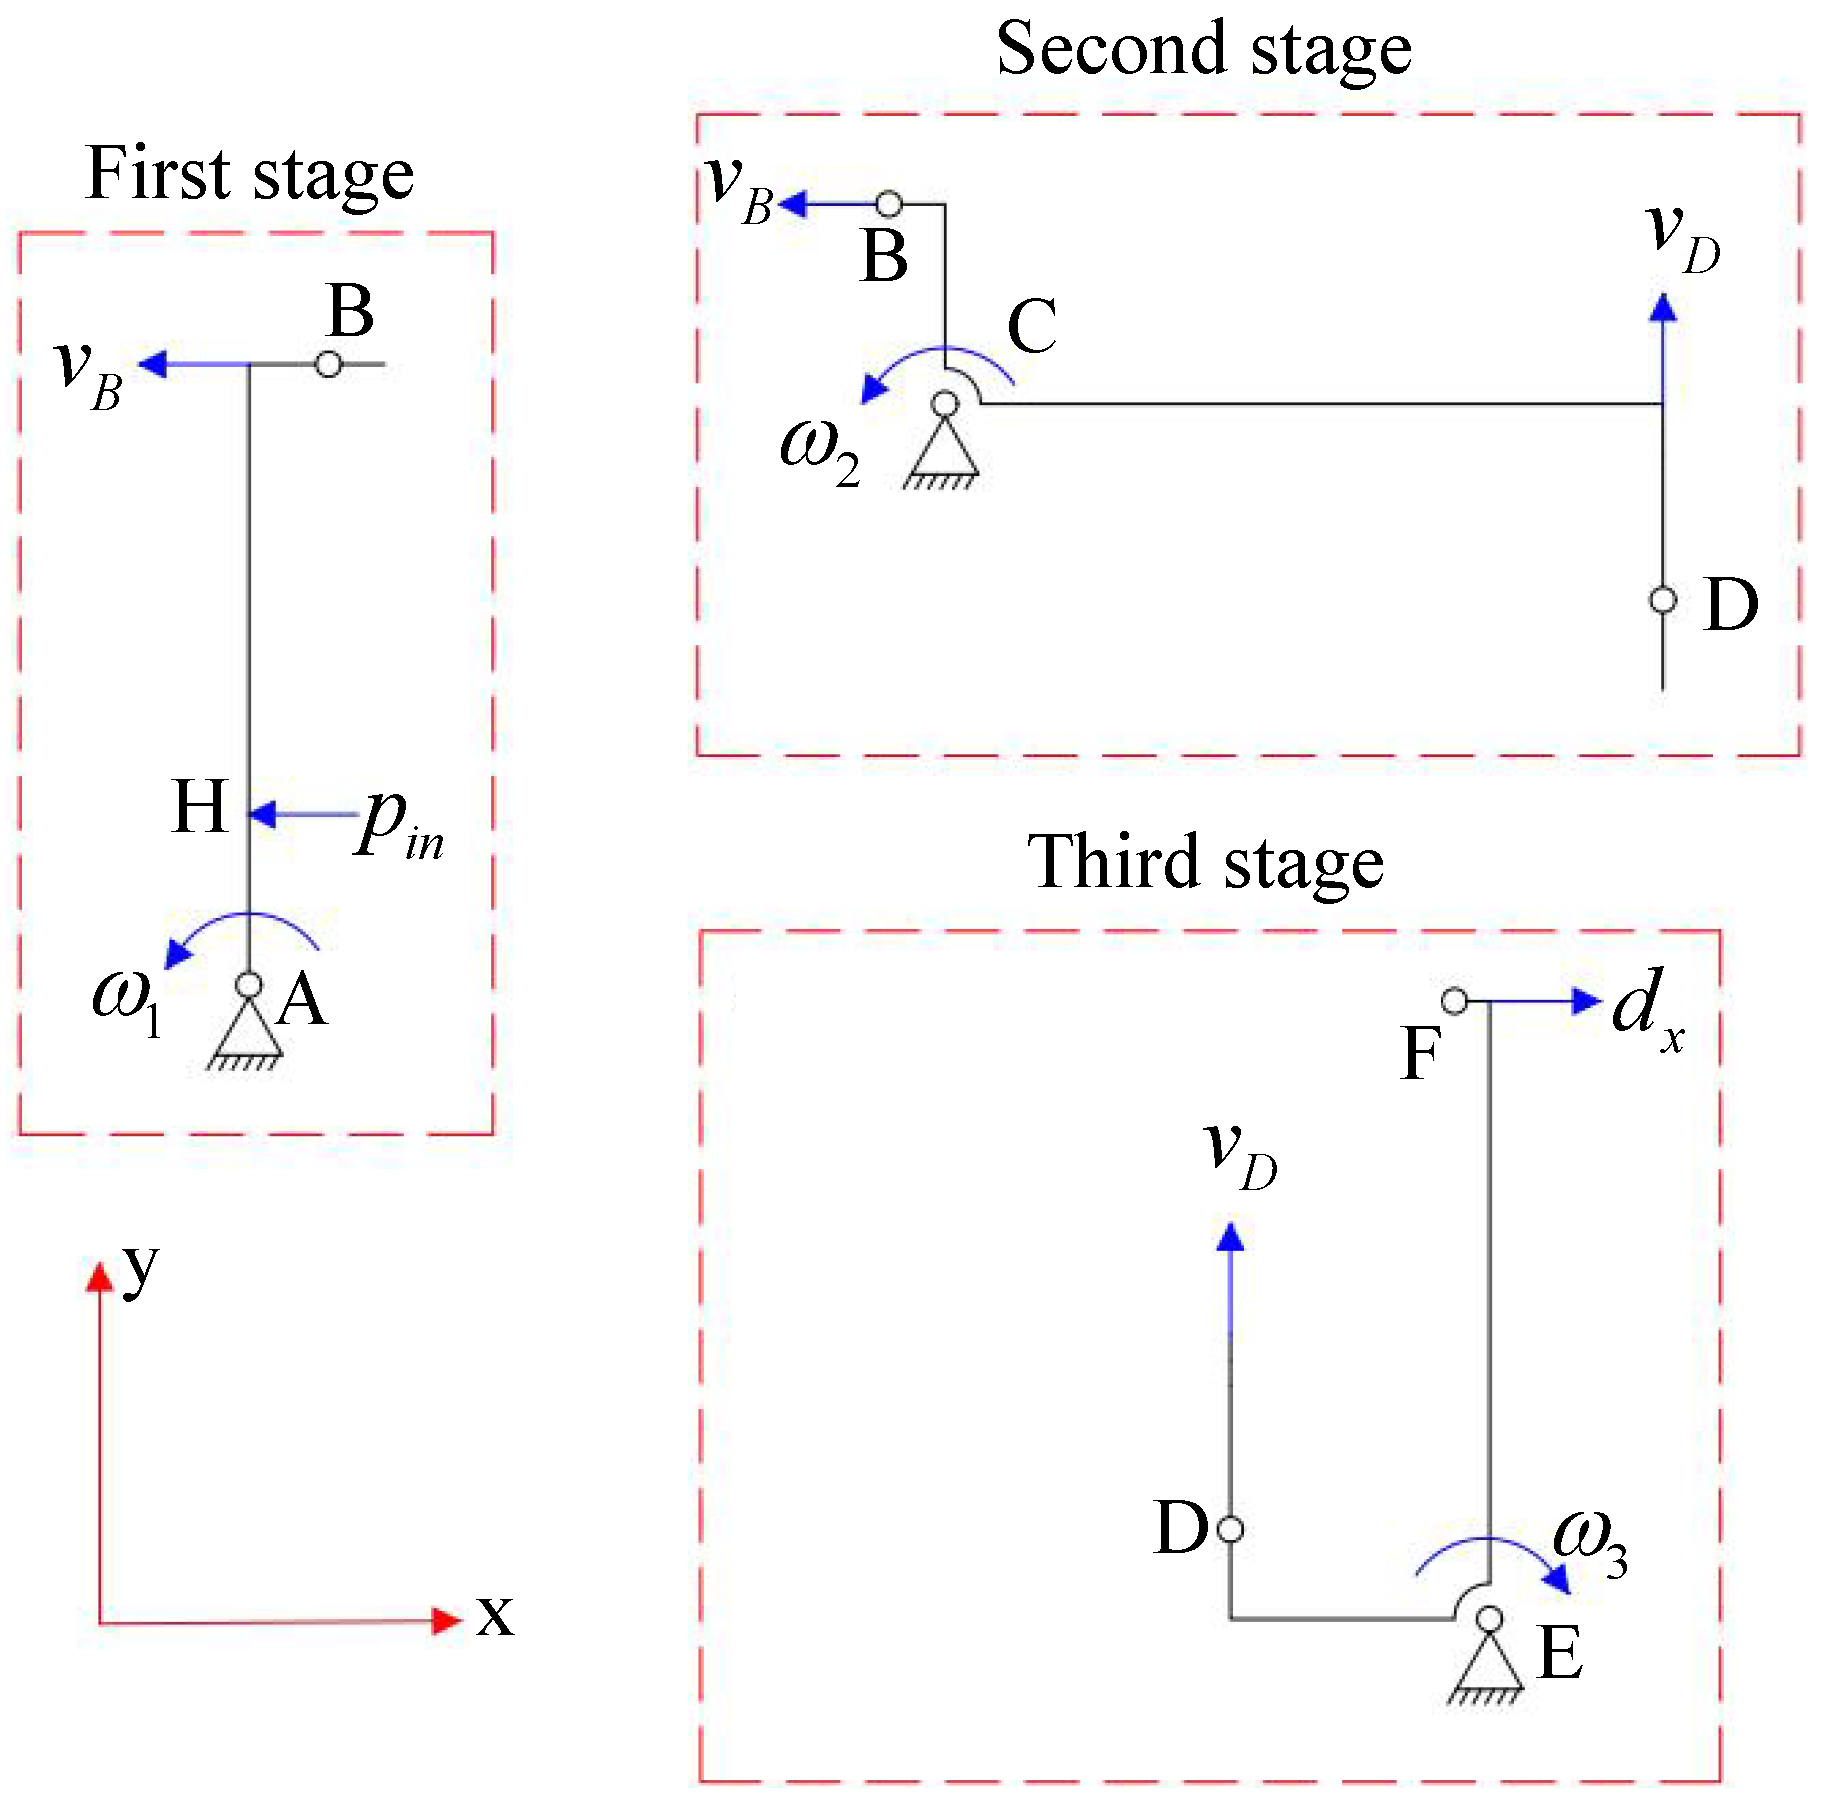
According to the principles of the pseudo-rigid body model method, the flexure hinge can be equivalently represented as an ideal rotational joint with a torsional spring, while the link connected by the flexure hinge is considered a rigid rod. The micro-positioning platform designed in this paper is driven by three branches arranged in a circular array, with each branch having an identical structure. To simplify the analysis, one branch is selected for displacement amplification analysis, and the motion vector diagrams of the three amplification mechanisms are shown in
Figure 7, where
and
represent the input displacement and output displacement of the branch, respectively.
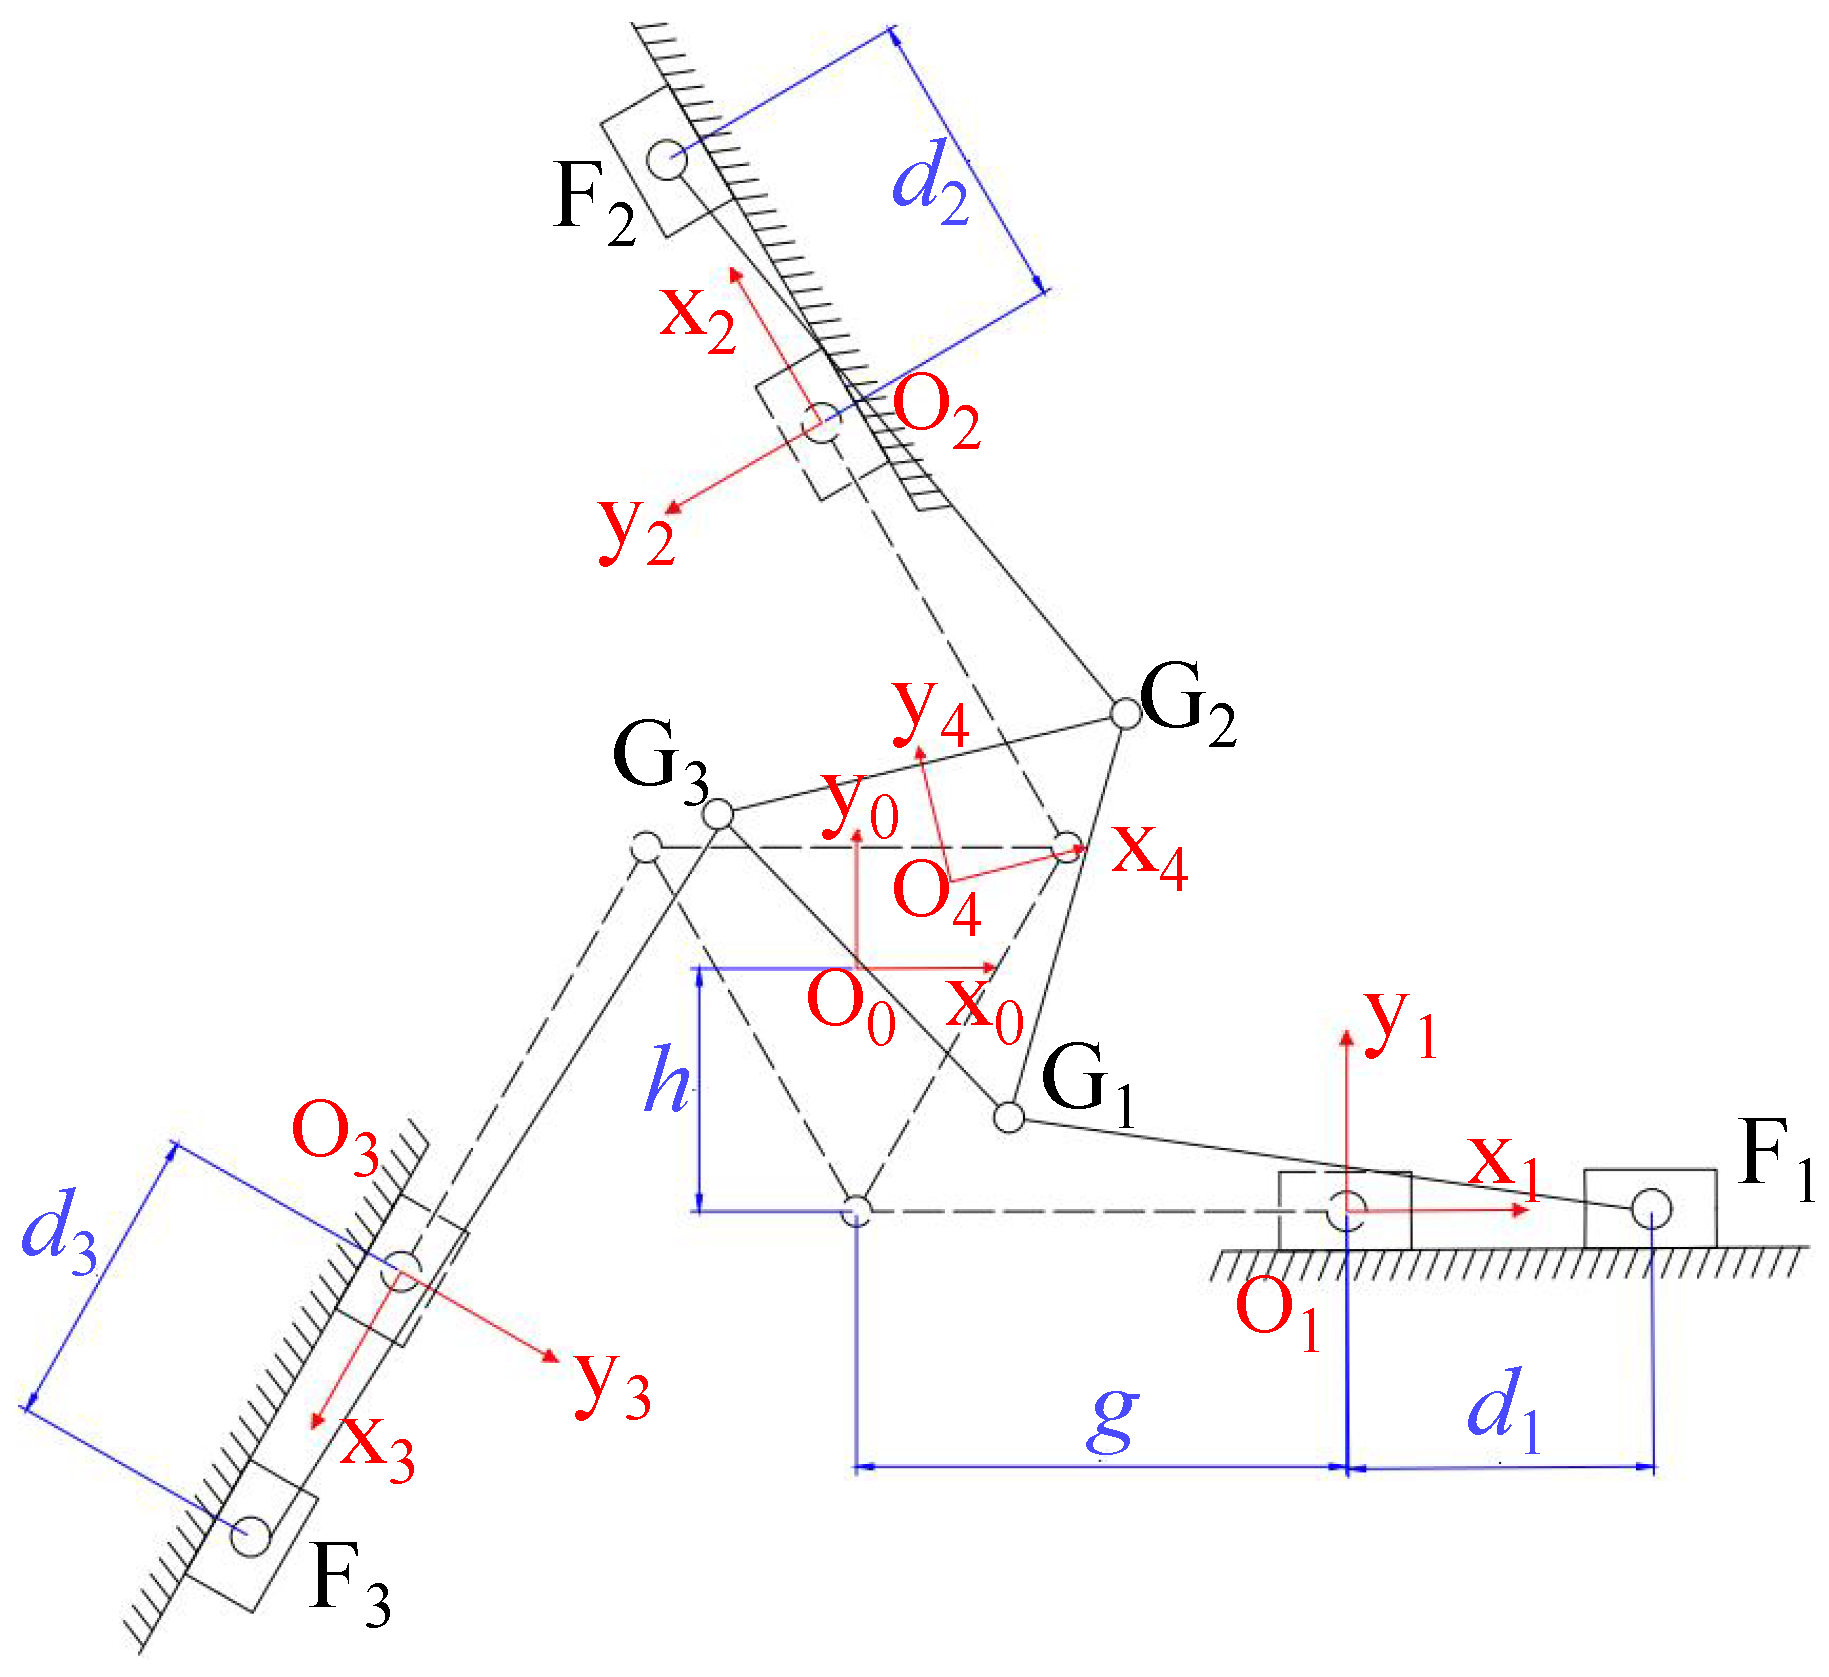
Figure 8 shows the diagram with key dimension markings for the branch.
Assume that the relationship between the input displacement
and the output displacement
of the branch is
where
is the DAR. To obtain the overall amplification ratio
of each branch, it is necessary to derive the amplification ratios of the lever-type, Z-shaped, and L-shaped amplification mechanisms.
Firstly, for the first-stage lever mechanism, as shown in
Figure 7, the instantaneous velocities of points H and B satisfy the following relationship:
where
represents the angular velocity of link AC rotating around the instantaneous center of hinge A,
is the length of the rod segment AH, and
represents the projection length of the segment AB onto the y-axis, as shown in
Figure 7.
The DAR
of the first-stage lever mechanism can be obtained from Equations (
3) and (
4):
Similarly, for the second-stage Z-type amplification mechanism, the instantaneous velocities of points B and D are given by
where
represents the angular velocity of the Z-shaped lever rotating around the instantaneous center of rotation C, and
and
represent the projection lengths of segments BC and CD onto the y-axis and x-axis, respectively, as shown in
Figure 7.
The DAR
of the second-stage Z-shaped amplification mechanism can be obtained from Equations (
6) and (
7):
For the third-stage L-shaped amplification mechanism, the instantaneous velocity of point D and the output end is given by
where
represents the angular velocity of the L-shaped lever rotating around the instantaneous center of rotation E, and
and
represent the projection lengths of segments DE and EF onto the x-axis and y-axis, respectively.
The DAR
of the L-shaped amplification mechanism can be obtained from Equations (
9) and (
10):
Therefore, the overall DAR
of a single branch of the micro-positioning platform designed in this paper can be obtained from Equations (
5), (
8) and (
11):
Next, the relationship between the motion of the end-effector and the output displacements of each branch (i = 1∼3) after the three branches are connected in parallel to the end-effector is derived.
Since the relationship between the input and output displacements of each branch has been solved, the kinematic modeling of the parallel connection between the branches and the end-effector can be simplified. According to the actual configuration of the platform designed in this paper, the output end of each branch can be equivalent to a 3-PRR (prismatic–revolute–revolute) kinematic chain for analysis, as shown in the motion diagram in
Figure 9. The flexure hinge
at the output end of the third-stage amplification mechanism of each branch is equivalent to a prismatic–revolute joint. In the kinematic modeling process of the simplified 3-PRR kinematic chain, the global coordinate system
is located at the center point of the end-effector; the three coordinate systems
(i = 1∼3) are located at the initial positions of the flexure hinge
corresponding to each branch, with the x-axis oriented in the direction of the respective prismatic joint’s motion; the motion coordinate system
is attached to the center point of the end-effector and moves along with the end-effector.
represents the input displacement of the simplified 3-PRR platform.
For the 3-PRR platform, the transformation matrix from the global coordinate system
to the coordinate system
is given by
where
,
, and
is the rotation angle from the coordinate system
to the global coordinate system
. In the structure designed in this paper,
,
, and
.
The motion of the end-effector can be described by the position and orientation of the motion coordinate system
. Relative to the global coordinate system
, the position and orientation of the motion coordinate system
are defined as
and
, respectively. Therefore, the transformation matrix from the coordinate system
to the coordinate system
is given by
where
, and
. By combining Equations (
13) and (
14), the transformation matrix from the motion coordinate system
to the coordinate system
(i = 1∼3) is derived as follows:
Since the motion range of the end-effector platform is extremely small, it can be approximated as
and
. Therefore, Equation (
15) can be simplified as follows:
The inverse kinematics matrix of the simplified 3-PRR platform is derived based on the coordinate position of the hinge point . The position of hinge in the coordinate system is denoted as , and its position in the coordinate system is denoted as .
In the simplified 3-PRR platform, are known quantities: , , and .
According to Equation (
16), the coordinate position of hinge
in the coordinate system
can be calculated as follows:
Since the length of the link
remains constant during the motion of the end-effector, the following equation can be derived:
By rearranging Equation (
18), the expression for
can be obtained as follows:
By substituting Equation (
17) and the value of
into Equation (
19), the following equation can be obtained:
Equation (
20) describes the mapping relationship between the position and orientation of the end-effector and the inputs. By rewriting Equation (
20) in matrix form, the inverse kinematic relationship of the simplified 3-PRR platform is expressed as Equation (
21):
By substituting Equation (
2) into Equation (
21), the inverse kinematic relationship of the overall 3-DOF platform can be obtained, as shown below:
The forward kinematics of the overall 3-DOF platform can be obtained by solving the inverse of Equation (
22).
In the above two equations, (i = 1∼3) represents the driving displacement of the PEA for each branch, is the DAR of the branch, and and define the inverse and forward kinematic Jacobian matrices of the 3-DOF platform, respectively.
5. Finite Element Simulation Verification
Finite element simulations were conducted using ANSYS Workbench (version 2022R1) to perform both static structural and modal analyses of the proposed micro-positioning platform. The analysis focused on the displacement response and dynamic characteristics of the positioning platform and end-effector. The model was discretized using SOLID186 ten-node 3D elements, with a target element size of 2090 m, while each flexible hinge unit was set to a size of 1000 m. The final mesh consisted of 564,098 elements and 854,932 nodes. The material was set as aluminum alloy (Al-7075-T6), with the following mechanical properties: density of 2810 kg/m3, Young’s modulus of 71.7 GPa, Poisson’s ratio of 0.33, and yield strength of 503 MPa. A safety factor of was chosen. Fixed constraints were applied at the mounting holes, and a prescribed displacement was applied at the input port in a specified direction to simulate actuation. Additionally, gravitational loads were applied to both the end-effector and the positioning platform to replicate realistic operating conditions. The resulting displacement of the end-effector was recorded to evaluate the DAR.
5.1. Single-Branch Amplification Ratio Verification
A large-stroke 3-DOF parallel micro-positioning platform is designed in this paper. To verify the amplification ratio performance of each branch, the single-branch amplification ratio was tested. Based on the design structure and
Figure 8,
Table 2 lists the main dimensional parameters of the micro-positioning platform designed in this paper.
By substituting the data from
Table 2 into Equation (
12), the theoretical amplification ratio of the branch chain is obtained as
During the structure design process, the rated input displacement of the PEA is set to 60 m. However, due to the influence of structural input stiffness, the maximum input displacement of a single branch in practical applications is typically lower than this rated value. To ensure that the research results are more aligned with real-world conditions and to fully consider system stability and drive safety margins, a conservative approach was adopted when setting the maximum drive displacement, which was set to 50 m. This approach aims to more accurately reflect the performance of the micro-positioning platform under actual working conditions. At the same time, to comprehensively verify the displacement amplification ratio of a single branch of the micro-positioning platform, the input displacement of the single branch was set to 54.59 m in the simulation analysis, in order to authoritatively evaluate its amplification characteristics and operational performance.
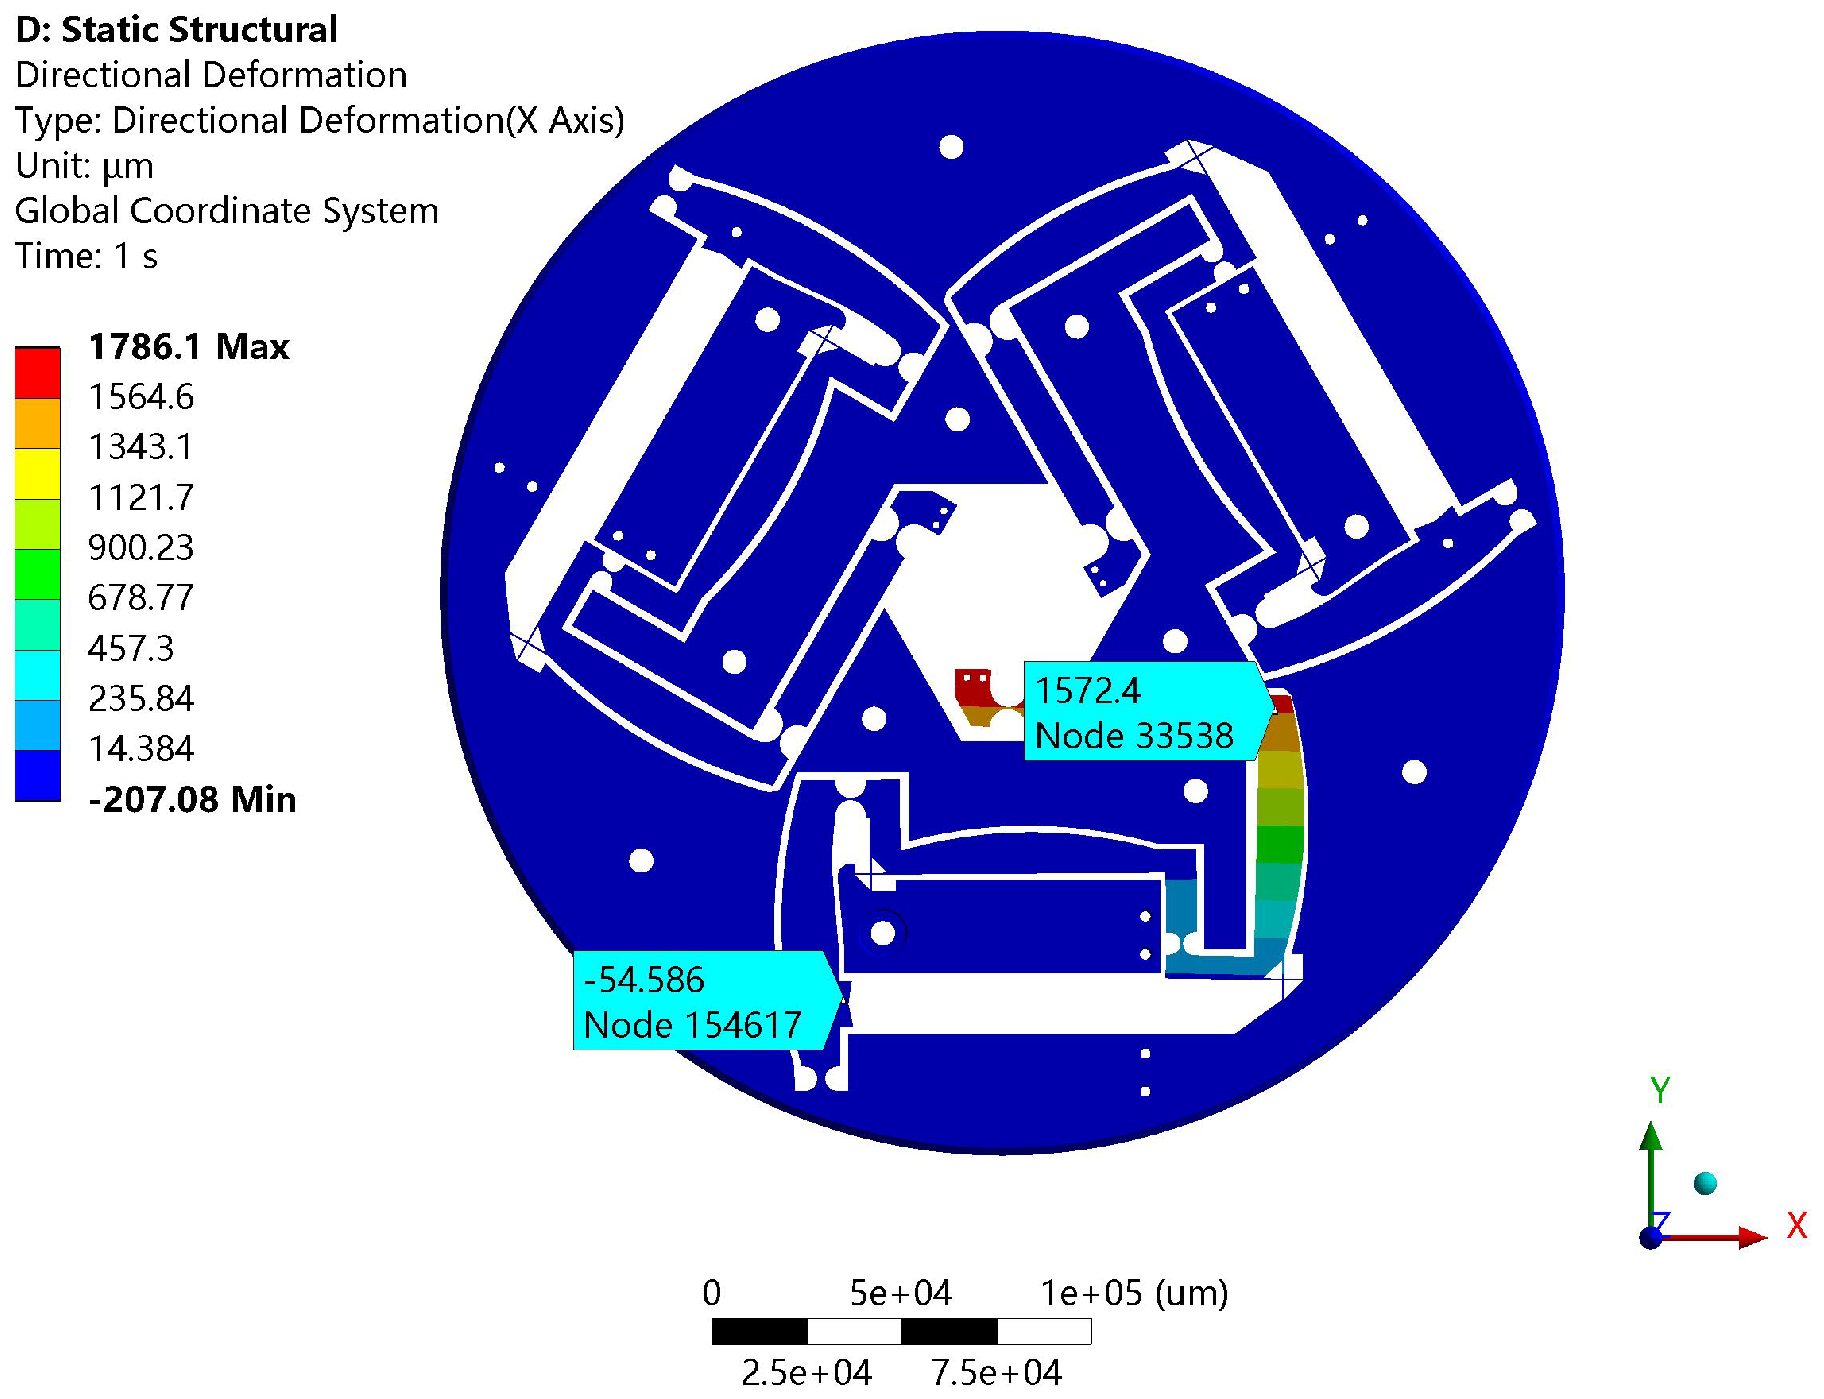
The simulation results are shown in
Figure 11. When the branch is not parallel to the end-effector, the input displacement of 54.59
m at the input end of the single branch results in an output displacement of 1572.4
m along the x-axis, with a simulation amplification ratio
of 28.81. The error compared to the theoretical calculation is 1.2%. The error primarily arises from the differences in assumptions between the theoretical calculation and the simulation model. In the theoretical calculation, the branch is assumed to be a rigid body, without considering the elastic deformation of the material, while the simulation includes flexure effects, such as small bending and stretching, which causes the branch to deform and absorb some of the displacement, thus reducing the amplification ratio. Moreover, the theoretical analysis does not take into account the deformation of the transition hinges between the amplification mechanisms, which results in displacement loss, while the simulation model incorporates and accumulates this deformation, further contributing to the reduction in the actual amplification ratio.
Despite the presence of errors, the simulation results show that the output amplification ratio of the single-chain actuator still reaches as high as 28.81, demonstrating excellent displacement amplification capability. This effectively highlights the validity of the displacement amplification design in the case of a single-chain actuator.
5.2. Validation of Parallel Amplification Ratio and Stress Analysis
By substituting the theoretical amplification ratio
calculated from Equation (
44) into Equation (
23), the relationship between the inputs at the three ends of the branch chains,
, and the 3-DOF motion of the end-effector can be obtained. A static analysis of the parallel micro-positioning platform was performed using the Ansys software. According to the theoretical formula, when
is maximized and
are set to 0, the end-effector will exhibit pure translational motion along the x-axis and rotational motion about the z-axis, with the x-axis translation reaching its maximum extent. To verify the displacement amplification effect of the end-effector under the condition of maximum motion along the x-axis, a displacement of 50.38
m is applied only at the input
of the branch chain, i.e.,
,
. In this case, according to Equation (
23), the theoretical amplification ratio of the end-effector’s motion along the x-axis is 19.44. The actual simulation results, as shown in
Figure 12a, indicate that the output displacement of the end-effector’s center along the x-direction reaches 881.71
m, with a simulated amplification ratio
of 17.5, resulting in an error of 9.98%. Furthermore,
Figure 12b demonstrates that under the same input displacement, the parasitic motion of the end-effector’s center along the y-axis is 11.02
m, with a cross-coupling ratio of 1.25%, achieving nearly decoupled long-range motion and ensuring the precision of the micro-positioning platform. Under this input condition, the theoretical rotation angle about the z-axis is 15.3 mrad. According to
Figure 12c, given the end-effector dimension v = 30 mm, the simulated rotation angle is determined to be 12.9 mrad based on the simulation results and the corresponding conversion relationship, resulting in a relative error of 15.69%.
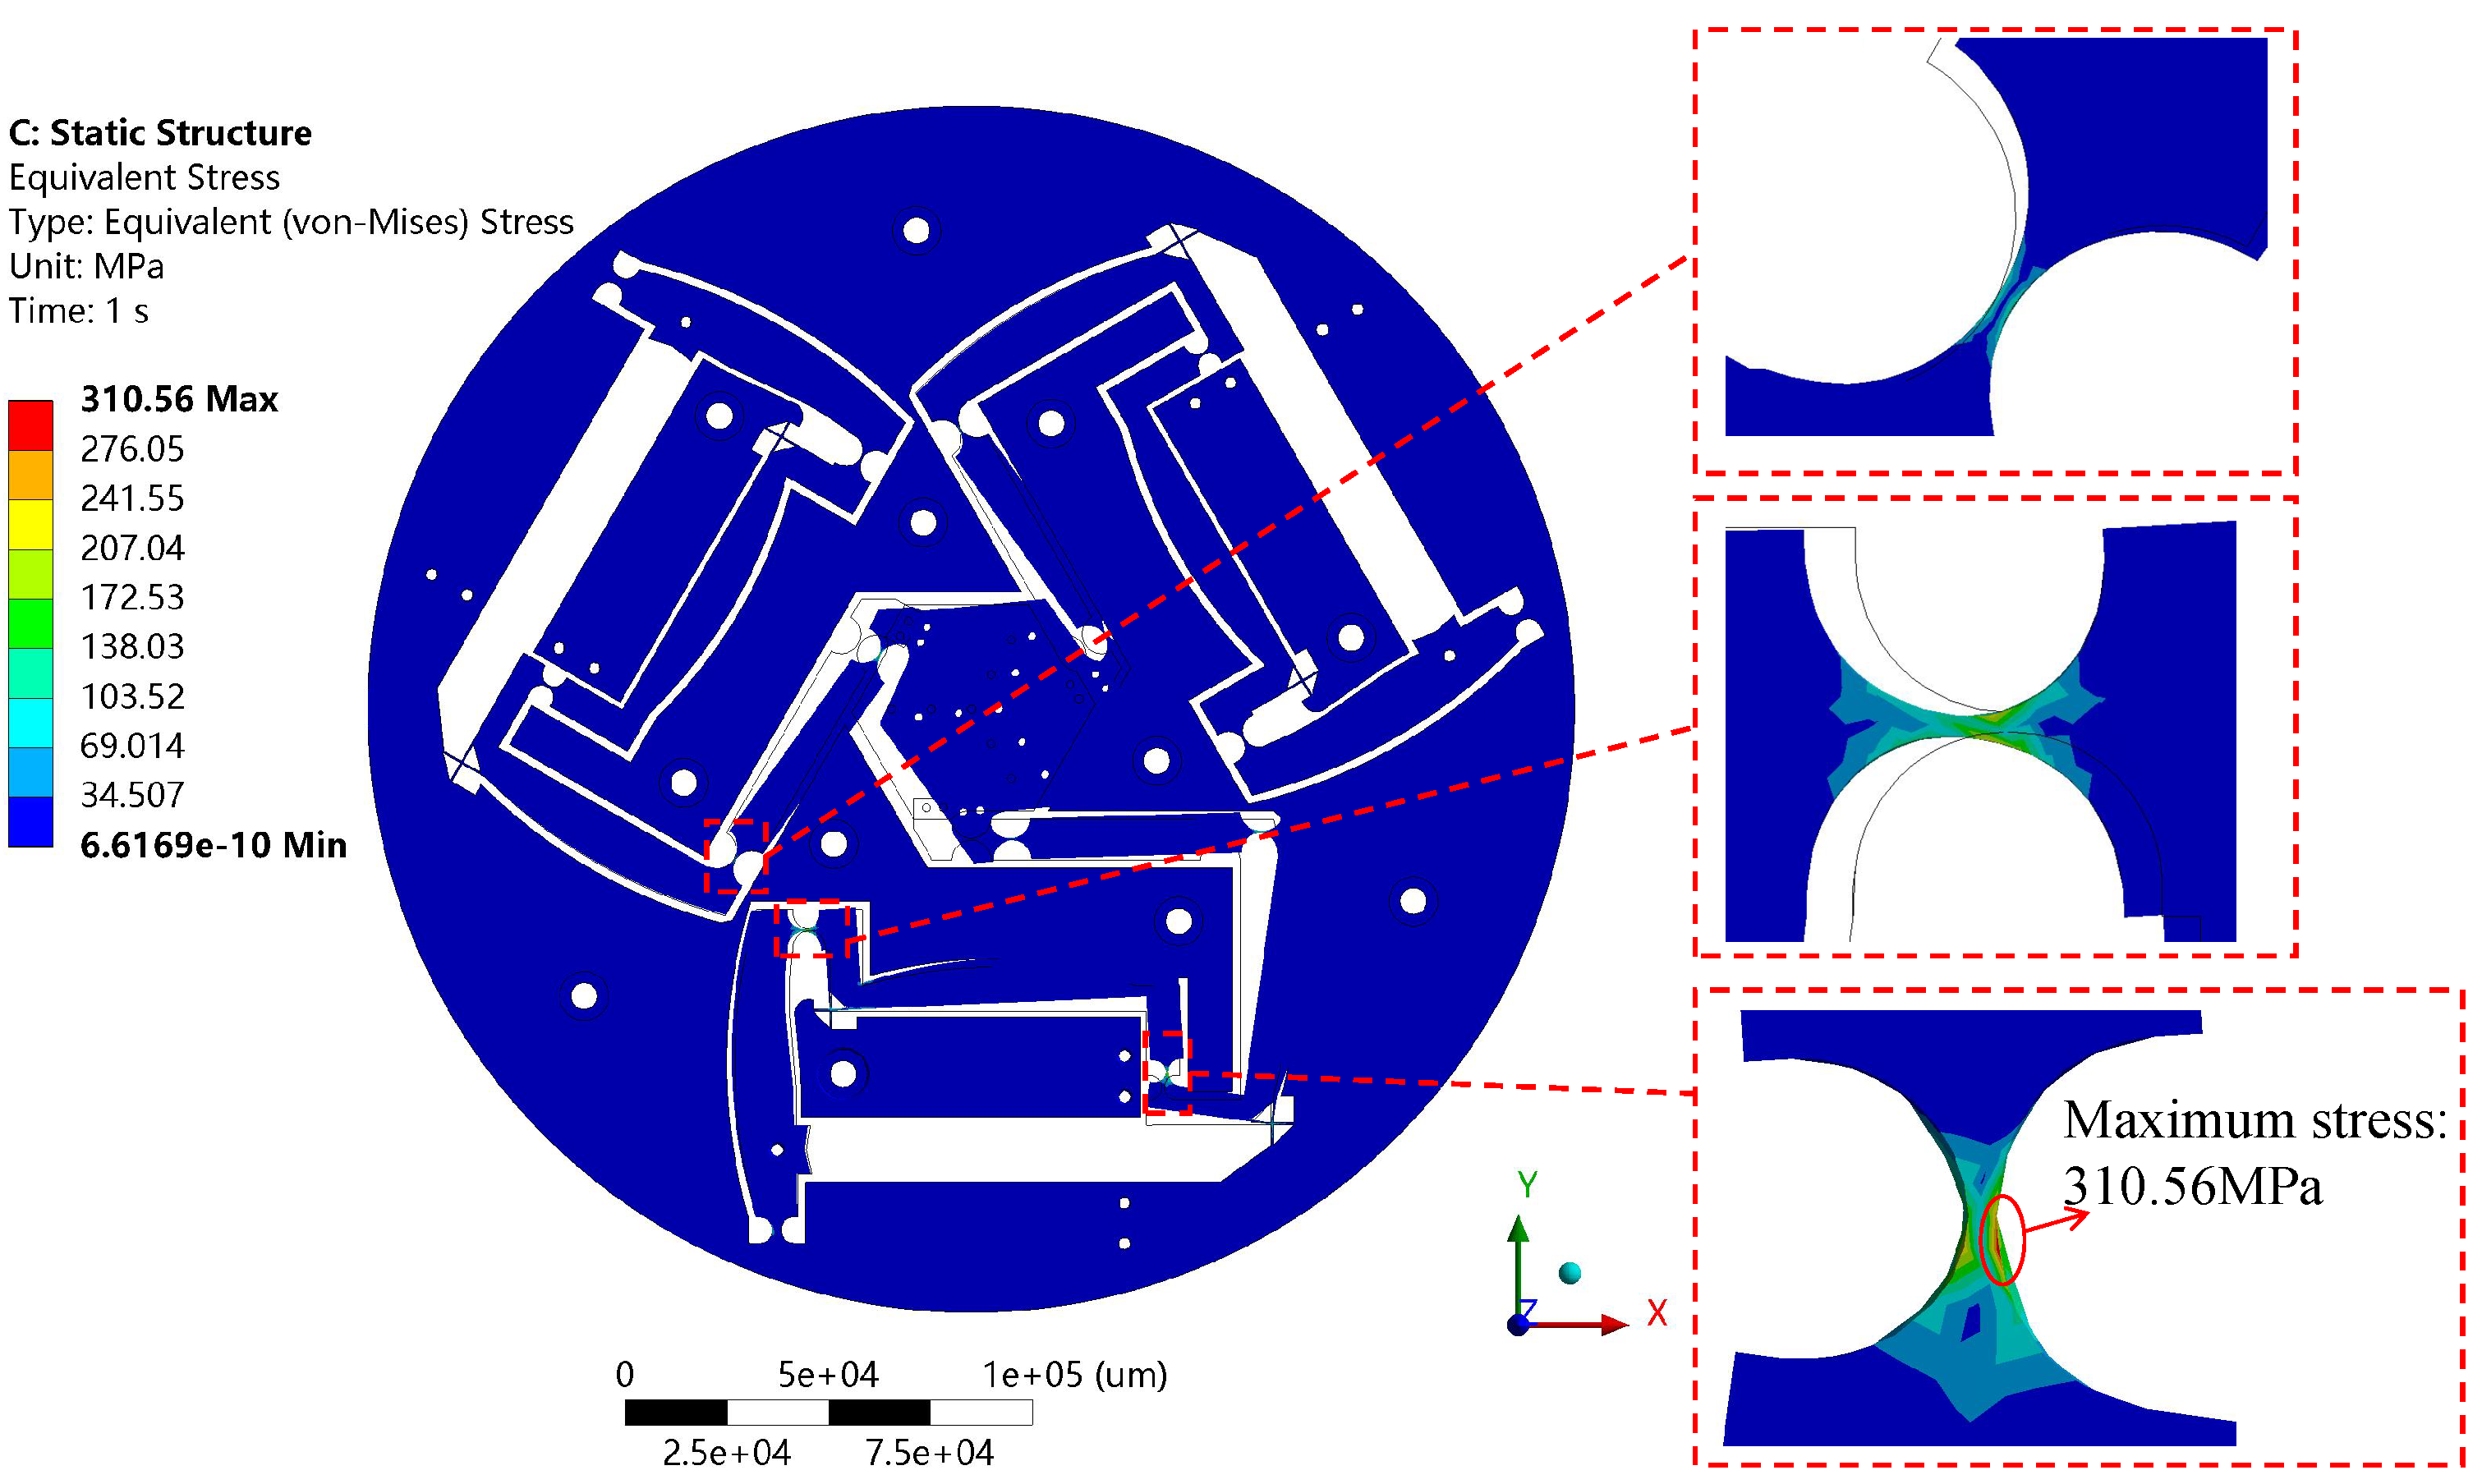
When the micro-positioning platform is in a state of extreme displacement motion at each DOF, the risk of material strength failure becomes particularly prominent.
Figure 13 illustrates the stress distribution of the end-effector when it moves to the limit position along the x-axis. The simulation results indicate that the majority of the stress in the flexure hinges is concentrated between 101 and 207 MPa. In the first branch chain, the connecting hinge between the Z-type and L-type amplification mechanisms experiences the largest torsional load, with its maximum stress reaching 310.56 MPa. However, the distribution range of this high-stress area is very small, and the overall stress levels are below the allowable stress of 335.33 MPa for the material used in this study. This result verifies the structural safety of the end-effector when achieving maximum displacement motion along the x-axis.
According to the results of Equation (
23), when
is maximized and
,
, the end-effector will exhibit pure translational motion along the positive direction of the y-axis and rotational motion about the z-axis, with the translational displacement along the y-axis reaching its maximum extent. To verify the displacement amplification effect of the end-effector under the condition of limit motion along the y-axis, a displacement of 25
m is applied at the input
and 50
m at the input
, i.e.,
. In this case, according to Equation (
23), the theoretical amplification ratio of the end-effector’s motion along the y-axis is 16.84. The actual simulation results, as shown in
Figure 14a, indicate that the output displacement of the end-effector’s center along the y-direction reaches 770.14
m, with a simulated amplification ratio
of 15.4, resulting in an error of 8.5%. Furthermore,
Figure 14b shows that under the same input displacement, the parasitic motion of the end-effector’s center along the x-axis is 3.16
m, with a cross-coupling ratio of 0.4%, achieving nearly decoupled long-range motion and ensuring the precision of the micro-positioning platform. Under this input condition, the theoretical rotation angle about the z-axis is 22.78 mrad. According to
Figure 14c, given the end-effector dimension v = 30 mm, the simulated rotation angle is determined to be 19.56 mrad based on the simulation results and the corresponding conversion relationship, resulting in a relative error of 14.14%.
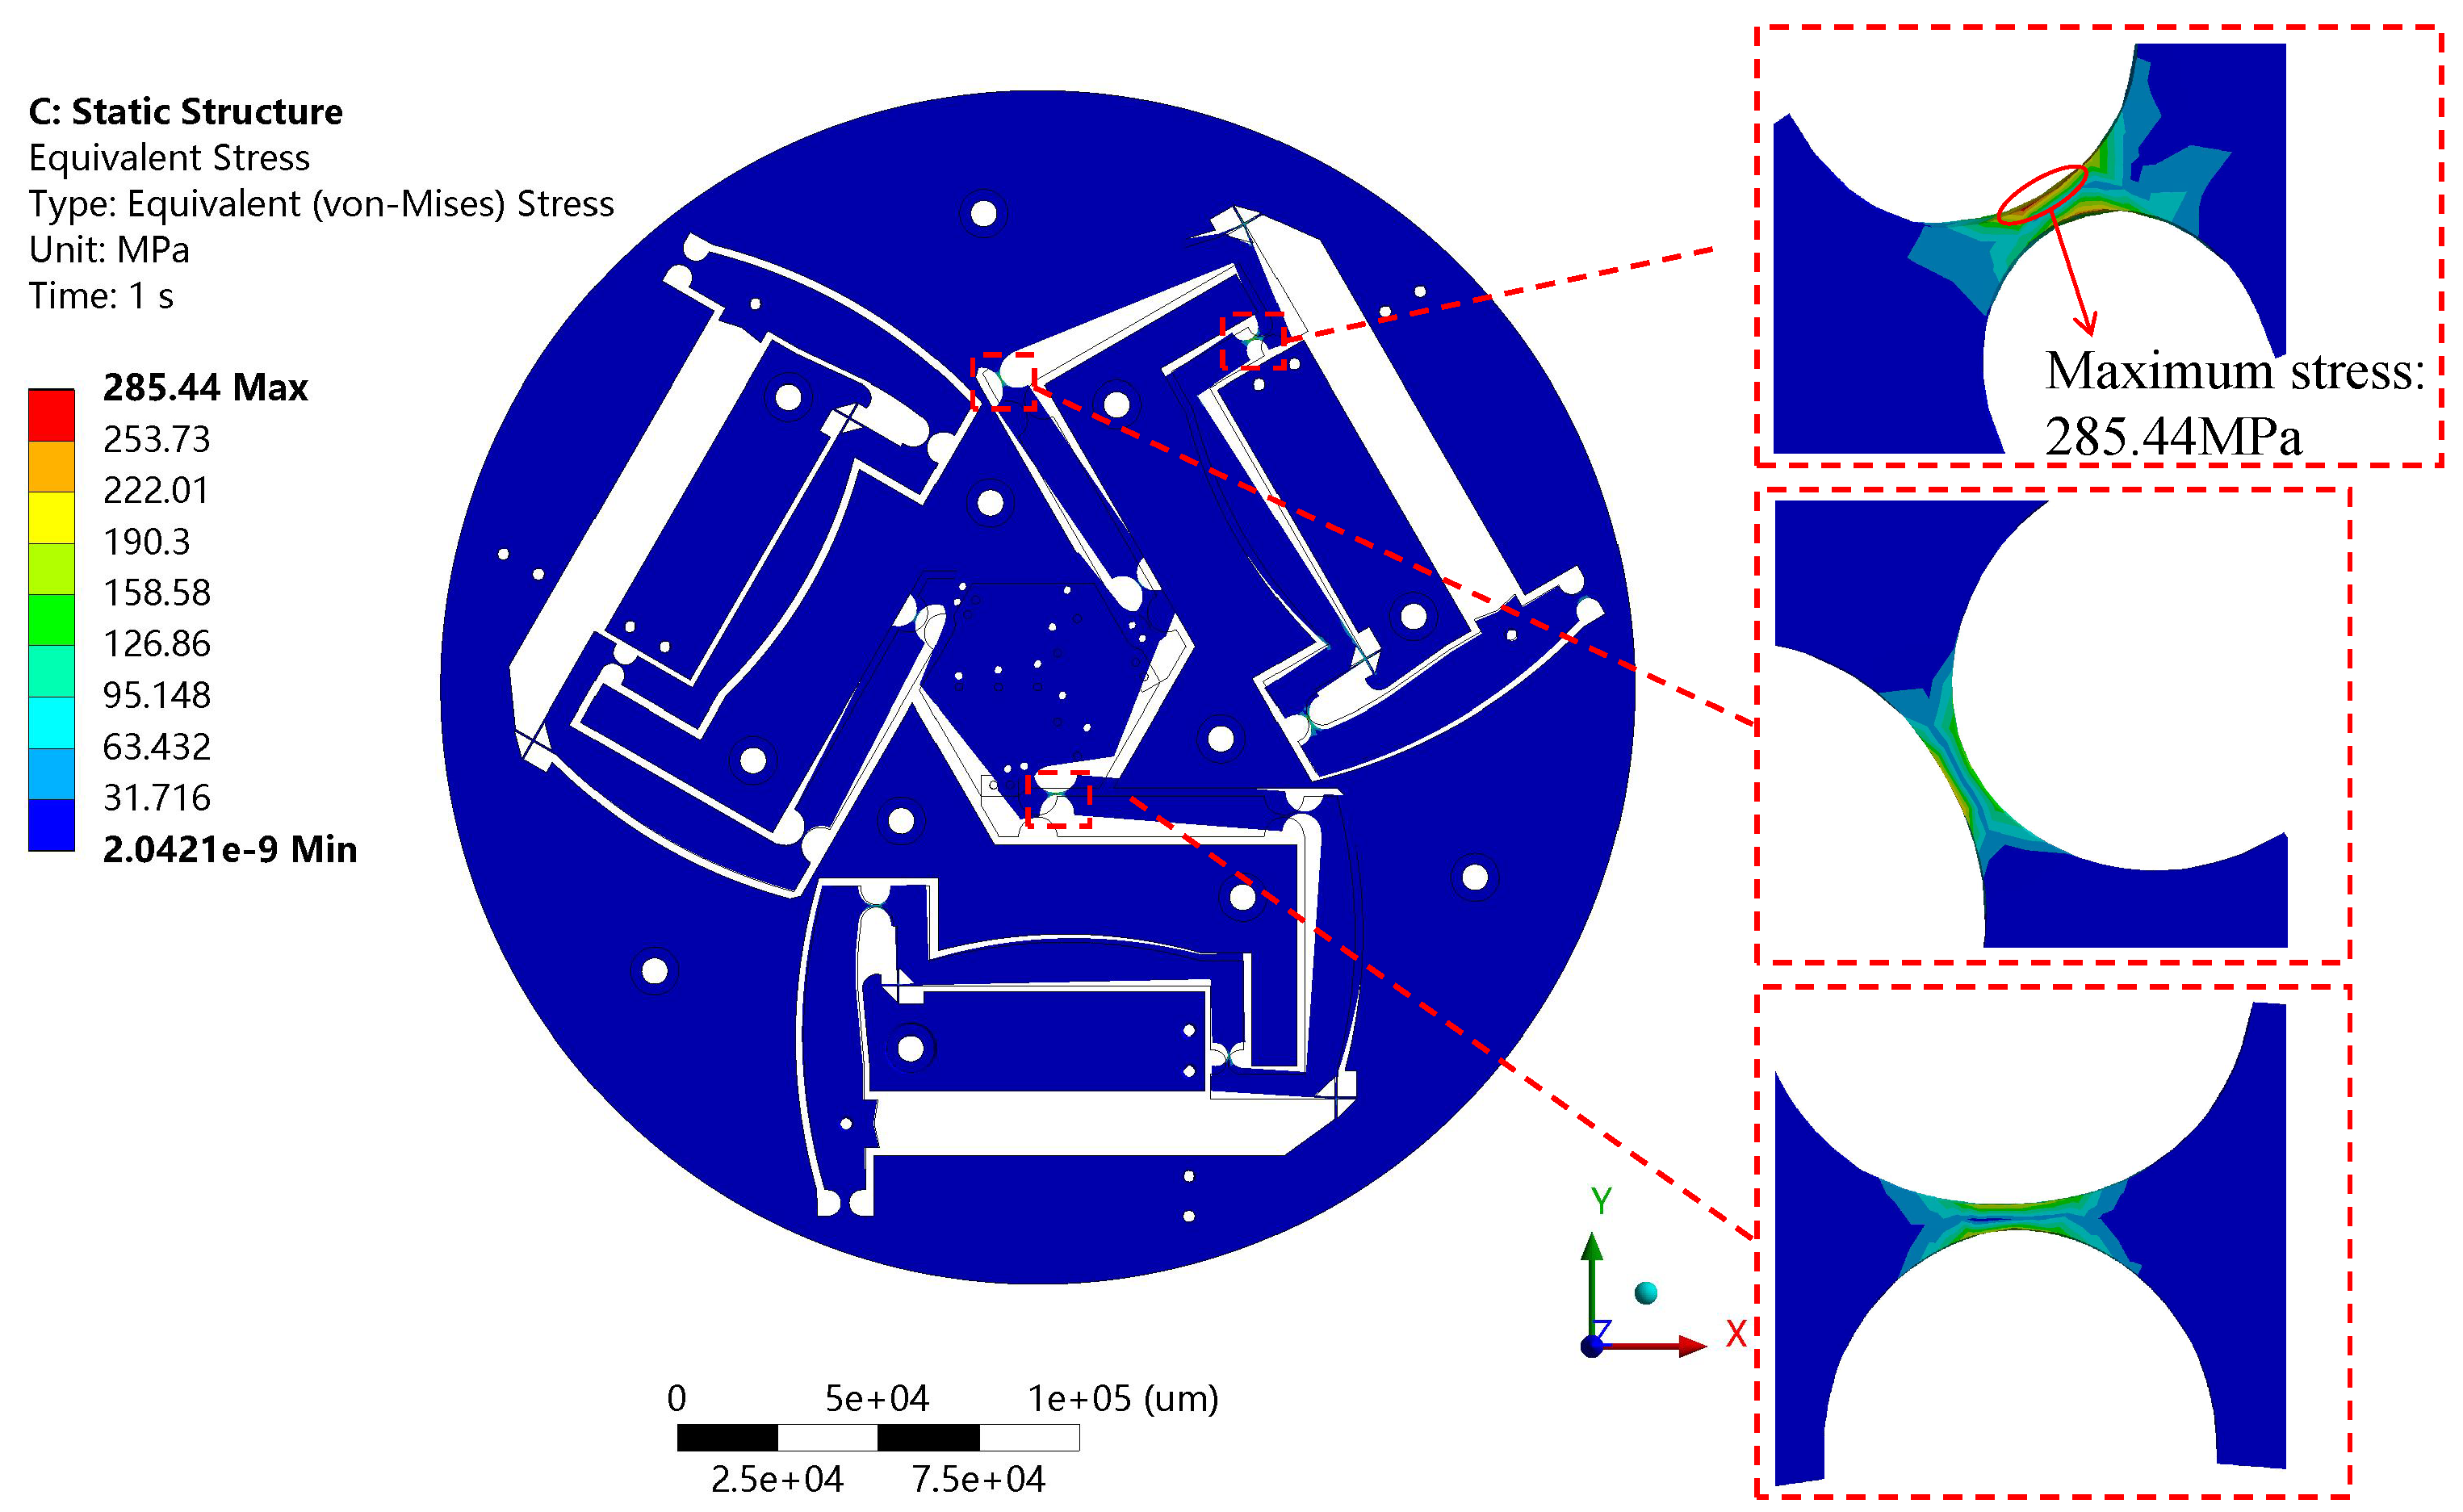
Figure 15 illustrates the stress distribution of the end-effector when it moves to the limit position along the y-axis. The simulation results show that the stress in most of the flexure hinges is concentrated between 95.15 MPa and 190.3 MPa. In the second branch chain, the connecting hinge between the Z-type and L-type amplification mechanisms experiences the largest torsional load, with its maximum stress reaching 285.44 MPa. However, the distribution range of this high-stress area is very small, and the overall stress levels are below the allowable stress of 335.33 MPa for the material used in this study. This result verifies the structural safety of the end-effector when achieving maximum displacement motion along the y-axis.
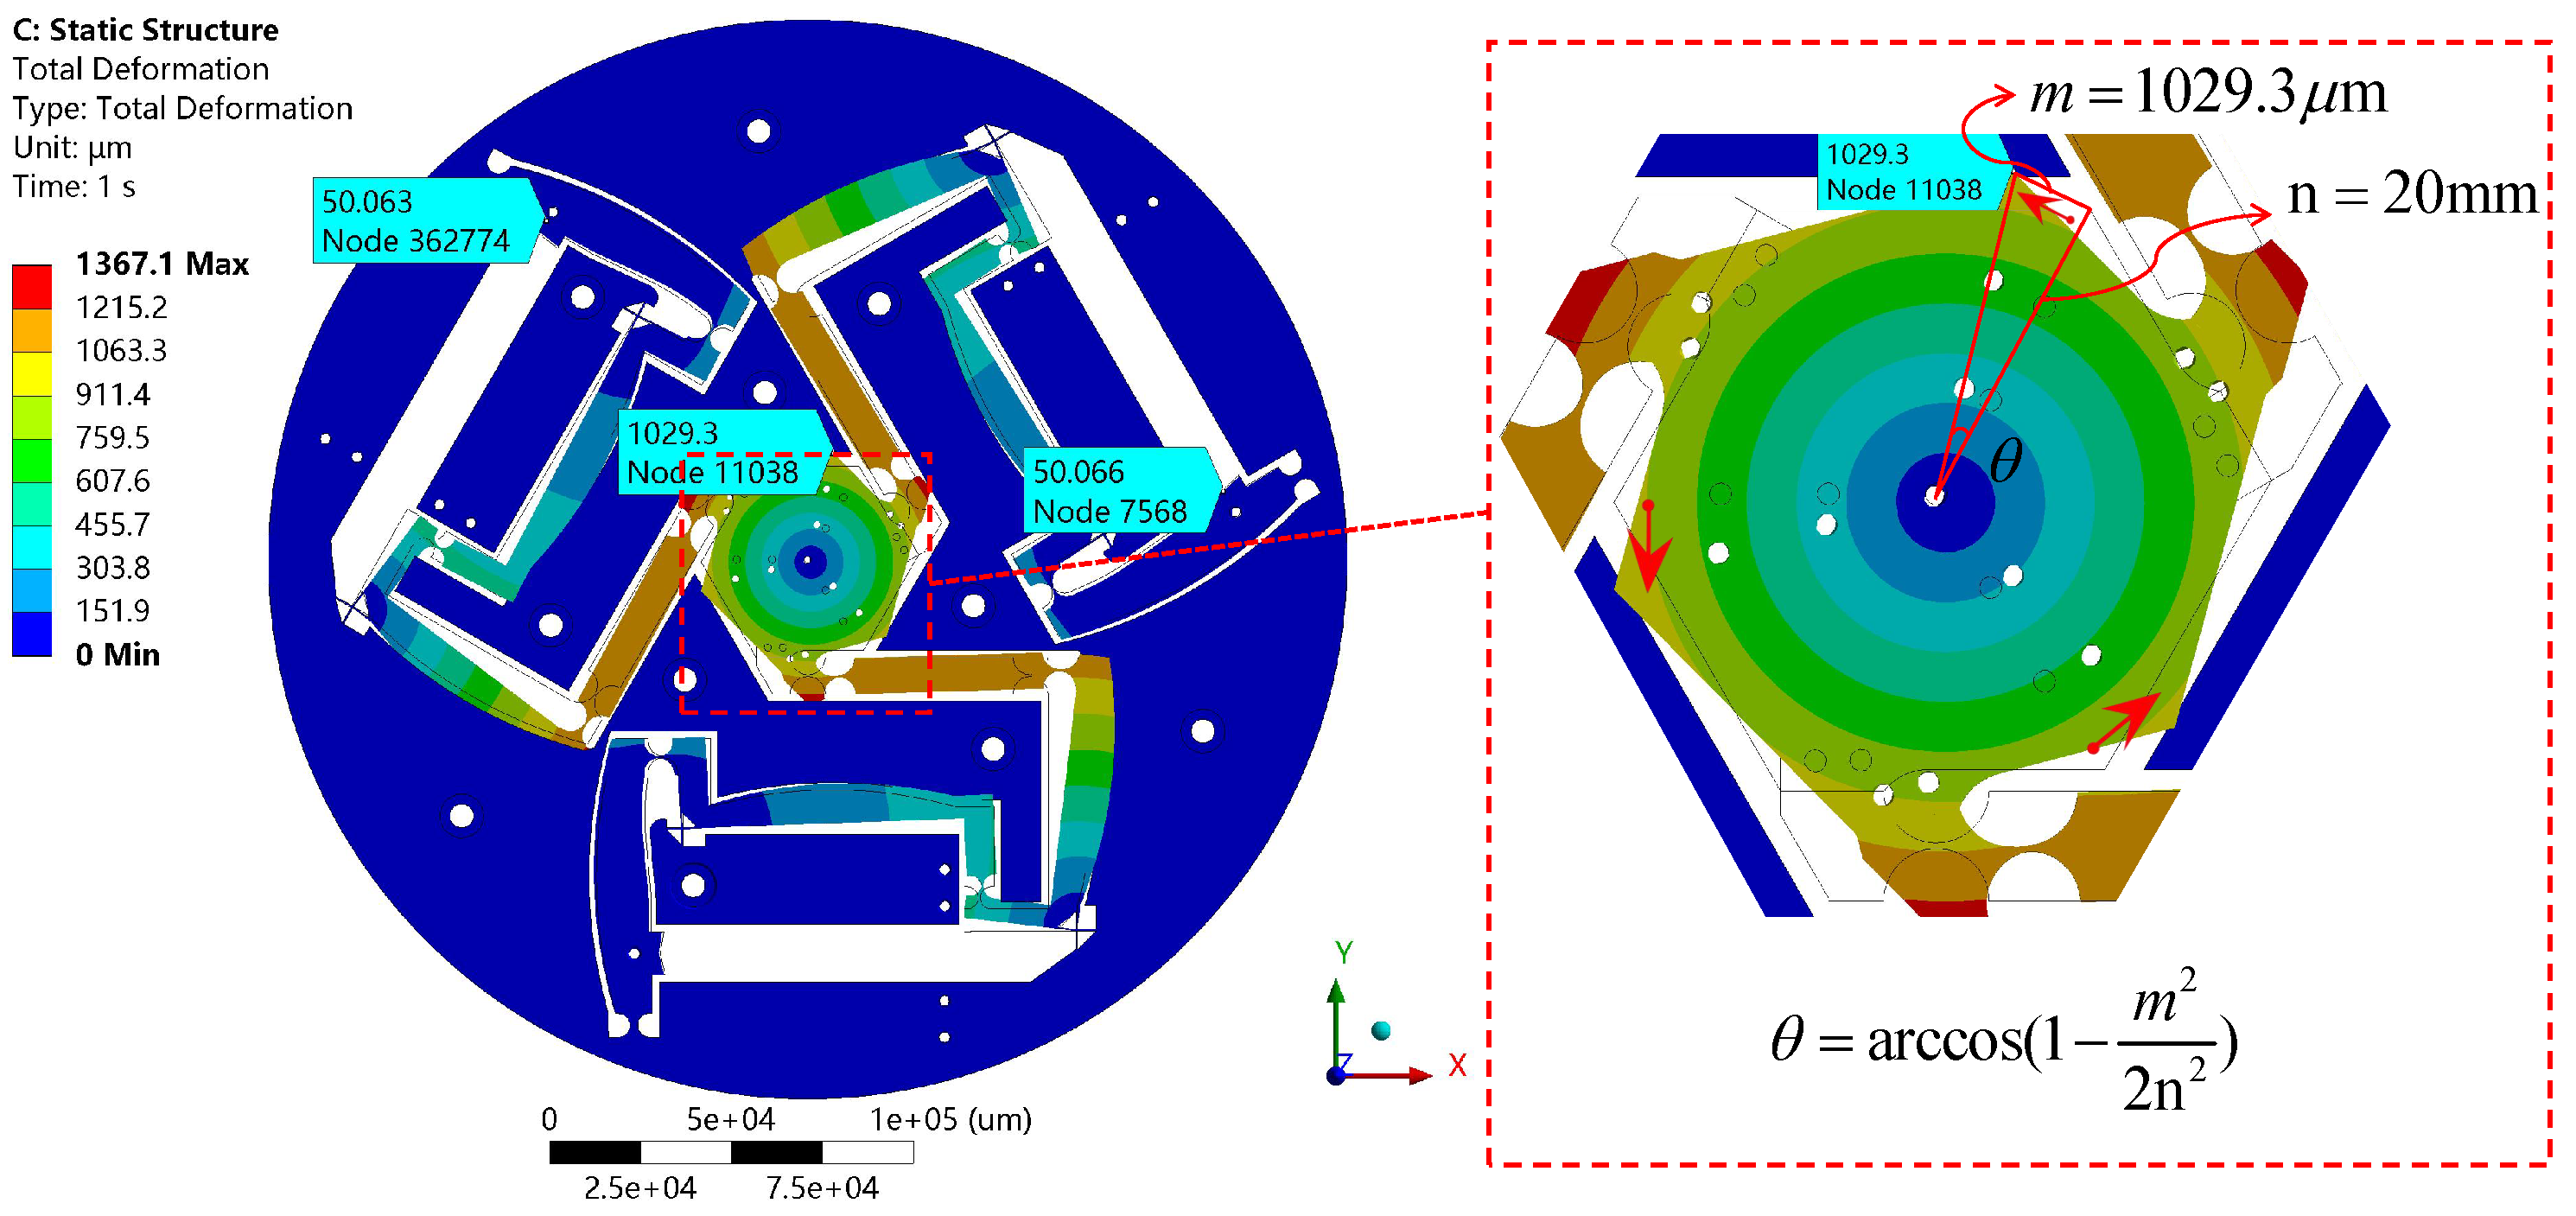
According to the results of Equation (
23), when
and all are maximized, the end-effector will exhibit a purely rotational motion confined exclusively to the z-axis, without any translational displacement, and is expected to achieve its maximum angular displacement in the counterclockwise direction. To verify the amplification effect of the end-effector’s rotation around the z-axis under the condition of limit motion, a displacement of 50
m is applied at the inputs
,
, and
, i.e.,
μm. In this case, according to Equation (
23), the theoretical amplification ratio for the end-effector’s rotational motion around the z-axis is 0.91. The rotational amplification ratio is defined as the ratio of the change in the end-effector’s rotational angle to the input linear displacement, representing the system’s rotational amplification capability. The actual simulation results, as shown in
Figure 16, indicate that, based on geometric relations and the cosine theorem, the simulation rotation angle is 51.47 mrad, with a simulation amplification ratio of 1.03 and an error of 11.65%. Additionally, the simulation results show that under this input condition, there is almost no parasitic motion along the x-axis or y-axis, which is attributed to the symmetry of the structural design, ensuring the positioning accuracy of the micro-positioning platform.
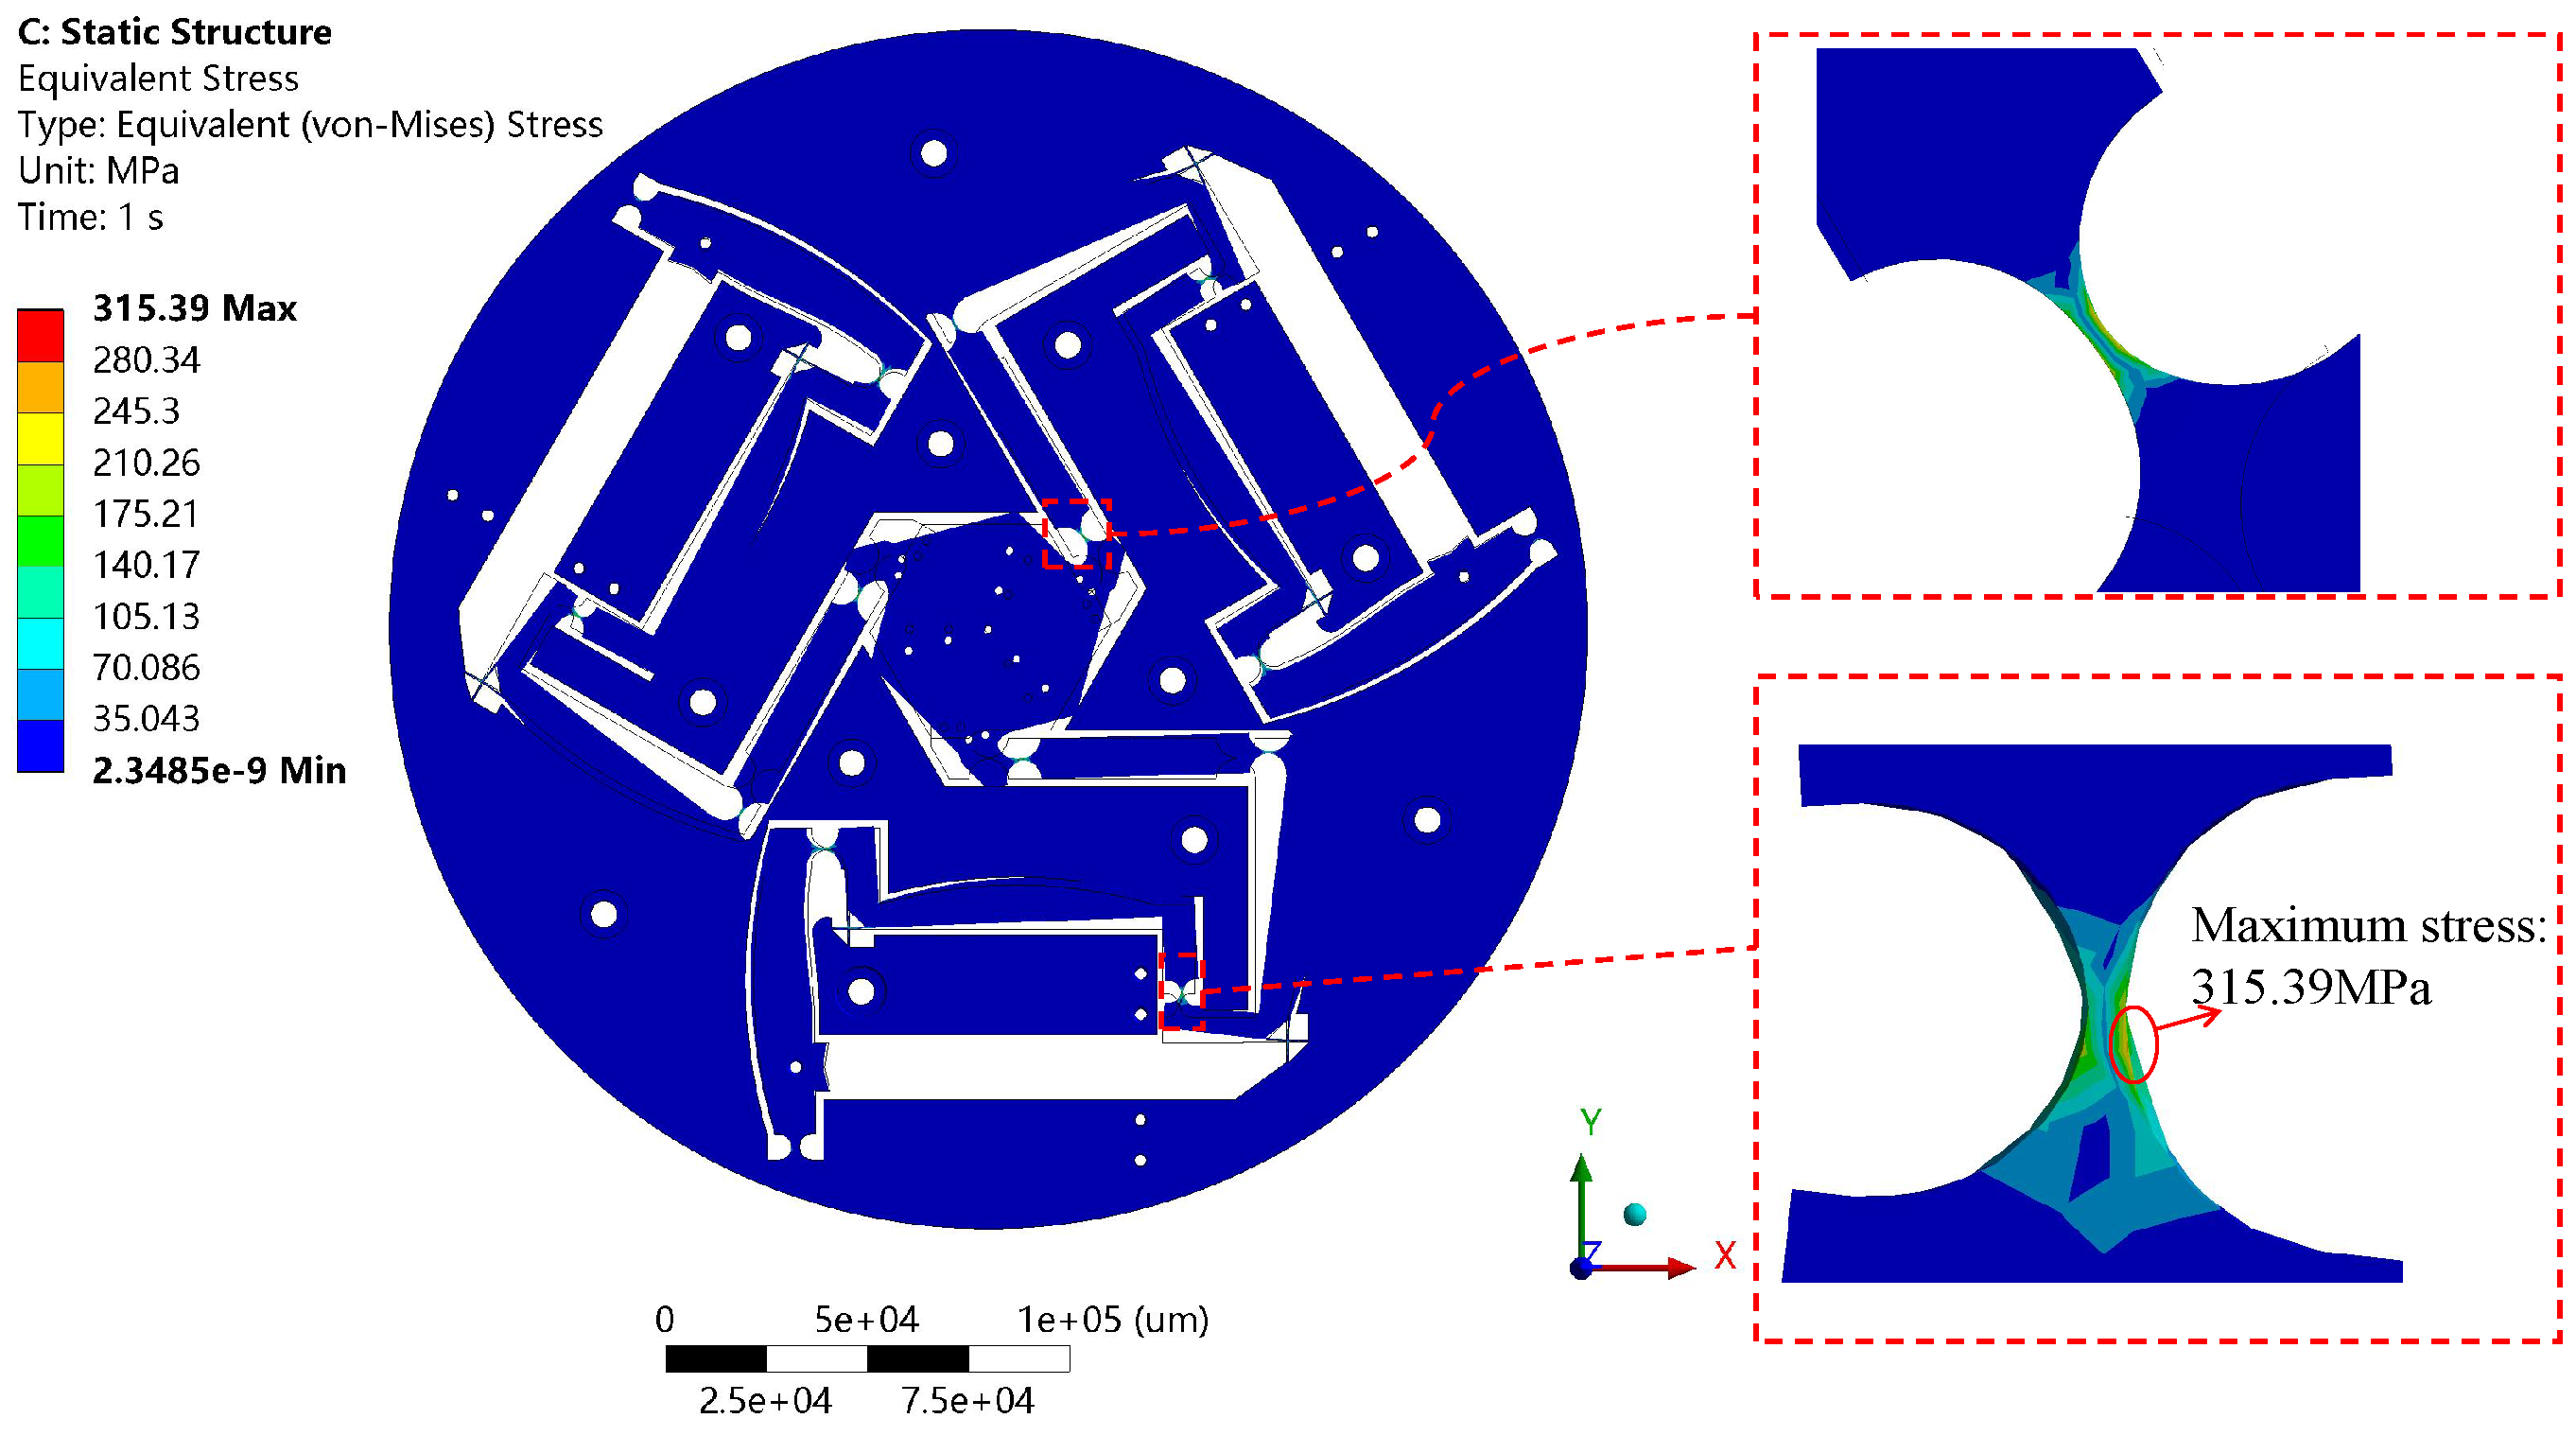
Figure 17 illustrates the stress distribution of the end-effector when it moves to the limit position during rotation around the z-axis. The simulation results show that the stress in most of the flexure hinges is concentrated between 105.13 MPa and 210.26 MPa. In each branch chain, the connecting hinge between the Z-type and L-type amplification mechanisms experiences the largest torsional load, with its maximum stress reaching 315.39 MPa. However, the distribution range of this high-stress area is very small, and the overall stress levels are below the allowable stress of 335.33 MPa for the material used in this study. This result verifies the structural safety of the end-effector when rotating to the maximum angle around the z-axis.
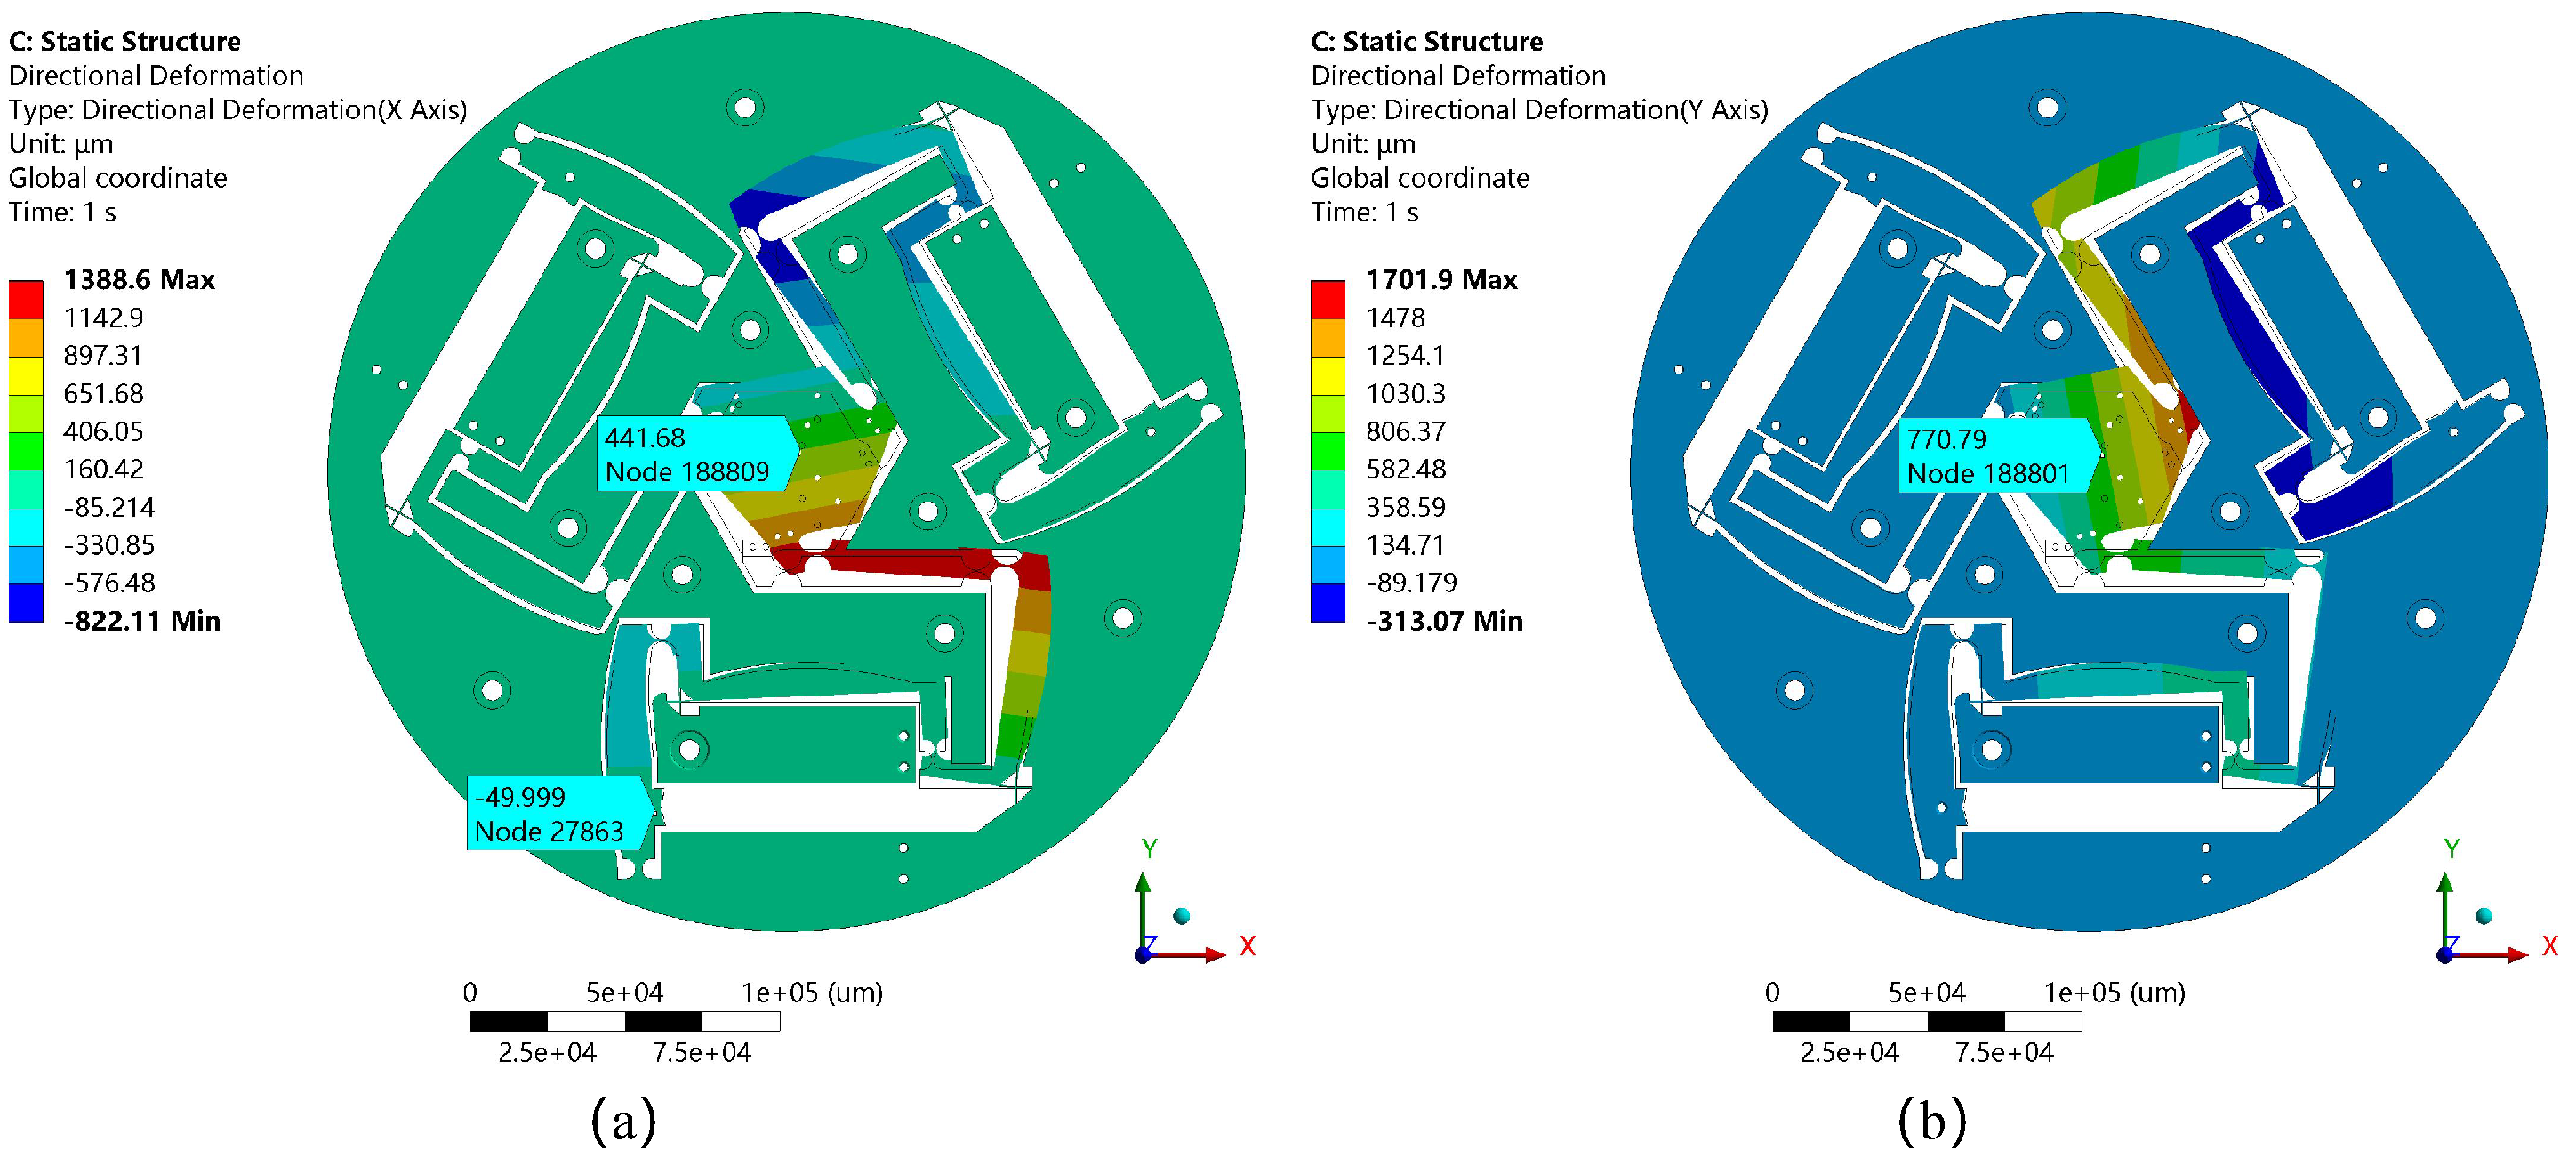
The above analysis has verified the feasibility and rationality of the designed micro-positioning platform in achieving the maximum displacement along each individual degree of freedom. However, in practical applications, the platform more commonly operates under a coordinated mode involving all three degrees of freedom, where the end-effector simultaneously performs translational motion along the x- and y-axes and rotational motion about the z-axis. To further evaluate the potential of the structure under such conditions, a combined input scenario was analyzed based on the results derived from Equation (
23), where
, and
. Under this setting, the end-effector is expected to translate along the x-axis, achieve its maximum displacement along the y-axis, and simultaneously rotate about the z-axis. The corresponding simulation results are presented in
Figure 18. Specifically,
Figure 18a shows that the displacement along the x-axis reaches 441.68
, with a relative error of 9.12% compared to the theoretical value.
Figure 18b illustrates a displacement of 841.78
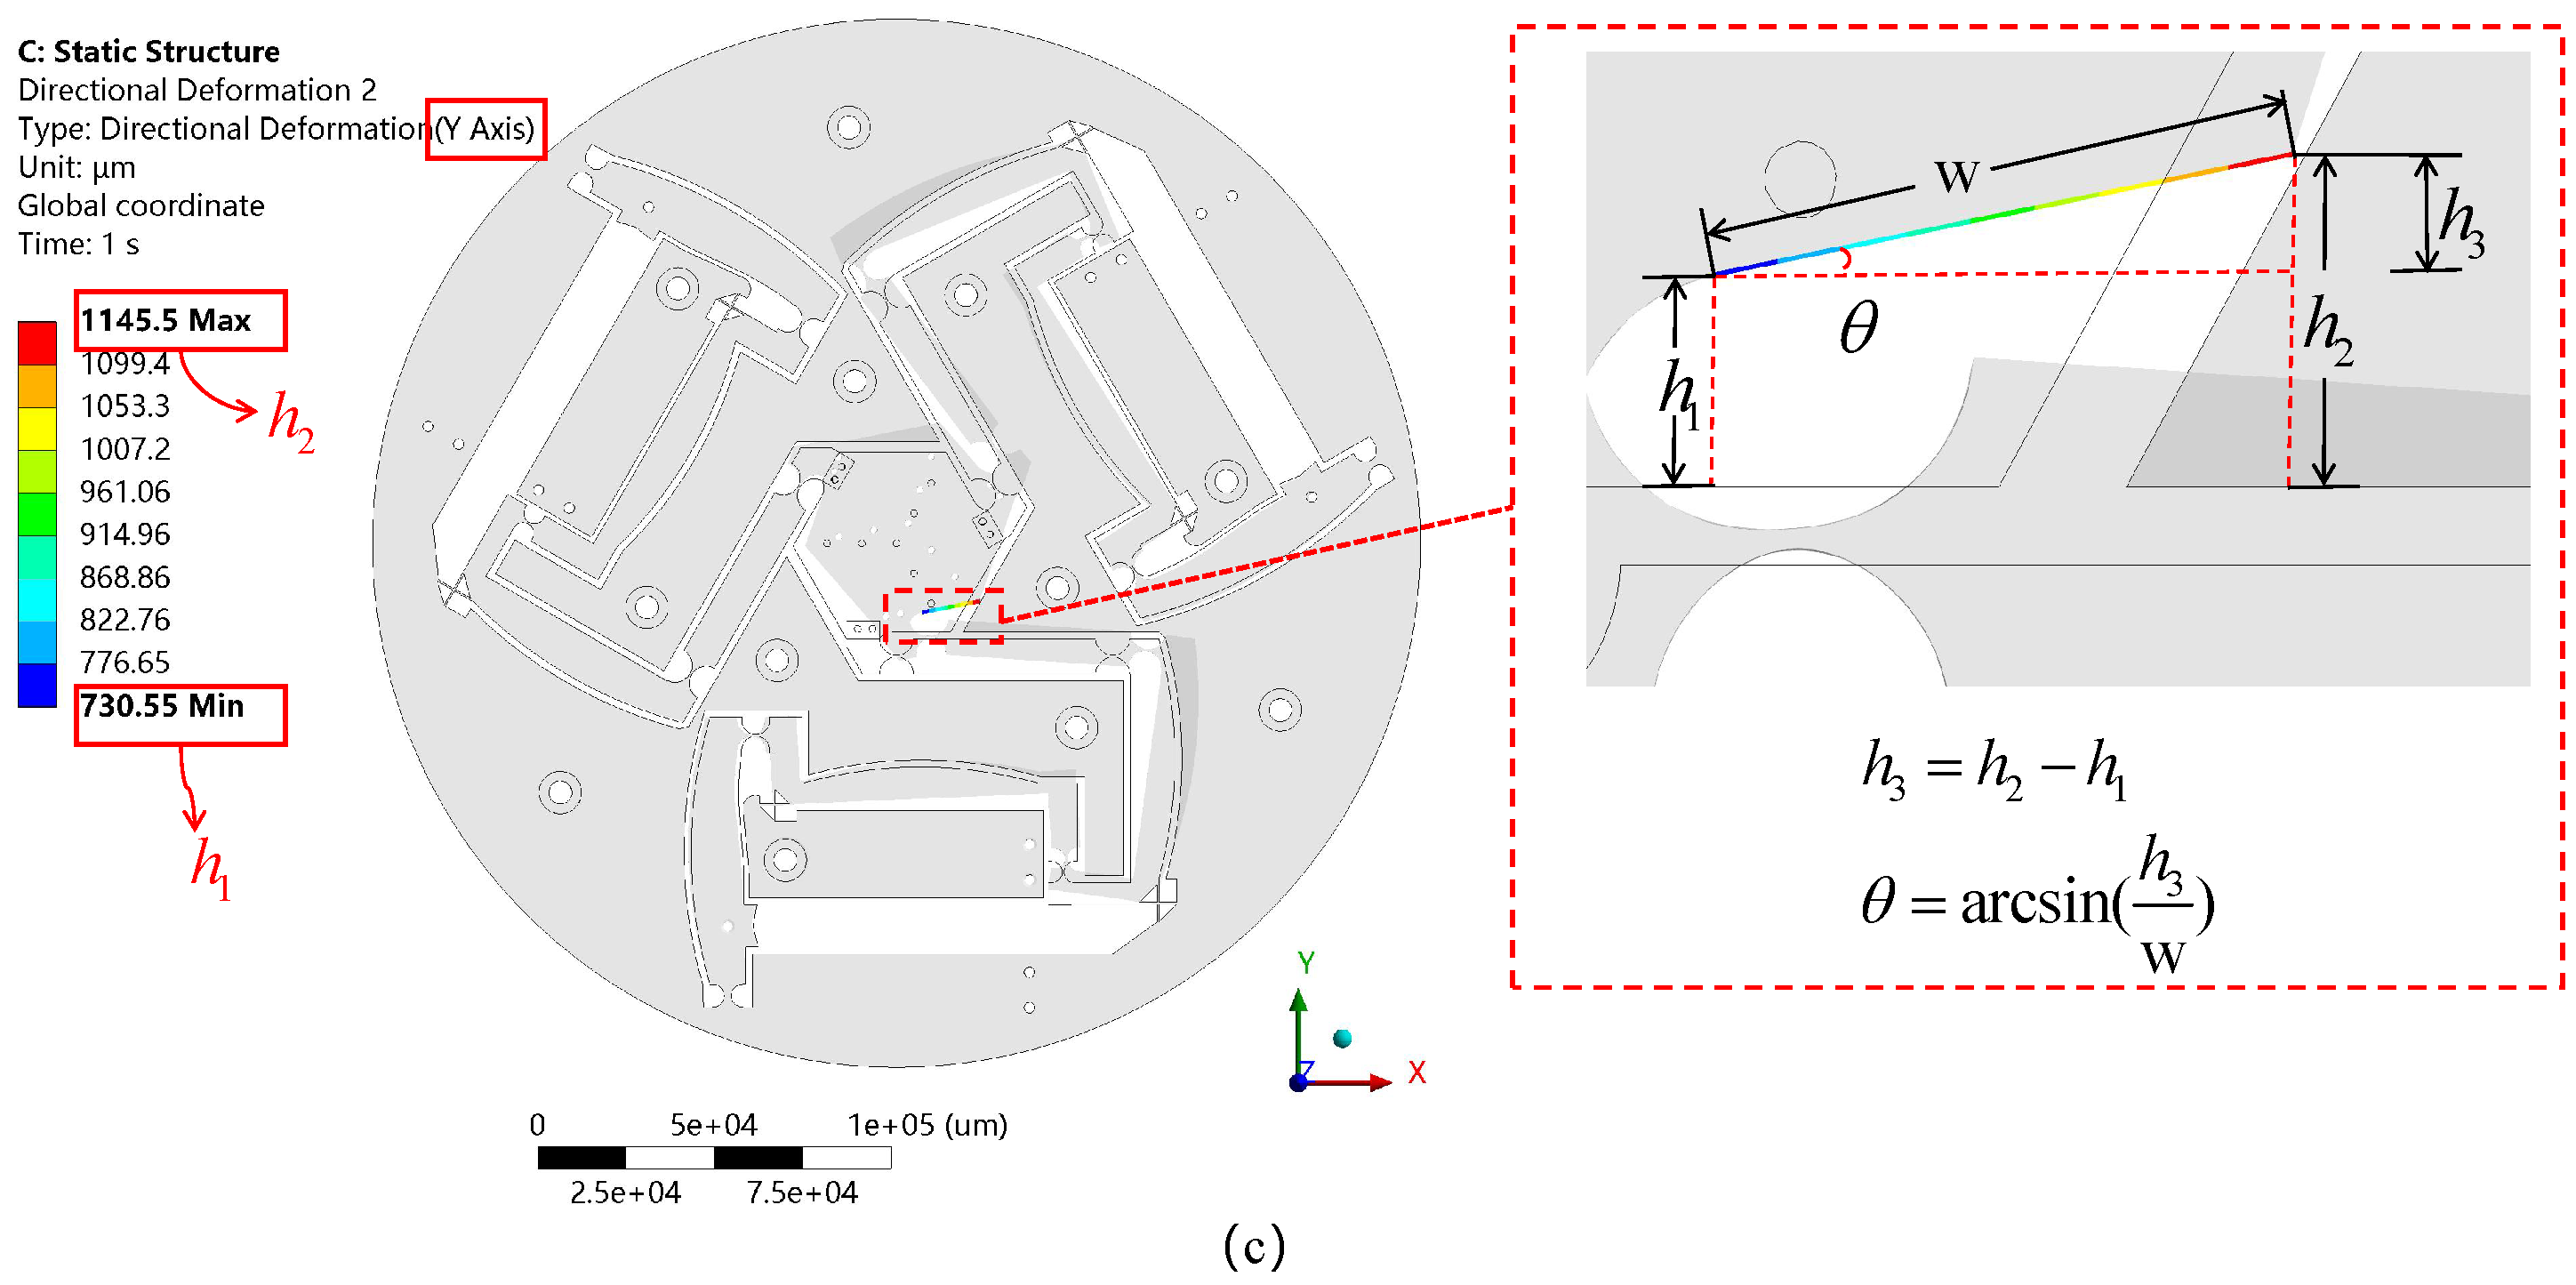
along the y-axis, corresponding to a relative error of 8.43%. In
Figure 18c, given the end-effector dimension w = 16 mm, the rotational angle about the z-axis is determined to be 25.94 mrad based on the simulation and conversion relationship, resulting in a relative error of 14.61%. It is worth noting that under the condition of simultaneous three-degrees-of-freedom actuation, the simulation errors are comparable to those observed in the individual maximum displacement cases, further validating the rationality of the structural design. Additionally, the stresses in each flexible hinge are within the allowable stress limits, ensuring structural safety. A detailed analysis of the error sources is provided in
Section 5.3.
5.3. Simulation Error Analysis
In
Section 5.2, Ansys finite element simulation is employed to analyze the displacement amplification ratio of the end-effector under the limit motion conditions of each degree of freedom, and further investigate the displacement behavior of the micro-positioning platform under coordinated three-degrees-of-freedom operation. The simulation results for each DOF are detailed in
Table 3. Here, the rotational amplification ratio is defined as the ratio of the change in the end-effector’s rotational angle to the input linear displacement; the corrected branch amplification ratio is defined as the amplification ratio obtained by back-calculating the simulated amplification ratio using Equation (
23), providing a more accurate representation of the amplification effect in that DOF.
When the branch chains are parallel to the end-effector, there are deviations of varying degrees between the actual motion range of each DOF transmitted from the branch chains to the end-effector and the theoretical calculation results. This also leads to a decrease or increase in the simulated amplification ratio for each motion direction. The sources of error are as follows:
(1) In the parallel structure, the motion of the end-effector is mainly constrained by the flexure hinges and of the three branch chains. In theoretical calculations, these hinges are idealized as purely rotational flexure hinges, but in reality, their limited rotational stiffness will, to some extent, restrict the transmission of displacement at the end-effector.
(2) In the parallel structure, as the stiffness of the input ends of the branch chains increases, a larger input force is required to achieve the same input displacement. This places higher demands on the first double-notch straight circular flexure hinge of each branch chain. Ideally, should only bear rotational motion, but its non-ideal performance results in a reduction in the displacement transmission efficiency of the first-stage amplification mechanism.
(3) When the input displacements of the three branch chains are the same, the simulated amplification ratio during the rotation of the end-effector around the z-axis is actually larger. The main reason for this is that the position and orientation of the connecting rod between the third-stage L-type amplification mechanism and the end-effector undergoes a skew change, which further transmits displacement to the end-effector, thereby enhancing the amplification effect.
It is worth mentioning that further reducing the stiffness of the flexure hinges
and
can, to some extent, reduce the amplification ratio error in the parallel configuration, but this will also lower the structural strength. Considering that the amplification errors under the limit motion conditions of each DOF are all below 12%, and the corrected branch amplification ratio is still as high as 26.25 at its lowest, this fully verifies the exceptional micro-displacement amplification capability of the designed micro-positioning platform. Furthermore, according to the simulation results presented in
Section 5.2, when the end-effector undergoes maximum displacement along the x- and y-axes, its rotational angle around the z-axis is slightly smaller than the theoretical value, with errors of 15.69% and 14.14%, respectively. These errors are generally consistent with the displacement losses observed under maximum motion along the x- and y-axes. The primary source of this deviation lies in the non-ideal stiffness characteristics of the flexure hinges
and
. Additionally, the theoretical model may inaccurately estimate the dynamic distance between the geometric rotation centers of the
hinges and the center of the end-effector under working conditions, leading to discrepancies in theoretical calculations. Nevertheless, in practical applications, the compliance loss caused by this error remains within an acceptable range for observation and manipulation tasks, which further verifies the rationality and reliability of the proposed structural model under coupled motion conditions.
At the end of
Section 5.2, when the end-effector performs coordinated three-degrees-of-freedom motion, the simulation results show that the relative errors of the end-effector’s displacement along the x-, y-, and z-axes are 9.12%, 8.43%, and 14.61%, respectively. These errors are highly consistent with the results under the limit motion conditions of each degree of freedom, and the sources of the errors are also similar, further validating the feasibility and rationality of the structural design under coordinated three-degrees-of-freedom operation.
5.4. Natural Frequency Analysis
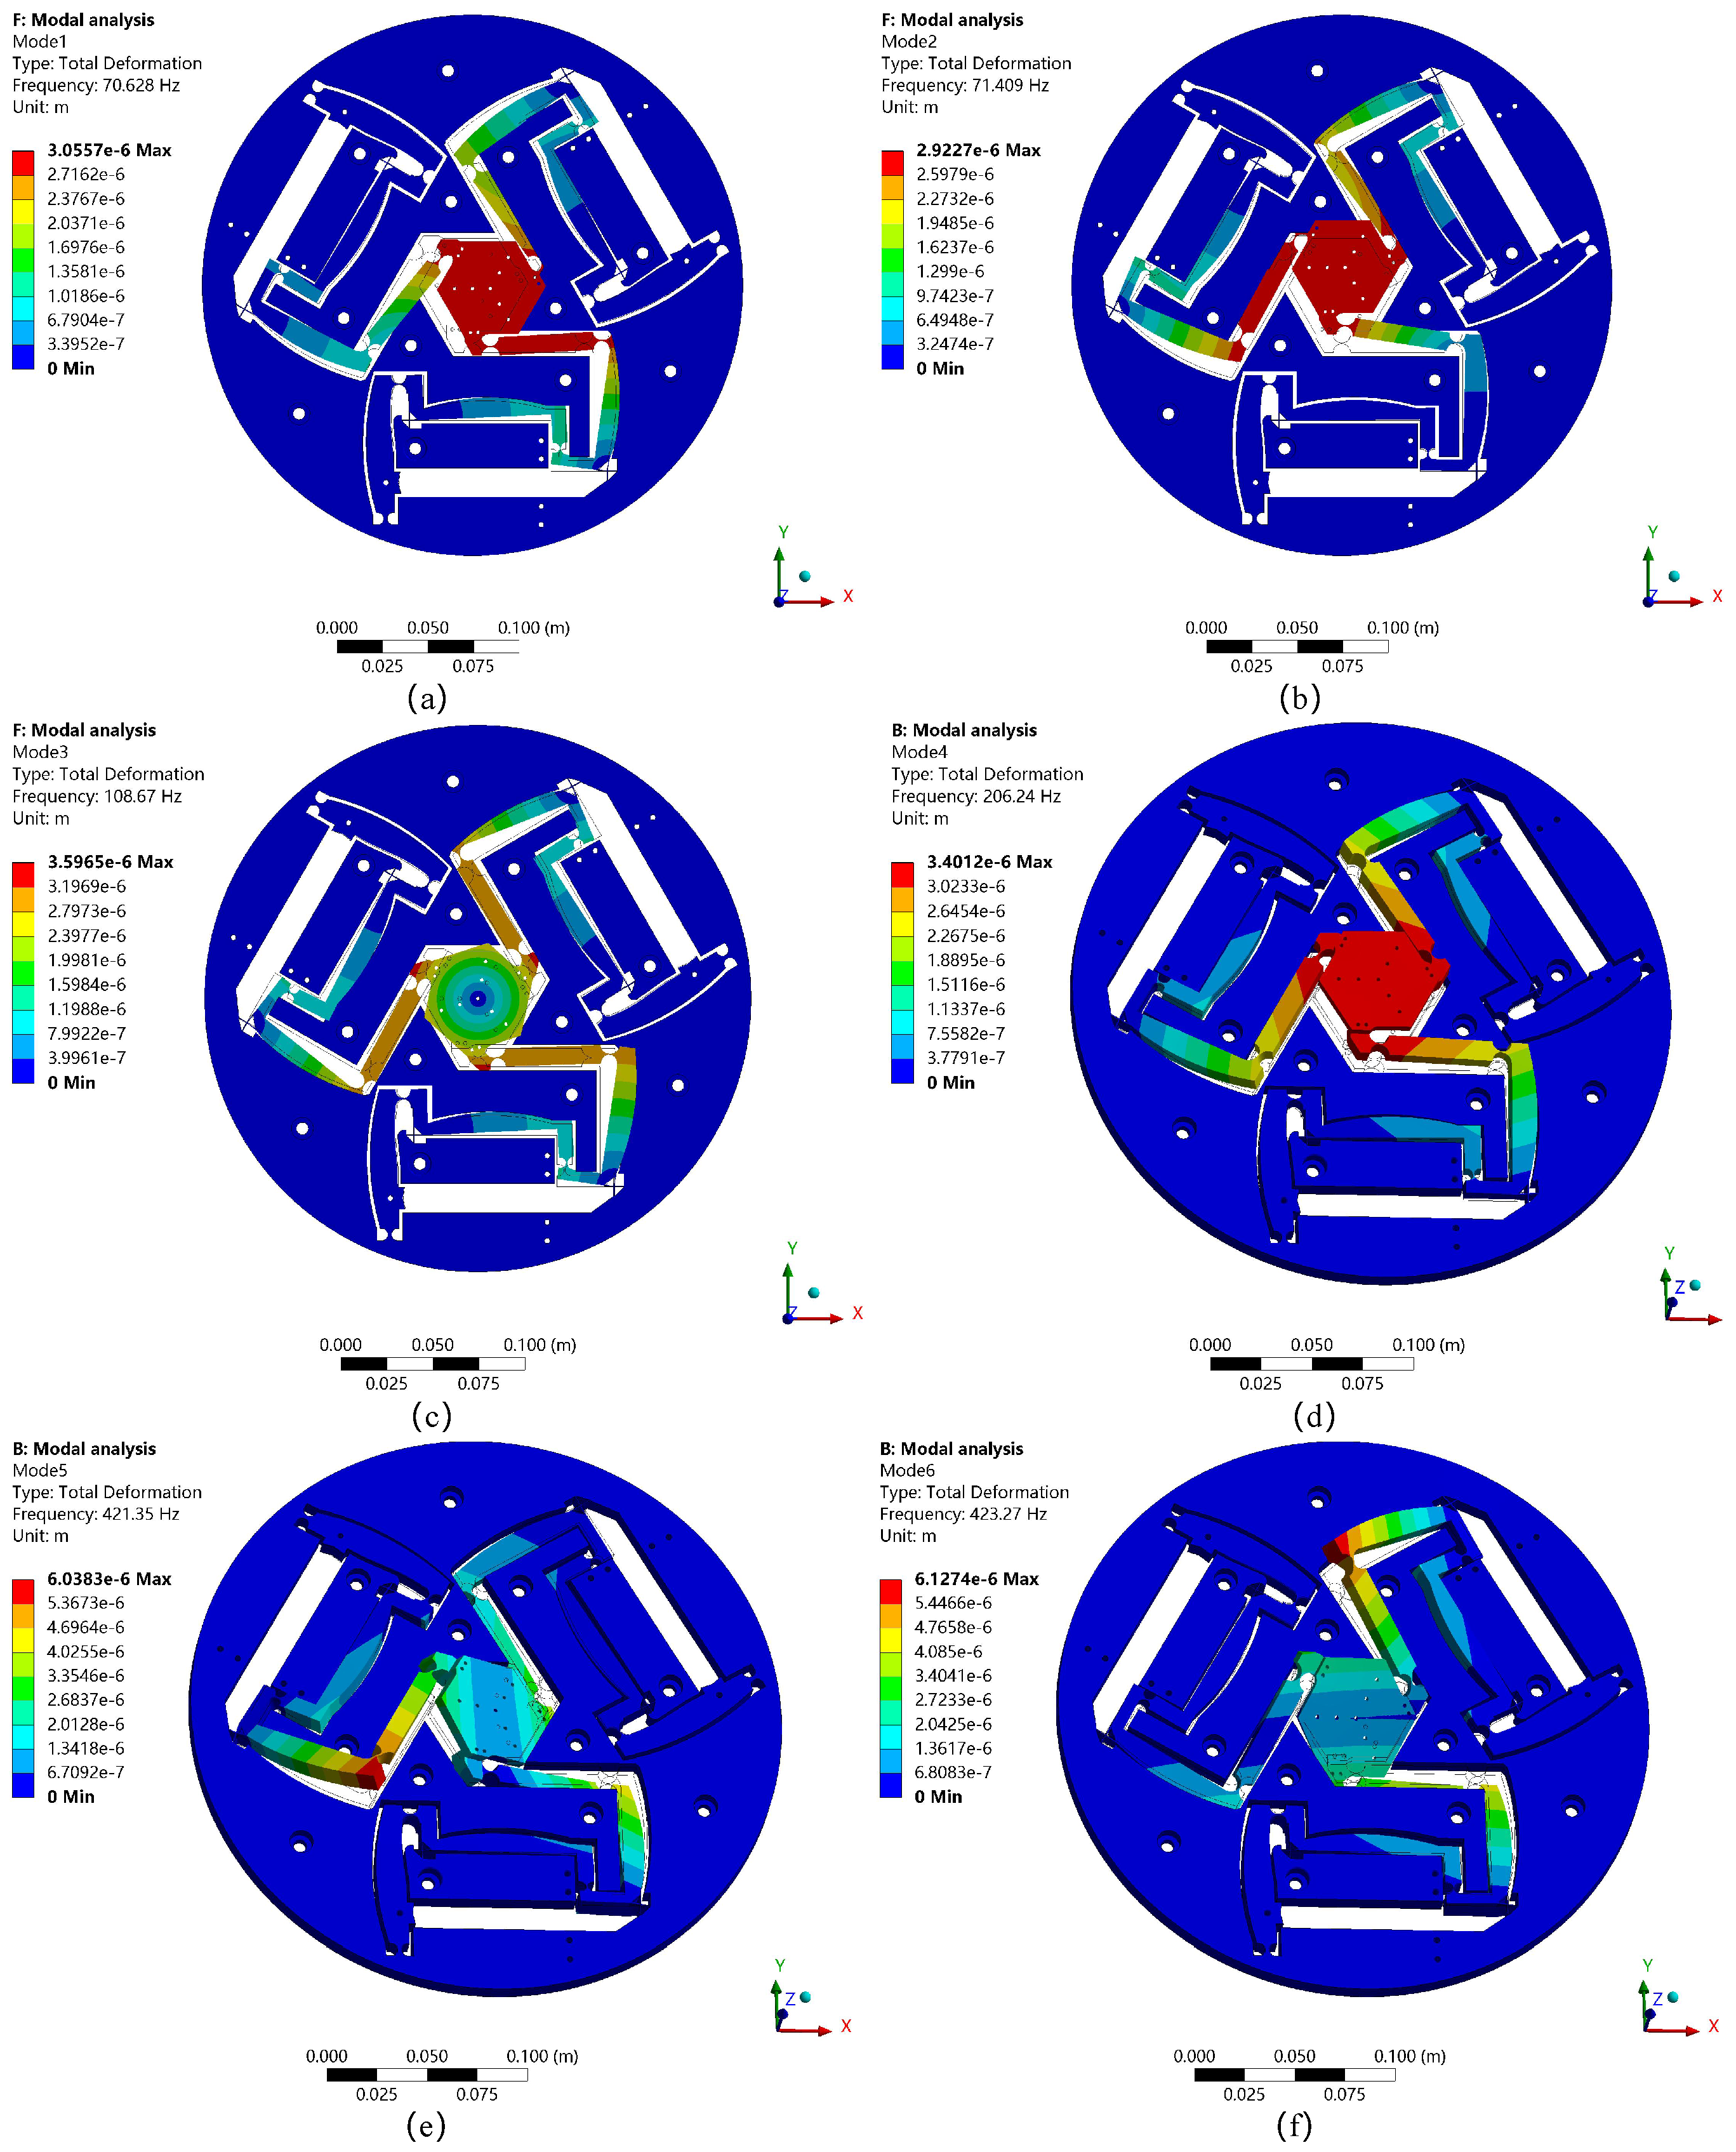
To evaluate the dynamic characteristics of the micro-positioning platform, a modal analysis was performed on the structure using the Ansys finite element simulation software, and the first six vibration modes were obtained, as shown in
Figure 19. The results indicate that the first three modes primarily reflect the translational motion of the micro-positioning platform along the x-axis and y-axis, as well as rotational motion around the z-axis. The inherent modal characteristics are generally consistent with the design expectations, thus verifying the rationality of the structural design in terms of dynamic characteristics. It is worth mentioning that the simulation results show that the natural frequency of the fourth mode is approximately 89.8% higher than that of the third mode. This significant frequency gap effectively prevents higher-order modes from interfering with the working mode, thereby enhancing the system’s dynamic stability and anti-resonance capability.
A comparison of the simulated natural frequencies of the first three modes with the theoretical calculation results is shown in
Table 4. As seen from the data in the table, when the end-effector moves along the x- and y-axes, the natural frequency error between the theoretical calculation and simulation testing is relatively small, while the error for the third mode is relatively large. However, overall, the simulation results are in good agreement with the theoretical calculations, verifying the feasibility of the designed structure. Possible reasons for the natural frequency errors are as follows:
(1) The rotational stiffness formula for the hinges used in the theoretical calculation has some discrepancies with the actual situation, while the finite element simulation, through refined solid element modeling, more accurately represents the local plastic strain distribution and multi-directional stiffness coupling effects in the stress concentration areas of the hinge roots. This allows a more realistic reflection of how the generalized stiffness matrix influences the system’s motion accuracy non-linearly.
(2) The theoretical model based on the small-deformation assumption does not account for higher-order infinitesimal terms and geometric non-linear effects (such as rotational center drift) when estimating the hinge’s rotational angle. Although the end displacement is in the micrometer range, the linearization of the dynamic model may still lead to parasitic motion errors, causing some theoretical deviation.
(3) The theoretical model simplifies the parallel branch chains as a 3-PRR kinematic chain and idealizes the distributed flexure hinges as rotational pairs, without fully considering the stiffness anisotropy caused by the kinematic coupling between the branches. In the actual system, the time-varying stiffness characteristics of the flexure hinges (such as the local strain energy gradient changing with the end-effector’s position) and the over-constrained redundant internal force field between the branches significantly affect the system’s equivalent stiffness ellipsoid shape. Such non-linear effects are difficult to accurately represent under the rigid body replacement assumption, leading to significant discrepancies between the theoretical calculation and simulation results for the third mode.
5.5. Reachable Workspace Calculation
In the structural design phase of this paper, the PEA (model PSt150/5/60VS10, Core Tomorrow Co., Harbin, China) selected can provide a nominal output displacement of 60
m at a maximum driving voltage of 150 V. Considering input stiffness, system stability, and driving safety margin, a conservative approach was adopted in calculating the reachable workspace, with the maximum input displacement set to 50
m to more accurately reflect the performance of the micro-positioning platform under practical working conditions. Referring to
Table 3, the minimum value of the corrected branch amplification ratio, 26.25, was taken as the amplification ratio. Using Matlab computational tools and a Monte Carlo-based searching method, the workspace was calculated combined with Equation (
22), and the result is shown in
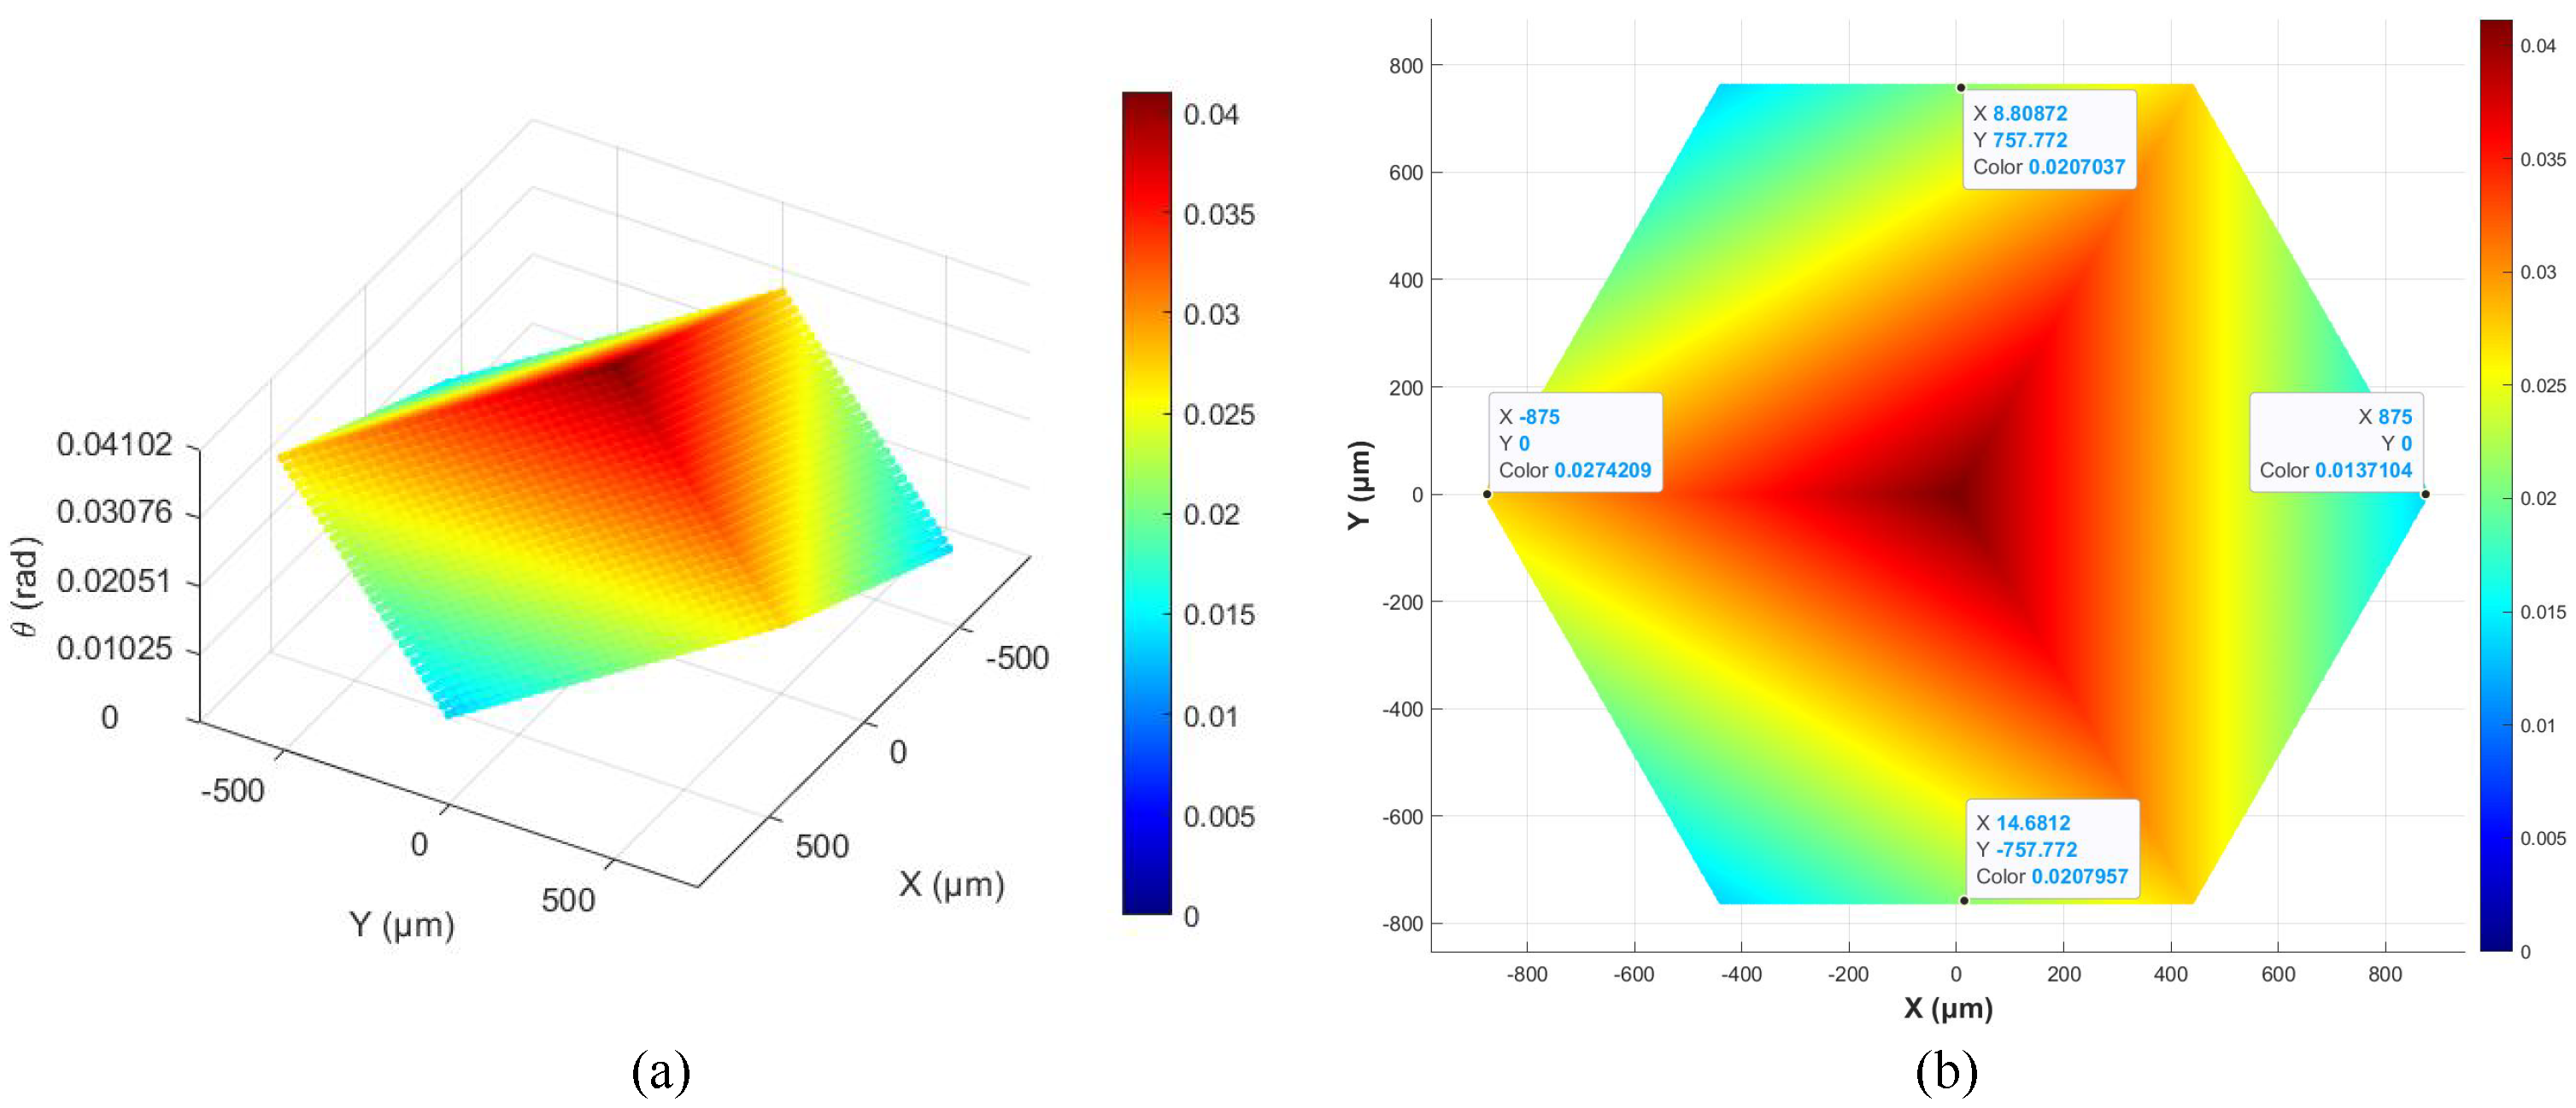
Figure 20.
As shown in
Figure 20a, within the input displacement range of 0–50
m, the maximum rotation angle of the end platform is 41.02 mrad.
Figure 20b shows that the movement range of the platform along the x-axis is ±875
m, while the movement range along the y-axis is ±757.8
m.
5.6. Performance Comparisons Between Different Piezoelectric Platforms
Table 5 presents a comparative analysis of the key performance indicators of the 3-DOF parallel micro-positioning platform designed in this paper and four existing typical parallel micro-positioning platforms based on amplification mechanisms. Given that all the performance data in this work are derived from finite element simulations, the comparison is also conducted using simulation results from other platforms to ensure fairness and consistency, thereby avoiding unnecessary errors caused by experimental factors such as noise interference, machining inaccuracies, and assembly deviations. Yuan et al. [
18] proposed a two-DOF micro-positioning platform based on a lever amplification mechanism, achieving an amplification ratio of 21.8, but its workspace did not show significant expansion. Zhang et al. [
19] effectively expanded the platform’s workspace by combining amplification mechanisms with spatial design methods. Nevertheless, the overall structure was relatively complex, and due to inherent structural limitations, the actual usable workspace experienced up to 45% displacement loss, with similar degradation observed in the amplification ratio. The hollow structure proposed by Kim et al. [
20] demonstrated certain advantages in micro-positioning applications, especially in terms of operational convenience, but its amplification ratio was relatively limited. Wang et al. [
21] also designed a 3-DOF micro-positioning platform based on a lever mechanism, achieving an amplification ratio of 9.11, but the workspace still has potential for improvement. In contrast, the platform proposed in this paper strikes a balance between compactness and functionality in its structural design, providing a larger output stroke and good structural stability. While achieving a maximum amplification ratio of 17.5, the coupling ratio is effectively controlled within 1.25%, and the platform structure offers excellent light-transmission conditions, showing good adaptability and potential for applications in precision operations and other scenarios.
5.7. Future Work
Although the feasibility and performance of the designed micro-positioning platform have been validated through finite element simulations, we recognize that simulation alone is not sufficient to comprehensively evaluate the system’s actual performance under real operating conditions, particularly considering the influence of the piezoelectric actuator’s characteristics on the actual maximum input displacement at the input end. Despite the platform’s highly symmetrical structural design and the implementation of a two-stage vibration isolation scheme, factors such as environmental noise, manufacturing tolerances, and assembly errors may still affect system performance in practical applications. Therefore, future work will focus on prototype development and experimental verification, comparing simulation and experimental data to gain a deeper understanding of the platform’s performance under real operating conditions. Based on experimental feedback, we will further optimize the structural design, particularly in terms of balancing structural stability, working space, and motion accuracy. Additionally, we will assess the platform’s adaptability in various application scenarios to ensure its reliability and versatility in complex environments. To further improve system performance, we plan to explore methods for expanding the platform’s working space and amplification ratio based on experimental results, while also working to minimize positioning errors caused by the non-ideal characteristics of flexure hinges. Furthermore, we will incorporate intelligent control algorithms to achieve adaptive adjustment of the platform under varying parameters, significantly enhancing its positioning accuracy and operational stability. We believe that with continuous experimental validation and iterative optimization, this micro-positioning platform will demonstrate strong potential in large-range, high-precision positioning applications, providing a solid foundation for related precision tasks.


