Abstract
The preservation and continuous monitoring of cutting tools in a computer numerical control (CNC) machine is essential for ensuring seamless transitions in the manufacturing workflow, as well as maintaining adequate part quality. The implementation of tool condition monitoring (TCM) when milling can provide the user with necessary data regarding tool life, wear, and part quality. However, it is important to broaden the application of the TCM process across a much broader class of workpiece materials to understand the effects of material properties on the condition of the tool. The aim of this paper is to investigate the efficacy of tool condition monitoring techniques while milling low- and high-yield-strength materials across varied process parameters. A Fast Fourier Transform (FFT) analysis was conducted in this research. Vibration data were acquired from both uniaxial and triaxial accelerometers to investigate irregularities in vibrational amplitudes between new and worn milling tools. The experimental results show that there is a significant increase in vibrational amplitudes for the worn tool when compared to the new tool across various frequencies, which affirms the expected increase in vibrations and cutting forces at the tool–workpiece interface from using a worn tool. The F-values and p-values calculated using an F-test with a 95% confidence interval indicated statistically significant differences in vibration data between new and worn tools across various materials, including polyurethane foam, aluminum 6061, mild steel, and stainless steel, under different cutting conditions (low, medium, and high). These results further validate the findings obtained from the FFT analysis and highlight the effectiveness of vibration-based monitoring in distinguishing tool wear under varying material characteristics and machining conditions.
1. Introduction
Understanding the health and capabilities of manufacturing assets is critical to optimize performance, maintain adequate part quality, and to aid in data-driven decision making in the manufacturing industry [1]. CNC machines are highly utilized in industry as they can carry out various types of cutting processes, such as end-milling, drilling, slotting, grinding, and turning processes. The market for milling machines alone accounts for USD 17.25 billion and is expected to reach USD 21.55 billion by 2026 in the United States [2]. The automotive and aerospace sectors employ the highest number of milling machines by far compared to other industries. Milling can be used to manufacture parts with a wide range of slots, grooves, and threads, and many more complex designs. The tools used in milling processes undergo excessive wear over the duration of the cutting process and can fail prematurely if cutting parameters and tool wear are not accounted for.
As the cutting parameters vary with each process, it is critical to monitor and detect tool wear. Tool breakage can cause unscheduled maintenance stops, which leads to machine downtime. In fact, tool failure accounts for almost 7–20% of total machine downtime and tool changes can account for 3–12% of the total machining costs [3]. To circumvent such losses, an effective tool wear detection and tool replacement strategy needs to be implemented. Tool Condition Monitoring (TCM) has emerged as one of the most effective techniques to monitor the condition of cutting tools used in the machining process [4]. This will allow the machinist to consistently monitor tool wear and replace the cutting tool when necessary. Over the years, researchers have studied and experimented on a multitude of ways to detect tool wear. Online tool condition monitoring is an important technique as it helps in realizing the health and capability levels of a fully automated manufacturing system. A study conducted by Dimla Sr and Lister [5] shows that tool wear occurs in combination with the predominant wear mode, dependent upon the cutting conditions, workpiece material, and the geometry of the tool itself. The techniques used to monitor tool wear are broadly classified into two types: direct sensing and indirect sensing. Although direct sensing methods provide a visual reference for the condition of the cutting tool, indirect sensing methods have been employed more frequently by researchers, due, in part, to more sensors and cutting tool data being readily available to the user. Table 1 summarizes the benefits and disadvantages of both types of sensing techniques.

Table 1.
Comparison between direct sensing and indirect sensing methods [6,7].
Direct sensing methods have been shown to hold certain advantages over indirect methods. Optical, radioactive, proximity, and touch-trigger probe sensors are some of the sensors used in direct sensing methods. Indirect methods make use of the data obtained when the tool is actively engaged, since they involve recording a variable that can be correlated to tool wear. Methods include sensing cutting forces, acoustic emissions, spindle motor current, and depth of cut. Dimla and Lister [5], for example, used a Kistler mini accelerometers (type 8703 A) to measure tri-axial acceleration signals and the Kistler tool dynamometer (type 9263 A) to measure the cutting force with respect to the three planes. With the sensor data, the authors were able to obtain a correlation between the spindle speed, feed rate, and forces acting on the axes. This helped in plotting wear-time plots for different configurations of spindle speed and feed rate.
Zhou and Xue [8] discuss both direct and indirect sensing methods and implemented indirect sensing methods in their experiments. The use of indirect sensing methods initially requires an appropriate sensor configuration, which extracts the necessary features for the user to create a robust model to monitor the state of the cutting tools. Sensor configuration can be achieved with a single sensor or a multi-sensor setup. A single sensor setup includes cutting force, vibration, motor current, and acoustic emission sensors. Other sensors, such as sound and temperature sensors, have not been effectively utilized due to the high degree of noise that results from the ambient conditions. A number of studies have shown that the cutting force is very sensitive to the condition of the tool. Wang and Wang [9] showed that the tool wear data obtained through force sensors was the most stable and reliable signal. Yin, et al. [10] used a piezoelectric dynamometer and a rotary dynamometer to determine how reliable these signals were, and they observed similar trends to those observed by Wang and Wang [9]. However, Koike, et al. [11], through their study, established that force sensors interfere with the motion control of the spindle and also reduce its rigidity. The authors also mentioned that, in some cases, the expense of using a dynamometer can lead to skyrocketing manufacturing costs, which can ultimately limit its implementation.
Vibration sensors tend to be very inexpensive, are easy to install, and provide a similar data signal to that of the force sensors. It was also determined that sharp tools have lower vibrations in comparison with tools that are blunt. A study conducted by Hsieh, et al. [12] showed that vibration (acceleration) signals could differentiate between tool conditions during milling, provided they were used in conjunction with appropriate feature extraction techniques. However, the fundamental characteristics of the milling process limit the accuracy of the vibration sensor. Firstly, these sensors cannot always distinguish between vibration signals arising from the milling process and those arising from the air-cutting process (where no material is removed). Secondly, signals obtained by the vibration sensors are difficult to filter, as observed by Gao, et al. [13].
As tool wear increases, the servo motor tends to draw more current to make up for the increase in cutting force. The study conducted by Madhusudana, et al. [14] demonstrates that current sensors provide TCM data that are fairly comparable to cutting force sensor data. Also, these sensors are less susceptible to ambient and environmental noise, making the data more accurate. Lee [15] demonstrated that, at high spindle speeds, the current sensor data were not as usable, as few changes were observed in the cutting force. Thus, current sensors are not consistently suitable for processes utilizing high spindle speeds.
Acoustic emission sensors provide data that are suitable for milling processes, as these signals have not been influenced by other mechanical effects (e.g., spindle or tool holder vibrations). These signals also propagate at a higher frequency than that of the cutting force sensors, thus reducing interference. Zhou and Xue [3] showed that when acoustic emission sensors are placed on top of the tool holder, they provide accurate crater wear data. However, these sensors are highly susceptible to environmental/ambient noise, making it much more difficult to filter out data signals.
The literature review highlights that using individual sensors in tool condition monitoring systems can present significant challenges. In some cases, such as acoustic emission sensors, the drawbacks outweigh the advantages, making them less suitable for standalone use. As a result, many researchers have increasingly shifted towards a multi-sensor approach. This configuration integrates multiple sensor types, enhancing the depth and diversity of the information collected. While this approach may introduce some redundancy in the signals, it significantly improves the accuracy and reliability of TCM methods. Ghosh, et al. [16] conducted a study wherein they made use of five sensors (cutting force, vibration, motor current, acoustic emission, and thermal sensors) and discovered that the force sensor contains more useful and accurate information than the other sensors. Therefore, it is critical to identify the ideal type and number of sensors to be used in combination for a specific milling process.
Table 2 shows that vibration sensors are most commonly used out of all the sensor types, making them a reliable option for TCM. Studies conducted by Bahr, et al. [17] and Wang and Wang [9] focused on using indirect sensing techniques (vibration and cutting force sensors) to monitor the health of the tool during the milling process. Mannan, et al. [18] investigated a combination of direct and indirect sensors that could adequately monitor tool wear by inspecting the surface of the workpiece instead of the tool itself. Although several TCM machining experiments have been conducted, the workpiece material largely remained the same throughout the experiments. Okokpujie, et al. [19] conducted TCM experiments considering only aluminum, whereas Özbek and Saruhan [20] and Alonso and Salgado [21] conducted experimental studies involving TCM for steel and titanium, respectively. To broaden the applicability of TCM, alternative materials should be considered, as industries tend to focus on carrying out multiple machining operations each day on a multitude of materials.
Table 2.
Various sensor configurations employed in TCM research between 2000 and 2022.
For example, a manufacturer from the automotive sector can work with lightweight materials including carbon fiber, magnesium alloys, and fiber-reinforced plastics, whereas the aerospace industry uses materials such as stainless steel, aluminum 6061, and titanium alloys, which are lightweight and have a higher yield strength. Although the use of tool condition monitoring for higher-yield-strength materials has been extensively studied over the years, the literature addressing its application to lower-yield-strength materials is limited. Monitoring tool wear is crucial when machining low-yield-strength materials like polyurethane foam, as even slight tool degradation can lead to a poor surface finish and dimensional inaccuracies.
As manufacturing processes utilize a wide array of materials tailored to specific applications, this research aims to evaluate the effectiveness of tool condition monitoring techniques in assessing the performance of cutting tools when used on materials with varying yield strengths. Cutting tools are essential for maintaining smooth manufacturing workflows and ensuring the quality of machined components. By extending the scope of TCM to include workpiece materials with lower yield strengths, such as polyurethane foam, this study addresses a critical gap in the understanding of how these alternative materials influence tool behavior. This expanded perspective provides valuable insights into tool life and wear, ultimately contributing to improved maintenance strategies, optimized machining operations, and broader applicability across industries and machining processes.
2. Material and Methods
In this research, end milling was carried out on aluminum 6061, polyurethane foam, 17-4 stainless steel and A36 mild steel samples using an LMV-400 3-axis milling machine (Levil Technologies, Oviedo, FL, USA) having a spindle power of 110 VAC 15 A, and a maximum spindle speed of 14,000 RPM. These materials allowed for an investigation of tool wear when milling low- and high-strength materials. As depicted in Figure 1, five slots (each measuring 101.6 mm in length, 5 mm in depth, and 7.93 mm in width) were milled into each material at three distinct cutting speeds—low, medium, and high—tailored to the specific material type. Each slot was machined incrementally using multiple 1 mm depth-of-cut passes until the full 5 mm depth was achieved, with the total machining volume for each workpiece being 20,142 mm3.
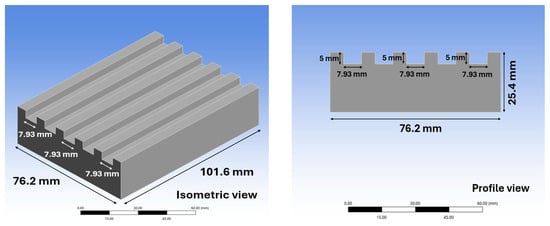
Figure 1.
3D rendering of the machined part.
The process parameters were selected based on the tool material and type, as shown in Table 3. For each material, two uncoated carbide end mills were used, represented as “new” and “worn” tools. The cutting tools used to mill aluminum 6061 and polyurethane foam are uncoated carbide 2-flute endmills, while the cutting tools used to mill stainless steel and mild steel are uncoated carbide 4-flute end mills. All cutting tools have a diameter of 5/16″ (7.93 mm), overall length of 3″, length of cut of 9/8″, and a helix angle of 30°. The worn tools were naturally worn by subjecting them to a higher depth of cut of 10 mm, a spindle speed of 10,000 RPM, and a feed rate of 60 mm/min. The cutting tools were used on their designated workpiece materials. Each new tool milled 5 slots per cutting configuration (25 passes in all) and the same procedure was followed for the worn tool. Using both new and worn tools allowed for a comparison of changes in the vibration spectra during machining between a new tool and one with significant wear. After machining, the tools underwent microscopic imaging using the OGP SmartScope (Optical Gauging Products, Rochester, NY, USA, distributed by Florida Metrology, Port St. Lucie, FL, USA) and the Keyence VHX-7000 series digital microscope (Keyence Corporation of America, Itasca, IL, USA) to observe the tool wear patterns.
Table 3.
Process parameters for the experimental runs.
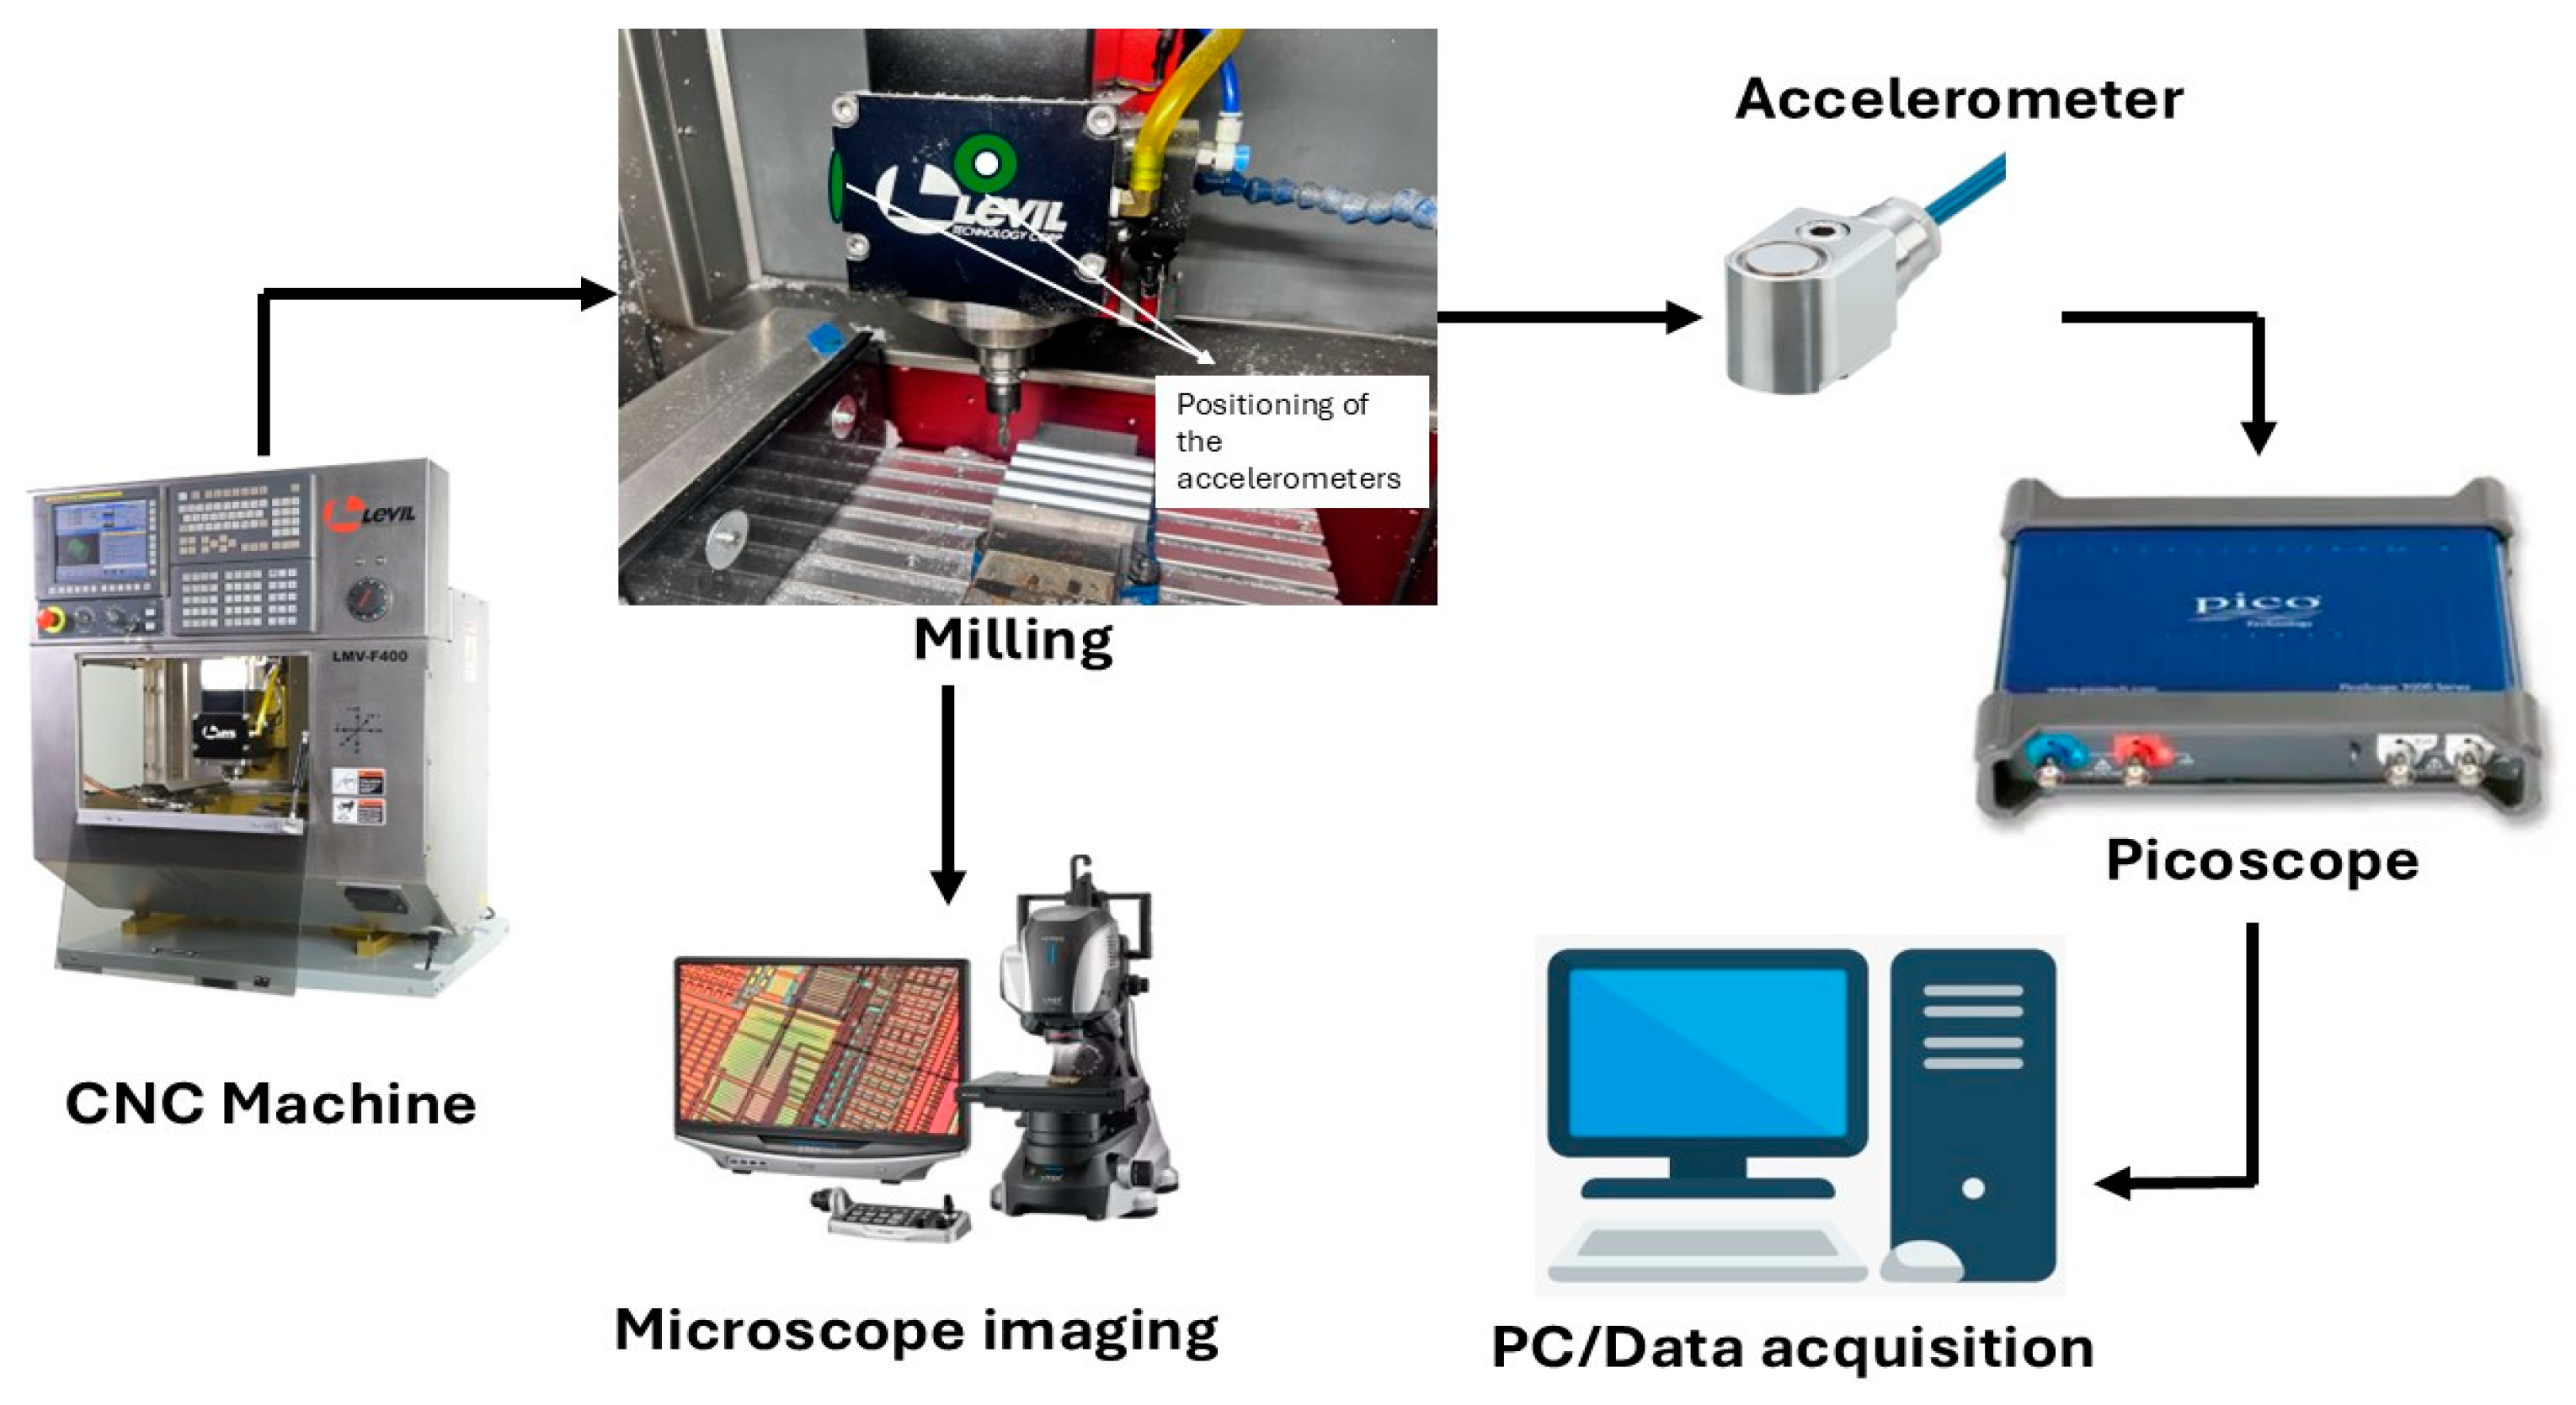
Machining vibrations were recorded using an IFM uniaxial accelerometer with a data acquisition frequency of 10,000 Hz. The high-frequency capability of the IFM accelerometer was essential for capturing the subtle vibration effects caused by tool wear, particularly when machining softer materials such as polyurethane foam. Additionally, a WITMOTION triaxial accelerometer was also used and recorded data at a frequency of 200 Hz, connected to a computer via its dedicated data acquisition dashboard. The sensors were mounted to the CNC spindle to facilitate accurate data collection as shown in Figure 2. An FFT (Fast Fourier Transform) analysis was conducted on MATLAB R2024b to observe the differences in vibrational amplitudes between the new and the worn tool. A low-pass butterworth filter was included in the analysis to mitigate the effects of high-frequency noise to observe the true behavior of the machining process. Table 4 shows the properties of the materials used for the milling experiment. FFT has been widely used to observe vibration data and detect anomalies at specific frequencies. Researchers use this tool to analyze vibration signals for a variety of applications, not only TCM.

Figure 2.
Experimental setup.
Table 4.
Material properties.
3. Results
3.1. Modeling of the Cutting Forces
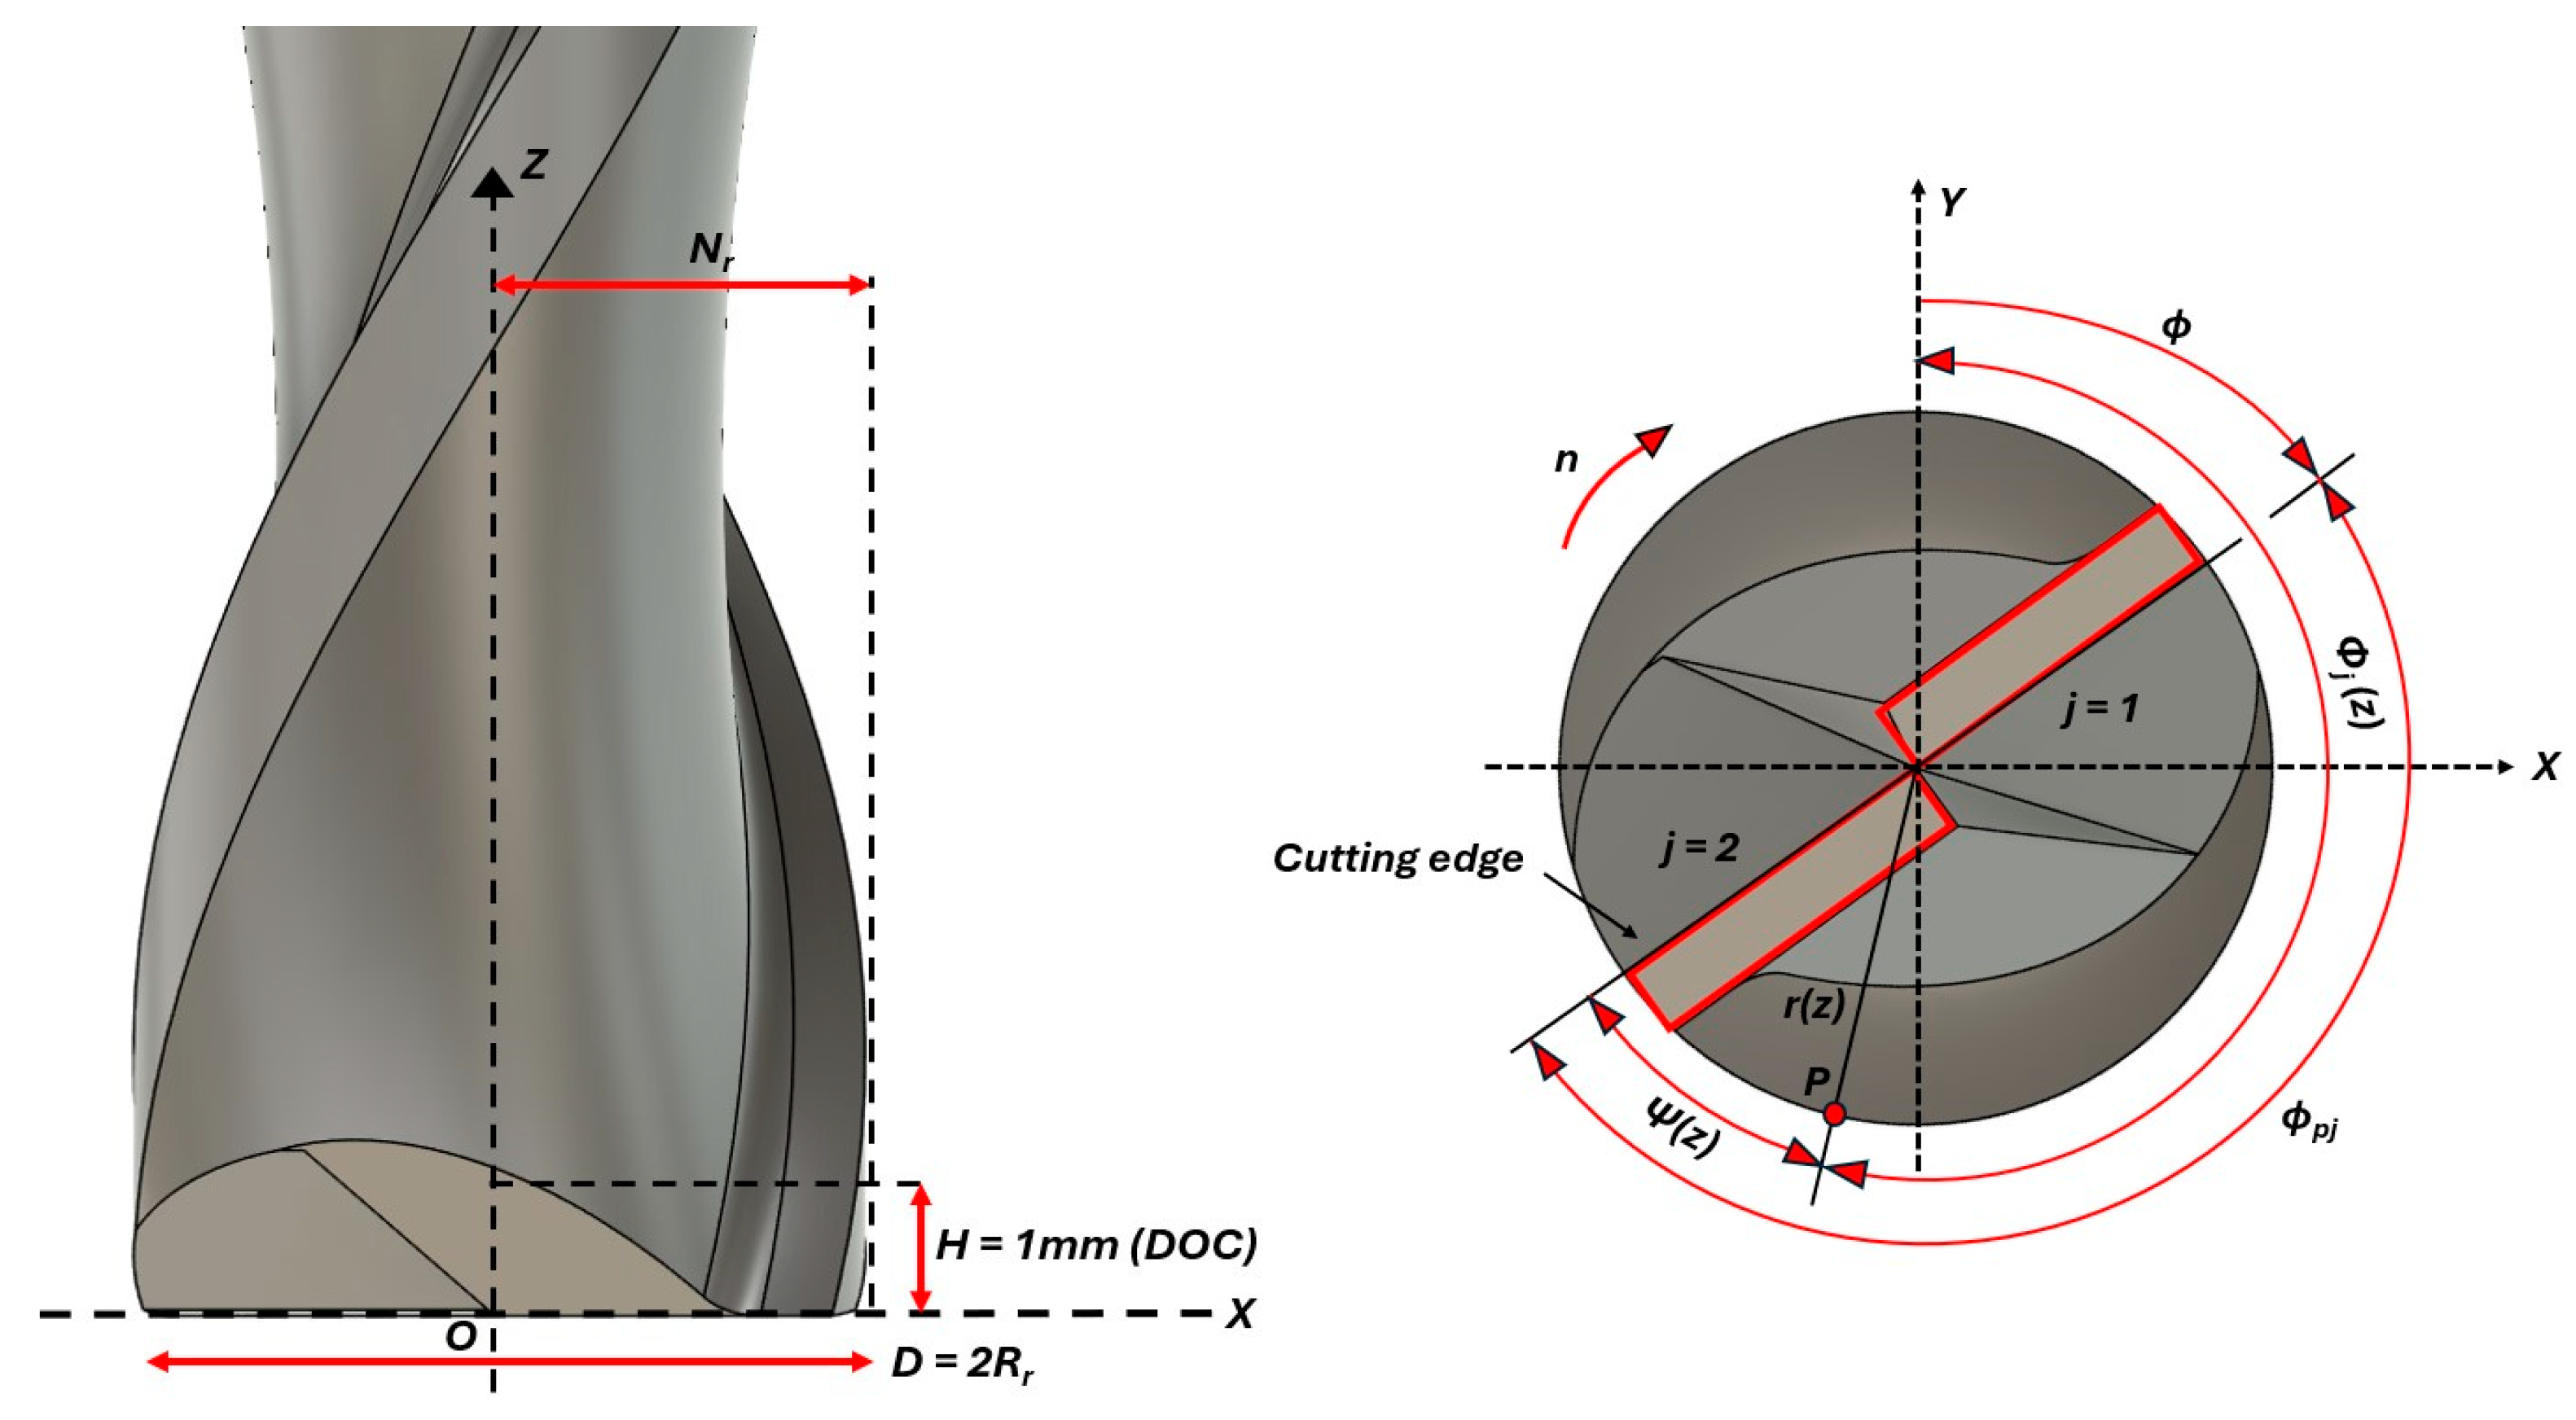
An analysis of the cutting forces acting at the tool tip was performed, based on the work of Engin and Altintas [31]. Figure 3 shows a representation of the end mill geometry, specifically of helical end mills; key variables are highlighted, which will be used to determine the cutting forces for each cutting tool as it rotates.

Figure 3.
Tool geometry for a cylindrical end mill (representative of the two-flute end mill).
During the milling process, tangential, radial, and axial forces act at the tool tip. Since we are analyzing an infinitesimal segment of the cutting edge, these forces are considered at a localized level. The differential tangential (dFt), radial (dFr) and axial (dFa) cutting forces are given as follows:
where Kte, Kre, and Kae are the edge force coefficients in the tangential, radial, and axial directions, respectively, and Ktc, Krc, and Kac are the cutting force coefficients in the tangential, radial, and axial directions, respectively. These coefficients, represented in Table 5, depend on the specific cutting tool, the workpiece material, and the machining parameters being used. See the Nomenclature section for a description of the parameters and variables used in this section.
Table 5.
Cutting and edge force coefficients. All values are in [N/mm2] ([32,33]).
The chip thickness changes with both the radial ([z]) and axial immersion (kj) angles and can be found using Equations (4) and (5):
where Stj is the chip load and is the pitch angle of flute j (180° for a two-flute end mill and 90° for a four-flute end mill). The axial immersion angle for flute j at a depth of cut z is represented as follows:
The radial immersion angle, , for flute j is represented as follows:
For a cylindrical end mill with a constant helix, the helix angle, i(z), and radial lag angle, ), can be represented via Equations (8) and (9), respectively:
where . The axial offset, Nz, simplifies to zero for the cylindrical end mill and the radial offset, Nr, can be found using the following equation:
where for cylindrical end mills. The starting and final lag angles and at point M are represented as follows:
Based on the mathematical model shown above, dFt, dFr, and dFa can be calculated using Equations (1)–(3). The cutting forces in the cartesian coordinate system are given by the following:
Therefore, the total cutting forces for a specific angle of rotation can be found by integrating the above equation along the axial depth for every cutting flute that is in contact with the workpiece. Nf is 2 or 4 depending upon the number of flutes present in the end mill, as shown in the following equations:
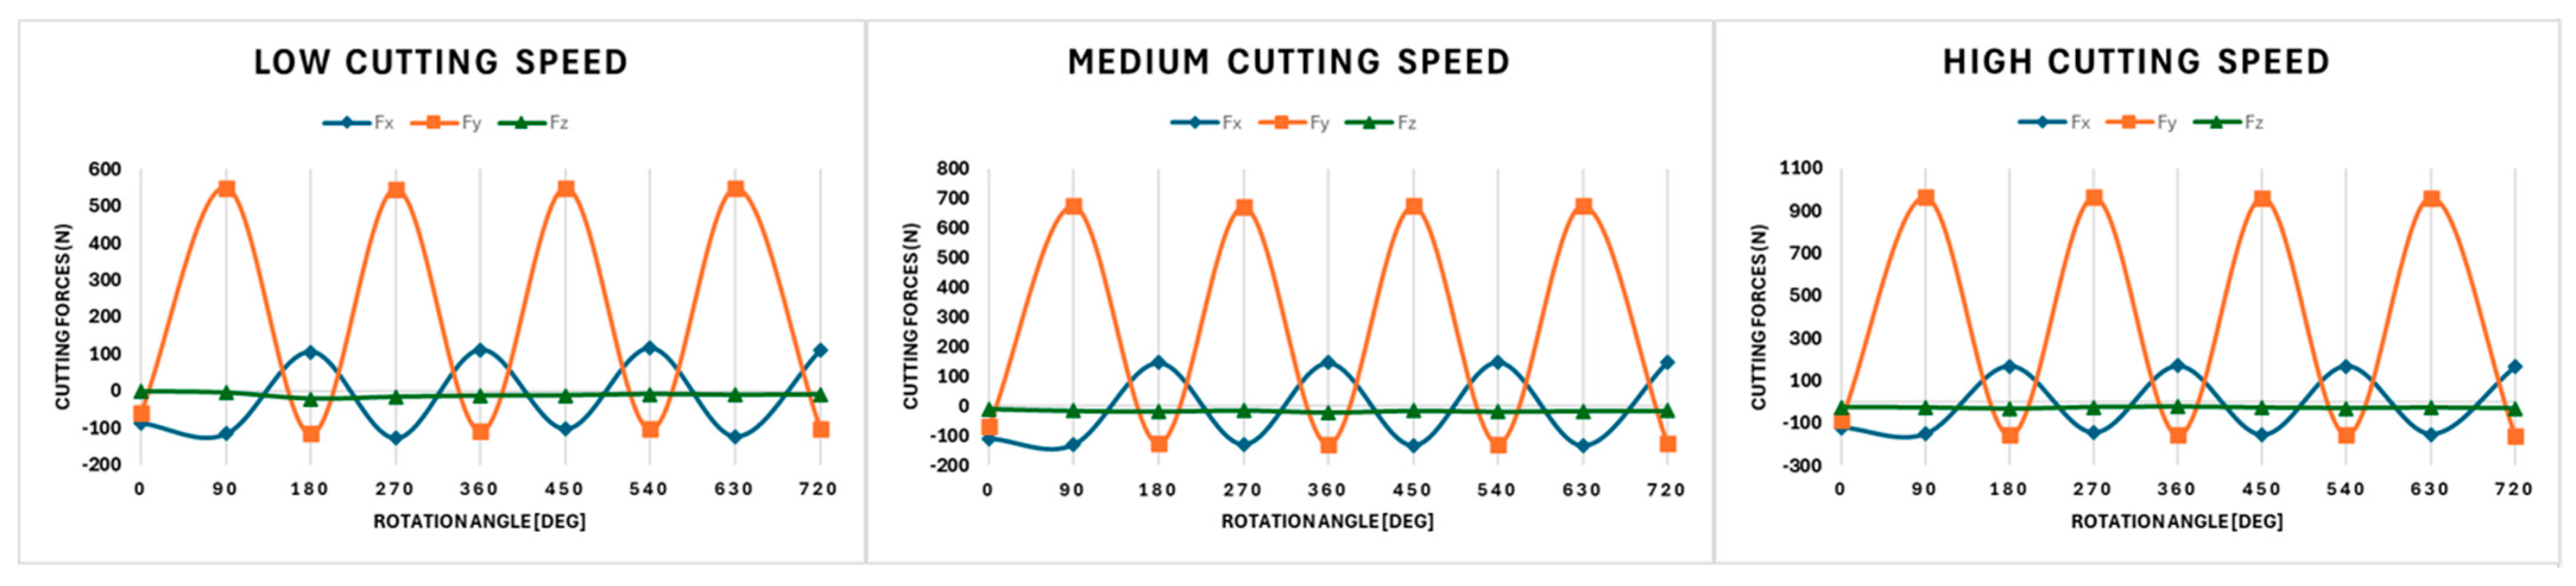
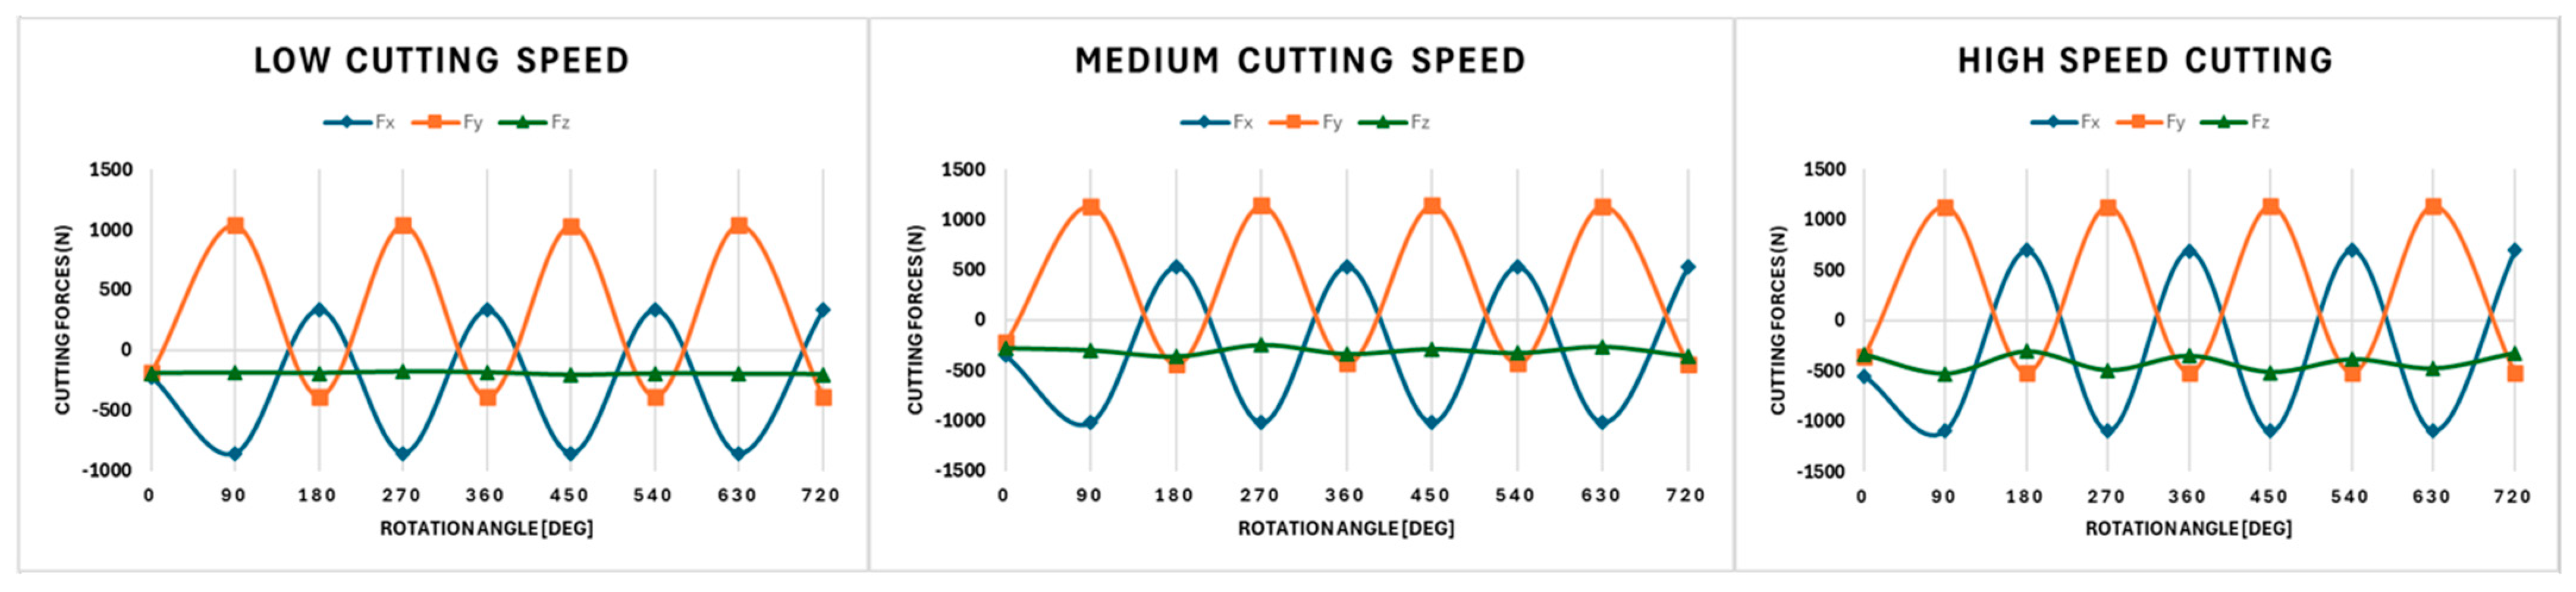
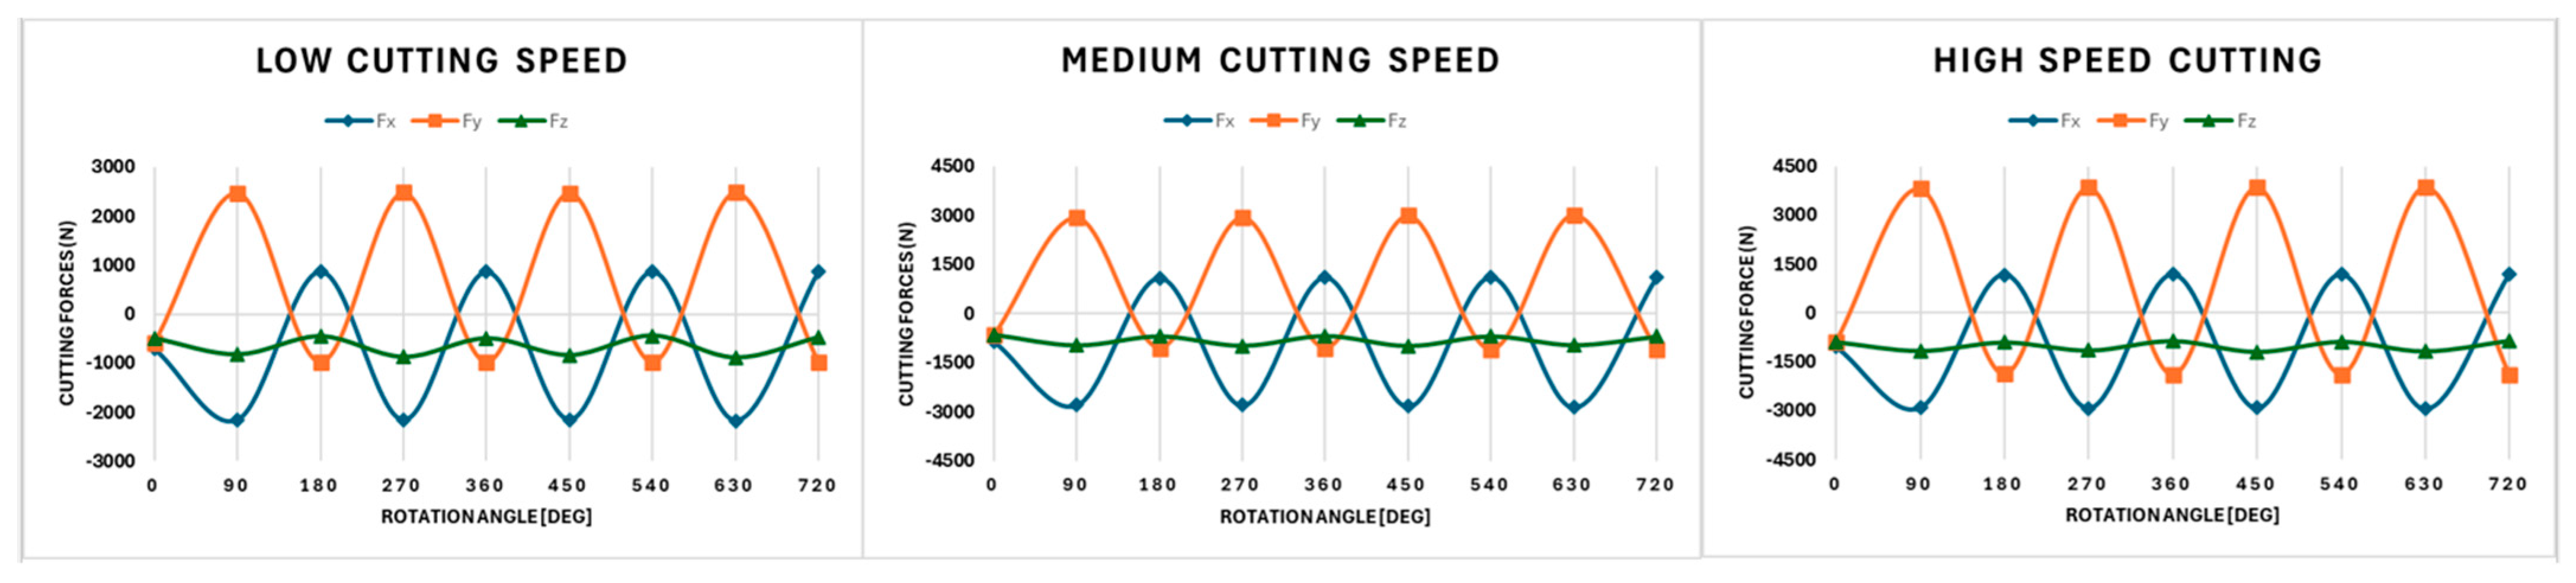
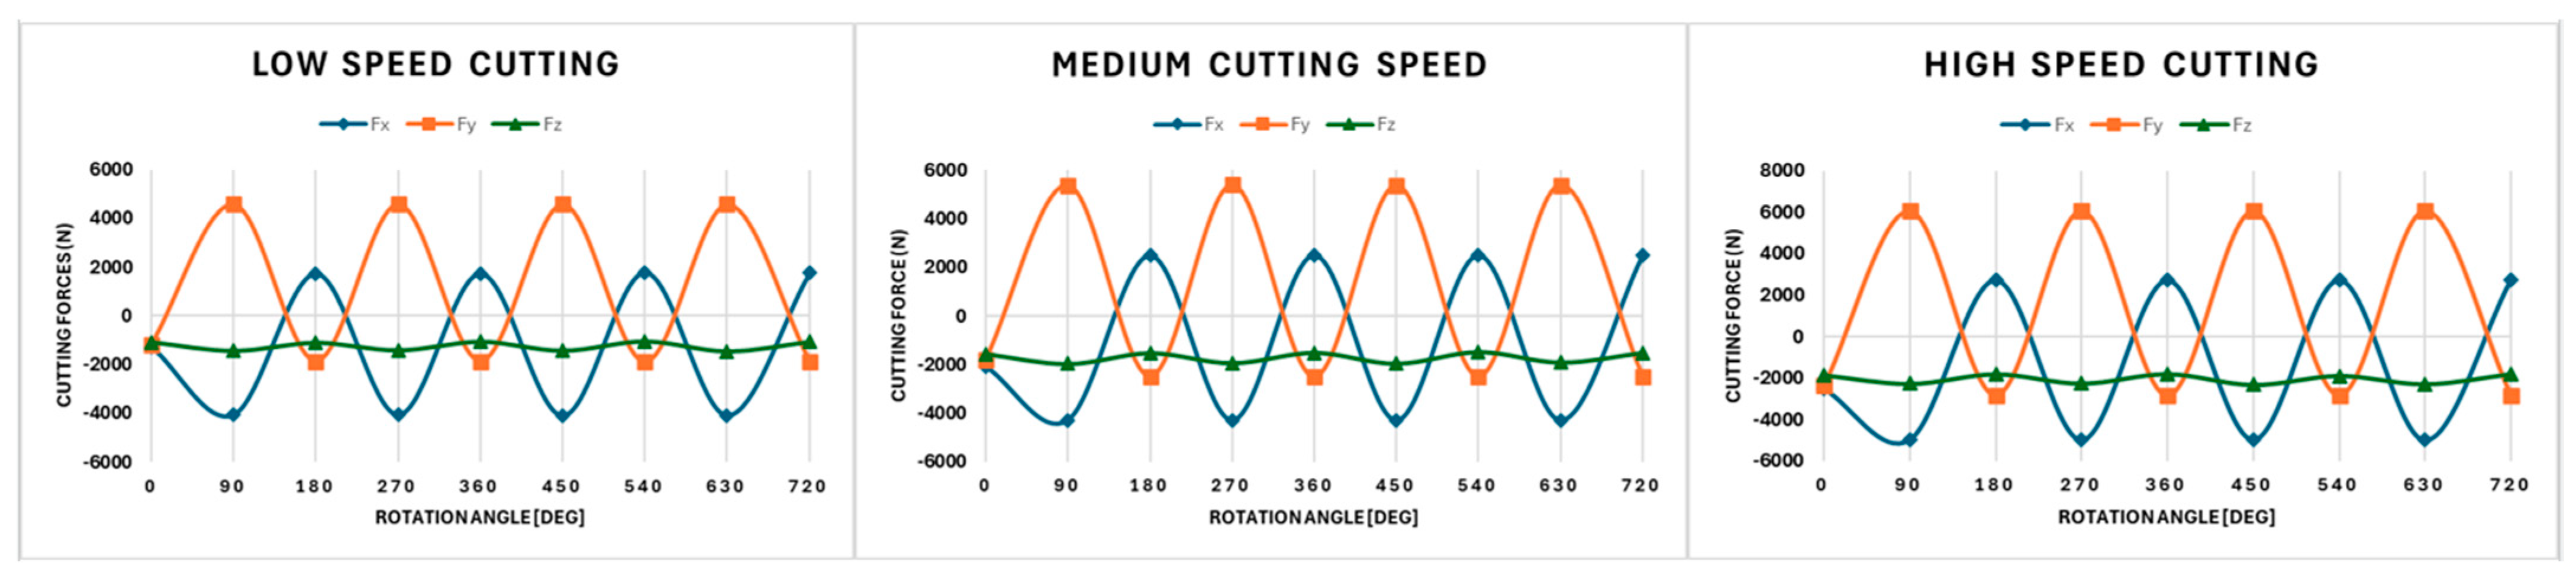
The initial cutting forces recorded over the first full rotation of the cutting tool (0–360°) reveal that the magnitude of the forces along the y-axis (Fy) is significantly lower for polyurethane foam compared to the metal workpieces (see Figure 4). This behavior is attributed to the material’s low hardness, with a Shore D hardness of 85 [34], low yield strength, and high machinability, all of which contribute to reduced cutting resistance. The same trend was observed for forces acting along the x-axis (Fx) where the simulated cutting forces remain lower for polyurethane foam than for the metal workpieces. Similarly, aluminum 6061, known for its relatively high machinability due to its ductility and low yield strength of 145 MPa, exhibited moderate cutting forces during machining as shown in Figure 5. While the magnitude of these forces is higher than those observed for polyurethane foam, they remain lower than those generated when machining mild steel and stainless steel. Mild steel and stainless steel have a lower machinability due to their higher yield strengths of 250 MPa and 515 MPa, respectively [35]. This results in significantly increased cutting forces, as depicted in Figure 6 and Figure 7. Despite being softer than stainless steel, mild steel tends to adhere more to the cutting tool, increasing friction and cutting resistance. Stainless steel, on the other hand, exhibits the highest range of cutting forces across the rotation angles (0–360°) due to its high strength, work-hardening tendency, and low thermal conductivity [36]. Forces acting perpendicular to the machining direction along the z-axis (Fz) show minimal variation, primarily due to the shallow axial depth of cut (1 mm) compared to the radial depth of cut (7.938 mm). This is in alignment with the results of [31]. While slight fluctuations in Fz are present, they remain negligible under normal machining conditions. However, as the hardness of the workpiece material increases, the magnitude of Fz also increases slightly, reflecting the greater resistance encountered during machining.

Figure 4.
Cutting forces as a function of the rotational position for various cutting speeds (polyurethane foam).
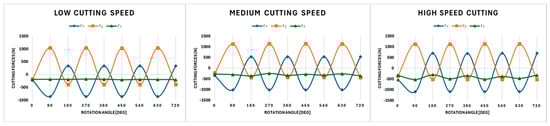
Figure 5.
Cutting forces as a function of the rotational position for various cutting speeds (aluminum 6061).

Figure 6.
Cutting forces as a function of the rotational position for various cutting speeds (mild steel).

Figure 7.
Cutting forces as a function of rotational position for various cutting speeds (stainless steel).
3.2. Analysis of Tool Wear
After machining, the end mills were inspected under a Keyence digital microscope at magnifications of 150×, 250× and 300×. This was primarily carried out to examine the wear on these tools. Flank wear occurs on the flank or side surface of the cutting tool, which comes into contact with the machined surface of the workpiece. It appears as gradual wear along this surface, often starting near the cutting edge and progressing along the flank, and is primarily caused by abrasion from the workpiece material rubbing against the tool surface during cutting.
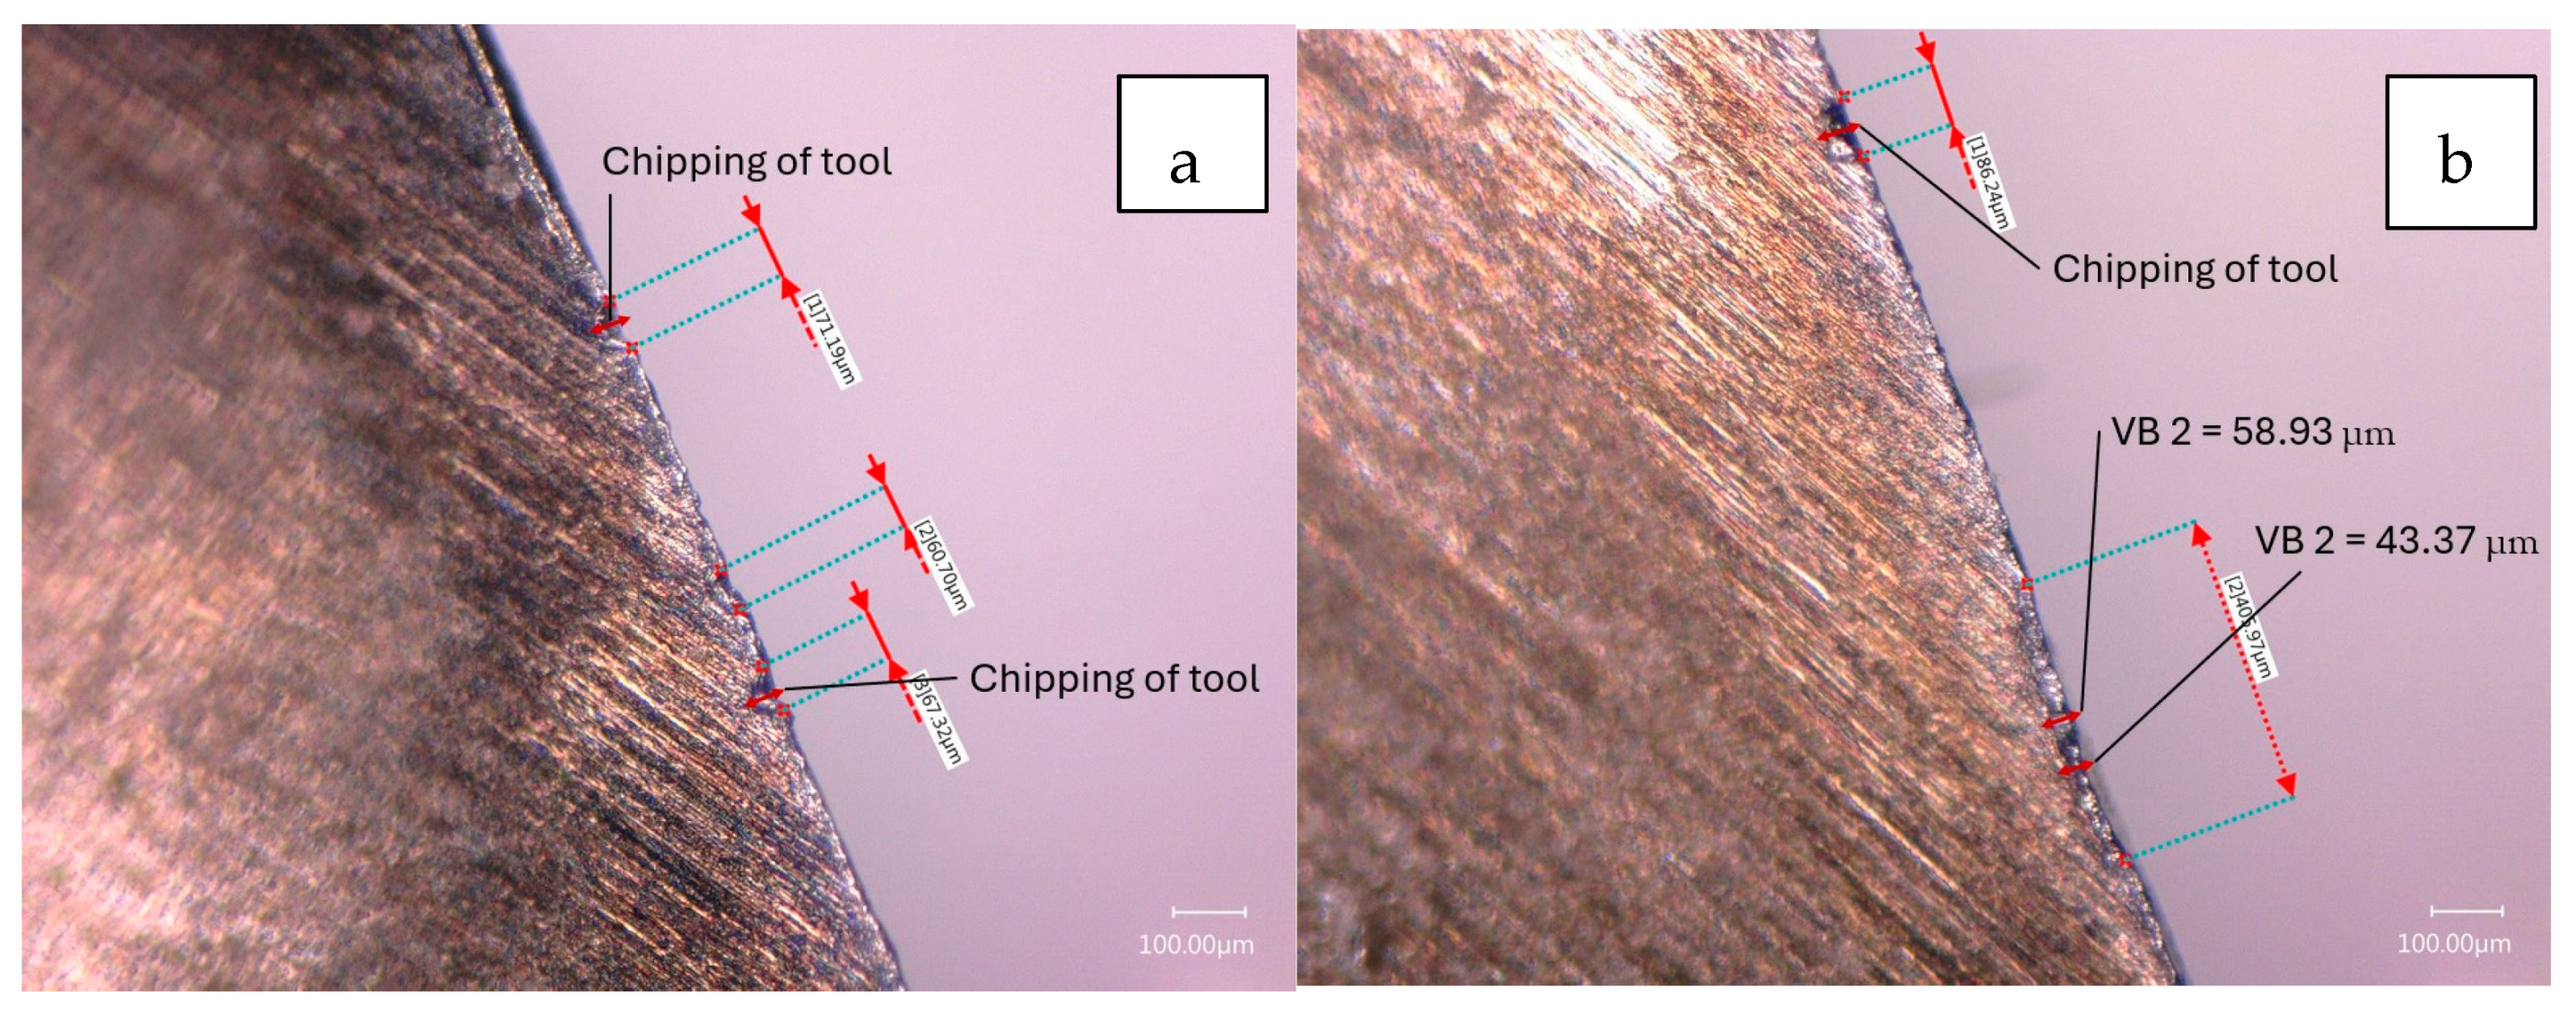
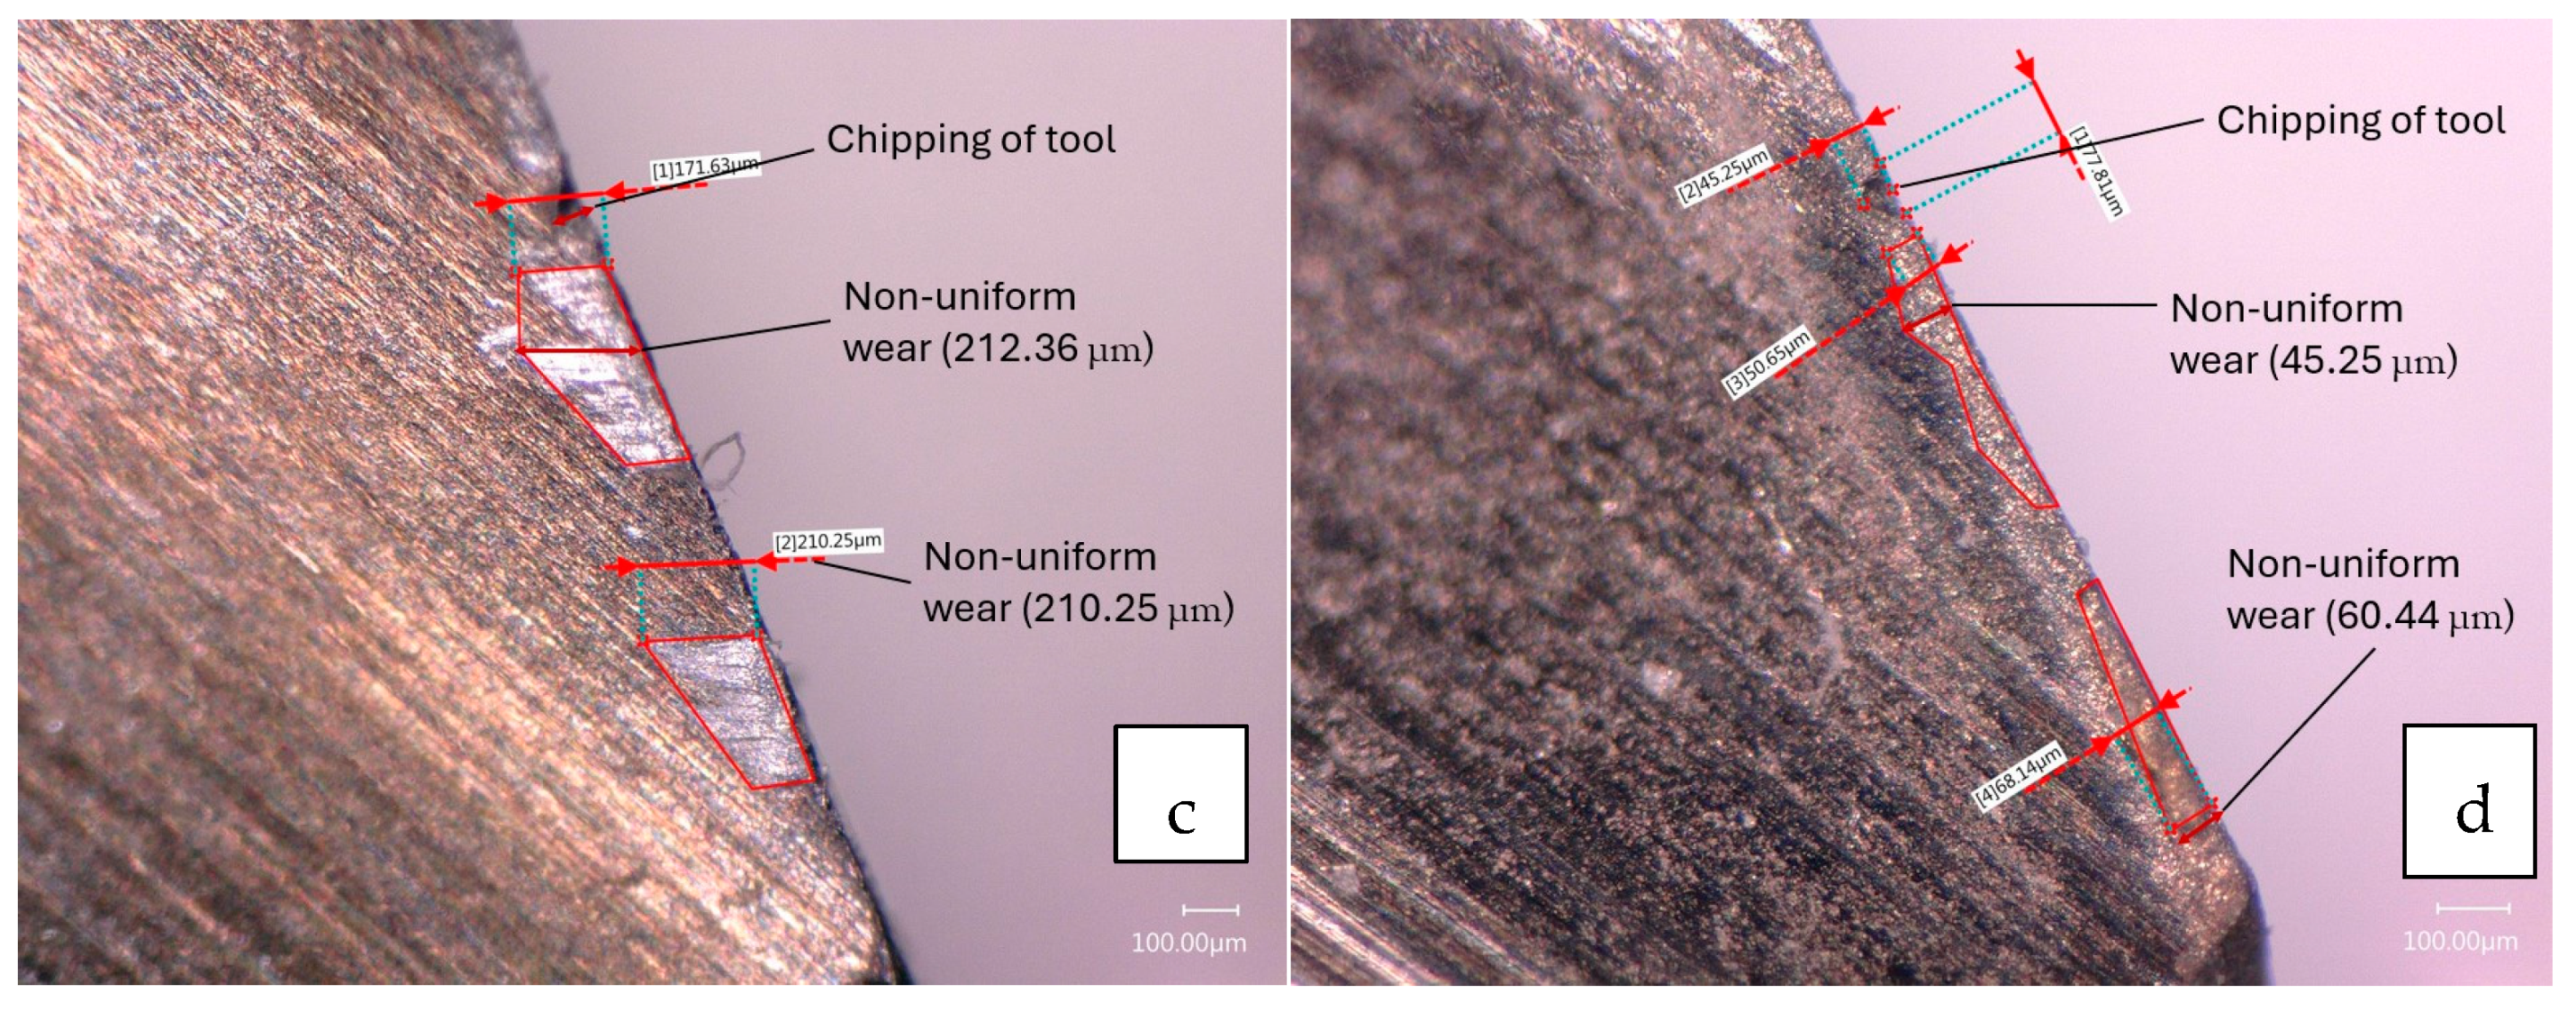
Preliminary observations of the new cutting tools at 250× showed that small portions of the tool were being chipped away at the edges. At higher magnifications, it was revealed that the cutting tools had undergone chipping and flank wear, as is represented in Figure 8. Figure 8a,b depict the tool wear observed on both flutes of the new tool after machining polyurethane foam under the low-cutting-speed configuration. Localized chipping of the tool and non-uniform flank wear (VB 2) are evident in these images. Similarly, Figure 8c,d present tool wear on both the flutes after machining polyurethane foam under the high-cutting-speed configuration. Localized chipping of the tool and non-uniform wear patterns are observed, but with a noticeable increase in the extent of wear at higher cutting speeds. This indicates that higher cutting speeds increase tool wear, emphasizing their impact on tool performance.


Figure 8.
Tool wear observed on the rake face of the end mill (new tool) to machine polyurethane foam at a low speed ((a) first and (b) second flutes) and high speed ((c) first and (d) second flutes).
The greatest amount of tool wear was exhibited while machining stainless steel and mild steel. Figure 9a–d display the tool wear measurements on flute 3 and flute 4 of the cutting tool, following the machining of stainless steel under the low-speed and high-speed cutting configurations. The wear patterns on the cutting tool are a result of thermal damage on the end mill when machining stainless steel due to the high heat generated at the tool–workpiece interface without coolant. Parameters Wthermal and Lthermal represent the width and length of the wear patterns, respectively. This type of damage also accelerates wear mechanisms such as crater wear and leads to deformation of the tool, weakening the cutting edge and reducing tool life considerably.
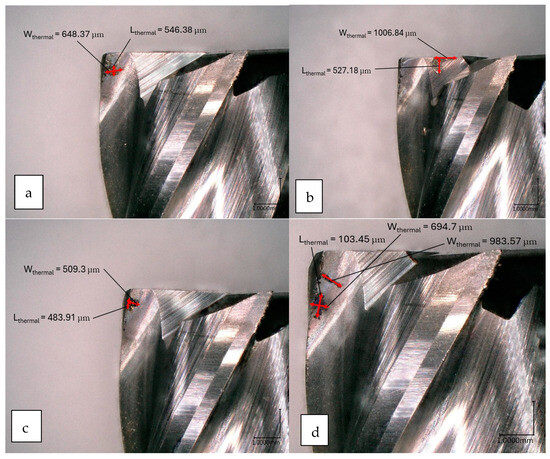
Figure 9.
Tool wear observed on the rake face of the end mill (new tool) to machine stainless steel at a low speed ((a) third flute and (b) fourth flute) and high speed ((c) third flute and (d) fourth flute).
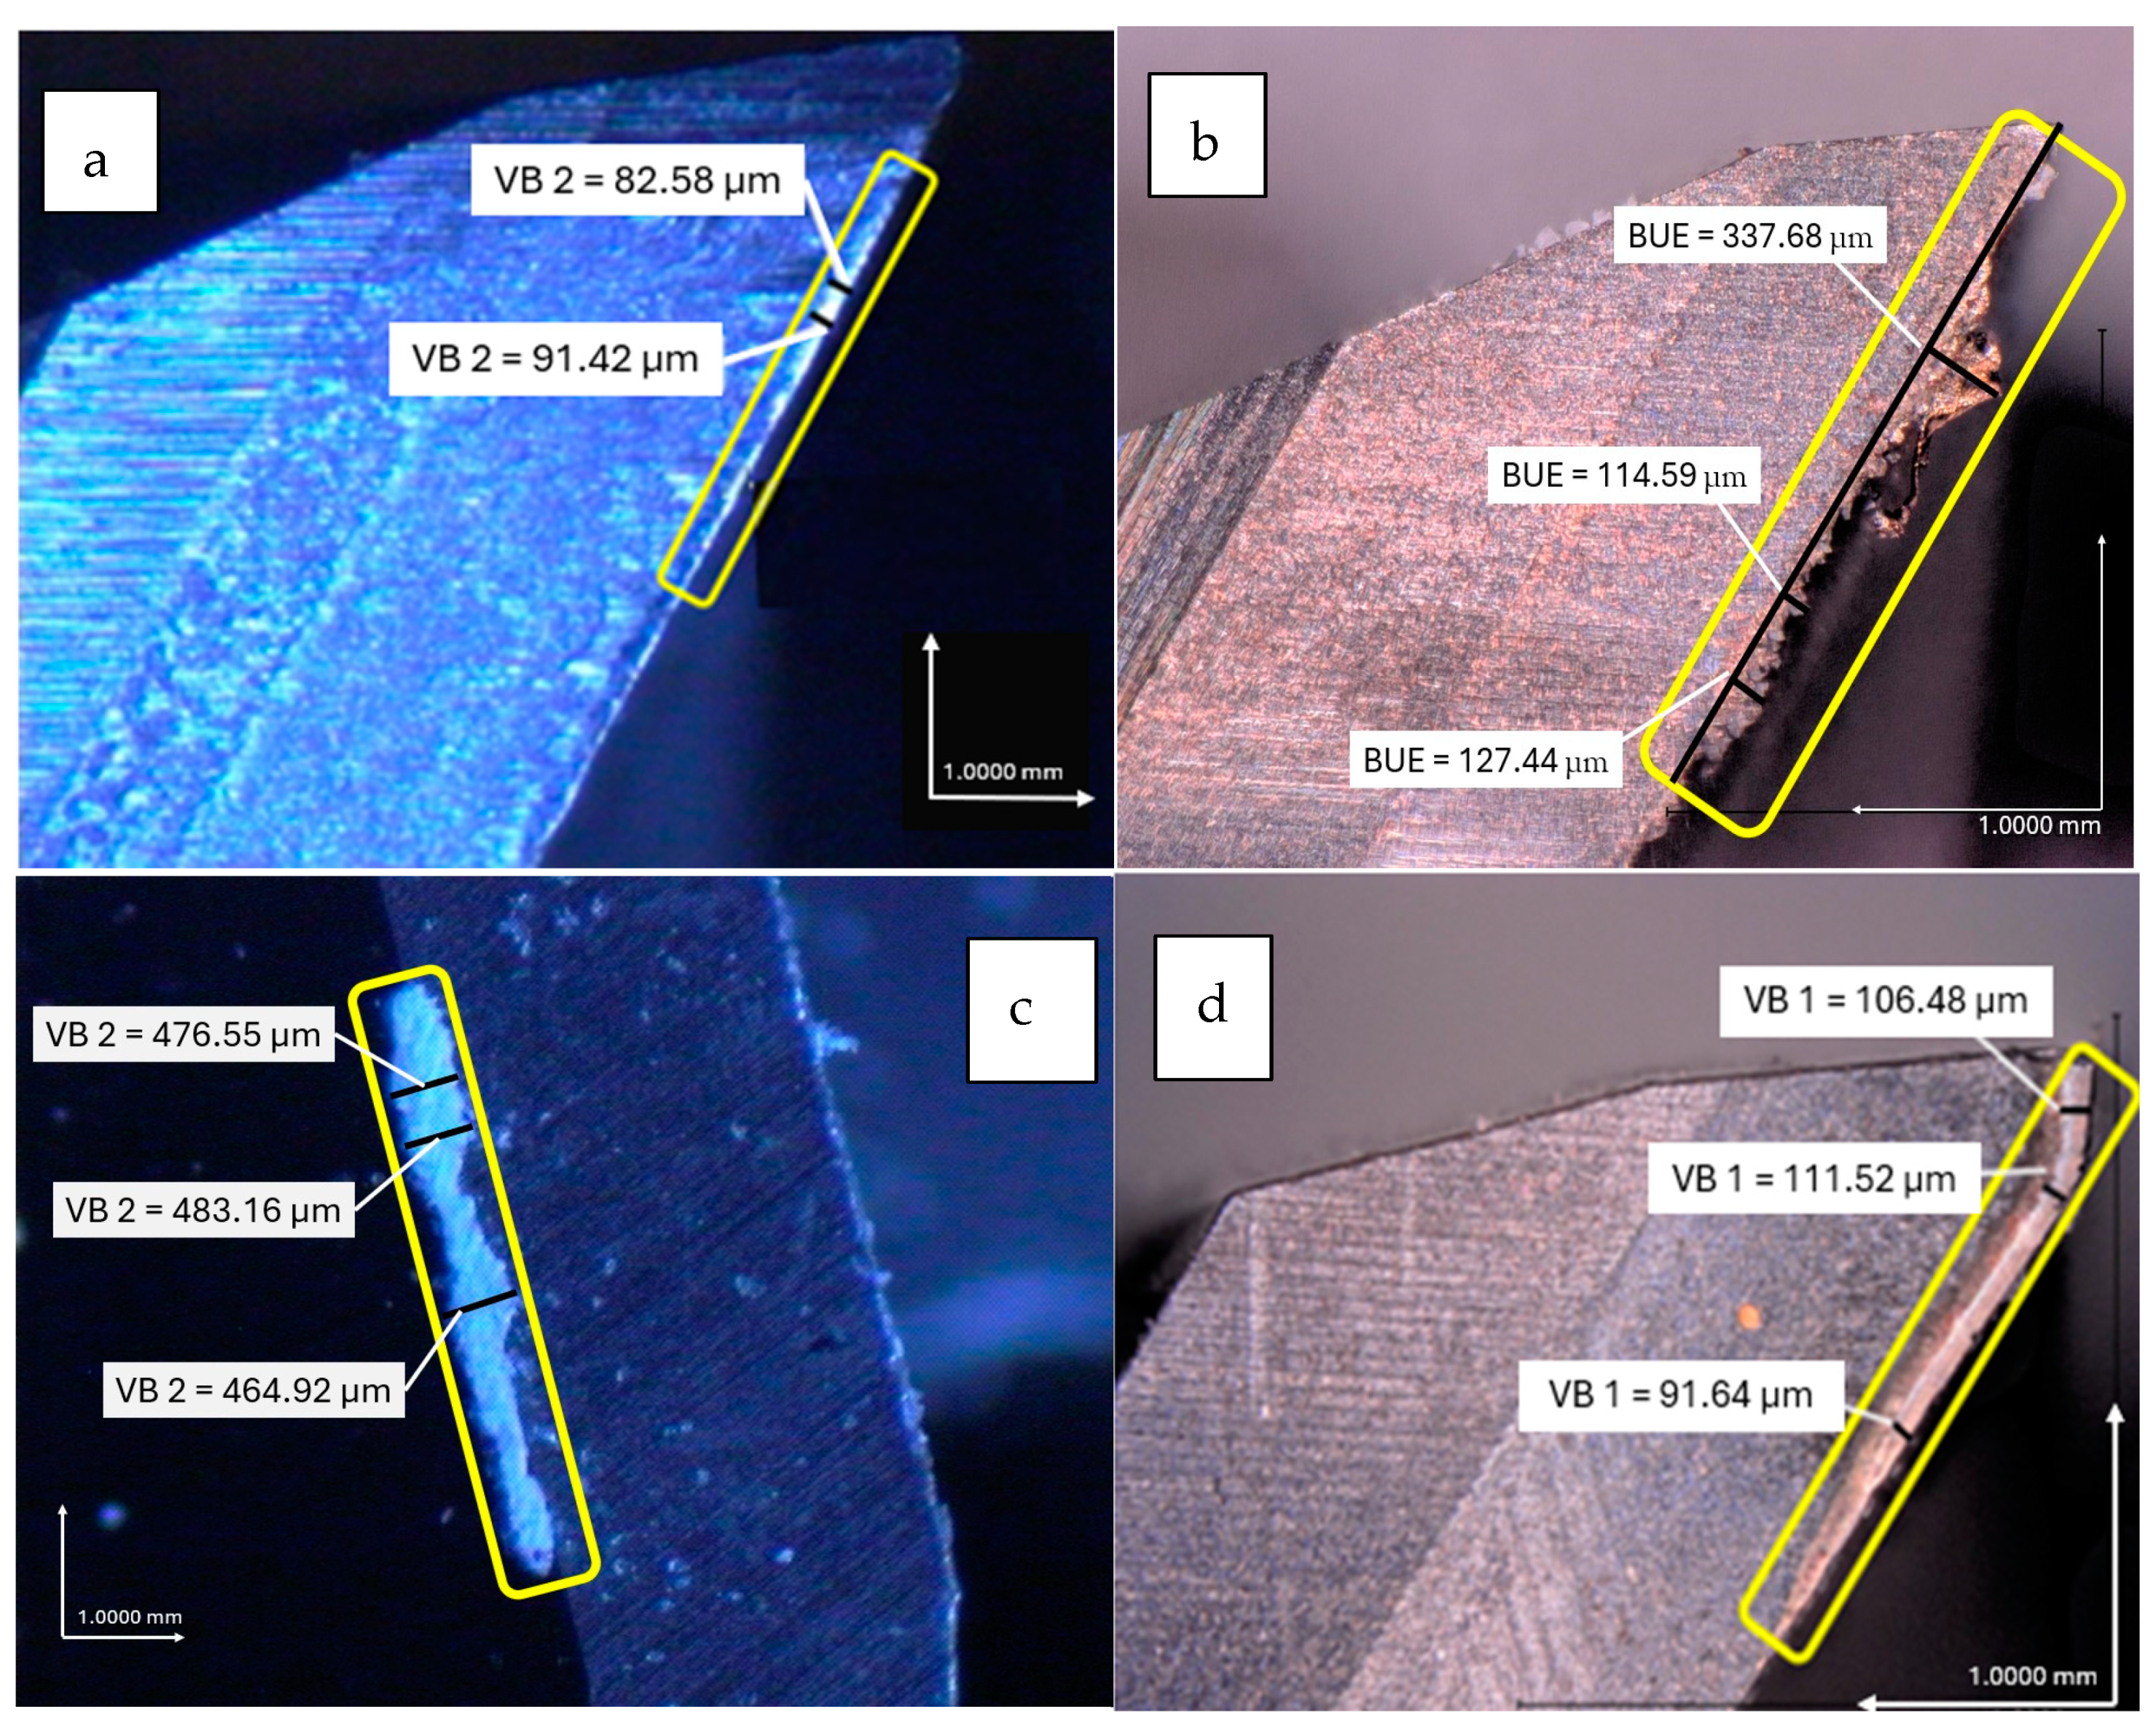
Figure 10a–d illustrate the tool wear patterns observed on end mills used for machining mild steel under both low- and high-cutting-speed configurations, specifically on the second and third flutes. The wear patterns identified include uniform flank wear (VB 1), non-uniform flank wear (VB 2), and built-up edges (BUE) on the cutting face of the end mill. The tool wear nomenclature was adopted from ISO standards 3685:1993 and 8688-2:1989 [37,38]. The amplitude of the vibration signals was found to be higher in the case of the worn tool relative to the new tool. In the previous literature, Bhuiyan, et al. [39] showed that an FFT analysis of vibration data can be used to determine the frequencies that are being excited and their respective amplitudes. When the vibration data were converted from the time domain to the frequency domain, initial observations in the FFT spectra yielded a similar trend to that observed by Bhuiyan, et al. [39], with significant differences in vibrational amplitudes across a range of frequencies. Differences in signals were detected by both the IFM and Witmotion accelerometers; however, the IFM sensor provided a more detailed comparison of the FFT spectra between the new and the worn tool, which showed multiple frequencies with considerable differences in amplitude.

Figure 10.
Tool wear observed on the flank face of the end mill (new tool) to machine mild steel at a low speed ((a) second flute and (b) third flute) and high speed ((c) second flute and (d) third flute).
3.3. Low Cutting Speed
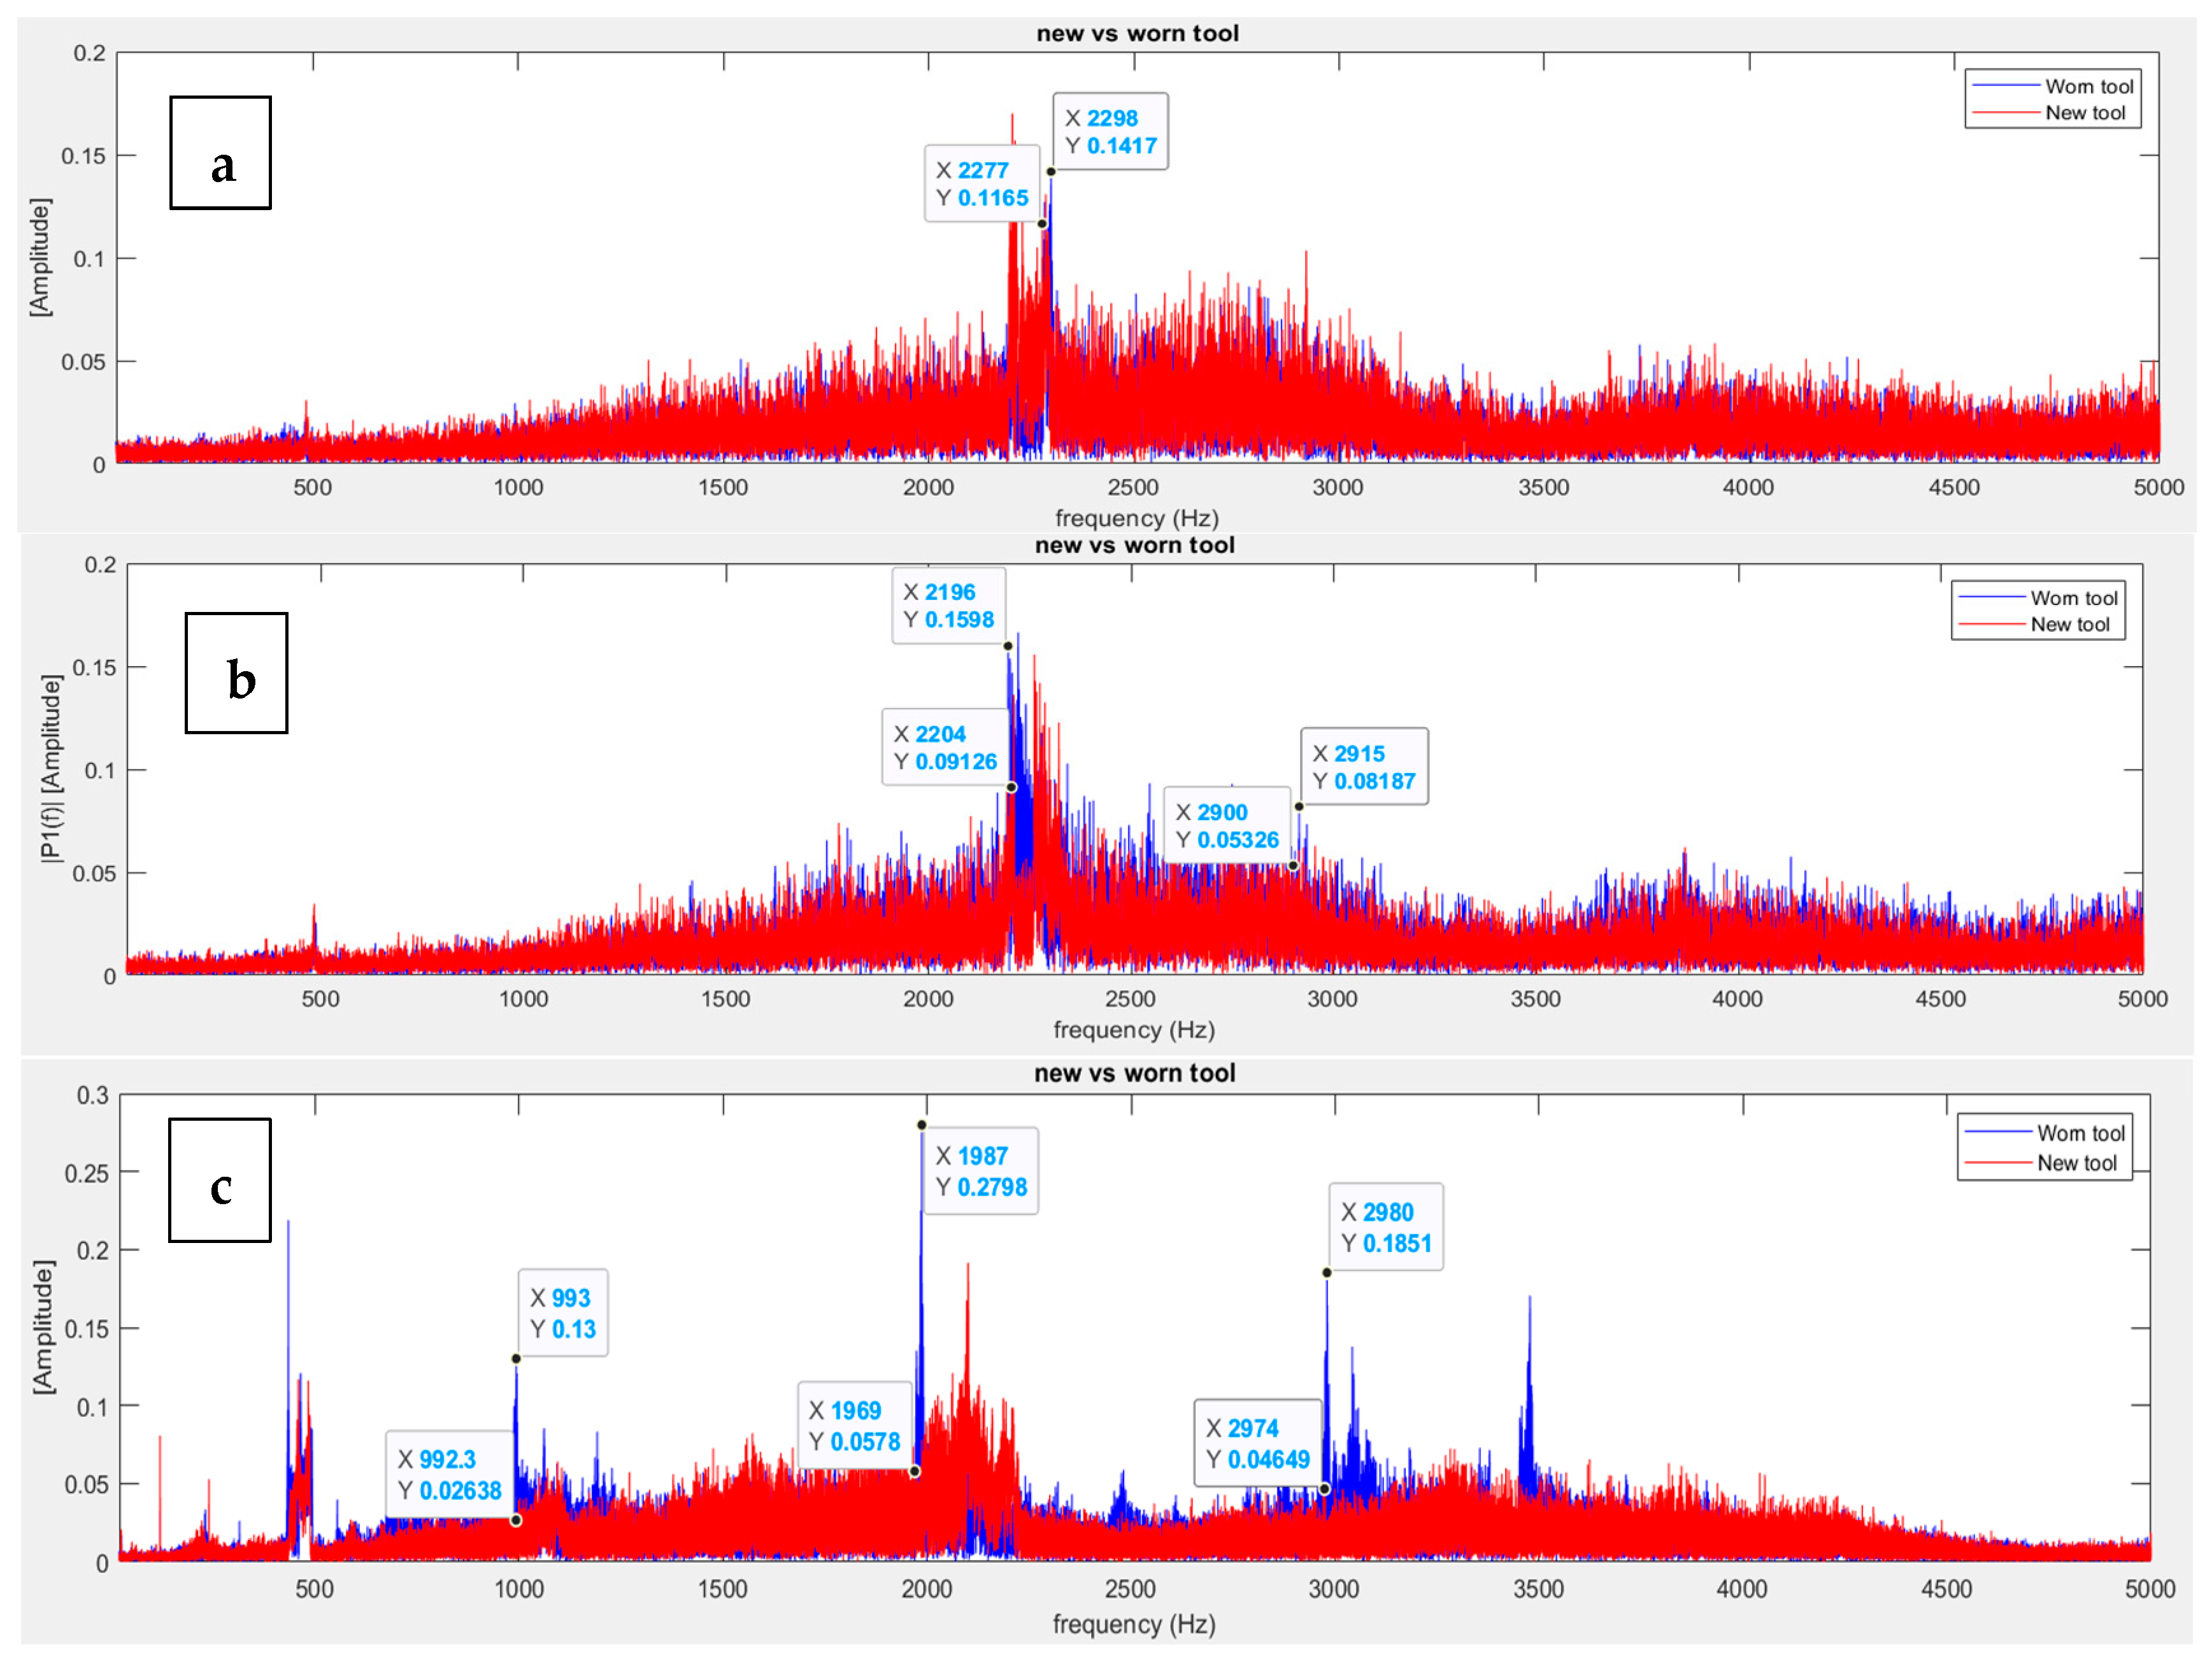
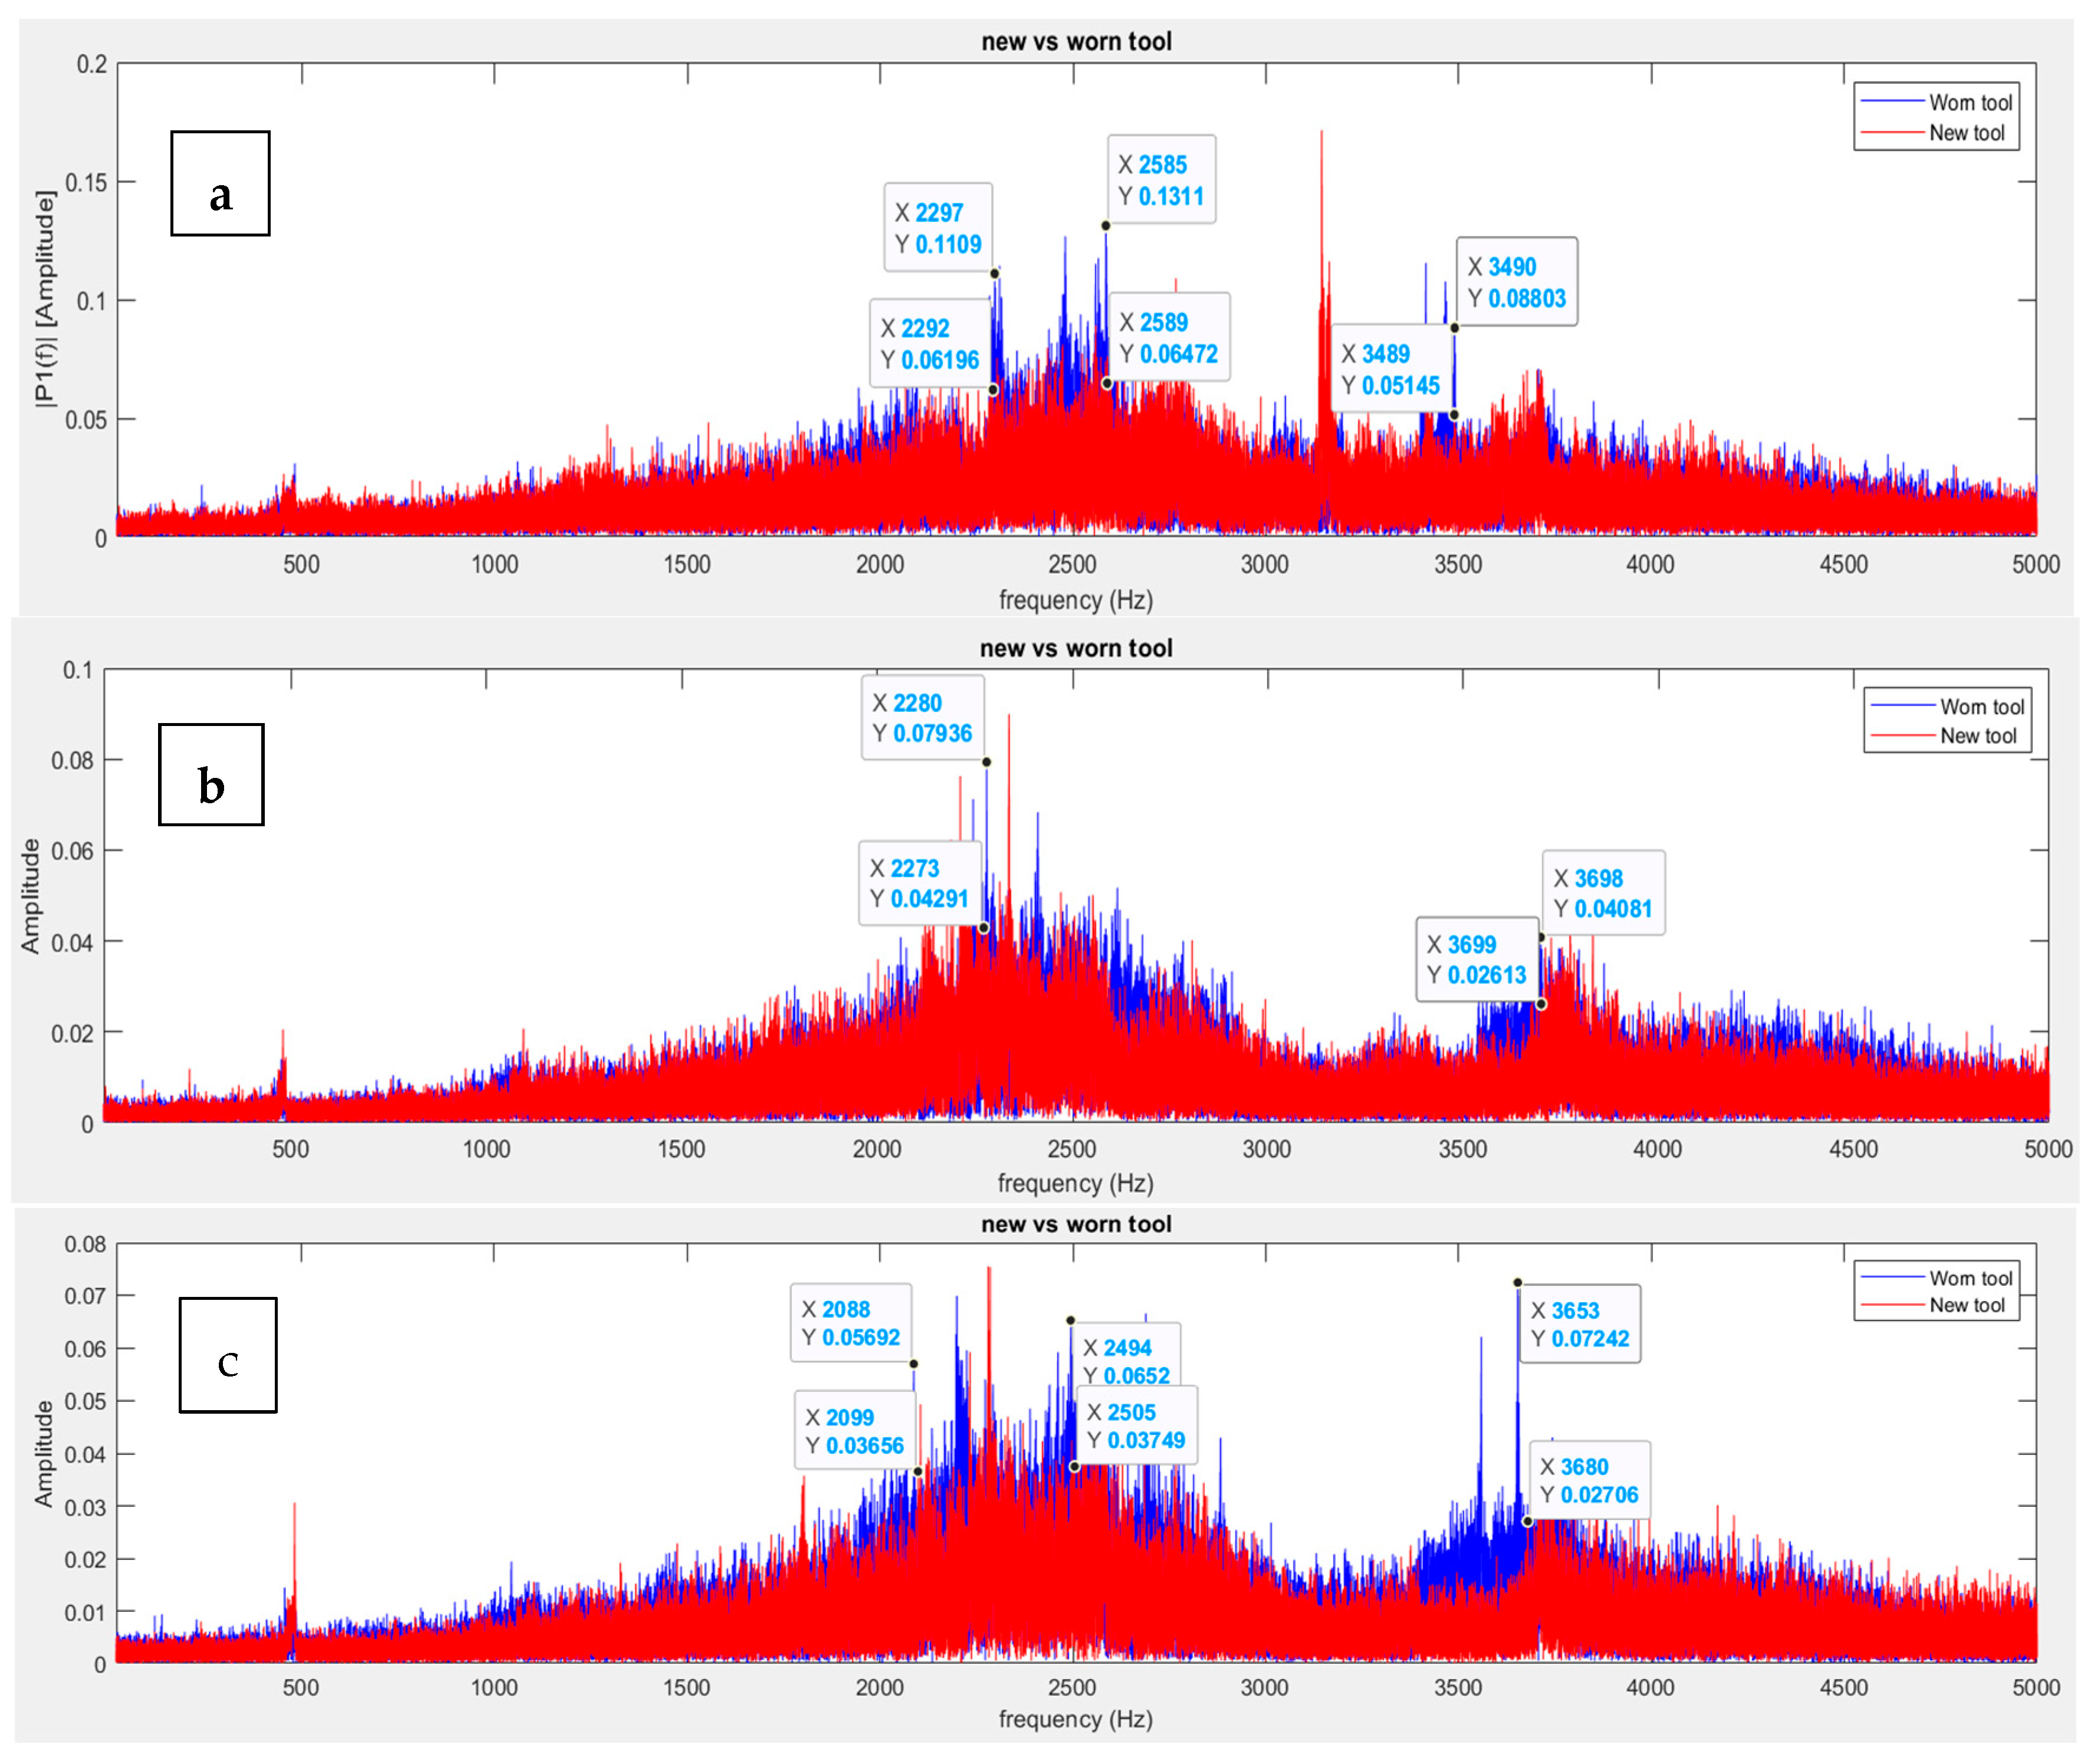
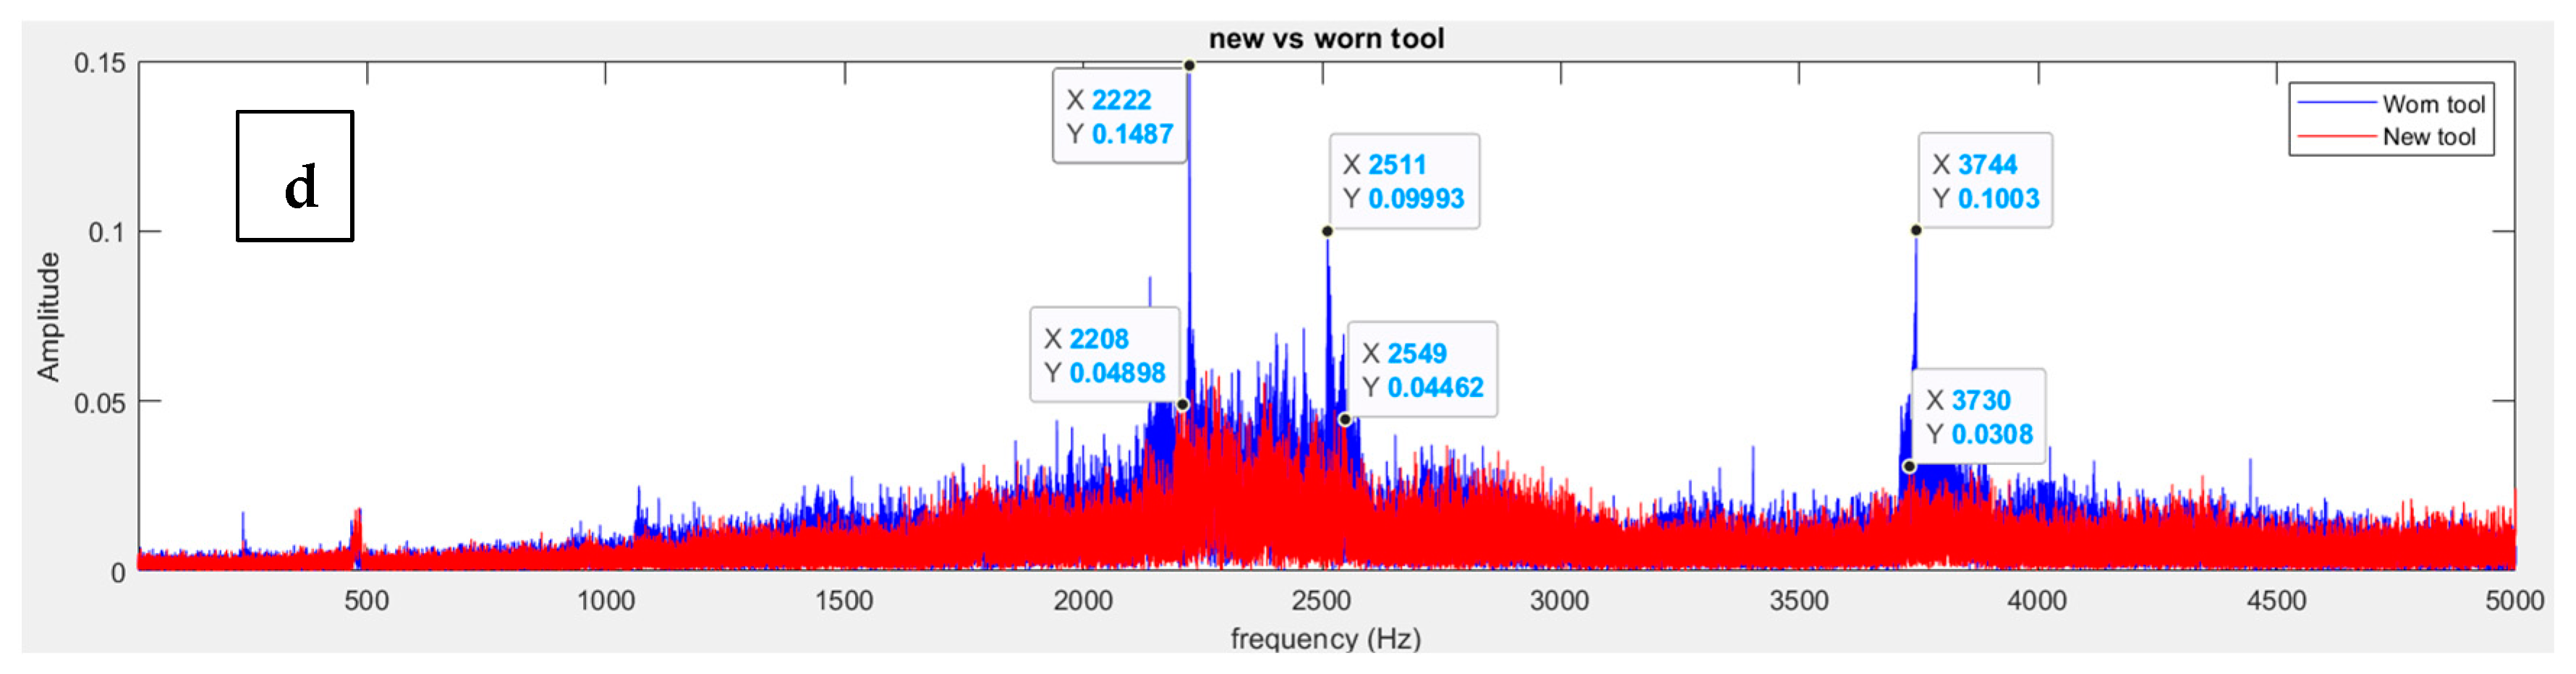
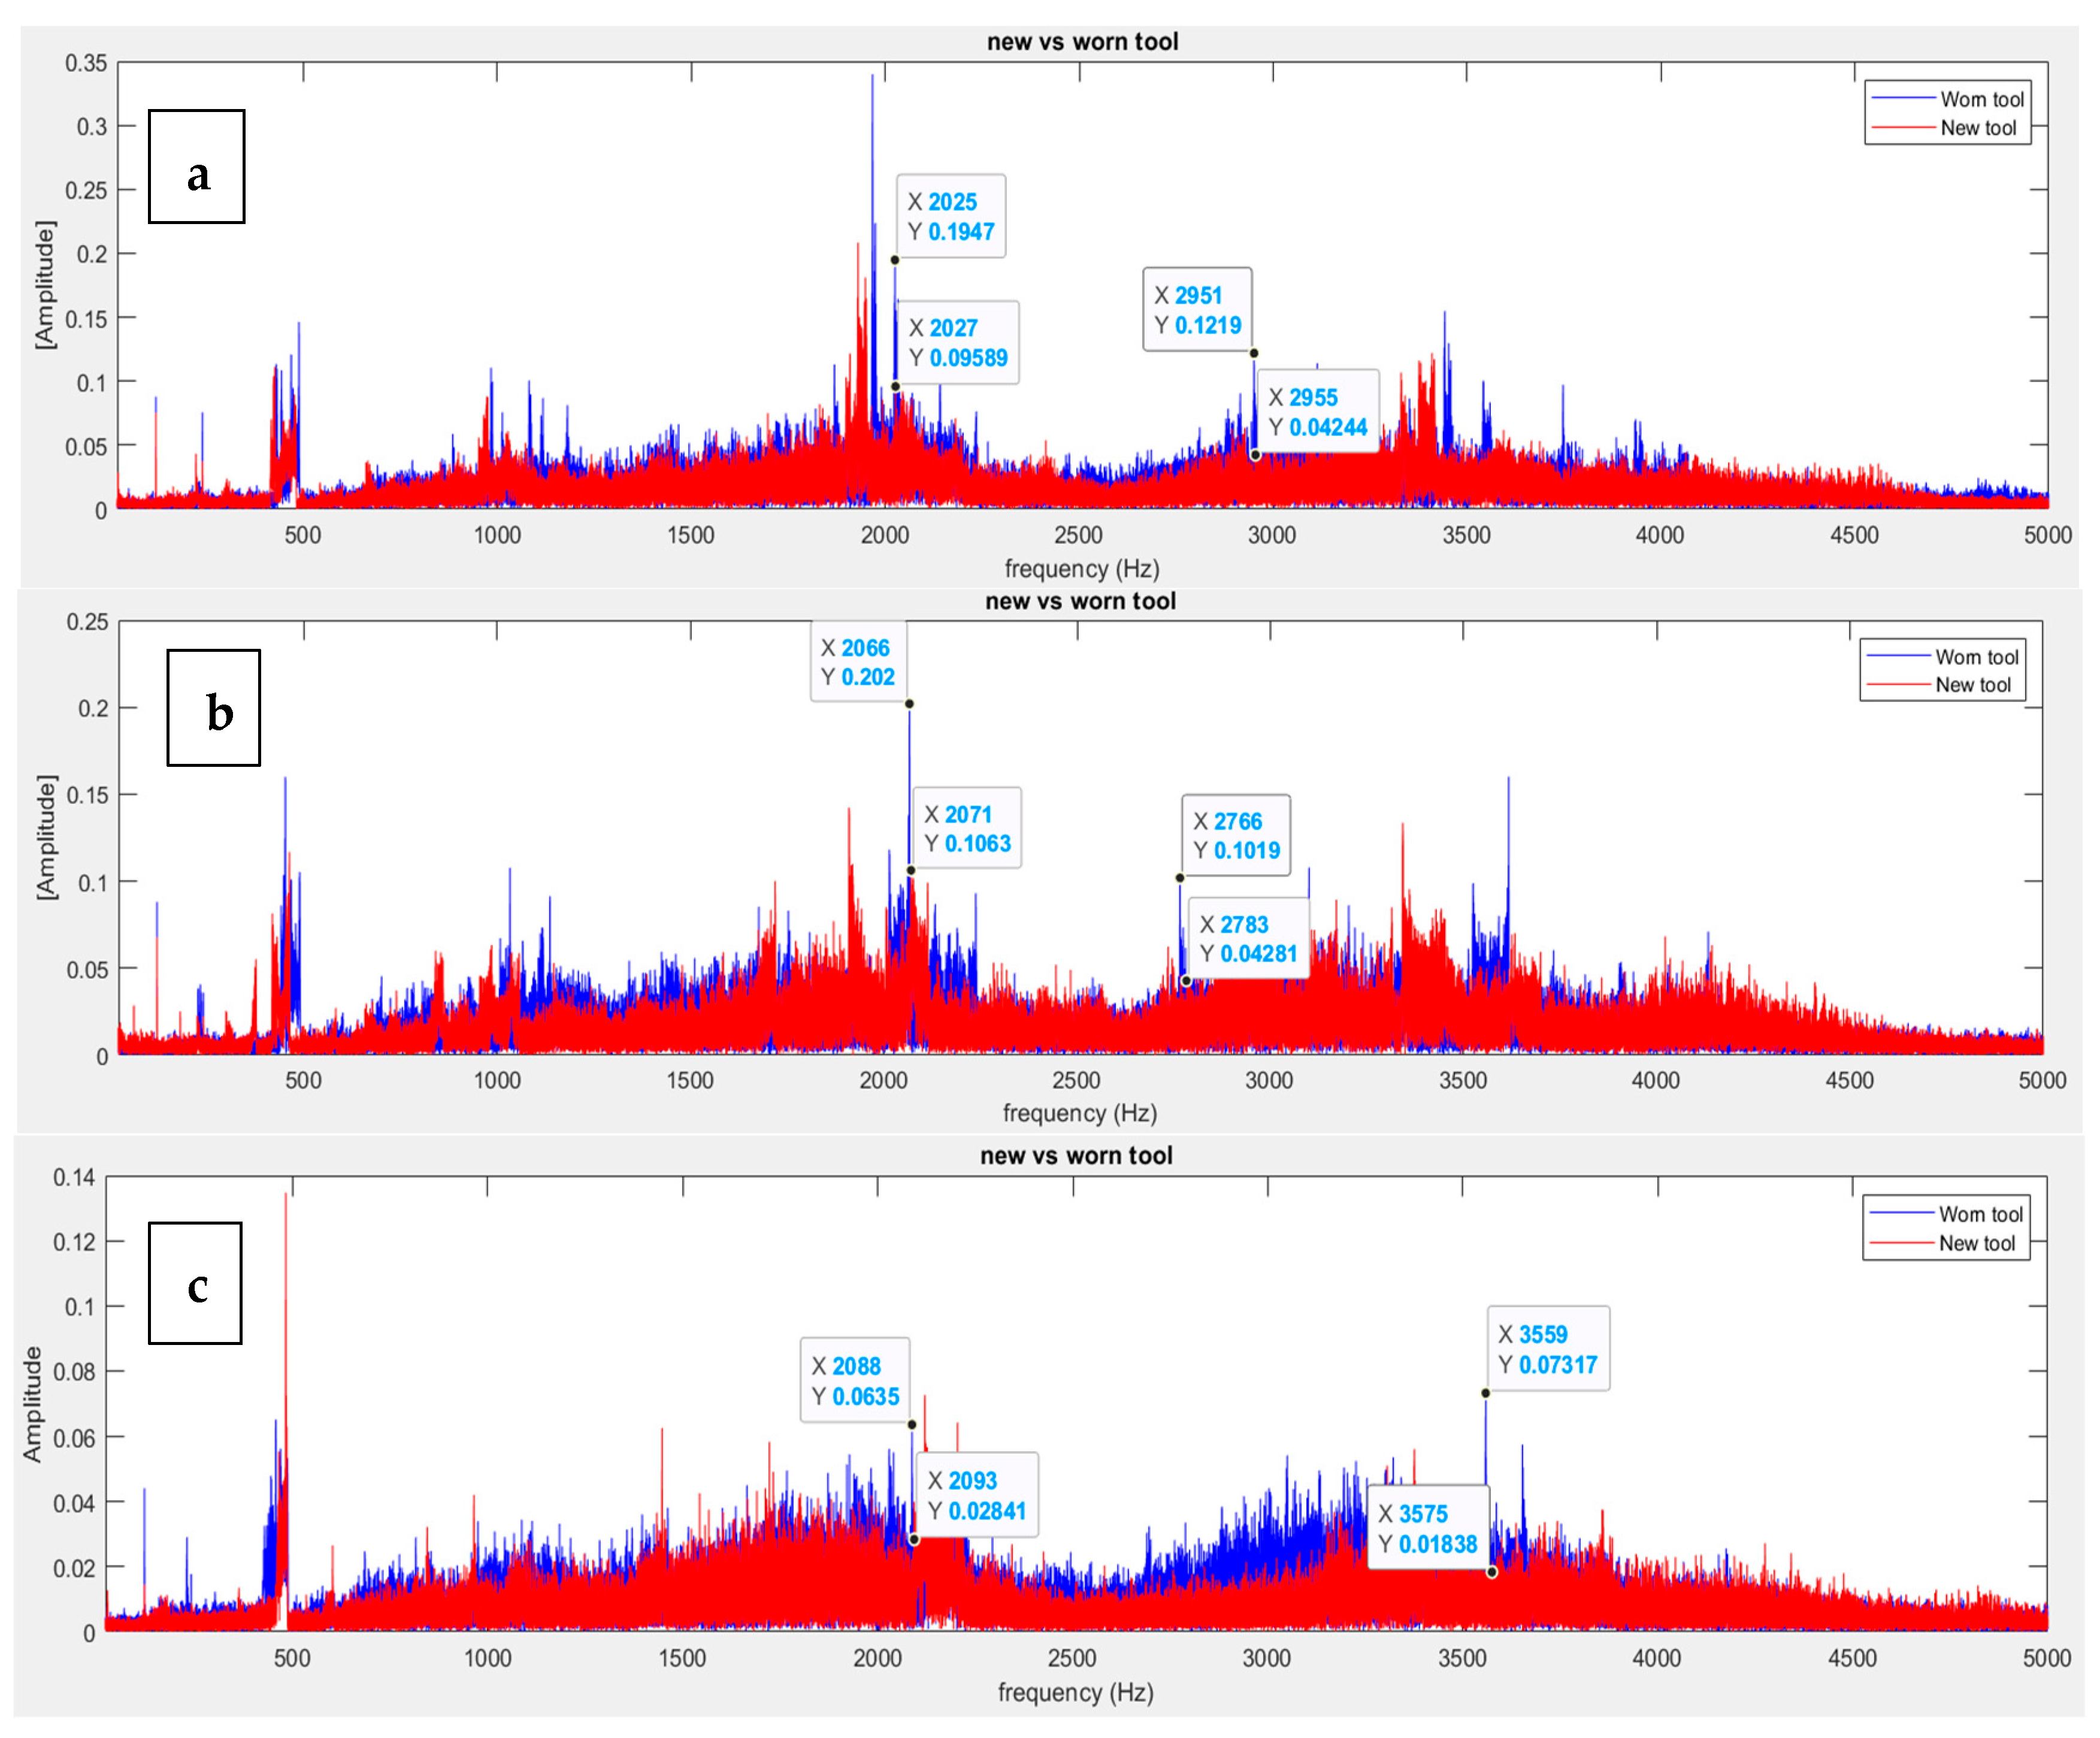
In Figure 11, the frequency spectra collected at 10,000 Hz highlight distinct characteristics of the machining processes when using new and worn tools to machine various materials. Notably, the vibrations recorded for the worn tool (depicted by the blue line) exhibited higher amplitudes compared to those for the new tool (illustrated by the red line) during the milling process. For instance, when machining aluminum 6061, as depicted in Figure 11b, a notable difference in vibrational amplitude can be observed at approximately 2200 Hz, where the amplitude difference measures 0.07 Vrms2, and at ~3000 Hz, where it measures 0.028 Vrms2. Similarly, when examining mild steel, as presented in Figure 11c, there is a discernible difference in vibrational amplitudes at ~2200 Hz (0.22 Vrms2) and at ~3000 Hz (0.14 Vrms2). The magnitude of the amplitude variations across identical frequencies notably increases, indicating the impact of tool wear on vibration generation during machining processes. However, in Figure 11a, the discrepancies in vibrational amplitudes are less pronounced, manifesting predominantly at about 2200 Hz. The distinct behavior observed in polyurethane foam, characterized by its softer nature impeding the free flow of vibrations within its material structure, underscore the influence of material properties on vibration dynamics during machining.
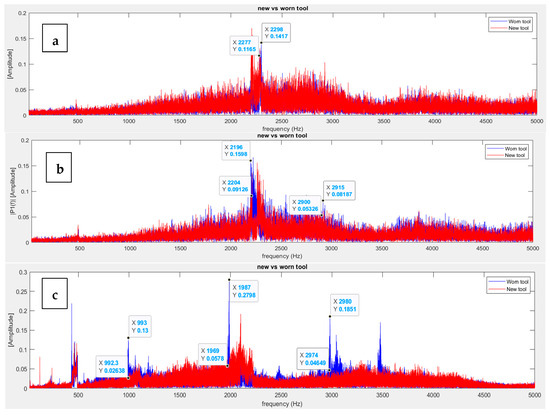
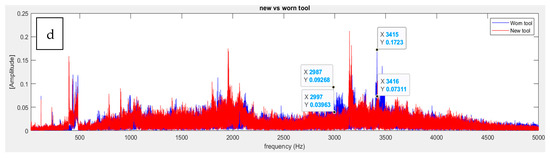
Figure 11.
FFT analysis of vibration data obtained from the IFM sensor for the low-cutting-speed configuration: (a) polyurethane foam, (b) aluminum 6061, (c) mild steel, and (d) stainless steel.
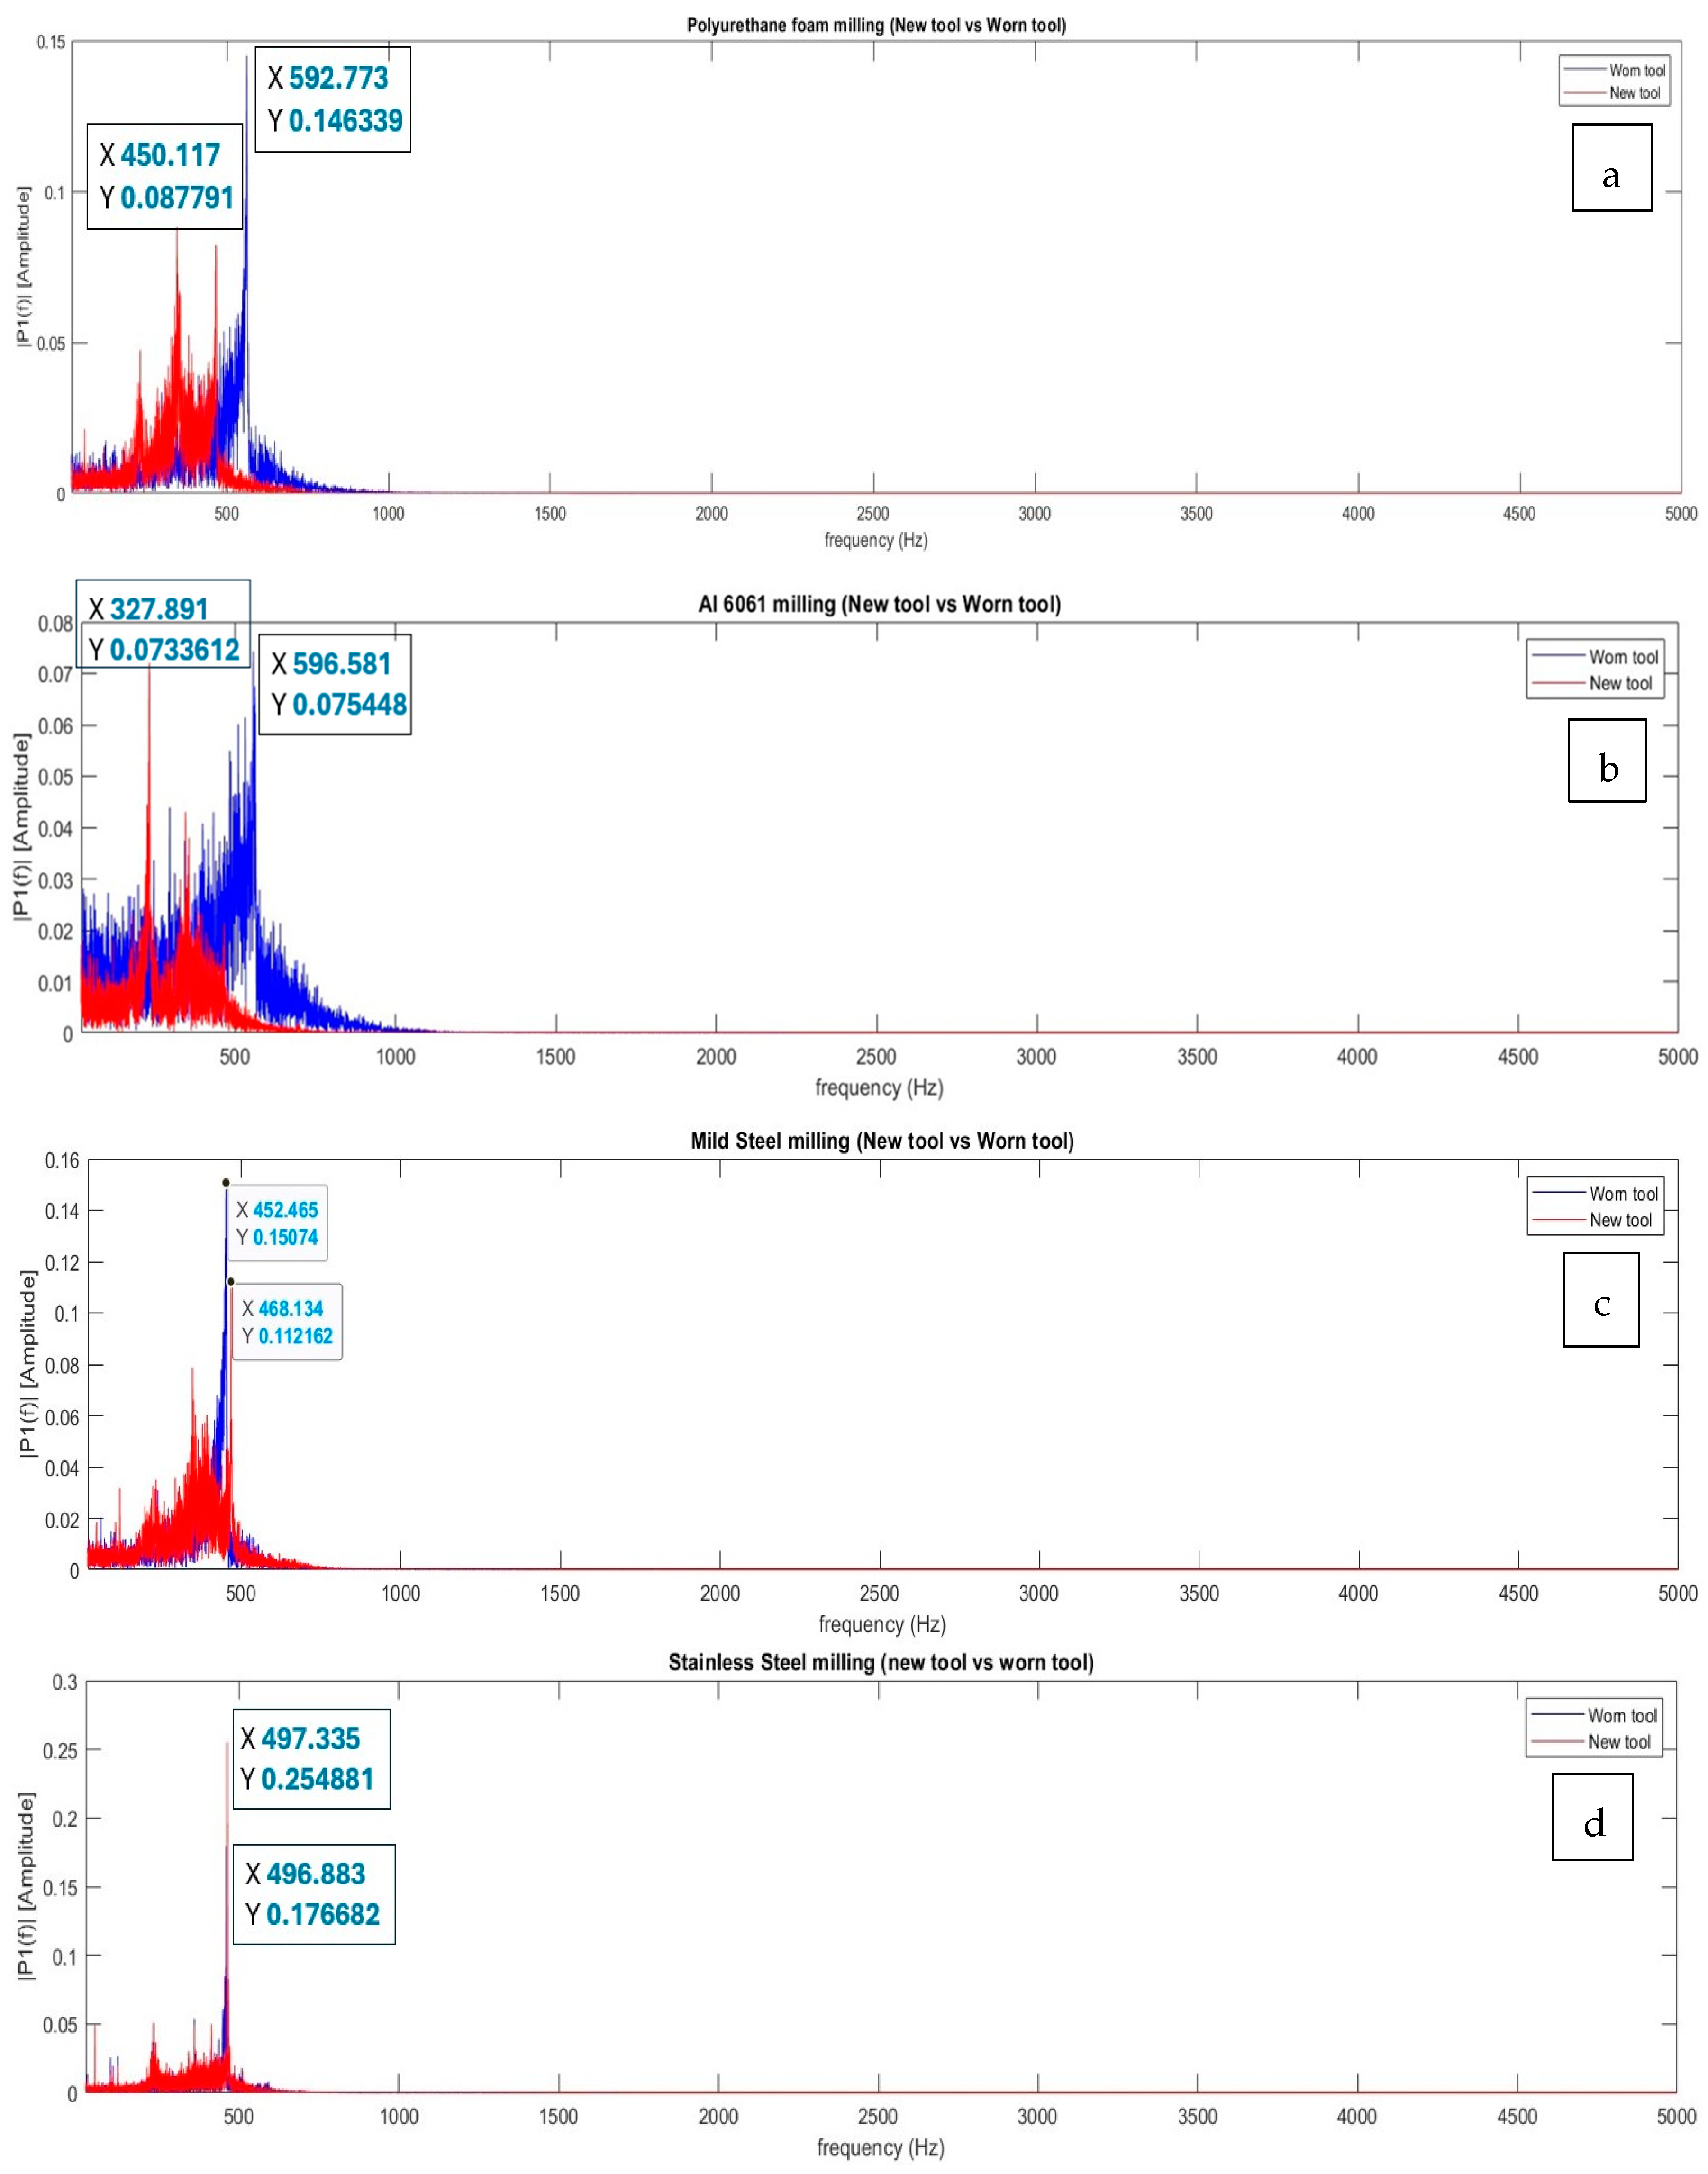
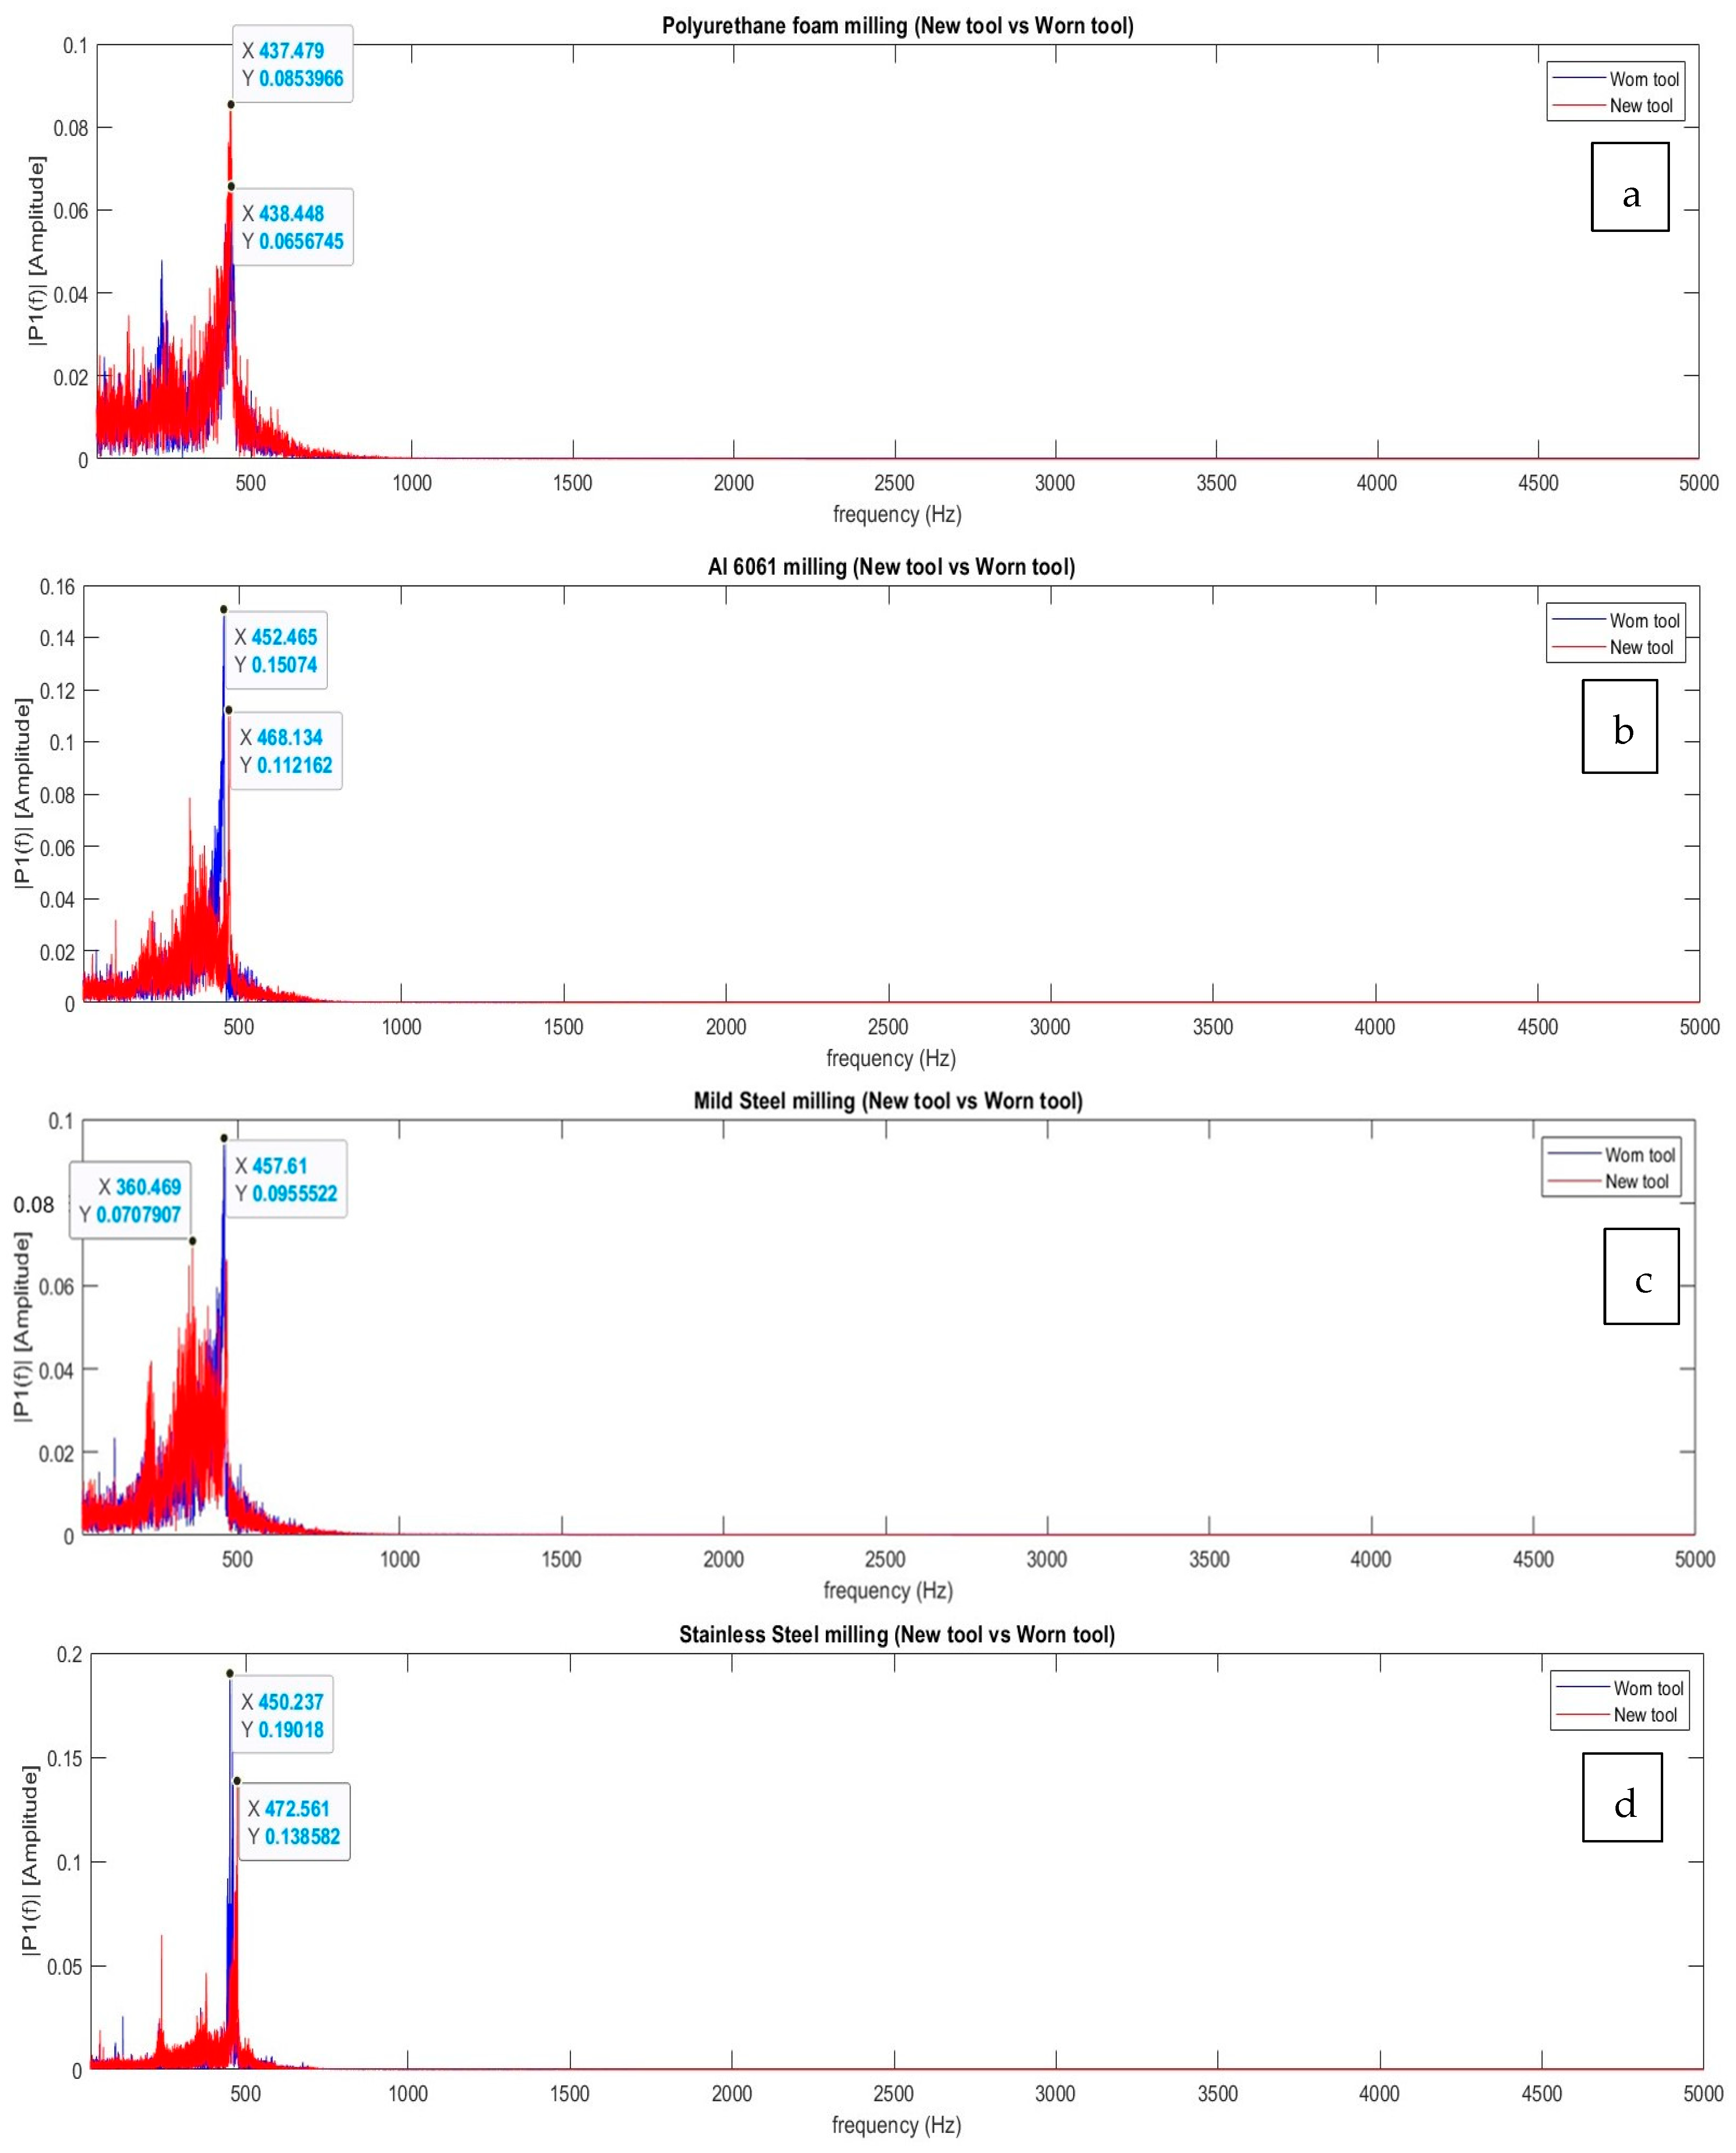
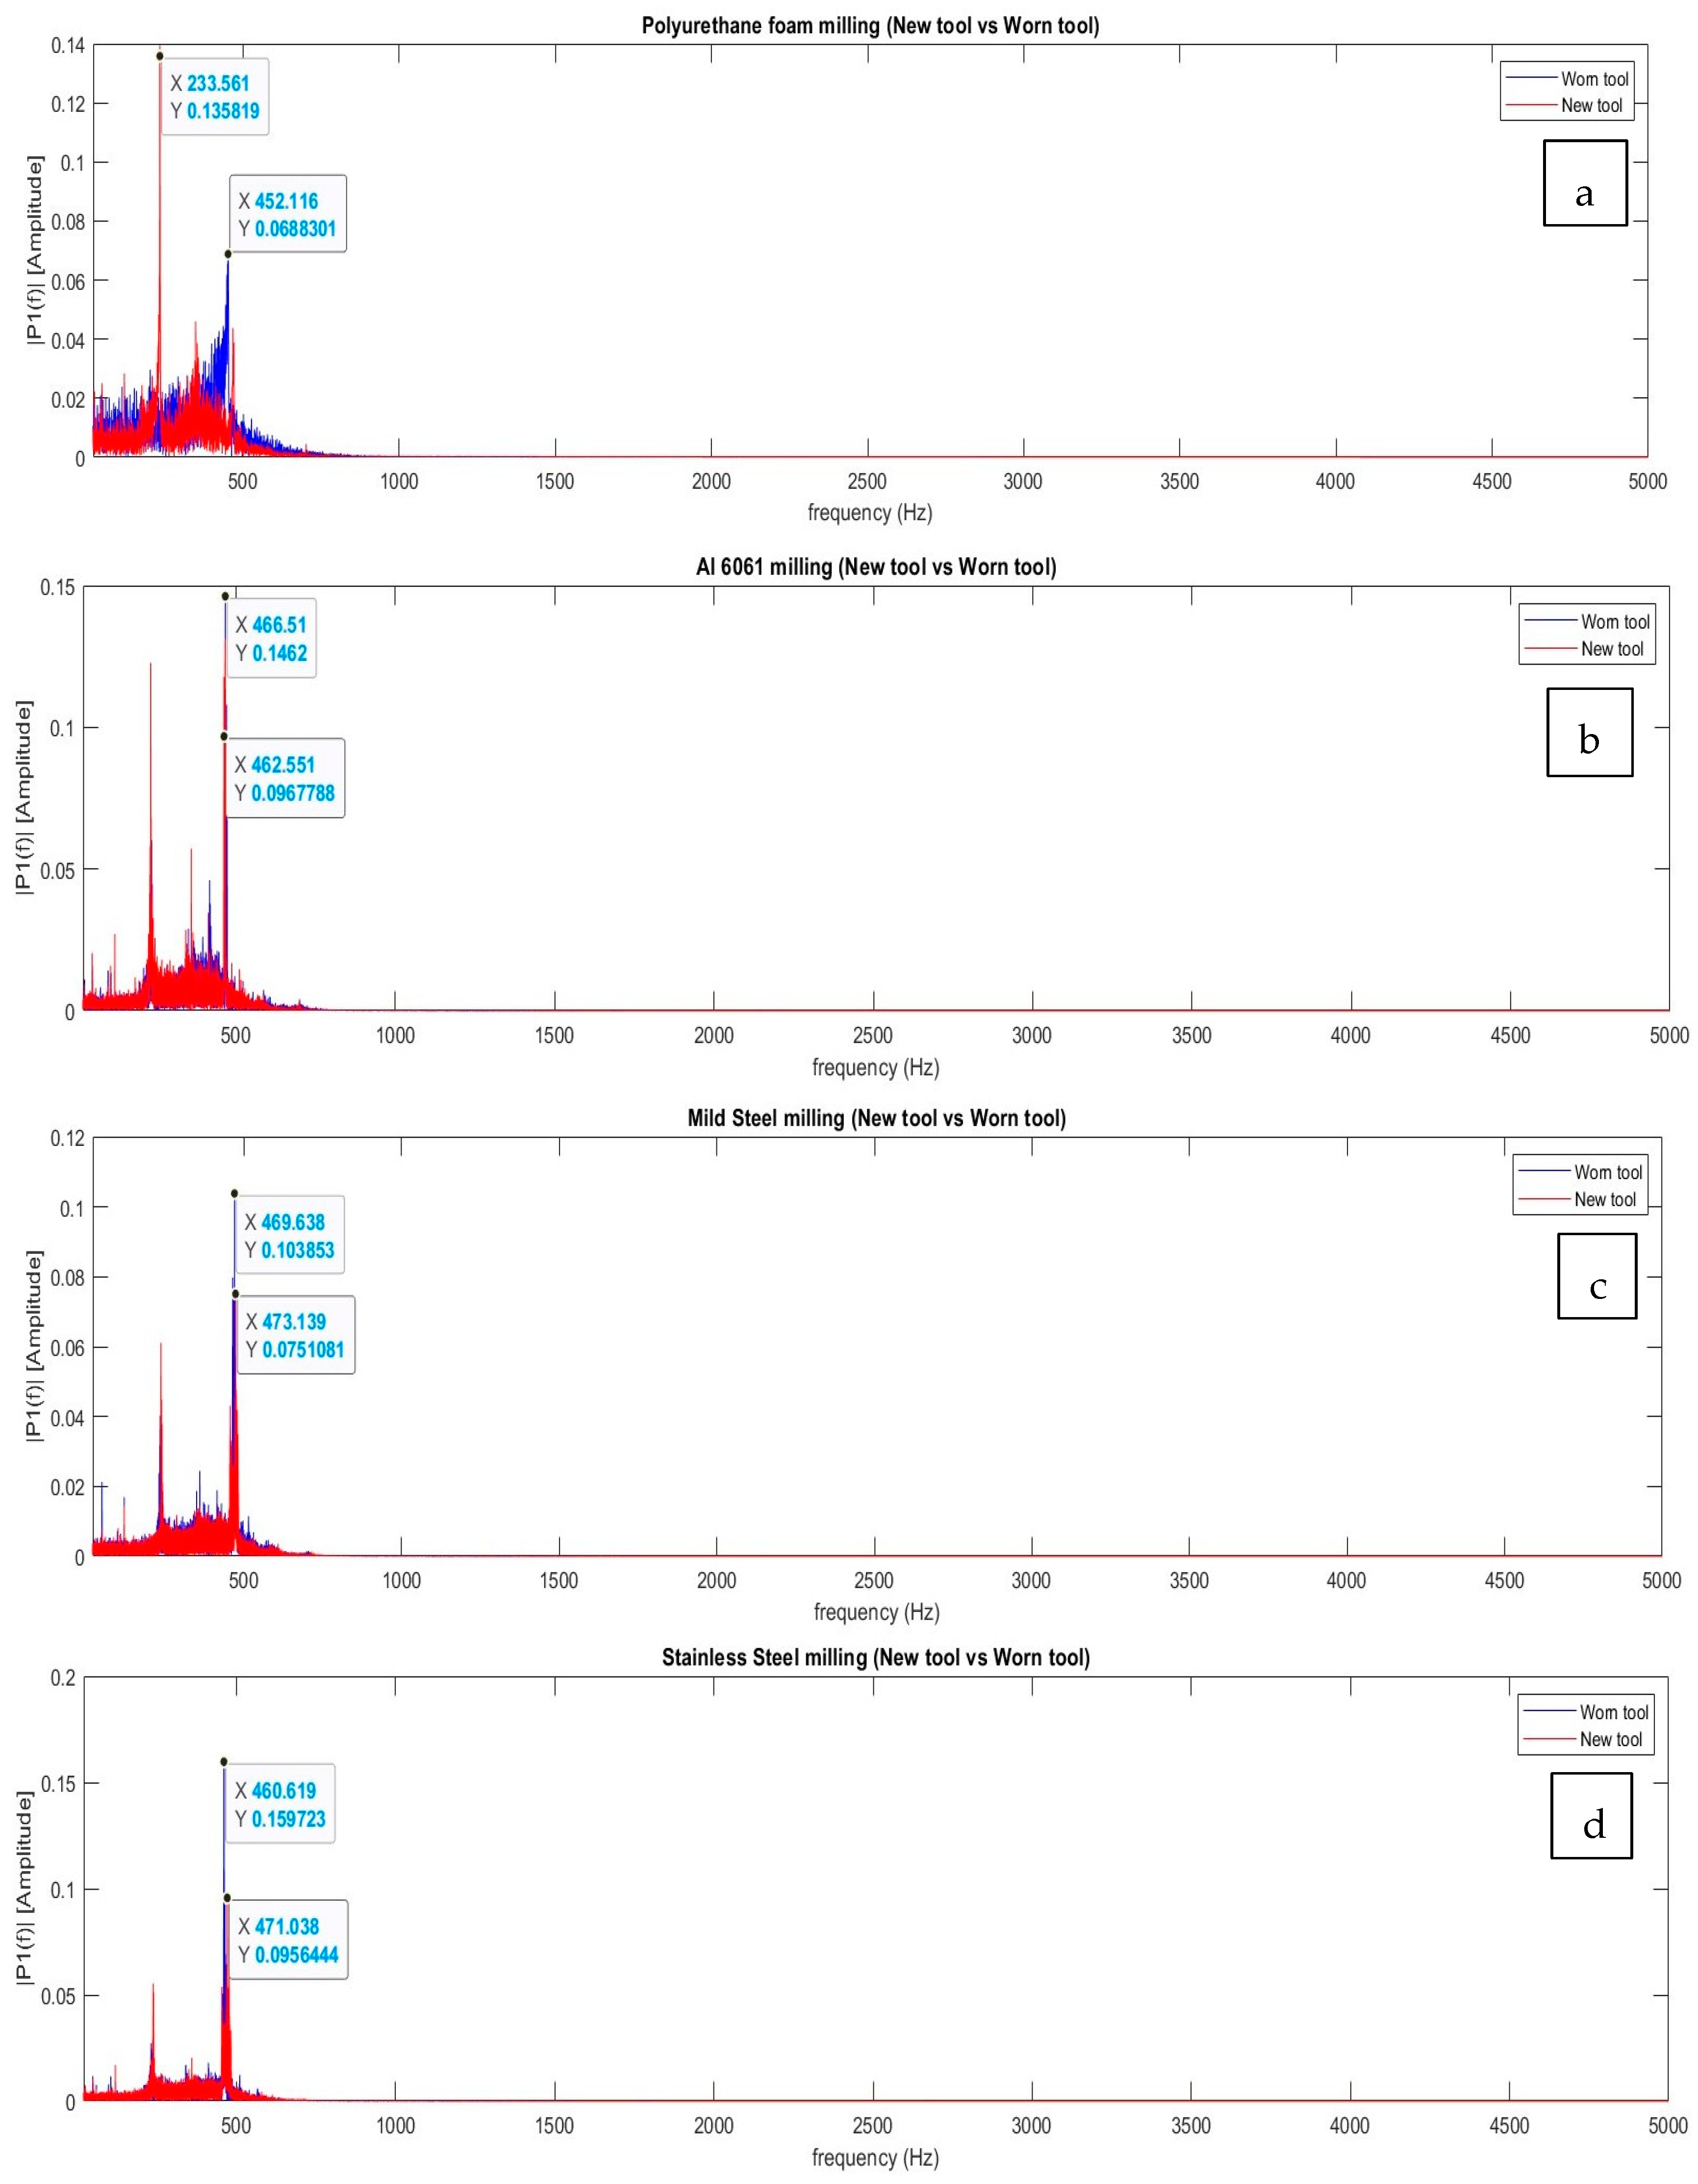
As mentioned earlier, machining induces significant vibrations at the tool–workpiece interface. The inclusion of a low-pass Butterworth filter in the analysis of vibration data is essential for isolating meaningful signal components while mitigating the effects of high-frequency noise. In milling operations, vibration signals often contain contributions from machine tool dynamics, material interactions, and ambient noise. High-frequency components, which are typically noise or irrelevant chatter artifacts, can obscure the true behavior of the machining process. Figure 12 showcases the FFT spectra for each material workpiece for the new and the worn tool. The FFT spectra plotted for the range of materials show that the initial peak in the vibrational amplitude is higher for the worn tool compared to the new tool. This can be attributed to changes in the tool’s cutting dynamics caused by wear.

Figure 12.
Filtered FFT analysis of vibration data obtained from the IFM sensor for the low-cutting-speed configuration: (a) polyurethane foam, (b) aluminum 6061, (c) mild steel, and (d) stainless steel.
As the cutting tool wears, its geometry and sharpness degrade, which affects its interactions with the workpiece. This degradation leads to increased friction, higher cutting forces, and greater tool deflection, all of which contribute to higher vibrational amplitudes in the lower frequency range. Figure 12 shows higher vibrational amplitudes for worn tools compared to new tools across all materials, with notable increases in polyurethane foam (0.146 Vrms2 vs. 0.0877 Vrms2) and stainless steel (0.254 Vrms2 vs. 0.1766 Vrms2). These results demonstrate that machining with a worn tool significantly amplifies vibrations, especially at higher frequencies, impacting machining performance. These results consistently indicate that tool wear leads to increased vibrational amplitudes, with varying frequencies observed across different materials.
3.4. Medium Cutting Speed
In this case, the experimental setup remains the same, with the only change being in the range of cutting speeds utilized. After the FFT graph was plotted, similar trends to those observed in the previous machining configuration were observed for the present machining configuration, as shown in Figure 13a–d.


Figure 13.
FFT analysis of vibration data obtained from the IFM sensor for the medium-cutting-speed configuration: (a) polyurethane foam, (b) aluminum 6061, (c) mild steel, and (d) stainless steel.
However, the variations in amplitudes across different frequency spectra are amplified when compared to the lower-cutting-speed configuration, indicating that an increase in the cutting speed can increase vibrations during the machining process. This result is similar to what was confirmed by John Stephen, et al. [40], wherein the authors altered the machining parameters when machining aluminum 6061 to observe if more vibrations were generated. In our study, this was the case across the selected range of materials for the unfiltered dataset. Similar to the previous set of FFT spectra, a low-pass Butterworth filter was then applied to eliminate high-frequency noise and observe true cutting behavior. Figure 14 illustrates the outcomes of the FFT for the filtered vibration data of worn tools compared to new tools across most materials, with significant increases in amplitude for Al 6061 (0.1507 Vrms2 vs. 0.112 Vrms2) and stainless steel (0.1902 Vrms2 vs. 0.1386 Vrms2). These findings highlight the impact of tool wear on the vibration, particularly at distinct frequencies, affecting machining dynamics. These results highlight the distinct changes in the vibrational characteristics associated with tool wear across different materials, emphasizing the impact of wear on amplitude and vibrational frequency.
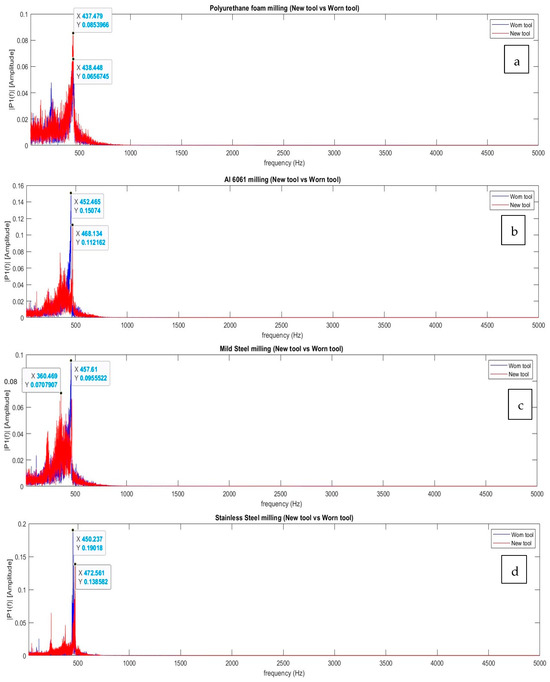
Figure 14.
Filtered FFT analysis of vibration data obtained from the IFM sensor for the medium-cutting-speed configuration: (a) polyurethane foam, (b) aluminum 6061, (c) mild steel, and (d) stainless steel.
3.5. High Cutting Speed
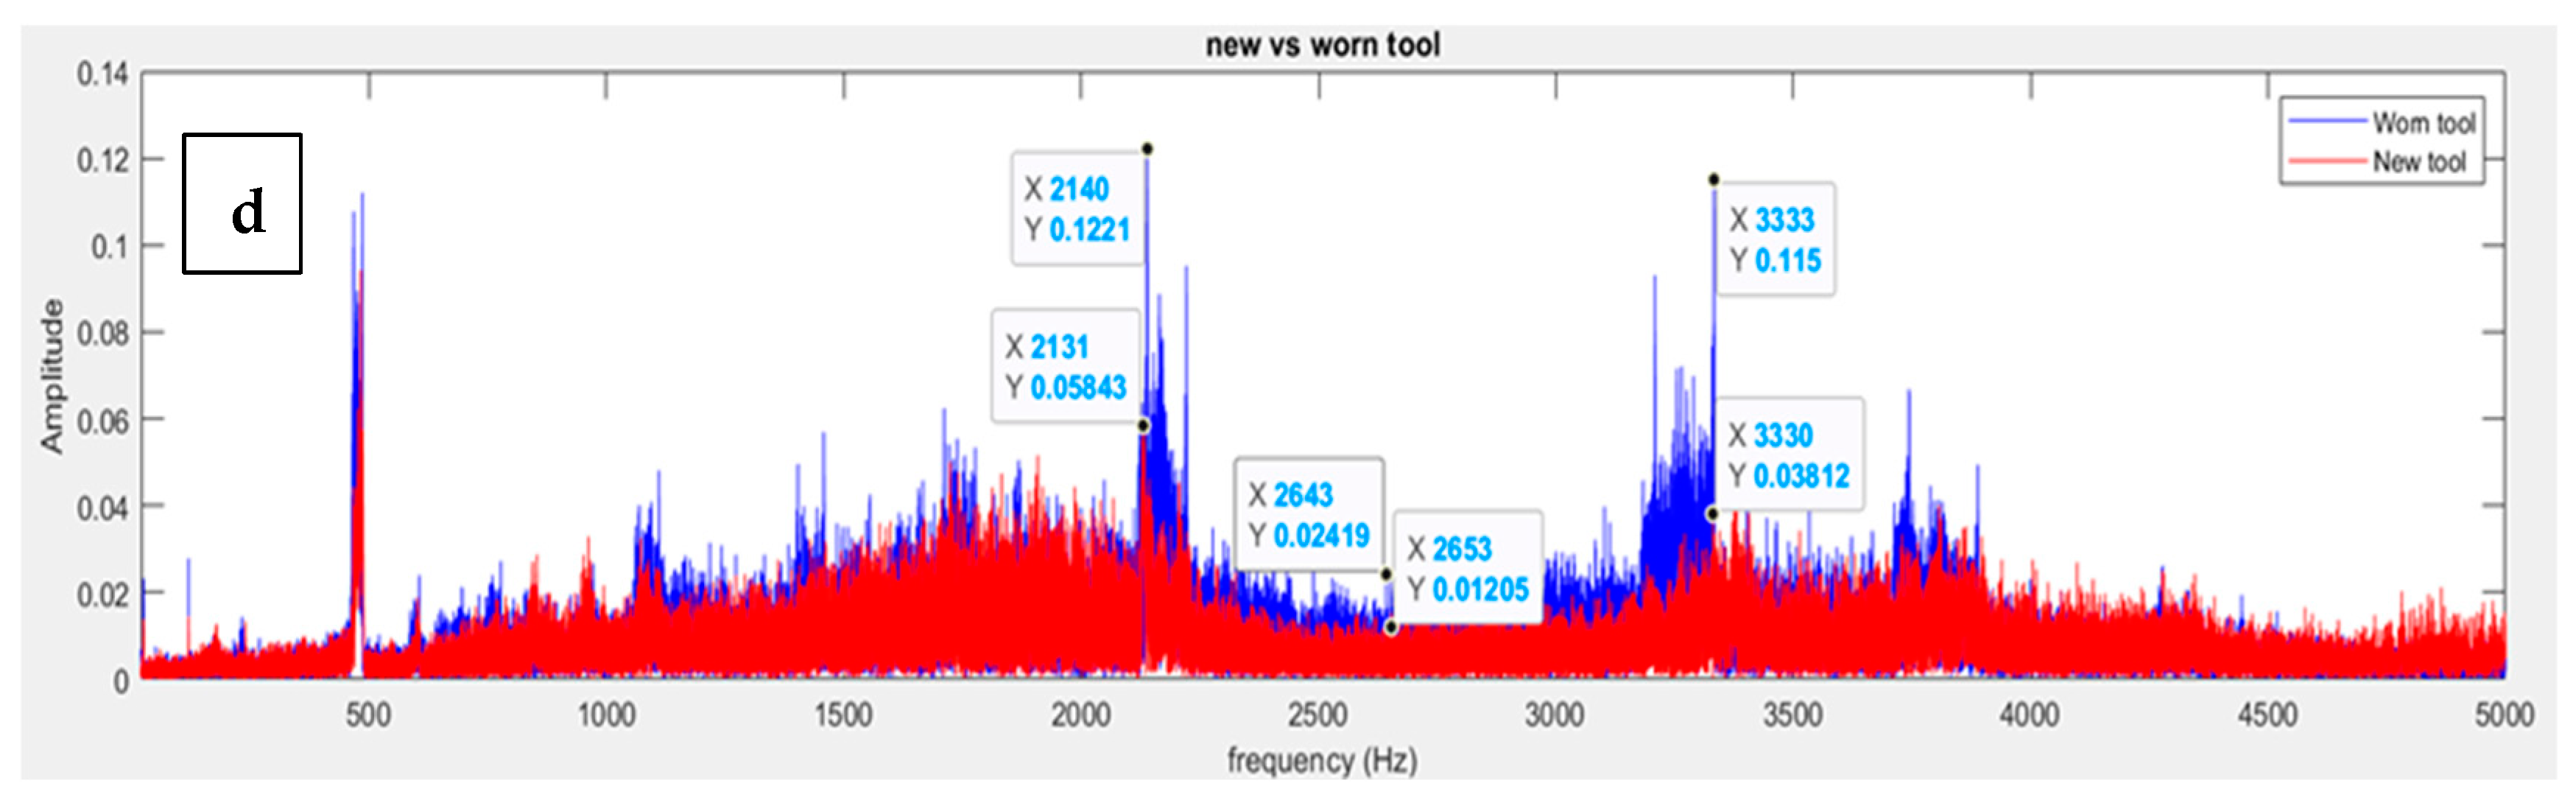
Figure 15 shows the frequency spectra for the high-cutting-speed machining scenarios. Compared to the low- and average-cutting-speed scenarios, where vibrational amplitudes between the new and the worn tool vary at certain frequencies, the amplitude of vibration for the worn tool remains higher than the new tool, fairly consistently, across numerous frequencies captured by the sensor, as can be seen in Figure 15a–d.


Figure 15.
FFT analysis of vibration data obtained from the IFM sensor for the high-cutting-speed configuration: (a) polyurethane foam, (b) aluminum 6061, (c) mild steel, and (d) stainless steel.
Haber [41] investigated the tool wear patterns during a high-speed machining process based on various signals captured by a dynamometer and an acoustic emission sensor, both in the time and frequency domains, in which high signal strengths were observed overall during the machining process. These results corroborate our findings, wherein the amplitudes of the vibration signals for the high-speed cutting configuration were considerably higher when comparing the new and the worn tools relative to the low- and medium cutting speed configurations. They also showcase a correlation between the strength of the material and vibrational amplitude. For example, in the case of aluminum 6061 (Figure 15b) at approximately 2000 Hz, the difference in amplitude between the new and the worn tools was found to be 0.0957 Vrms2, whereas the difference in amplitude in the case of stainless steel (Figure 15d) at the same frequency was 0.0637 Vrms2. This can be attributed to the higher cutting forces and the increased wear on the tool, which will serve to further deteriorate the part quality. Figure 16 highlights the FFT spectra after filtering the data. Even at the lower frequencies, the worn tool showed higher amplitudes in Al 6061 (0.1462 Vrms2 vs. 0.0967 Vrms2) and stainless steel (0.1597 Vrms2 vs. 0.0956 Vrms2), emphasizing the increased vibration caused by tool wear at specific frequencies.

Figure 16.
Filtered FFT analysis of vibration data obtained from the IFM sensor for the high-cutting-speed configuration: (a) polyurethane foam, (b) aluminum 6061, (c) mild steel, and (d) stainless steel.
4. Discussion
In the filtered FFT spectra shown in Figure 12, Figure 14, and Figure 16, the peak vibration was consistently higher for a worn tool compared to a new tool across all cutting configurations and material workpieces. This can be attributed to several factors. First, increased friction arises from the degraded cutting edges of worn tools, which leads to greater friction at the tool–workpiece interface, amplifying vibration levels at characteristic frequencies. Second, tool wear results in uneven cutting forces due to the irregular geometry of the worn edges, causing dynamic instabilities that contribute to higher vibrational amplitudes. Additionally, worn tools are less efficient at cutting, leading to more significant material deformation and resistance, which generates higher forces and translates into elevated vibrational energy. Finally, the rougher cuts produced by worn edges introduce periodic disturbances during machining, further reflected as higher peaks in the FFT spectra.
Furthermore, to understand the statistical significance of the outcomes of this study, an F-test was conducted with a 95% confidence interval. The table below presents the F-values derived from vibration data collected by two sensors, IFM and WITMOTION, comparing new and worn tools. The IFM sensor consistently produced F-values exceeding the critical threshold (F-critical = 3.841), as shown in Table 6, indicating a strong statistical significance for the differences between the vibration datasets of the new and worn tools. To further support this, the table also includes p-values for each cutting configuration and material workpiece. For the WITMOTION sensor, the F-values for polyurethane foam and Al 6061 were below the F-critical value, indicating no significant difference between new and worn tools. However, for mild steel and stainless steel, the results at the medium and high cutting speeds were similar to those of the IFM sensor, with F-values exceeding the critical threshold, and therefore confirming the statistically significant differences between the new and worn tool datasets. Previous research [39,42,43] shows that any useable data from vibration signals are identified at frequencies between 1 kHz and 2 kHz or higher for tougher materials such as inconel, titanium, and nickel alloys. This highlights the need to use a sensor with high sampling frequency (such as the IFM accelerometer) when machining materials with higher yield strength in order to provide useful machining data to monitor the health and wear of the cutting tools.
Table 6.
F and p-values for each of the tests conducted.
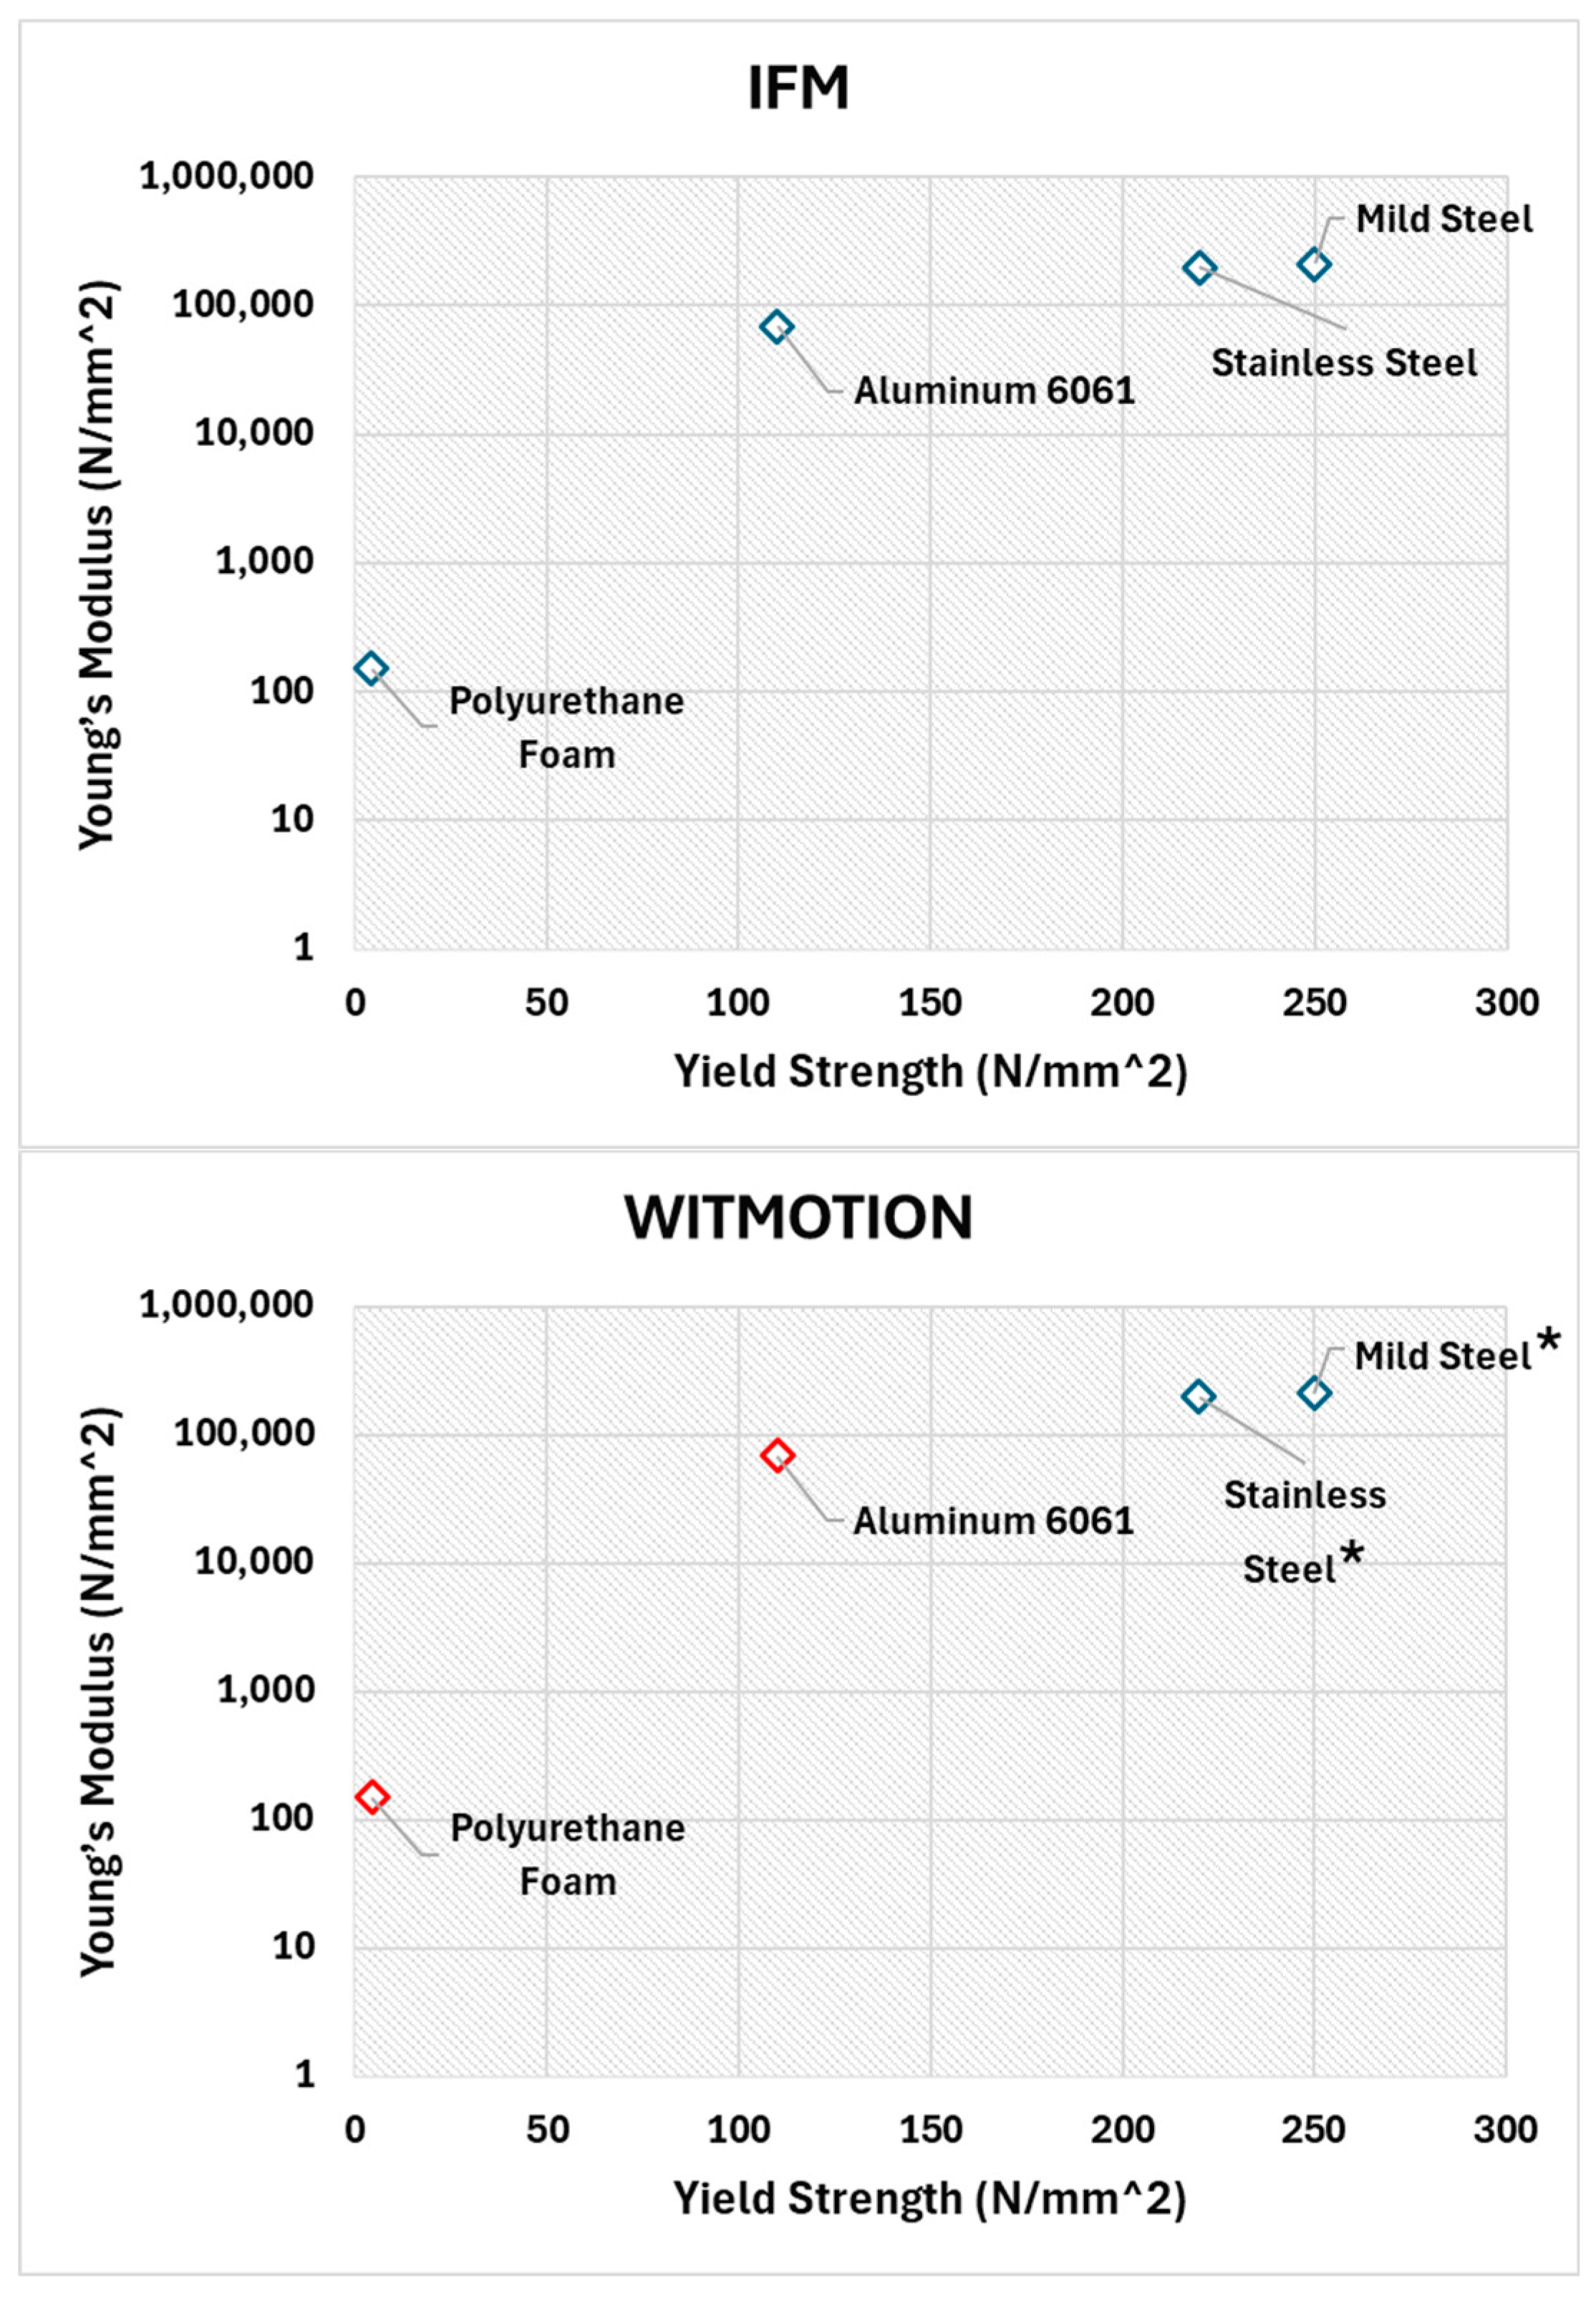
Figure 17 provides an overview of the yield strength and Young’s modulus for each cutting speed configuration across the materials that were machined. This chart serves as a visual representation of the diverse mechanical properties exhibited by the materials under investigation. By plotting these properties, it is possible to discern the relationships between material characteristics and machining outcomes, providing valuable insights into material selection and tooling strategies for optimized machining processes. In Figure 17, the materials highlighted in blue analyzing data from the IFM and WITMOTION sensors had statistically significant differences (above F-critical and p-values less than 0.05) when comparing the vibrations from machining with a new and worn tool.

Figure 17.
Range of materials captured by the IFM and WITMOTION sensors. Materials in blue (F > 3.841, p < 0.05) are statistically significant (materials with an asterisk [*] had significant results in the medium and high cutting speeds only), indicating that tool wear effects were detected. Materials in red (F < 3.841 and/or p > 0.05) are statistically insignificant.
5. Conclusions
After performing end milling operations using two- and four-flute endmills on a set of low- to high-yield-strength materials and analyzing vibration data through FFT and statistical analyses, the following conclusions can be made:
- Vibrational amplitudes for the worn tool while using the IFM sensor were considerably higher than those obtained using the new tool. The statistical analysis suggests the same, with F-values being above F-critical (3.841) and p-values being less than 0.05 for every cutting speed configuration.
- There is a potential for the p-values to be less than 0.05 for the polyurethane foam and Al 6061 workpieces, indicating statistical significance in the datasets obtained from the WITMOTION sensor. However, the tests conducted for this experiment all ranged from approximately 9 to 30 min. Future research could focus on evaluating the statistical significance in vibration data for these workpieces when using a longer and more complex machining process to potentially yield statistical significance in the datasets.
- Vibrational amplitudes are greatly influenced by the material strength and the machining parameters (i.e., cutting speed, feed rate, and number of flutes). Vibrational amplitudes in the frequency spectra increased when milling higher-yield-strength materials at higher cutting speeds and feed rates.
- In the case of the low-cutting-speed scenarios, differences in vibrational amplitudes only began to appear when machining metals (specifically, mild and stainless steel) as high sampling frequencies as opposed to polyurethane foam. The amplitudes between the new and the worn tool varied more distinctly during the medium and high cutting speed configurations.
- The F-test was also conducted for data sets from the WITMOTION accelerometer. However, variations in the results were not statistically significant for the tests conducted for the aluminum 6061 and polyurethane foam samples. To reach statistical significance, it is recommended to utilize sensors with a frequency range of at least 1000 Hz or higher. Increasing the frequency range further enhances the potential to capture statistically significant data.
- This research primarily focused on analyzing the effects of tool wear through vibration data rather than investigating the cause of specific wear types, such as flank wear. The aspect of wear mechanics, especially under varying vibrational loads, is a potential topic for future research, potentially incorporating additional analyses such as SEM-EDS to study thermal effects and material transfer.
With manufacturing industries adopting smart machining practices to preserve tool life and improve part quality, the implementation of TCM for various machining operations has more potential than ever. TCM has several advantages over conventional machining operations as it provides the manufacturer with tool health data that provide a roadmap for manufacturers to identify the crucial parameters of their assets and to choose the appropriate technology that caters to those parameters. From the use cases shown in this paper, it can be said that the investment in TCM for existing manufacturing assets would allow for asset management and aid in predicting useful life. Although the implementation of TCM in milling processes has previously been investigated by researchers, it has been limited with respect to the workpiece materials. Utilizing this technique across a range of workpiece materials, such as polyurethane foam and metals, for machining provides more versatility for industrial applications. Additionally, the temperature variations that occur during the machining process can significantly influence tool wear patterns and may even alter the composition of the tool material. High temperatures can lead to fusion between the workpiece and tool materials, resulting in a modified material composition that can impact the quality of the machining process. This can be effectively studied using SEM-EDS analysis, which can detect trace amounts of the workpiece material on the tool. Therefore, we recommend that future work investigates the data acquisition requirements for alternative machining processes (drilling, turning, and grinding) to examine tool wear-related behavior as well as to explore the relationship between cutting tool vibrations and tool wear resulting from material composition changes at elevated temperatures. This broader perspective will allow manufacturers and researchers alike to have a more comprehensive understanding of the condition of the cutting tool during the machining process.
Author Contributions
Conceptualization, S.N. and N.D.-E.; Methodology, S.N. and N.D.-E.; Formal analysis, S.N.; Investigation, S.N.; Resources, N.D.-E.; Data curation, S.N. and N.D.-E.; Writing—original draft, S.N.; Writing—review & editing, S.N. and N.D.-E.; Supervision, N.D.-E.; Funding acquisition, N.D.-E. All authors have read and agreed to the published version of the manuscript.
Funding
This research was funded by the College of Engineering at the University of South Florida, the Alfred P. Sloan Foundation, Sloan Scholars Mentoring Network, and the Florida Advanced Technological Education Center (FLATE).
Data Availability Statement
The data will be made available upon reasonable request.
Acknowledgments
The authors would also like to acknowledge Torrent Photonics for the use of their metrology instruments.
Conflicts of Interest
The authors declare no conflict of interest.
Nomenclature
| D, R, Rr, Rz | Parametric radial dimensions of the end mill |
| xj, yj, zj | Coordinates of the cutting point on flute j |
| Nr | Radial offsets of the end mill profile |
| Nz | Axial offsets of the end mill profile |
| Rotation angle of the cutting edge | |
| Pitch angle of flute j | |
| Radial immersion angle for flute j | |
| , kj) | Chip thickness at a point specified by (, kj) |
| Radial lag angle | |
| kj | Axial immersion angle for flute j |
| Ψ2s, Ψ1e, Ψae | Starting and final lag angles at the cutter tip generated by the taper zone |
| i(z) | Helix angle |
| io | Localized helix angle |
| Stj | Feed per tooth for tooth j |
| vf | Feed rate |
| dFr, dFt, dFa | Differential tangential, radial, and axial forces |
| Ktc, Krc, Kac | Cutting force coefficients in the tangential, radial, and axial directions |
| Kte, Kre, Kae | Edge force coefficients in the tangential, radial, and axial directions |
| dS | Infinitesimal cutting edge length |
| db | Projected length of an infinitesimal cutting flute in the direction of cutting velocity |
| Fx, Fy, Fz | Force components along the x-, y-, and z-axes |
| Nf | Number of flutes |
| n | Spindle speed |
References
- Diaz-Elsayed, N.; Hernandez, L.; Rajamani, R. A framework for the health-ready characterization of manufacturing systems. Manuf. Lett. 2021, 29, 56–60. [Google Scholar]
- Khan, A.M.; He, N.; Li, L.; Zhao, W.; Jamil, M. Analysis of productivity and machining efficiency in sustainable machining of titanium alloy. Procedia Manuf. 2020, 43, 111–118. [Google Scholar]
- Zhou, Y.; Xue, W. Review of tool condition monitoring methods in milling processes. Int. J. Adv. Manuf. Technol. 2018, 96, 2509–2523. [Google Scholar]
- Mohanraj, T.; Shankar, S.; Rajasekar, R.; Sakthivel, N.; Pramanik, A. Tool condition monitoring techniques in milling process—A review. J. Mater. Res. Technol. 2020, 9, 1032–1042. [Google Scholar]
- Dimla, D., Sr.; Lister, P.M. On-line metal cutting tool condition monitoring.: I: Force and vibration analyses. Int. J. Mach. Tools Manuf. 2000, 40, 739–768. [Google Scholar]
- Stavropoulos, P.; Papacharalampopoulos, A.; Vasiliadis, E.; Chryssolouris, G. Tool wear predictability estimation in milling based on multi-sensorial data. Int. J. Adv. Manuf. Technol. 2016, 82, 509–521. [Google Scholar]
- Wang, W.; Hong, G.-S.; Wong, Y.; Zhu, K. Sensor fusion for online tool condition monitoring in milling. Int. J. Prod. Res. 2007, 45, 5095–5116. [Google Scholar]
- Zhou, Y.; Xue, W. A multisensor fusion method for tool condition monitoring in milling. Sensors 2018, 18, 3866. [Google Scholar] [CrossRef]
- Wang, M.; Wang, J. CHMM for tool condition monitoring and remaining useful life prediction. Int. J. Adv. Manuf. Technol. 2012, 59, 463–471. [Google Scholar]
- Yin, X.; Zhang, B.; Zhou, Z.; Han, X.; Wang, Z.; Hu, G. A new health estimation model for CNC machine tool based on infinite irrelevance and belief rule base. Microelectron. Reliab. 2018, 84, 187–196. [Google Scholar]
- Koike, R.; Ohnishi, K.; Aoyama, T. A sensorless approach for tool fracture detection in milling by integrating multi-axial servo information. CIRP Ann. 2016, 65, 385–388. [Google Scholar] [CrossRef]
- Hsieh, W.-H.; Lu, M.-C.; Chiou, S.-J. Application of backpropagation neural network for spindle vibration-based tool wear monitoring in micro-milling. Int. J. Adv. Manuf. Technol. 2012, 61, 53–61. [Google Scholar] [CrossRef]
- Gao, C.; Xue, W.; Ren, Y.; Zhou, Y. Numerical control machine tool fault diagnosis using hybrid stationary subspace analysis and least squares support vector machine with a single sensor. Appl. Sci. 2017, 7, 346. [Google Scholar] [CrossRef]
- Madhusudana, C.; Kumar, H.; Narendranath, S. Fault diagnosis of face milling tool using decision tree and sound signal. Mater. Today Proc. 2018, 5, 12035–12044. [Google Scholar] [CrossRef]
- Lee, B. Application of the discrete wavelet transform to the monitoring of tool failure in end milling using the spindle motor current. Int. J. Adv. Manuf. Technol. 1999, 15, 238–243. [Google Scholar] [CrossRef]
- Ghosh, N.; Ravi, Y.; Patra, A.; Mukhopadhyay, S.; Paul, S.; Mohanty, A.; Chattopadhyay, A. Estimation of tool wear during CNC milling using neural network-based sensor fusion. Mech. Syst. Signal Process. 2007, 21, 466–479. [Google Scholar] [CrossRef]
- Bahr, B.; Motavalli, S.; Arfi, T. Sensor fusion for monitoring machine tool conditions. Int. J. Comput. Integr. Manuf. 1997, 10, 314–323. [Google Scholar] [CrossRef]
- Mannan, M.; Kassim, A.A.; Jing, M. Application of image and sound analysis techniques to monitor the condition of cutting tools. Pattern Recognit. Lett. 2000, 21, 969–979. [Google Scholar] [CrossRef]
- Okokpujie, I.P.; Ikumapayi, O.M.; Okonkwo, U.C.; Salawu, E.Y.; Afolalu, S.A.; Dirisu, J.O.; Nwoke, O.N.; Ajayi, O.O. Experimental and mathematical modeling for prediction of tool wear on the machining of aluminium 6061 alloy by high speed steel tools. Open Eng. 2017, 7, 461–469. [Google Scholar] [CrossRef]
- Özbek, O.; Saruhan, H. The effect of vibration and cutting zone temperature on surface roughness and tool wear in eco-friendly MQL turning of AISI D2. J. Mater. Res. Technol. 2020, 9, 2762–2772. [Google Scholar] [CrossRef]
- Alonso, F.; Salgado, D. Analysis of the structure of vibration signals for tool wear detection. Mech. Syst. Signal Process. 2008, 22, 735–748. [Google Scholar]
- Pimenov, D.Y.; Gupta, M.K.; da Silva, L.R.; Kiran, M.; Khanna, N.; Krolczyk, G.M. Application of measurement systems in tool condition monitoring of Milling: A review of measurement science approach. Measurement 2022, 199, 111503. [Google Scholar]
- Liu, C.; Wang, G.; Li, Z. Incremental learning for online tool condition monitoring using Ellipsoid ARTMAP network model. Appl. Soft Comput. 2015, 35, 186–198. [Google Scholar]
- Möhring, H.-C.; Kimmelmann, M.; Eschelbacher, S.; Güzel, K.; Gauggel, C. Process monitoring on drilling fiber-reinforced plastics and aluminum stacks using acoustic emissions. Procedia Manuf. 2018, 18, 58–67. [Google Scholar]
- Bouchareb, A.; Lagred, A.; Amirat, A. Effect of the interaction between depth of cut and height-to-width ratio of a workpiece on vibration amplitude during face milling of C45 steel. Int. J. Adv. Manuf. Technol. 2019, 104, 1221–1227. [Google Scholar]
- Prasad, B.S.; Prabha, K.A.; Kumar, P.G. Condition monitoring of the turning process using an infrared thermography technique—An experimental approach. Infrared Phys. Technol. 2017, 81, 137–147. [Google Scholar]
- Hafner, R.; Pušavec, F.; Čerče, L.; Kopač, J. Influence of milling process on machined surface of porous polyurethane (PU) foam. Teh. Vjesn. 2016, 23, 1089–1093. [Google Scholar]
- de Jesus, R.-T.R.; Gilberto, H.-R.; Ivan, T.-V.; Carlos, J.-C.J. Driver current analysis for sensorless tool breakage monitoring of CNC milling machines. Int. J. Mach. Tools Manuf. 2003, 43, 1529–1534. [Google Scholar]
- Wei, J.C.; Crezee, W.H.; Jongeneel, H.; De Haas, T.S.; Kool, W.L.; Blaauw, B.J.; Dankelman, J.; Horeman, T. Using acoustic vibrations as a method for implant insertion assessment in total hip arthroplasty. Sensors 2022, 22, 1609. [Google Scholar] [CrossRef]
- Goossens, Q.; Leuridan, S.; Henyš, P.; Roosen, J.; Pastrav, L.; Mulier, M.; Desmet, W.; Denis, K.; Vander Sloten, J. Development of an acoustic measurement protocol to monitor acetabular implant fixation in cementless total hip Arthroplasty: A preliminary study. Med. Eng. Phys. 2017, 49, 28–38. [Google Scholar]
- Engin, S.; Altintas, Y. Mechanics and dynamics of general milling cutters.: Part I: Helical end mills. Int. J. Mach. Tools Manuf. 2001, 41, 2195–2212. [Google Scholar]
- Engin, S.; Altintas, Y. Mechanics and dynamics of general milling cutters.: Part II: Inserted cutters. Int. J. Mach. Tools Manuf. 2001, 41, 2213–2231. [Google Scholar]
- FOberg, D.J.E.; Horton, H.L.; Ryffel, H.H.; McCauley, C.J. Machinery’s Handbook, 31st ed.; Industrial Press: New York, NY, USA, 2016. [Google Scholar]
- Sawbones. Solid Rigid Polyurethane Foam. Available online: https://www.sawbones.com/media/assets/product/documents/Solid_Rigid_Polyurethane_Foam_Properties_V03.pdf (accessed on 8 February 2025).
- Callister, W.D., Jr.; Rethwisch, D.G. Materials Science and Engineering: An Introduction; John Wiley & Sons: Hoboken, NJ, USA, 2020. [Google Scholar]
- Trent, E.M.; Wright, P.K. Metal Cutting; Butterworth-Heinemann: Oxford, UK, 2000. [Google Scholar]
- ISO 8688-2:1989; Tool Life Testing in Milling—Part 2: End Milling. International Organization for Standardization: Geneva, Switzerland, 1989.
- ISO 3685:1993; Tool-Life Testing with Single-Point Turning Tools. International Organization for Standardization: Geneva, Switzerland, 1993.
- Bhuiyan, M.; Choudhury, I.; Dahari, M. Monitoring the tool wear, surface roughness and chip formation occurrences using multiple sensors in turning. J. Manuf. Syst. 2014, 33, 476–487. [Google Scholar]
- John Stephen, R.; Thangeswari, T.; Palani, S. Condition Monitoring in Drilling Operation based on Vibration Signals. Int. J. Recent Technol. Eng. 2019, 8, 1272–1277. [Google Scholar]
- Haber, R.E.; Jiménez, J.E.; Peres, C.R.; Alique, J.R. An investigation of tool-wear monitoring in a high-speed machining process. Sens. Actuators A Phys. 2004, 116, 539–545. [Google Scholar]
- Wei, C.C.; Chung, H.Y.; Zhang, J.B. The Study of Band Sawing Vibration and Cutting Performance. Key Eng. Mater. 2015, 642, 236–241. [Google Scholar]
- Kumar, A.; Ramkumar, J.; Verma, N.K.; Dixit, S. Detection and classification for faults in drilling process using vibration analysis. In Proceedings of the 2014 International Conference on Prognostics and Health Management, Cheney, WA, USA, 22–25 June 2014; IEEE: Piscataway, NJ, USA; pp. 1–6. [Google Scholar]


Disclaimer/Publisher’s Note: The statements, opinions and data contained in all publications are solely those of the individual author(s) and contributor(s) and not of MDPI and/or the editor(s). MDPI and/or the editor(s) disclaim responsibility for any injury to people or property resulting from any ideas, methods, instructions or products referred to in the content. |
© 2025 by the authors. Licensee MDPI, Basel, Switzerland. This article is an open access article distributed under the terms and conditions of the Creative Commons Attribution (CC BY) license (https://creativecommons.org/licenses/by/4.0/).