Article

Sensitivity Analysis Based on E-TOPSIS Combined with MORIME-Based Multi-Objective Optimization for Sprayer Frame Design Optimization

School of Electrical and Mechanical Engineering, Sichuan Agricultural University, Yaan 625014, China
*
Author to whom correspondence should be addressed.
Machines 2025, 13(3), 201; https://doi.org/10.3390/machines13030201
Submission received: 10 January 2025 / Revised: 15 February 2025 / Accepted: 21 February 2025 / Published: 28 February 2025
(This article belongs to the Section Machine Design and Theory)

Abstract

:
This study establishes a sensitivity evaluation system based on the E-TOPSIS method and combines it with the MORIME algorithm for the optimization design of the frame. First, a three-dimensional model and a finite element analysis model of the frame were developed. The loading conditions of the frame were then analyzed, followed by static and modal analyses. Modal data of the frame were also extracted. The experimental results prove the reliability of the established finite element model and the subsequent optimization results. A sensitivity evaluation system based on the E-TOPSIS method was established in this study. Using this system, the sensitivity of the frame components with respect to three different performance parameters was analyzed, enabling the scientific and rapid selection of 17 design variables and significantly reducing the optimization workload. The experimental design was then conducted using Latin hypercube sampling and CCD sampling methods. Finally, the multi-objective lightweight design of the selected components was performed based on the MORIME algorithm. After optimization, the stress increased by 12.01% and 1.52% under two operating conditions, while deformation increased by 0.647 mm and 0.607 mm, and the frame mass was reduced by 22.754 kg, a decrease of 12.8%. The experimental results demonstrate the effectiveness of the proposed method.

1. Introduction

The lightweight design of the frame is a key aspect of machine optimization. While reducing weight, it is crucial to ensure that the frame’s strength meets the required operational standards and safety requirements. Traditional lightweighting methods often lack the scientific selection of design parameters and components; instead, they typically apply lightweighting across all parts indiscriminately. Since engineering optimization problems require numerous iterations for resolution, traditional methods can be extremely labor-intensive [1].
Previous research on multi-objective lightweighting has primarily focused on two areas. The first is improving the algorithms used for lightweighting to enhance optimization speed and accuracy. Hosseini et al. [2] proposed improvements to the non-dominated sorting genetic algorithm (NSGA-II), incorporating the group method of data handling (GMDH) for modeling objective functions. By using an evolutionary Pareto-based optimization approach, polynomial models were utilized to plot Pareto fronts, and TOPSIS was employed to calculate the optimal commercial points. Liu et al. [3] proposed a two-stage optimization design method integrating zero-order optimization, parameter rounding, and structural re-optimization. Using this approach, a lightweight structural optimization design system was developed for gantry machine tools, incorporating parametric design, lightweight design, and other functions. After optimization, the frame’s weight was reduced by 9.24%. Tang et al. [1] constructed a Kriging surrogate model using sample points and response values, replacing the actual model for optimization. Finally, a multi-condition, multi-objective optimization mathematical model was established for the frame, with objectives including minimum weight, maximum first-order natural frequency, and minimum stress under full-load bending and torsion conditions. Cui et al. [4] employed the Morris method to analyze the sensitivity relationship between design variables and objective functions. They combined computational fluid dynamics (CFD) and radial basis function (RBF) neural networks to establish the response relationship between design variables and optimization objectives and used a genetic algorithm for optimizing the centrifugal impeller. Zhou et al. [5] proposed a planning framework that combines multi-objective optimization with fuzzy multi-criteria decision making (MCDM). By using a decomposition-based multi-objective state transition algorithm (MOSTA/D), a Pareto set was generated to achieve a balance among multiple conflicting objectives. Li et al. [6] introduced a data-driven engine cover optimization design method. To address the multi-objective constrained problem with mixed variables, several strategies were used to improve the newly proposed single-objective optimization algorithm. Another approach focuses on determining the optimal solution to the optimization problem from the solution set using mathematical methods. Wang et al. [7] proposed an optimization strategy that integrates contribution analysis, experimental design, surrogate models, and the preference selection index (PSI) method, establishing an efficient multi-objective lightweight design method for heavy-duty commercial vehicle frames. Ebrahimi-Nejad et al. [8] derived the vibration control equations for a selected sports car suspension system using the Lagrangian equation and performed multi-objective optimization using the TOPSIS method by selecting the optimal solutions for CS and KS, as well as minimizing the maximum acceleration and displacement of unsprung mass and spring mass. Wang et al. [9] proposed a hybrid method that combines the improved particle swarm optimization algorithm (MPSO), the ideal solution similarity ranking preference technique (TOPSIS), and principal component analysis (PCA). After multi-objective optimization, the TOPSIS method combined with PCA was used to filter the Pareto optimal solution set. Ni et al. [10] integrated the response surface method with the genetic algorithm to improve optimization efficiency and accuracy. Adjei et al. [11] combined free-form surface methods with multi-objective genetic algorithms and employed sparse active subspaces to develop an efficient multi-objective optimization strategy for turbine blade design. Li et al. [12] constructed an RBF-Kriging hybrid surrogate model and coupled it with an archive micro-genetic algorithm. For the Pareto optimal solution set generated from multi-objective optimization, they proposed a fuzzy analytic hierarchy process—TOPSIS (FAHP-TOPSIS) method. This method was used to rank the Pareto efficient solutions based on their overall performance and select the optimal solution.
The Technique for Order of Preference by Similarity to Ideal Solution (TOPSIS) is a multi-attribute decision-making method. Before using TOPSIS, it is necessary to determine the weights of different design variables [13]. Common methods for determining weights include the best–worst method [14], the variation coefficient method [15], and the entropy method, among others. Among these, the entropy-based TOPSIS (E-TOPSIS) is a typical method for weight determination based on diversity [13]. The E-TOPSIS method has been widely applied in various fields, including trend analysis, user matching evaluation [16], and feature ranking [17]. Nguyen et al. [18] studied the effects of cutting parameters during the electrical discharge machining (EDM) of Ti-6Al-4V alloy on surface roughness (Ra), cutting time (t), and material removal rate (MRR). The E-TOPSIS method was used to analyze the Pareto solutions, ultimately determining the optimal solution. Jiang et al. [19] used E-TOPSIS to optimize the layering of CFRP bumpers with the objectives of minimizing mass, maximizing specific energy absorption, and minimizing the peak collision force and intrusion depth. The results showed that, under the same crashworthiness requirements, the optimized CFRP bumper was 76.82% lighter than the original steel bumper. Chen et al. [20] applied a combination of dynamic time warping (DTW), entropy-weighted TOPSIS, and system clustering methods to propose an improved entropy-weighted TOPSIS approach for wear state evaluation. They also validated the effectiveness of the improved method. By using the E-TOPSIS method, a scientific and rigorous weight evaluation system is established. This system enables the accurate selection of components to be optimized based on their sensitivity to different performance parameters, significantly reducing the complex simulation workload typical of traditional methods.
Currently, the development of dual-system band spraying machines for soybean and corn intercropping is still in its early stages. Most designs are improvements based on the structure and functions of traditional crop sprayers. The dual-system sprayer is equipped with two spraying systems, and the spray booms have been enhanced with features such as drift control, which adds complexity to the structure and significantly increases the machine’s weight [21]. However, an excessively heavy frame inevitably places additional pressure on the transmission system and leads to higher fuel consumption, resulting in increased carbon emissions, production costs, and operational expenses. Therefore, there is an urgent need for the lightweight design of the frame.
This study focuses on the lightweight design of the sprayer frame, taking the 3WPZ-700Y high-clearance dual-system band sprayer as the research subject. First, a three-dimensional model and finite element model of the frame were established, followed by modal and static analysis of the frame. Modal testing was conducted using a modal analysis instrument to verify the accuracy of the finite element model and confirm the reliability of subsequent optimization results. Next, sensitivity data for the various components of the frame were extracted in relation to different performance parameters. A sensitivity evaluation system based on the E-TOPSIS method was developed, and this system was used to analyze the sensitivity data for three performance indicators of the frame components, enabling the efficient and scientifically driven identification of parts that need optimization. The experimental design was conducted using the Latin hypercube sampling (LHS) method and central composite design (CCD) sampling method. A Kriging model was established. Finally, the multi-objective optimization of the frame was carried out using the RIME algorithm.
This research adopts a methodologically rigorous workflow commencing with comprehensive simulation analysis and experimental validation to ensure model fidelity, thereby establishing a credible foundation for subsequent optimization processes. Theoretically diverging from conventional paradigms that predominantly focus on algorithm refinement and post-optimization result filtration to enhance lightweighting efficiency, our approach introduces an entropy-weighted TOPSIS (E-TOPSIS)-based sensitivity evaluation system. This system enables a priori design variable screening, effectively reducing computational workload. In the optimization work, the optimization algorithm used in this paper is based on the soft-rime search strategy and the hard-rime puncture mechanism. This algorithm can effectively enhance the global search efficiency and improve the quality of the global solution, thereby providing a novel and effective method for lightweighting work. It is expected to offer ideas and references for the subsequent design and optimization of parts.

2. Finite Element Simulation and Experimental Testing of the Frame

2.1. Construction of the Frame’s 3D Model

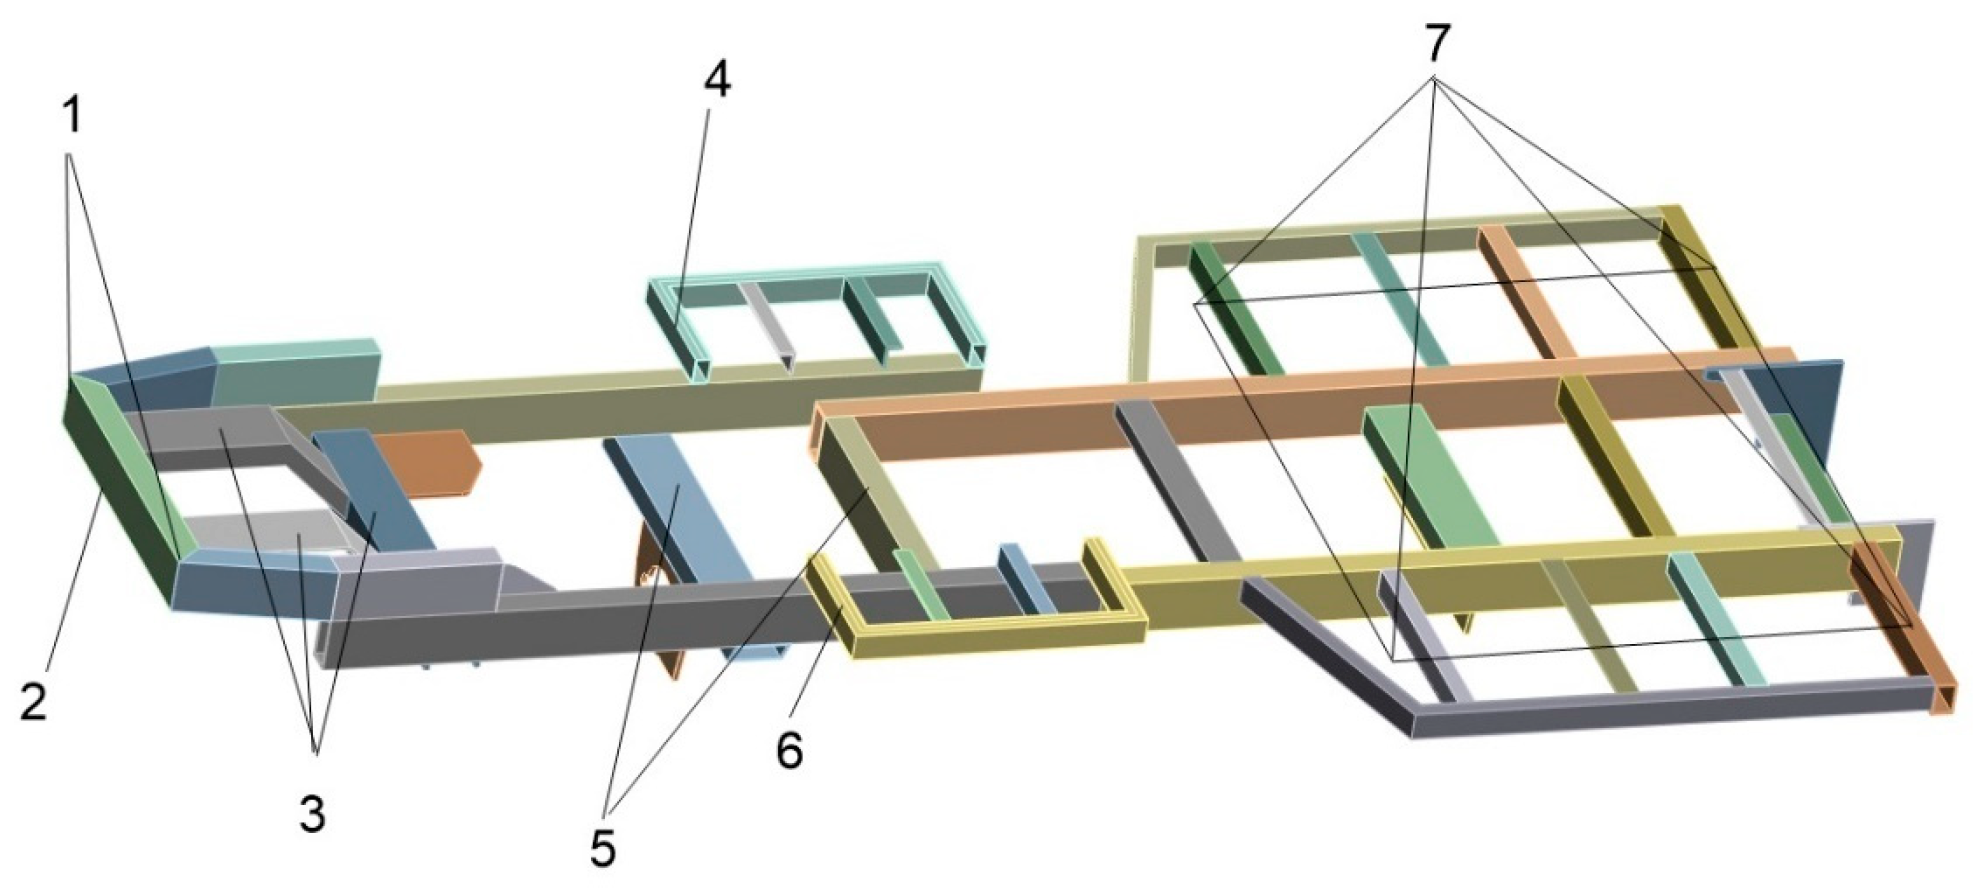
This subsection introduces the basic information of the frame and presents the development of its three-dimensional model. The frame of the 3WPZ-700Y high-clearance dual-system strip sprayer is primarily welded from channel steel, square steel, and rectangular steel. The main dimensions of the frame are 3246 mm × 1510 mm × 390 mm, as shown in Figure 1. Due to the large number of meshes required for the three-dimensional model of the frame, and to improve the speed and accuracy of the finite element analysis, functional structures such as chamfers, radii, and areas that do not bear load impacts were removed from the model. Small, complex features would significantly increase computational effort; thus, the defeaturing tolerance method was used to eliminate features with a tolerance of 3 mm or less, which are considered small features.

2.2. Finite Element Modeling of the Sprayer Frame

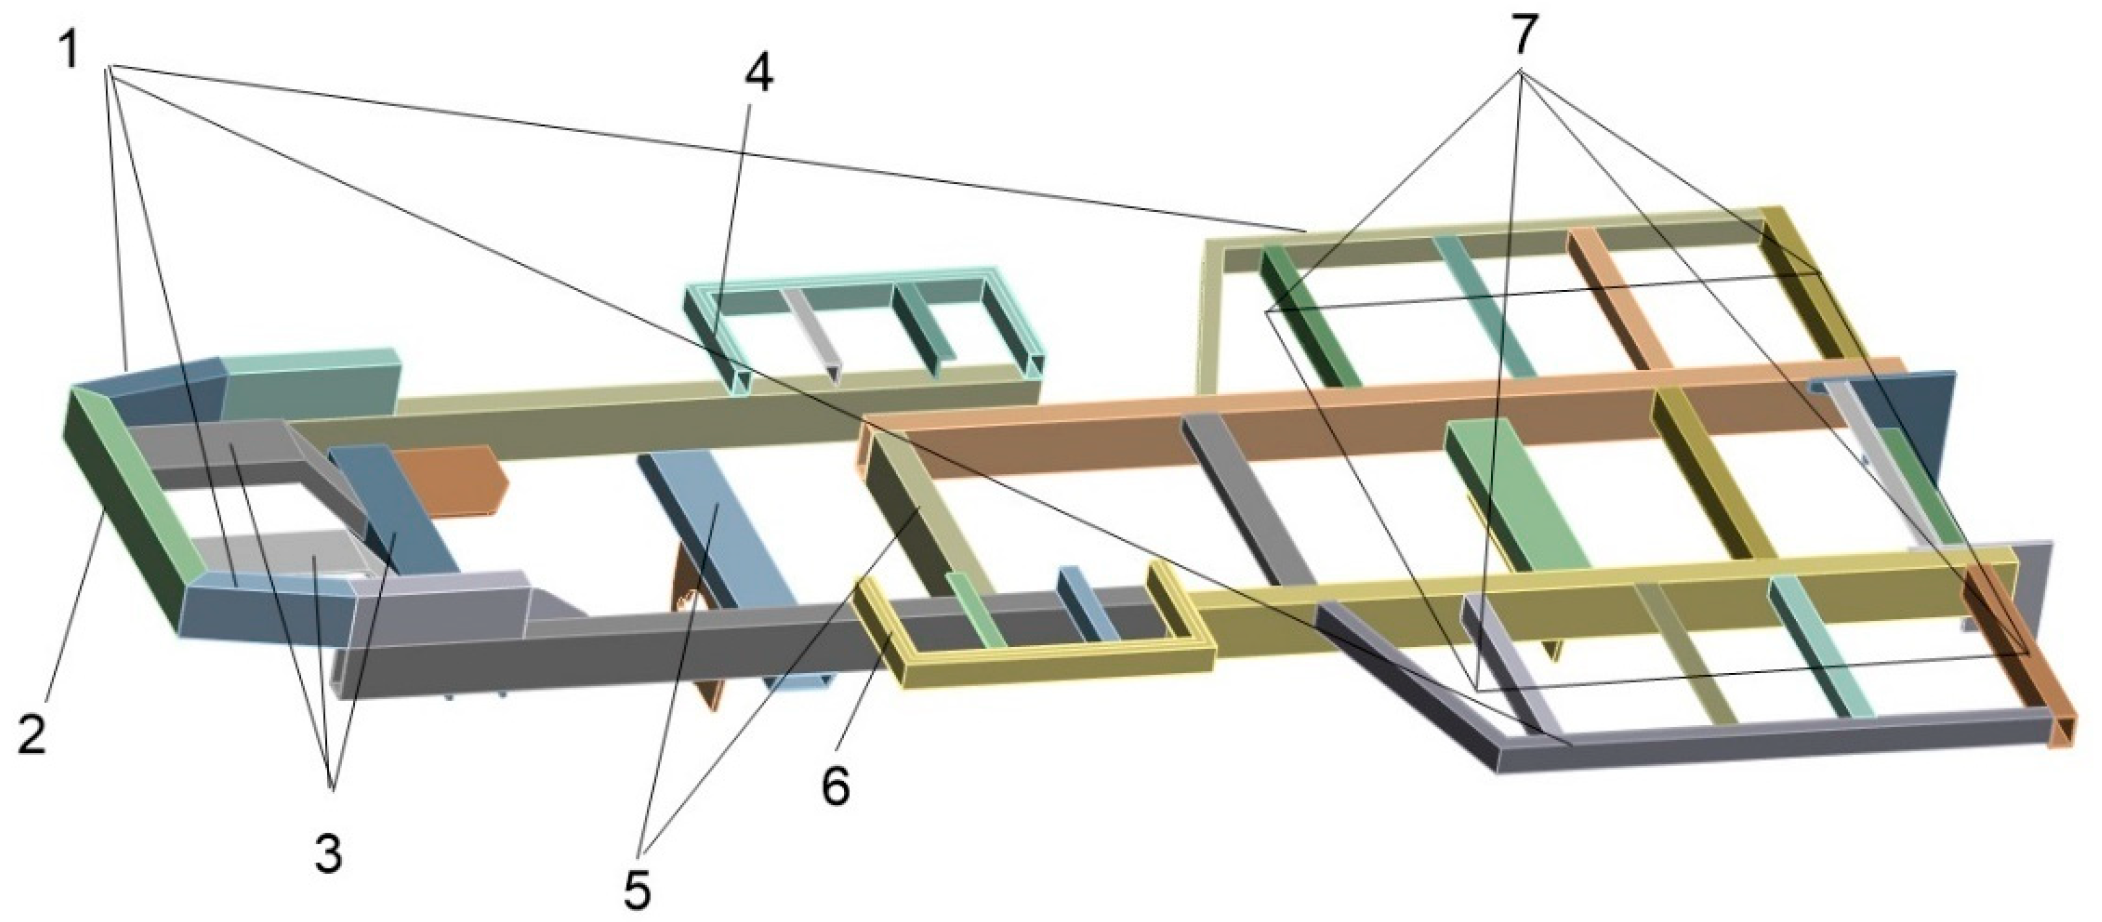
The model is meshed using a coordinated slicing algorithm (path conforming), which is based on the TGrid algorithm. This method, in combination with a sweeping technique, generates conformal hybrid meshes, including tetrahedral, prismatic, and hexahedral elements, suitable for multibody or complex parts. To reduce computational effort while maintaining accuracy, the primary mesh size is set to 3 mm, with finer mesh refinement in narrower regions. The frame components are connected using a common node approach. The finite element model of the frame, shown in Figure 2, consists of 306,184 grid cells and 691,008 nodes.

2.3. Mechanical Properties Evaluation of the Frame

This subsection presents the mechanical analysis of the frame. First, the loading conditions to which the frame is subjected are introduced. The maximum stress and deformation of the frame are then analyzed under two different operating conditions: full-load bending and extreme torsion. The static loads on the frame of the strip spraying machine primarily come from components such as the suspension, spray boom, engine, fuel tank, chemical tank, water tank, and driver’s cabin. The weight of each component is shown in Table 1.
When analyzing the mechanical properties of the sprayer frame, it is essential to consider both the magnitude and direction of the applied loads under actual working conditions, particularly during extreme operating scenarios. For a belt sprayer, two primary conditions must be considered: the fully loaded bending condition, which occurs when the tank is full and the spray boom is deployed for spraying, and the extreme torsion condition, which arises when the sprayer crosses obstacles in the field.

2.3.1. Mechanical Properties Under Fully Loaded Bending Condition

The full-load bending condition refers to the sprayer’s ability to resist bending deformation while stationary or moving at a uniform speed. Under this condition, the frame is subjected to a significant vertical dynamic load, with a load factor set to 2.0 [22]. When the sprayer operates in the field, the spray bar is extended to both sides. The spray bar is modeled as a uniform beam, with one end fixed to the suspension and the other end free. The bending moment M a on the spray boom on the suspension side is calculated using Equation (1).
M a + 1 2 m g l 2 = 0 ,
where m is the mass of the spray bar and l is the length of the spray bar. The positions of the loads applied under the full-load bending condition are illustrated in Figure 3. A torque of magnitude M a is applied at position 1, while the self-weight loads of the suspension, engine, water tank, cab, fuel tank, and chemical tank are applied at positions 2–7 as remote loads. The support seat at the bottom of the sprayer frame, which mounts the suspension, is subjected to fixed constraints, while no constraints are applied to the other components.

2.3.2. Mechanical Properties Under Extreme Torsional Loading Conditions

The extreme torsion condition occurs when the four wheels are not in contact with the ground simultaneously, such as when the sprayer travels through obstacles like ridges. In this study, the unilateral bending condition is considered, where the left front wheel is suspended while the sprayer moves through the field, with a load factor set to 1.3 [22]. Constraints are applied to the left front wheel of the frame, restricting its movement in the X, Y, and Z directions, while the other wheels remain unconstrained. At this point, the spray bar is folded backward, and its load is supported by both sides of the frame. The applied load under this extreme torsional condition is illustrated in Figure 4.

2.4. Modal Analysis and Experimental Validation

2.4.1. Modal Analysis of the Frame Under Free Boundary Conditions

This subsection presents the free modal simulation analysis of the frame, followed by modal testing to verify the accuracy of the finite element model and enhance the reliability of the subsequent optimization results. The material used in the finite element model of the frame is Q235 steel, with a density of 7.85 × 10³ kg/m3, Young’s modulus of 2.5 × 10⁵  MPa, Poisson’s ratio of 0.3, and yield strength of 250 MPa. The first six natural modes of the frame were extracted based on the Lanczos method algorithm.

2.4.2. Modal Test and Validation of the Frame

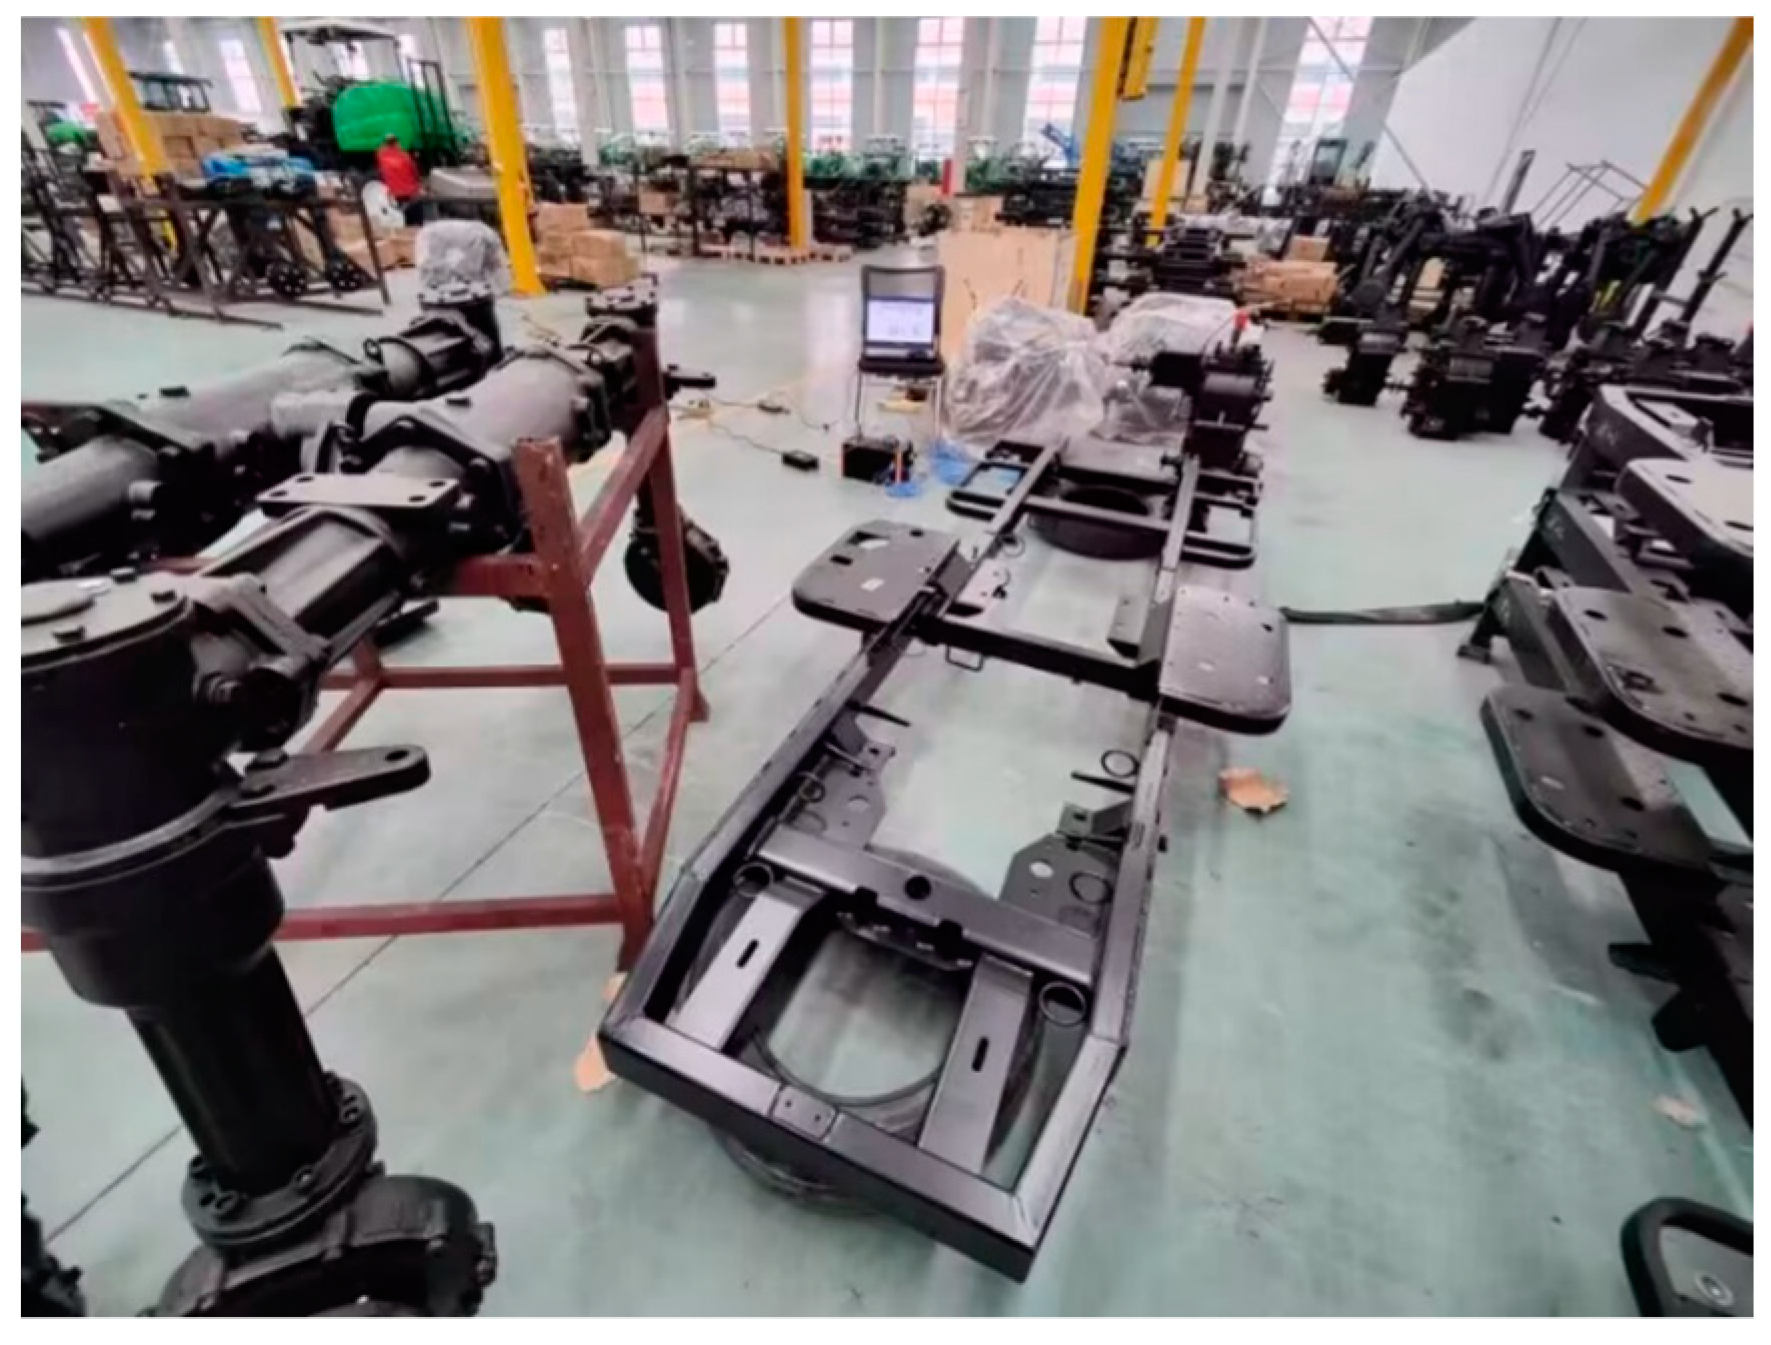
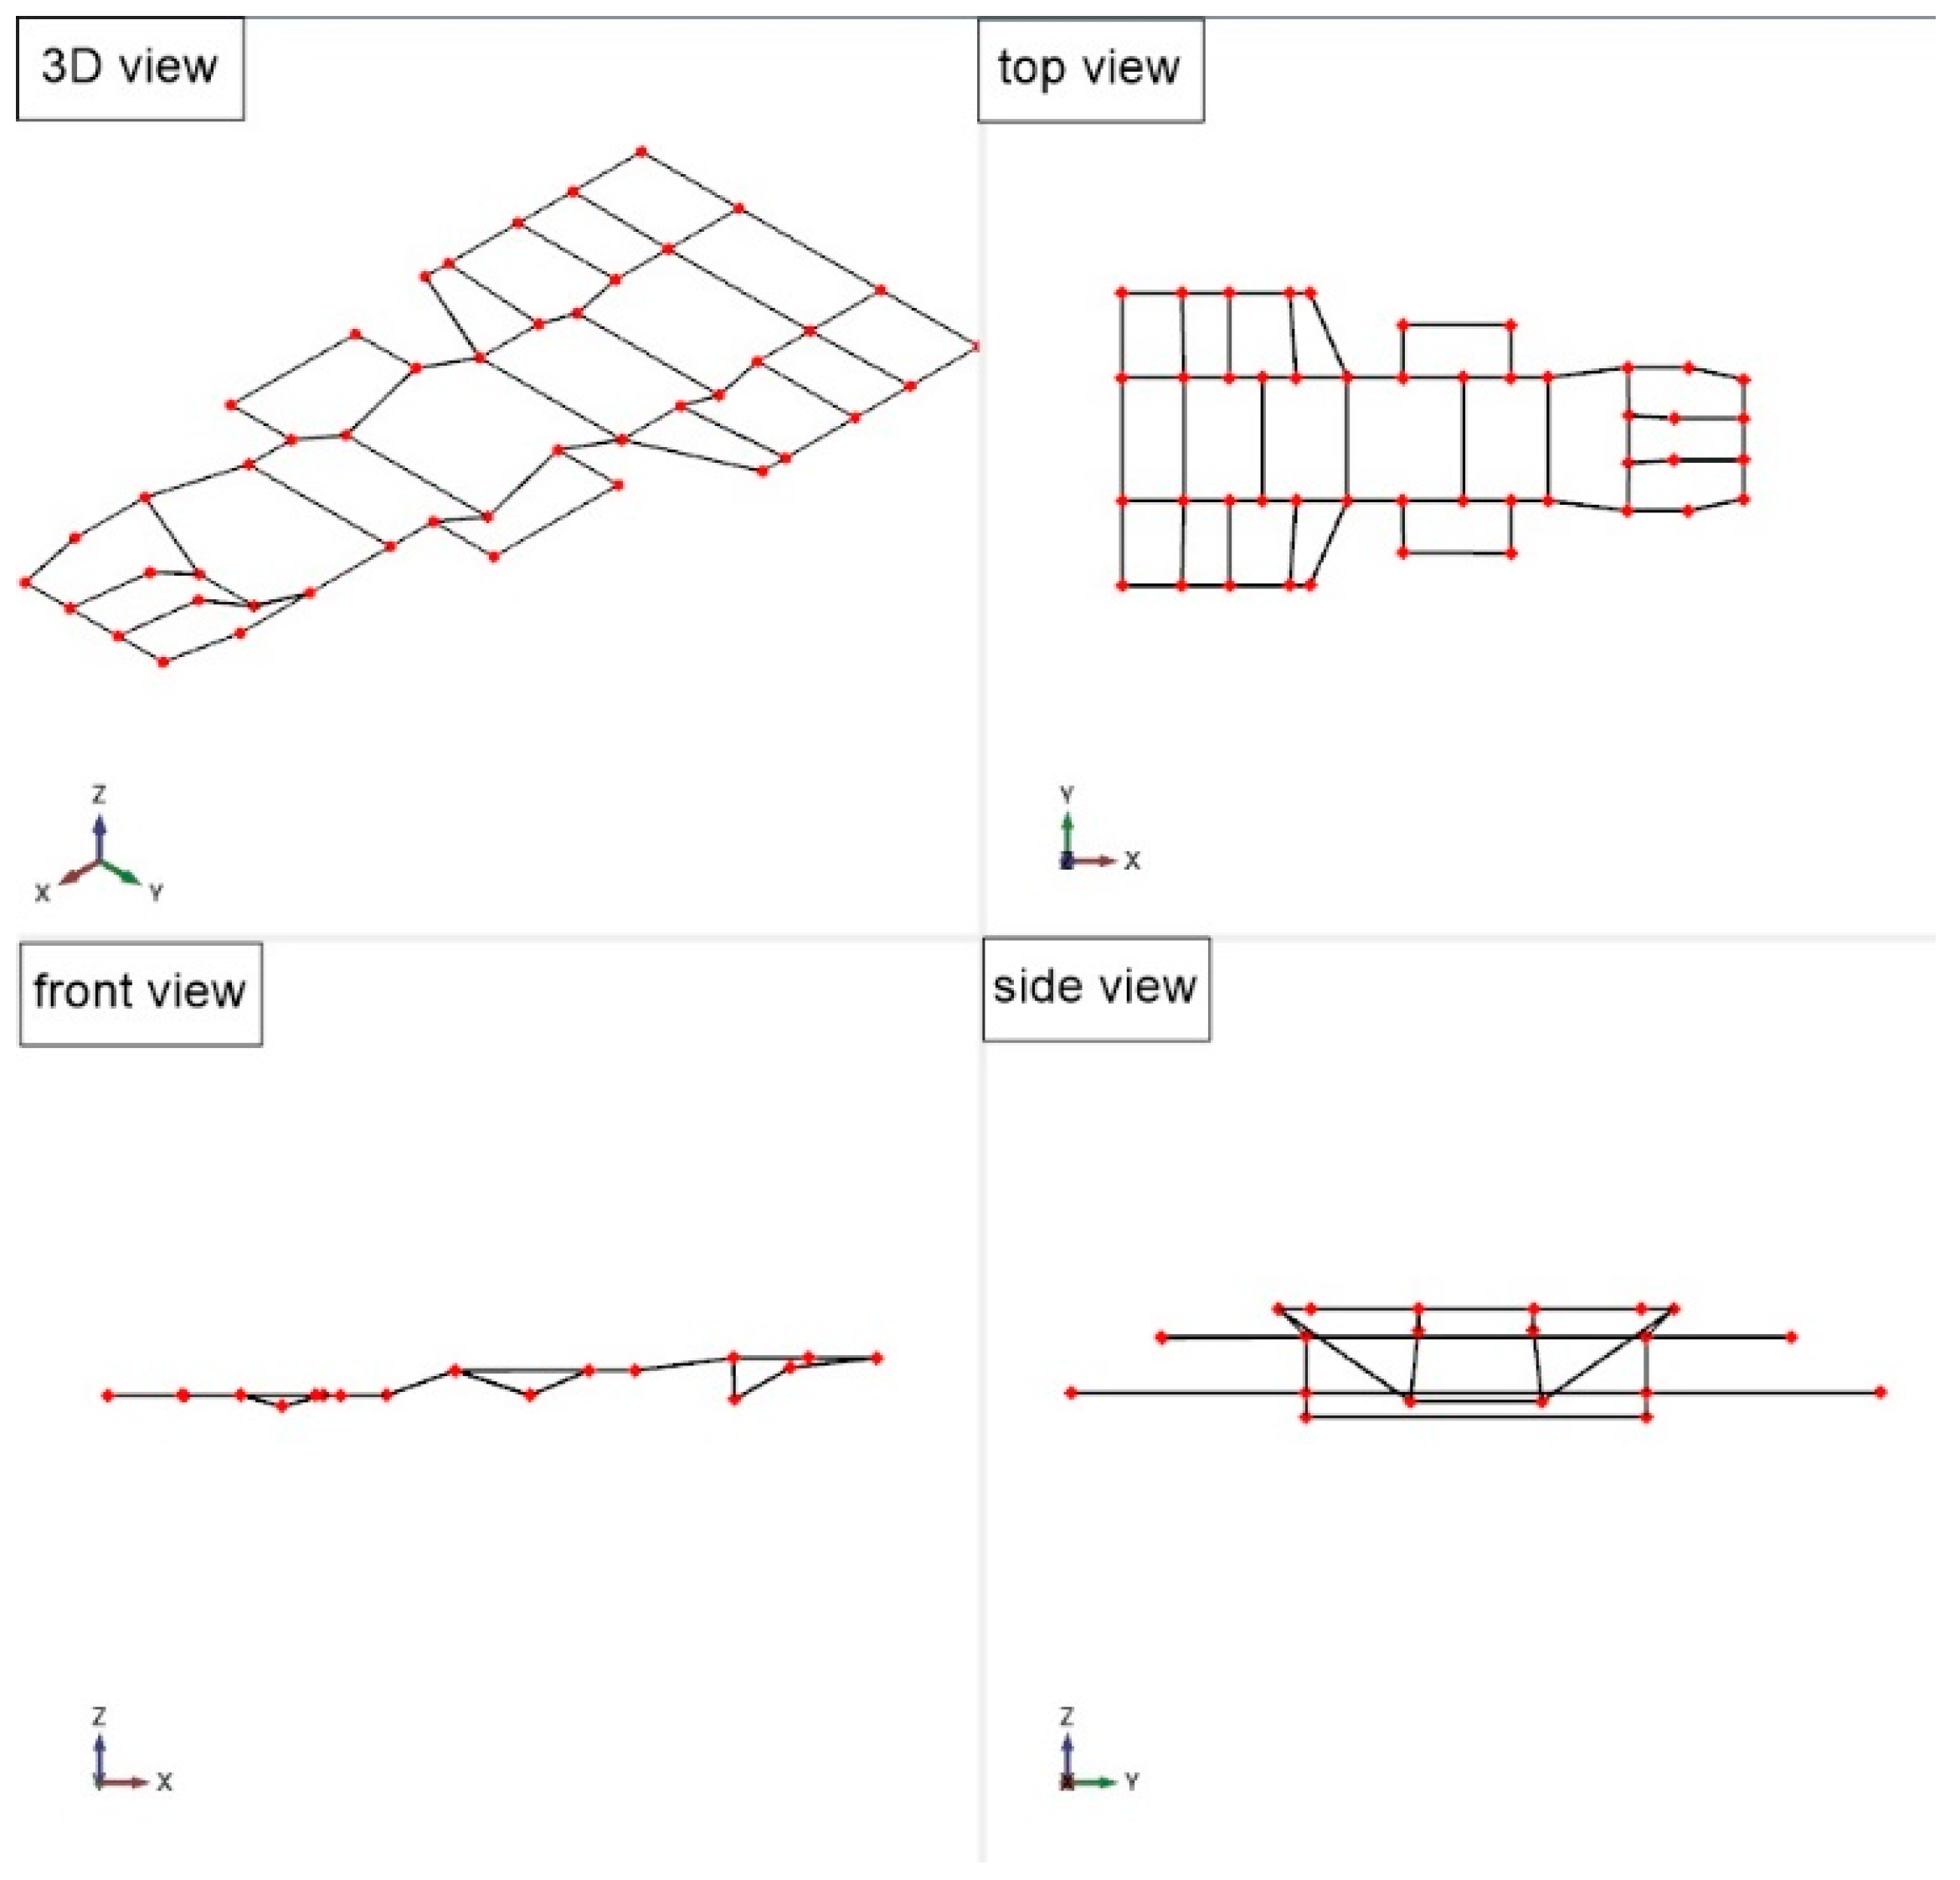
To verify the accuracy of the finite element model and enhance the reliability of the subsequent optimization results, modal testing of the frame was performed in this subsection using the Donghua Modal Analyzer (Jiangsu Donghua Testing Technology Co., Taizhou, Jiangsu Province, China). The test employed a hammering method for multi-point excitation of the frame. The equipment used included a 1A312E accelerometer (Jiangsu Donghua Testing Technology Co., Taizhou, Jiangsu Province, China), Donghua modal analysis software (http://www.dhtest.com/product_sj/20.html), and an 8-channel data acquisition system. The experimental setup is shown in Figure 5. The test involved multi-point excitation, with the frame model structure being established using 44 nodes, as shown in Figure 6.

3. Lightweight Frame Optimization Process

3.1. Component Sensitivity Analysis

The design of sprayer frames requires consideration of multiple factors. Optimizing the thickness of the frame components affects numerous performance parameters. Traditional multi-objective optimization methods, which require multiple iterations, can be time-consuming and yield limited results when applied directly to all components. Furthermore, blindly selecting specific components for lightweight design may compromise the frame’s performance. Therefore, the key to effective optimization lies in the scientific and efficient identification of components that require optimization. In this study, the sensitivity of different components to weight, deformation, and stress is analyzed, enabling the identification of design variables with significant impact on frame weight. This approach facilitates lightweighting without sacrificing performance. The sensitivity of the components is derived from the partial derivatives of the design response with respect to the optimization variables, forming the basis for lightweight optimization. The sensitivity calculation formula is given in Equation (2).
g X = Q T X U + Q T U X ,
where
g is the design response, X is the design variable, U is the displacement variable, and Q T is a constant.
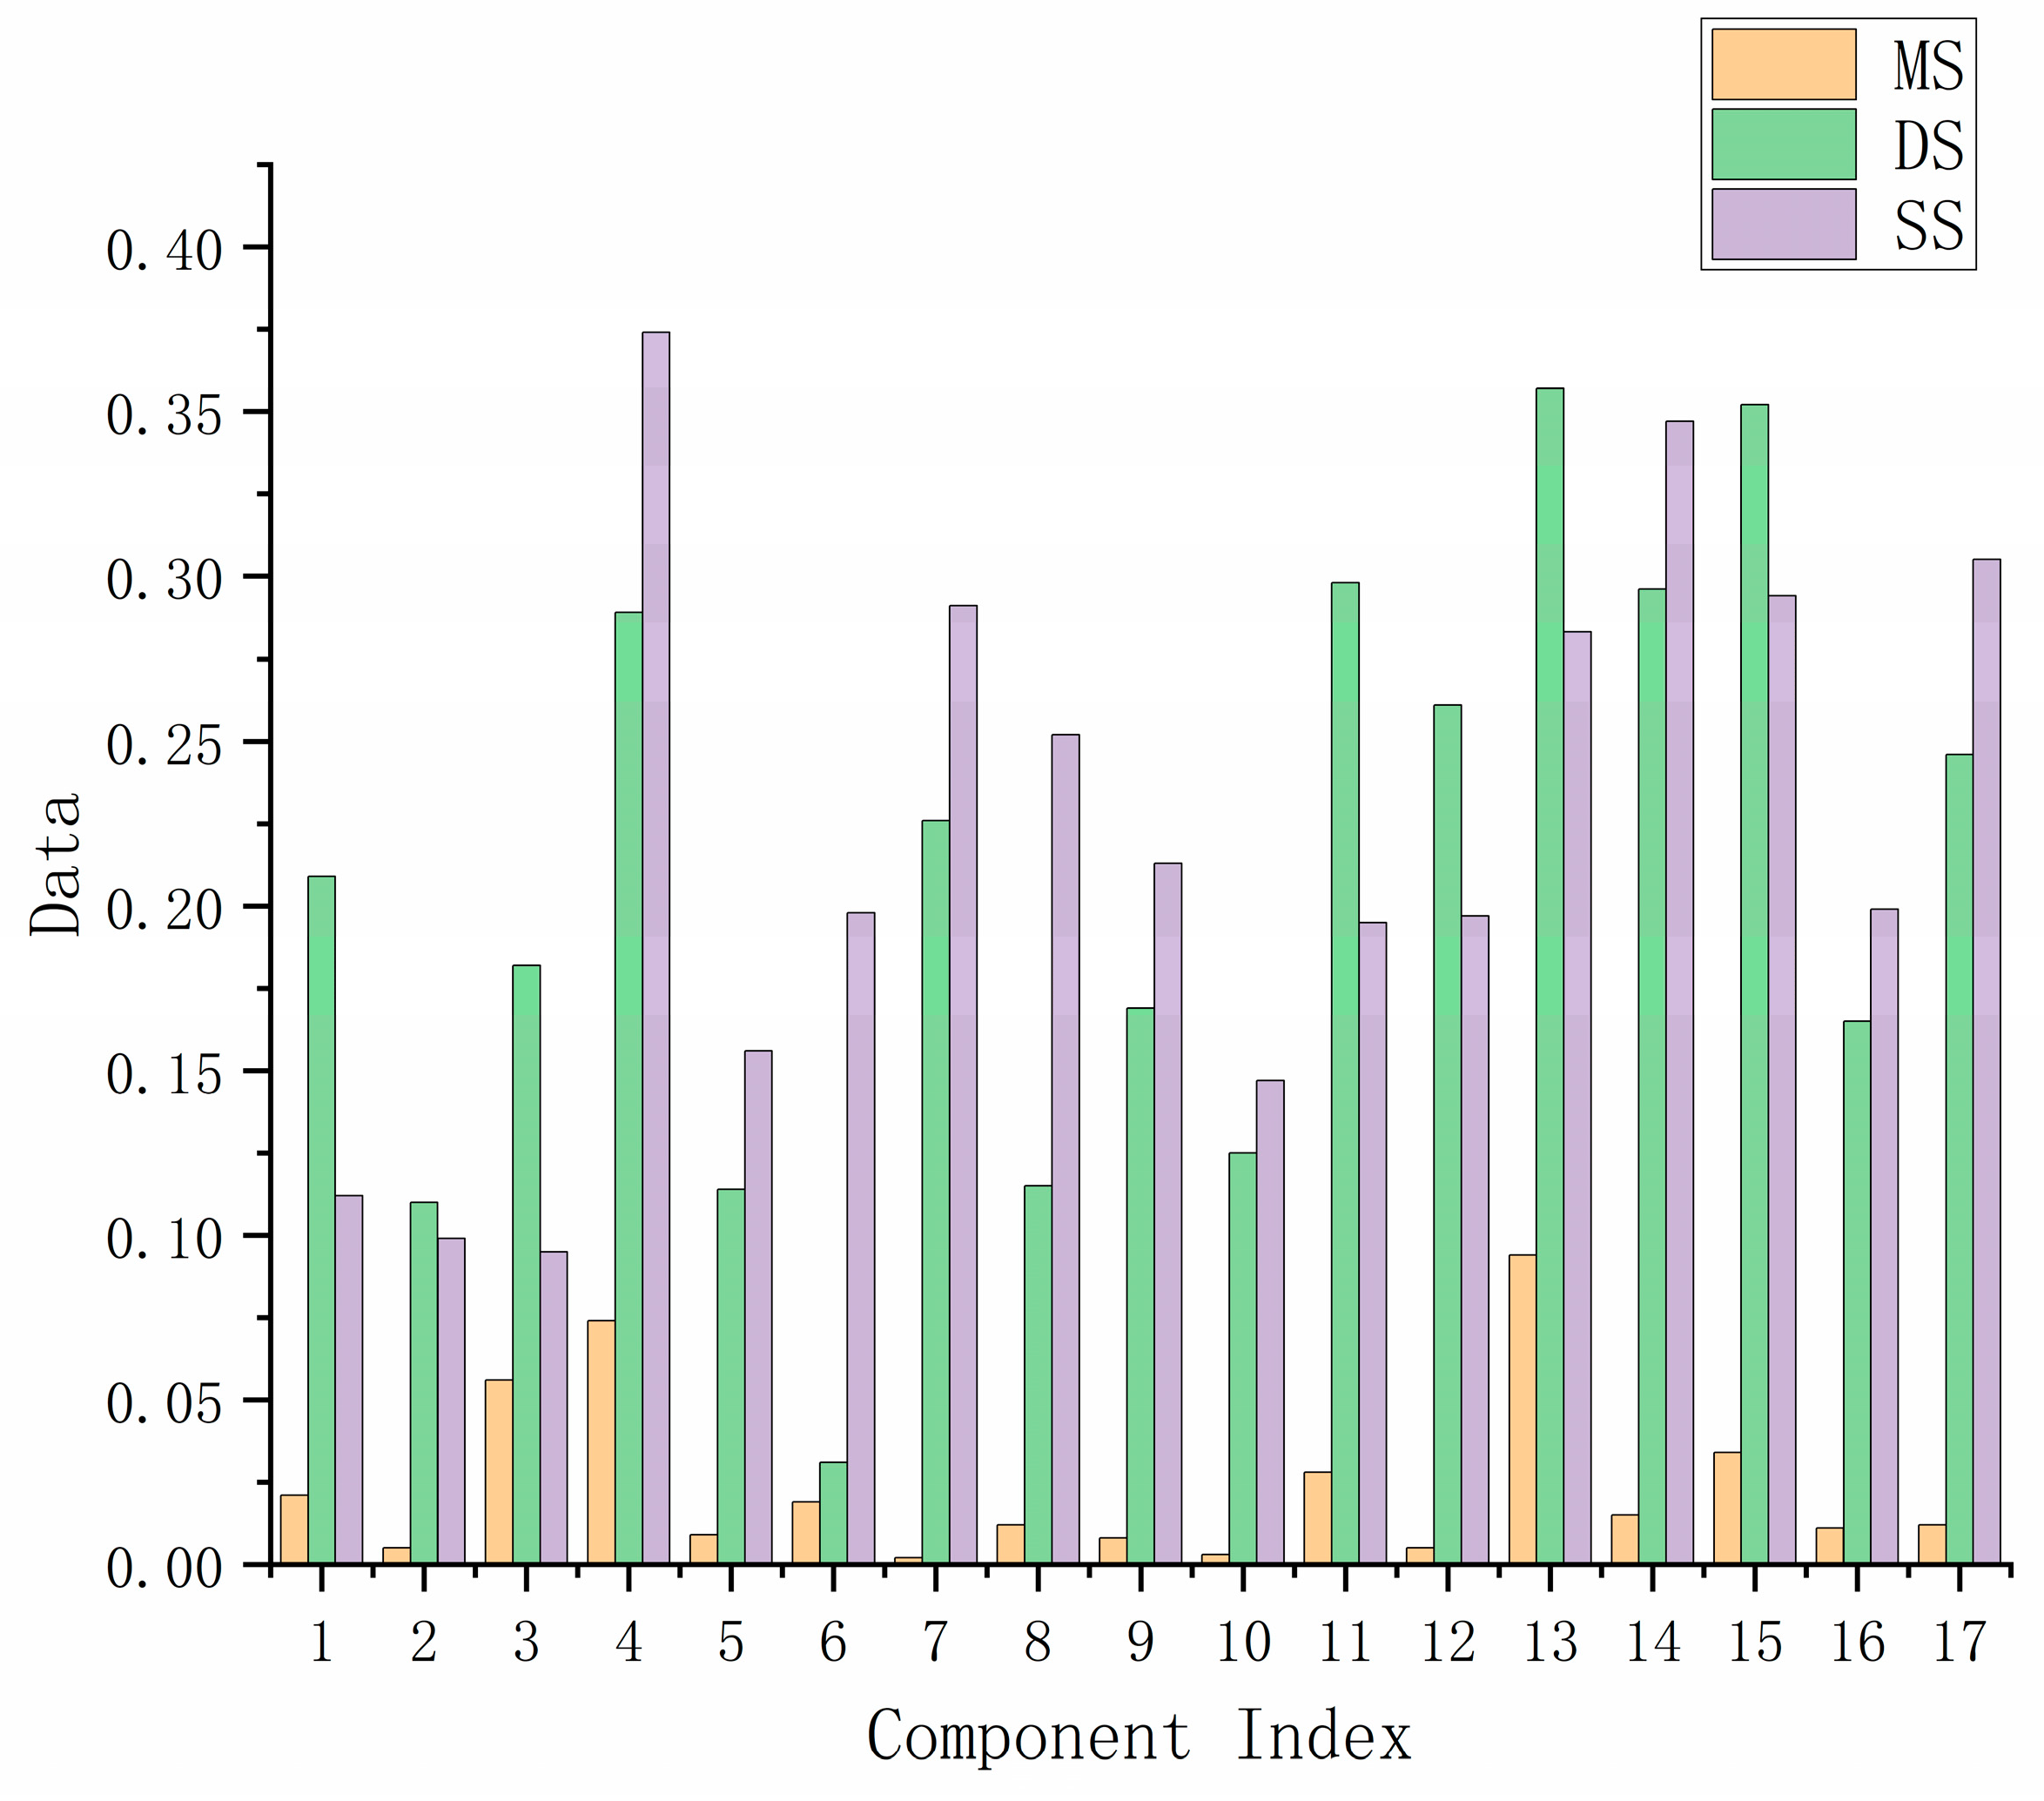
The sensitivity of each component with respect to the three different performance indicators—mass sensitivity (MS), deformation sensitivity (DS), and stress sensitivity (SS)—is extracted, as shown in Table 2.

3.2. Screening of Design Variables Using Entropy Weighting and TOPSIS Methods

The bar chart of the sensitivity data in this study is shown in Figure 7. Even with the sensitivity data extracted and presented in a graphical format, it is often challenging to directly determine which components need to be optimized from the numerous parts. To balance the impact of different components on the frame mass and performance, a weight evaluation system combining the entropy method and the TOPSIS method is used to process the sensitivity data. This system allows for the scientific and efficient selection of components that require lightweight optimization.
First, the decision matrix Y is established, and its expression is given by Equation (3).
Y = y 11 y 12 y 1 n y 21 y 22 y 2 n y m 1 y m 2 y m n ,
y i j denotes the contribution of the i t h parameter to the j t h performance indicator, and y i j denotes the contribution of the i t h parameter to the j t h performance indicator, where n represents the number of parameters and m represents the number of performance indicators. To avoid the influence of different performance indicators, the decision matrix is normalized using Equation (4).
r i j = y i j i = 1 n y i j 2 ,
The entropy weighting method is then applied to assign reasonable weights, minimizing the impact of human judgment on the results. A parameter’s information entropy ( e j ) is inversely related to its significance in the comprehensive evaluation: The smaller the entropy, the greater the contribution of the parameter to the overall evaluation. The information entropy is calculated using Equations (5)–(7).
e j = k i = 1 n p i j ln p i j ,
p i j i = 1 n r i j = r i j ,
w j × j = 1 m ( 1 e j ) = ( 1 e j ) ,
where w j is the weight coefficient of the j t h performance indicator, and p i j denotes the weight of the i t h parameter with respect to the j t h performance indicator. The weight coefficients w j are obtained by solving the above equations, and r i j is then weighted and normalized to v i j using Equation (8).
v i j = w j × r i j ,
The contribution of each metric is calculated and ranked; the greater the contribution, the more important the metric is to the frame. The degree of contribution is determined as a floating parameter between the positive ideal value and the negative ideal value of each indicator. The expression for the ideal value is given by Equation (9).
x j + = max v i j x j = min v i j ,
In this study, the Euclidean geometric distance is used to represent the fluctuation parameters between the positive and negative ideal values, and it is calculated according to Equation (10).
s i + = j = 1 n ( v i j x j + ) 2 s i = j = 1 n ( v i j x j ) 2 ,
The greater the comprehensive contribution of a parameter to the performance index, the more significant its influence on the frame’s performance. Prioritizing design variables with a larger comprehensive contribution in the design process can enhance the degree of lightweighting of the frame. The comprehensive contribution is calculated using Equation (11).
C i = s i s i + + s i ,
Using the method described above, the decision matrix is established, consisting of 17 parameters and three performance indicators. The weight coefficients of each performance indicator are obtained after processing, as shown in Table 3.
The comprehensive contribution of each component is calculated and ranked. The top 10 components with the highest comprehensive contributions are selected for optimization. The final selected components and their respective contributions are presented in Table 4.

3.3. Size Optimization Design Using the MORIME Algorithm

In this paper, an efficient multi-objective optimization algorithm, MORIME, is employed. MORIME is based on the RIME algorithm, which was developed by Sundaram B. Pandya et al. [23] in 2024, and evolved from the RIME algorithm originally proposed by Hang Su et al. [24] in 2023. The RIME algorithm constructs a soft-edge search strategy and a hard-edge puncturing mechanism by simulating the growth processes of two distinct forms of rime-ice, as illustrated in Figure 8. Furthermore, the algorithm incorporates an improved greedy selection mechanism, which enhances population updating and significantly improves both the global search efficiency and the weight of the global solution.
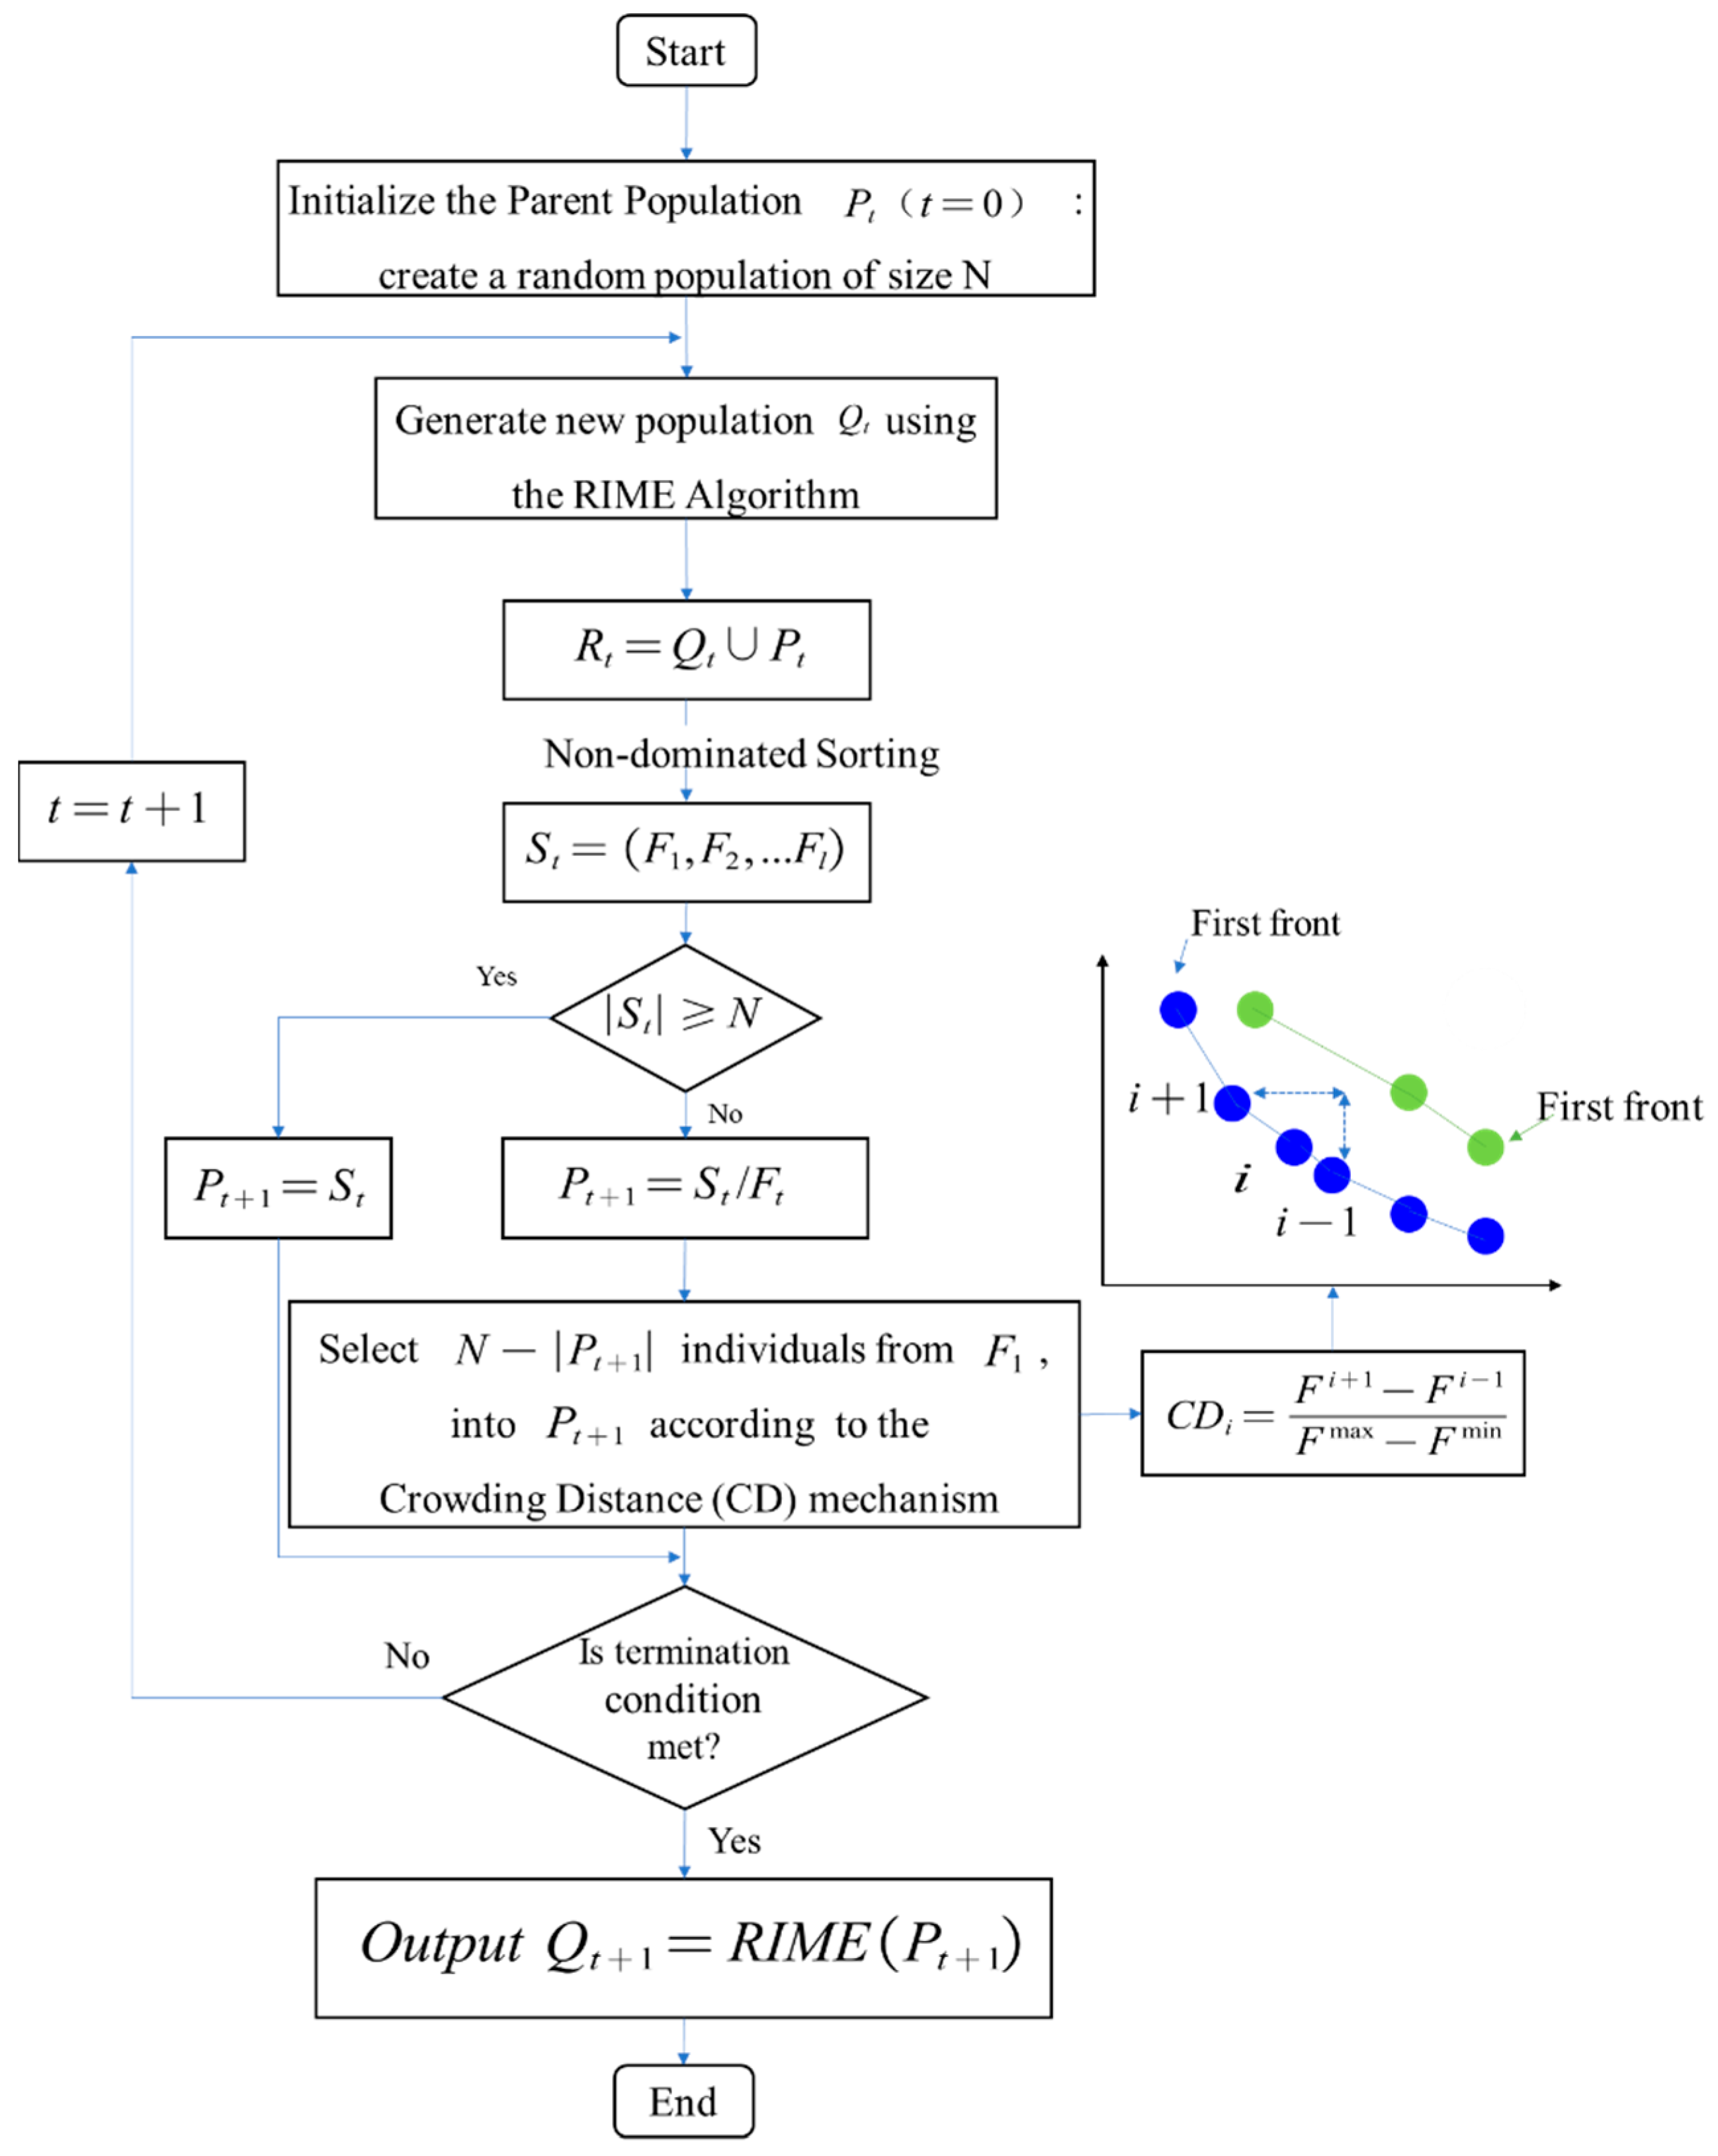
MORIME combines the non-dominated sorting method and the diversity maintenance distance technique from the NSGA-II algorithm to categorize populations into different non-dominated classes and compute the crowding distance between them. The algorithm can be summarized in four main steps:
  • Initialization: The population is initialized by randomly generating an initial parent population of size N , denoted as p 0 . An offspring population of the same size, N , is then created using the standard RIME algorithm, denoted as Q 0 .
  • Non-Dominated Sorting: The parent and offspring populations ( p t and Q t ) are merged to form a new population, R t , of size 2 N . The merged populations are sorted according to their dominance levels ( F 1 , F 2 , F t ) , and are sequentially merged into a new population S t = l = 1 t F i . If the size of S t  exceeds N, then, P t + 1 = S t . Otherwise, P t + 1 = S t / F l .
  • Crowding Distance Sorting: The population P t + 1 is sorted based on crowding distance, and the selection process continues to supplement P t + 1 until N individuals are reached.
  • Iteration: Steps 2 and 3 are repeated until the maximum number of iterations is reached.
The specific flowchart of the algorithm is shown in Figure 9.
In this study, the total mass of the frame and the minimum deformation are set as the optimization objectives, with the maximum equivalent stress under various operating conditions as the constraint. The thickness of the 10 selected components, as discussed earlier, is used as the design variables for the optimization. First, Latin hypercube sampling (LHS) is employed for sampling, followed by CCD (central composite design) sampling. The Latin hypercube sampling method randomly selects samples from the sample space and, through fewer iterations, achieves an accurate reconstruction of the input distribution. A Kriging surrogate model is then established. The Kriging model, known for its excellent accuracy in fitting nonlinear problems, is widely used in optimization studies. In this research, the number of sampling points is set to 200.
The mathematical model for the multi-objective optimization is formulated as follows:
min f 1 ( x ) , f 2 ( x ) , f 3 ( x ) s , t , σ max 1 250   MPa σ max 2 250   MPa x t x x u , x = ( x 1 , x 2 x 10 )
Let f 1 ( x ) denote the total mass function of the frame, f 2 ( x ) represent the minimum deformation function of the frame under the ultimate torsion condition, and f 3 ( x ) denote the minimum deformation function of the frame under the full-load bending condition. σ m a x 1 and σ m a x 2 represent the maximum equivalent stresses under the full-load bending condition and the ultimate torsion condition, respectively.
The design variables are represented by x , which consists of 10 components. x t denotes the upper limit of the design variables, and x u denotes the lower limit of the design variables. The maximum number of iterations n is set to 50.

4. Results

4.1. Static Analysis

Under full-load bending conditions, the maximum equivalent stress of the sprayer vehicle frame was observed at the junction between the chemical tank bracket and rear straight beam in the frame’s tail section, reaching 203.61 MPa. The maximum deformation under this operational state measured 1.7285 mm, occurring at the lower side of the right rear corner of the chemical tank bracket.
In extreme torsion conditions, the peak stress manifested at the identical connection (tank bracket–rear beam interface) with a magnitude of 180.23 MPa. Correspondingly, the maximum deformation under torsional loading registered 1.4723 mm, exhibiting spatial consistency with the bending scenario at the tank bracket’s lower right rear quadrant.

4.2. Modal Analysis and Experimental Validation

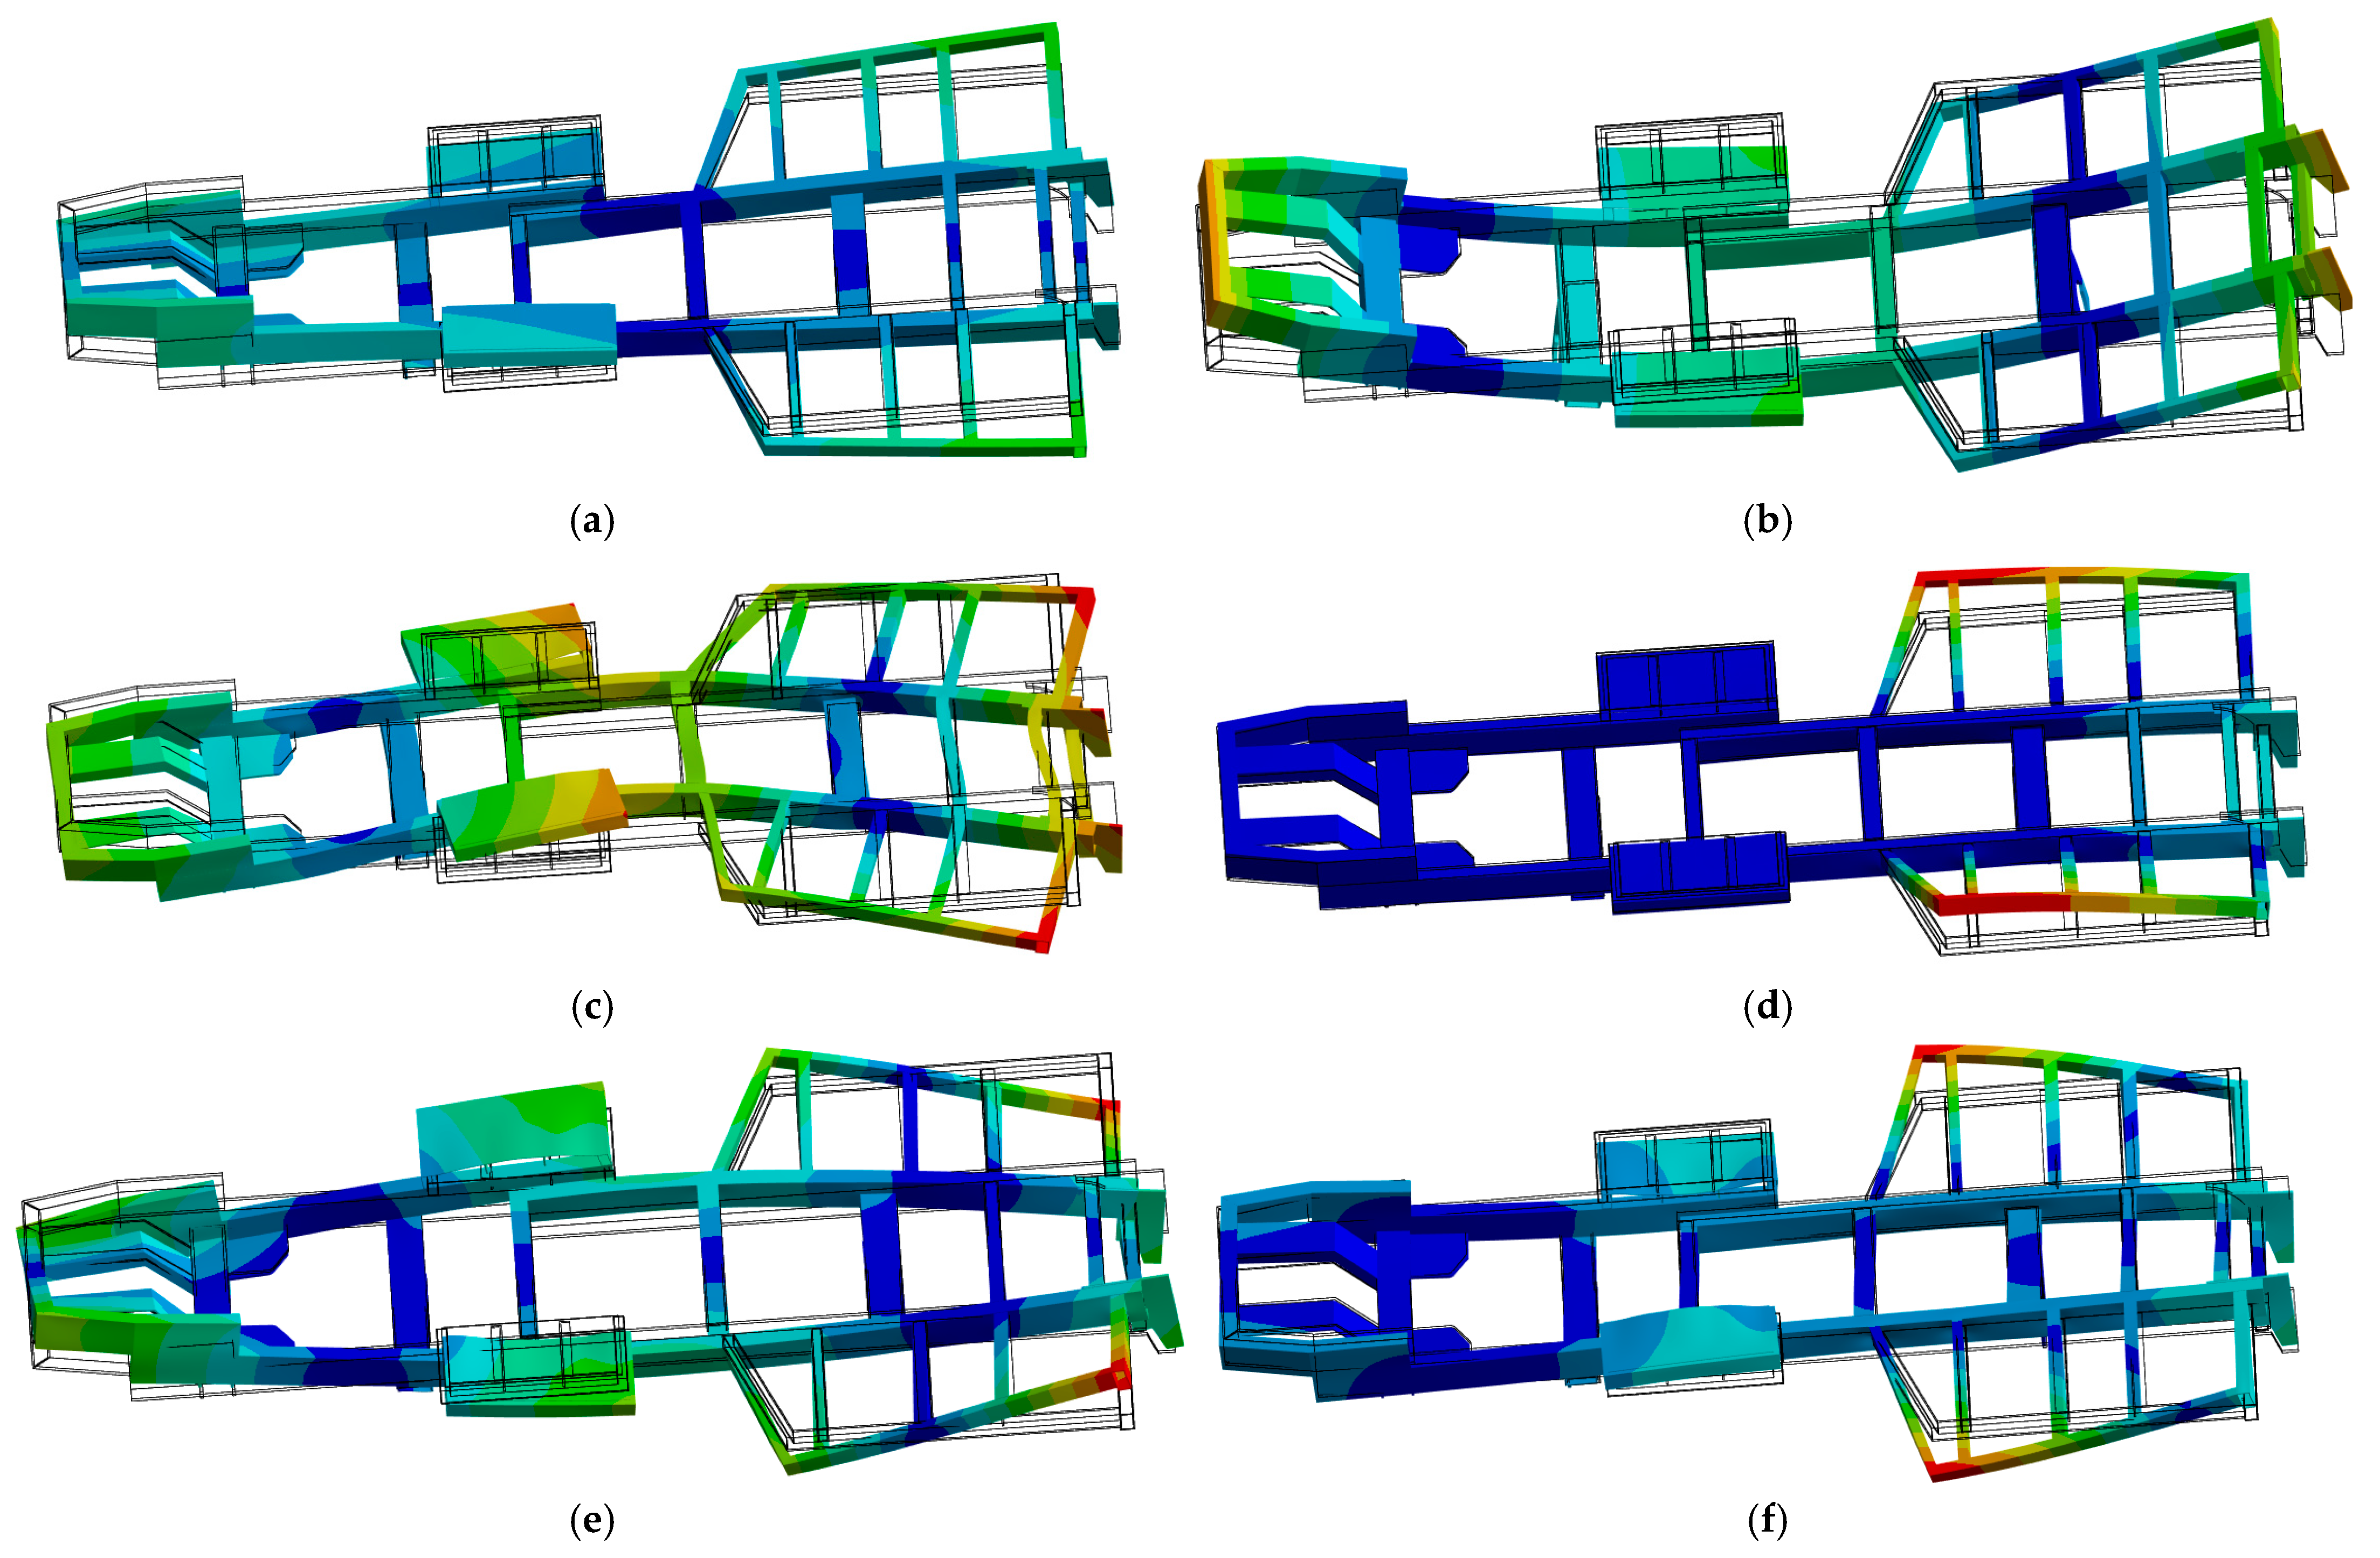
The natural frequencies and vibration modes of the first six modes of the frame are shown in Table 5. The engine used in the sprayer is a 6-cylinder engine with a rated speed range of 2400–2600 RPM. The fixed frequency of the engine is, therefore, 120–130 Hz, while the excitation frequency during field operation is between 1 and 3 Hz. As shown in Table 2, the first six natural frequencies of the frame are well separated from both the engine’s fixed frequency and the excitation frequencies during field operation, indicating that the frame’s vibration characteristics are relatively reasonable. This effectively avoids low-frequency resonance and meets the design specifications. Figure 10 shows the vibration modes of the first six natural frequencies of the frame.
The modal data obtained from the experiment are shown in Table 6. Both the experimental and simulation results for the first six natural frequencies of the frame fall within the range of 30–90 Hz. The maximum difference between the simulation and experimental data occurs for the third-order mode, with a discrepancy of 10.679 Hz. Therefore, the established finite element model can effectively replace physical testing for simulation purposes.

4.3. Multi-Objective Optimization Outcomes

The optimal values of the input design variables are calculated through system iteration, as shown in Table 7.
The model is updated based on the obtained optimization parameters, and the optimized frame performance indices are recalculated. The frame parameters before and after optimization are compared, and the results are presented in Table 8. The stresses under the two working conditions increase by 20.64 MPa and 3.10 MPa, respectively, while the deformations increase by 0.647 mm and 0.607 mm, respectively. However, these values remain within the allowable range. The first-order modal frequency increases by 1.693 Hz, and the optimized frame’s modal frequency falls within the reasonable range, ensuring no resonance occurs. The mass of the frame after optimization is 155.613 kg, which is 22.754 kg lower than before optimization, representing a reduction of 12.8%.

5. Discussion

This study first verified the accuracy of the established finite element model and the reliability of the subsequent optimization results by comparing the simulation and physical test results. The experimental results show that the first six natural frequencies of the frame fall within the range of 30–90 Hz, indicating that the frame’s vibration characteristics are relatively reasonable and effectively avoid low-frequency resonance [25]. A sensitivity analysis system based on the E-TOPSIS method was established, and sensitivity data for the frame components with respect to three different performance parameters were extracted. The weights of the three performance parameters were determined using the E-TOPSIS method, and the comprehensive contributions of each component were calculated. Using this system, the components requiring lightweight optimization were selected, which, compared to previous lightweighting methods, significantly reduced the simulation workload by narrowing down the number of components from 17 to 10 [26]. An experimental design was then performed, and a Kriging model was fitted. The frame was optimized for lightweight design based on the MORIME algorithm. After optimization, the stress increased by 20.64 MPa and 3.10 MPa under two operating conditions, while deformation increased by 0.647 mm and 0.607 mm, and the frame mass was reduced by 12.754 kg, a decrease of 12.8%. The optimization results were promising, demonstrating that the proposed method provides an effective new approach for the lightweight design of components.

Author Contributions

Conceptualization, S.Z. and L.Z.; methodology, S.Z.; software, S.Z.; validation, S.Z., Q.C., and L.Z.; formal analysis, S.Z.; investigation, S.Z.; resources, S.Z.; data curation, S.Z.; writing—original draft preparation, S.Z.; writing—review and editing, Q.C.; visualization, Q.C.; supervision, L.Z.; project administration, L.Z.; funding acquisition, L.Z. All authors have read and agreed to the published version of the manuscript.

Funding

This research was funded by the National Key Research and Development Program of China, grant number 2022YFD2300903.

Data Availability Statement

The original contributions presented in this study are included in the article. Further inquiries can be directed to the corresponding authors.

Conflicts of Interest

The authors declare no conflicts of interest.

Abbreviations

The following abbreviations are used in this manuscript:
E-TOPSISEntropy-based TOPSIS
FTFirst-order torsion
FBFirst-order bending
TBCBending and torsion combinations
MSMass sensitivity
DSDeformation sensitivity
SSStress sensitivity
MSTCMaximum Stress in torsion condition
MSBCMaximum Stress in bending condition
DTCDeformation in torsion condition
DBCDeformation in bending condition
FOMFirst-order modal

References

  1. Tang, P.; Yang, R.; Ni, X.; Zhao, H.; Xu, F. Research on a Lightweight Unmanned Sightseeing Vehicle Frame Based on Multi-Condition and Multi-Objective Optimization. Adv. Mech. Eng. 2022, 14, 16878132221131748. [Google Scholar] [CrossRef]
  2. Hosseini, S.E.; Karimi, O.; AsemanBakhsh, M.A. Experimental Investigation and Multi-Objective Optimization of Savonius Wind Turbine Based on Modified Non-Dominated Sorting Genetic Algorithm-II. Wind Eng. 2024, 48, 446–467. [Google Scholar] [CrossRef]
  3. Liu, S.; Du, Y.; Lin, M. Study on Lightweight Structural Optimization Design System for Gantry Machine Tool. Concurr. Eng. 2019, 27, 170–185. [Google Scholar] [CrossRef]
  4. Cui, W.; Feng, J.; Zhu, G.; Liu, B.; Ge, Z.; Luo, X. Multi-objective Optimization Design of a Centrifugal Fan Based on the Blade Loading Distribution. J. Eng. Thermophys. 2024, 45, 1949–1959. [Google Scholar]
  5. Zhou, X.; Tan, W.; Sun, Y.; Huang, T.; Yang, C. Multi-Objective Optimization and Decision Making for Integrated Energy System Using STA and Fuzzy TOPSIS. Expert Syst. Appl. 2024, 240, 122539. [Google Scholar] [CrossRef]
  6. Li, H.; Liu, Z.; Zhu, P. An Improved Multi-Objective Optimization Algorithm with Mixed Variables for Automobile Engine Hood Lightweight Design. J. Mech. Sci. Technol. 2021, 35, 2073–2082. [Google Scholar] [CrossRef]
  7. Wang, D.; Zhang, X. Application of the Preference Selection Index Method in Multi-Objective Lightweight Design of Heavy Commercial Vehicle Frames. Eng. Optim. 2023, 55, 1020–1039. [Google Scholar] [CrossRef]
  8. Ebrahimi-Nejad, S.; Kheybari, M.; Borujerd, S.V.N. Multi-Objective Optimization of a Sports Car Suspension System Using Simplified Quarter-Car Models. Mech. Ind. 2020, 21, 412. [Google Scholar] [CrossRef]
  9. Wang, S.; Wang, D. Research on Crashworthiness and Lightweight of B-Pillar Based on MPSO with TOPSIS Method. J. Braz. Soc. Mech. Sci. Eng. 2019, 41, 498. [Google Scholar] [CrossRef]
  10. Ni, X.; Li, Y.; Sun, R.; Xu, Y. Multi-Parameter Optimization Analysis of Permanent Magnet Couplings Using Response Surface Methodology and Genetic Algorithm. J. Mech. Sci. Technol. 2024, 38, 6279–6286. [Google Scholar] [CrossRef]
  11. Adjei, R.A.; Fan, C. Multi-Objective Design Optimization of a Transonic Axial Fan Stage Using Sparse Active Subspaces. Eng. Appl. Comput. Fluid Mech. 2024, 18, 2325488. [Google Scholar] [CrossRef]
  12. Li, S.; Bei, J.; Jiang, Z.; Zhang, D. Lightweight design of integrated engine hood based on FAHP-TOPSIS method. J. Vib. Shock 2024, 43, 125–133. [Google Scholar]
  13. Chen, P. Effects of the Entropy Weight on TOPSIS. Expert Syst. Appl. 2021, 168, 114186. [Google Scholar] [CrossRef]
  14. Rezaei, J. Best-Worst Multi-Criteria Decision-Making Method. Omega 2015, 53, 49–57. [Google Scholar] [CrossRef]
  15. Liu, W. Application on Floor Water Inrush Evaluation Based on AHP Variation Coefficient Method with GIS. Geotech. Geol. Eng. 2018, 36, 2799–2808. [Google Scholar] [CrossRef]
  16. Zhang, J.; He, J. Matching Evaluation of Integrated Energy Services and Users Based on FA-E-TOPSIS-GRA. In Proceedings of the 2023 International Conference on Power System Technology (PowerCon), Jinan, China, 21–22 September 2023; pp. 1–5. [Google Scholar]
  17. Fu, G. Re-Ranking and TOPSIS-Based Ensemble Feature Selection with Multi-Stage Aggregation for Text Categorization. Pattern Recognit. Lett. 2023, 168, 47–56. [Google Scholar] [CrossRef]
  18. Nguyen, V.-C.; Vu, D.-T.; Tran, Q.-H. Optimizing EDM for Titanium Alloys: An In-Depth Comparison of Five MCDM Techniques. EUREKA Phys. Eng. 2024, 5, 89–98. [Google Scholar] [CrossRef]
  19. Jiang, R.; Zhang, T.; Sun, H.; Liu, D.; Chen, H.; Wang, D. Study on Lightweighting of CFRP Bumper Beam Using Entropy-Based TOPSIS Approach. Automot. Eng. 2021, 43, 421–428. [Google Scholar]
  20. Chen, T.; Liu, Y.; Jia, R.; Tang, C. Wear State Evaluation Method Based on Improved Entropy-weighted TOPSIS for Power-shift Steering Transmission. J. Hunan Univ. Sci. 2024, 51, 10–18. [Google Scholar]
  21. Yang, W.; Yong, T.; Wang, X.; Liu, W.; Yang, F. Creation and Application of Corn—Soybean Belt Compound Planting Technology System. China High-Tech. 2020, 15, 15. [Google Scholar]
  22. Wu, G.; Wu, X. To Adopt the Loads of Passenger Car Body on Strength Analysis by Finite Element Method. J. Mech. Eng. 1997, 5, 84–88. [Google Scholar]
  23. Pandya, S.B.; Kalita, K.; Jangir, P.; Cep, R.; Migdady, H.; Chohan, J.S.; Abualigah, L.; Mallik, S. Multi-Objective RIME Algorithm-Based Techno Economic Analysis for Security Constraints Load Dispatch and Power Flow Including Uncertainties Model of Hybrid Power Systems. Energy Reports. Energy Rep. 2024, 11, 4423–4451. [Google Scholar] [CrossRef]
  24. Su, H. RIME: A Physics-Based Optimization. Neurocomputing 2023, 532, 183–214. [Google Scholar] [CrossRef]
  25. Cai, L.; Ma, S.; Zhao, Y.; Liu, Z.; Yang, W. Finite Element Modeling and Modal Analysis of Heavy-Duty Mechanical Spindle under Multiple Constraints. J. Mech. Eng. 2012, 48, 165–173. [Google Scholar] [CrossRef]
  26. Xiong, F.; Wang, D.; Ma, Z.; Chen, S.; Lv, T.; Lu, F. Structure-Material Integrated Multi-Objective Lightweight Design of the Front End Structure of Automobile Body. Struct. Multidiscip. Optim. 2018, 57, 829–847. [Google Scholar] [CrossRef]
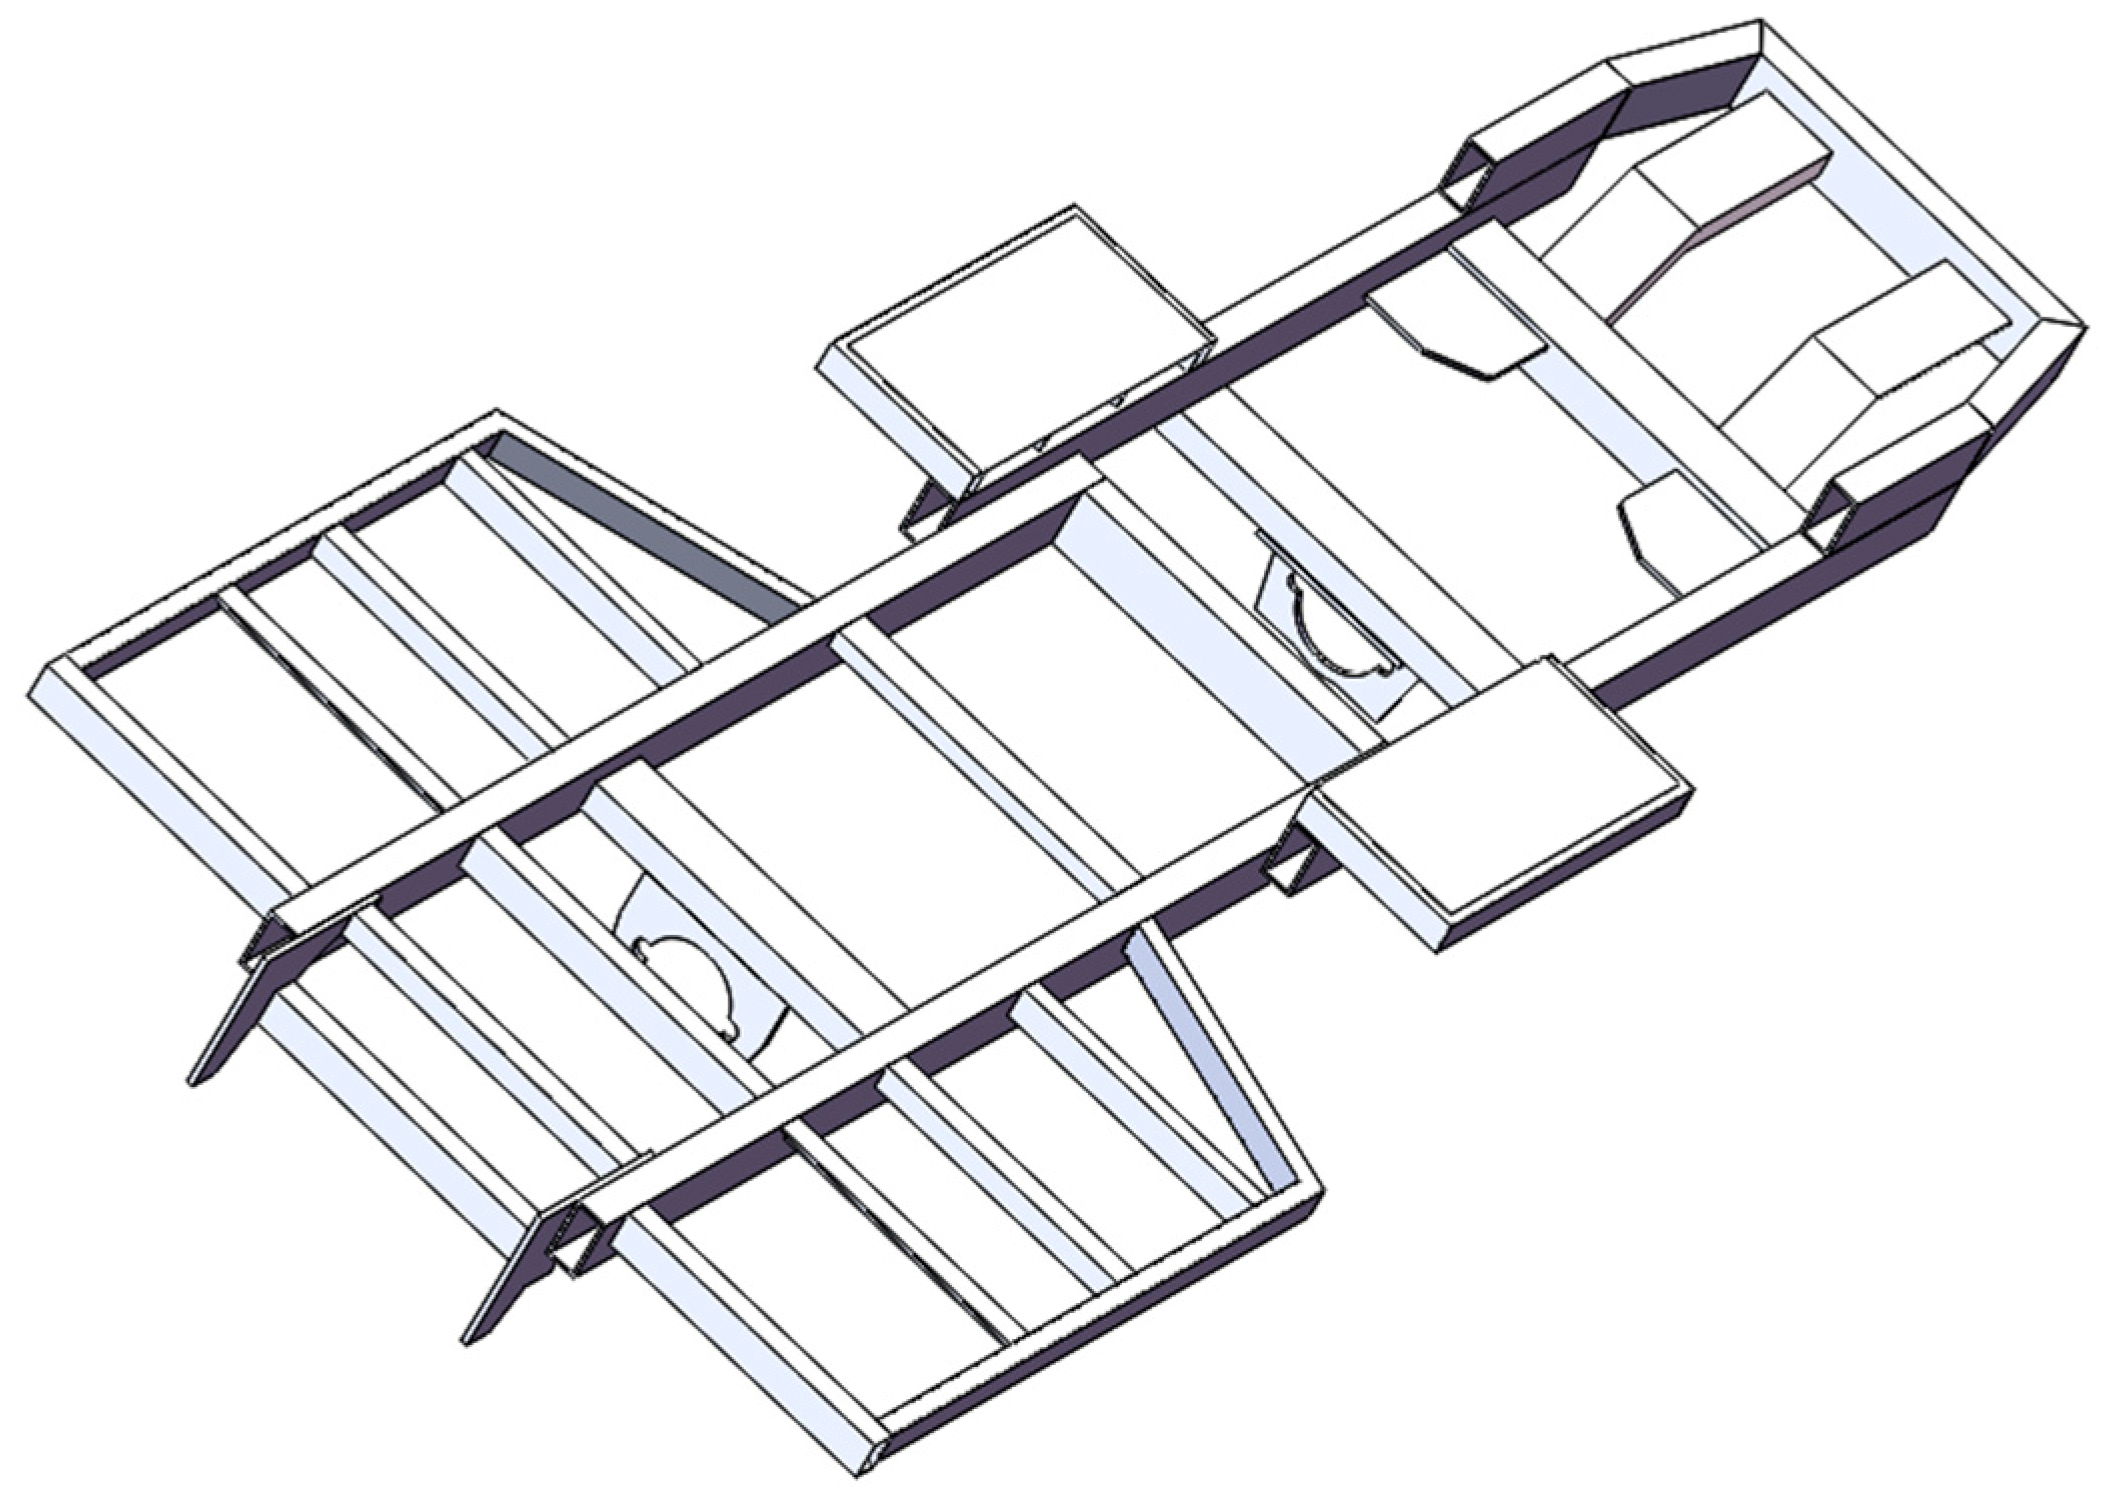
Figure 1. 3D model of the sprayer frame.
Machines 13 00201 g001
Figure 2. The finite element model of the frame.
Machines 13 00201 g002
Figure 3. Schematic diagram of load application positions under full-load bending condition.
Machines 13 00201 g003
Figure 4. Schematic diagram of load application positions under extreme torsional loading condition.
Machines 13 00201 g004
Figure 5. Modal test verification diagram.
Machines 13 00201 g005
Figure 6. Modal test structural diagram.
Machines 13 00201 g006
Figure 7. Sensitivity data for each component.
Machines 13 00201 g007
Figure 8. Schematic diagram of the soft boundary search strategy and hard boundary penetration mechanism of the RIME algorithm. (a) soft-rime; (b) hard-rime.
Machines 13 00201 g008
Figure 9. MORIME algorithm Flowchart.
Machines 13 00201 g009
Figure 10. The finite element model of the frame: (a) first-order mode; (b) second-order mode; (c) third-order mode; (d) fourth-order mode; (e) fifth-order mode; and (f) sixth-order mode.
Machines 13 00201 g010
Table 1. Weight of the sprayer components.
The Sprayer ComponentsWeights/kg
suspensions80
nozzle220
motor250
oil tank50
water box40
cabs300
medicine cabinet (full)600
Table 2. Sensitivity data for each component.
Part NumberMSDSSS
10.021−0.2090.112
20.0050.1100.099
30.0560.1820.095
40.074−0.2890.374
50.009−0.114−0.156
60.019−0.031−0.198
70.002−0.2260.291
80.012−0.1150.252
90.0080.1690.213
100.0030.1250.147
110.0280.298−0.195
120.005−0.261−0.197
130.094−0.3570.283
140.015−0.2960.347
150.034−0.3520.294
160.0110.1650.199
170.0120.2460.305
Table 3. Weight coefficients of performance indicators.
Performance IndicatorsWeight Coefficient
Mass0.5042
Equivalent Stress0.2552
Total Deformation0.2406
Table 4. Comprehensive contribution of selected components.
Part NumberComprehensive Contribution
10.2065
30.5870
40.7826
60.1848
80.1087
110.2826
131.0000
140.1413
150.3478
170.1087
Table 5. Natural frequencies and vibration modes of the frame.
Modal OrderFrequency/HzVibration Type
132.532FT
238.292FB
369.213TBC
473.936FT
574.170TBC
692.752TBC
Table 6. Comparison of simulation and experimental frequencies.
Modal OrderSimulation Frequency/HzExperimental Frequency/Hz
139.53237.007
245.29248.626
359.21369.892
463.93671.350
570.17076.632
682.75289.932
Table 7. Thickness of components after optimization.
Part NumberOptimized ThicknessRounded Value
14.721084.7
34.592294.6
47.538617.5
62.352192.4
84.781184.8
119.724519.7
134.428594.4
143.522813.5
155.168525.2
174.719544.7
Table 8. Comparison of frame performance before and after optimization.
Mass
\kg
MSTC
\MPa
MSBC
\MPa
DTC
\mm
DBC
\mm
FOM
\Hz
Before Opt.178.367180.23203.611.47231.72839.532
After Opt.155.613200.65206.712.11932.33541.225
Variation−22.754+20.64+3.10+0.647+0.607+1.693
Disclaimer/Publisher’s Note: The statements, opinions and data contained in all publications are solely those of the individual author(s) and contributor(s) and not of MDPI and/or the editor(s). MDPI and/or the editor(s) disclaim responsibility for any injury to people or property resulting from any ideas, methods, instructions or products referred to in the content.