Article

Darrieus Vertical Axis Wind Turbine (VAWT) Performance Enhancement by Means of Gurney Flap

1
Department of Engineering, University of Palermo, Viale delle Scienze, Edificio 8, 90128 Palermo, Italy
2
Department of Naval Architecture, Ocean & Marine Engineering, University of Strathclyde, Glasgow G4 0LZ, UK
*
Author to whom correspondence should be addressed.
Machines 2025, 13(11), 1004; https://doi.org/10.3390/machines13111004
Submission received: 5 October 2025 / Revised: 21 October 2025 / Accepted: 27 October 2025 / Published: 31 October 2025

Abstract

This study investigates the aerodynamic effect of Gurney flaps (GFs) of different heights on the performance of a Darrieus vertical axis wind turbine (VAWT). Through numerical simulations, the performance of a baseline airfoil is compared against configurations with GFs of 0.5%c, 1%c, and 1.5%c chord lengths across a range of tip-speed ratios (TSRs). Results identify the 0.5%c GF as the optimal configuration, providing consistent power enhancement across all tested conditions, unlike the taller flaps which showed inconsistent or negative effects. This optimal configuration achieved a peak power coefficient (Cp) of 0.366 at TSR = 2.0, a 3.73% improvement over the baseline, and critically, enhanced the low-speed power by 6.30% at TSR = 0.5, improving the turbine’s self-starting capability. Flow field analysis reveals a dual-benefit mechanism for this superior performance: at low TSRs, the GF delays flow separation during the upwind pass to increase lift, while at higher TSRs, it effectively manages the wake during the downwind pass to reduce drag and mitigate negative torque. The study concludes that the 0.5%c GF strikes an optimal balance between lift augmentation and drag.

1. Introduction

The development of renewable energy is considered an effective countermeasure to mitigate the problems caused by the large-scale combustion of fossil fuels [1]. In response to energy challenges, the world is shifting toward the development and utilization of renewable energy, which has become a key component of its energy strategies. Among these, wind energy as a clean and sustainable energy, has garnered widespread attention due to its minimal environmental impact and efficient utilization of natural resources. The continued advancement of wind energy technology has not only driven innovation within the energy sector but also contributed to mitigating global climate change.
Wind turbines (WTs) convert wind energy into electrical energy and are primarily categorized based on the orientation of their rotational axis: horizontal-axis wind turbines (HAWTs) and vertical-axis wind turbines (VAWTs). In VAWTs, the rotor blades are vertically aligned relative to the shaft, enabling omnidirectional wind to be captured without the need for a yaw mechanism [2,3,4]. Their compactness, easier maintenance, low noise emission, and adaptability to urban and turbulent wind conditions make them particularly attractive for decentralized energy applications [5,6].
Despite these benefits, VAWTs face several issues that limit their large-scale deployment. The periodic variation in the blade angle of attack (AOA) during rotation often induces dynamic stall, leading to flow separation, cyclic loading, and low self-starting capability, and the occurrence is likely unpreventable in low tip speeds below 3 [7,8,9]. To address these issues, various optimization strategies have been investigated, including active and passive flow control devices, structural modification, and hybrid augmentation systems [10,11,12,13,14]. Passive devices, such as Gurney Flaps (GFs), have attracted growing attention due to their simplicity and energy free operation, providing effective lift enhancement and flow stabilization across a range of aerodynamic applications [13,15]. Dan Gurney, an American race car driver, first used this on the rear spoiler of his racing car in the early 1970s. Following that, in 1978, Liebeck [16] did an extensive study on the aerodynamic properties of such a device. His wind tunnel test focused on a Newman airfoil, and Liebeck coined the name ‘Gurney flap.’
Recent research studies have growingly explored passive and structural augmentation techniques to enhance the efficiency of VAWTs. Ducted configuration and power augmenters effectively accelerate local flow and enhance the power coefficient, thereby improving the self-starting capability of Savonius and Darrieus turbines [17]. Augmentation devices such as deflectors, shrouds, and guide vanes have shown considerable improvements in energy capture and wake control, indicating the importance of passive aerodynamic modifications [18]. Complementary studies on adaptable and responsive designs, such as morphing blades, adjustable pitch, and variable Gurney flaps, indicate that the integration of adjustable geometry can enhance torque and aerodynamic efficiency under various wind conditions [19]. These findings underline the increasing focus on fixed and variable augmentation strategies as effective methods for enhancing VAWT efficiency, with GFs emerging as a promising, simplified passive control technique.
Building on these developments, Scholars worldwide have extensively investigated VAWT airfoil structures, with particular focus on the aerodynamic performance improvements achieved through the installation of trailing-edge GFs. Mayda et al. [20] examined fixed GFs installed on both the pressure and suction sides of turbine blades, highlighted that the GF on the pressure side effectively improved aerodynamic performance. Syawitri, T.P. et al. [21] reported that incorporating GFs in VAWT blades effectively prolongs deep stall, mitigate negative instantaneous torque, and enhance overall turbine performance. Chakroun et al. [8] and Mousavi et al. [15] computationally evaluated the effects of GFs on a rotating VAWT using the NACA 0018 and NACA 0021 airfoils, respectively, and found that GFs significantly improved lift and power output. In addition, Xie et al. [22] applied GF on a NACA 0012 airfoil, resulting in a 22% increase in maximum energy extraction and a 15% improvement in overall efficiency. Collectively, these findings highlight the growing emphasis on both fixed and variable augmentation techniques as effective approach for improving VAWT performance, within which GFs represent a promising, low complexity passive control approach.
GFs are typically mounted perpendicular to the airfoils chord, with heights ranges from 0.5% to 5% of the chord length [23]. Giguere, P. et al. [24] and Li, Y.C. et al. [25] demonstrated that even small GFs can notably enhance lift with just a slight increase in drag. Jain et al. [26] further found that a flap height of 1.5% of the chord, positioned normal to the trailing edge, yields the optimal lift-to-drag ratio. Yan et al. [27] also demonstrated that perpendicular mounting offers the most favorable aerodynamic performance. Moreover, Table 1 in the referenced article [28] summarizes the key contributions in this field.
While these findings highlight the aerodynamic potential of GFs under controlled conditions, numerical simulations often fail to account for various real-world physical effects, such as tip losses, three-dimensional (3D) flow structures, and structural deformation, resulting in discrepancies from actual turbine behavior. The operational performance of VAWTs is influenced by unsteady inflow, turbulence intensity, and environmental variability, which alter aerodynamic loads and wake patterns [29]. Moreover, field studies indicate that terrain-induced turbulence, wind shear, and directional instability can significantly affect power output and fatigue loading, highlighting importance for designs that sustain reliability in non-uniform and imperfect flow conditions [30]. Considering these imperfections is essential for reducing the difference between numerical estimates and the actual aerodynamic performance of VAWTs, and this study examines the aerodynamic effects of Gurney flaps through two-dimensional (2D) numerical analysis to establish a reliable reference for subsequent 3D and experimental studies.
To further address these aerodynamic and modeling limitations, previous research has focused on the use of GFs on conventional turbine airfoils, primarily those with four-digit series, demonstrating improvements in lift with minimal drag penalties. This study aims to address the gap in existing literature regarding the insufficient attention given to GFs on six-digit airfoils, specifically in the context of VAWTs. We analyze the NACA 64(2)-415 airfoil, commonly used in three-bladed VAWT configurations, applying GFs of varying heights to the trailing edge on the pressure side. A 2D computational fluid dynamics (CFD) analysis is conducted to evaluate the aerodynamic performance of these configurations compared to the clean baseline airfoil. This research highlights the potential of GFs as a passive method for improving the efficiency of three-bladed VAWTs.

2. Methodology

2.1. Selection of the Airfoil

In this study, the NACA 64(2)-415 airfoil is used, based on the findings of our prior research [31], and to address the gap in the existing literature, which lacks sufficient attention to the GF on six digits airfoils. The chord length of the airfoil is 0.25 m. The aerodynamic performance of a baseline airfoil was tested computationally against configurations with GFs of 0.5%c, 1%c, and 1.5%c chord lengths across a range of tip speed ratios (TSRs) by conducting numerical simulations at a Reynolds number (Re) of 1.03 × 10⁵. The Re was derived using the standard equation (Re = ρVL/μ), where ρ represents air density, V indicates the free-stream velocity, L signifies the characteristic length (chord), and μ denotes the dynamic viscosity of air.
The flap is mounted perpendicularly, forming a 90° angle to the chord line, as determined by previous studies [23,26,27]. Figure 1 depicts the geometric configurations of the baseline, clean, and modified with the GF airfoils.

2.2. Geometric Domain and Boundary Conditions of VAWT

Accurately defining the computational domain is crucial in numerical simulations. If the fluid domain is too large, it can significantly increase the number of elements, thereby raising computational costs. On the other hand, using a smaller fluid domain that limits vortex formation and development downstream of the turbine can lead to substantial changes in the results, potentially increasing the simulation’s error margin. This study utilized a 2D domain adapted from Alaimo et al. [32] to reduce simulation time through an effective trial-and-error refining method. In the rotating domain, three bodies of influence (BOIs) were strategically placed around the airfoils to reduce the number of elements while preserving grid quality. Table 1 summarizes the geometric and operational specifications of the current Darrieus VAWT, using NACA 64(2)-415 airfoil profiles.
The boundary conditions are applied to each side of the 2D computational do-main, as shown in Figure 2. A uniform inflow velocity of 6 m/s is directed into the domain from the left, with a turbulent intensity of 0.1% and a viscosity ratio of 10. A pressure-outlet boundary condition as specified at the outlet, with a zero-gauge pressure, representing atmospheric pressure. The far-field boundaries were placed sufficiently far from the turbine to avoid interference with the results, and a zero-flux slip condition was applied at the boundaries. To ensure a smooth transition between the stationery and rotating zones, an interface boundary was used to interpolate the required values across this boundary. Finally, no-slip wall boundary conditions are applied to the surfaces of the rotor blades.

3. Model Sensitivity Analysis

3.1. Numerical Setup and Grid Independence Study (Grid Topology)

Numerical simulations were conducted using ANSYS 2024 R2, a finite volume-based CFD solver. A transient study was performed under incompressible flow conditions to capture the unstable aerodynamic behavior of the airfoil. The turbulence model was simulated by applying the two-equation SST (Shear Stress Transport) k-ω model, which presents precision in predicting separation and near-wall flow properties as reported by Ekaterinaris and Platzer [33,34]. The pressure-based solver was set, with pressure-velocity coupling managed by the SIMPLE (Semi-Implicit Method for Pressure Linked Equations) method. Spatial discretization was executed with the least-squares cell-based technique for gradients and a second-order upwind scheme for the momentum and turbulence equations. To ensure the convergence of the solution at each time step, a residual tolerance of 1 × 10⁻⁵ was required for all governing equations.
The accuracy of the VAWTs CFD model relies on high-quality grid, as substantial variations in element size, especially on the blade surfaces and interface boundaries, can lead to increase computational errors. The velocity gradient demonstrates significant intensity along the blade walls, where the formation of a vortex is also observed. It highlights the need for precisely forecasting flow dynamics at the blade walls. The y plus parameter is a dimensionless number used to estimate the boundary layer profile. The height of the very first inflation layer of the grid in relation to the blade’s surface must be configured to ensure that the first layer remains within the viscous sublayer [35]. The y+ value is directly influenced by the normal distance of the cell center from the wall, as demonstrated by the following relationships:
y + = u * y / v ,
where u * ,   y ,   v represents friction velocity, normal distance of the cell center from the wall and kinematic viscosity, respectively.
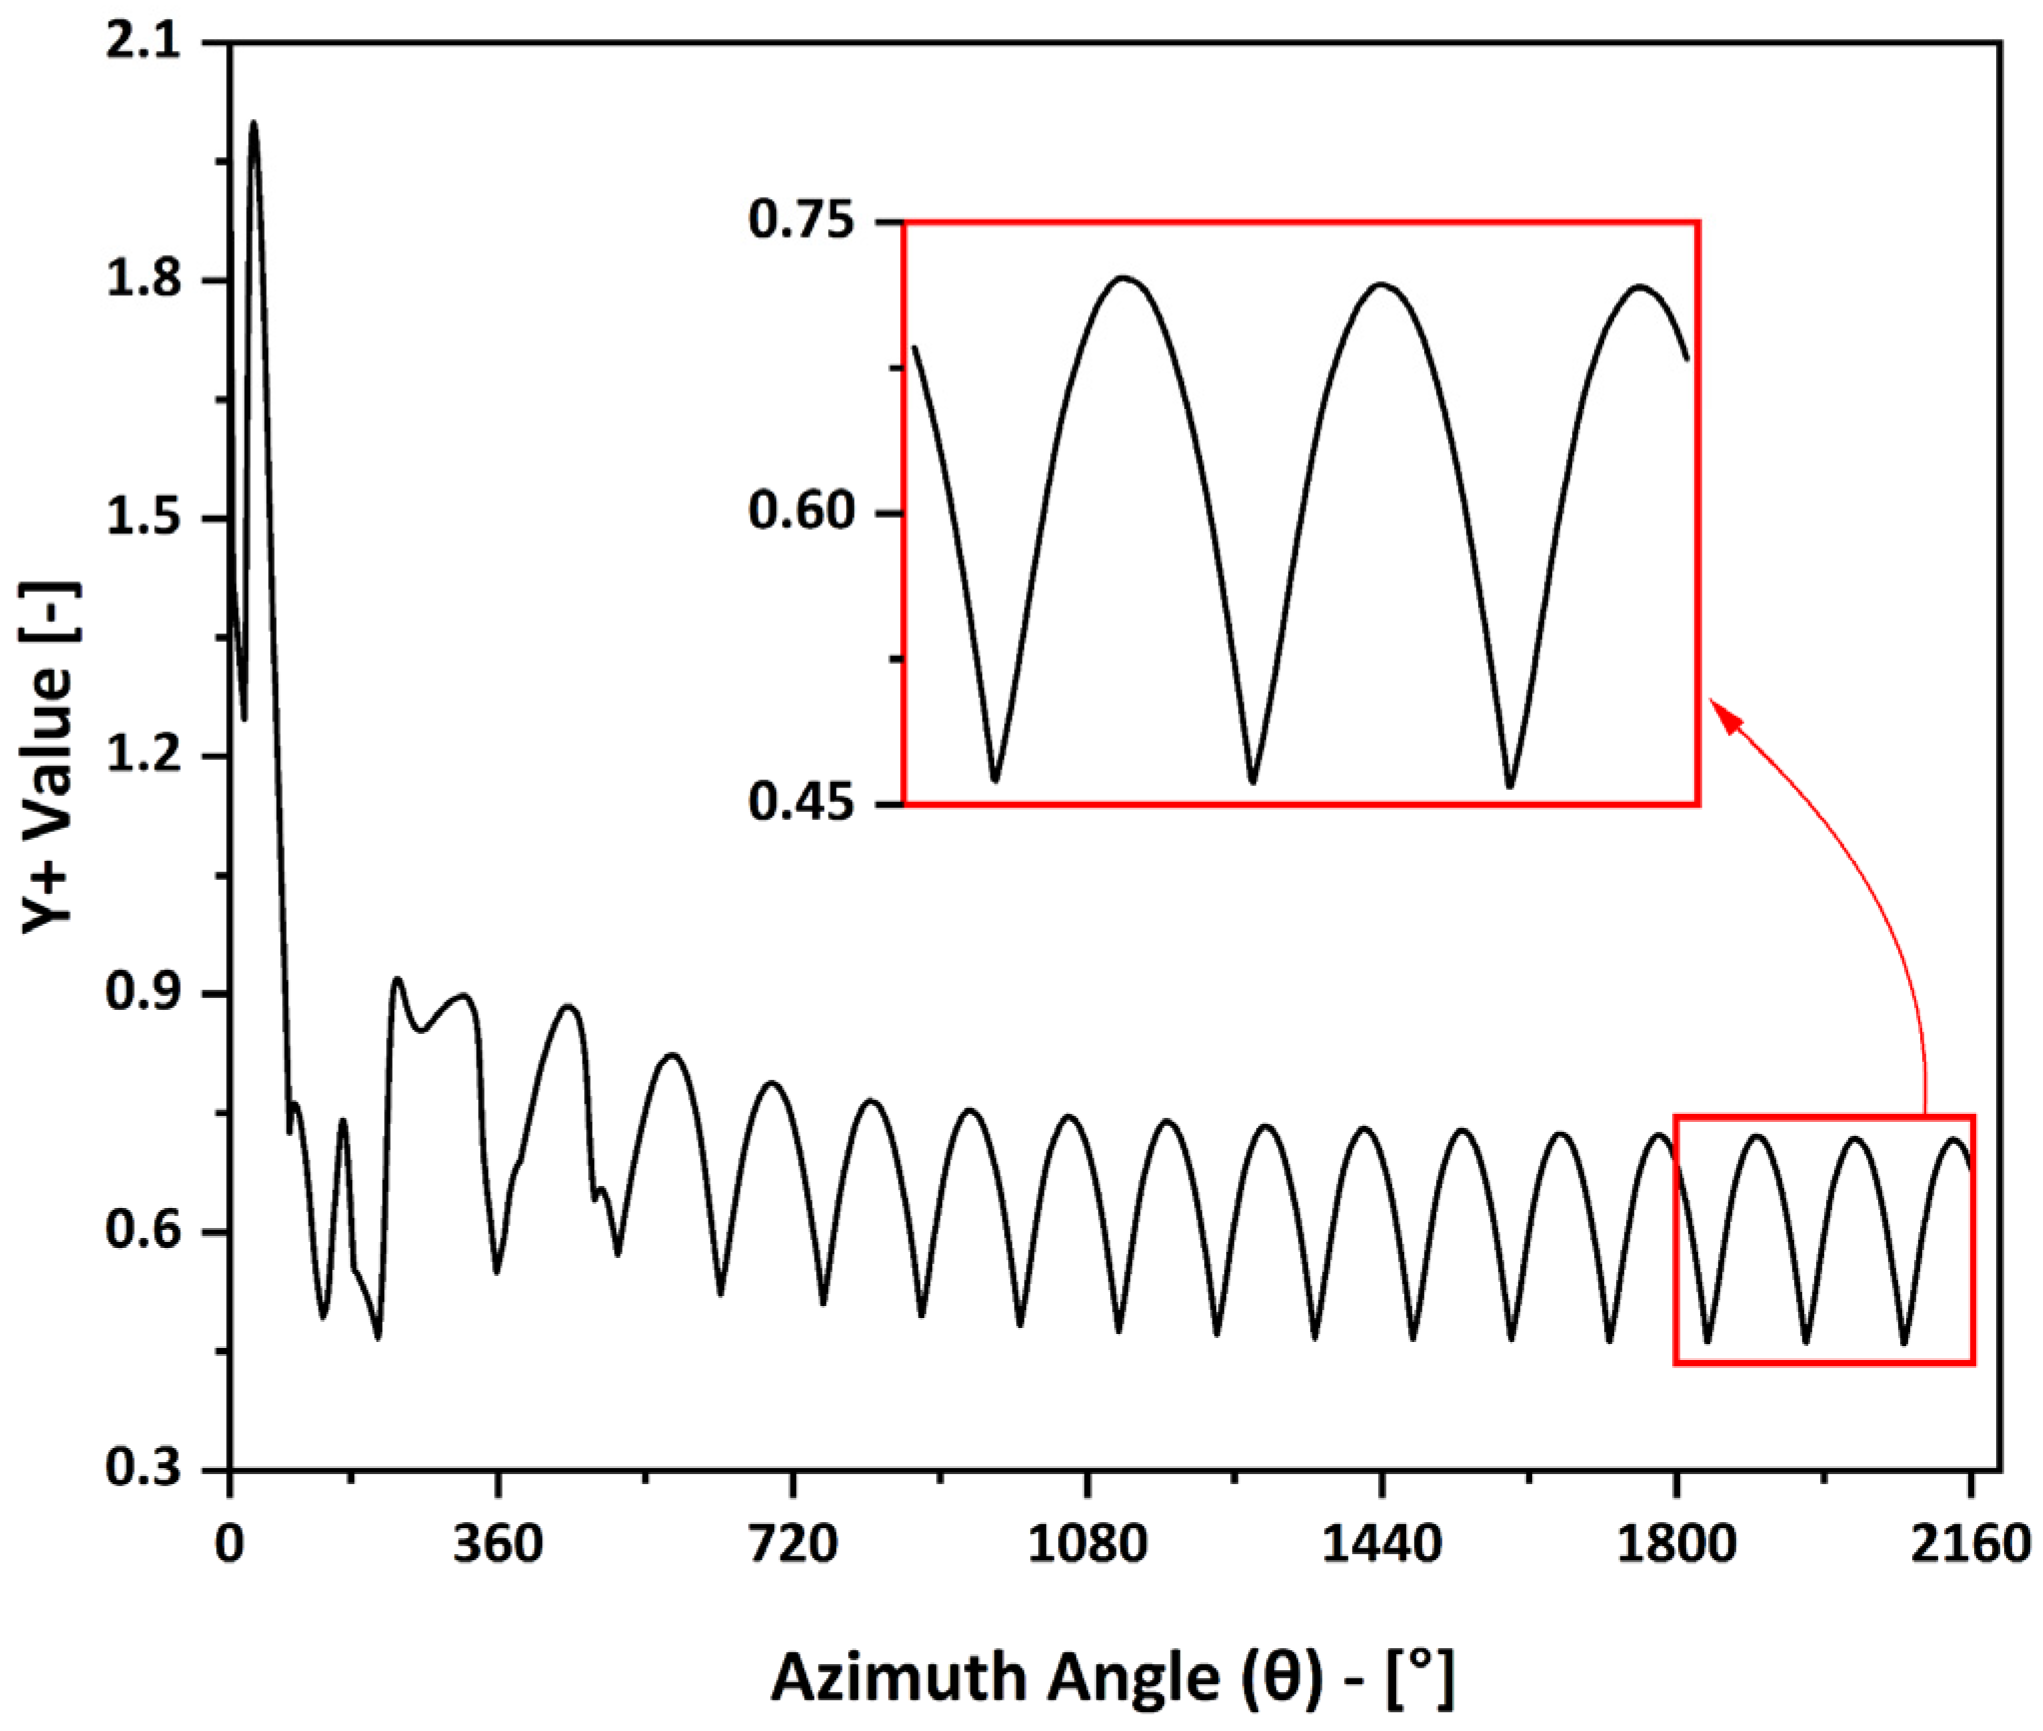
To ensure the accuracy of the turbulence model, the y+ value of the first layer should be approximately 1 or below [36,37]. In the current investigation, the mesh was carefully constructed to meet this requirement. As shown in Figure 3 for a representative case, the y+ values on the blade surfaces were consistently maintained at an appropriate level for the SST k-ω model.
Four distinct mesh configurations are created and assessed to examine grid independence, with a specific focus on mesh quality in critical areas, such as blade surfaces and interface boundaries. It is worth noting that several grids were observed to seek suitable first-layer thickness to satisfy the acceptable y+ range. The boundary layer mesh is carefully designed with 35 layers and a growth rate of 1.1 to capture the near-wall flow physics accurately. The grid independence study was conducted for the airfoil equipped with a 1%c height of GF at the trailing edge of the blade at TSR 2.5, where the highest velocity gradients are anticipated near the blade walls, given the 0.5–2.5 TSR range of the current study. Table 2 summarizes the specifications of the generated grids independence study, revealing a methodical refinement approach from coarse to very fine meshes. Owing to experiences related to the stationary steady state conditions, all results are computed to the sixth revolution of the turbine.
Figure 4 illustrates the utilization of an unstructured grid for both the rotating and stationary zones to reduce mesh generation costs, while a boundary layer grid was generated in the proximity of the airfoils. A finer grid was used exclusively in critical and sensitive regions.
A comparison of the results on the instantaneous torque coefficient variation as a function of blade azimuth angle for different grids is presented in Figure 5. The results demonstrate distinctive cyclical patterns with three periods corresponding to the three-bladed turbine configuration. The findings across different grids indicate that the coarse mesh with 450 elements on the blade surface yielded an average torque coefficient of 0.1103. To double the number of cells on the blade surface, leading to a total of 537,820 elements and an average torque coefficient of 0.1283, indicating a 14% variation. The further refinement to 1800 elements resulted in a mere 3.09% deviation from the medium mesh outcomes. The exceptionally fine mesh with 3600 splits exhibited a slight 0.83% variation relative to the fine mesh.
Closer examination of Figure 5 reveals critical performance differentiators between the grid resolutions. The coarse grid significantly underpredicts the peak torque values, while the fine and very fine grid exhibit nearly identical torque profiles with minimal deviation (0.83%) in average torque coefficient, well below the established 1% convergence criterion. Consequently, the fine grid was selected for the following simulations, offering an optimal balance between the accuracy and computational cost.

3.2. Time Step Size Sensitivity Analysis

The time step is generally adjusted according to the rotor’s rotation angle in VAWT simulations, as illustrated in Figure 6. In this study, changing time step values of 0.5°, 1°, and 2° were evaluated. The simulation began with the turbine exhibiting a rotational displacement of 0.5° at each step, followed by increments to 1° and 2° in the succeeding cases. The time independence analysis is conducted at a TSR of 2.5, using fine mesh.
Table 3 demonstrates the average torque coefficients acquired for various time step sizes. The findings indicate that a time step of 1° rotation produces an average torque coefficient of 0.1324, reflecting a mere 0.69% variation from the 0.5–time step. Increasing the time step to 2° yields a notable variation of 6.39%, indicating a potential reduction in accuracy. With a convergence threshold of 1% variation in the average torque coefficient, the time step for a 1° rotation was chosen for further simulations, providing an acceptable balance between computational cost and solution precision. The findings are in line with the study [35,38], which showed that smaller time steps allow the flow field to evolve smoothly. In comparison larger time steps result in significant discrepancies due to abrupt blade displacement. The time step sensitivity analysis must be conducted independently for each case study to guarantee the trustworthiness of the numerical outcomes.

3.3. Solution Convergence Analysis

To confirm that the simulations reached a stable periodic state, the instantaneous torque coefficient (Cm) was monitored over multiple rotor revolutions. The analysis was performed for the TSR of 2.5 case, which represents the most challenging condition with the highest velocity gradients. Figure 7 shows the Cm profile over the final seven rotor revolutions of the simulation. The curves for each revolution overlap almost perfectly, indicating that a cyclically stable solution was achieved. Therefore, the data from second last revolution, used for the analysis in this paper, is fully converged and representative.

3.4. Model Validation

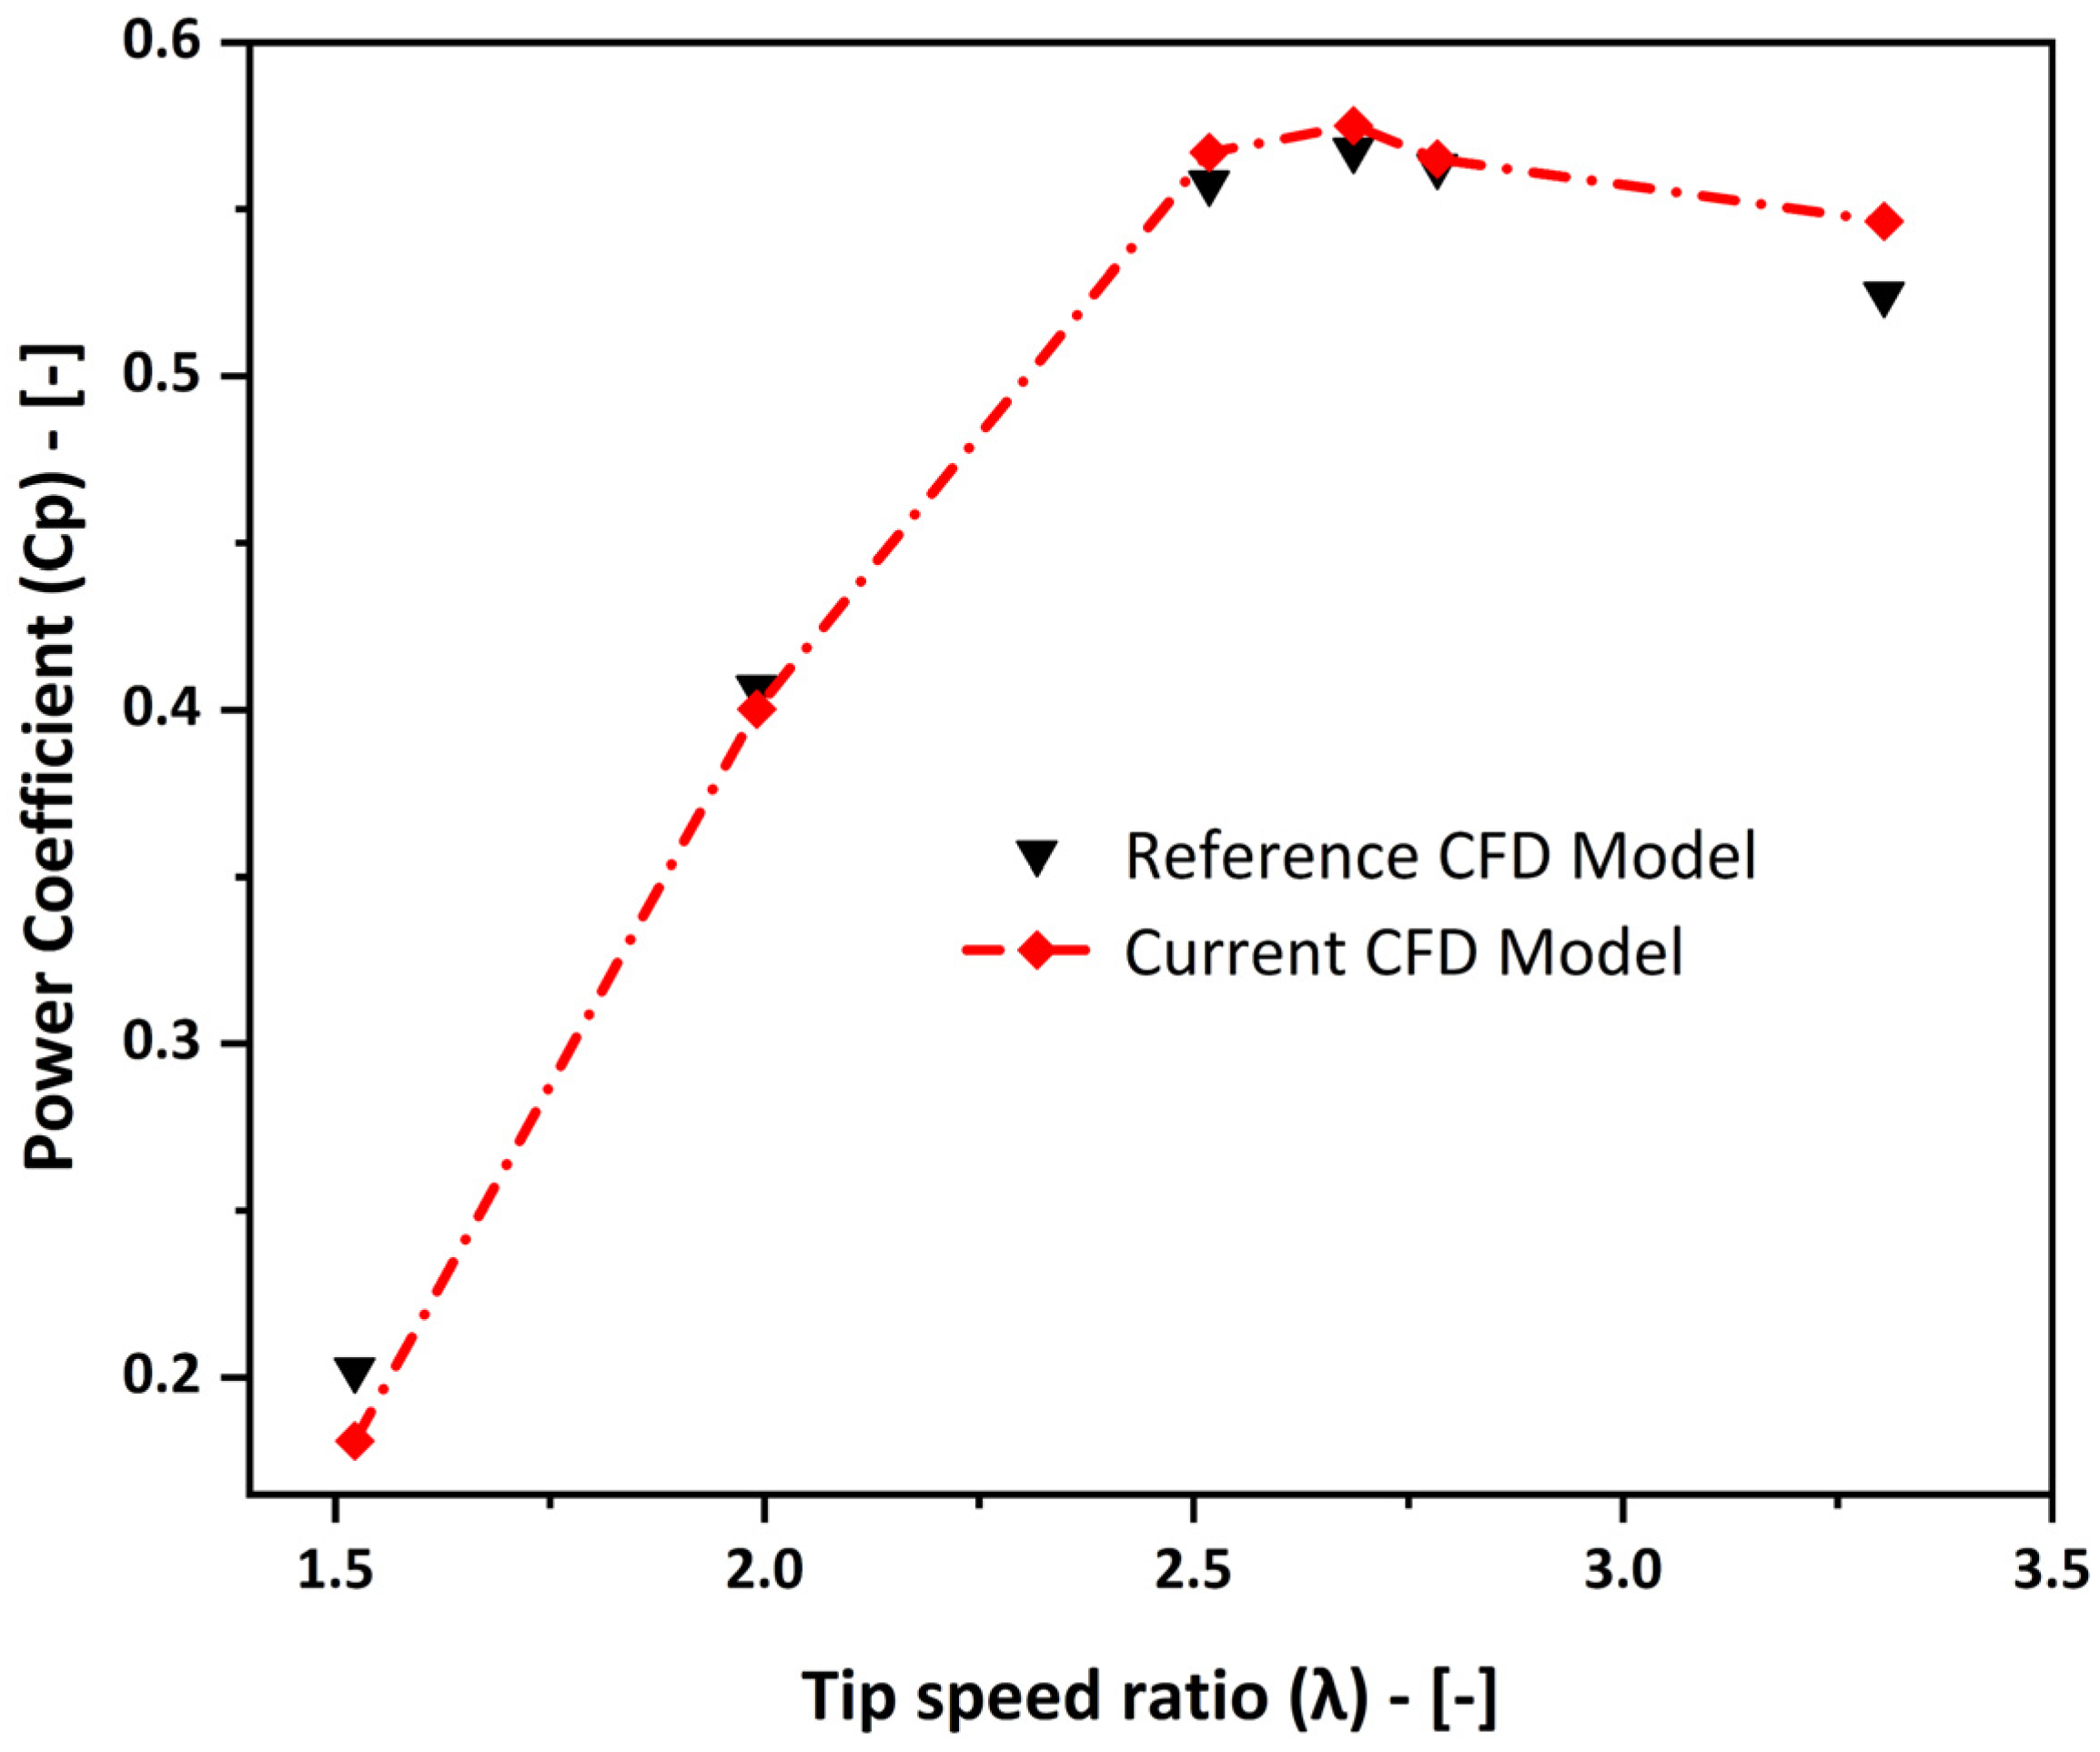
To ensure the reliability and accuracy of the current numerical model, a comprehensive validation study was carried out by comparing the present computational results against the data presented by Castelli et al. [39], who performed a systematic investigation of a straight-bladed Darrieus VAWT with NACA 0021 airfoil section, with their key geometric parameters presented in Table 4.
The validation presents a comparison of the power coefficient (Cp) curves across different tip speed ratios at a constant wind speed of 9 m/s. The Cp, which represents the ratio of the power extracted by the turbine to the available power in the wind, is defined as:
C p = P / 0.5 ρ   A   V 3 ,
where P is the power extracted by the turbine, ρ is the air density, A is the swept area of the turbine, and V is the freestream velocity.
The numerical predictions from the current CFD model showed excellent agreement with Castelli’s numerical results, as illustrated in Figure 8. Their study involved both experimental and computational analyses of a three-bladed Darrieus VAWT. The accuracy of the CFD approach was validated by the observation that the variations between the present study and the reference numerical data consistently remained below 6% as the tip speed ratio ranged from 1.5 to 3.3. This validation not only provides a reliable predictive tool for subsequent optimization studies, facilitating fast iteration and performance assessment of wind turbine designs, but also eliminates the need for physical testing.
The authors emphasized that despite the limitations of 2D modeling in capturing absolute performance values, these models effectively predict the relative performance trends and fundamental flow physics at a significantly reduced computational cost compared to 3D simulations, and makes 2D analysis particularly useful for parametric studies and initial design optimization, where the relative impact of design changes is of primary interest rather than absolute performance predictions.

4. Results and Discussion

4.1. Global Performance Overview

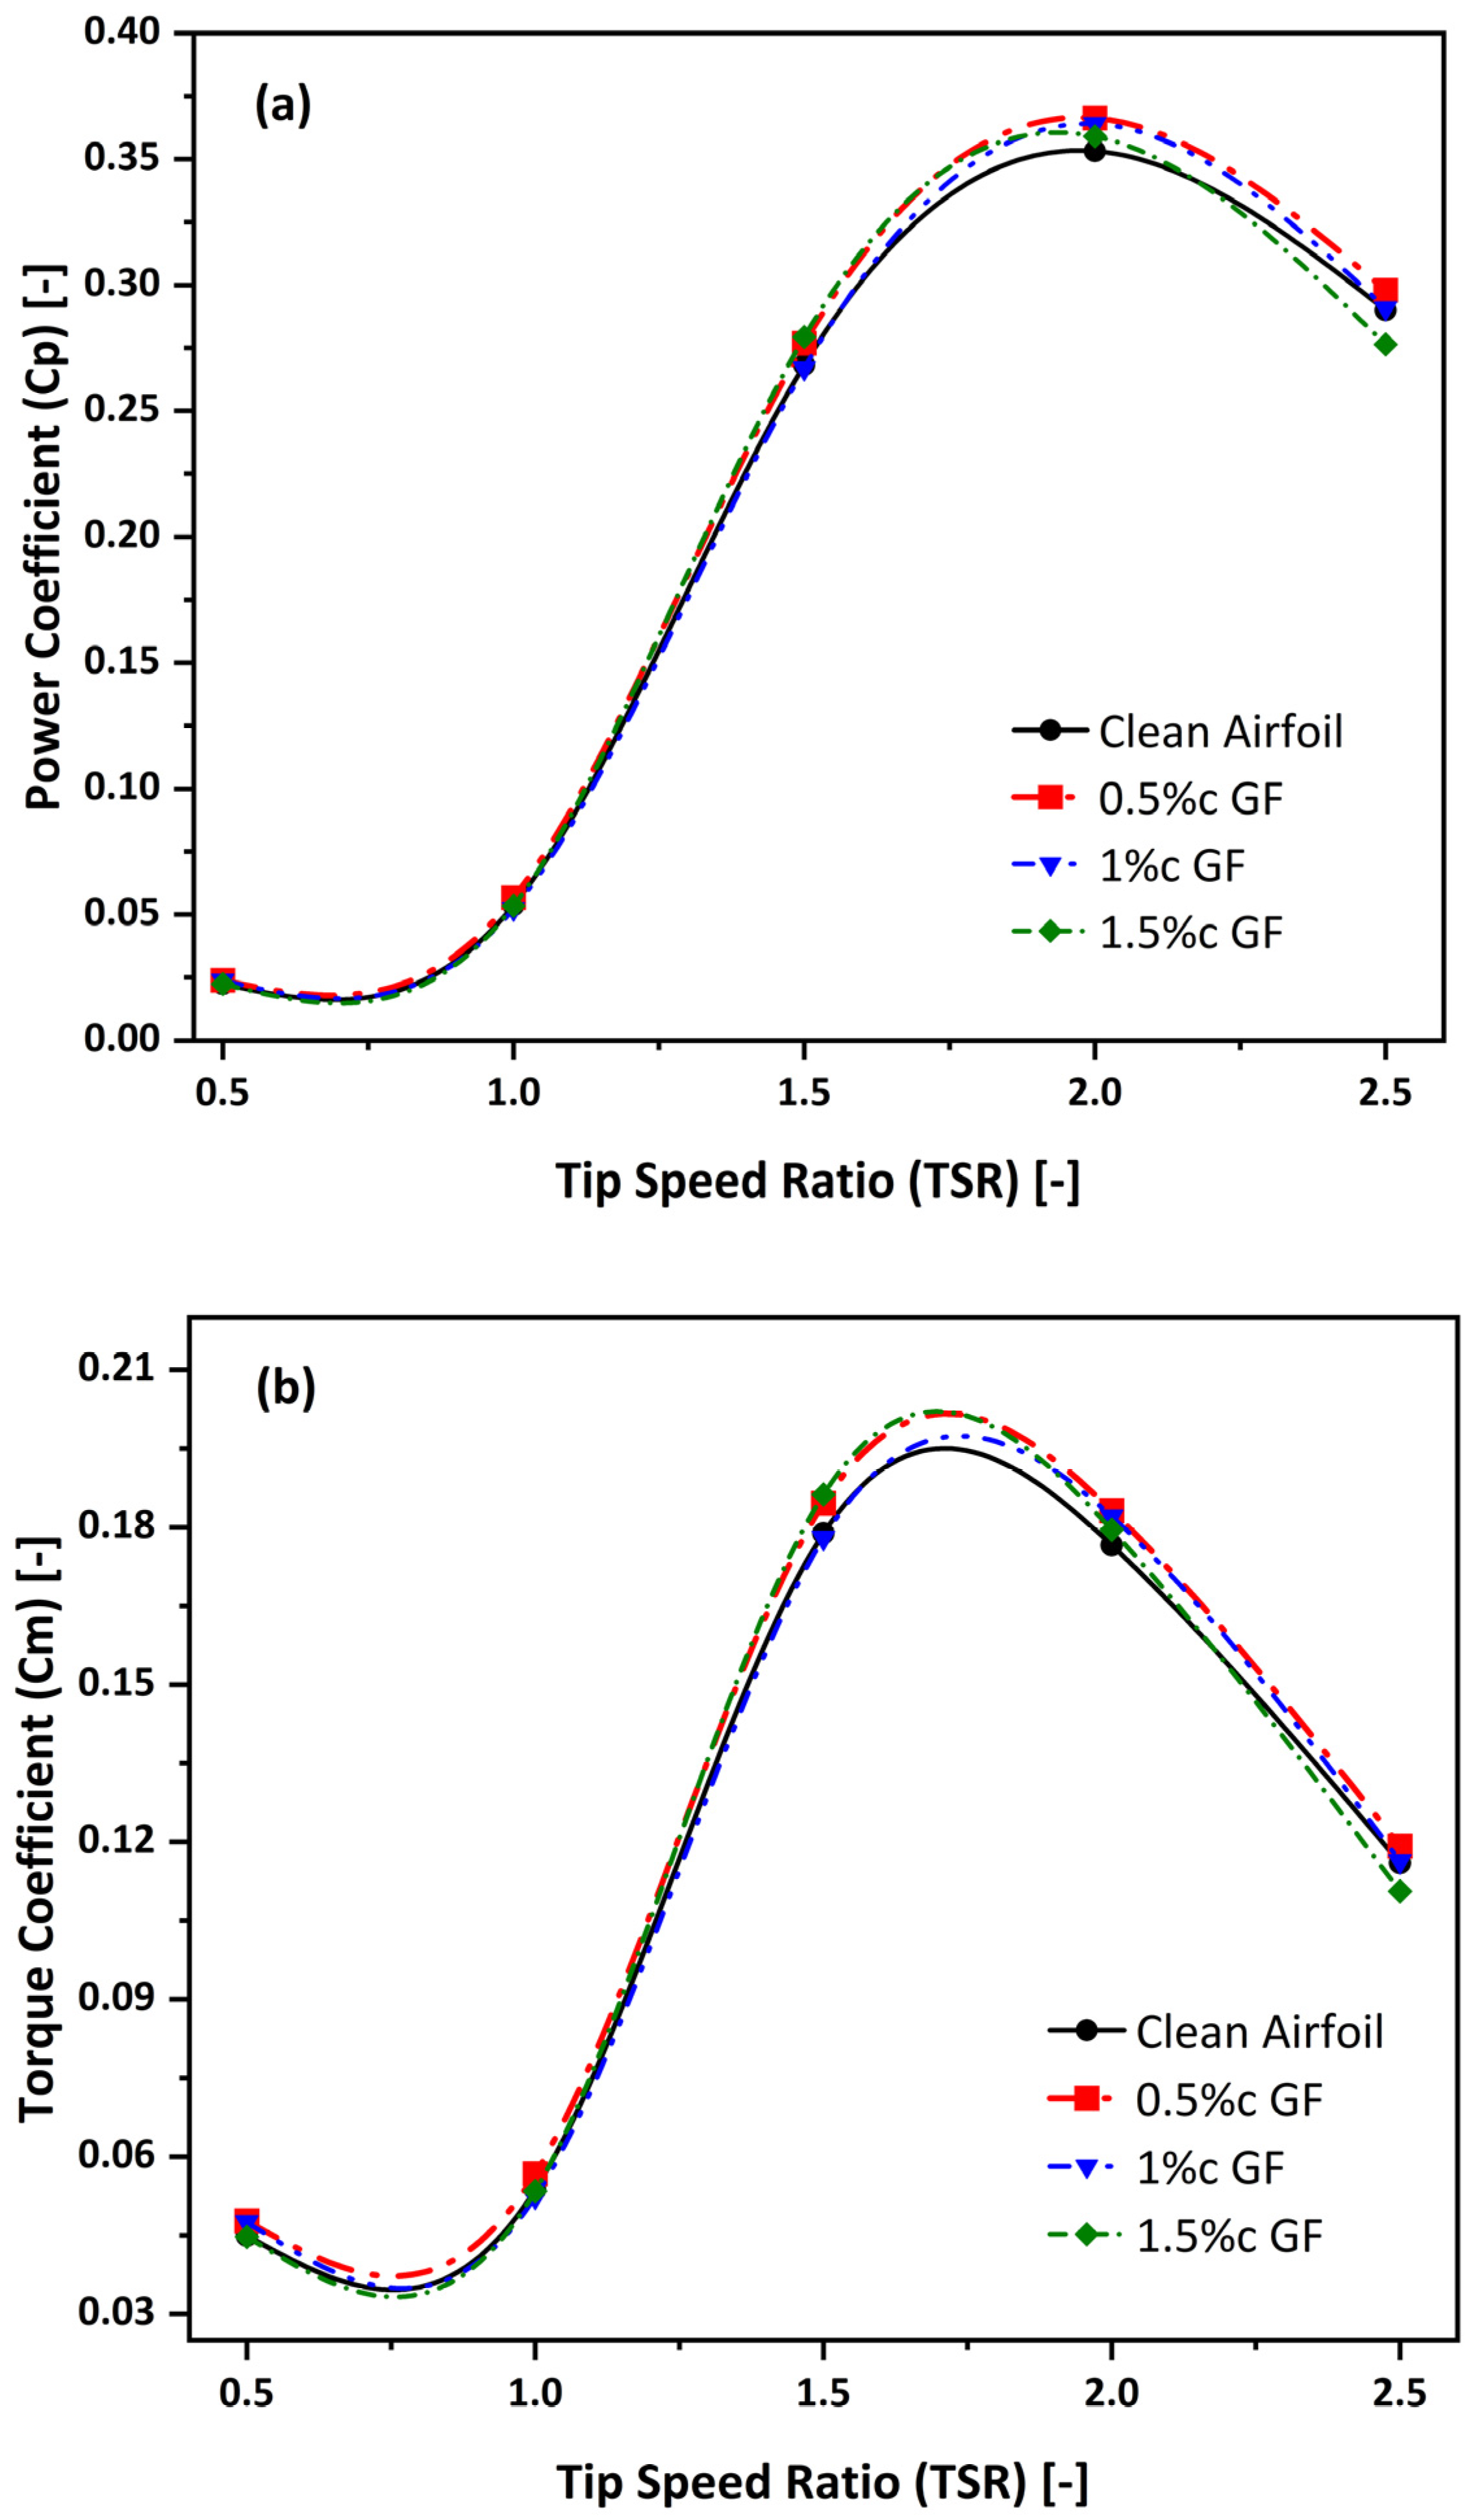
The overall aerodynamic performance of the H-rotor VAWT was evaluated by analyzing the mean torque coefficient (Cm) and Cp across a range of operational TSRs. Figure 9a presents the Cp-TSR and Figure 9b Cm-TSR relationships for the baseline clean airfoil and the three GFs configurations. This provides a visual representation of the performance trends. For a precise quantitative comparison, a comprehensive summary of the performance metrics is provided in Table 5, which details the exact Cp and Cm values and quantifies the performance change relative to the clean airfoil.
The quantitative data presented in Table 5 clearly identify the 0.5% GF as the optimal overall configuration. It is the only design that consistently and positively enhances performance across all tested TSRs. The most significant gain is observed at TSR = 0.5, where the Cp increases by a substantial 6.30%. This improvement at low rotational speeds is critical for a VAWT’s self-starting capability and is directly corroborated by the Cm data, where the 0.5%c GF generated the highest mean torque 0.0477 under these conditions.
Furthermore, the 0.5%c GF configuration achieves the highest peak Cp of all tested models, reaching a Cp, max of 0.366 at TSR 2.0. This represents a 3.73% improvement over the baseline airfoil’s peak performance, demonstrating its effectiveness in the optimal operating range of the turbine.
In contrast, the taller GFs exhibit inconsistent and often detrimental effects. The 1.5%c GF, for example, shows a localized benefit at TSR 1.5 but results in a significant performance degradation of −4.68% at TSR 2.5. This behavior strongly suggests that for taller flaps, the parasitic drag penalty becomes dominant and outweighs any lift augmentation benefits, particularly at higher relative flow velocities. The superior and stable performance of the 0.5%c GF indicates it strikes an effective balance between these competing aerodynamic effects.
To understand the physical mechanisms driving the consistent superiority of the 0.5%c GF, the following section will analyze the instantaneous torque generation over a full 360° rotation.

4.2. Torque Distribution Analysis

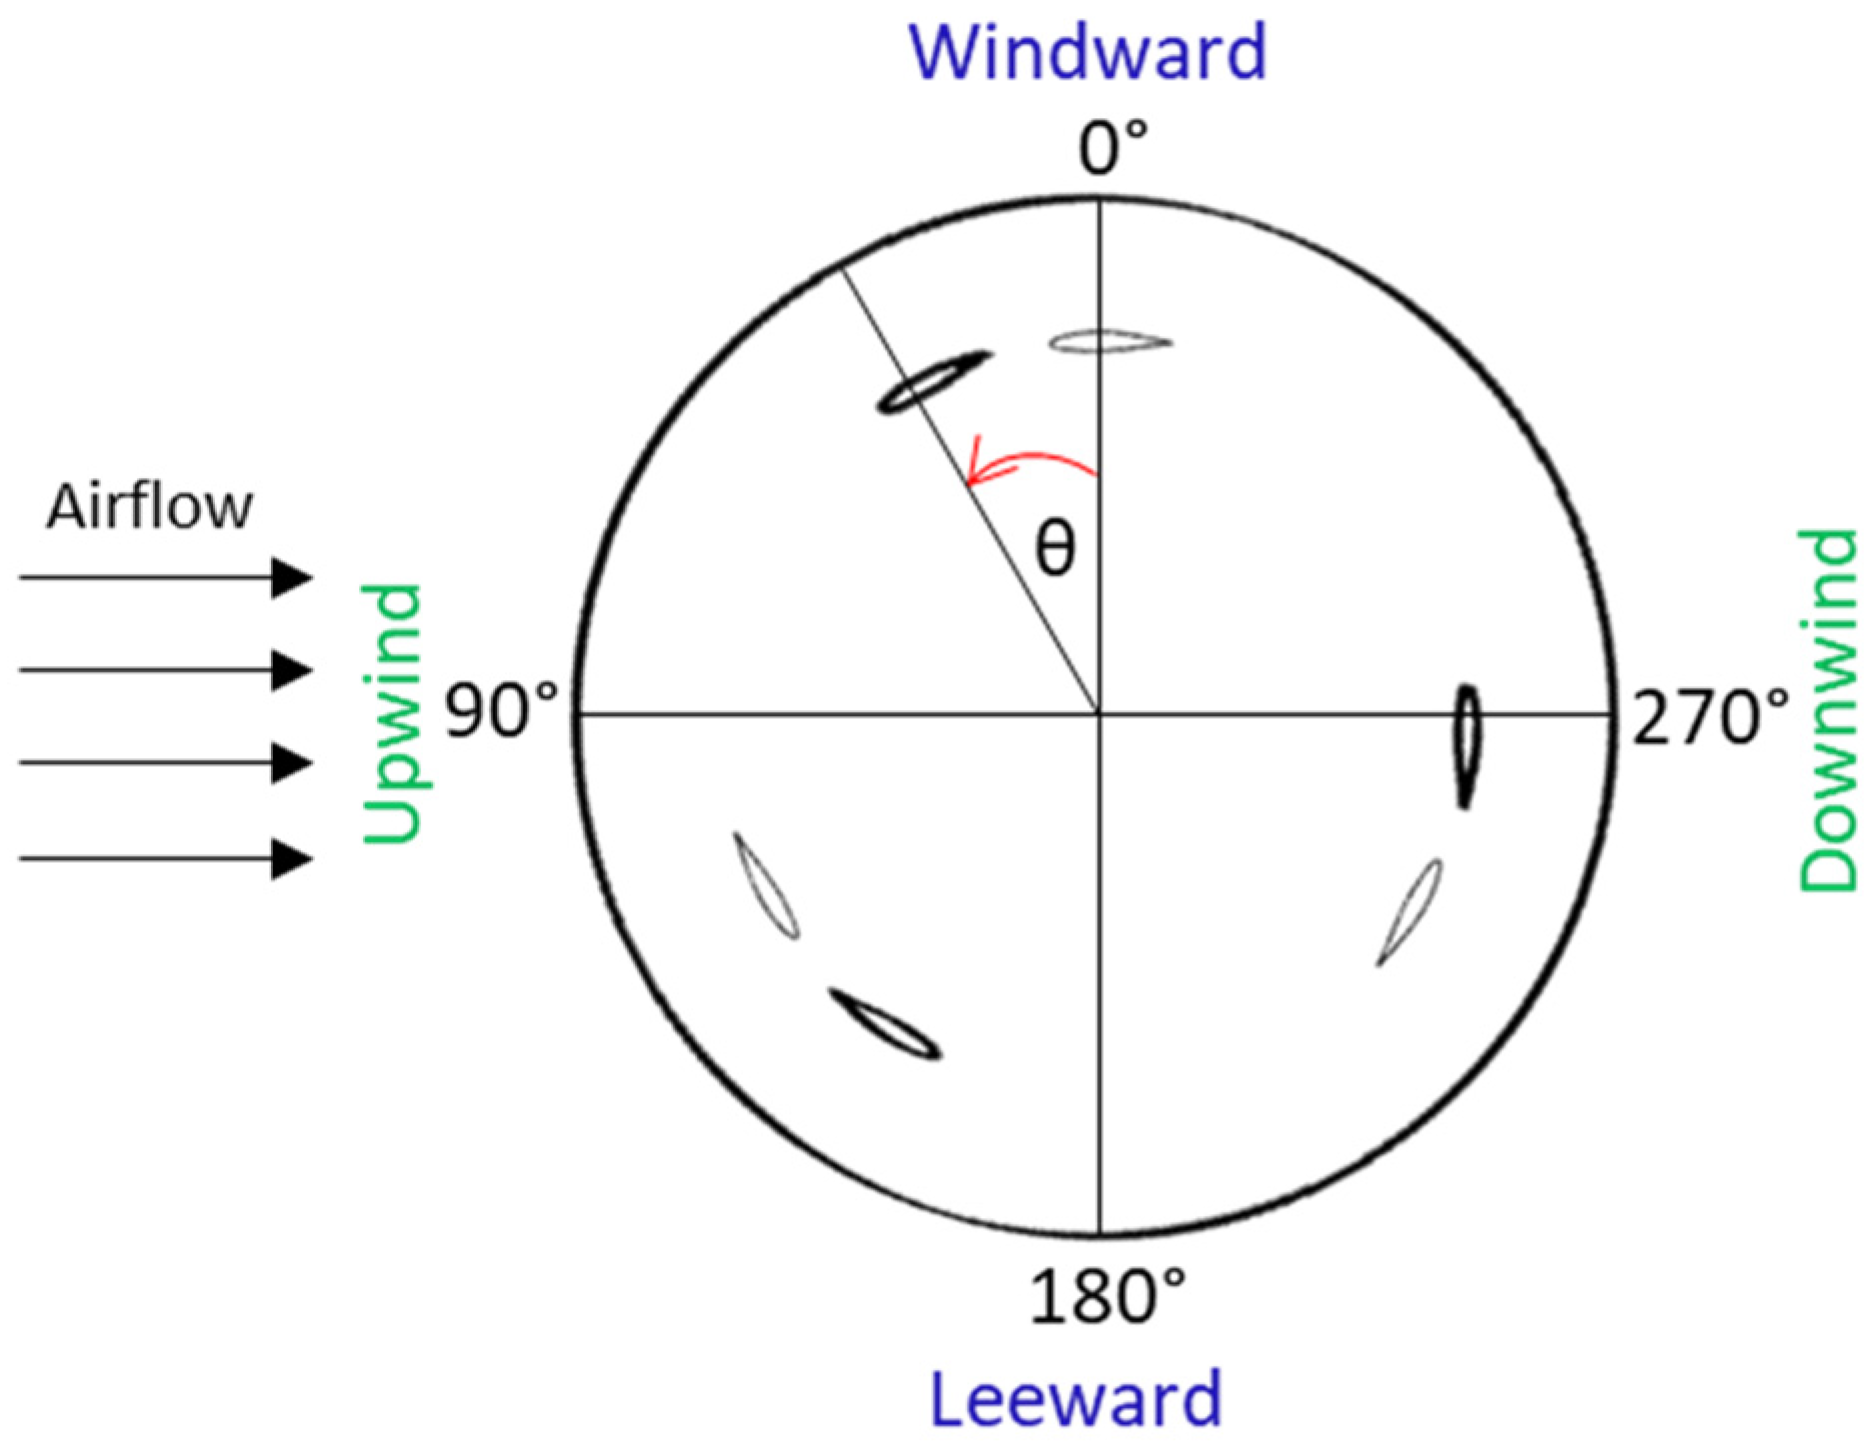
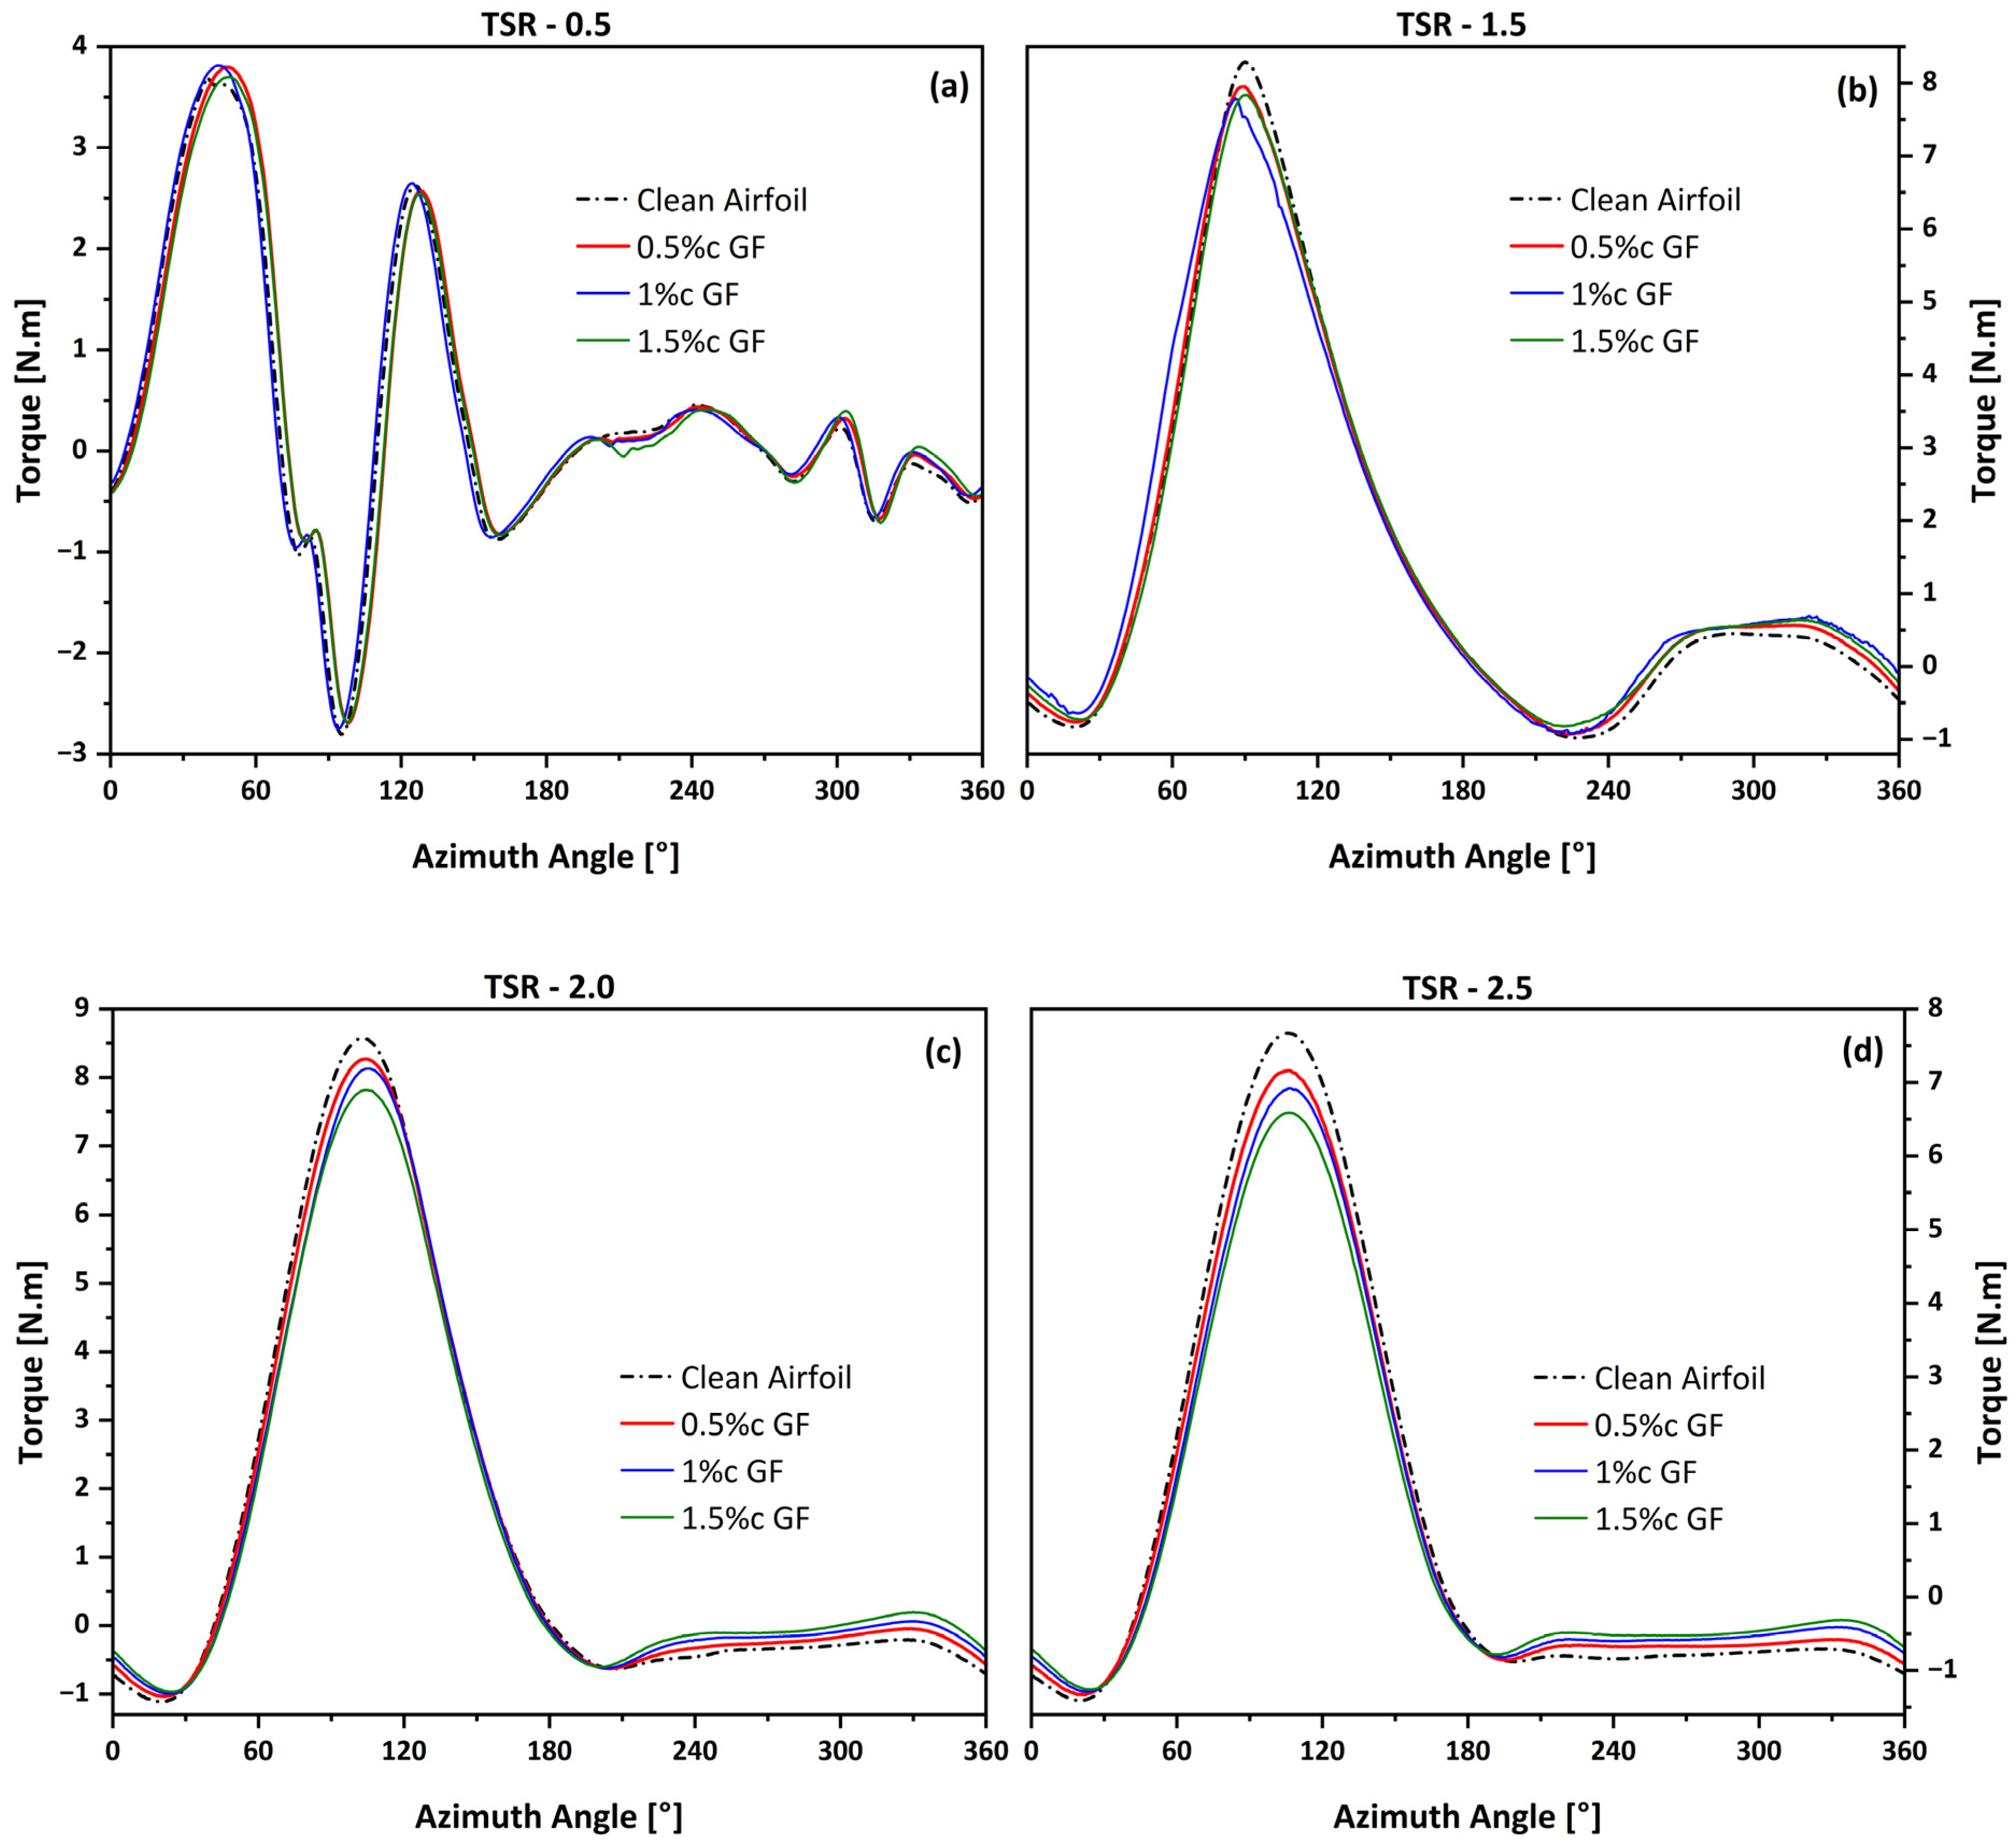
To understand the mechanisms behind the global performance variations identified in Section 4.1, the instantaneous torque generated by a single blade was analyzed over a full 360° rotation. In this study defines the θ = 0° representing the blade at the upstream position, aligned with the freestream wind, and the angle increasing counterclockwise in accordance with rotor rotation. Figure 10 presents the azimuthal torque profiles for all configurations at the four key TSRs. This analysis reveals how the GFs modify the aerodynamic loading throughout the cycle, distinguishing the superior performance of the 0.5%c GF.
At the low-speed startup condition of TSR 0.5 (Figure 10a), the torque profile is complex, characterized by two distinct positive peaks in the upwind phase (0–180°) and significant negative torque regions. The 0.5%c GF provides a small but crucial advantage by slightly increasing the magnitude of the first and second torque peaks. While all configurations suffer from negative torque, the 0.5%c GF helps to subtly mitigate these losses, resulting in the higher mean torque value that is critical for self-starting, as previously established in Table 5.
As the turbine accelerates to its optimal operating range at TSR 1.5 and TSR 2.0 (Figure 10b,c), the torque profile is dominated by a single, large positive peak during the upwind pass. A critical insight emerges here: the peak torque value alone does not determine the best performance. Although the clean airfoil often reaches a slightly higher peak torque, the 0.5%c GF consistently widens the azimuthal range of positive torque generation. This broadening of the effective “power stroke” contributes more to the average torque over the full cycle than a slightly higher but narrower peak. This effect is particularly clear at TSR 2.0, where the 0.5%c GF maintains a higher torque value than the clean airfoil from approximately 100° to 180°, compensating for its marginally lower peak.
The detrimental effect of excessive drag from taller GFs becomes evident at TSR 2.5 (Figure 10d). Here, both the 1%c and 1.5%c GFs cause a significant reduction in the peak upwind torque compared to the clean airfoil. In contrast, the 0.5%c GF closely tracks the clean airfoil’s profile, delivering nearly the same peak torque while also reducing the negative torque (drag) in the downwind phase (approximately 200–340°). This dual benefit maintaining high positive torque in the upwind pass and minimizing negative torque in the downwind pass is the primary reason for its superior overall performance at high TSRs.
In summary, the azimuthal torque analysis reveals that the 0.5%c GF achieves an optimal aerodynamic balance. It enhances positive torque generation, primarily by extending the duration of the power stroke, and effectively reduces parasitic drag on the blade during the non-productive downwind pass. To visualize the flow physics responsible for these favorable aerodynamic modifications, the following section will compare the velocity flow fields around the 0.5%c GF blade and the clean airfoil blade at critical azimuthal positions. Those positions are the angles at which the blade encounters the most positive torque, negative torque, or big changes between upwind and downwind aerodynamic phases.

4.3. Flow Physics Analysis

To visualize the flow physics responsible for the torque modifications discussed in Section 4.2, the velocity flow fields around the optimal 0.5%c GF airfoil and the baseline clean airfoil are compared at critical azimuthal positions. This analysis provides direct evidence of how the GF favorably alters the flow structure to enhance overall turbine performance.
At the low-speed startup condition of TSR 0.5, the torque profile in Figure 10a showed that the 0.5%c GF produced slightly higher torque peaks, particularly around the 30–45° azimuthal range. The velocity contours at θ = 30° (Figure 11) reveal the cause of this enhancement. The clean airfoil already shows signs of a developing leading-edge separation bubble on its suction surface (the upper surface). This premature separation limits its ability to generate maximum lift. In contrast, the 0.5%c GF acts as a flow control device. It energizes the boundary layer, delaying the onset of flow separation and keeping the flow attached over a larger portion of the airfoil’s chord. This improved flow attachment maintains a lower-pressure region on the suction side, resulting in higher lift and, consequently, the observed increase in positive torque. This subtle but critical improvement is what contributes to the superior self-starting capability noted in Table 5.
At TSR 1.5, the torque curve (Figure 10b) presented a more complex trade-off: the GF configuration produced a slightly weaker peak torque near 90° but significantly improved performance in the downwind phase (post-180°). The flow field analysis substantiates this behavior perfectly.
  • Upwind Phase (θ = 90°): At the point of maximum torque generation (Figure 12), both airfoils operate at a high angle of attack. While the GF helps maintain attached flow, it also introduces a parasitic drag penalty. At this specific angle, the small increase in drag slightly counteracts the lift gain, resulting in a net tangential force that is marginally lower than that of the clean airfoil. This explains the slight reduction in the peak instantaneous torque.
  • Downwind Phase (θ = 270°): The true advantage of the 0.5%c GF is revealed during the downwind pass. At θ = 270° (Figure 12), the blade moves through turbulent air while experiencing a negative angle of attack, a condition ripe for high drag and negative torque. The clean airfoil exhibits a massive, disorganized, low-velocity wake, which is indicative of significant pressure drag. The 0.5%c GF fundamentally alters this wake structure. It traps a small, stable vortex between the flap and the trailing edge, which helps to stabilize the downstream flow, narrow the wake, and significantly reduce the size of the separated region. This mitigation of pressure drag reduces the negative torque, leading to a higher mean torque over the entire cycle and explaining the 3.21% power improvement at this TSR.
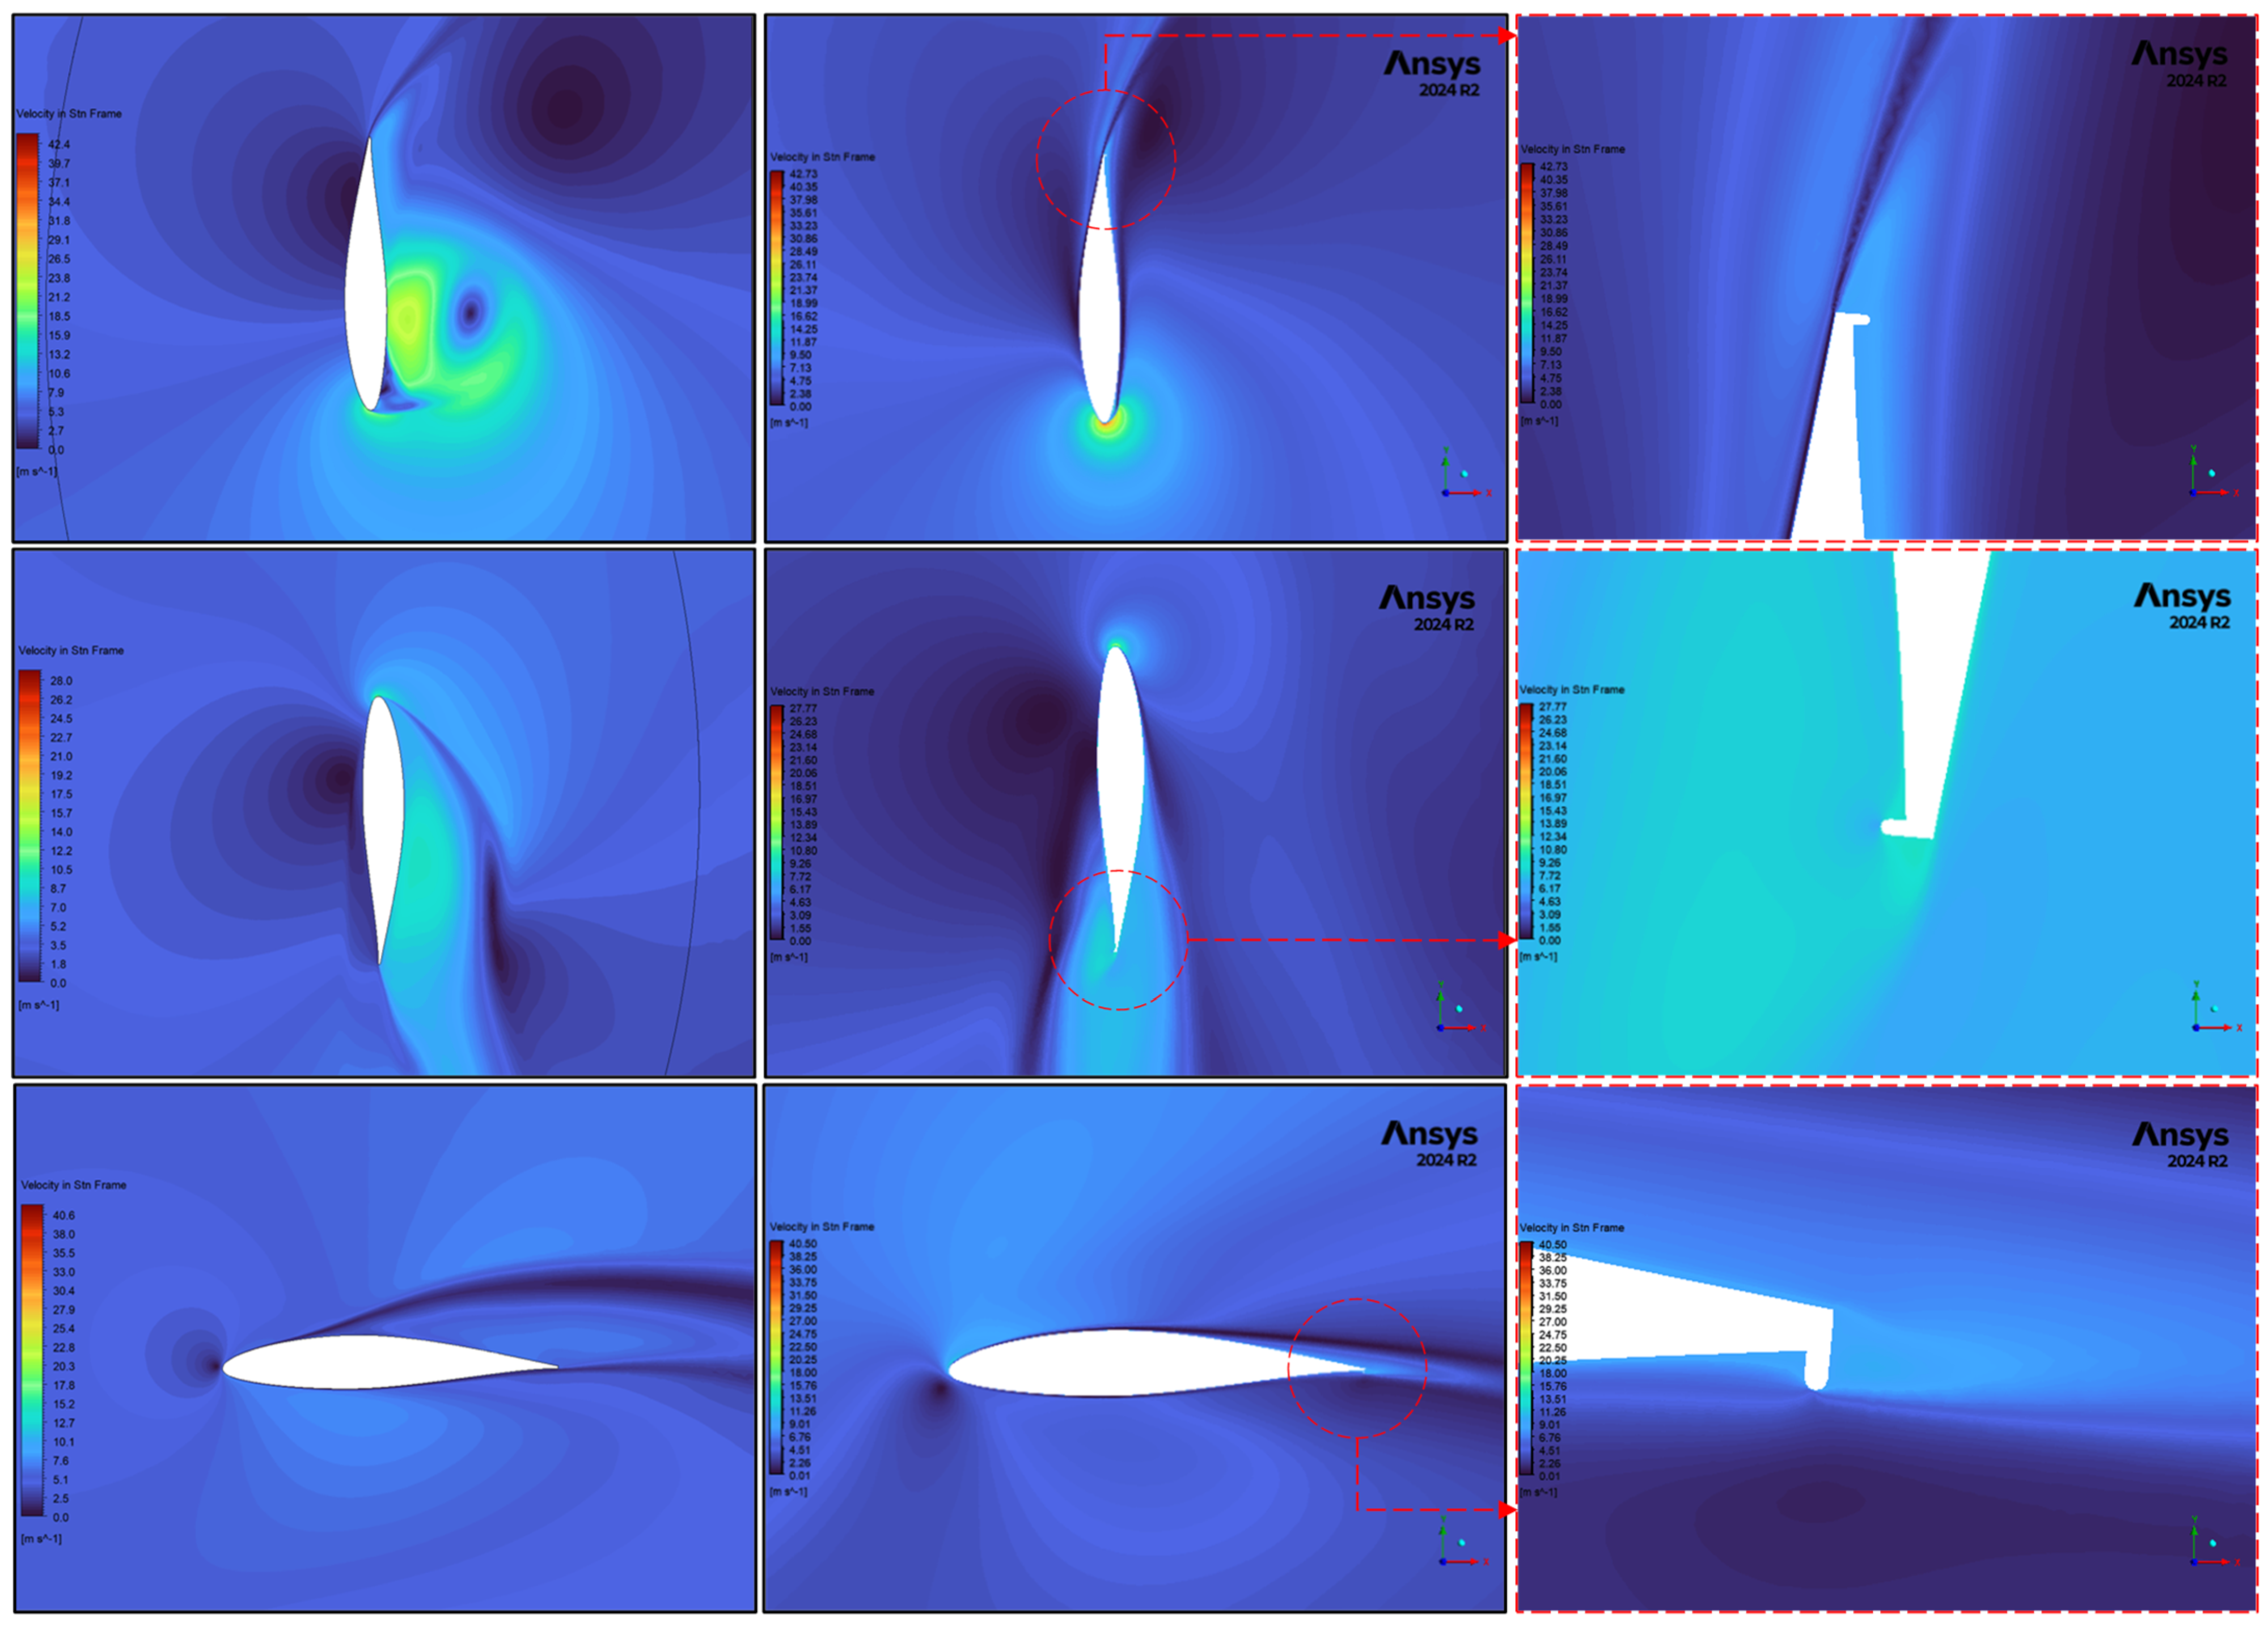
Figure 12. Comparative Velocity Contours. Instantaneous velocity fields around the clean airfoil (left column) and the 0.5%c GF airfoil (right column—by side with enlarging view of GF) at critical θ and TSR of 1.5.
Machines 13 01004 g012
As shown, the pattern observed at TSR 1.5 becomes even more pronounced at higher TSRs. The peak upwind torque for the GF case is slightly reduced, while the torque in the downwind phase (from approx. 200° to 340°) is consistently enhanced. This can be attributed to the amplification of aerodynamic forces at higher relative velocities. The parasitic drag from the GF becomes more influential during the high-loading upwind pass, causing a slight dip in peak torque. Conversely, its effectiveness as a wake management device during the downwind pass also increases, leading to even greater drag reduction. This trade-off sacrificing a small amount of peak torque for a substantial reduction in negative torque is the key strategy that makes the 0.5%c GF the superior overall performer, especially at high operational speeds.
In essence, the flow visualization confirms that the 0.5%c GF is not merely a lift-enhancement device but a sophisticated flow control tool that optimizes the torque profile across both the productive upwind and non-productive downwind phases of the rotor’s revolution.
Although the current results were produced under 2D numerical configurations, wind turbines in the practical have several imperfections such as surface roughness, structural flexibility, and unstable inflow. These parameters may slightly alter the flow-separation behavior and torque distribution reported here, and their impact should be examined in future 3D and empirical studies.

5. Conclusions

This numerical study investigated the aerodynamic performance of an H-rotor VAWT augmented with GFs of three different heights (0.5%c, 1%c, and 1.5%c). By analyzing the global power output, instantaneous torque profiles, and the detailed flow physics, a comprehensive understanding of the GFs effect was achieved. The findings clearly demonstrate that a small, appropriately sized GF can serve as a highly effective passive flow control device, but that improper sizing can lead to performance degradation.
The primary conclusions drawn from this work are summarized as follows:
  • Optimal Configuration Identified: The 0.5%c Gurney flap was unequivocally identified as the most effective and robust configuration, being the only design to provide a consistent power increase across all investigated TSRs.
  • Enhanced Startup and Peak Performance: The optimal 0.5%c GF significantly improved the turbine’s self-starting capability, with a 6.30% power increase at TSR = 0.5. It also enhanced the peak performance, achieving a maximum power coefficient (Cp, max) of 0.366 at TSR = 2.0, a 3.73% improvement over the baseline.
  • Detrimental Effect of Taller Flaps: Gurney flaps with heights of 1%c and 1.5%c showed inconsistent or negative results. The 1.5%c GF caused a significant power loss of −4.68% at TSR 2.5, demonstrating that beyond an optimal height, the parasitic drag penalty outweighs any lift augmentation benefits.
  • Dual Aerodynamic Mechanism: The success of the 0.5%c GF is attributed to a dual mechanism. In the upwind phase, it delays flow separation to increase positive torque at low speeds. In the downwind phase, its primary role is to act as a wake management device, mitigating pressure drag and reducing the negative torque that hinders the clean airfoil.
This study confirms that the benefit of a GF on a VAWT is not merely from lift enhancement but from a sophisticated optimization of the net torque across the entire 360° rotation. The 0.5%c GF achieves an ideal balance, sacrificing a marginal amount of peak upwind torque for a substantial reduction in downwind drag, thereby improving the overall energy extraction efficiency of the turbine.
Furthermore, it should be noted that this study utilized uniform inflow velocity and low turbulence intensity, a standard practice for 2D CFD analyses aimed at isolating specific aerodynamic changes. While the large computational domain helps ensure the flow is well-developed, further study should investigate the impact of more realistic turbulent and sheared inflow profiles.
From a practical perspective, these results suggest that VAWTs fitted with Gurney flaps can perform better in real-world circumstances, especially when wind speeds fluctuate and turbine speed vary during the day. The Gurney flap, having a simple, static device that requires no power or control systems, is a promising method for increasing VAWT efficiency. The small size of the optimal 0.5%c Gurney flap (1.25 mm for the 0.25 m chord) presents both opportunities and challenges. While its small mass would have a negligible impact on the overall blade inertia, its manufacture and installation would require high precision. The flap’s performance is sensitive to its perpendicular orientation, and any misalignment could lead to unintended negative aerodynamic effects.
Future study should focus on several key areas: developing adjustable or adaptive Gurney flaps that can dynamically respond to wind changes could enhance performance under diverse operating conditions. Structural analysis is needed to ensure the flap’s integrity under operational loads and investigate the sensitivity of its performance to manufacturing tolerances, which are critical for translating these numerical gains into real world applications. Additionally, employing 3D CFD simulations would allow better representation of tip effects and complex flow patterns, while wind tunnel experiments are essential to validate the numerical findings and strengthen the applicability of design in real-world turbine systems.

Author Contributions

Conceptualization, H.U., A.P., V.G., Z.D. and Q.X.; methodology, H.U., A.P., V.G., Z.D. and Q.X.; software, H.U., A.P., V.G., Z.D. and Q.X.; validation, H.U., A.P., V.G., Z.D. and Q.X.; formal analysis, H.U., Z.D., A.P. and V.G.; investigation, H.U., Z.D., A.P. and V.G.; resources, H.U., A.P., V.G. and Q.X.; data curation, H.U., Z.D., A.P. and V.G.; writing—original draft preparation, H.U., A.P., V.G., Z.D. and Q.X.; writing—review and editing, H.U., A.P., V.G., Z.D. and Q.X.; visualization, H.U., Z.D., A.P., V.G. and Q.X.; supervision, A.P., V.G. and Q.X.; project administration, A.P. All authors have read and agreed to the published version of the manuscript.

Funding

This research received no external funding.

Data Availability Statement

Data are contained within the article.

Acknowledgments

This research was supported by the University of Palermo and the Piano Nazionale di Ripresa e Resilienza (PNRR) Italy. The authors also acknowledge the computational facilities provided by the department of Naval Architecture, Ocean & Marine Engineering, University of Strathclyde, Glasgow, UK. With special thanks to Susan Pawson and Alex Watterson for their assistance.

Conflicts of Interest

The authors declare no conflicts of interest.

Abbreviations and Nomenclature

The following abbreviations are used in this manuscript:
WTsWind turbines
HAWTsHorizontal axis wind turbines
VAWTsVertical axis wind turbines
AOAAngle of Attack
GFs Gurney Flaps
3DThree-dimensional
2DTwo-dimensional
CFDComputational fluid dynamics
TSRsTip speed ratios
ReReynolds number
BOIsBody of influences
SSTShear Stress Transport
SIMPLESemi-Implicit Method for Pressure Linked Equations
cChord length
CpPower coefficient
CmTorque coefficient
V∞Free stream velocity
θAzimuthal angle
°Degree

References

  1. Chen, W.H.; Peng, J.; Bi, X.T. A State-of-the-Art Review of Biomass Torrefaction, Densification and Applications. Renew. Sustain. Energy Rev. 2015, 44, 847–866. [Google Scholar] [CrossRef]
  2. Eriksson, S.; Bernhoff, H.; Leijon, M. Evaluation of different turbine concepts for wind power. Renewable Sustainable Energy Rev. 2008, 12, 1419–1434. [Google Scholar] [CrossRef]
  3. Tummala, A.; Velamati, R.K.; Sinha, D.K.; Indraja, V.; Krishna, V.H. A Review on Small Scale Wind Turbines. Renew. Sustain. Energy Rev. 2016, 56, 1351–1371. [Google Scholar] [CrossRef]
  4. Damota, J.B.; García, J.d.D.R.; Casanova, A.C.; Miranda, J.T.; Caccia, C.G.; Galdo, M.I.L. Analysis of a Nature-Inspired Shape for a Vertical Axis Wind Turbine. Appl. Sci. 2022, 12, 7018. [Google Scholar] [CrossRef]
  5. Khammas, F.; Hussein Suffer, K.; Usubamatov, R.; Mustaffa, M.T. Overview of Vertical Axis Wind Turbine (VAWT) Is One of the Wind Energy Application. Appl. Mech. Mater. 2015, 793, 388–392. [Google Scholar] [CrossRef]
  6. Johari, M.K.; Azim, M.; Jalil, A.; Faizal, M.; Shariff, M. Comparison of Horizontal Axis Wind Turbine (HAWT) and Vertical Axis Wind Turbine (VAWT). Int. J. Eng. Technol. 2018, 7, 74–80. [Google Scholar] [CrossRef]
  7. Mccroskey, W.J. The Phenomenon of Dynamic Stall; Technical Report NASA-TM-81264, 4 September 2013; NASA: Washington, DC, USA, 2013. [Google Scholar]
  8. Chakroun, Y.; Bangga, G. Aerodynamic Characteristics of Airfoil and Vertical Axis Wind Turbine Employed with Gurney Flaps. Sustainability 2021, 13, 4284. [Google Scholar] [CrossRef]
  9. Carr, L.W. Progress in Analysis and Prediction of Dynamic Stall. J. Aircr. 1988, 25, 6–17. [Google Scholar] [CrossRef]
  10. Rezaeiha, A.; Montazeri, H.; Blocken, B. Towards Optimal Aerodynamic Design of Vertical Axis Wind Turbines: Impact of Solidity and Number of Blades. Energy 2018, 165, 1129–1148. [Google Scholar] [CrossRef]
  11. Kumar, R.; Raahemifar, K.; Fung, A.S. A Critical Review of Vertical Axis Wind Turbines for Urban Applications. Renew. Sustain. Energy Rev. 2018, 89, 281–291. [Google Scholar] [CrossRef]
  12. Worasinchai, S.; Ingram, G.L.; Dominy, R.G. The Physics of H-Darrieus Turbine Starting Behavior. J. Eng. Gas. Turbine Power 2016, 138, 062605. [Google Scholar] [CrossRef]
  13. Syawitri, T.P.; Yao, Y.; Yao, J.; Chandra, B. A Review on the Use of Passive Flow Control Devices as Performance Enhancement of Lift-Type Vertical Axis Wind Turbines. Wiley Interdiscip. Rev. Energy Environ. 2022, 11, e435. [Google Scholar] [CrossRef]
  14. Wong, K.H.; Chong, W.T.; Sukiman, N.L.; Poh, S.C.; Shiah, Y.C.; Wang, C.T. Performance Enhancements on Vertical Axis Wind Turbines Using Flow Augmentation Systems: A Review. Renew. Sustain. Energy Rev. 2017, 73, 904–921. [Google Scholar] [CrossRef]
  15. Mousavi, M.; Masdari, M.; Tahani, M. Power Performance Enhancement of Vertical Axis Wind Turbines by a Novel Gurney Flap Design. Aircr. Eng. Aerosp. Technol. 2022, 94, 482–491. [Google Scholar] [CrossRef]
  16. Liebeck, R.H. Design of Subsonic Airfoils for High Lift. J. Aircr. 1978, 15, 547–561. [Google Scholar] [CrossRef]
  17. Brusca, S.; Cucinotta, F.; Galvagno, A.; Sfravara, F.; Chillemi, M. Development of a Numerical Characterization Method for a Ducted Savonius Turbine with Power Augmenters. Energies 2025, 18, 1142. [Google Scholar] [CrossRef]
  18. Das Karmakar, S.; Chattopadhyay, H. A Review of Augmentation Methods to Enhance the Performance of Vertical Axis Wind Turbine. Sustain. Energy Technol. Assess. 2022, 53, 102469. [Google Scholar] [CrossRef]
  19. Lee, K.Y.; Cruden, A.; Ng, J.H.; Wong, K.H. Variable Designs of Vertical Axis Wind Turbines—A Review. Front. Energy Res. 2024, 12, 1437800. [Google Scholar] [CrossRef]
  20. Mayda, E.A.; Van Dam, C.P.; Yen Nakafuji, D. Computational Investigation of Finite Width Microtabs for Aerodynamic Load Control. In Proceedings of the Collection of the 2005 ASME Wind Energy Symposium Technical Papers at the 43rd AIAA Aerospace Sciences Meeting and Exhibit, Reno, NV, USA, 10–13 January 2005; American Institute of Aeronautics and Astronautics Inc.: Reston, VA, USA, 2005; pp. 424–436. [Google Scholar]
  21. Syawitri, T.P.; Yao, Y.; Yao, J.; Chandra, B. Geometry Optimisation of Vertical Axis Wind Turbine with Gurney Flap for Performance Enhancement at Low, Medium and High Ranges of Tip Speed Ratios. Sustain. Energy Technol. Assess. 2022, 49, 101779. [Google Scholar] [CrossRef]
  22. Xie, Y.H.; Jiang, W.; Lu, K.; Zhang, D. Numerical Investigation into Energy Extraction of Flapping Airfoil with Gurney Flaps. Energy 2016, 109, 694–702. [Google Scholar] [CrossRef]
  23. Yan, Y.; Avital, E.; Williams, J.; Cui, J. Aerodynamic Performance Improvement of Vertical Axis Wind Turbines through Novel Techniques. J. Wind. Eng. Ind. Aerodyn. 2021, 211, 104535. [Google Scholar] [CrossRef]
  24. Giguère, P.; Lemay, J.; Dumas, G. Gurney Flap Effects and Scaling for Low-Speed Airfoils. In Proceedings of the 13th Applied Aerodynamics Conference, San Diego, CA, USA, 19–22 June 1995; American Institute of Aeronautics and Astronautics Inc.: Reston, VA, USA, 1995; pp. 966–976. [Google Scholar]
  25. Li, Y.C.; Wang, J.J.; Tan, G.K.; Zhang, P.F. Effects of Gurney Flaps on the Lift Enhancement of a Cropped Nonslender Delta Wing. Exp. Fluids 2002, 32, 99–105. [Google Scholar] [CrossRef]
  26. Jain, S.; Sitaram, N.; Krishnaswamy, S. Computational Investigations on the Effects of Gurney Flap on Airfoil Aerodynamics. Int. Sch. Res. Not. 2015, 2015, 402358. [Google Scholar] [CrossRef] [PubMed]
  27. Yan, Y.; Avital, E.; Williams, J.; Cui, J. Performance Improvements for a Vertical Axis Wind Turbine by Means of Gurney Flap. J. Fluids Eng. Trans. ASME 2020, 142, 021205. [Google Scholar] [CrossRef]
  28. Liu, Q.; Miao, W.; Ye, Q.; Li, C. Performance Assessment of an Innovative Gurney Flap for Straight-Bladed Vertical Axis Wind Turbine. Renew. Energy 2022, 185, 1124–1138. [Google Scholar] [CrossRef]
  29. Rezaeiha, A.; Montazeri, H.; Blocken, B. Characterization of Aerodynamic Performance of Vertical Axis Wind Turbines: Impact of Operational Parameters. Energy Convers. Manag. 2018, 169, 45–77. [Google Scholar] [CrossRef]
  30. Didane, D.H.; Behery, M.R.; Al-Ghriybah, M.; Manshoor, B. Recent Progress in Design and Performance Analysis of Vertical-Axis Wind Turbines—A Comprehensive Review. Processes 2024, 12, 1094. [Google Scholar] [CrossRef]
  31. Ullah, H.; Huang, Y.; Gulizzi, V.; Pantano, A. To Enhance the Aerodynamic Power Efficiency of Vertical Axis Wind Turbines: Proposing Morphing Strategies for Variable Wind Speed. Machines 2025, 13, 739. [Google Scholar] [CrossRef]
  32. Alaimo, A.; Esposito, A.; Messineo, A.; Orlando, C.; Tumino, D. 3D CFD Analysis of a Vertical Axis Wind Turbine. Energies 2015, 8, 3013–3033. [Google Scholar] [CrossRef]
  33. Zhang, L.; Gu, J.; Hu, K.; Zhu, H.; Miao, J.; Li, X.; Ma, D.; Mi, Y.; Wang, Z. Influences of Trailing Edge Split Flap on the Aerodynamic Performance of Vertical Axis Wind Turbine. Energy Sci. Eng. 2021, 9, 101–115. [Google Scholar] [CrossRef]
  34. Ekaterinaris, J.A.; Platzer, M.F. Computational Prediction of Airfoil Dynamic Stall. Prog. Aerosp. Sci. 1997, 33, 759–846. [Google Scholar] [CrossRef]
  35. Kord, K.; Bazargan, M. Numerical Investigation on J-Shaped Straight-Bladed Darrieus Vertical Axis Wind Turbines Equipped with Gurney Flaps. Int. J. Energy Res. 2024, 2024, 8992210. [Google Scholar] [CrossRef]
  36. Moshizi, S.A.; Madadi, A.; Kermani, M.J. Comp Arison of Inviscid and Viscous Transonic Flow Field in VKI Gas Turbine Blade Cascade. Alex. Eng. J. 2014, 53, 275–280. [Google Scholar] [CrossRef]
  37. Langtry, R.B.; Gola, J.; Menter, F.R. Predicting 2D Airfoil and 3D Wind Turbine Rotor Performance Using a Transition Model for General CFD Codes. In Proceedings of the 44th AIAA Aerospace Sciences Meeting and Exhibit, Reno, NV, USA, 9–12 January 2006. [Google Scholar]
  38. Mclaren, K.W. A Numerical and Experimental Study of Unsteady Loading of High Solidity Vertical Axis Wind Turbines. Ph.D. Thesis, McMaster University, Hamilton, ON, Canada, 2011. [Google Scholar]
  39. Raciti Castelli, M.; Englaro, A.; Benini, E. The Darrieus Wind Turbine: Proposal for a New Performance Prediction Model Based on CFD. Energy 2011, 36, 4919–4934. [Google Scholar] [CrossRef]
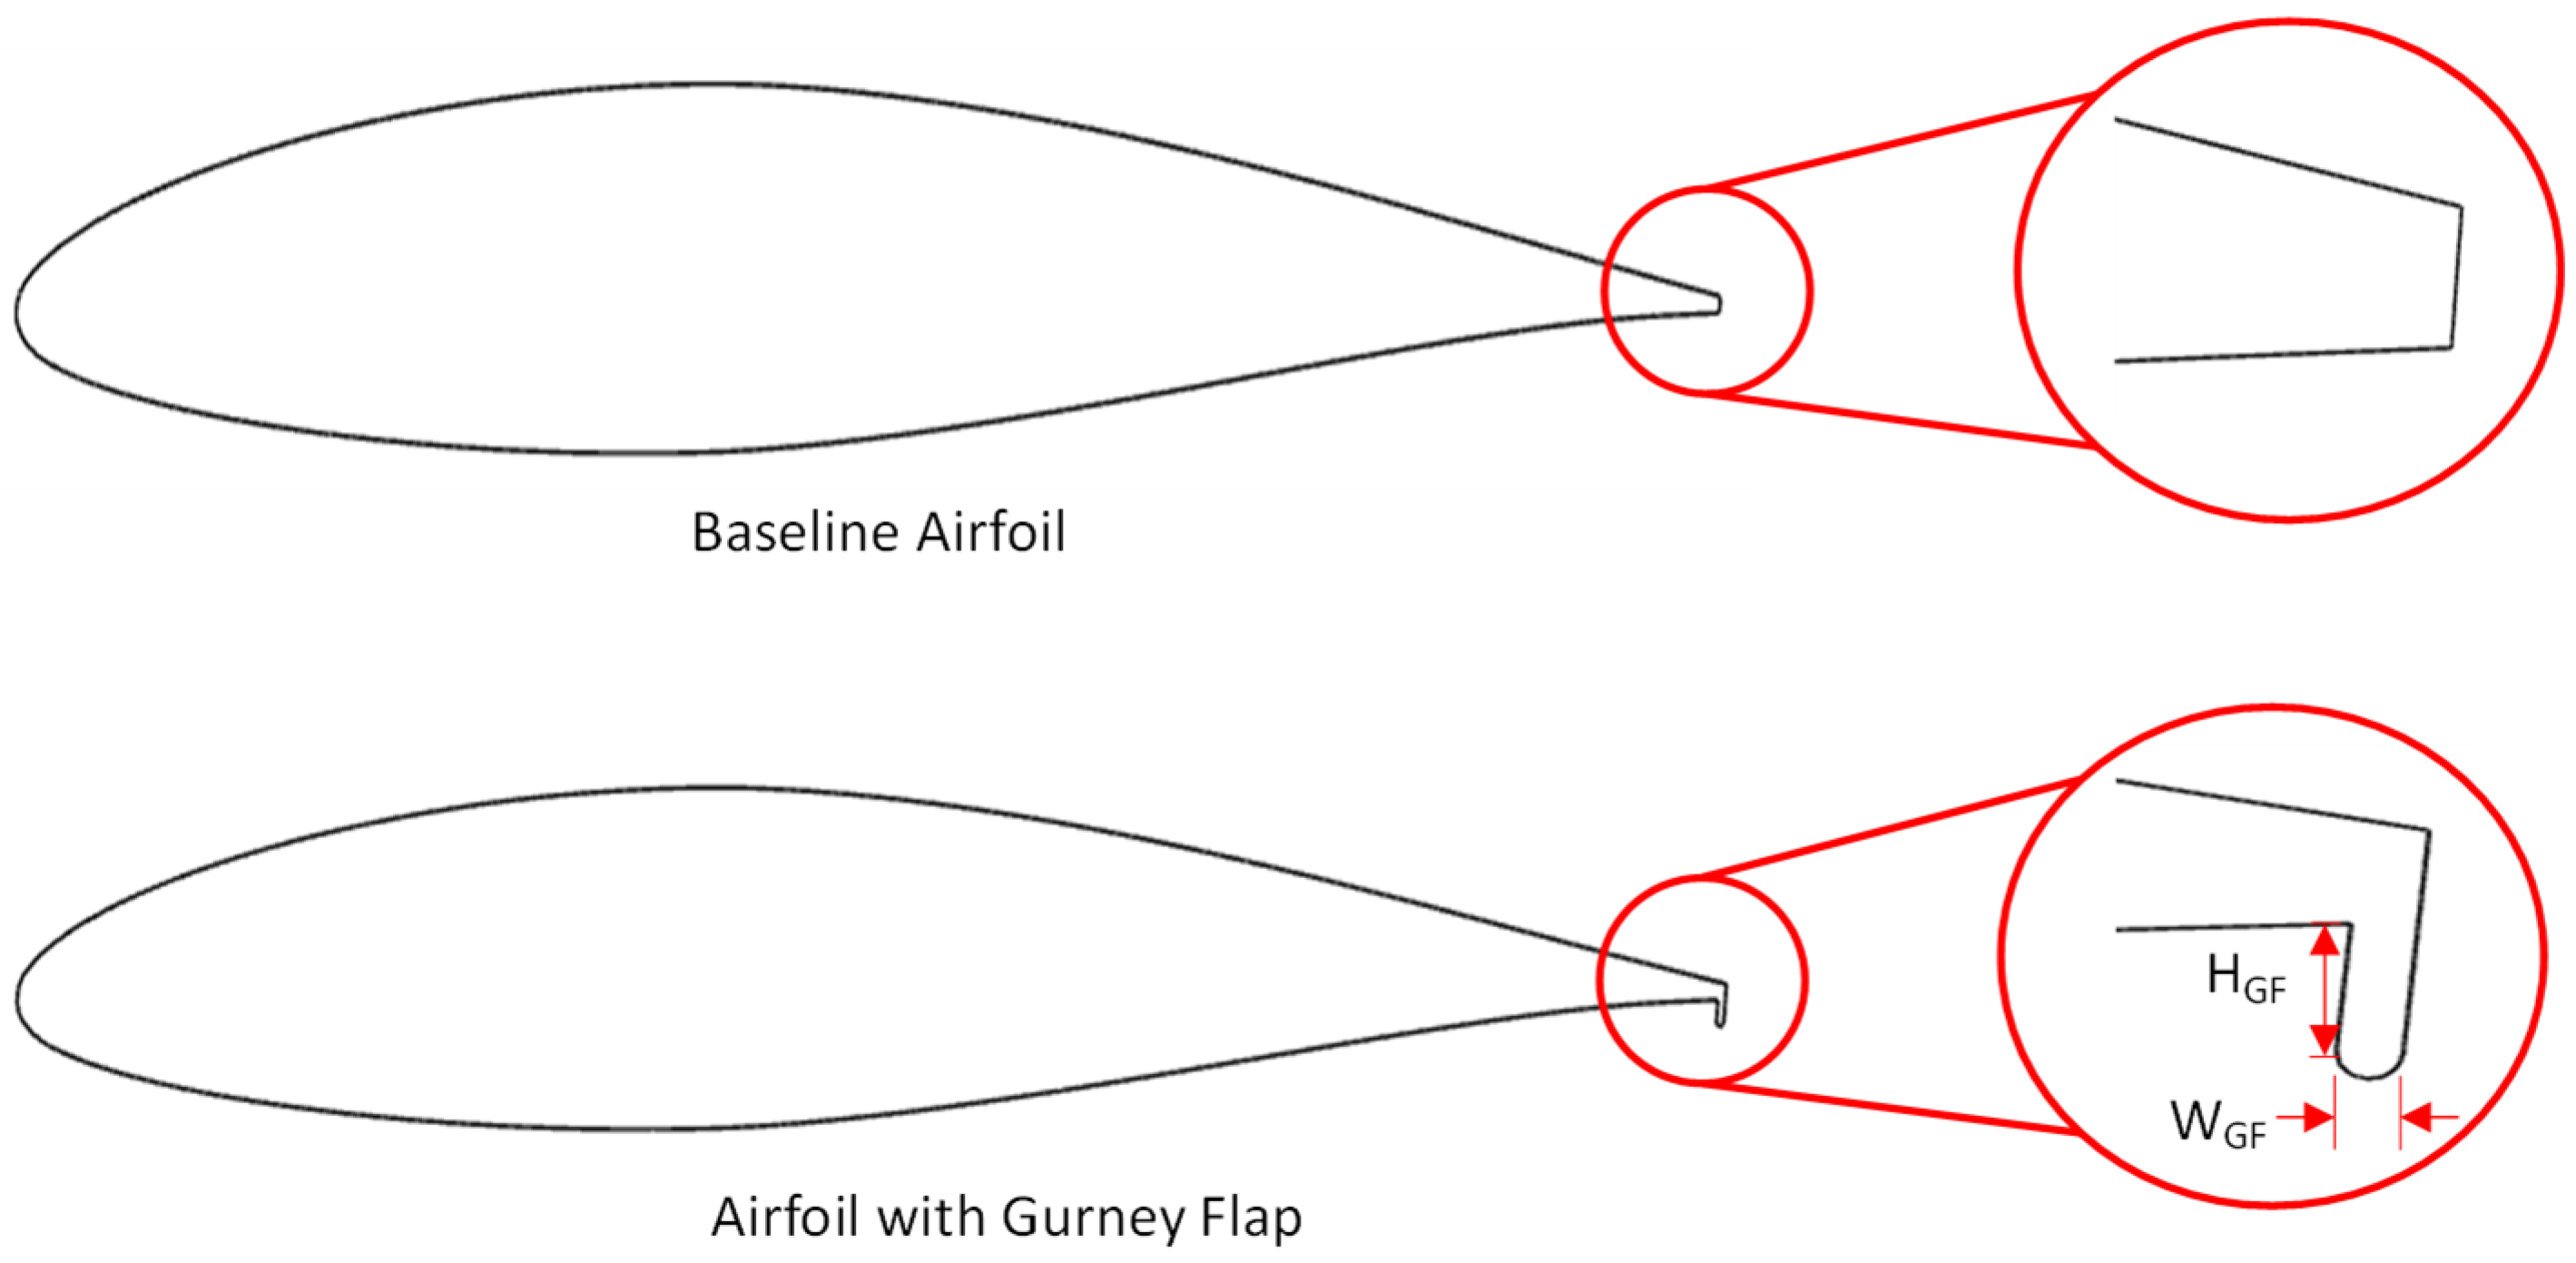
Figure 1. Geometry of the baseline clean airfoil and the airfoil mounted with a Gurney flap.
Machines 13 01004 g001
Figure 2. Two-dimensional computational domain of the three-bladed VAWT, illustrating the geometry and boundary dimensions (in meters).
Machines 13 01004 g002
Figure 3. Maximum y+ value on the blade surfaces during one full rotation at TSR 2.5, confirming appropriate near-wall resolution.
Machines 13 01004 g003
Figure 4. Mesh distribution of the geometric computational domain, and the blade equipped with Gurney flap configuration.
Machines 13 01004 g004
Figure 5. Grid size examination: the variation in torque coefficient over one complete revolution.
Machines 13 01004 g005
Figure 6. Definition of the time Step (⸰), azimuth angle (θ), and division of the wind turbine path for a counter-clockwise rotation.
Machines 13 01004 g006
Figure 7. Instantaneous torque coefficient (Cm) over the final seven rotor revolutions at TSR = 2.5, showing the achievement of a periodic and stable solution.
Machines 13 01004 g007
Figure 8. Comparison of power coefficients (Cp) as a function of tip speed ratios (TSRs): Present CFD model vs. [39] results.
Machines 13 01004 g008
Figure 9. Overall performance characteristics of the VAWT with different Gurney flap configurations: (a) Power coefficient (Cp), and (b) Mean torque coefficient (Cm) versus TSRs.
Machines 13 01004 g009
Figure 10. Instantaneous Blade Torque over Azimuthal Angle. Comparison of torque generation for the clean airfoil and GF configurations at four distinct TSRs; (a) TSR 0.5; (b) TSR 1.5; (c) TSR 2.0; and (d) TSR 2.5.
Machines 13 01004 g010
Figure 11. Comparative Velocity Contours. Instantaneous velocity fields around the clean airfoil (left column) and the 0.5%c GF airfoil (right column) at critical θ and TSR of 0.5 at 30°.
Machines 13 01004 g011
Table 1. Specification of the Vertical axis wind turbine.
ParametersNotationValueMeasure
Geometric and Design parameters
Airfoil profile-NACA 64(2)-415-
Chord lengthc0.25m
Rotor radiusRrotor0.725m
Rotor diameterDrotor1.45m
HeightH1 (2D)m
Number of bladesN3-
Gurney flapsGFs0.5, 1.0, 1.5%c
Operational parameters
Wind speedV6m/s
TSRsλ0.5–2.5-
Reynolds NumberRe1.03 × 105-
Table 2. Generated grid features for grid independence study at TSR 2.5.
GridNo. of Divisions on BladeNo. of Boundary LayersGrowth RateTotal Number of ElementsAverage Torque CoefficientDerivation (%)
Coarse450351.1267,5540.1103--
Medium900351.1537,8200.128314
Fine1800351.05747,1540.13243.09
Very fine3600351.051,116,6760.13130.83
Table 3. Average torque coefficients yielded at each time step size.
Time Step Size (°)Average Torque CoefficientDerivation (%)
0.50.1315---
10.13240.69
20.14086.39
Table 4. Validation model main features.
ParametersNotationValueMeasure
Airfoil profile-NACA0021-
Number of bladesN3-
Rotor diameterDrotor1030mm
Rotor heightH1 (2D)mm
Chord lengthc85.8mm
Solidityσ0.5-
Table 5. Comparison of Mean Torque (Cm) and Power (Cp) Coefficients for All Configurations.
TSRsConfigurationMean Torque Coefficient (Cm)Mean Power Coefficient (Cp)Change in GFs vs. Clean Airfoil (%)
0.5Clean Airfoil0.04490.0224Baseline
0.5%c GF0.04770.0239+6.30%
1%c GF0.04750.0238+5.80%
1.5%c GF0.04470.0224−0.40%
1.5Clean Airfoil0.17890.2683Baseline
0.5%c GF0.18460.2769+3.21%
1%c GF0.17790.2669−0.52%
1.5%c GF0.18620.2794+4.13%
2.0Clean Airfoil0.17650.3531Baseline
0.5%c GF0.18310.3663+3.73%
1%c GF0.18200.3640+3.09%
1.5%c GF0.17950.3590+1.66%
2.5Clean Airfoil0.11600.2900Baseline
0.5%c GF0.11920.2980+2.75%
1%c GF0.11630.2908+0.29%
1.5%c GF0.11060.2764−4.68%
Disclaimer/Publisher’s Note: The statements, opinions and data contained in all publications are solely those of the individual author(s) and contributor(s) and not of MDPI and/or the editor(s). MDPI and/or the editor(s) disclaim responsibility for any injury to people or property resulting from any ideas, methods, instructions or products referred to in the content.