Abstract
Transmission error (TE) is an important parameter in gear dynamics that has a direct impact on the vibration and noise of gears. Under quasi-static conditions, gear elastic deformation and assembly errors amplify with increasing load, potentially contributing to noise and vibration. This paper presents a novel method for measuring the quasi-static transmission error (QSTE) of spur gears under quasi-static conditions. In particular, the study investigates the relationship between quasi-static transmission error, elastic deformation transmission error, and gear tangential acceleration. Gear elastic deformation transmission error was calculated from experimental data obtained with single-point, symmetrical dual-point, and orthogonal four-point configurations of tangential acceleration sensors. The orthogonal four-point sensor configuration greatly improves measurement accuracy when compared to theoretical values derived from material mechanics calculations. A dedicated on-machine acquisition system for spur gear tangential acceleration was constructed. Tangential acceleration tests were conducted across varying loads and rotational speeds. The acquired data underwent filtering and integration processing in order to obtain gear elastic deformation and quasi-static transmission error. The feasibility of the acceleration approach for measuring both gear elastic deformation and quasi-static transmission error is confirmed by a comparative analysis of the acceleration method results with transmission errors obtained via material mechanics calculations and magnetic grating detection.
1. Introduction
Gear transmission error is a key indicator for measuring gear performance, directly affecting vibration, lifespan, and motion accuracy. Under dynamic operating conditions, factors such as inertial forces can obscure the true error signal. By eliminating dynamic interferences by quasi-static testing (measured under stable load), the intrinsic error characteristics of the gear pair can be precisely determined. This provides an essential basis for the optimization of design, manufacturing, and quality control of gears [1].
Anichowski et al. analyzed the time-frequency characteristics of dynamic TE in high-speed gears utilizing accelerometer systems [2], on the other hand, Hotait et al. integrated root strain and TE measurement systems so as to quantify the impact of gear modification on dynamic factors [3]. Zhang et al. proposed a method for evaluating the dynamic transmission error of spur gears using strain sensors and verified its effectiveness through experiments [4]. Benatar M et al. combined a power cycle testing machine with an encoder-accelerometer system, which confirmed that tooth profile modification significantly suppresses TE amplitude under wide operating conditions [5]. Ma et al. obtained dynamic TE and multi-directional motion parameters of gear pairs by processing acceleration signals from shaft flanges using tri-axial accelerometers [6].
Gregory et al. used optical mirrors and optimized acquisition systems to achieve real-time TE measurement for a 1:1 gear ratio under 6000 rpm [7]; Xiong et al. discovered that crown modification reduces dynamic TE peak-to-peak values via high-precision optical encoders, pointing out that elastic deformation dominates TE under light load [8]. In contrast, Zhan et al. used magnetic grating methods to establish a mapping between TE and gear wear by comparing signals from worn and normal gears [9]; however, this approach struggles to separate local tooth surface deformation. A novel non-contact measurement approach was presented by Yu et al. when they proposed an optical point cloud technique to reconstruct TE curves by analyzing tooth contact states (single/multi-tooth meshing) [10].
In order to determine the dynamic TE of modified/unmodified spur gears under various conditions, Tamminana et al. proposed nonlinear finite element (FE) deformable body models and simplified discrete models, which were then validated by experiments [11]. Rezayat et al. combined FE analysis with grating-based quasi-static tests to study load-TE relationships in hybrid metal-composite gears [12].
In analytical modeling, Liu et al. predicted static TE and interference of spur gears based on ISO accuracy grades via discrete gear-error model coupling [13]. Tang et al. confirmed that pitch error dominates the shape of TE curves at the same accuracy level [14], while on the other hand, Cheng et al. found through spur/helical gear experiments that backlash and face width direction errors significantly affect motion error, whereas axial offset has minimal impact [15].
Wang et al. found that thermal fields cause maximum non-involute errors at tooth tips and lead to TE mutations due to elastic deformation at single-double tooth meshing transitions, with mutation amplitude positively correlated with TE amplitude [16]. A new dynamic TE calculation method for hypoid gears based on relative velocity in the direction of the action line was proposed by Karagiannis et al., for the purpose of tracking stable/unstable periodic responses within the working range [17].
Lee et al. developed a TE measurement device for the automatic transmission of planetary gears, optimizing the gear set via TE-noise comparison [18]. In order to assess sideband phenomena in planetary gear TE simulation with high precision, Kumagai et al. took into account periodic variations in component eccentricity and tilt [19]. For bevel gears, Guo et al. conducted tooth contact analysis and fuzzy optimization for Klingelnberg spiral bevel gears to reduce TE and improve meshing performance [20]. Sentoku et al. emphasized that gear system design must integrate the coupling effects of tooth profiles, shafts, and support structures, based on TE measurements of bearing-supported gear shafts [21].
Research on tooth profile modification has reached a consensus. Mohamad et al. put forward a general meshing model to analyze the impact of tooth surface deviations [22], while Hotait, Benatar, Xiong et al. confirmed that modification reduces TE peak-to-peak values by enhancing contact states [3,5,8]. The spiral gear TE testing device designed by Zachary et al. provides a benchmark for static TE measurement [23].
In this work, an acceleration-based approach to measuring gear quasi-static transmission error is investigated. The approach involves controlling the rotational speed to operate the gears under quasi-static conditions. In this study, quasi-static conditions refer to operating states with stable loads and low speeds (0–500 rpm), where dynamic inertia effects can be ignored, and gear transmission errors are mainly determined by manufacturing errors, assembly deviations, and tooth surface elastic deformation. Circumferential acceleration signals are acquired under varying loads as well as rotational speeds. Through signal processing, transmission error and gear elastic deformation error are extracted, and their variation patterns are analyzed. In contrast to the magnetic grating method (which detects displacement using a magnetic scale but can only reflect the overall deviation of the gear pair and cannot isolate local elastic deformation), the acceleration method shows notable benefits in detecting micro-elastic deformations such as tooth flank contact deformation. This technique is a useful guide for related research and can be used for testing gear quasi-static transmission error under complex operating conditions.
2. Measuring Principle
2.1. Acceleration Method
Under quasi-static operating conditions characterized by low dynamic excitation, the dynamic behavior of transmission systems is significantly simplified. Owing to the low rotational speed and the fact that acceleration approaches zero, the influence of dynamic inertial effects on system vibration can be neglected. In this regime, manufacturing errors, assembly deviations, and tooth flank elastic deformation are the main factors governing the transmission error. Under these conditions, dynamic impacts and high-frequency vibration components are minimal, with vibration energy concentrated at the meshing frequency and its low-order harmonics. There is a substantial association between the tooth flank contact state and the signal characteristics at the meshing frequency. Specifically, the amplitude directly reflects the uniformity of the contact pattern, whereas the phase shift serves as an indicator of contact position deviation. To investigate the relationship involving the quasi-static transmission error, gear elastic deformation-induced transmission error, and gear circumferential acceleration, a dedicated accelerometer-based signal acquisition system for circumferential acceleration was designed. This system is capable of accurately capturing the meshing frequency of gears and their harmonic frequencies, covering the entire dynamic range from low-frequency vibrations to high-frequency transient vibrations.
To achieve higher measurement accuracy by averaging random errors, two pairs of accelerometers were symmetrically mounted along the circumferential tangential direction of the gear on a rigid connecting structure (e.g., flange or sleeve), as illustrated in Figure 1. The tangential acceleration at the meshing point is directly captured by this configuration. The tangential alignment makes sure that the sensitive axis of the sensors coincides with the direction of the gear meshing force, enabling precise extraction of dynamic fluctuations in the tangential direction caused by tooth flank deformation and manufacturing errors.
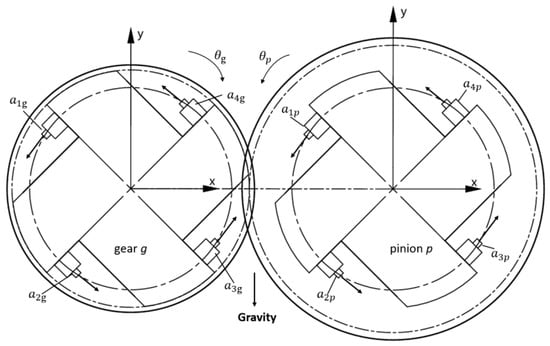
Figure 1.
Installation diagram of acceleration sensor.
The acceleration sensors are arranged at the same radius of the gears. The output signal of the acceleration sensor for the gear includes a gravitational acceleration component and a rotational acceleration component (where i = p, g; p and g denote the pinion and the gear).
where and are the instantaneous accelerations of sensors 1 and 3 on gear i; is the angular velocity of gear i. By adding and to cancel out the gravitational acceleration, both the angular acceleration and circumferential acceleration of gear i are obtained.
where and are the angular acceleration and circumferential acceleration of gear i, ri is the base circle radius of gear i, and is the sensor installation radius.
Abnormal interference signals may be contained in the collected vibration acceleration signals as a result of the influence of random environmental factors. Direct processing of the raw signals will affect the accuracy of the results. Prior to integrating the acceleration signals, if they contain DC components and high-frequency random noise, preprocessing of the acceleration signals should be performed first.
This paper employs the mean subtraction method to remove the DC component by calculating the average value of the signal and subtracting it from each sample point to eliminate the overall offset. If the signal sample value is a[m] (n = 0, 1, 2, …, M), then the acceleration signal following the removal of the DC component is as follows:
In the preprocessing of vibration signals, digital filtering is used primarily to remove noise or spurious components from the test vibration signal, suppress interference signals, separate frequency components, and so on. This paper employs an IIR bandpass digital filter to denoise and extract useful signals from acceleration signals. The filtering expression of the IIR filter can be defined as a difference equation:
where and represent the input and output time-domain signal sequences, respectively; aj and bj denote the filter coefficients. Its system transfer function is expressed by the following equation:
where denotes the order corresponding to the IIR filter; denotes the number of zeros in the transfer function of the filter system; and and exhibits both weighting function coefficients.
The Fourier-domain integration method is used to compute displacement using the preprocessed vibration acceleration signal. The Fourier transform component of the vibration signal can be denoted as
where represents the Fourier transform of the vibration signal at frequency ω; denotes the coefficient corresponding to .
Integrating the vibration acceleration signal in the time domain to obtain the velocity signal, i.e.,
where represents the velocity signal; indicates the coefficient corresponding to .
The vibration acceleration signal is integrated twice in the time domain to obtain the displacement signal:
where represents the displacement signal; is the coefficient corresponding to .
The following is the numerical calculation formula for a single integral:
The numerical calculation formula for quadratic integration is
with
where and represent the lower cutoff frequency and the upper cutoff frequency, respectively; denotes the Fourier transform of ; is the frequency resolution.
The gear dynamic transmission error STE defined along the gear meshing line can be expressed as:
where r is the time series index, corresponding to the sampling point in signal processing.
In addition to increasing computational efficiency, the frequency domain integration method transforms complex integral calculations into simple division operations and effectively prevents the cumulative amplification of minor errors in time-domain signals during the integration process, thereby yielding more accurate results.
2.2. Theoretical Calculation Method of Material Mechanics
A theoretical method for calculating spur gear transmission error is the material mechanics approach. During the gear meshing process, the tooth flanks are subjected to loads, causing the gear teeth to undergo elastic deformation, which is further converted into angular deviation in the transmission process.
where and represent the flexural deformation and tangential deformation of the trapezoidal structural segment of the gear, respectively; and denote the flexural deformation and tangential deformation of the rectangular structural segment of the gear, respectively; represents the tooth body deformation generated by the elastic displacement of the gear substrate; and is the meshing contact deformation of the gear teeth.
According to the gear meshing transmission mechanism, by taking the vector sum of the elastic deformation amounts of the driving gear and the driven gear along the meshing line direction, the dynamic transmission error of the spur gear is determined.
where and denote the total deformation amounts of the driven gear teeth and the driving gear teeth under load, respectively.
2.3. Magnetic Grating Detection Method
The magnetic grating method is a high-precision direct displacement measurement method. Its core principle is to calculate the angular transmission error of the gear pair by measuring the actual rotational angle deviation between the input shaft and the output shaft, and its expression is as follows:
where represents the rotation angle of the driving gear, reflects the rotation angle of the driven gear, and is the transmission ratio between the gear pair.
To intuitively reflect the error of the gear meshing line, the angular transmission error is usually multiplied by the base circle radius rb of the output gear to obtain the linear transmission error and its expression is as follows:
where denotes the base circle radius of the driven gear.
3. Experiment
Design of the Experiment Platform
To conduct the quasi-static gear transmission error test of spur gears, the test rig described in Reference [24] was adopted to carry out research on the quasi-static gear transmission error measurement technology using the acceleration method. Transmission error measurement experiments under different working conditions were conducted, and the vibration acceleration data were processed to obtain the gear transmission error. This result was compared with the transmission error results measured by the material mechanics theoretical calculation method and the magnetic grating method, so as to verify the feasibility of the acceleration method for measuring the quasi-static gear transmission error of gears.
The test rig forms a power closed-loop system through the connection between the standard gearbox, transmission shaft, test gearbox, and torsion shaft, as shown in Figure 2.
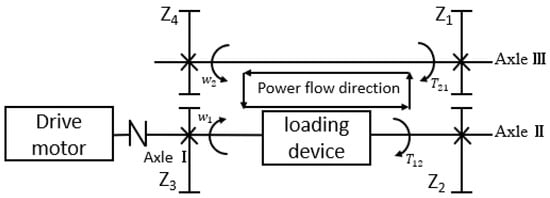
Figure 2.
The flow direction of power flow in a closed system.
The rotational speed directions and of drive shafts I and III, the torque from gear to is in the opposite direction to the rotational speed , and the torque from gear to is in the same direction as the rotational speed. As illustrated in Figure 2, closed power flow circulates in the direction of -shaft I-loading device-shaft II---shaft III--, i.e., the closed power flows counterclockwise. When the rotation direction changes while the torque direction remains unchanged, or the torque direction changes while the rotation direction remains unchanged, the direction of the closed power flow will change accordingly. Nevertheless, the driving gear and the direction of the closed power flow remain the same if the rotation and torque directions are altered simultaneously.
The torque shaft has a torque device attached to it. By applying weights to adjust the relative angle between the two parts of the torque device, it is possible to apply different magnitudes of torque to the test gear. Applying and adjusting the torque on the test gear is made simpler by the torque device’s structure. The test platform is shown in Figure 3.
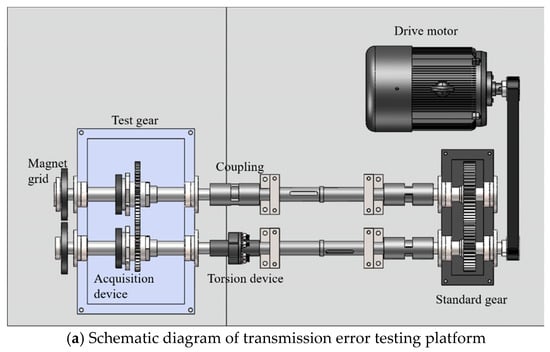
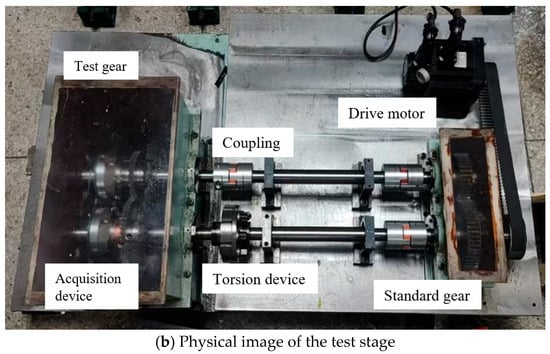
Figure 3.
Gear transmission error test stage.
Quasi-static transmission error measurement system based on acceleration sensors relies on two pairs of tangentially mounted single-axis accelerometers placed adjacent to each gear. The accelerometers are arranged in a centrally symmetric configuration, with each pair installed at a radius ρ in diametrically opposite orientations. In order to gather experimental data using the acceleration method, the acceleration signals are wirelessly transferred to the host computer through an acceleration signal acquisition device. Simultaneously, a magnetic grating is installed at the shaft end to capture changes in the gear shaft rotation angle. Through a high-speed data acquisition card, Synchronous acquisition of magnetic grating signals is implemented, and the collected data are transmitted to the computer system to generate gear transmission error results via the magnetic grating measurement method. The platform can perform low-speed rotation under load conditions, and during testing, the torque applied to the test gear is adjusted by adding weights to the torque applicator. The accelerometer model used in this experiment is PCB Piezotronics 352C22 (single axis accelerometer), with a sensitivity of 100 mV/g, a measurement range of ±50 g, and a frequency response range of 0.5 Hz~10 kHz, which meets the acquisition requirements of high-frequency vibration signals in gear meshing. In the experiment, when the number of active teeth is 53 and the speed is 460 rpm, in order to meet the requirements of the sampling theorem, the sampling frequency is set to 5 kHz (≥10 times the maximum meshing frequency).
The material parameters and geometric parameters of the gears used in the experiment are illustrated in Table 1 and Table 2, respectively.

Table 1.
Gear material characteristic parameters.

Table 2.
Gear dimensional parameters.
4. Test Results
Utilizing the established Gear Transmission Error Test Platform, torque values were sequentially selected at 51.25 N·m, 39 N·m, and 26.56 N·m within the safety thresholds of the equipment, based on the drive motor’s load capacity and the maximum loading capability of the torque applicator. To ensure comprehensive data coverage spanning a broad range from low to high speeds, circumferential acceleration measurements of the gear pair were performed at rotational speeds of 73 rpm, 168 rpm, 264 rpm, 366 rpm, and 460 rpm. A thorough examination of gear quasi-static transmission error is made possible by this combination of testing across multiple torque and speed levels.
4.1. Comparison of Measurement Accuracy for Different Tangential Acceleration Sensor Configurations on Gears
Figure 4 presents the time-frequency domain representation of the tangential acceleration data for the gear pair under the operating condition of 51.25 N·m torque and 460 rpm rotational speed.
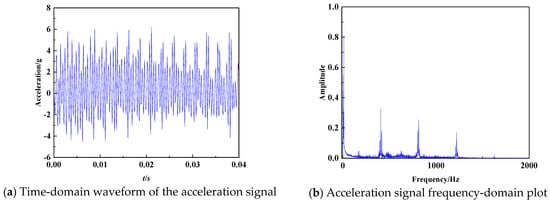
Figure 4.
Time-Frequency Representation of Gear Tangential Acceleration Data.
The time-domain waveform of the acceleration signal over a 0.04 s duration is displayed in Figure 4a. Analysis of Figure 4b reveals that the low-frequency components of the gear circumferential acceleration are primarily dominated by shaft rotational frequency. These components primarily characterize the magnitude of cumulative pitch error and individual pitch error within the gear. On the other hand, the gear meshing frequency and its multiples dominate the high-frequency components. These high-frequency components are primarily determined by factors such as tooth profile error and tooth contact deformation. The vibrational energy of the gear is predominantly concentrated in these high-frequency components. The frequency spectrum clearly shows that the amplitude is the largest at the fundamental meshing frequency for the spur gear. At the second and third meshing frequencies, the amplitudes gradually diminish.
Figure 5 presents the theoretical elastic deformation-induced transmission error values of the gear transmission system under operating conditions of 51.25 N·m, 39 N·m, and 26.56 N·m torque at 460 rpm. The engagement point, double-to-single tooth engagement transition point, pitch point, single-to-double tooth engagement transition point, and disengagement point were the five characteristic points chosen for material mechanics-based theoretical analysis of gear meshing deformation-induced transmission error. The following trend is revealed by the analysis: The error decreases during the transition from double-tooth to single-tooth engagement. After entering single-tooth engagement, the error gradually increases, reaching its minimum near the pitch point. The error increases again during the transition from single-tooth to double-tooth engagement. The meshing cycle is finally completed when the error gradually drops during the double-tooth engagement phase.
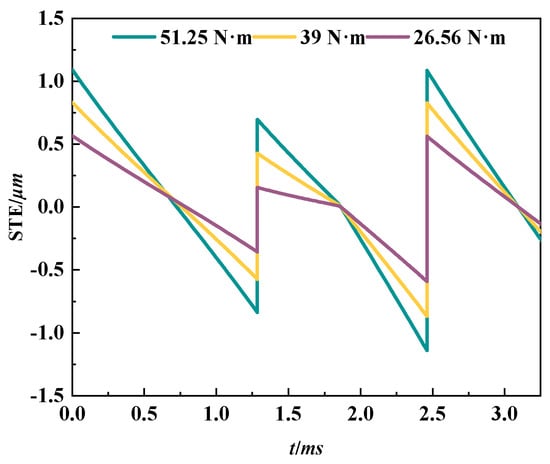
Figure 5.
Theoretical values of transmission error at torques of 51.25 N·m, 39 N·m, and 26.56 N·m.
In gear vibration monitoring, the elastic deformation-induced transmission error was calculated using measured data from three tangential acceleration sensor configurations: single-point, symmetrically dual-point, and orthogonally quad-point arrangements. The outcomes were contrasted with material mechanics-based theoretical values.
Figure 6 presents the calculated elastic deformation-induced transmission error derived from experimental data under operating conditions of 51.25 N·m, 39 N·m, and 26.56 N·m torque at 460 rpm, using single-point, symmetrically dual-point, and orthogonally quad-point tangential accelerometer configurations. Signal processing is required to convert vibration signals into error representations when employing accelerometers to measure gear transmission error. Acquiring raw acceleration time-domain signals at a sampling rate ≥ 10× the meshing frequency is necessary for this. Pre-processing (detrending and band-pass filtering) is performed to eliminate noise and DC components. Double integration with cumulative error correction is used to convert acceleration to displacement. The meshing frequency, rotational frequency, and associated spectral components are extracted from the processed signal by applying the Fourier transform. Reconstructing displacement curves based on frequency-domain features to quantify gear transmission error.

Figure 6.
Measured transmission error values for three sensor configurations.
The amplitude curves of the measured and theoretical elastic deformation-induced transmission error values are exhibited in Figure 7. Figure 8a displays the relative error between measured and theoretical values for different sensor configurations, while Figure 8b shows the RMS values of the measured data across the three sensor arrangements. In all three configurations, the difference between the measured and theoretical values becomes smaller as the number of sensors increases. At a torque of 51.25 N·m, the measurement value of the transmission error of a single sensor fluctuates the most, with a peak-to-peak value of 3.18 µm, exceeding the theoretical value by 42.35%. Its RMS value is 0.88. A pair of sensors reduced the fluctuation range to 2.79 µm, which is 25.25% higher compared to the theoretical value, and the RMS value decreased to 0.77. The measured values of the two pairs of sensors are closest to the theoretical waveform amplitude of 2.54 µm, which is still 13.9% higher than the theoretical value of 2.232. The RMS value, however, has decreased to 0.71, suggesting that sensor configuration can effectively improve measurement accuracy. But the measured value is still higher than the theoretical value, because the theoretical calculation simplifies the gear teeth into rectangular and trapezoidal structures, increasing the stiffness in comparison to the original structure. At the same time, only static loads are taken into account in the analysis, and the machining and assembly errors of the gear cannot be included, so it is relatively small. Moreover, the experimental results include these factors, meaning the overall experimental results are slightly larger than the theoretical calculation results.
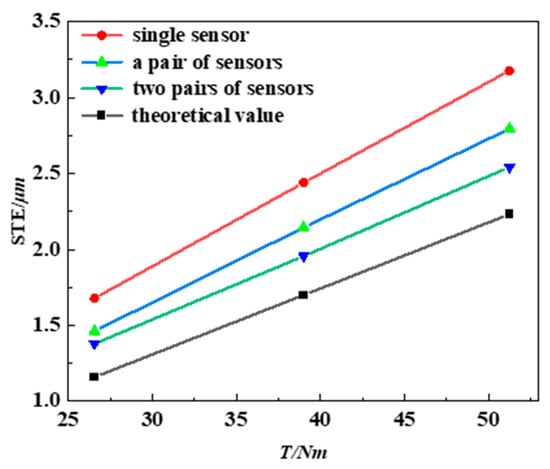
Figure 7.
Amplitude curves of theoretical and measured gear transmission error.
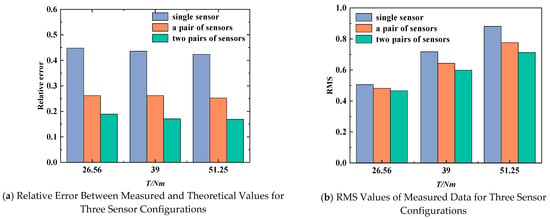
Figure 8.
Relative error and rms values for three sensor configurations.
4.2. Experimental Results of Gear Elastic Deformation-Induced Transmission Error
Experiments were conducted to measure the circumferential acceleration of gear pairs under different rotational speeds and torque conditions. Process the experimental data to obtain gear meshing vibration signals and use an integration method to obtain the change curve of the transmission error caused by gear elastic deformation. Figure 9 shows the acceleration test results of the large gear with speeds of 73 r/min, 168 r/min, 264 r/min, 366 r/min, and 460 r/min, and torques of 51.25 N·m, 39 N·m, and 26.56 N·m, respectively.
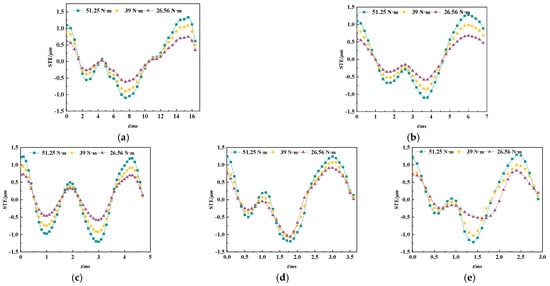
Figure 9.
Experimental results under the conditions of torque of 51.25 N·m, 39 N·m, and 26.56 N·m, (a) speed = 73 r/min, (b) speed = 168 r/min, (c) speed = 264 r/min, (d) speed = 366 r/min, (e) speed = 460 r/min.
Figure 9 depicts the measurement results of the acceleration method under different torques as well as speeds. As can be seen from Figure 5, the experimental result curve of gear elastic deformation transmission error is consistent with the theoretical calculation curve. The first double-tooth meshing area showed an overall downward trend, with the single-tooth meshing area rising first and then falling, and the second double-tooth meshing area rising first and then falling.
Amplitude of the theoretical calculation results and experimental result curves was compared in order to verify the reliability of the experimental method for measuring gear elastic deformation transmission error based on the acceleration method under different working conditions. The elastic deformation transmission error change can reflect the transmission error change in a pair of teeth meshing process.
The theoretical values of material mechanics in Figure 10 are based on the calculation of tooth contact deformation under static loads. The main idea behind this is to ignore dynamic effects and treat the load as a quasi-static process applied slowly. The rotating speed has no effect on the transmission error of meshing deformation. It is evident from the experimental data that as speed and torque rise, so does the transmission error as determined by the acceleration method. This change is mainly dominated by dynamic effects. As the rotational speed increases, the inertial force acts as an additional load. At this time, the inertial force produced by rotation is included in the total load in addition to the force produced by the externally applied torque. Consequently, as the rotational speed increases, the inertial force increases, leading to an increase in the total contact stress. Hence, the experimental value of the acceleration method is higher than the theoretical value of material mechanics and increases as the rotational speed increases.
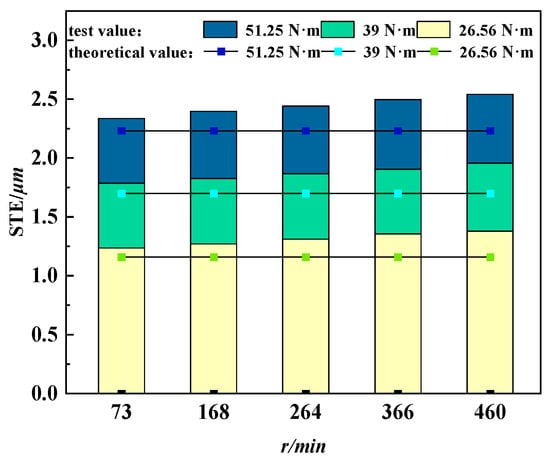
Figure 10.
Comparison of experimental results and theoretical values of acceleration method under different working conditions.
To quantitatively evaluate the consistency between the measured results of the acceleration method and the theoretical calculated values, Figure 11 calculates the relative errors under different operating conditions. Analysis shows that the relative error exhibits two main trends: (1) at any fixed torque, the error significantly increases with increasing speed. This is mainly due to the dynamic inertial force effect not considered in the theoretical model, which increases with the square of the rotational speed and leads to additional contact deformation; (2) At any fixed speed, the error increases as the torque decreases. This is mainly due to the fact that under low torque conditions, the elastic deformation calculated theoretically is relatively small, which amplifies the fixed system error in the relative error calculation.
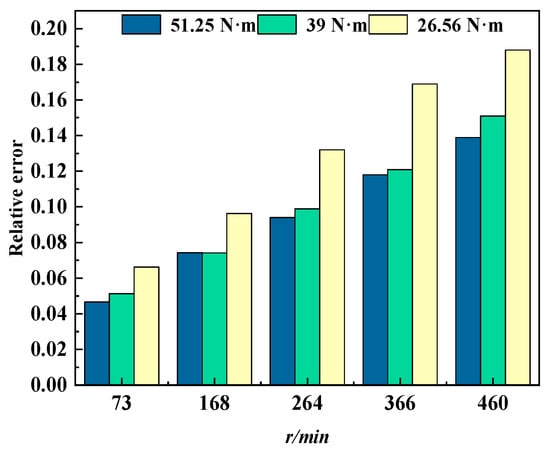
Figure 11.
Relative error between experimental results and theoretical values of acceleration method under different operating conditions.
4.3. Comparative Analysis of Acceleration-Based Quasi-Static Transmission Error Measurements Versus Magnetic Grating Method Results
By comparing the transmission error obtained from integrating vibration acceleration signals with the transmission error measured using the magnetic grating testing method, this study evaluates the feasibility of measuring the quasi-static gear transmission error of gears using the acceleration method. Figure 11 presents the experimental transmission error values obtained using the acceleration method alongside the magnetic grating method results for the large gear operating at 460 r/min under torque loads of 51.25 N·m, 39 N·m, and 26.56 N·m, respectively. Figure 12 reveals that the experimental amplitude of the quasi-static gear transmission error measured via the acceleration method is lower in comparison to that obtained using the magnetic grating method. This discrepancy stems from fundamental differences in their measurement principles. The acceleration method derives displacement indirectly by integrating vibration acceleration signals, a process susceptible to underestimation due to cumulative integration errors or signal processing (such as noise filtering). The magnetic grating approach, on the other hand, offers a direct displacement measurement, inherently offering higher precision. In terms of dynamic response characteristics, the acceleration method exhibits heightened sensitivity to high-frequency dynamic errors, whereas the magnetic grating method captures both static and low-frequency error components more thoroughly. Consequently, the QSTE values measured by the acceleration method are consistently lower than those acquired via the magnetic grating method. Despite this amplitude difference, the comparative analysis of QSTE trends and magnitudes under varying torque loads (51.25 N·m, 39 N·m, 26.56 N·m) at the constant rotational speed of 460 r/min shows the applicability of the acceleration method for measuring gear transmission error across different load conditions.
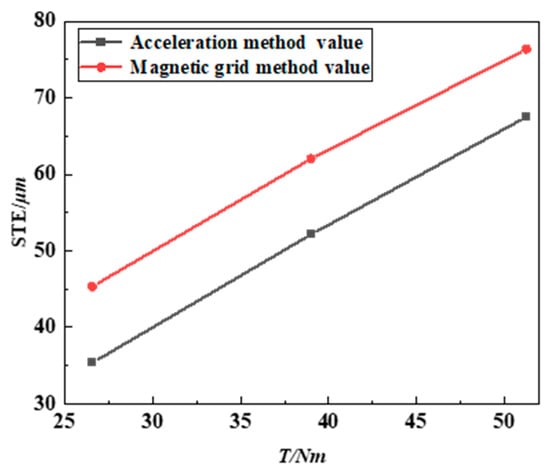
Figure 12.
Acceleration method quasi-static transmission error test values and magnetic grating method test results for large gear speed of 460 r/min and torque of 51.25 N·m, 39 N·m, and 26.56 N·m, respectively.
To quantitatively evaluate the consistency of the measurement results between the acceleration method and the magnetic grating method, we calculated the mean absolute error (MAE) and Pearson correlation coefficient (R) under three torque conditions, as shown in Table 3. Data analysis shows that the results of the two methods exhibit a very high linear correlation (R = 0.999), which confirms the effectiveness of the acceleration method in capturing the trend of quasi-static transmission errors. At the same time, there is a systematic deviation of approximately 9.58 µm in the measured values of the acceleration method, which is due to the attenuation of the extremely low frequency displacement signal by the high pass filtering operation during the integration process, resulting in underestimation of the amplitude.

Table 3.
The mean absolute error (MAE) and correlation coefficient of the experimental results of acceleration method and magnetic grating method under different torques.
Figure 13 demonstrates that the gear transmission error increases as the rotational speed increases. Furthermore, the discrepancy between the acceleration method and the magnetic grating method diminishes as the speed increases, implying that the outcomes of the two approaches tend to converge at higher rotational speeds. While acceleration sensors exhibit sensitivity to high-frequency vibration, the integration algorithms used to derive displacement typically require noise-reduction filtering (e.g., high-pass filtering). The true amplitude of low-frequency displacement signals is naturally attenuated by this filtering process. Conversely, the magnetic grating method lacks such filtering stages, enabling a more direct response to full-spectrum displacement, particularly at low frequencies. As a result, it more readily captures the gradual deformation occurring during gear meshing. This fundamental difference explains why the gear transmission error results measured via the magnetic grating method are consistently larger than those obtained using the acceleration method. Nonetheless, the application of the acceleration method for measuring gear transmission error across different speed conditions is confirmed by a comparative analysis of the trends and amplitudes of quasi-static transmission error measured by both methods under constant load but varying rotational speeds.
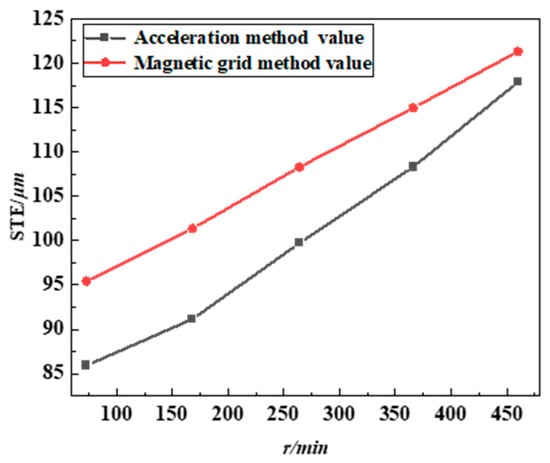
Figure 13.
Test results of quasi-static gear transmission error using acceleration method and magnetic grating method with a torque of 39 N·m and large gear speeds of 73 r/min, 168 r/min, 264 r/min, 366 r/min, and 460 r/min, respectively.
Table 4 shows the measurement results and quantitative comparison of acceleration method and magnetic grating method at different speeds. The data confirms a high linear correlation (R = 0.998) between the two methods. As the speed increases, the absolute error shows a clear convergence trend, decreasing significantly from 9.49 µm at low speed of 73 rpm to 3.43 µm at 460 rpm. This confirms that the acceleration method has better absolute accuracy in higher speed regions.

Table 4.
The mean absolute error (MAE) and correlation coefficient of experimental results using acceleration method and magnetic grating method at different rotational speeds.
5. Conclusions
This paper proposes a novel acceleration-based method for measuring both the quasi-static gear transmission error and the elastic deformation transmission error during gear meshing in spur gears. The credibility of the proposed method is proved through validation using material mechanics calculations and the magnetic grating method. By calculating the gear elastic deformation transmission error from experimental data acquired using single-point, symmetrical dual-point, and orthogonal four-point configurations of tangential acceleration sensors, and comparing the outcomes with theoretical values calculated based on material mechanics, this study demonstrates that the orthogonal four-point sensor configuration significantly enhances measurement accuracy. Both material mechanics theoretical calculations and acceleration-based experimental measurements reveal that the gear elastic deformation transmission error exhibits consistent trends across different operating conditions. However, the theoretical calculation yields smaller amplitudes than the experimental results obtained via the acceleration method. The reason for this discrepancy is that the theoretical model simplifies gear teeth as rectangular and trapezoidal cross-sections, which makes them stiffer than the actual structure. Furthermore, the theoretical analysis considers only static loads and cannot account for factors such as gear manufacturing errors and assembly errors.
Both magnetic grating and acceleration techniques were used to quantify the quasi-static gear transmission error simultaneously under constant-load/variable-speed and constant-speed/variable-load conditions. The experimental results demonstrate that the QSTE trends obtained via the acceleration method align consistently with those determined by the magnetic grating method. Furthermore, when rotational speed increases, the difference between the two approaches decreases, suggesting that data converge at higher speeds. This systematic validation confirms the feasibility of the acceleration method for gear transmission error testing.
In this study, the acceleration method is utilized to determine the transmission error of spur gears under quasi-static operating conditions. This method is particularly suitable for analyzing the laws and trends of transmission errors with changes in parameters such as load and speed and is suitable for assembled systems where it is inconvenient to install encoders/grating rulers on the shaft. Sensor installation is more flexible. The acceleration method is suitable for steady-state loads and is not currently applicable to severe dynamic load fluctuations. Currently validated at room temperature (20–25 °C). Our findings confirm that the acceleration method enables effective measurement of gear transmission error in quasi-static regimes. This capability holds significant implications for enhancing gear transmission performance as well as driving future advancements in the field of mechanical engineering.
Future work will focus on several avenues for improvement and extension: The temperature range is an important undefined boundary that needs to be tested in a wider temperature range (such as 0–60 °C) in the future. Develop more advanced signal processing algorithms to reduce integration errors and system biases at low speeds. Combine experimental methods with finite element analysis to create a high-fidelity digital twin model for modeling prediction errors.
Author Contributions
J.Z. contributed to conceptualization and methodology. C.J. developed software, curated data, conducted analysis and validation, and drafted the manuscript. C.L. and J.J. jointly designed and executed the control experiment. J.Z. provided review and editing of the manuscript and approved the final manuscript. Z.L. handled funding acquisition and project oversight. All authors have read and agreed to the published version of the manuscript.
Funding
This work was supported in part by the 2020 National Key Research and Development Program of China 2020YFB2008100, the National Natural Science Foundation of China under Project 52105061, the Natural Science Foundation of Jiangsu Province under Project BK20200424 and Project BK20200430, the Nanjing University of Aeronautics and Astronautics, Jiangsu Key Laboratory of Precision and Micro-manufacturing Technology, and the Sichuan Gas Turbine Establishment, Aero Engine Corporation of China. The authors would like to thank the anonymous reviewers for giving valuable suggestions to improve the quality of their work.
Data Availability Statement
All data used in this manuscript were gathered during experimentation and may be requested from the corresponding author with a reasonable justification.
Conflicts of Interest
The authors declare no conflicts of interest.
References
- Wu, J.; Wei, P.; Zhu, C.; Zhang, P.; Liu, H. Development and Application of High Strength Gears. Int. J. Adv. Manuf. Technol. 2024, 132, 3123–3148. [Google Scholar] [CrossRef]
- Anichowski, B.; Kahraman, A.; Talbot, D. Dynamic Transmission Error Measurements from Spur Gear Pairs Having Tooth Indexing Errors. In Proceedings of the ASME 2017 International Design Engineering Technical Conferences and Computers and Information in Engineering Conference, Cleveland, OH, USA, 6–9 August 2017. [Google Scholar]
- Hotait, M.; Kahraman, A. Experiments on the Relationship between the Dynamic Transmission Error and the Dynamic Stress Factor of Spur Gear Pairs. Mech. Mach. Theory 2013, 70, 116–128. [Google Scholar] [CrossRef]
- Zhang, J.; Lv, C.; Li, Z. Investigation of High-Speed Dynamic Transmission Error Testing Using Gear Strain. Machines 2023, 11, 956. [Google Scholar] [CrossRef]
- Benatar, M.; Handschuh, M.J.; Kahraman, A.; Talbot, D. Static and Dynamic Transmission Error Measurements of Helical Gear Pairs with Various Tooth Modifications. J. Mech. Des. 2019, 141, 103301. [Google Scholar] [CrossRef]
- Kang, M.R.; Kahraman, A. Measurement of vibratory motions of gears supported by compliant shafts. Mech. Syst. Signal Process. 2012, 29, 391–403. [Google Scholar] [CrossRef]
- Gregory, R.W.; Harris, S.L.; Munro, R.G. A method of measuring transmission error in spur gears of 1:1 ratio. J. Sci. Instrum. 1963, 40, 5–9. [Google Scholar] [CrossRef]
- Chun, X.; Siyu, C. Experimental Study of the Effect of Assembly Error on the Lightly Loaded Transmission Error of Spur Gear with Crown Modification. J. Low Freq. Noise Vib. Act. Control 2019, 39, 1039–1051. [Google Scholar] [CrossRef]
- Chin, Z.Y.; Smith, W.A.; Borghesani, P.; Randall, R.B.; Peng, Z. Absolute transmission error: A simple new tool for assessing gear wear. Mech. Syst. Signal Process. 2021, 146, 107070. [Google Scholar] [CrossRef]
- Yu, B.; Kou, H.; Shi, Z.; Sun, Y. A Virtual Measurement Method of the Transmission Error Based on Point Clouds of the Gear. Meas. Sci. Rev. 2022, 22, 92–99. [Google Scholar] [CrossRef]
- Tamminana, V.K.; Kahraman, A.; Vijayakar, S. A Study of the Relationship Between the Dynamic Factor and the Dynamic Transmission Error of Spur Gear Pairs. In Proceedings of the 2007 Asme International Design Engineering Technical Conferences & Computers & Information in Engineering Conference, Las Vegas, NV, USA, 4–7 September 2007. [Google Scholar]
- Rezayat, A.; Catera, P.G.; Capalbo, C.; Cosco, F.; Mundo, D. Numerical and experimental analysis of the transmission error in hybrid met-al-composite gears. Compos. Struct. 2022, 298, 116012. [Google Scholar] [CrossRef]
- Liu, C.; Shi, W.K.; Curá, F.M.; Mura, A. A novel method to predict static transmission error for spur gear pair based on accuracy grade. J. Cent. South Univ. 2020, 27, 3334–3349. [Google Scholar] [CrossRef]
- Tang, J.J.; Tang, J.Y. Transmission Error Calculation Based on Manufacturing Errors and Load. Adv. Mater. Res. 2014, 971–973, 848–851. [Google Scholar] [CrossRef]
- Cheng, J.H.; Liang, M.; Fan, F.L. Experiment Research and Analysis of Transmission Error of Gears. Adv. Mater. Res. 2012, 503–504, 1074–1077. [Google Scholar] [CrossRef]
- Wang, Y.N.; Sun, Z.L.; Yin, M.A. Considering Thermal Deformation in Gear Transmission Error Calculation. Appl. Mech. Mater. 2013, 281, 211–215. [Google Scholar] [CrossRef]
- Karagiannis, I.; Theodossiades, S. An Alternative Formulation of the Dynamic Transmission Error to Study the Oscillations of Automotive Hypoid Gears. J. Vib. Acoust. 2013, 136, 011001. [Google Scholar] [CrossRef]
- Lee, H.K.; Do, J.G.; Hong, S.M.; Yoo, D.K.; Won, K.M.; Chae, G.M.; Lee, T.H. Research for a Development of the Test Equipment for Transmission Error of the Planetary Gear Carrier Pack. Trans. Korean Soc. Noise Vib. Eng. 2014, 24, 549–554. [Google Scholar] [CrossRef]
- Morikawa, K.; Kumagai, K.; Komori, M.; Nakura, Y. Transmission Error Prediction Method of Planetary Gears Taking Account of Alignment Error. Proc. JSME Annu. Meet. 2012, 4, 513–525. [Google Scholar] [CrossRef][Green Version]
- Guo, C.H.; Yang, W.T.; Liu, Z.; Zhang, Z.M. Tooth Contact Analysis and Transmission Error Optimization for Klingelnberg Spiral Bevel Gear. Appl. Mech. Mater. 2013, 310, 323–327. [Google Scholar] [CrossRef]
- Sentoku, H.; Itou, T. Study on Transmission Error of Straight Bevel Gears. JSME Int. J. Ser. C 2004, 47, 391–397. [Google Scholar] [CrossRef]
- Mohamad, E.N.; Komori, M.; Murakami, H.; Kubo, A.; Fang, S. Effect of Convex Tooth Flank Form Deviation on the Characteristics of Transmission Error of Gears Considering Elastic Deformation. J. Mech. Des. 2010, 132, 101005. [Google Scholar] [CrossRef]
- Zachary, H.W. Loaded Transmission Error Measurement System for Spur and Helical Gears. Master’s Thesis, The Ohio State University, Columbus, OH, USA, 2009. [Google Scholar]
- Lu, H.; Zhang, J.; Pan, K.; Lv, C.; Hou, X.; Li, Z.; Zhang, H. Quasi-Static Transmission Error Measurement Using Micro-Deformation. Iran. J. Sci. Technol. Trans. Mech. Eng. 2023, 48, 723–731. [Google Scholar] [CrossRef]
Disclaimer/Publisher’s Note: The statements, opinions and data contained in all publications are solely those of the individual author(s) and contributor(s) and not of MDPI and/or the editor(s). MDPI and/or the editor(s) disclaim responsibility for any injury to people or property resulting from any ideas, methods, instructions or products referred to in the content. |
© 2025 by the authors. Licensee MDPI, Basel, Switzerland. This article is an open access article distributed under the terms and conditions of the Creative Commons Attribution (CC BY) license (https://creativecommons.org/licenses/by/4.0/).