Abstract
Even though the design of vibration isolators is well-established for many engineering applications, their efficiency in wide and multiple frequency ranges is still a challenge. In these cases, the use of Phononic-Based Vibration Isolators (PBVIs) may be advantageous as they present different Attenuation Regions (ARs) in which the elastic waves are strongly attenuated. Therefore, the present paper is devoted to the experimental evaluation, in terms of force transmissibility, of different types of supporting devices tested on a load mass and a motor of a Hermetic Compressor (HC). Those devices are the original Helical Coil Spring (HS) that equips the HC, the PBVI, and the Combined Structure (CS) which is composed of a PBVI combined in series with the HS. Results evidentiate the capability of the CSs to isolate vibrations, where the PBVI contributes with its ARs, thus operating as a “filter” in specific frequency ranges, while the HSs maintain the flexibility of the CSs, which is advantageous for impact-loads and/or transient-case scenarios. Hence, the capability, relevance and impact that these PBVIs present for force transmissibility reduction applications is highlighted here, which should capture the attention of and motivate the industry, e.g., producers of isolation systems, since it has wide-ranging engineering applications.
1. Introduction
Vibration isolation is still a recurrent problem in engineering; many mechanisms dedicated to passive vibration reduction (some of which can be tuned and/or optimized) are commercially available or under research [1,2,3].
The diversity of sizes in vibrating systems, as well as their operational conditions, dictate a variety of methods, devices, and materials to suppress vibrations in a passive way [4]. The materials commonly employed are as follows: (i) rubber-type materials that provide combined benefits in damping, flexibility, and durability characteristics, as well as resistance to environmental factors—thus, commonly used for machinery mounts, automotive parts, and electronics applications; (ii) polymeric foams (e.g., polyurethane and melamine foams) that, besides being lightweight, provide good energy absorption and customizable density—thus, usually found in soundproofing panels, cushions, and automotive components; (iii) viscoelastic materials, e.g., sorbothane®, usually found in electronics applications, footwear, and medical devices due to their excellent energy absorption and high damping coefficient; (iv) fiber composites, e.g., fiberglass and carbon fiber, which are mainly used in aerospace and automotive applications, as they present high strength-to-weight ratio and customizable damping properties; (v) metals and metal alloys, e.g., lead and copper, that are used in specific vibration damping applications such as industrial equipment and civil construction, as they have benefits like high density and excellent low-frequency damping; and (vi) cork and Cork Composite Materials (CCMs) used in applications like flooring and industrial gaskets, as they are lightweight and present good damping and heat resistance characteristics.
The vibration isolation devices considered in this work are (i) steel Helical Coil Springs (HSs), (ii) two-material multilayered bars here entitled as Phononic-Based Vibration Isolators (PBVIs), composed of alternate layers of steel and a CCM, and (iii) Combined Structures (CSs) of one HS in series with one PBVI. Compared with materials commonly employed in other devices, the CS combines a CCM with steel laminates and a HS applied at one of its extremities. Note that mechanical vibration isolators are typically preferred for heavy-duty applications. Foams and viscoelastic polymers are considered more suitable for light-duty applications. One may say that the PBVIs and CS appear naturally appropriate for intermediate-duty applications.
One of the most used devices is the HS (Figure 1a). Although inexpensive and critical to reliability in many situations (especially under shock and/or transient conditions), the HSs do not always provide satisfactory performance in the service frequency range [5]. The HSs present a regularly spaced distribution of the natural frequencies in the frequency response spectrum (Figure 1b), leading to unwanted vibration and possible acoustic discomfort, namely for frequencies near the resonances.
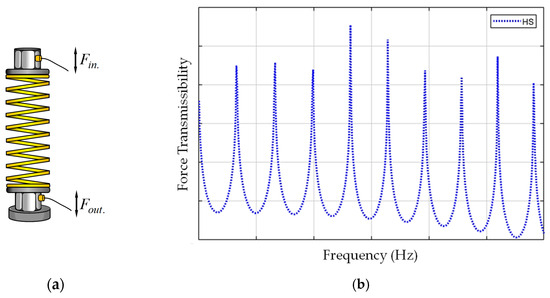
Figure 1.
Helical Coil Spring (HS): (a) Spring with force transducers; and (b) Frequency response of the force transmissibility: where ω is the excitation frequency.
A possible solution may be found in phononic structures [6,7,8]. Even though the first works date back to Newton [9] and Rayleigh [10], among the pioneering efforts is also the work of Brillouin [11] and Mead and his co-workers [12], which includes many of the original contributions to the analysis and characterization of the wave propagation in periodic structures. These are based on wave scattering and interference inside heterogeneous periodic materials and make use of the fundamental properties of waves to create bandgaps, i.e., ranges of frequency within which waves cannot propagate (stop-bands).
The bandgaps can be tailored for structural vibration control by designing the properties, size, and distribution of the periodic materials. The first experimental evidence of the existence of phononic bandgaps in periodic structures dates to 1995 when Meseguer et al. [13] analyzed the acoustic characteristics of a minimalist sculpture by Eusebio Sempere. The sculpture consists of a periodic array of hollow stainless-steel cylinders, each 30 mm in diameter, arranged on a square 100 mm lattice (spacing), forming a structure 4 m in diameter. Measurements of the acoustic transmission as a function of frequency and direction were conducted on the sculpture revealing that sound traveling perpendicular to the axes of the cylinders was strongly attenuated after a frequency of 1670 Hz. To gather additional data, the researchers decided to build their minimalist sculpture by hanging cylinders of stainless steel from a frame mounted in an acoustic chamber [14]. Results revealed that the structure strongly suppressed sound waves in the audible range, at frequencies between 1400 and 1700 Hz. Further experimental evidence of bandgaps may be found in the works of Richards and Pines [15], who built a periodic shaft with bandgaps from 600 Hz to 1200 Hz and 1250 Hz to 2000 Hz to inhibit the transmission of waves from the shaft into the bearings and supports. In [16,17], authors use multi-laminated periodic beams to obtain wide Attenuation Regions between 968 Hz and 4368 Hz [17].
To study structures built with infinite periodicity repetition, Bloch’s theorem [18], also related to Lyapunov–Floquet’s theorem [19], can be used to obtain a characterization of longitudinal waves leading to the corresponding dispersion relation. For structures with finite periodic repetition, a description of the basics can be found in [20,21,22,23,24]. Motivated by these works, the authors have designed and developed finite periodic structures composed of alternating layers of two or more materials (where each two successive layers can be regarded as a unit cell) with a significant contrast in the wave phase velocity that are here entitled as PBVIs [25]. It has been shown that with a repetition of only two or three cells (depending on the materials), relatively strong Attenuation Regions (ARs) are obtained instead of bandgaps [22,23], at the same frequency ranges. To determine the location and width of the bandgaps, a computational component has been explored by the authors in [17] to develop the analytical and numerical models used in simulation, as well as an algorithm for the selection of the pair of materials and their optimal proportion within the unit cell. In that study, the pairs of selected materials are steel and CCM (either cork rubbers or cork agglomerates [25]). The possibility to numerically predict the location and width of the ARs in frequency has been shown and validated with the subsequent application to finite repetitive structures [26,27,28]. From these studies arose the idea that a CS composed of an HS in series with a PBVI would be advantageous in the sense that it combines the shock/transient load absorption capability of the HS with the “filtering” capability within the ARs of the PBVIs.
In this sense, this work addresses a practical application regarding the suspension of the motors used in Hermetic Compressors (HCs) in which HSs are originally used as supports. These HSs may present undesirable vibration transmissibility to the carcass of the HC at certain frequencies and, consequently, undesirable noise to the environment. The aim is to test the application of a PBVI, as presented here. Additionally, the possibility of combining these isolators with the spring to maintain the flexibility of the support in which the PBVI acts as a filter is also presented.
This work, being a natural continuation of previous works [17,26], is divided into two experimental sets: (i) a load mass (equivalent to the mass of the motor of the HC) excited by a shaker and supported by three sets of three HSs, PBVIs, and CSs arranged in a triangular form; and (ii) the motor of an HC that is self-excited, i.e., working, supported at four points by its original HSs and by the CSs. At each support point, force transducers are mounted between the support of the motor and the supporting device and between the supporting device and the ground, to measure the input and output force signals, respectively.
The results, evaluated in terms of force transmissibility (i.e., the ratio between the magnitude of the output and input force signals at each frequency in a given frequency range), demonstrate in these cases the increased capability of these CSs in reducing the transmitted force. This is expected to attract the attention of researchers and especially the industry, to facilitate the development of vibration isolators and, more specifically, PBVIs, which possess numerous engineering applications.
2. Materials and Methods
2.1. The Force Transmissibility Concept
The performance of vibration isolators is usually assessed in terms of force transmissibility by applying an excitation force , with an excitation frequency , to a mass that is coupled to the supporting devices, see Figure 2.
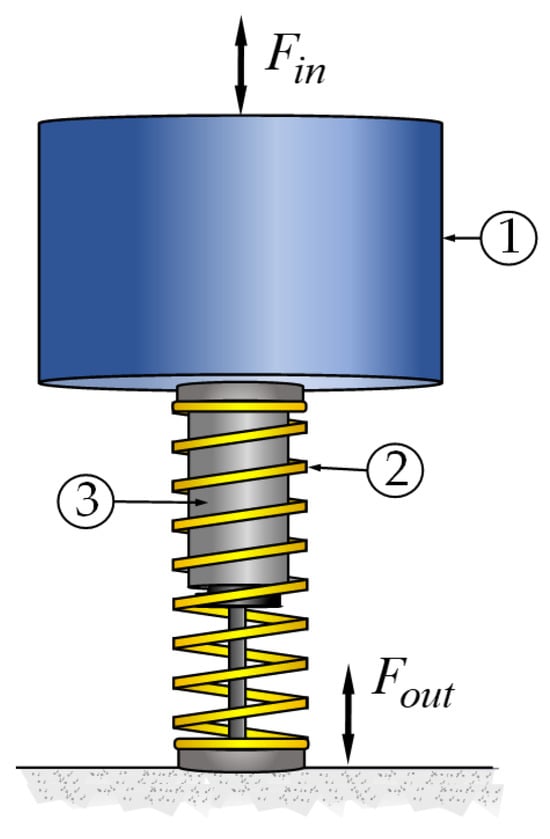
Figure 2.
Mass supported by vibration isolators. Key: 1—Mass; 2—HS; and 3—Damper.
Then, by measuring the dynamic forces effectively transmitted to the foundation (), one uses the concept of force transmissibility [29,30] that, in the frequency domain, may be defined as
i.e., the ratio between the force transmitted to the foundation and the applied one, at each frequency ( in which is the frequency in Hz) of a given defined frequency range. The is a critical parameter for evaluating the effectiveness of vibration isolation systems; it is clear that for greater than one, the force transmitted to the foundation is amplified, and for less than one, the force transmitted to the foundation is reduced, isolated, or attenuated. Note that lower force transmissibility indicates better isolation, i.e., less vibrational energy transmitted through the isolator to the foundation.
In the isolation frequency regions, is usually “very small”, e.g., 1 10−6, whereas in the amplification regions, is relatively larger by several orders of magnitude. Therefore, one often uses a logarithmic scale to express these values, i.e., to simplify the representation of small/large ratios in which positive values indicate that the force is amplified, and negative values indicate that the force is reduced.
2.2. From Phononic Structures to Phononics-Based Vibration Isolators (PBVIs)
Phononic crystals may be conceptualized as (micro) structures composed of numerous cells (composed of two materials) arranged accurately (or with some intended disorder) and repeatable in space, leading to some ideal order and symmetry as illustrated in Figure 3.
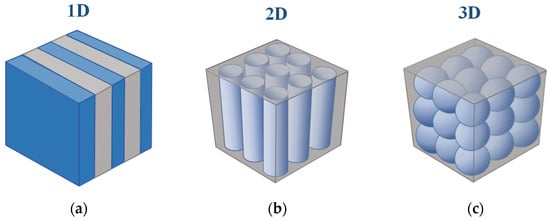
Figure 3.
Examples of phononic crystals with one-, two-, and three-dimension periodicities: (a) 1D crystal consisting of alternating layers of two materials with different mechanical properties; (b) 2D crystal consisting of parallel cylinders of a material inserted in another material with different mechanical properties; (c) 3D crystal consisting of spheres of one material embedded in another material with different mechanical properties (based on [31]).
Due to the periodical change in mass density and/or elastic constants (i.e., on the wave phase velocity through the cells in the crystal) and making use of the fundamental properties of waves (namely, scattering and interference), it is possible to create in a periodic structure/media forbidden bands (also referred to as bandgaps and stopbands), i.e., ranges of frequencies within which the phonons (mechanical waves) do not propagate.
The propagation of 1D longitudinal mechanical waves is typically described by a dispersion relation that relates the frequency and the wavenumber as
where is the wave phase velocity in the medium. However, the dispersion relations for materials that are not homogeneous, such as phononic crystals, are not that simple.
Consider a piecewise heterogeneous bar, i.e., material properties are dependent on the position along the axial direction as illustrated by Figure 4. The bar has a uniform transversal sectional area and parallel alternating layers of two materials, with longitudinal dynamic moduli of elasticity and , mass densities and , and lengths and .

Figure 4.
Uniform periodic bar composed of two different materials.
From the Bloch wave theory [18,19], it is known that due to the periodicity of the infinite structure, the natural modes of such a structure may be characterized by using the wave number and assuming that the displacement in the cell is expressed by
where is the total number of cells, is the length of the cell, and is the periodic solution, i.e., .
The dispersion relations for 1D two-material layer may be expressed as [32]
where and are the wave numbers of the respective materials expressed as where is the wave phase velocity, and is the material number.
From Equation (4), it is possible to determine for the infinite-length layered bar (Figure 5a left) the wave number versus frequency (Figure 5a right). For frequency values that make the wave number complex, the amplitude of the displacements is exponentially attenuated. Thus, the frequency ranges where is complex are bandgaps (stopbands), while the frequency ranges where is real are passbands, see Figure 5a right.
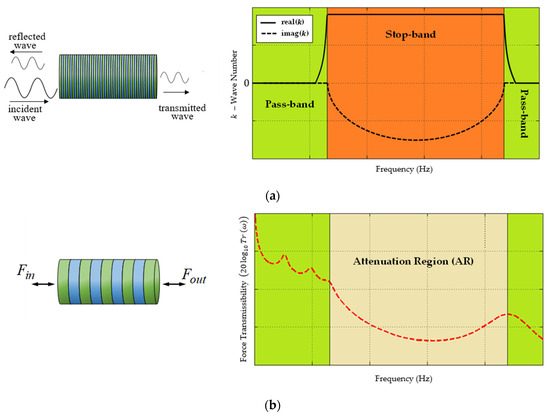
Figure 5.
Frequency responses of (a) phononic crystal (infinite number of cells) that presents pass/stopbands (bandgaps); and (b) Phononic-Based Vibration Isolator (PBVI) (finite number of cells) that presents ARs (the red dashed line represents the amplitude of the force transmissibility response at each frequency .
For an intuitive understanding of how bandgaps exist, consider a 1D periodic bar, as illustrated by Figure 4 or Figure 5, composed of infinite alternating layers of two different materials with longitudinal dynamic moduli of elasticity and , mass densities and , and lengths and . At every interface, an incoming wave transfers part of its energy into secondary, reflected waves, which then interfere with each other. If this interference is destructive, all the energy of the original wave is reflected, and the wave cannot propagate through the crystal resulting in the creation of a bandgap (stopband). On the other hand, if the interference is constructive, then all the energy of the original wave is transmitted through the crystal leading to the formation of propagation bands (passbands).
So being, the 1D forced harmonic longitudinal vibrations (where the wavelength of the stationary waves in the dynamically and longitudinally loaded bar is much longer than the characteristic transverse dimension of the bar) may be expressed for each material layer , where is the layer’s type number, as
where is the corresponding displacement response at the longitudinal coordinate and time .
As previously mentioned, for a finite periodic structure (Figure 5b left) with only two or three cells (depending on the materials), relatively strong Attenuation Regions (ARs) (Figure 5b right) are obtained instead of bandgaps [22,23], at the same frequency ranges (Figure 5a right).
The contrast in the wave phase velocities, associated with the adequate length of the unit cell (thickness of the layers), allows for the design of the PBVIs to present wider gaps between adjacent natural frequencies, i.e., ARs (see black dashed line in Figure 6), relative to the HSs (see blue dotted line in Figure 6), as well as their positioning in the frequency range. Thus, it allows for vibration isolation in a relatively low and wide frequency range, which is of interest for several mechanical applications.
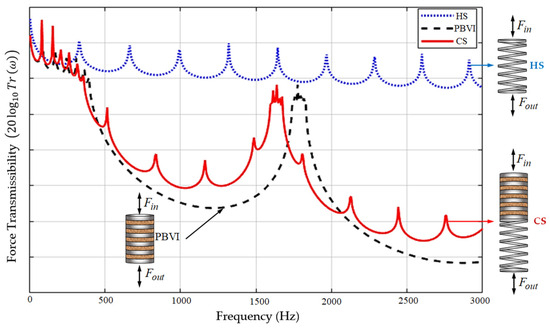
Figure 6.
Frequency response of the force transmissibility for the HS, PBVI, and Combined Structure (CS).
From what has been presented here and shown in Figure 6, it is quite evident that a CS composed of a HS in series with a PBVI (red solid line) may be advantageous in the sense that it combines the shock/transient load absorption capability of the HS with the “filtering” capability within the ARs of the PBVIs.
2.3. Workflow of the Experimental Tests
Experimental modal analyses are conducted to test different types of supporting devices and setup configurations as well as assess their vibration isolation performance in terms of force transmissibility. The workflow is shown in Figure 7.
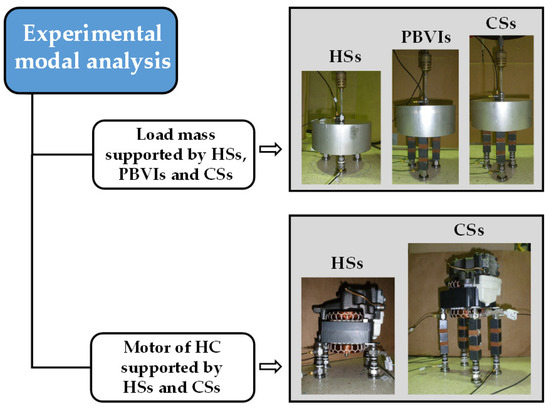
Figure 7.
Workflow of the experimental modal analyses to assess the force transmissibility of different supporting devices using a load mass and Hermetic Compressor (HC) motor.
Experimental modal analyses are primarily conducted on the load mass, equivalent to the HC mass of the motor, which is excited by a shaker and supported by three sets of HSs, PBVIs, and CSs; these are arranged in a triangular form. Next, the motor of a HC which is self-excited, i.e., working, is supported at four points by its original HSs and by the CSs.
In what follows, a brief description of these supporting devices is presented.
2.4. Supporting Devices
The three supporting devices here considered are the following:
- HSs (Figure 8a), with a rest length of 20.4 mm, a diameter of the steel wire of 1.5 mm, an inner diameter of 12 mm, 4 active coils, and 2 close plain coils at each end (the white terminations are plastic connection devices).
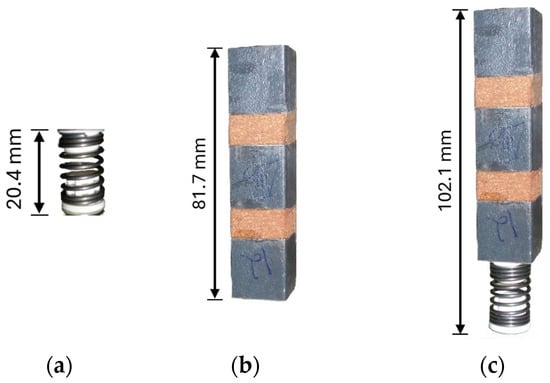 Figure 8. Supporting devices: (a) HS; (b) PBVI; and (c) CS.
 - PBVI (Figure 8b), of square cross-section with 20 mm length and composed of steel and cork composite (ref.VC5200 [25,33]) material layers with thicknesses of 20.5 mm and 10.1 mm, respectively. The total length and mass are 81.7 mm and 67.3 × 10⁻³ kg, respectively.
- CSs (Figure 8c), a combination (in series) of the HS with the PBVI. The total length is 102.1 mm.
- The material properties of the steel and CCM VC5200 are presented in Table A1 of Appendix A.
The HSs considered here are those that originally equipped the HC. Regarding the PBVI, a description of the selection of the pair of materials and their respective proportions, which is essential for the location and width of the ARs in the frequency range, is presented in [17] and further developed in [26]; hence, it will not be replicated here. Note that this PBVI is chosen among the others due to the location and width of its ARs in the frequency range and also due to its stability to sustain the load mass and the mass of the motor of the HC.
The CS consists of an HS together with a PBVI, in which a two-component epoxy adhesive with a cure time of approximately five minutes is used to join the HS and the PBVI. Note that no special care is needed to ensure the thickness of the adhesive; just a minimum amount of adhesive is used to fill the surfaces to be joined uniformly.
2.5. Experimental Methodology and Setups
2.5.1. Load Mass
The load mass is a portion of a cylindrical aluminum rod with a diameter of 150 mm, a length of 65 mm, and a mass of approximately 3.2 kg. This value is similar to the mass of the motor of the HC, which is later addressed when considering the supporting devices in an industrial application.
The basic layout of the experimental setup (Figure 9) used to obtain the force transmissibility curves of the supporting devices may vary between three sets of HSs, PBVIs, and CSs, arranged in a triangular form (see Figure 10a, Figure 10b, and Figure 10c, respectively). It may be described in the following way: a signal is generated and transmitted to the vibration exciter (Brüel&Kjær 4808—Nærum, Denmark), which is suspended from a fixed support by metallic chains. The force effectively applied to the load mass (input signal) is measured through a force transducer (PCB 208C01—Depew, NY, USA). The dynamical deformation propagates throughout the supporting device and, at the opposite extremity, to a force transducer(s) (PCB 208C01) that measures the force effectively transmitted to the foundation (output signal). The input and output signals are acquired using a data acquisition unit (Brüel&Kjær 3560D) and analyzed with the Bruel&Kjær software PULSE® LabShop Version 6.1.5.65.
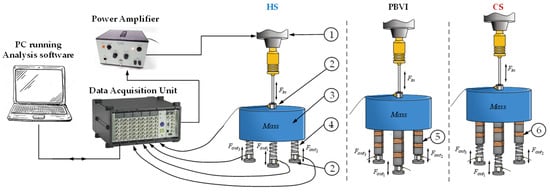
Figure 9.
Layout of the experimental setup to obtain the force transmissibility curves using the load mass supported by devices HSs, PBVIs, or CSs. Key: 1—Vibration exciter; 2—Force transducers; 3—Load mass; 4—HS; 5—PBVI; and 6—CS.
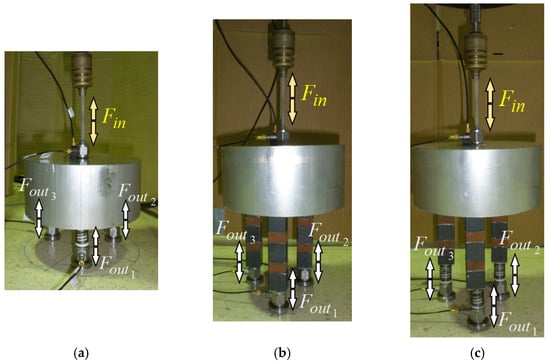
Figure 10.
Photographs of the experimental setup to obtain the force transmissibility curves using the load mass supported by: (a) HSs; (b) PBVIs; and (c) CSs.
2.5.2. Motor of the Hermetic Compressor
An industrial mechanical application is presented here, where the load mass is replaced by a working motor of a HC. The motor has a mass of approximately 3.2 kg, a power of 185 W, and a constant rotational speed of 4800 rpm. The basic layout of the experimental setup used to obtain the transmissibility curves is illustrated in Figure 11. First, the motor is tested when supported by the HSs (Figure 12a), and then, the motor is tested when supported by the CSs (Figure 12b).

Figure 11.
Basic layout of the experimental setup to obtain the force transmissibility curves using the motor supported by the HSs or CSs. Key: 1—Motor connected to the electric grid; 2—Force transducer Fin; 3—Force transducer Fout; 4—HS; and 5—CS.
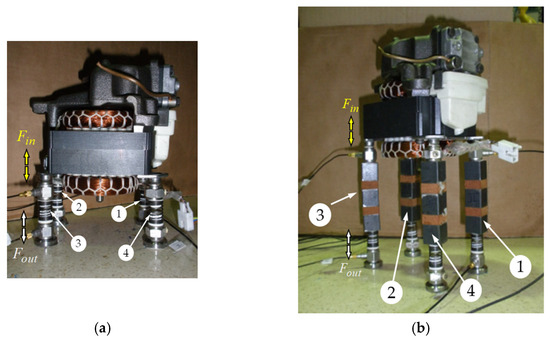
Figure 12.
Photographs of the experimental setup to obtain the force transmissibility curves using the motor of a HC supported by: (a) HSs; and (b) CSs. Key: Position of each supporting device: 1—Position 1; 2—Position 2; 3—Position 3; 4—Position 4.
The source of vibration is the motor itself which, at the time of the experiment, was working (as it is directly connected to the electricity net), so no vibration exciter is used. This specific motor has four support points and, therefore, requires four supporting devices and, consequently, eight force transducers to measure the input and output forces at all four supports. The vibration generated by the motor (input signal) is measured through force transducers (PCB 208C01). The dynamical deformation propagates throughout the supporting devices, and at the opposite extremity, force transducers measure the force effectively transmitted to the foundation (output signal).
The input and output signals are acquired using a data acquisition unit (Brüel&Kjær 3560D) and analyzed with the analysis software (Bruel&Kjær PULSE® LabShop Version 6.1.5.65).
During the experiments, the piston and cylinder of the HC motor are manually lubricated to avoid overheating and consequent damage to the motor. Furthermore, due to the manual and non-normal lubrification, as a precaution, the HC motor runs for approximately 1 minute and then rests at least 5 minutes before the next experiment.
3. Results and Discussion
3.1. Results with the Load Mass Supported by HSs, PBVIs, and CSs
In the following, the main experimental results are presented. They were obtained using the setup described in Section 2.5.1—and illustrated in Figure 9 and Figure 10—to study the performance of these devices in terms of force transmissibility (see Section 2.1).
To compare the relative performance of each type of supporting device, the force transmissibility curves of each device (in this case position 2 was chosen, see Figure 9 and Figure 10) are illustrated in Figure 13. The results for the other positions are presented in Appendix B as they lead to similar results.
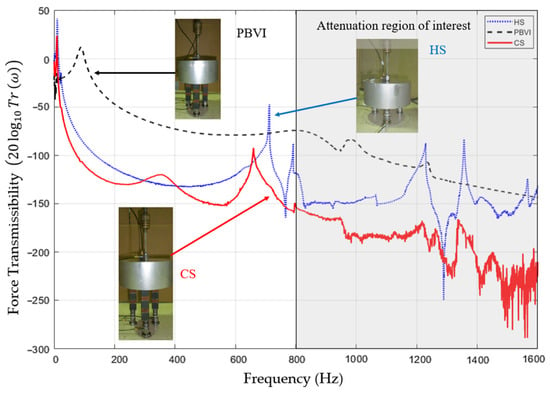
Figure 13.
Experimental force transmissibility curves obtained with the devices HS, PBVIs, and CSs supporting the load mass.
From Figure 13, one can verify that the CS (red solid line) is capable of effectively reducing the force transmissibility of the HSs’ responses (blue dotted line) after ~650 Hz and with emphasis at their natural frequencies within the PBVIs AR (shaded area), i.e., after approximately 800 Hz.
3.2. Results with the Motor of a HC Supported by HSs and CSs
Instead of a load mass, which experimentally shall be accessible to reproduce, consider now that a working motor of an HC is used (Figure 12), which is supported by the following: (i) the original HSs that equip the HC and (ii) the CSs. To study the dynamic behavior, in terms of force transmissibility (see Section 2.1), the experimental setup described in Section 2.5.2 and illustrated in Figure 11 is used here.
Figure 14 shows the force transmissibility curves obtained for the two supporting device cases previously referred to (in this case, position 4 was chosen, see Figure 11 and Figure 12). The results for the other positions are presented in Appendix C as they lead to similar results.
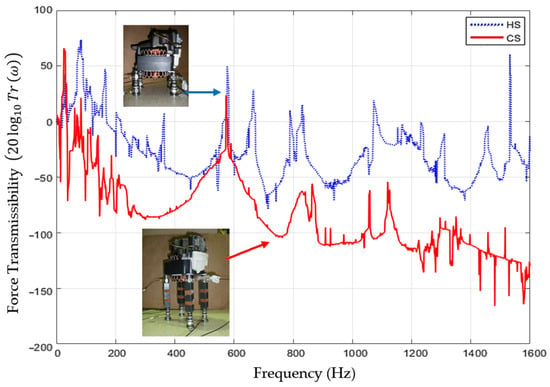
Figure 14.
Experimental force transmissibility curves obtained with HS, and CSs supporting the motor of the HC.
From Figure 14, it is clear that when the device CS (red solid line) is used (instead of the original HS (blue dashed line)) to support the working motor of HC, the force transmissibility is, in general, lower (similarly to the load mass case, see Figure 13). This is observed between 40 and 540 Hz, restarts at ≈600 Hz, and is established in the PBVIs AR of interest, i.e., after approximately 800 Hz (see Figure 13).
To compare the performance of different supporting devices, e.g., the CS and the HS, the force transmissibility ratio between those devices, e.g., and , which are always positive entities, expressed as follows may be used,
.
From the reasons previously mentioned in Section 2.1, a logarithm scale is used to express . In a logarithm scale, positive values of indicate that , while negative values of indicate that , and zero values of indicate that .
The force transmissibility ratio between these devices, see Equation (6), is illustrated in Figure 15, which also presents the mean values in specific frequency ranges. These frequency ranges are established when a change in the sign of the logarithm force transmissibility ratio occurs, i.e., when is less or greater than one. For each frequency range the mean value of the logarithm force transmissibility ratio is determined, see Table 1.
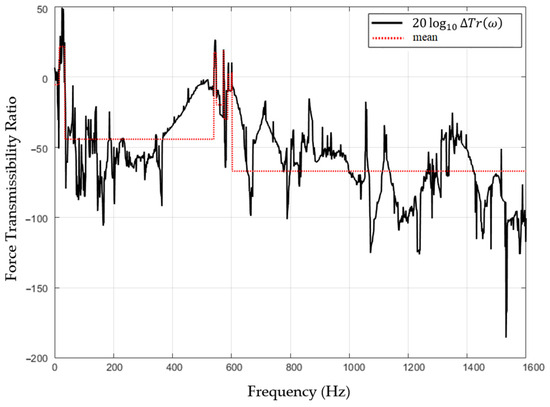
Figure 15.
Force transmissibility ratio and its mean value for the case of the motor of the HC supported by the CS and the HS.

Table 1.
Mean values of the force transmissibility ratio between the cases of the motor of the HC supported by the CS and the HS in specific frequency ranges.
As previously illustrated in Figure 14 and Figure 15, and now presented in Table 1, there are two relevant frequency ranges where the CSs present lower force transmissibility. The first is located between 36 and 541 Hz, presenting a mean transmissibility ratio of 44.3, and the second, after 604 Hz, contemplates the PBVIs AR of interest, with a mean transmissibility ratio of 67.0 and a minimum of 185.0 at 1532 Hz.
4. Discussion and Conclusions
The results from the load mass case (Figure 13) show that the force transmissibility of the PBVI (black dashed curve) is in general higher than that of the HS (blue dotted line). Even though this is in contrast with what is illustrated in Figure 6, it is expected for this PBVI—due to the materials and number of unit cells (see Section 2.4)—and this is the reason why it is not used to support the motor of the HC. Nevertheless, Figure 12 shows that with the CS (red solid line), it is possible to improve the isolation of a source of vibration, in terms of force. It is achieved with a PBVI device that has an AR in a specific frequency range, acting as a “filter” and still maintaining the flexibility of the support (which is relevant for shock absorption) due to the combined HS. This is also evident from the results of the motor of the HC (Figure 14), that when the CS (red solid line) is used instead of the HS (blue dotted line), the force transmissibility is in general lower. Hence, it is experimentally shown that it is possible to isolate vibration, in terms of force, with a CS that has an AR in a specific frequency range functioning as a “filter” and still keeping the flexibility due to the HS.
Further criteria such as fatigue, durability, the effect of temperature and humidity, etc., that were not considered, as well as strategies to protect these devices from fluids, e.g., oil, and the redesign of the connections to the motor, are topics that should be addressed in future works.
From this point of view, the concept, design, and application of PBVIs are seen to have a significant impact in the development of better vibration isolation devices, as the CSs present an improved alternative and/or solution for real isolation for several mechanical applications.
Author Contributions
Conceptualization, H.P., M.M.N. and N.M.M.M.; methodology, H.P., M.M.N. and N.M.M.M.; software, H.P.; validation, H.P., M.M.N. and N.M.M.M.; formal analysis, H.P.; investigation, H.P.; resources, H.P., M.M.N. and N.M.M.M.; data curation, H.P.; writing—original draft preparation, H.P. and R.A.B.A.; writing—review and editing, H.P., R.A.B.A., M.M.N. and N.M.M.M.; visualization, H.P. and R.A.B.A.; supervision, M.M.N. and N.M.M.M.; funding acquisition, H.P., R.A.B.A., M.M.N. and N.M.M.M. All authors have read and agreed to the published version of the manuscript.
Funding
The authors acknowledge Fundação para a Ciência e a Tecnologia (FCT) for its financial support via the projects LAETA Base Funding (DOI: 10.54499/UIDB/50022/2020) and LAETA Programatic Funding (DOI: 10.54499/UIDP/50022/2020). The authors further acknowledge FCT for its financial support via the projects UNIDEMI UIDB/00667/2020 and UIDP/00667/2020.
Data Availability Statement
Data are contained within the article. Data files will be made available on request from the corresponding author.
Conflicts of Interest
The authors declare no conflicts of interest.
Appendix A
In Table A1 of this appendix the material properties of the steel and CCM (ref VC5200 [33]) used in the PBVIs are presented.

Table A1.
Material properties: —longitudinal modulus of elasticity; —longitudinal dynamic moduli of elasticity; and —mass density.
Table A1.
Material properties: —longitudinal modulus of elasticity; —longitudinal dynamic moduli of elasticity; and —mass density.
| Material | [GPa] | [MPa] | [kg m−3] |
|---|---|---|---|
| Steel | 205 | 7860 | |
| VC5200 * | 24.5 + 5.2i (128 Hz) [25] 26.2 + 6.4i (912 Hz) [25] | 700 [33] |
* VC 5200 is a CCM manufactured and commercialized by Amorim Cork Composites.
Appendix B
This appendix presents the force transmissibility curves obtained with the load mass supported by HSs, PBVIs, and CSs using the setup described in Section 2.5.1 for all three supporting positions, see Figure 9 and Figure 10.
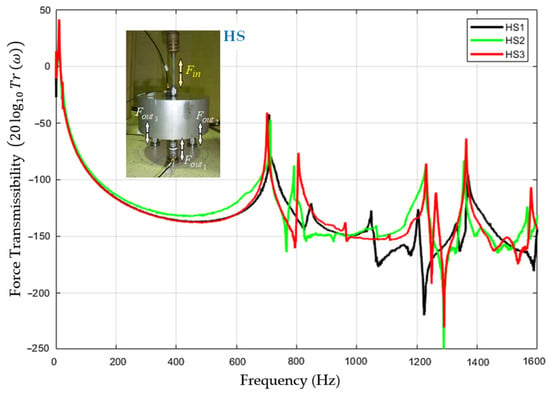
Figure A1.
Experimental force transmissibility curves obtained for all three supporting positions using HSs to support the load mass.
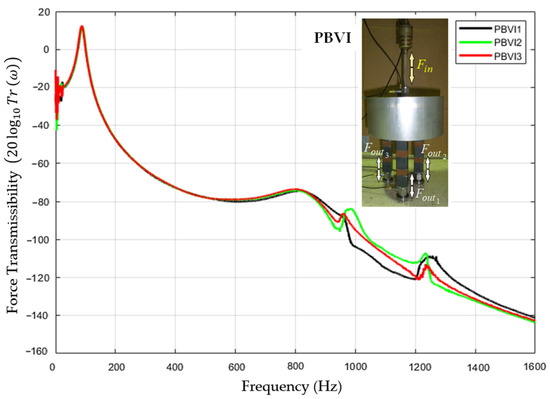
Figure A2.
Experimental force transmissibility curves obtained for all three supporting positions using PBVIs to support the load mass.
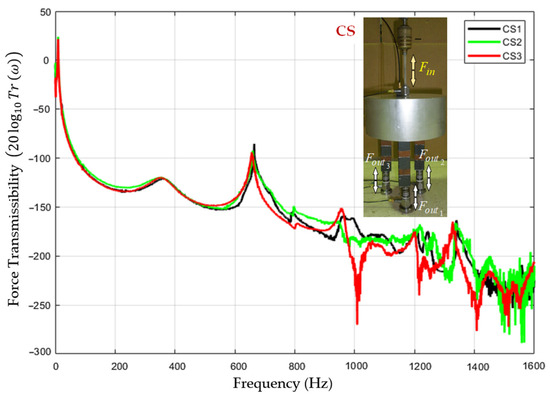
Figure A3.
Experimental force transmissibility curves obtained for all three supporting positions using CSs to support the load mass.
Appendix C
This appendix presents the force transmissibility curves obtained with the motor of the HC supported by HSs and CSs using the setup described in Section 2.5.2 for all four supporting positions, see Figure 11 and Figure 12.
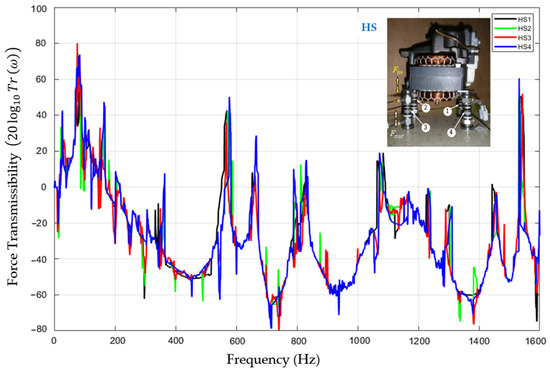
Figure A4.
Experimental force transmissibility curves obtained for all four supporting positions using HSs to support the motor of the HC.
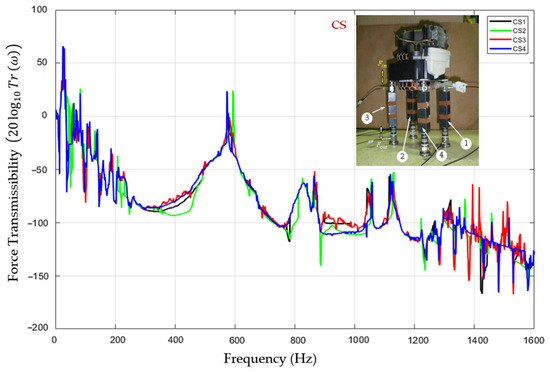
Figure A5.
Experimental force transmissibility curves obtained for all four supporting positions using CSs to support the motor of the HC.
References
- Siami, A.; Cigada, A.; Karimi, H.R.; Zappa, E. Vibration Protection of a Famous Statue against Ambient and Earthquake Excitation Using A Tuned Inerter–Damper. Machines 2017, 5, 33. [Google Scholar] [CrossRef]
- Ma, Z.; Zhou, R.; Yang, Q. Recent Advances in Quasi-Zero Stiffness Vibration Isolation Systems: An Overview and Future Possibilities. Machines 2022, 10, 813. [Google Scholar] [CrossRef]
- Garcia, P.; De-Juan, A.; Ríos, D.; Herráez, M.; Viadero, F. Contribution to the Characterization of Vibration Isolators Based on Metal Mesh. Machines 2023, 11, 856. [Google Scholar] [CrossRef]
- Mead, D.J. Passive Vibration Control; John Wiley & Sons: New York, NY, USA, 1999; ISBN 978-0-471-94203-0. [Google Scholar]
- Timoshenko, S.; Young, D.H.; Weaver, W.J. Vibration Problems in Engineering, 4th ed.; John Wiley & Sons: New York, NY, USA, 1974; ISBN 0471873152. [Google Scholar]
- Hussein, M.I.; Leamy, M.J.; Ruzzene, M. Dynamics of Phononic Materials and Structures: Historical Origins, Recent Progress, and Future Outlook. Appl. Mech. Rev. 2014, 66, 040802. [Google Scholar] [CrossRef]
- Li, W.; Meng, F.; Chen, Y.; Li, Y.F.; Huang, X. Topology Optimization of Photonic and Phononic Crystals and Metamaterials: A Review. Adv. Theory Simul. 2019, 2, 1900017. [Google Scholar] [CrossRef]
- Vasileiadis, T.; Varghese, J.; Babacic, V.; Gomis-Bresco, J.; Navarro Urrios, D.; Graczykowski, B. Progress and Perspectives on Phononic Crystals. J. Appl. Phys. 2021, 129, 160901. [Google Scholar] [CrossRef]
- Newton, I. Principia—Book II; Samuel Pepys and the Royal Society; William Dawson & Sons: London, UK, 1686. [Google Scholar]
- Rayleigh, J.W.S. The Theory of Sound; Dover: New York, NY, USA, 1945; Volume I, ISBN 0486602923. [Google Scholar]
- Brillouin, L. Wave Propagation in Periodic Structures; Dover: New York, NY, USA, 1953. [Google Scholar]
- Mead, D.M. Wave Propagation in Continuous Periodic Structures: Research Contributions from Southampton, 1964–1995. J. Sound Vib. 1996, 190, 495–524. [Google Scholar] [CrossRef]
- Martínez-Sala, R.; Sancho, J.; Sánchez, J.V.; Gómez, V.; Llinares, J.; Meseguer, F. Sound Attenuation by Sculpture. Nature 1995, 378, 241. [Google Scholar] [CrossRef]
- Sánchez-Pérez, J.V.; Caballero, D.; Mártinez-Sala, R.; Rubio, C.; Sánchez-Dehesa, J.; Meseguer, F.; Llinares, J.; Gálvez, F. Sound Attenuation by a Two-Dimensional Array of Rigid Cylinders. Phys. Rev. Lett. 1998, 80, 5325–5328. [Google Scholar] [CrossRef]
- Richards, D.; Pines, D.J. Passive Reduction of Gear Mesh Vibration Using a Periodic Drive Shaft. J. Sound Vib. 2003, 264, 317–342. [Google Scholar] [CrossRef]
- Davis, B.L.; Tomchek, A.S.; Flores, E.A.; Liu, L.; Hussein, M.I. Analysis of Periodicity Termination in Phononic Crystals. In Proceedings of the ASME 2011 International Mechanical Engineering Congress and Exposition, Denver, CO, USA, 11–17 November 2011; Volume 8, pp. 973–977. [Google Scholar]
- Policarpo, H.; Neves, M.M.; Ribeiro, A.M.R. Dynamical Response of a Multi-Laminated Periodic Bar: Analytical, Numerical and Experimental Study. Shock Vib. 2010, 17, 521–535. [Google Scholar] [CrossRef]
- Ashcroft, N.W.; Mermin, N.D. Solid State Physics; Saunders College Publishing: Fort Worth, TX, USA, 1976; pp. 614–641. ISBN 0030839939. [Google Scholar]
- Floquet, G. Sur les Équations Différentielles Linéaires à Coefficients Périodiques. Ann. Sci. l’École Norm. Supér. 1883, 12, 47–88. [Google Scholar] [CrossRef]
- Sigmund, O.; Jensen, J.S. Systematic Design of Phononic Band-Gap Materials and Structures by Topology Optimization. Philos. Trans. Math. Phys. Eng. Sci. 2003, 361, 1001–1019. [Google Scholar] [CrossRef] [PubMed]
- Hussein, M.I.; Hulbert, G.M.; Scott, R.A. Dispersive Elastodynamics of 1D Banded Materials and Structures: Analysis. J. Sound Vib. 2006, 289, 779–806. [Google Scholar] [CrossRef]
- Hussein, M.I.; Hulbert, G.M.; Scott, R.A. Dispersive Elastodynamics of 1D Banded Materials and Structures: Design. J. Sound Vib. 2007, 307, 865–893. [Google Scholar] [CrossRef]
- Hussein, M.I.; Hamza, K.; Hulbert, G.M.; Scott, R.A.; Saitou, K. Multiobjective Evolutionary Optimization of Periodic Layered Materials for Desired Wave Dispersion Characteristics. Struct. Multidiscip. Optim. 2006, 31, 60–75. [Google Scholar] [CrossRef]
- Diaz, A.R.; Haddow, A.G.; Ma, L. Design of Band-Gap Grid Structures. Struct. Multidiscip. Optim. 2005, 29, 418–431. [Google Scholar] [CrossRef]
- Policarpo, H.; Neves, M.M.; Maia, N.M.M. A Simple Method for the Determination of the Complex Modulus of Resilient Materials Using a Longitudinally Vibrating Three-Layer Specimen. J. Sound Vib. 2013, 332, 246–263. [Google Scholar] [CrossRef]
- Policarpo, H. Numerical and Experimental Models for Vibration Attenuation Using Cork Composite Materials. Ph.D. Thesis, Instituto Superior Técnico, Universidade de Lisboa, Lisbon, Portugal, 2013. [Google Scholar]
- Li, A.; Fan, Y.; Wu, Y.; Li, L.; Yi, K. Retuning the Disordered Periodic Structures by Sorting Unit Cells: Numerical Analyses and Experimental Studies. J. Sound Vib. 2023, 566, 117925. [Google Scholar] [CrossRef]
- Goto, A.M.; Nóbrega, E.D.; Pereira, F.N.; Dos Santos, J.M.C. Numerical and Experimental Investigation of Phononic Crystals via Wave-Based Higher-Order Rod Models. Int. J. Mech. Sci. 2020, 181, 105776. [Google Scholar] [CrossRef]
- Ribeiro, A.M.R.; Silva, J.M.M.; Maia, N.M.M. On the Generalisation of the Transmissibility Concept. Mech. Syst. Signal Process. 2000, 14, 29–35. [Google Scholar] [CrossRef]
- Maia, N.M.M.; Lage, Y.E.; Neves, M.M. Recent Advances on Force Identification in Structural Dynamics. In Advances in Vibration Engineering and Structural Dynamics; Beltran-Carbajal, F., Ed.; IntechOpen: Rijeka, Croatia, 2012. [Google Scholar]
- Joannopoulos, J.D.; Johnson, S.G.; Winn, J.N.; Meade, R.D. Photonic Crystals: Molding the Flow of Light, 2nd ed.; Princeton University Press: Princeton, NJ, USA, 2008; ISBN 9780691124568. [Google Scholar]
- Kosevich, A. On a Simple Model of the Photonic or Phononic Crystal. JETP Lett. 2001, 74, 559–563. [Google Scholar] [CrossRef][Green Version]
- Composites, A.C. VC5200 Material Data Sheet. Available online: https://amorimcorkcomposites.com/media/2342/vc5200.pdf (accessed on 6 May 2024).
Disclaimer/Publisher’s Note: The statements, opinions and data contained in all publications are solely those of the individual author(s) and contributor(s) and not of MDPI and/or the editor(s). MDPI and/or the editor(s) disclaim responsibility for any injury to people or property resulting from any ideas, methods, instructions or products referred to in the content. |
© 2024 by the authors. Licensee MDPI, Basel, Switzerland. This article is an open access article distributed under the terms and conditions of the Creative Commons Attribution (CC BY) license (https://creativecommons.org/licenses/by/4.0/).