Article

Implementation of Grey Wolf, Multi-Verse and Ant Lion Metaheuristic Algorithms for Optimizing Machinability of Dry CNC Turning of Annealed and Hardened UNIMAX® Tool Steel

by
Nikolaos A. Fountas
1,
Ioannis Papantoniou
2,
Dimitrios E. Manolakos
2 and
Nikolaos M. Vaxevanidis
1,*
1
Laboratory of Manufacturing Processes and Machine Tools (LMProMaT), Department of Mechanical Engineering Educators, School of Pedagogical and Technological Education (ASPETE), GR 151 22 Amarousion, Greece
2
School of Mechanical Engineering, National Technical University of Athens, GR 157 80 Zografou, Greece
*
Author to whom correspondence should be addressed.
Machines 2024, 12(3), 156; https://doi.org/10.3390/machines12030156
Submission received: 23 January 2024 / Revised: 18 February 2024 / Accepted: 22 February 2024 / Published: 24 February 2024

Abstract

:
Advances in machining technology and materials science impose the identification of optimal settings for process-related parameters to maintain high quality and process efficiency. Given the available resources, manufacturers should determine an advantageous process parameter range for their settings. In this work, the machinability of a special tool steel (UNIMAX® by Uddeholm, Sweden) under dry CNC turning is investigated. The working material is examined under two states; annealed and hardened. As major machinability indicators, main cutting force Fz (N) and mean surface roughness Ra (μm) were selected and studied under different values for the cutting conditions of cutting speed, feed rate, and depth of cut. A systematic experimental design was established as per the response surface methodology (RSM). The experimental design involved twenty base runs with eight cube points, four center points in the cube, six axial points, and two center points in the axial direction. Corresponding statistical analysis was based on analysis of variance and normal probability plots for residuals. Two regression models referring to main cutting force and surface roughness for both the annealed and hardened states of the material were developed and used as objective functions for subsequent evaluations by three modern meta-heuristics under the goal of machinability optimization, namely multi-objective grey wolf algorithm, multi-objective multi-verse algorithm and multi-objective ant lion algorithm. All algorithms were found capable of providing beneficial Pareto-optimal solutions for both main cutting force and surface roughness simultaneously whilst regression models achieved high correlation among input variables and optimization responses.

1. Introduction

Cold-work tool steels constitute the majority of materials used for numerous industrial applications, where the temperature is below 200 °C. Typical mechanical properties of cold-work tool steels have high hardness [1,2], high wear resistance, and good toughness and compressive strength [3]. As major alloying elements for tool steels, carbon and carbide-forming elements such as Cr, Mo, V, and W are used. Carbon content may typically vary from 0.5 to 2.5 wt.% C and other values, whilst other alloying elements may vary from 1 to 13 wt.%. Representative examples of commercially available tool steels are AISI H13 (ORVAR®), CALMAX®, Sverker® 21, and UNIMAX® to name a few. UNIMAX® is a high-hardness electro-slag, remelted tool steel which provides great wear resistance even over extended working timespans at elevated temperatures. As such, it is suitable for coating and nitriding. UNIMAX® performs very well in the precision forging, hot stamping, and molding of reinforced plastics. In this process, a conventionally solidified ingot is used as an electrode and slag is placed at the bottom of the furnace. Heat is produced when a high AC current is passed from the electrode to the slag. Due to the high electrical resistivity of the slag, it melts first. The electrode starts melting when it is submerged in the molten bath of slag. The molten steel and the slag are contained in a copper mold which is cooled by water. The droplets of molten steel are denser than the slag and hence pass through it. They are collected in the pool of molten steel which solidifies with time. The highly reactive slag used in the electro-slag remelting operation removes the oxide inclusions and reduces the sulfur content [4]. In contrast to the “up-hill casting” technique [4,5] the higher solidification rate achieved in electro-slag remelting reduces carbide banding, carbide size and grain size. In most applications, special tool steels may be used after proper heat treatment in controlled environments. The typical range for heat treatment is between 45 to 65 HRC [6]. Since most of these materials are difficult to machine, a significant number of research contributions have been devoted for investigating the machinability indicators and different manufacturing processes, i.e., cutting forces and surface roughness [7,8,9,10,11]. All special engineering alloys, including UNIMAX®, require the proper selection of cutting tool materials, especially in the case of finish machining. Noticeable contributions in the field have reported the usage of cubic boron nitride tools and polycrystalline diamond tools in the form of cutting inserts. Such materials are mandatory for maintaining surface finish and accuracy. The rationale behind their selection is the fact that ordinary cutting materials do not sustain their chemical stability during the machining process; they exhibit rapid tool wear owing to high temperatures and strong adhesion. Cutting tool selection should also be based on proper geometry according to the machining stage. Normally, hard-turning cutting inserts have an 0.8 mm tool tip radius whilst those used for finish-turning have a smaller tool tip radius equal to 0.4 mm. Even though these conventional geometries have been widely applicable, they may restrict productivity or deteriorate quality owing to the narrow range for selecting feed rates. A cutting insert with large tool tip radius will maintain surface quality, but it will lead to higher cutting forces and chattering. On the contrary, cutting inserts with smaller radii will reduce cutting force, but they dramatically restrict the applicable range of feed rate selection for maintaining a good surface finish. To balance this trade-off between productivity and surface finish, wiper geometries for cutting inserts have been developed to provide an alternative to high surface finish [12,13,14,15,16,17,18,19,20,21,22,23]. Undoubtedly, every manufacturing process is affected by its corresponding process parameters. To determine feasible or even advantageous settings for process parameters, handbooks and cutting tool catalogues are available to practitioners to select specific values from a constrained applicable range. However, such recommended ranges for setting process parameters are far from being optimal to satisfy performance metrics. In addition, with new developments and novel aspects concerning modern materials, such recommendations are yet to be provided. Based on this context, artificial intelligence and soft computing techniques [24,25,26,27,28,29,30] are continuously implemented to provide advantageous solutions to almost any manufacturing process.
This work investigates the effect of rotational speed, feed rate, and depth of cut on main cutting force and surface roughness during the dry CNC turning of UNIMAX® tool steel (Uddeholm-Sweden) under two discrete states; one soft annealed to approximately 180 HB/10 HRC (delivery condition) and one hardened to approximately 513–534 HB/53–54 HRC. Statistical outputs are further examined to create robust regression models and utilize them as objective functions to optimize the dry CNC turning process for UNIMAX® tool steel. As regards this particular material, research results have yet to be presented to facilitate industrial applications. The work contributes to practical decision-making when it comes to the selection of optimal cutting parameters for the CNC turning of UNIMAX® tool steel in soft-annealed and hardened conditions with a predetermined hardness range. The results come with the novel aspect of generally implementing several variants of new intelligent algorithms for optimizing the CNC turning operations of difficult-to-cut materials and alloys such as the one studied in the current work.

2. Materials and Methods

2.1. Design of Experiments

Aiming at examining the influence of the independent variables n (rpm), f (mm/rev), and a (mm) on the responses of the Fz (N) and Ra (μm) experiments, CNC turning experiments were executed considering the experimental protocol. Central composite design (CCD) is an important approach in response surface methodology (RSM). It allows for determining the corner, axial, and center points of the design and therefore it can lead to more controllable solution domains for fitting a second-order regression model. However, the CCD approach has the drawback of involving a relatively large number of experimental runs owing to experimental replicates. As a result, the CCD method would be better selected when the number of independent variables is low (i.e., three parameters). In the current study, the three independent parameters give a reasonable number of experimental runs. By maintaining uniform accuracy for three-factor experimentation, 8 factorial points, 6 axial points, and 6 center runs, 20 experimental runs were generated. The experimental design is summarized in Table 1. Note that spindle speed n (rpm) is not considered as a main cutting condition parameter, and cutting speed, Vc (m/min), which is the peripheral speed of the workpiece, should be taken into account instead or at least to accompany the resulting rotational speed given the initial diameter of the workpiece. Consequently Table 1 gives the three levels of cutting speed Vc (m/min) corresponding to the spindle speed’s experimental levels.
UNIMAX® tool steel of the known Swedish manufacturer Uddeholm® was used in its delivery condition, i.e., 180 HB (10 HRC) and in a hardened state with a hardness equal to 513–534 HB (53–54 HRC). Two pre-machined rods, 30 mm in diameter, 300 mm length, having ten discrete zones separated by 5 mm grooves were used for the main experiments for ensuring chip removal (Figure 1). Figure 1a illustrates a pre-processed and a finished rod whilst Figure 1b depicts the CBN wiper cutting insert that was used (SECO® TNGA332S-00820-L1-C, CBN200) held on a PTJNR 2525M16 insert holder. The surface roughness of the initial samples was found to be equal to 2.26 and 1.87 for the “as received” and “hardened” material conditions, respectively.
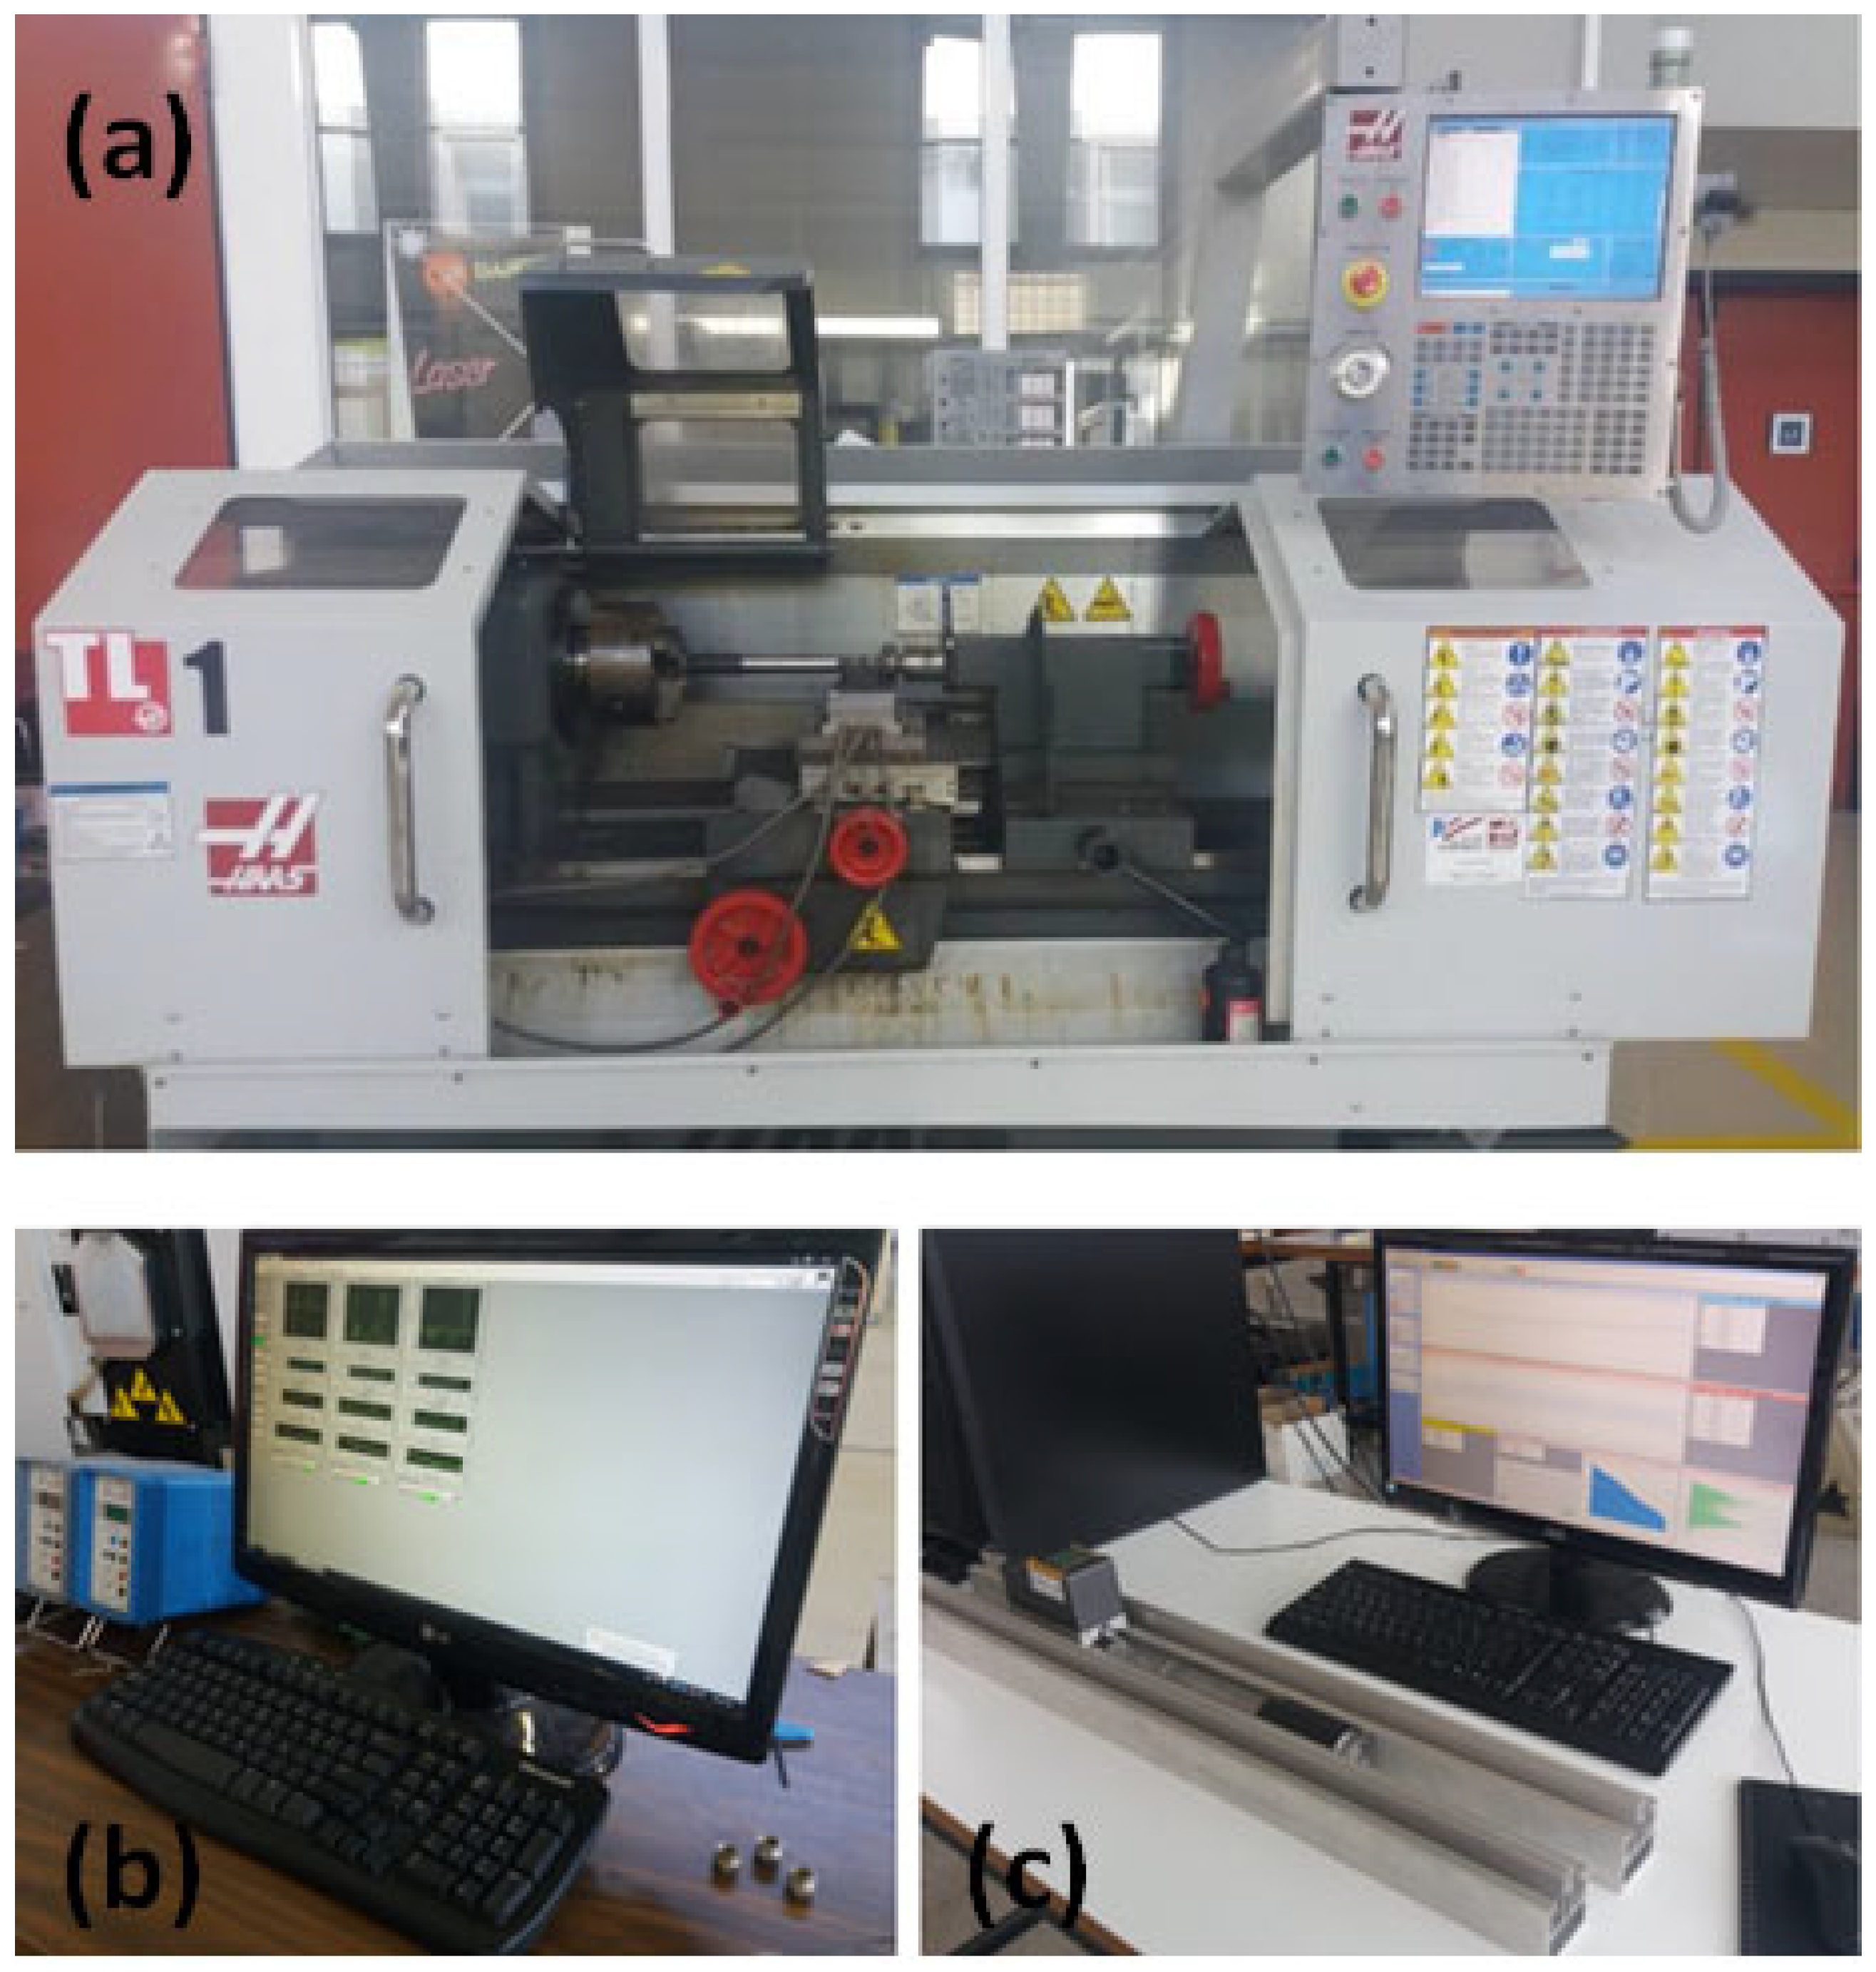
The machining experiments were conducted using a HAAS® TL-1 CNC turning center (Figure 2a). The CNC turning center was equipped with a three-component KISTLER® dynamometer accompanied with its corresponding data acquisition interface (Labview® module) to collect online measurements for the three components of cutting forces (Figure 2b). The TESA® Rugosurf 10-G portable roughness tester (Figure 2c) was used for collecting the measurements for mean surface roughness Ra (μm).

2.2. Experimental Results

The actual measurements of main cutting force Fz, were further examined to compute the average values from raw data. The average values from the meaningful regions (i.e., where high cutting force signals occurred) were calculated to establish the first response. To examine surface roughness, each cutting zone was measured three times on the periphery of the work piece at an angle of 120° and the mean value was kept to represent the final result. To distinguish the two material conditions of the working material, the terms “AR” and “HRD” were adopted. The former term refers to the “as received” (annealed) state of UNIMAX®, whereas the latter (HRD) corresponds to the hardened material condition. The asterisk “*” in the experimental results denotes the corrected values in the response surface experiments based on the CCD design. The effect of the machining parameters as well as the error estimation were studied using analysis of variance (ANOVA). The results for the two responses of Fz and Ra referring to both material conditions of the examined UNIMAX® steel are summarized in Table 2.
MINITAB® R17 software was used to statistically analyze the experimental data. The regression models generated as per the full quadratic response surface regression depiction are shown in Equation (1) up to Equation (4) for Fz-AR (N), Fz-HRD (N), Ra-AR (μm) and Ra-HRD (μm), respectively.
Fz-AR (N) = −1617 + 1.589 × n + 1811 × f + 687 × a − 0.000423 × n2−6018 × f2−180.3 × a2 + 0.014 × n × f − 0.1387 ×
n × a + 595 × f × a
Fz-HRD (N) = −1282 + 1.305 × n + 2025 × f + 538 × a − 0.000380 × n2−7105 × f2−184.3 × a2 + 0.074 × n × f − 0.0306 ×
n × a + 905 × f × a
Ra-AR (μm) = −5.09 + 0.0116 × n − 26.3 × f + 1.65 × a − 3 × 10⁻⁵ × n2 + 186.1 × f2 − 0.251 × a2 − 0.0002 × n × f
0.00048 × n × a − 1.43 × f × a
Ra-HRD (μm) = −9.18 + 0.01259 × n−29.5 × f + 1.88 × a − 4 × 10⁻⁵ × n2 + 218.0 × f2−0.317 × a2 − 0.0004 × n × f
0.00052 × n × a −1.61 × f × a
Table 3, Table 4, Table 5 and Table 6 summarize the results obtained by the analysis of variance (ANOVA) with reference to the experimental results. In the ANOVA, a result of less than 0.05 for the p-value suggests that the corresponding independent variable is significant. When it comes to lack-of-fit, the p-value must be greater than 0.05 to exhibit insignificance. An insignificant lack-of-fit is preferred, suggesting a negligible error contribution to the model.
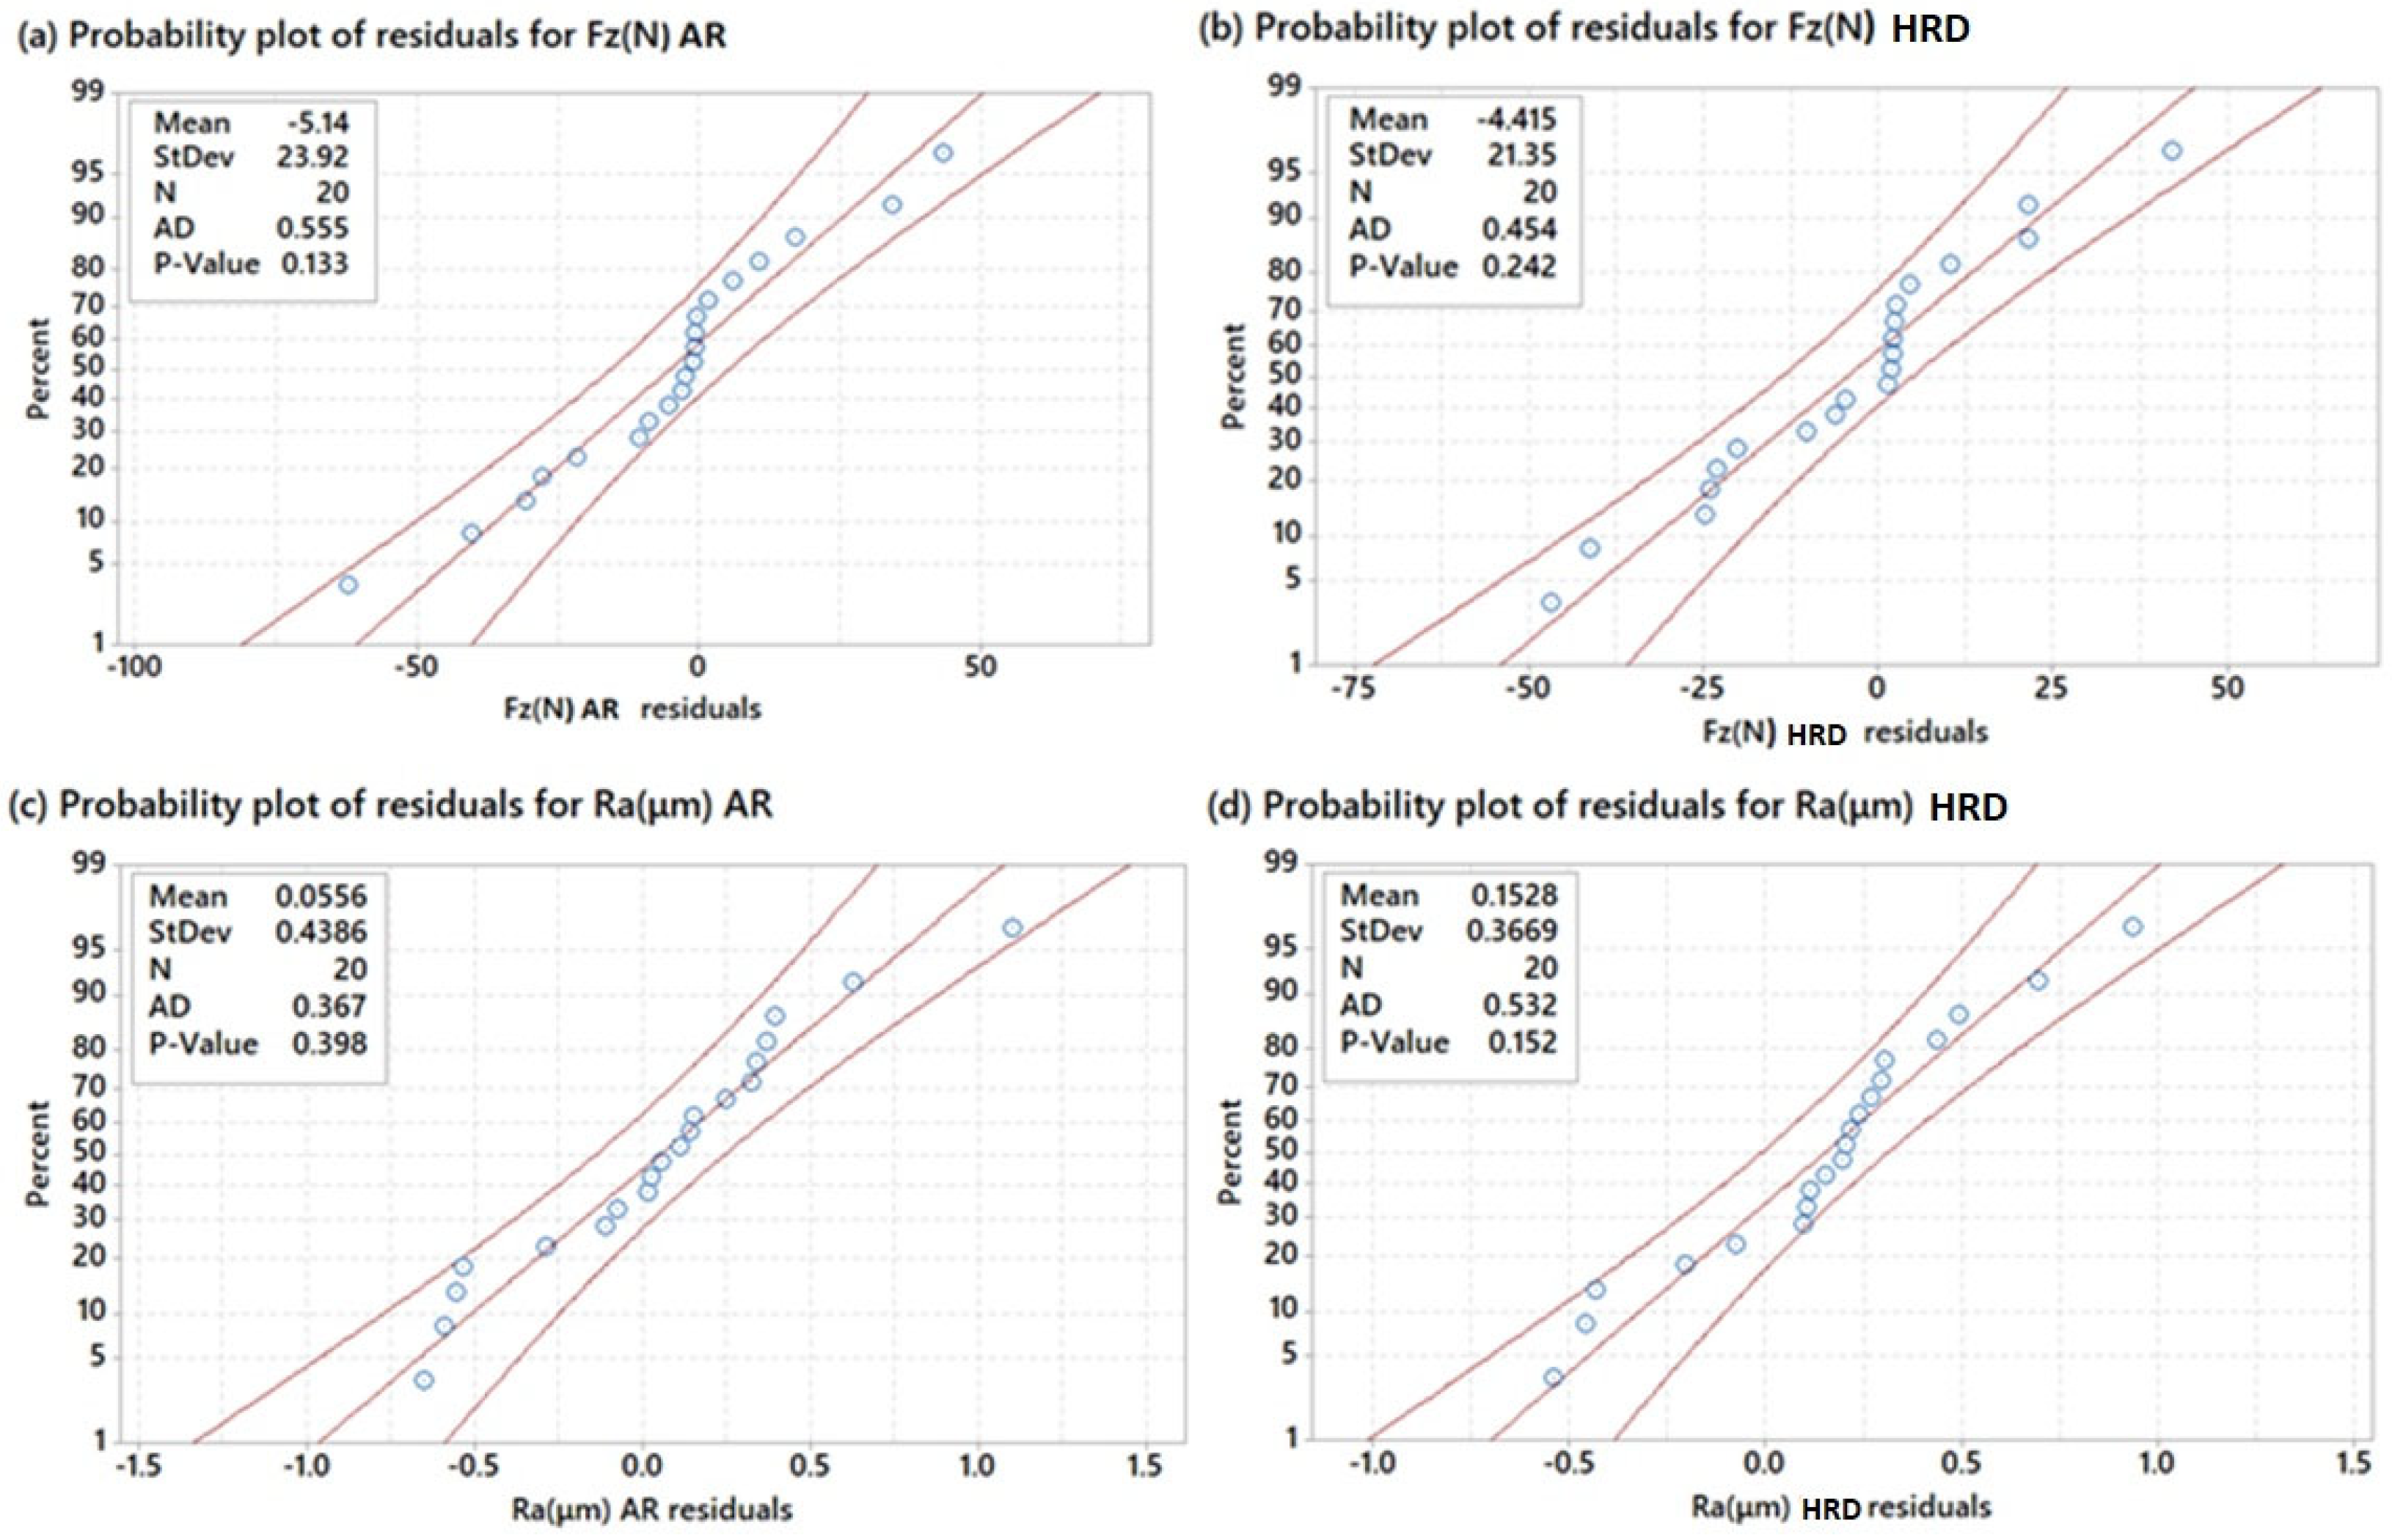
The Anderson–Darling normality test is used to validate the generated models’ suitability referring to the Fz (N) and Ra (μm) responses. In the Anderson–Darling test, if p is lower than the selected significance level (c.i. = 0.05), the data fails to follow a normal distribution. In this study, the ANOVA results for the generated quadratic models, indicate that the models are suitable for predicting Fz (N) and Ra (μm). The coefficient of determination (R2) indicates the percentage of total variation in the response explained by the terms in the models. In the study, the ANOVA shows that after examining the residuals for all four quadratic models referring to both material hardness conditions of UNIMAX®, they are considered suitable for predicting Fz (N) and Ra (μm) with quite high contributions, i.e., 93.97% for the main cutting force plot of the “AR” material condition, 95.10% for the main cutting force plot of the “HRD” material condition, and 92.12% and 95.47% for surface roughness in the “AR” and the “HRD” conditions, respectively. p-values for lack-of-fit are beyond 0.05 (Figure 3).
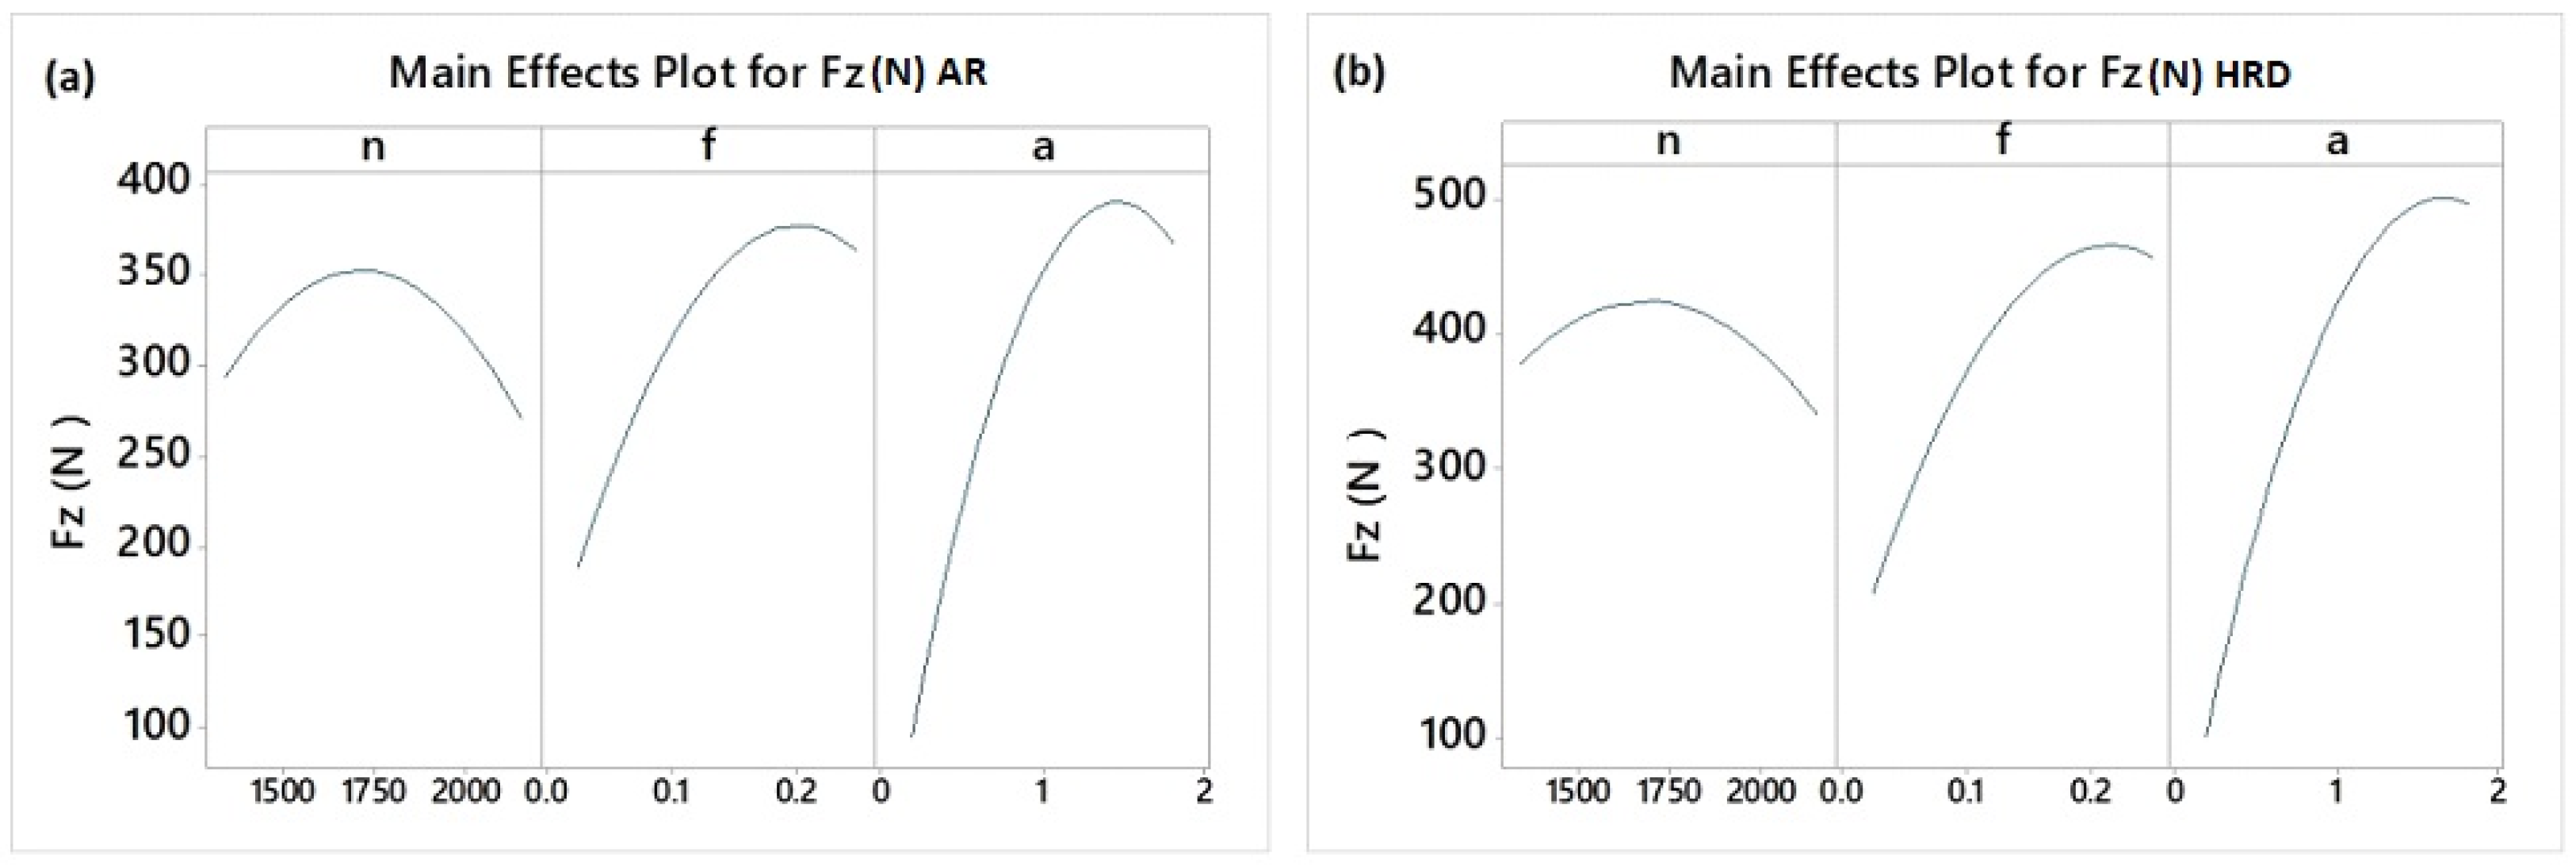
With reference to the p-value for parameter effects, it has been concluded that in both the cases of the annealed and the hardened UNIMAX® conditions, main cutting force Fz (N) is mainly influenced by the linear terms, followed by the square terms and the interaction terms. Specifically, for cutting force Fz, the linear terms in “AR” case of UNIMAX® are 68.59% significant, followed by the square terms with 22.48% and 2-way interactions with 3.19%. Lack-of-fit error contributes as much as 6.03%. Similarly, for cutting force Fz, the linear terms in the “HRD” case of UNIMAX® are 80.59% significant, followed by the square terms with 14.15% and 2-way interactions with 2.69%. Lack-of-fit error contributes as much as 2.58%. In both cases for Fz, depth of cut primarily affects Fz, followed by feed rate and spindle speed. When it comes to surface roughness, the linear terms in the “AR” case of UNIMAX® are 65.55% significant, followed by the square terms with 26.46% and 2-way interactions with 0.11%. Lack-of-fit error contributes as much as 7.50%. Similarly, the linear terms in the “HRD” case of UNIMAX® are 69.62% significant, followed by the square terms with 25.76% and 2-way interactions with 0.11%. Lack-of-fit error contributes as much as 4.01%. In both cases for Ra, feed rate primarily affects Ra, followed by spindle speed and depth of cut. By examining the individual effects of each process parameter on the responses of main cutting force Fz and surface roughness Ra, the following results are observed. Referring to the main effects of the parameters concerning main cutting force Fz, depth of cut a (mm) has the largest effect on main cutting force Fz (N), followed by feed rate f (mm/rev) and rotational speed n (rpm) in both hardness conditions of UNIMAX®. Main cutting force gradually increases with the increase in all three parameters, with emphasis on depth of cut a (mm). Main cutting force reaches high values at middle levels of rotational speed, and high levels for feed rate and depth of cut, while main cutting force is higher in the case of the hardened condition of UNIMAX®. Figure 4a depicts the main effects of process parameters on the main cutting force in the “AR” case (material “as received”) and Figure 4b depicts the main effects of process parameters on the main cutting force in the “HRD” case (material “hardened”).
As far as the main effects of process parameters on surface roughness Ra are concerned, feed rate f (mm/rev) has the largest effect on the response of surface roughness Ra (μm) in both material conditions of UNIMAX. The most advantageous values for roughness are exhibited at middle levels of feed rate, i.e., 0.2 mm/rev. Surface roughness gradually increases with an increase in rotational speed (1750 rpm) and then becomes lower for n = 2000 rpm. Depth of cut does not seem to affect surface roughness. Figure 5a depicts the main effects of process parameters on surface roughness in the “AR” case (material “as received”) whereas Figure 5b depicts the main effects of process parameters on surface roughness in the “HRD” case (material “hardened”).
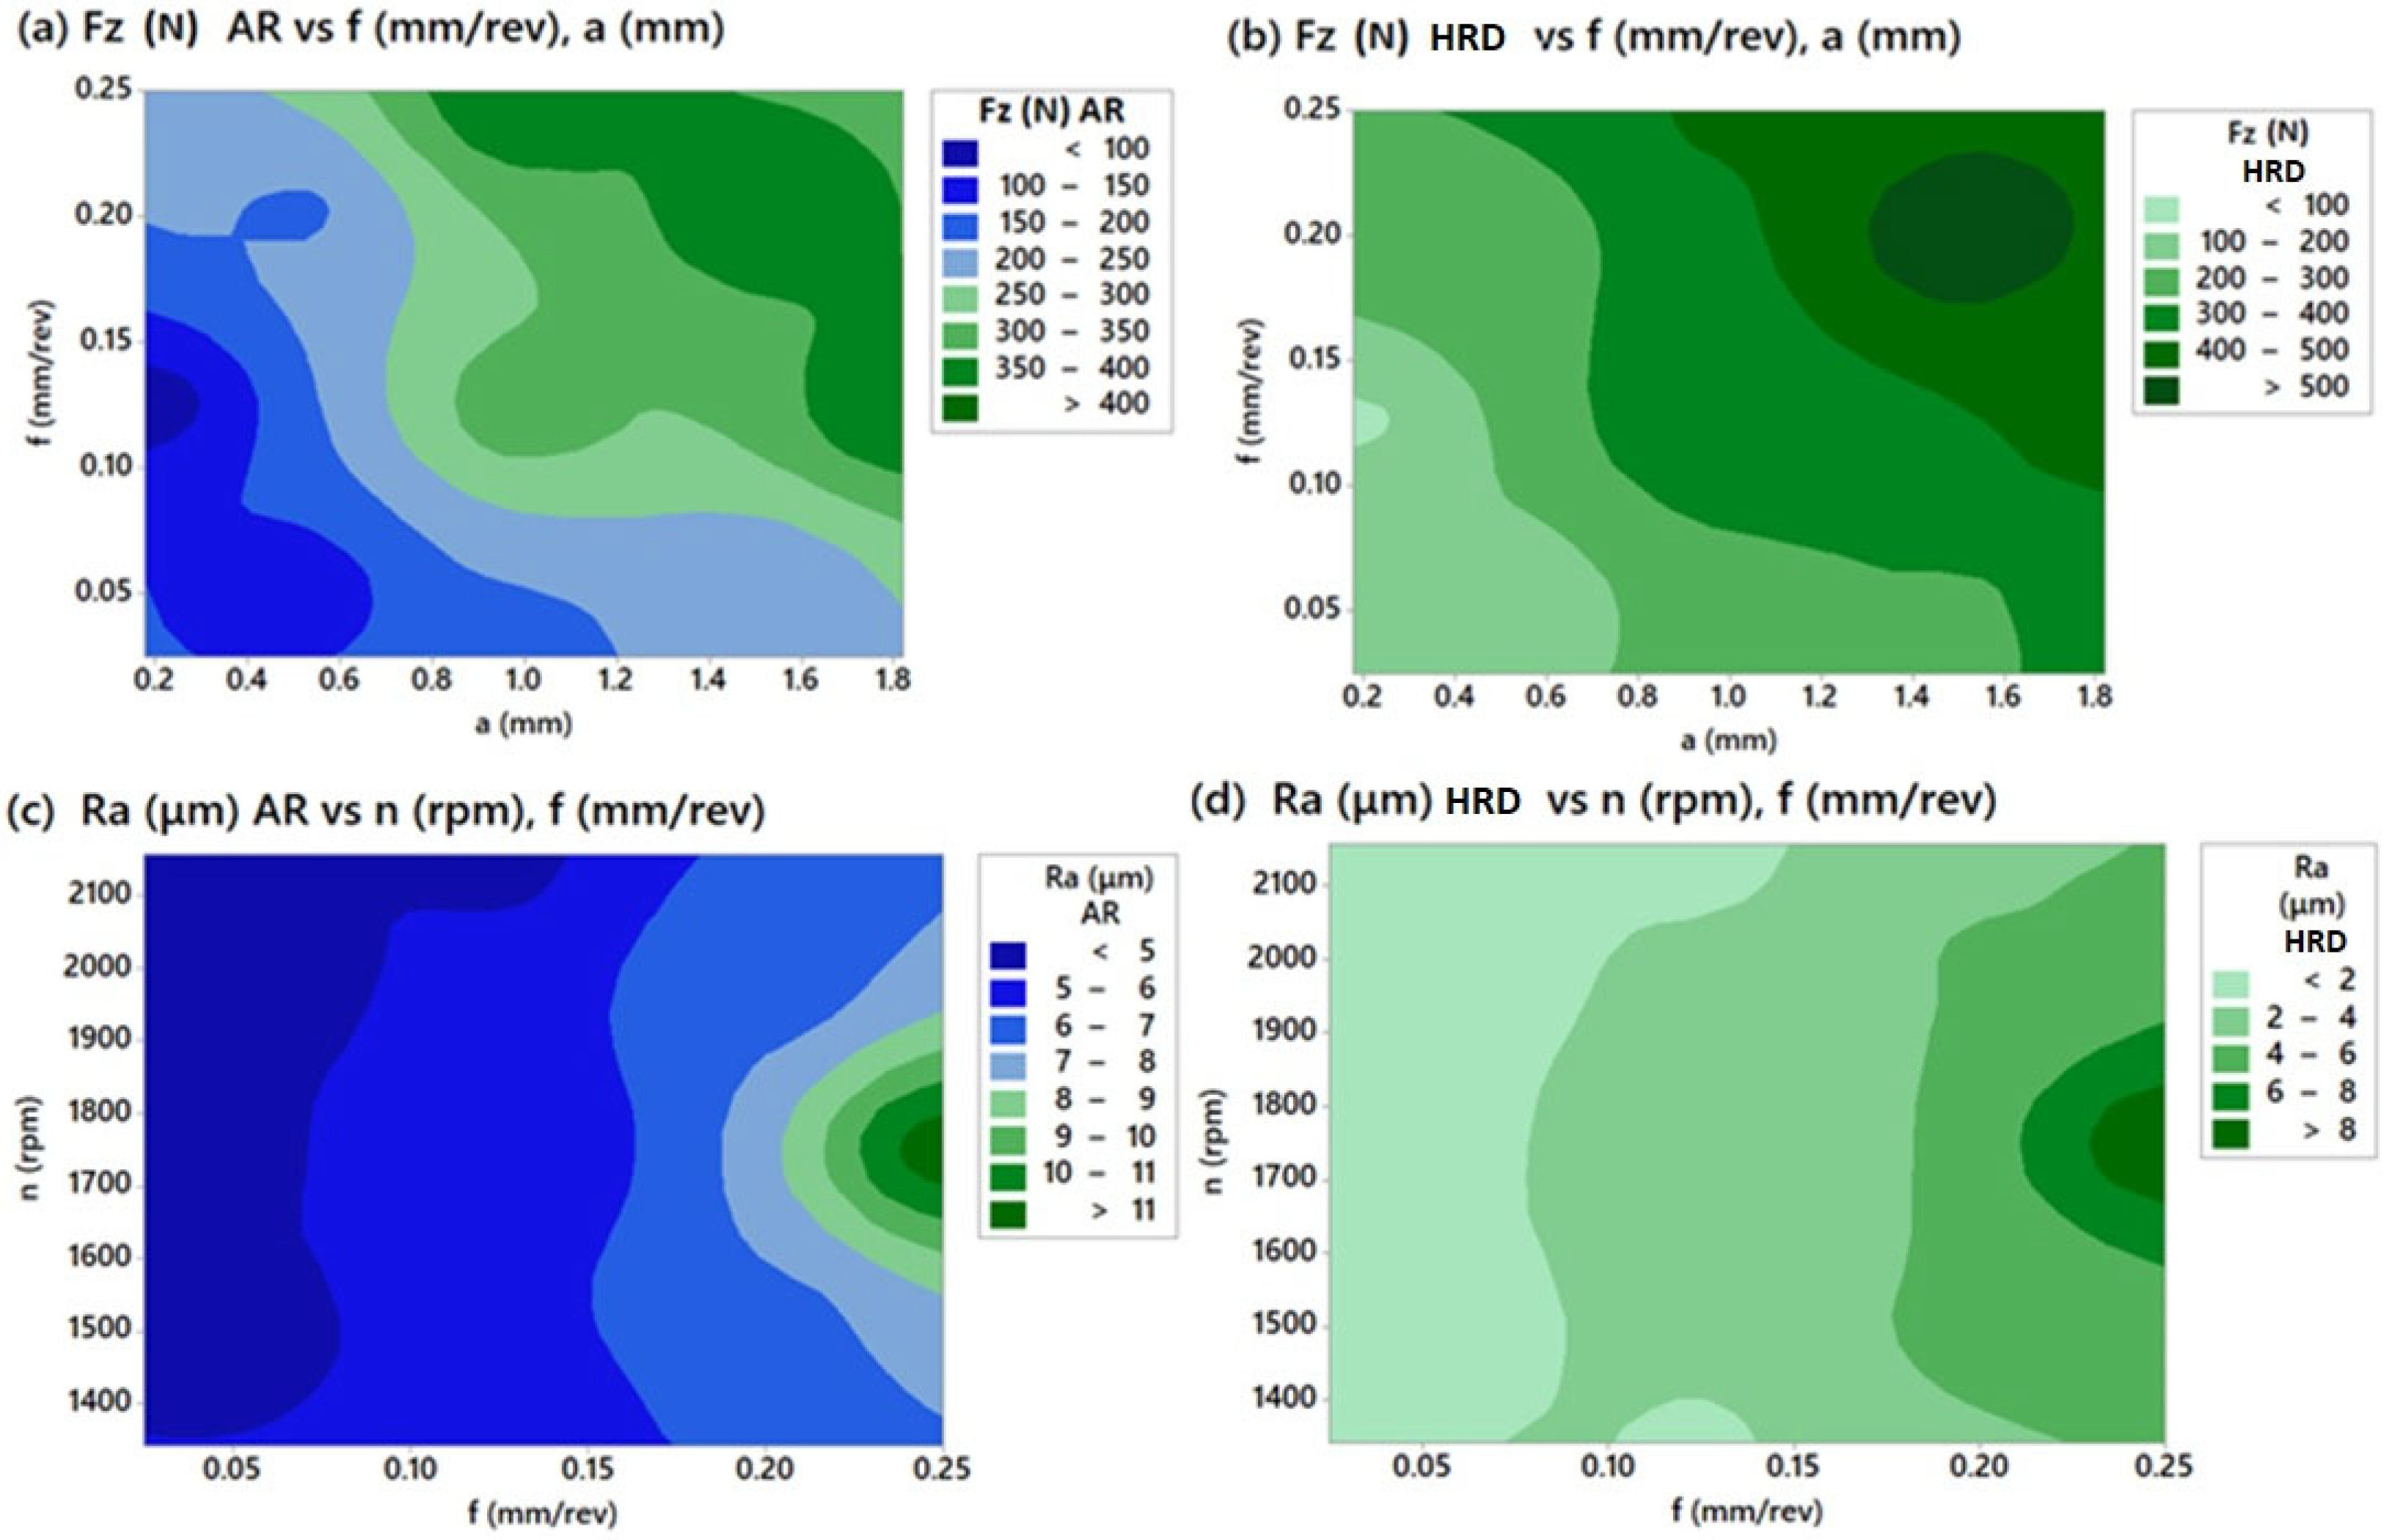
Contour plots are an alternative depiction of 3D surfaces on a 2D illustration. They involve two predictors (parameters) on the X and Y axes whilst the response is shown on the Z axis in the form of a contour. Representative contour plots for Fz and Ra responses were created to show their variability as functions of different pairs of independent variables. Figure 6 shows the resulting changes in main cutting force and surface roughness when altering the two most influential process parameters regarding the response under examination, i.e., feed rate with depth of cut for Fz and feed rate with spindle speed for Ra.
It is clear that f (mm/rev) and a (mm) yield the largest effect on Fz (N) referring to both material conditions. Main cutting force is maintained at low levels if moderate feeds are applied in combination with low-to-moderate depths of cut. Main cutting force reaches its highest value close to the highest feed rate levels and depth of cut. Figure 7 depicts the resulting tool wear by using the cutting parameter values of the 7th experimental run (Table 1; n = 1500 rpm, f = 0.2 mm/rev, a = 1.5 mm) for the HRD condition of UNIMAX® tool steel. It is shown that severe abrasion and extensive tool wear are exerted on the insert’s tool nose owing to high levels of feed and linear speed where more heat dissipates into the working sample during CNC dry turning.
Surface roughness is maintained at moderate to high spindle speeds, with low-to-moderate feeds, while higher values for spindle may be used only in combination to moderate feeds to avoid excessive tool wear, mainly referring to the hardened “HRD” UNIMAX® condition.

3. Multi-Objective Optimization

For both UNIMAX® tool steel conditions, two bi-objective optimization problems have been formulated and solved using three modern meta-heuristics, namely the multi-objective grey wolf algorithm, MOGWO [28], the multi-verse optimization algorithm MOMVO, [29] and the multi-objective ant lion algorithm, MOALO [30]. Fz and Ra are the two optimization objectives with respect to the three cutting conditions of n (rpm), f (mm/rev), and a (mm). The solution domain has been created by adhering to the same parameter low-high levels whilst each candidate solution is a vector corresponding to the values of three machining parameters within their predefined ranges. The two problems were examined with respect to the default settings for algorithm-specific parameters by applying 20 individuals and 1000 generations as the maximum number for evaluations. The simulations were run in MATLAB® 2014b. For all three algorithms, 50 results for the non-dominated solutions were stored. Figure 7 depicts the strongest non-dominated solutions set observed by conducting a series of independent runs to examine the variability in the optimal solutions. All three algorithms managed to obtain a uniform set of non-dominated solutions that cover most of the experimental region. Figure 8a depicts the non-dominated optimal solutions obtained by the algorithms in the case of the “AR” UNIMAX® condition. MOGWO managed to cover almost the entire Pareto space by providing all types of solutions, with others favoring either cutting force or surface roughness. MOMVO and MOALO provided denser solution sets with emphasis on the center of the Pareto fronts. This is the region where both objectives are facilitated, and their trade-off is balanced. Figure 8b depicts the non-dominated optimal solutions obtained by the algorithms in the case of the “HRD” hardened UNIMAX® condition.
By observing the Pareto fronts, the better coverage and spread of the non-dominated solutions are shown. MOGWO managed to obtain a Pareto front of solutions with the largest spread covering the entire experimental space. The majority of the solutions obtained by MOMVO and MOALO cover the center of Pareto region where both objectives are favored. In general, all algorithms have managed to provide beneficial solutions for optimizing the CNC turning of UNIMAX® tool steel for both examined material conditions. However, noticeable observations lead to the conclusion that the MOALO algorithm exhibited the best performance from the perspective that its corresponding non-dominated solutions occupy the central region of the Pareto front as mentioned, whilst very few solutions are shown to exist on maximized results referring to the Fz and Ra axes. This implies that the MOALO algorithm managed to maintain an efficient balance between cutting force and surface roughness, and this is justified by the indications of low cutting force results with a simultaneous minimization of surface roughness. Each of the algorithms achieved better results from a different perspective or performance metric, allowing an engineer to select a solution according to the specific needs and interest in terms of machinability requirements. Therefore, it is the job of the end user to decide which of these solutions should be implemented regarding production needs and priorities in terms of machining objectives.

4. Conclusions

In this study, the effect of CNC turning parameters, namely, spindle speed n, feed rate f, and depth of cut a was examined by considering main cutting force Fz and surface roughness Ra as major machinability responses. This research refers to two conditions of the UNIMAX® tool steel: as-received (soft-annealed, 10 HRC) and hardened (53–54 HRC). Response surface methodology was adopted to establish the experimental design under the central composite design (CCD) approach. ANOVA and regression analysis were the two key statistical tools that were used to interpret the results. Normal probability and contour plots were investigated to study the variability of the effects of independent turning parameters. The experimental results were further used for generating regression models that served as objective functions for optimizing the objectives of Fz and Ra using three cutting-edge intelligent algorithms, namely, MOGWO, MOMVO, and MOALO. The findings of the study are summarized as follows:
  • When finish-turning the UNIMAX® in its hardened “HRD” condition, main cutting force Fz is approximately 19% larger than the one corresponding to the “AR” (soft-annealed) state. Yet, surface roughness is reduced to 47.1% providing a superior surface finish.
  • According to the analysis of variance, the hierarchy of the effects of the cutting parameters in terms of cutting force suggests the linear terms, the square terms, and finally the interaction terms, regardless of the material conditions.
  • Depth of cut and feed rate are influential cutting parameters for main cutting force, whilst feed rate and spindle speed are influential cutting parameters for surface roughness, regardless of the material conditions. Both objectives of main cutting force Fz and surface roughness Ra alter their experimental trends from one condition to another with quite high complexity. This can justify the implementation of intelligent algorithms to solve multi-objective optimization problems.
  • There is no clear superiority in the application of multi-objective intelligent algorithms to this case of the machinability optimization problem. However, the different algorithms may exhibit different performance behavior affecting computational costs depending on the problem under question. Algorithms should be tested by conducting several evaluations and examining their statistical outputs to gain a clear understanding of their performance. Final selections for the settings of advantageous machining parameters to facilitate all objectives under study should be based on requirements corresponding to the production and shop floor’s resources.

Author Contributions

Conceptualization, N.A.F. and N.M.V.; methodology, N.A.F. and N.M.V.; software, N.A.F. and I.P.; validation, N.A.F. and I.P.; formal analysis, N.A.F. and I.P.; investigation, N.A.F. and I.P.; resources, N.M.V. and D.E.M.; data curation, N.A.F., I.P., and N.M.V.; writing—original draft preparation, N.A.F.; writing—review and editing, N.A.F., I.P., and N.M.V.; visualization, N.M.V.; supervision, N.M.V. and D.E.M.; project administration, D.E.M. and N.M.V. All authors have read and agreed to the published version of the manuscript.

Funding

This research received no external funding.

Data Availability Statement

Data are contained within the article.

Conflicts of Interest

The authors declare no conflicts of interest.

References

  1. Ezugwu, E.O.; Da Silva, R.B.; Bonney, J.; Machado, A.R. Evaluation of the performance of CBN tools when turning Ti–6Al–4V alloy with high pressure coolant supplies. Int. J. Mach. Tools Manuf. 2005, 45, 1009–1014. [Google Scholar] [CrossRef]
  2. Armendia, M.; Garay, A.; Iriarte, L.M.; Arrazola, P.J. Comparison of the machinabilities of Ti6Al4V and TIMETAL® 54M using uncoated WC–Co tools. J. Mater. Process. Technol. 2010, 210, 197–203. [Google Scholar] [CrossRef]
  3. Kalpakjian, S.; Schmid, S.R. Manufacturing Processes for Engineering Materials, 6th ed.; Pearson: London, UK, 2022. [Google Scholar]
  4. Hoyle, G. Electroslag Processes: Principles and Practice; Applied Science: London, UK, 1983. [Google Scholar]
  5. Roberts, G.; Kraus, G.; Kennedy, R. Tool Steel, 5th ed.; ASM International: Materials Park, OH, USA, 2000. [Google Scholar]
  6. Kumar, P.; Chauhan, S.R. Machinability Study on Finish Turning of AISI H13 Hot Working Die Tool Steel with Cubic Boron Nitride (CBN) Cutting Tool Inserts Using Response Surface Methodology (RSM). Arab. J. Sci. Technol. 2015, 40, 1471–1485. [Google Scholar] [CrossRef]
  7. Boy, M.; Yaşar, N.; Çiftçi, İ. Experimental investigation and modelling of surface roughness and resultant cutting force in hard turning of AISI H13 Steel. IOP Conf. Ser. Mater. Sci. Eng. 2016, 161, 012039. [Google Scholar] [CrossRef]
  8. Hosseini, A.; Hussein, M.; Kishawy, H.A. On the machinability of die/mold D2 steel material. Int. J. Adv. Manuf. Technol. 2016, 85, 735–740. [Google Scholar] [CrossRef]
  9. Elbestawi, M.A.; Chen, L.; Becze, C.E.; El-Wardany, T.I. High-speed milling of dies and molds in their hardened state. CIRP Ann. 1997, 46, 57–62. [Google Scholar] [CrossRef]
  10. Abbas, A.T.; El Rayes, M.M.; Luqman, M.M.; Naeim, N.; Hegab, H.; Elkaseer, A. On the Assessment of Surface Quality and Productivity Aspects in Precision Hard Turning of AISI 4340 Steel Alloy: Relative Performance of Wiper vs. Conventional Inserts. Materials 2020, 20, 2036. [Google Scholar] [CrossRef]
  11. Ghani, M.U.; Abukhashim, N.A.; Sheikh, M.A. An investigation of heat partition and tool wear in hard turning of H13 tool steel with CBN cutting tools. Int. J. Adv. Manuf. Technol. 2008, 39, 874–888. [Google Scholar] [CrossRef]
  12. Outeiro, J.C. Surface integrity predictions and optimisation of machining conditions in the turning of AISI H13 tool steel. Int. J. Mach. Mach. Mater. 2014, 15, 122–134. [Google Scholar] [CrossRef]
  13. Pathak, H.; Das, S.; Doley, R.; Kashyap, S. Optimization of Cutting Parameters for AISI H13 Tool Steel by Taguchi Method and Artificial Neural Network. Int. J. Mater. Form. Mach. Process. 2015, 2, 47–65. [Google Scholar] [CrossRef]
  14. Mia, M.; Królczyk, G.; Maruda, R.; Wojciechowski, S. Intelligent Optimization of Hard-Turning Parameters Using Evolutionary Algorithms for Smart Manufacturing. Materials 2019, 12, 879. [Google Scholar] [CrossRef]
  15. Kumar, A.; Pradhan, S.K. Investigations into hard turning process using wiper tool inserts. Proc. Mater. Today 2018, 5 Pt 2, 12579–12587. [Google Scholar] [CrossRef]
  16. Schaal, N.; Wegener, K. Comparison of ground and laser machined wiper geometry on carbide inserts for high performance finishing. Proc. CIRP 2016, 46, 623–626. [Google Scholar] [CrossRef]
  17. D’Addona, D.M.; Raykar, S.J. Analysis of surface roughness in hard turning using wiper insert geometry. Proc. CIRP 2016, 41, 841–846. [Google Scholar] [CrossRef]
  18. M’Saoubi, R.; Guddat, J.; Alm, P.; Meyer, D. Hard turning of AISI 52100 using PCBN wiper geometry inserts and the resulting surface integrity. Proc. Eng. 2011, 19, 118–124. [Google Scholar]
  19. Balestrassi, P.P.; Paiva, E.J.; Lopes, L.G.D.; Ferreira, J.R.; Campos, P.H.; Paiva, A.P. A multivariate robust parameter design approach for optimization of AISI 52100 hardened steel turning with wiper mixed ceramic tool. Int. J. Refract. Met. Hard Mater. 2012, 30, 152–163. [Google Scholar]
  20. Gaitonde, V.N.; Karnik, S.R.; Figueira, L.; Davim, J.P. Performance comparison of conventional and wiper ceramic inserts in hard turning through artificial neural network modeling. Int. J. Adv. Manuf. Technol. 2011, 52, 101–114. [Google Scholar] [CrossRef]
  21. Kurniawan, D.; Noordin, M.Y.; Sharif, S. Hard machining of stainless steel using wiper coated carbide: Tool life and surface integrity. J. Mater. Manuf. Process. 2010, 25, 370–377. [Google Scholar] [CrossRef]
  22. Gaitonde, V.N.; Karnik, S.R.; Figueira, L.; Davim, J.P. Machinability investigations in hard turning of AISI D2 cold work tool steel with conventional and wiper ceramic inserts. Int. J. Refract. Met. Hard Mater. 2009, 27, 754–763. [Google Scholar] [CrossRef]
  23. He, X.; Wu, S.; Kratz, H. Forces in Hard Turning of 51CrV4 with Wiper Cutting Tool. Tsinghua Sci. Technol. 2006, 11, 501–506. [Google Scholar] [CrossRef]
  24. Markopoulos, A.P.; Georgiopoulos, S.; Manolakos, D.E. On the use of back propagation and radial basis function neural networks in surface roughness prediction. J. Ind. Eng. Int. 2016, 12, 389–400. [Google Scholar] [CrossRef]
  25. Markopoulos, A.P.; Manolakos, D.E.; Vaxevanidis, N.M. Artificial neural network models for the prediction of surface roughness in electrical discharge machining. J. Intell. Manuf. 2008, 19, 283–292. [Google Scholar] [CrossRef]
  26. Karagiannis, S.; Stavropoulos, P.; Ziogas, C.; Kechagias, J. Prediction of surface roughness magnitude in computer numerical controlled end milling processes using neural networks, by considering a set of influence parameters: An aluminium alloy 5083 case study. Proc. Inst. Mech. Eng. B J. Eng. Manuf. 2014, 228, 233–244. [Google Scholar] [CrossRef]
  27. Stavropoulos, P.; Papacharalampopoulos, A.; Vasiliadis, E.; Chryssolouris, G. Tool wear predictability estimation in milling based on multi-sensorial data. Int. J. Adv. Manuf. Technol. 2016, 82, 509–521. [Google Scholar] [CrossRef]
  28. Mirjalili, S.; Saremi, S.; Mirjalili, S.M.; Coelho, L.D.S. Multi-Objective Grey Wolf Optimizer: A Novel Algorithm for Multi-Criterion Optimization. Expert Syst. Appl. 2016, 47, 106–119. [Google Scholar] [CrossRef]
  29. Mirjalili, S.; Jangir, P.; Mirjalili, S.Z.; Saremi, S.; Trivedi, I.N. Optimization of Problems with Multiple Objectives Using the Multi-Verse Optimization Algorithm. Knowl.-Based Syst. 2017, 134, 50–71. [Google Scholar] [CrossRef]
  30. Mirjalili, S.; Jangir, P.; Saremi, S. Multi-Objective Ant Lion Optimizer: A Multi-Objective Optimization Algorithm for Solving Engineering Problems. Appl. Intell. 2017, 46, 79–95. [Google Scholar] [CrossRef]
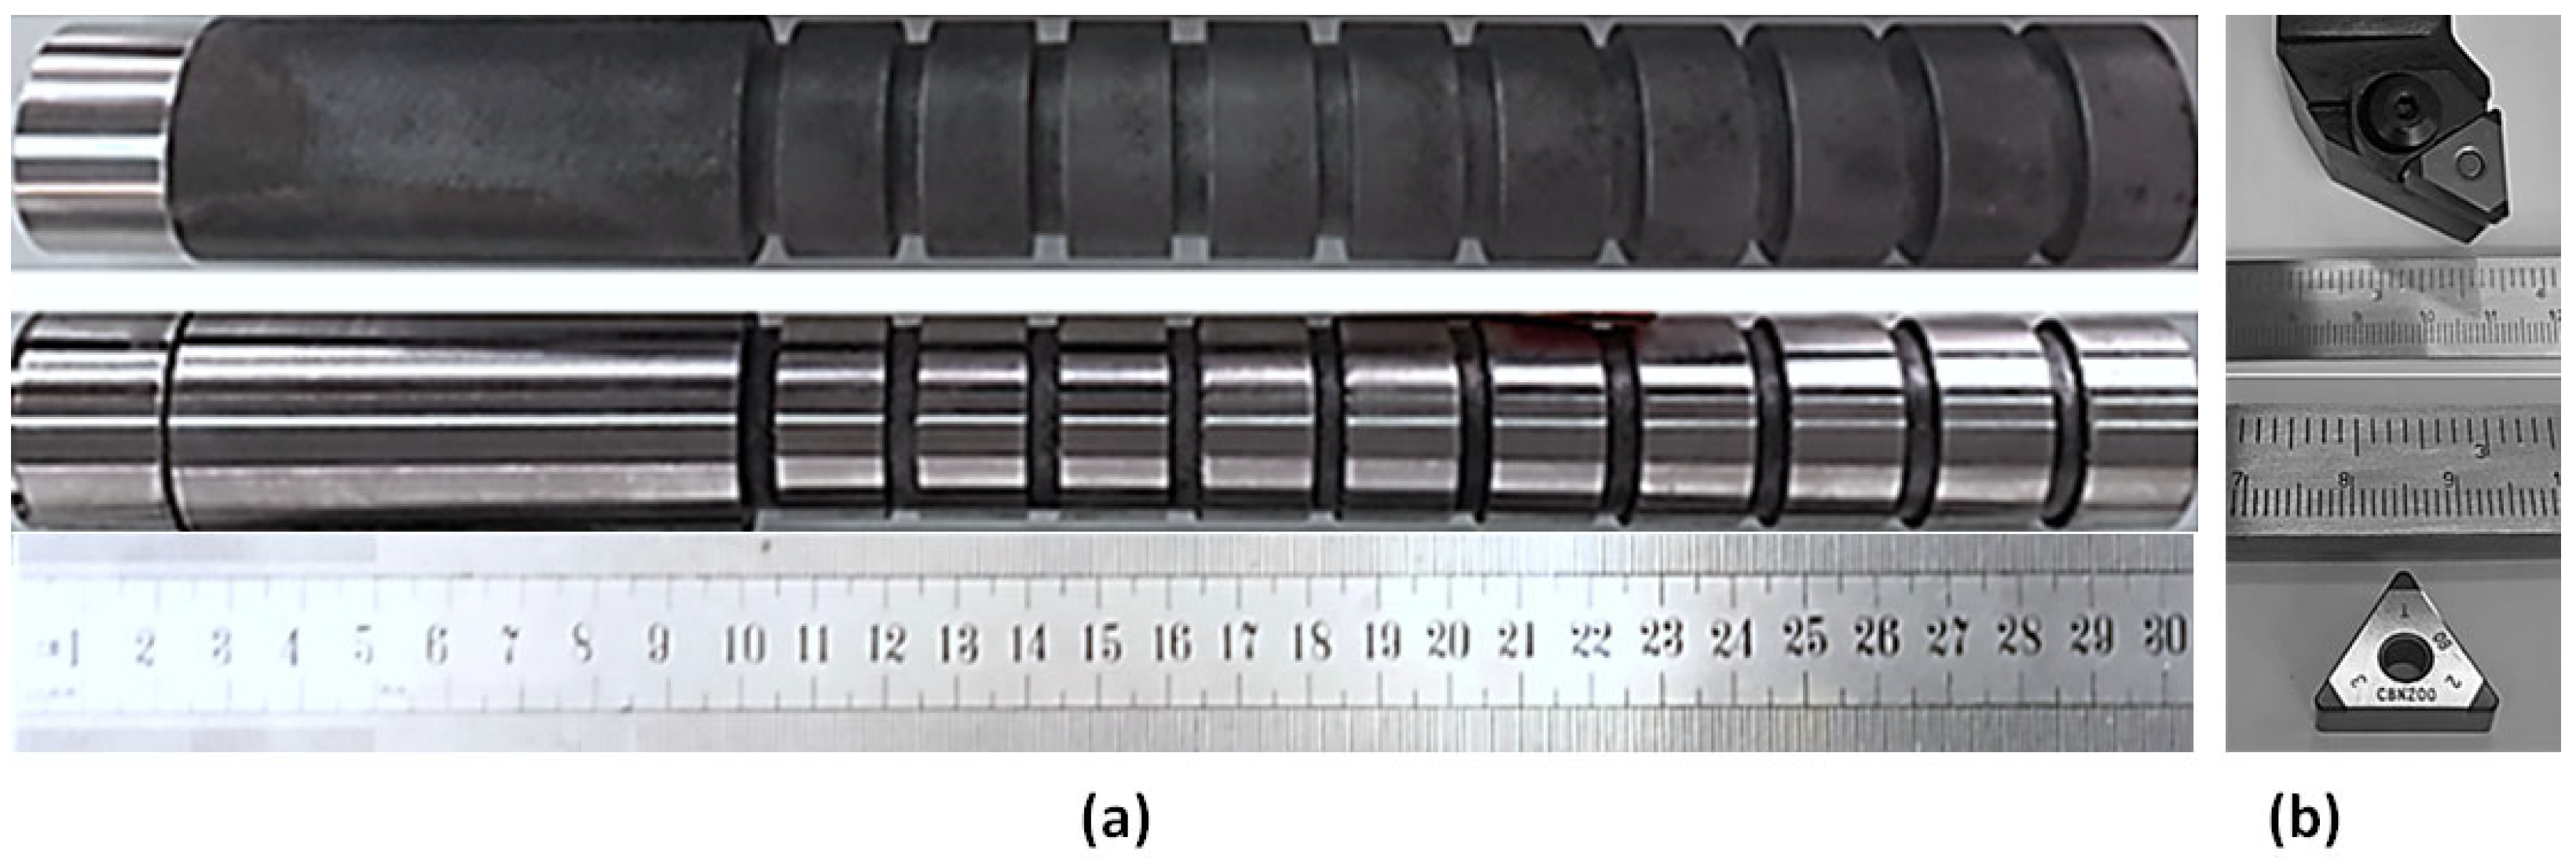
Figure 1. (a) Ø30 × 300 mm UNIMAX® bars for dry CNC turning experiments; (b) the SECO® TNGA332S-00820-L1-C, CBN200 with the PTJNR 2525M16 insert holder.
Machines 12 00156 g001
Figure 2. Experimental set-up. (a) The HAAS® TL-1 CNC turning center with KISTLER® three-component cutting force dynamometer; (b) Labview® environment to measure cutting force signals; (c) TESA® Rugosurf 10 G setup for roughness measurements.
Machines 12 00156 g002
Figure 3. Probability plots for regression models: (a) Fz for the “AR” condition of UNIMAX; (b) Fz for the “HRD” condition of UNIMAX; (c) Ra for the “AR” condition of UNIMAX; (d) Ra for the “HRD” condition of UNIMAX.
Machines 12 00156 g003
Figure 4. Main effects plots for: (a) Fz for the “AR” condition of UNIMAX®; (b) Fz for the “HRD” condition of UNIMAX®.
Machines 12 00156 g004
Figure 5. Main effects plots for: (a) Ra for the “AR” condition of UNIMAX®; (b) Ra for the “HRD” condition of UNIMAX®.
Machines 12 00156 g005
Figure 6. Contour plots for: (a) Fz for the “AR” condition of UNIMAX; (b) Fz for the “HRD” condition of UNIMAX; (c) Ra for the “AR” condition of UNIMAX; (d) Ra for the “HRD” condition of UNIMAX.
Machines 12 00156 g006
Figure 7. Surface topography of cutting insert during the dry turning of hardened (HRD) UNIMAX®.
Machines 12 00156 g007
Figure 8. Pareto optimal (non-dominated) solutions for optimizing UNIMAX® CNC turning: (a) “AR” condition; (b) hardened “HRD” condition.
Machines 12 00156 g008
Table 1. Cutting parameters and corresponding experimental levels.
Central Composite Design of Experiments
ParameterSymbolLevel
Low (−1)Center (0)High (1)Unit
Spindle speed
(Cutting speed)
n
(Vc)
1500
(141)
1750
(165)
2000
(188)
rpm (m/min)
Feed ratef0.0500.1250.200mm/rev
Depth of cuta0.5001.0001.500mm
Table 2. Experimental results for main cutting force (Fz) and surface roughness (Ra).
No.n/(Vc)
(rpm)/(m/min)
f (mm/rev)a
(mm)
Fz
(N) AR
Fz
(N) HRD
Ra
(μm) AR
Ra (μm) HRD
11500 (141)0.0500.50140.760120.6444.4991.291
22000 (188)0.0500.5098.581120.2704.4531.261
31500 (141)0.2000.50170.008280.1396.7784.279
42000 (188)0.2000.50220.991250.1786.5874.081
51500 (141)0.0501.50220.166320.8864.9311.753
62000 (188)0.0501.50200.773270.0344.5111.325
71500 (141)0.2001.50430.855580.9456.8634.362
82000 (188)0.2001.50320.351570.8476.5634.040
91750 (165)0.1251.00340.837410.2065.1342.349
101750 (165)0.1251.00340.263410.1245.1222.251
111750 (165)0.1251.00340.936410.5534.9961.969
121750 (165)0.1251.00340.957410.3264.8191.612
131342 * (126)0.1251.00280.011340.8455.0541.846
142158 * (203)0.1251.00295.215300.8994.7821.574
151750 (165)0.025 *1.00180.069210.1124.4681.260
161750 (165)0.250 *1.00400.445410.70211.4349.226
171750 (165)0.1250.18 *80.40790.5245.2051.997
181750 (165)0.1251.82 *392.834430.4125.3842.176
191750 (165)0.1251.00340.529410.3535.3582.150
201750 (165)0.1251.00340.023410.1525.2512.043
St.Dev. 102.768135.3411.5751.863
Mean 273.751337.9585.6102.642
Median 307.783375.4855.1282.02
Range 350.448490.4216.9817.966
* Experimental values with reference to “alpha” factor of CCD design.
Table 3. ANOVA table for response surface regression: Fz (N)-AR vs. n, f, a.
SourceDFSeq.SSContribution %Adj.SSAdj.MSF-Val.p-Val.
Model9188,56693.97188,56620,951.817.32<0.005
Linear3137,07368.31128,71142,903.635.46<0.005
n (rpm)16960.35657.0657.00.540.478
f (mm/rev)153,31526.5741,00541,004.933.89<0.005
a (mm)183,06241.3987,04987,048.971.95<0.005
Square345,10022.4845,10015,033.312.430.001
n2167293.3592529251.67.650.020
f2111,0575.5112,19212,192.410.080.010
a2127,31413.6127,31427,314.222.580.001
2-way int.363933.1963932131.01.760.218
n × f11010.500.984
n × a124051.2024052404.71.990.189
f × a139881.9939883987.63.300.100
Error1012,0986.0312,0981209.8
Lack-of-fit512,0976.0312,0972419.56.560.235
Pure error51010.1
Total19200,664100
R293.97%
Table 4. ANOVA table for response surface regression: Fz (N)-HRD vs. n, f, a.
SourceDFSeq.SSContribution %Adj.SSAdj.MSF-Val.p-Val.
Model9339,05297.42339,05237,67241.99<0.005
Linear3280,46480.59269,02689,67599.95<0.005
n (rpm)118370.53168716871.880.200
f (mm/rev)1103,91329.8683,44783,44793.01<0.005
a (mm)1174,71450.20183,892183,892204.97<0.005
Square349,24414.1549,24416,41518.30<0.005
n2151021.47746674668.320.016
f2115,6234.4916,99616,99618.94<0.005
a2128,5198.1928,51928,51931.79<0.005
2-way int.393452.69934531153.470.059
n × f116016160.020.898
n × a11170.031171170.130.725
f × a192122.659212921210.270.009
Error1089722.588972897
Lack-of-fit589722.58897217944.250.244
Pure error50000
Total19348,024100
R297.42%
Table 5. ANOVA table for response surface regression: Ra (μm)-AR vs. n, f, a.
SourceDFSeq.SSContribution %Adj.SSAdj.MSF-Val.p-Val.
Model943.415792.1243.41574.824012.98<0.005
Linear330.893765.5536.764312.254832.98<0.005
n (rpm)10.14730.310.14210.14210.380.550
f (mm/rev)130.693165.1236.584636.584698.46<0.005
a (mm)10.05330.110.03750.03750.100.757
Square312.469826.464.15664.156611.190.002
n210.68941.460.56140.56141.510.247
f2111.727624.8811.664811.664831.39<0.005
a210.05290.110.05290.05290.140.714
2-way int.30.05220.110.01740.01740.050.986
n × f10.00010.000.00010.00010.000.989
n × a10.02300.060.02920.02920.080.785
f × a13.71580.050.02300.02300.060.809
Error103.53617.880.37160.3716
Lack-of-fit50.17977.500.70720.70721.680.187
Pure error50.17970.380.03590.0359
Total1947.1315100
R292.12%
Table 6. ANOVA table for response surface regression: Ra (μm)-HRD vs. n, f, a.
SourceDFSeq.SSContribution %Adj.SSAdj.MSF-Val.p-Val.
Model962.955895.4762.95586.995123.44<0.005
Linear345.904669.6254.231718.077260.57<0.005
n (rpm)10.15170.230.14850.14850.500.497
f (mm/rev)145.697469.3054.045454.0454181.09<0.005
a (mm)10.05550.080.03770.03770.130.730
Square316.987425.7616.98745.662518.97<0.005
n210.81271.230.65320.65322.190.170
f2116.090624.4015.999015.999053.61<0.005
a210.08410.130.08410.08410.280.607
2-way int.30.06380.100.06380.02130.070.974
n × f10.00050.000.00050.00050.000.969
n × a10.03410.050.03410.03410.110.742
f × a10.02930.040.02930.02930.100.761
Error102.98454.532.98450.2984
Lack-of-fit52.64714.012.64710.52943.850.204
Pure error50.33730.510.33730.0675
Total1965.9403100
R295.47%
Disclaimer/Publisher’s Note: The statements, opinions and data contained in all publications are solely those of the individual author(s) and contributor(s) and not of MDPI and/or the editor(s). MDPI and/or the editor(s) disclaim responsibility for any injury to people or property resulting from any ideas, methods, instructions or products referred to in the content.