Abstract
The use of lasers in various precise material removal processes has emerged as a viable and efficient alternative to traditional mechanical methods. However, the laser ablation of materials is a complex, multi-parameter process where scanning paths need to be repeated multiple times. This repetition causes changes in the absorption and temperature distribution along the scanning path, thereby affecting the accuracy of the ablation. Therefore, it is crucial to thoroughly study these phenomena. This article presents an experimental and numerical study on the laser ablation of bronze (DIN: 1705) in a multi-track ablation process. Specifically, six consecutive passes using a ns laser at three different energy densities were conducted. After each pass, measurements of the ablation depth and pile-up height were taken at three distinct points along the track (start, middle, and end) to evaluate the efficiency and quality of the process. To gain a deeper understanding of the underlying physical mechanisms, a numerical simulation model based on the Finite Element Method (FEM) was developed. The effective absorptivity was defined through reverse engineering, and the material’s cooling rates were also estimated. This study’s findings provide significant insights into the influence of machining parameters on the ablation process and its progression with varying numbers of consecutive repetitions. A primarily linear correlation was deduced between the ablation depth, energy density, and number of repetitions, while the relationship with the pile-up height appeared to be more ambiguous and nonlinear. The estimated cooling rates ranged from 106 to 1010 [K/s]. Additionally, a heat accumulation phenomenon and a gradual temperature increase resulting from consecutive laser scans were also observed. A good agreement between the simulation results and experiments for the ablation depths was observed.
1. Introduction
Laser ablation possesses significant advantages compared to conventional removal methods. These include its non-contact nature, the capability to process materials regardless of their mechanical properties, and its inherent flexibility and versatility [1].
In general, the process of laser ablation is inherently complex due to the intricate interaction between the laser and the ablating material. Upon the arrival of electromagnetic wave pulses from the laser onto surfaces, heat energy is transferred to the material, initiating the stage of thermalization. Subsequent incident pulses induce the thermal expansion of the material, leading to its gradual melting. The rise in temperature of the melt pool prompts a phenomenon known as melt expulsion [2]. An increase in the average laser power and repetition rate results in a higher melt expulsion rate [3]. The performance of ablation is determined by laser parameters, such as pulse duration, fluence, frequency, wavelength, and the efficiency of absorption, while, typically, the required laser fluence is approximately between 0.1 and 100 (J/cm2) [4]. When a nanosecond laser is utilized, the process can be considered mainly thermal, including material heating, melting, and ablation [4]. As a rule of thumb, longer pulse durations result in a higher ablation rate; however, the inferior surface quality and accuracy results are unfavorable [5,6]. In addition, the type of ablation, namely, cold and warm ablation and melt expulsion, are also directly dependent on the pulse duration [7]. The influence of the laser frequency on melt expulsion and, consequently, removal is much more intricate so that material removal grows linearly up and then reaches a plateau phase [8]. Nevertheless, the interaction of a high-intensity laser with matter is far more complicated.
When matter is irradiated by a high-intensity laser, some surface degradation occurs [9]. There are three main mechanisms that lead to optical surface damage. Firstly, the metal fragments created during ablation explode on the metal surface, resulting in morphological changes [10]. Secondly, laser-induced periodic surface structures (LIPSSs), which are surface features that are created after laser irradiation, also lead to morphological changes [11]. Thirdly, the excited atoms and ions, due to laser irradiation, interact with air molecules in the environment, forming metal oxides, nitrides, etc., leading to chemical modifications. These chemical modifications are also responsible for optical surface damage [12]. All these three factors are responsible for surface alterations. Specifically, morphological changes lead to surface pattern wavelengths that are much shorter than the wavelength of the illuminating light. This pattern traps more photons, leading to surface darkening. Moreover, the existence of oxides on the surface also results in compounds with a black or dark color. These dark colors increase the absorptivity of the metal [13]. Furthermore, during the interaction of the laser with the material due to explosive melt ejection, nano- and micro-cavities are generated [14]. The formation of these cavities on the irradiated surface might result in uneven laser absorption as the surface is irradiated in successive passes. The non-uniformity in energy absorption caused by these cavities also results in a uniform temperature distribution, which forces the molten material to be expelled around the boundary of the ablation region [15]. Therefore, the material after abruption from the melt pool freezes on the upper surface of the workpiece near the boundaries of the ablation zone, which consequently leads to pile-up formation on the upper surface of the workpiece [16]. The above brief review of the laser–matter interaction and melt behavior supports the necessity of extensive research regarding the laser machining of different materials and alloys.
In the ns laser machining of non-ferrous materials, including bronze alloys, the average ablation rate per pulse decreases as much as 50% for deep ablated channels, compared to cases where ablation is conducted on the surface. An increase in laser fluence results in a higher ablation rate; however, oxidation is also intensified [17]. Therefore, in cases of multi-track laser scanning, the metal surface oxidizes as the number of pattern repeats increases, and, thus, the surface’s absorptivity also changes. The absorption coefficient of a metal depends on various laser-related and material-related factors. The laser-related factors are wavelength, the angle of incidence, beam polarization, and laser intensity. The material-related factors are the composition of the metal (pure metal or alloy), the temperature of the metal, the roughness, the texture and the existence of surface oxides, pile-ups, and contamination (oil, dust, and dirt). Because the absorption coefficient is highly sensitive to the above laser-related and material-related parameters, researchers have limited their studies to estimate the absorption coefficient of pure metals or alloys under almost ideal laser- and material-related conditions. Drude used the polarimetry method to explicit the expressions of the refractive index and extinction coefficient derived from measured quantities [18]. However, the limitation of this model is its sensitivity to the surface preparation of the material. In order to eliminate the surface condition sensitivity, the Kramers–Kronig technique was used to measure the absorptivity of Cu, Ag, and Au [19]. Nevertheless, this method requires a numerical inversion of the optical constants’ equations and the extrapolation of absorptivity outside the measured range of frequencies, which are the main drawbacks of this technique. Johnson and Christy [20] measured the reflection and transmission of 185–500 Å Cu, Ag, and Au thin films. The films were vacuum-evaporated, and the measurements were taken at room temperature and in the 0.5–0.65 eV spectral range. In their review paper, Bunaziv et al. [21] compared absorptivity data from the literature for different Fe, Cu, and Al alloys and showed that their composition and surface preparation play a crucial role in their absorptivity. Thus, using the theoretical or case-specific values of absorption coefficients from the literature to describe the experiments in the current paper, in which neither the laser-related nor material-related parameters were ideal, would result in high inaccuracy.
Hence, fluctuations in absorption, as well as temperature variations, could significantly impact the accuracy and overall performance of the ablation process, potentially causing inaccuracies in determining ablation depths. Addressing these two phenomena is imperative for achieving precise ablation. By studying the variations in absorption and accurately evaluating temperature variations in the multi-track ablation process, greater precision in the ablation process could be attained.
The current study aims to estimate (1) the absorption coefficient and (2) temperature variation under the specific experimental conditions outlined in this paper, particularly in the context of multi-track laser ablation. Thus, to study a multi-track laser ablation process, it is necessary first to estimate the absorption coefficients for each pattern repeat. Nevertheless, it is not straightforward to calculate absorptivity experimentally. To this purpose, it is crucial to develop simulations that estimate the absorption coefficients indirectly. So far, based on the authors’ knowledge, in the existing literature, there has been a notable absence of research on the multi-track nanosecond laser ablation of bronze, where the focus is placed on the absorption coefficient in multi-track ablation. In this research paper, we conducted an experimental and numerical investigation focusing on the laser ablation of bronze. The reason for selecting bronze is that, in different applications, including in the laser conditioning of abrasive tools—as a prime example of a multi-track ablation process—the challenge lies predominantly in the precise control of the ablation of bronze. In the laser conditioning of abrasive tools, specifically for bronze-bond abrasive tools, bronze material is utilized as a binding material due to its favorable characteristics. It possesses good bonding properties, aiding in holding abrasive particles together and maintaining their form profile within the abrasive tool during grinding operations. From this perspective, bronze was chosen for this study to understand the interaction between bronze and the laser beam. To pursue this purpose, we performed a series of six consecutive passes using a ns laser at three different energy densities. After each pass, we measured the ablation depth and pile-up height at three points along the track, namely, the start-, mid-, and end-points. These measurements allowed us to estimate the efficiency and quality of the ablation process. The experimental results indicate that, as the repetition increases, the ablation depth also increases. However, the ablation depth varies along the scanning track so that, at the start point, the depth is considerably higher than at the mid- and end-points. To better understand the underlying physical mechanisms, we developed a numerical model based on the Finite Element Method (FEM). By employing reverse engineering techniques, we determined the effective absorptivity and estimated the material cooling rates. The FEM results show that, straight after irradiation, the cooling rate is very high ( and then drops rapidly to values with a magnitude of or . The outcomes of our study provide significant insights into the influence of laser parameters on the process performance and its progression with varying numbers of consecutive repetitions.
2. Materials and Methods
2.1. Experimental Process
The utilized laser was the Carbide Model (CB3-40-0200-10-HB) from Light Conversion Company—Vilnius, Lithuania, with an emission wavelength of 1064 [nm]. The intensity profile at the laser output was near-Gaussian (M2 < 1.2), and the beam spot size (LBDIAM = 2w0) was 22 [µm]. This laser also provided a nanosecond pulse with a duration of 16 [ns] and a maximum average power of 40 [W]. The laser parameters that were used are given in Table 1. The irradiated material was a bronze block (DIN: 1705), as shown in Figure 1a. The laser beam travelled from the left side to the right side, with a nominal scanning speed υLB between 1000 and 1400 [mm/s] for a scanning path length of 2 [mm]. Different laser energy densities were achieved by changing the scanning speed, resulting in a range from 1.29 to 1.81 [J/mm2]. The nominal average laser energy density was calculated as
where LPDENS is the nominal average laser energy density in [J/mm2], LP is the nominal laser power in [W], υLB is the laser scanning speed in [mm/s], and LBDIAM is the beam diameter in [mm].

Table 1.
Laser parameters.

Figure 1.
(a) Schematic presentation of the laser irradiation scanning path and (b) measuring points along the irradiated scanning path.
The return speed of the laser beam (from right to left) was set at 1500 [mm/s] with the laser turned off. The number of successive scanning paths ranged from 1 to 6. The quality and feasibility of the process were assessed based on the ablation depth and the formation of pile-ups. To precisely measure the ablation depth and the pile-up after each scanning pass, the surface required the minimum surface roughness; therefore, the test surface was polished to obtain a surface roughness of Ra < 50 [nm]. To achieve this surface quality, the procedure summarized in Table 2 was followed. A confocal microscope (NanoFocus) was used to measure the ablation depths. Each experiment was conducted three times, with measurements taken in three different positions: (1) left, (2) middle, and (3) right of the laser path, as illustrated in Figure 1b. The average value for each area was recorded and is reported and discussed. In general, all the measurements showed a significantly low deviation, and, thus, the process can be considered highly repeatable.

Table 2.
Polishing steps and experimental requirements to obtain surface roughness of Ra < 50 [nm].
2.2. Modeling and Simulation Methodology
Laser irradiation leads to a temperature gradient inside the body of the ablating material, resulting in heat transfer from higher-temperature to lower-temperature areas. This mechanism of heat transfer in nanosecond lasers with higher pulse durations is mainly based on heat conduction, which can be described by Fourier’s law [22]:
where ρ [kg/m3] is the material’s density, CP [J/kgK] is the specific heat, k [W/mK] is the thermal conductivity, q [W/m2] is the boundary heat flux vector, and Q [W/m3] is the volumetric heat source power intensity.
A Gaussian spatial distribution [23] and a uniform time distribution are used to describe the laser beam, which is expressed by the following equation:
where qLB [W/m2] is the laser beam heat flux, a is the effective absorption coefficient, (xo, yo) are the coordinates of the center of the laser beam in [m], σ [m] is the standard deviation, P [W] is the laser peak power, f [Hz] is the laser pulse frequency, and τp [s] is the laser pulse duration. During the “return” interval of the laser beam, the LP is zeroed, while the coordinates of the center of the laser beam are defined based on the laser beam scanning speed, υLB.
Moreover, heat exchange between the material’s surface and the environment (air) through convection and radiation is also considered and described by the following equations, respectively:
where qconv [W/m2] is the heat flux due to convection; qrad [W/m2] is the heat flux due to radiation; h [W/m2K] is the convection coefficient, which equals 9 [W/m2K]; is the emissivity coefficient, which equals 0.23; σΒ = 5.67 × 10⁻⁸ [W/m2K4] is the Stefan–Boltzmann constant; and Text [K] is the external temperature.
To model the material ablation rate, the heat flux due to ablation is employed [22]:
where qa [W/m2] is the heat flux due to ablation; Ta [K] is the ablation temperature; and ha [W/m2K] is an artificial temperature-dependent heat transfer coefficient, which is defined as
Material removal is modeled through the control volume deformation. The boundary condition that describes the velocity of the deforming mesh and, thus, the material ablation is given below:
where υa [m/s] is the normal velocity of the material erosion front, and Hs [J/kg] is the latent heat of sublimation.
The material used for the simulation is bronze, consisting of 88% Cu and 12% Sn. The thermophysical properties of pure Cu [24] and Sn were obtained from the literature [25], and, eventually, the thermophysical properties of bronze were calculated with the rule of mixtures [26]. For the above bronze, the rule of mixtures has the following general form:
where is the general symbol of a thermophysical property, and the indices show that this general thermophysical property refers to the whole bronze alloy, the Cu element, and the Sn element, respectively.
The estimated properties of bronze are given in detail in Table 3.

Table 3.
Thermophysical and optical properties of bronze.
From now on in this paper, the experiment-based absorption coefficient is called the “effective absorption coefficient” to separate it from the theoretical or case-sensitive values recommended in the literature. The only unknown coefficient in the simulation is the effective absorption coefficient. Nevertheless, as already written in the Introduction of this paper, the effective absorption coefficient is highly sensitive to laser- and material-related conditions. Thus, any slight change in the surface roughness, inclination, and temperature slightly affects the value of the coefficient. However, estimating the effective absorption coefficient for all these minor changes would be pointless and unfeasible. For this reason, the mean effective absorption coefficient of each pattern repeat is calculated during the simulation. To find out the values of these six mean effective absorption coefficients (one for each pattern repeat), the trial-and-error method is implemented. Specifically, the simulation of each pattern repeat is run multiple times with different values for the mean effective absorption coefficient until the simulation results converge with the experimental results.
Due to the need to run the simulation for each pattern repeat multiple times, the computational time would be significantly high. To reduce the computational time, a model reduction from 3D to 2D is employed [27]. However, to apply the model reduction, it is necessary to firstly prove that the error between the 3D and the 2D ablation depths is negligible. For this reason, the 1st pattern repeat is simulated for both 3D (Figure 2a) and 2D (Figure 2b) models. It is deduced that the reduced 2D model can accurately model and predict material ablation, as the obtained results align with those from the 3D model.
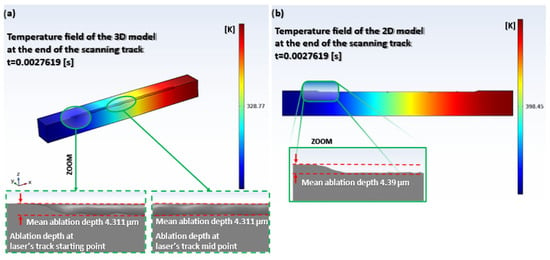
Figure 2.
(a) The 3D model ablation depth at the end of the 1st track and (b) the 2D model ablation depth at the end of the 1st track. The values denote the ablation depths resulting from the simulation.
3. Results and Discussion
3.1. Experimental Results—Ablation Depth and Pile-Up Formation
Table 4 summarizes the ablation depths corresponding to different laser fluences, and they are visually represented in Figure 3.

Table 4.
Ablation depths.
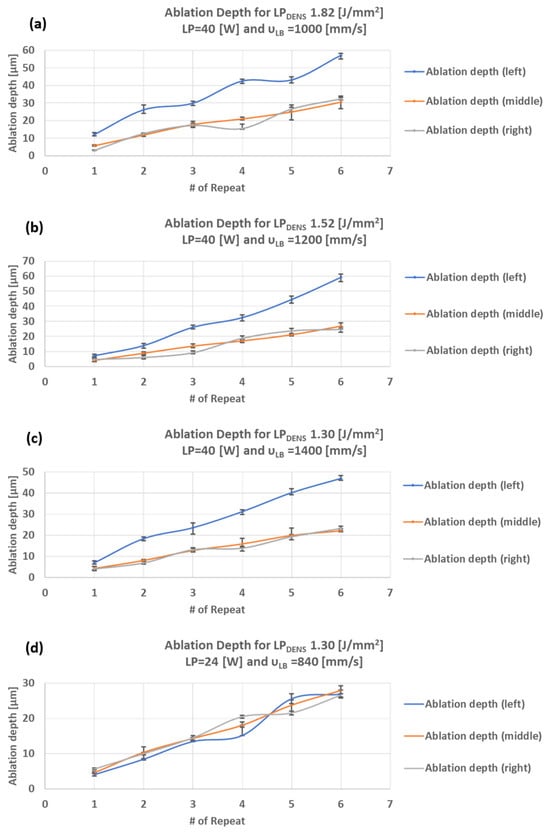
Figure 3.
Ablation depths for (a) 1.82 [J/mm2], (b) 1.52 [J/mm2], (c) 1.30 [J/mm2], and (d) 1.82 [J/mm2] with 24 [W] LP.
Based on the results in Figure 3, it is determined that the ablation depth increases almost linearly as the number of repeats increases from one to six. When considering the mid-point depth as a reference and representative value, it is deduced that the increase in laser energy density also results in an almost linear increase in the material ablation rate and, thus, an increase in the measured depths. As an example, for a 28% decrease in LPDENS (from 1.82 to 1.30 [J/mm2]), the corresponding decrease in the ablation depth at the mid-point after the sixth track is 27% (from 30.47 [μm] to 22.14 [μm]). Thus, it can be concluded that, at least within the limits of the current study, the process exhibits linear behavior.
It should be mentioned that, for all the scanning velocities, a considerable difference in the ablation depth is observed between the left and middle points along the ablation path, resulting in an average ablation depth twice as deep on the left side. The left point corresponds to what is known as “keyhole instability”. The term “keyhole” is commonly used in laser welding processes. A reasonable explanation might be the fluctuation in the temperature distribution along the laser path due to the possible alternation in the absorption coefficient and the material’s thermophysical properties due to the initial significantly different temperature profiles (i.e., ambient temperature) that the first incident pulses “meet” as they reach the irradiated surface. Gradually, the material’s temperature rises due to the preheating effect, and, thus, a change in the material’s optical and thermophysical properties may occur. The time lag is another parameter that may influence the observed instability at the beginning of the track. More specifically, the number of incidence pulses is considerably higher at the beginning of the scanning line than at the mid- and end-points. This disparity arises from the considerable delay time in the movement of the laser beam caused by the scanner mirrors, known as the time lag. In practical situations, regardless of whether a single line or a series of parallel lines are lasered, this time lag unavoidably requires experimental adjustment. It is a factor inherent to the architecture of the laser system’s pulse generation and its synchronization with the scanner layout. The qualitative impact of the time lag on the alignment of the lasered line is depicted in Figure 4.
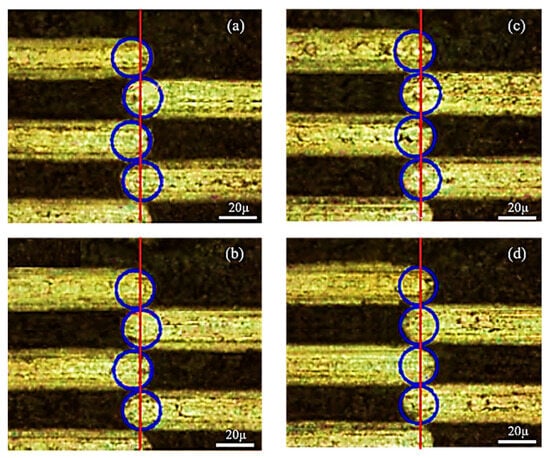
Figure 4.
Influence of different time lags- (a) 80 µs (b) 90 µs (c) 110 µs (d) 120 µs. The red line indicates to symmetrical axis and blue circles to the beam spot at the end of scanning path.
Different values are tested to determine the optimum time lag values (see Figure 4a–d, where the time lag is decreased). The two lines are correctly adjusted to the value of 120 [µs] (Figure 4d). Nevertheless, it is necessary to note that, by adjusting the time lag value correctly, the start points of the two parallel lines meet each other at the same position; however, the number of incident pulses at the very beginning of the scanning line is still higher than that at the middle and end of the line. From a practical point of view, this phenomenon becomes considerably intensified when higher frequency values are selected, particularly when the laser has to traverse the entire scanning path (from the right point to the left point) without emitting laser shooting. The number of incidence pulses targeting the surface corresponding to this 120 [µs] time lag is equal to 24 pulses when the frequency is 200 kHz. As a result, the mechanism of ablation at the beginning of the process, specifically at the left point, is comparatively similar to that of a laser drilling process. Therefore, a series of single-point experiments are conducted to see how the ablation depth varies with different numbers of incidence pulses (Figure 5). As shown in the figure, for an incidence pulse of 20, an ablation depth of 18 [µm] is reported. By the same analogy, the difference between the left point and mid-point in Figure 3a–c is almost in the same range. Another potential explanation for the deeper ablation depth at the left point and the existence of this instability could be the minimal effect of plasma shielding, particularly at the beginning of the process. The energy absorption of the progressively formed plasma cloud gradually decreases the efficiency of the later laser pulses compared to the initial ones. Consequently, it is expected that the ablation performance will diminish as the plasma cloud forms and expands over time, following the laser’s movement along the scanning path. To minimize the ablation difference between the left and middle points, manipulating the melt behavior could necessarily be achieved through proper pulse energy. As deduced from the data in Figure 3d, for a constant laser energy density of 1.29 [J/mm2], when a lower nominal mean LP is utilized (decrease from 40 to 24 [W]), along with a lower scanning speed (decrease from 1400 to 840 [mm/s]), the difference in ablation depth between the left and middle points is minimized. Hence, this suggests that utilizing a lower pulse energy minimizes the extreme material melting and evaporation at the beginning of the track, resulting in a more uniform and stable process.
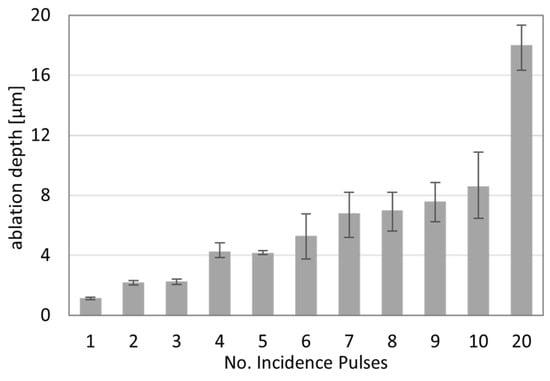
Figure 5.
Effect of single pulses in laser drilling.
Another critical aspect of the process is pile-up formation, which refers to the accumulation of resolidified material along the rims of the laser scanning path. The magnitude of pile-up formation depends on several parameters such as the energy density and the specific geometrical characteristics of the irradiated area. For example, Figure 6 illustrates the pile-up formation at the left, middle, and right points.

Figure 6.
Pile-up formation for 1200 [mm/s] scanning speed at the (a) left point, (b) middle point, and (c) right point.
Based on the results in Table 5 and the corresponding plots in Figure 7, it is evident that the pile-up directly and strongly depends on the repetition number and the relative position. More specifically, and as a general trend, the pile-up follows the same pattern as the ablation depth, with the left points having significantly higher pile-up formations. At the same time, it is worth mentioning that, for the first three repeats, at the middle and right points of the scanning path, the pile-up values are almost marginal. The interpretation of these observations lies in the fundamental formation mechanisms of the pile-up. Pile-ups are basically formed as the effect of the topical recoil pressure on the molten material, resulting in the molten material being squeezed out from the concave structure and piling up together [28]. Hence, the formation of pile-up structures depends on the molten material volume, the intensity of the process, and the areal geometrical characteristics. Significantly low pile-up formation can occur because the material experiences more severe evaporation instead of melting, and, thus, the molten material volume is limited, and/or it can occur if the process parameters do not lead to adequate recoil pressure to push the molten material upwards to the rims of the ablated path. By increasing repetition, resulting in a higher ablation depth of laser grooves, the melting process dominates over the evaporation process, and the mechanism of melt expulsion takes place. Figure 8 illustrates the difference in the pile-up formation between the first and the fourth repeats, highlighting the presence of resolidified debris after the fourth repeat, which is essential for assessing the quality of the irradiated surface. Finally, and based on Figure 7, it should be mentioned that, similarly to the ablation depth and for a constant laser energy density (i.e., 1.29 [J/mm2]), less intense process parameters result in a minimum deviation between the left and middle point pile-up heights.

Table 5.
Pile-up heights.
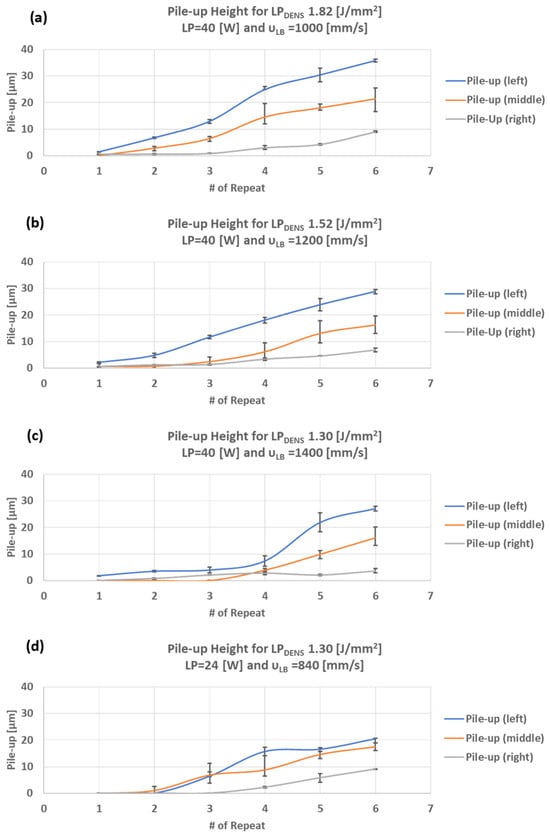
Figure 7.
Pile-up heights for (a) 1.82 [J/mm2], (b) 1.52 [J/mm2], (c) 1.30 [J/mm2], and (d) 1.82 [J/mm2] with 24 [W] LP.
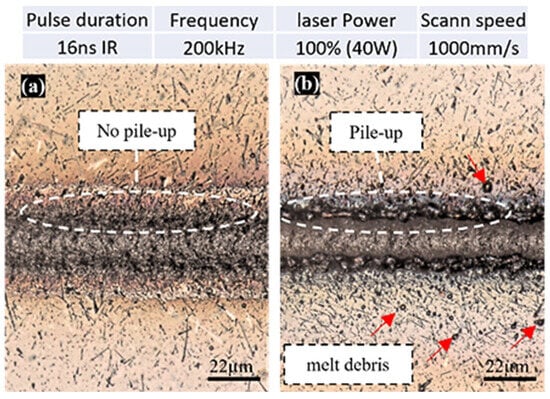
Figure 8.
Comparison of melt expulsion on top surface: (a) 1× repeat, (b) 4× repeats.
3.2. Simulation Results
3.2.1. Mean Effective Absorptivity Estimation
The only unknown coefficient used in the simulation was the mean effective absorption coefficient, which was calibrated for each pattern repeat regarding the experimental data. The fine-tuning showed that the mean effective absorption coefficient remained constant and equaled 0.09 for the first, second, third, fourth, and fifth pattern repeats and then dropped to 0.045 for the sixth pattern repeat. Following the fine-tuning of the mean effective absorption coefficient, the model was validated with the mid-point experimental data (see Figure 3c) by comparing their ablation depths. Both the experimental and simulation ablation depths of each pattern repeat and their in-between errors are provided below in Table 6. The criterion for validation was the ablation depth, chosen for its significance as an indicator of the material removal rate. It can be easily and accurately estimated in both simulations and experiments.

Table 6.
Validation of the simulation ablation depth.
The validation data presented in Table 6 show that the absolute error for all the pattern repeats is below 2.2%. This means that the fine-tuning of the mean effective absorption coefficient was highly accurate, so the model can make reliable predictions of the phenomena observed in the experiments in the current paper.
To correlate the sharp decrease in the mean effective absorption coefficient during the sixth pattern repeat with the experimental data, an analogy with the consecutive pulses in Figure 5 is used. As observed in Figure 5, the ablation depth for five consecutive pulses is decreased compared to the case of four incident pulses. This means that, during the fifth pulse, material addition occurs. The only phenomenon explaining this material addition is the pile-up remelting and collapse in the ablated cavity. The same idea described for the consecutive pulses in Figure 5 can then be applied to explain the steep drop in the mean effective absorption coefficient during the sixth pattern repeat. This significant drop is not related to a change in the material absorptivity but to the existence of pile-up remelting and cavity collapse during this pattern repeat. Such phenomena have already been observed in the literature, as discussed in [29].
3.2.2. Cavity Wall Generation
The cavity shape is highly dependent on the shape of the laser beam, as schematically shown in Figure 9. It is assumed that the first laser pulse irradiates the region between the two black-dashed lines, which is the region of the wall analyzed in this study. To explain this mechanism graphically, this region is divided into five sub-regions, which are called “spots” in this paper. Each spot is irradiated with different intensities, so each develops different temperatures, which leads to different ablations.
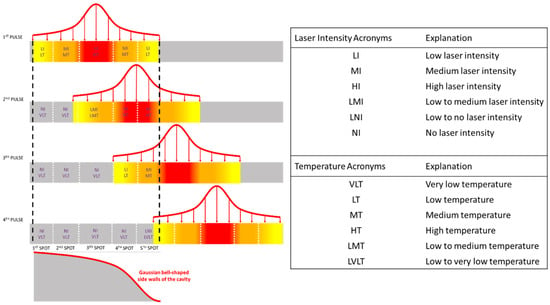
Figure 9.
Schematic representation of the cavity wall generation mechanism.
The first spot is irradiated only once by the first pulse and with a low intensity, causing a slight temperature increase insufficient for material ablation Subsequently, the second spot is irradiated only once by the first pulse with a moderate intensity, resulting in a slightly higher temperature than the first spot but leading only to slight ablation. Conversely, the third spot is irradiated by both the first (high-intensity) and second (low-to-medium-intensity) pulses. The combination of the high-intensity first pulse with the afterheat effect of the second pulse leads to significantly higher temperatures and ablation depths than those of the first and second spots. The temperature and the ablation depth increase further at the fourth spot, where the preheating effect of the first medium-intensity pulse is followed by a high-intensity second pulse and by an afterheat effect of the third low-intensity pulse. Finally, the combination of the high-intensity second pulse with the preheat effect of the first pulse and the two afterheat effects of the third and fourth pulses increases the temperature and the ablation depth even further.
With this schematic representation of the generation of the cavity walls, it is easy to understand that the temperature distribution and the shape of the cavity of a region irradiated by a Gaussian heat source follow the “shape” of the heat source. For this reason, the cavity walls in Figure 2 do not have a V shape or vertical shape, but they resemble the shape of a Gaussian bell. This observation is verified by multiple papers, especially in the area of laser welding, such as [30]. This mechanism explains how the cavity walls at the beginning of the irradiated line are created. In this case, the irradiation of the region starts with low-intensity pulses and grows to combined pulses of very high intensities. Reversing this sequence of pulses (starting with very high intensities and reducing to very low intensities) induces the mechanism of the cavity wall creation at the end of the irradiated line.
3.2.3. Cooling Rates
When the laser passes through a region of the simulated control volume, that region is no longer irradiated, and, thus, the cooling process begins. The cooling process of a region ends when the laser (due to the following pattern repeat) starts to irradiate it again. For this reason, studying the cooling rates during this process is necessary.
In this paper, the cooling rates are calculated for three characteristic points on the surface of the control volume:
- Start-point, which is the first point irradiated by the laser in each pattern repeat.
- Mid-point, which is the point exactly in the middle of the scanning line.
- End-point, which is the last point irradiated by the laser in each pattern repeat.
- In order to calculate the cooling rates, the following formulation is used [31]:
In the FEM simulation, the first six pattern repeats are compared with the corresponding experiments. Each pattern repeat includes the laser irradiation of a length of 2 mm with a scanning speed of 1400 [mm/s] and the return of the laser beam back to the start-point with a return speed of 1500 [mm/s]. Thus, the total duration of one pattern repeat is 0.0027619 s. To create more understandable figures and estimate the cooling rate functions straightforwardly, it is assumed that the time is not continuous for all six pattern repeats but that it starts from zero when a new pattern repeat begins. Thus, a new time counter is introduced for each pattern repeat, named the “Interval Time”. Below, all the temperature and cooling rate diagrams are given regarding these Interval Times.
By calculating the cooling rates of each point (the start-, mid- and end-points) and for each pattern repeat, it is observed that their values are approximately the same for all the pattern repeats. Thus, it would be pointless to further investigate the minor differences between the pattern repeats. However, it is very interesting to study the evolution of the order of magnitude of the cooling rates regarding time for the start-, mid- and end-points of the control volume. To study the magnitude of the cooling rates, characteristic cooling rate diagrams of the start- (Figure 10a), mid- (Figure 10b), and end-points (Figure 10c) of the third pattern repeat are presented.
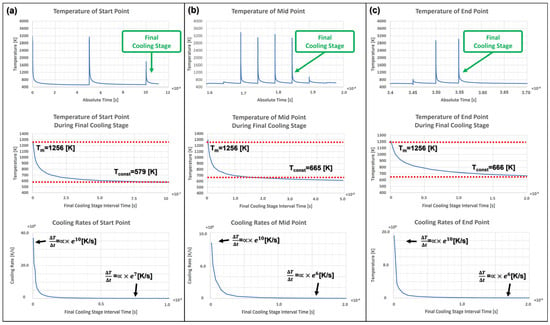
Figure 10.
Temperature evolution and cooling rate for the 3rd pattern repeat of (a) the start-point, (b) mid-point, and (c) end-point.
As observed in Figure 10, the highest cooling rates are given at the beginning of the cooling process (when the temperature drops to the melting point), and they are . Then, the cooling rates drop rapidly until they reach a constant value, which is for the start-point and for the mid- and end-points. The initial rapid reduction in the cooling rate and the afterward slowing down of the cooling rate reduction can be explained according to the heat transfer mechanisms. As already known from Equations (2) and (4), heat transfer due to conduction and convection increases linearly with T. Moreover, heat transfer due to radiation increases regarding . So, at the beginning of the cooling process, where the highest temperatures are met, heat is transferred away from the start-, mid- and end-points faster, and then this phenomenon slows down. Thus, the cooling rate is higher at the beginning and decreases as the temperature decreases. Such an evolution of the cooling rate is also verified by Diez et al. [32]. It is significant to estimate the cooling rate, as it is directly related to the microstructure of the material after the laser process and the properties that it obtains.
3.2.4. Preheat Temperature
As observed in the results of the simulations, the time between two consecutive irradiations of the same point of the control volume is not enough to allow its complete cooling down. This means that each pattern repeat begins from a higher temperature. Thus, an increasing preheat temperature is observed in all the pattern repeats, except for the start-point of the first pattern repeat (see Figure 10). Moreover, as observed in Figure 11, the mid- and end-points of the first pattern repeat are also preheated. This phenomenon does not happen due to the prior irradiation of these points from the laser but rather due to the heat that is transferred to these points via conduction from the rest of the material that has already been irradiated by the laser. Heat accumulation during the process can be utilized to enhance the overall efficiency of the process. However, it is equally important to consider it during process planning to select the optimal machining conditions. The temperature increase may necessitate a re-evaluation of the machining parameters as the initial conditions dynamically change.
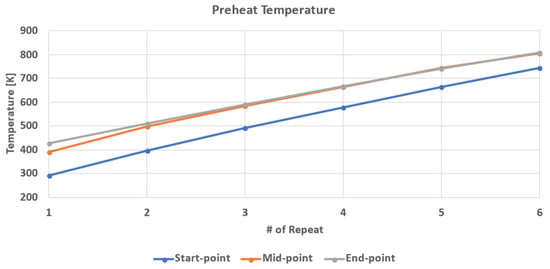
Figure 11.
Evolution of preheat temperature regarding the no. of pattern repeats.
4. Conclusions
The current study investigates the laser ablation of bronze through experimental and numerical approaches. Specifically, a series of six consecutive passes using a ns laser at three different energy densities were conducted. After each pass, the ablation depth and pile-up height were measured at three points along the track to evaluate the efficiency and quality of the process. Simultaneously, a numerical model based on the Finite Element Method (FEM) was developed to gain insights into the process and estimate parameters that are challenging to measure and define experimentally. These parameters included the absorption coefficients and temperature variations observed in different numbers of scan repetitions. The combination of experimental and numerical results aimed to derive solid conclusions about the overall process while considering the fundamental physical mechanisms. The most significant conclusions drawn from this study can be summarized as follows:
The ablation depth at the mid-point increases almost linearly as the number of repeats increases from one to six. Moreover, a notable deviation in the ablation depth is observed between the start-point and the mid-point. This deviation can reasonably be attributed to factors such as fluctuation in the temperature distribution along the laser path, the plasma shielding effect, and time lag phenomena, all of which negatively impact the process’s stability. However, minimizing the deviation in the ablation depth is possible by optimizing specific machining parameters.
The repetition number and relative position directly and strongly influence the pile-up height. There is a nonlinear relationship between the pile-up height and the repetition number. Specifically, for the first three repeats at the mid- and end-points of the scanning path, the pile-up values are almost negligible. Similar to the ablation depth, the starting points exhibit significantly higher pile-up formations than the mid-point. However, by optimizing specific combinations of machining parameters, this deviation can also be minimized.
The mean effective absorption coefficient of the process is defined as 0.09 for the first five repetitions and 0.045 for the sixth repetition. The change in the mean effective absorption coefficient can be reasonably attributed to the prevailing conditions specific to each repetition, such as the presence of certain factors like remelting, cavity collapse, and other related phenomena during that particular repeat.
The highest cooling rates are estimated at the beginning of the cooling phase and are in the range of 1010 [K/s]. However, during the cooling process, the cooling rates drop to a range of 106–107 [K/s]. Furthermore, the cooling phase does not result in the total cooling of the material. Therefore, each pattern repetition begins from a higher temperature, with the preheated temperature reaching approximately 400 [K] for the sixth repetition.
Author Contributions
Conceptualization, E.G.Z.; software, E.G.Z., V.E.A. and E.L.P.; validation, E.G.Z., V.E.A. and E.L.P.; formal analysis, E.G.Z. and V.E.A.; experimentation, E.G.Z.; draft preparation, E.G.Z. and V.E.A.; writing—review, E.G.Z., V.E.A. and E.L.P.; Supervision and review, B.A. and A.M. All authors have read and agreed to the published version of the manuscript.
Funding
This research received no external funding.
Data Availability Statement
Data are contained within the article.
Acknowledgments
The authors express their sincere thanks to +GF+ Machining Solutions GmbH for their invaluable support.
Conflicts of Interest
The authors declare no conflicts of interest.
References
- Davim, J.P. Nontraditional Machining Processes; Springer: London, UK, 2013. [Google Scholar]
- Lange, D.F.; de Schoonderbeek, A.; Meijer, J. Melt ejection during laser drilling. In International Congress on Applications of Lasers & Electro-Optics; Laser Institute of America: Orlando, FL, USA, 2004; p. 542. [Google Scholar]
- Czotscher, T.; Vollertsen, F. Analysis of Melting and Melt Expulsion during Nanosecond Pulsed Laser Ablation. Phys. Procedia 2016, 83, 53. [Google Scholar] [CrossRef]
- Sportelli, M.C.; Izzi, M.; Volpe, A.; Clemente, M.; Picca, R.A.; Ancona, A.; Lugarà, P.M.; Palazzo, G.; Cioffi, N. The Pros and Cons of the Use of Laser Ablation Synthesis for the Production of Silver Nano-Antimicrobials. Antibiotics 2018, 7, 67. [Google Scholar] [CrossRef]
- Finger, J.; Kalupka, C.; Reininghaus, M. High power ultra-short pulse laser ablation of IN718 using high repetition rates. J. Mater. Process. Technol. 2015, 226, 221. [Google Scholar] [CrossRef]
- Semerok, A.; Chaléard, C.; Detalle, V.; Lacour, J.-L.; Mauchien, P.; Meynadier, P.; Nouvellon, C.; Sallé, B.; Palianov, P.; Perdrix, M. Experimental investigations of laser ablation efficiency of pure metals with femto, pico and nanosecond pulses. Appl. Surf. Sci. 1999, 138–139, 311. [Google Scholar] [CrossRef]
- Schulz, W.; Eppelt, U.; Poprawe, R. Review on laser drilling I. Fundamentals, modeling, and simulation. J. Laser Appl. 2013, 25, 012006. [Google Scholar] [CrossRef]
- Hribar, L.; Gregorčič, P.; Senegačnik, M.; Jezeršek, M. The Influence of the Processing Parameters on the Laser-Ablation of Stainless Steel and Brass during the Engraving by Nanosecond Fiber Laser. Nanomaterials 2022, 12, 232. [Google Scholar] [CrossRef] [PubMed]
- Carr, C.W.; Radousky, H.B.; Demos, S.G. Wavelength dependence of laser-induced damage: Determining the damage initiation mechanisms. Phys. Rev. Lett. 2003, 91, 127402. [Google Scholar] [CrossRef]
- Jee, Y.; Becker, M.F.; Walser, R.M. Laser-induced damage on single-crystal metal surfaces. J. Opt. Soc. Am. B 1988, 5, 648–659. [Google Scholar] [CrossRef]
- Natoli, J.-Y.; Gallais, L.; Akhouayri, H.; Amra, C. Laser-induced damage of materials in bulk, thin-film, and liquid forms. Appl. Opt. 2002, 41, 3156–3166. [Google Scholar] [CrossRef]
- Demos, S.G.; Staggs, M.; Minoshima, K.; Fujimoto, J. Characterization of laser induced damage sites in optical components. Opt. Express 2002, 10, 1444–1450. [Google Scholar] [CrossRef]
- Hopp, B.; Smausz, T.; Lentner, M.; Kopniczky, J.; Tápai, C.; Gera, T.; Csizmadia, T.; Ehrhardt, M.; Lorenz, P.; Zimmer, K. Stability investigation of laser darkened metal surfaces. Appl. Phys. A 2017, 123, 598. [Google Scholar] [CrossRef]
- Bashir, S.; Vaheed, H.; Mahmood, K. Nanosecond pulsed laser ablation of brass in a dry and liquid-confined environment. Appl. Phys. A 2013, 110, 389–395. [Google Scholar] [CrossRef]
- Vorobyev, A.Y.; Guo, C. Thermal response and optical absorptance of metals under femtosecond laser irradiation. Nat. Sci. 2011, 3, 488–495. [Google Scholar] [CrossRef][Green Version]
- Bashir, S.; Rafique, M.S.; Husinsky, W. Identification of non-thermal and thermal processes in femtosecond laser-ablated aluminum. Radiat. Eff. Defects Solids 2013, 168, 902–911. [Google Scholar] [CrossRef]
- Maisterrena-Epstein, R.; Camacho-López, S. Nanosecond laser ablation of bulk Al, Bronze, and Cu: Ablation rate saturation and laserinduced oxidation. Superf. Y Vacío 2007, 20, 1–5. [Google Scholar]
- Bordag, M. Drude model and Lifshitz formula. Eur. Phys. J. C 2011, 71, 1788. [Google Scholar] [CrossRef]
- Lucarini, V.; Saarinen, J.J.; Peiponen, K.E.; Vartiainen, E.M. Kramers-Kronig Relations in Optical Materials Research; Springer: Berlin/Heidelberg, Germany, 2005. [Google Scholar]
- Johnson, P.B.; Christy, R.W. Optical Constants of the Noble Metals. Phys. Rev. B 1972, 6, 4370. [Google Scholar] [CrossRef]
- Bunaziv, I.; Akselsen, O.M.; Ren, X.; Nyhus, B.; Eriksson, M. Laser Beam and Laser-Arc Hybrid Welding of Aluminium Alloys. Metals 2021, 11, 1150. [Google Scholar] [CrossRef]
- Holman, J.P. Heat Transfer, 10th ed.; McGraw-Hill Higher Education: Boston, MA, USA, 2010. [Google Scholar]
- Alexopoulou, V.E.; Papazoglou, E.L.; Karmiris-Obratański, P.; Markopoulos, A.P. 3D finite element modeling of selective laser melting for conduction, transition and keyhole modes. J. Manuf. Process. 2022, 75, 877–894. [Google Scholar] [CrossRef]
- Mills, K.C. Recommended Values of Thermophysical Properties for Selected Commercial Alloys; Woodhead Publishing Limited: Cambridge, UK, 2002. [Google Scholar]
- Sharafat, S.; Ghoniem, N. Summary of Thermo-Physical Properties of Sn, and Compounds of Sn–H. Sn–O, Sn–C, Sn–Li, and Sn–Si and Comparison of Properties of Sn, Sn–Li, and Pb–Li. PhD. Thesis, University of California Los Angeles, Los Angeles, CA, USA, 2000. [Google Scholar]
- Shaikh, S.M.; Hariharan, V.S.; Yadav, S.K.; Murty, B.S. CALPHAD and rule-of-mixtures: A comparative study for refractory high entropy alloys. Intermetallics 2020, 127, 106926. [Google Scholar] [CrossRef]
- Lalancette, F.; Désilets, M.; Pansiot, B.; LeBreux, M.; Bilodeau, J.-F. Dimensional reduction of a 3D thermoelectric model to create a reliable and time-efficient 2D model representing an aluminum electrolysis cell. Int. J. Heat Mass Transf. 2023, 202, 123777. [Google Scholar] [CrossRef]
- Tang, M.; Shi, Y.; Zhu, W.; Zhang, N.; Zhang, L. A Convenient and High-Efficient Laser Micro-Engraving Treatment for Controllable Preparation of Microstructure on Al Alloy. Materials 2018, 11, 2297. [Google Scholar] [CrossRef] [PubMed]
- Wang, L.; Zhang, Y.; Chia, H.Y.; Yan, W. Mechanism of keyhole pore formation in metal additive manufacturing. Npj Comput. Mater. 2022, 8, 22. [Google Scholar] [CrossRef]
- Meng, C.; Lu, F.-G.; Cui, H.-C.; Tang, X.-H. Research on formation and stability of keyhole in stationary laser welding on aluminum MMCs reinforced with particles. Int. J. Adv. Manuf. Technol. 2013, 67, 2917–2925. [Google Scholar] [CrossRef]
- O’Sullivan, C.T. Newton’s law of cooling—A critical assessment Am. J. Phys. 1990, 58, 956. [Google Scholar]
- Diez, M.; Ametowobla, M.; Graf, T. Time-Resolved Reflectivity and Temperature Measurements During Laser Irradiation of Crystalline Silicon. J. Laser Micro/Nanoeng. 2017, 12, 230–234. [Google Scholar]
Disclaimer/Publisher’s Note: The statements, opinions and data contained in all publications are solely those of the individual author(s) and contributor(s) and not of MDPI and/or the editor(s). MDPI and/or the editor(s) disclaim responsibility for any injury to people or property resulting from any ideas, methods, instructions or products referred to in the content. |
© 2024 by the authors. Licensee MDPI, Basel, Switzerland. This article is an open access article distributed under the terms and conditions of the Creative Commons Attribution (CC BY) license (https://creativecommons.org/licenses/by/4.0/).