Article

Effect of Penetration Levels for Vehicle-to-Grid Integration on a Power Distribution Network †

by
Ana Simarro-García
*,
Raquel Villena-Ruiz
,
Andrés Honrubia-Escribano
and
Emilio Gómez-Lázaro
Renewable Energy Research Institute, Department of Electrical, Electronic, Automatic and Communications Engineering of ETSII-AB, University of Castilla-La Mancha (UCLM), 02071 Albacete, Spain
*
Author to whom correspondence should be addressed.
This paper is an extended version of our paper published in Simarro-García, A.; Villena-Ruiz, R.; Honrubia-Escribano, A.; Gómez-Lázaro, E. Impacts of electric vehicle charging stations on a Greek distribution network. In Proceedings of the CIRED Porto Workshop 2022: E-Mobility and Power Distribution Systems, Hybrid Conference, Porto, Portugal, 2–3 June 2022; pp. 452–456. https://doi.org/10.1049/icp.2022.0747.
Machines 2023, 11(4), 416; https://doi.org/10.3390/machines11040416
Submission received: 10 February 2023 / Revised: 14 March 2023 / Accepted: 20 March 2023 / Published: 23 March 2023
(This article belongs to the Special Issue Renewable Energy Power Plants and Systems)

Abstract

:
With the exponential growth of electric vehicle sales worldwide over the past years and progress in technology and actions to combat climate change by reducing greenhouse gas emissions, the trend is expected to continue with a significant increase in the deployment of electric vehicles and plug-in hybrids. Given these circumstances, it is essential to identify the constraints that this increase in the number of electric vehicle charging stations poses for the electricity system. Therefore, the analysis developed in this paper discusses the effect of integrating electric vehicle charging stations in a real distribution network with different penetration levels. For this purpose, a typical electric system in Greece, managed by the Greek distribution system operator (HEDNO), is modeled and simulated in DIgSILENT PowerFactory software, one of the most widely used simulation tools in the electricity sector. To study the feasibility of connecting electric vehicle charging stations to the network, different case studies are presented, showing changes in the quantity of electric vehicles feeding power into the network through vehicle-to-grid technology. Quasi-dynamic simulations are used to analyze and discuss the voltage profiles of the system nodes, active power flows with the external source and power losses of the distribution network to determine whether the system is capable of supporting the increase in load produced by the electric vehicle charging stations and to promote awareness of the benefits of implementing vehicle-to-grid connections.

1. Introduction

Currently, one of the most important elements for the quality of people’s life, in both rural and urban areas, is an efficient and accessible transport system. However, the transport sector consumes one third of all final energy in the European Union (EU), according to information published by the European Environmental Agency (EEA) [1], most of which is obtained from oil. Consequently, transport is responsible for a large share of the EU’s greenhouse gas (GHG) emissions and is thus one of the main contributors to climate change, along with other adverse effects on people, such as air and noise pollution.
In response to climate change, the EU proposed several environmental policies included in the ‘Energy Roadmap 2050’. The main objective of these actions is to minimize, as much as possible, the adverse effects of climate change. According to Colmenar-Santos et al. [2], this can be accomplished by establishing new measures and regulations promoting sustainable development in order to reduce GHG emissions. The European Commission guarantees in one of its latest press releases in October 2022 [3] that from 2035 all new passenger cars and vans registered in Europe will be zero-emission. This is the first agreement that puts a deadline on the sale of conventional combustion vehicles and a reminder to start developing strategies that lead to an appropriate and feasible transition.
To raise awareness among consumers, governments around the world are focusing on shifting the transport sector towards a cleaner and more efficient model, developing decarbonization strategies that emphasize the key role of renewable energy sources (RES) and electrification. Examples of such strategies are restrictions on the mobility and circulation of conventional petrol or diesel vehicles in low-emission zones (LEZ) in major cities, such as Madrid (Spain), Lisbon (Portugal) or Paris (France), as indicated in the Urban Access Regulations in Europe [4], as well as the introduction of special, more economic tariffs to promote the charging of electric vehicles (EV) during periods of lower demand on the grid, according to Hatziargyriou et al. [5].
The combination of increasing restrictions and taxes on the use of conventional vehicles and the decreased production costs generated by progress in battery and electric motor technologies has led to a significant rise in sales of EVs as a cleaner alternative to conventional combustion vehicles. In fact, taking a European country as an example, Spanish regulations make it compulsory for new buildings and in some cases existing ones to have a minimum infrastructure to enable electric vehicle charging [6].
This situation has introduced the need for a radical change in our transport system and electrical power infrastructure, as it affects the way energy is generated and consumed. New challenges must be addressed by power grids, especially distribution networks, which must support existing and future connections of distributed generation (DG) units and EV charging stations that were not foreseen when these grids were designed. Issues of power supply in electric networks are already emerging as a consequence of this unexpected situation several years ago. Many experts and associations, such as the European Network of Transmission System Operators for Electricity (ENTSO-E) in 2021 with its first position paper [7], comment that the power network might be overloaded in the low-voltage (LV) and medium-voltage (MV) lines or in the substations due to the connection of a large number of EVs, as is planned. Herein lies the importance of conducting studies such as the one presented in this article.
It should also be noted that, according to data collected by network operators, DISCERN [8] and VDN [9], distribution systems are much larger than transmission power systems, especially taking into account the number of assets. As an example, more than 90% of line lengths for cables and overhead lines in Germany are within the distribution system (1,500,000 km in total compared to 100,000 km of transmission lines). It is therefore important to address this present and future problem by studying the impact of grid-connected charging stations in order to develop strategies, detect failures in the power system and propose solutions, which is the justification for this research.

1.1. Literature Review

In order to design and model the distribution network developed in this work, as well as to know the state of the art related to this topic, recent contributions can be found in the scientific literature. The distribution network modeled in the present work is based on the publication of Anastasiadis et al. [10], which studies the impact of modifying the penetration level of photovoltaic (PV) generation units on the distribution network by simulating a load flow at a specific moment in time. In addition, the literature has also studied the economic impact of a solar resource on a stochastic EV charging model focused on India, with the Himabindu research [11]. From an educational perspective, Honrubia-Escribano et al. [12] developed an advanced teaching method for the load flow analysis of power systems based on a combination of theoretical, modeling and simulation approaches with the same software used in this work, DIgSILENT PowerFactory.
When defining the load profiles used for the simulations with this software, two types can be distinguished: loads coming from standard consumers and those associated with an EV charging station load model. To define the first type of load, it is necessary to know the power system. In this case, the article [10] classifies the distribution network as residential, and information provided by Proedrou [13] and Gottwalt et al. [14] is taken as a basis. Moreover, in order to calculate the loads derived from EV charging stations, some estimations are made based on the data presented in [15,16] and according to the equations reported by the authors of [17,18,19,20,21] (explained in Section 2).
The literature review shows many researchers have discussed the benefits and constrains of integrating EV charging stations in distributed networks, such as in [22,23,24,25,26], concluding that it is necessary to propose measures and solutions regarding the economic, technical and infrastructure aspects of electric networks. In order to understand the charging system of EVs, studies by authors such as Lee et al. [27] and Yang et al. [28] are used, in which different real charging profiles are presented to define predictive algorithms. Various authors have proposed optimization models that aim to demonstrate the economic benefit obtained by EV users, such as in the works published by Zhou et al. [29] and Aguilar-Dominguez et al. [30,31]. Other models proposed in the literature include a schedule of vehicle-to-grid (V2G) technology, such as the model developed by Guo et al. in [32], Luo et al. [33] and Diaz-Londono et al. [34]. Finally, it is worth mentioning Ahmad’s contribution [35], which provides a detailed review of the effect of the location of EV charging stations on the distribution network’s parameters. All these previous works support the present contribution, although from a different perspective to that developed in this paper, which is focused on studying the technical impact of the penetration level of EVs on a real distribution network, regarding voltage profiles, active power transferred from the external network and power losses. This is highly useful in demonstrating the reinforcement measures that distribution system operators (DSO) should implement in these power grids.

1.2. Contents of This Article

Following this introduction and brief analysis of the state of the art, this paper is structured as follows: Section 2 explains the methodology and material used to develop the study, describing the time profiles and the simulation software used, as well as the main characteristics of the distribution network studied. Section 3 describes the scenarios used for comparative analysis of voltage profiles, active power flow from the external grid to the distribution network and power losses. This comparison is presented in Section 4, where the results obtained from the simulations are presented. Finally, the discussion of results and conclusions drawn from the analysis are summarized in Section 5.

2. Materials and Methods

The distribution network proposed for the present work was implemented in the calculation software DIgSILENT PowerFactory, one of the most versatile and widely used tools for analyzing electrical power systems, such as transmission and distribution networks. Moreover, the possibilities of this software are even more useful when implementing smart grid-based solutions, such as integrating DG units or plug-in EV charging stations into the electric networks. Different load flows spaced at a user-defined time are calculated for this study by performing quasi-dynamic simulations with software tools. These consider the operating parameters of the network at a point in time given a specific profile, but if several load flows are resolved, the time-dependence of the system can be analyzed, thus predicting its future behavior.
In this work, residential loads and photovoltaic generation have been considered to have hourly variations, with profiles shown in Figure 1. All profiles were defined with an hourly time step and in relation to the load and generation values with which they are associated. In this way, the nominal power demanded or generated is multiplied by a scaling factor depending on the time of the day. To run the quasi-dynamic simulations in a realistic manner, a load profile adapted to residential use was defined (Figure 1a, published in the authors’ paper at CIRED 2022 Porto workshop [36]) using the information provided by Proedrou [13] and Gottwalt et al. [14]. In addition to this load profile, a PV generation profile (Figure 1b) was also incorporated into each of the DG units connected to the network, based on actual data of solar PV generation published by the ENTSO-E Transparency Platform [37].
The characteristics of the most widely sold EV models were investigated in order to define a realistic theoretical model of an EV to determine its charging requirements. In addition to the characteristics that help design the charging stations, it is necessary to know the number of EVs connected to the modeled distribution network in order to calculate the required loads. Statistical data, such as those provided by the Hellenic Statistical Authority [15], were used for this purpose. Based on the number of registered passenger cars and the percentage of EVs sold in Greece, it was determined that the area covered by the distribution network of this study has 2000 EV on the roads. To perform worst-case simulations, i.e., the scenario with the highest load consumption, 100% of these vehicles are assumed to be connected to the grid for charging. In the case of EVs being used as a power supply at times of peak grid demand through V2G technology, the impact of modifying the percentage of EVs injecting power into the grid is studied.
The amount of energy needed to charge the EVs was calculated based on an average of 40 km per day of use (information obtained from the Spanish National Statistics Institute [16], as no data could be found for Greece) and an average consumption of 15.40 kWh/100 km. Equation (1) estimates the daily discharge of the EV battery, obtaining a result of 6.16 kWh per day, and Equation (2) is used to calculate the state-of-charge (SOC) of the battery when the vehicle is connected to the charging station, derived from the technical article by Murnane and Ghazel [17]. For this case, as the average battery capacity is 48.70 kWh and the SOC is 87.35 %.
D = C o n s · D i s t ,
where D is the discharge of EV batteries (in kWh), C o n s is the consumption of EVs per 100 km (in kWh/100 km) and D i s t is the average daily distance traveled by the EVs (in km).
S O C = C a p D C a p · 100 ,
where SOC is the state-of-charge of the batteries (%) and C a p is the battery capacity of EVs (in kWh). D is calculated according to Equation (1).
With these two values, the energy obtained from the grid to charge the EVs and the charging time can be calculated using Equations (3) and (4), respectively, based on the article by Klayklueng et al. [18]. As the proposed distribution power system is mainly based on a residential network, the charging stations for EVs are slow-charging, typical of facilities where the vehicle will be parked for several hours. These chargers have a maximum power of 3.70 kW and an efficiency of 80%, based on information given by installers of EV charging stations [19].
E c h a r g e = 1 S O C 100 · C a p η c h a r g e ,
where E c h a r g e is the energy obtained from the grid to charge EVs (in kWh) and η c h a r g e is the charger efficiency. SOC is calculated according to Equation (2).
t c h a r g e = 1 S O C 100 · C a p P c h a r g e · 1 η c h a r g e = E c h a r g e P c h a r g e ,
where t c h a r g e is the charging time of EVs (in hours), P c h a r g e is the maximum power of charging stations (in kW) and η c h a r g e is the charger efficiency. SOC and E c h a r g e are calculated according to Equations (2) and (3), respectively.
Thus, according to Equations (3) and (4), respectively, an energy of 7.70 kWh and a charging time of 2 h is required per day. Once the charging requirements and the number of loads associated with the EVs distributed in the grid are known it is possible to determine the value of the loads associated with EV charging stations. The design characteristics considered are shown in Table 1. In addition to these, what also defines the EV loads in a quasi-dynamic simulation is their time profile.

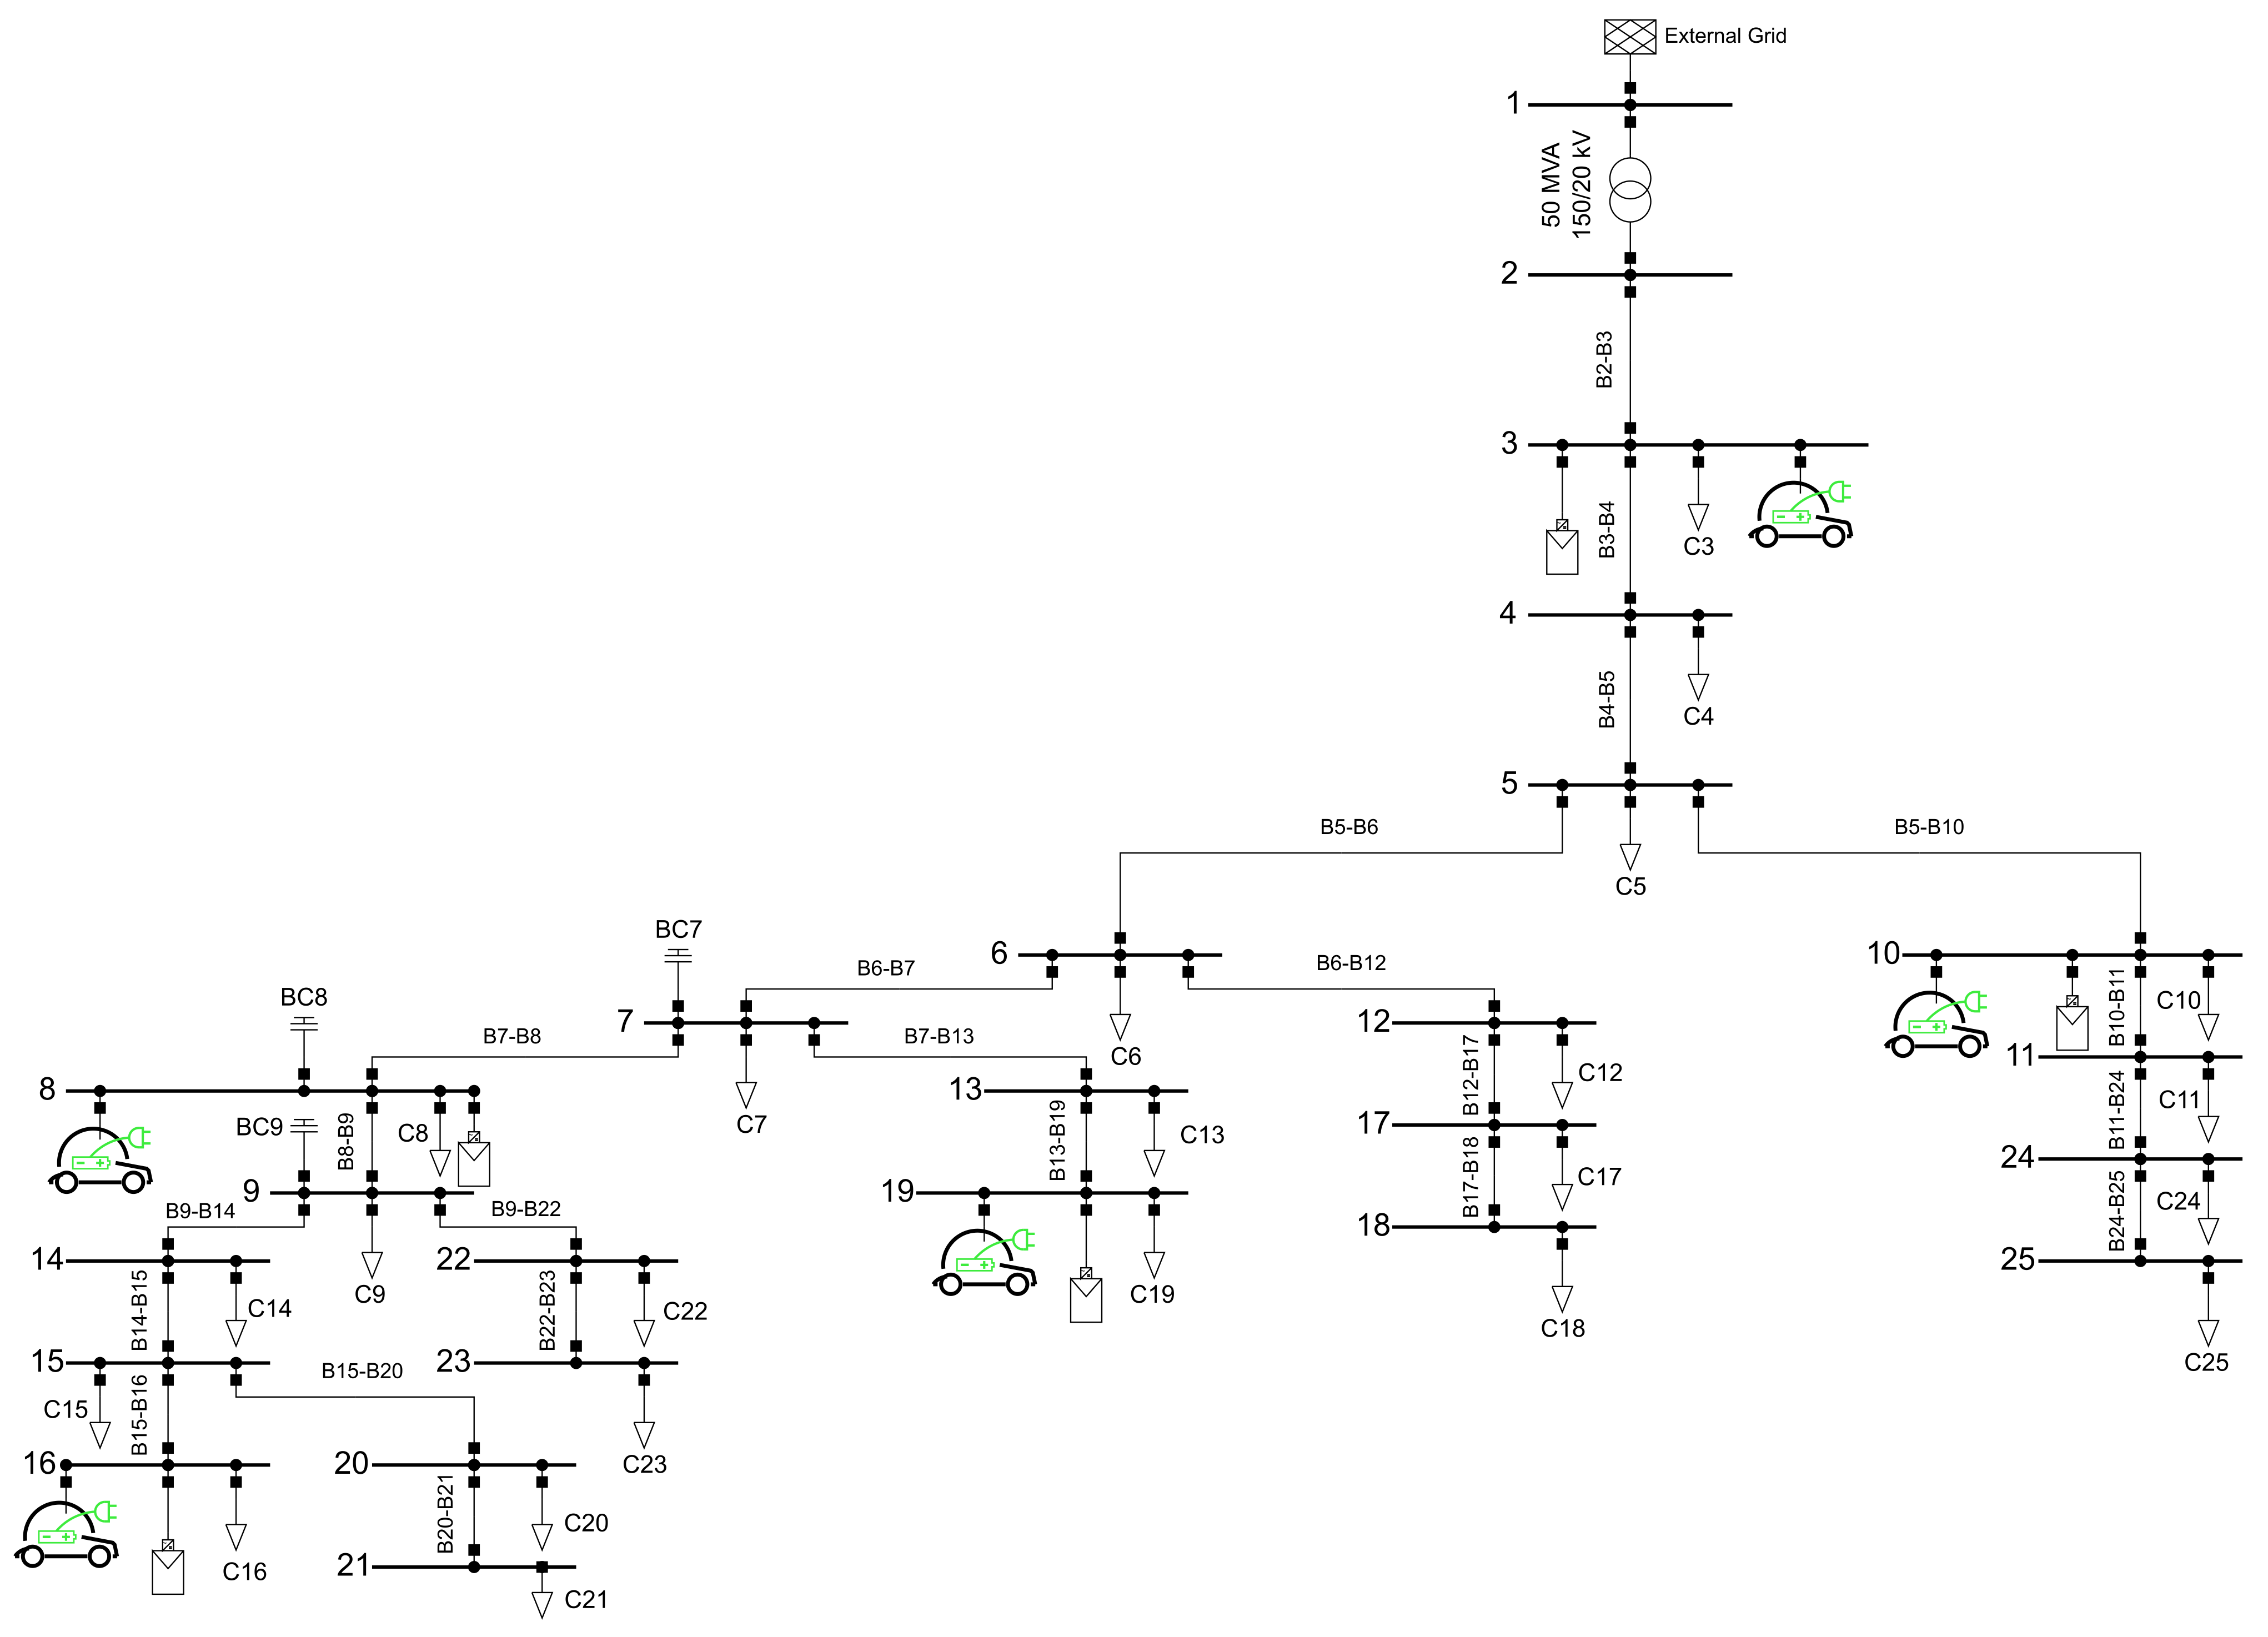
Medium-Voltage Network

Using DIgSILENT PowerFactory software, a typical medium-voltage (MV) distribution network in Greece, managed by the Greek DSO HEDNO, is modeled and simulated. Figure 2, published in the authors’ paper at CIRED 2022 Porto workshop [36], illustrates the simulation model. Based on the planning of the area, it is assumed that the DG units relying on solar PV generation can only be placed in certain areas (buses 3, 8, 10, 16 and 19) of the network, as reported by Anastasiadis [10]. EV charging stations are connected in these areas.
The 20 kV MV distribution network shown in Figure 2 is fed from an external 150 kV transmission network by a 50 MVA nominal power transformer. Following the results reported by Anastasiadis [10], where different scenarios are studied by modifying the DG penetration level, for this study, each of the DG units have a nominal power of 2 MW, and three capacitor banks (buses 7, 8 and 9) of 0.9 MVAr each are connected to compensate for the reactive power of the grid. As an initial step to perform the simulations, this distribution network modeled in PowerFactory software was validated according to the results presented in [10].

3. Case Studies

In order to study the technical impact of the penetration level of EVs on a real distribution network, six scenarios with different quantities of EVs incorporating V2G technology were considered, from a reference scenario without EV charging stations to considering that 50% of the EVs in the area are able to supply power to the grid from their batteries.

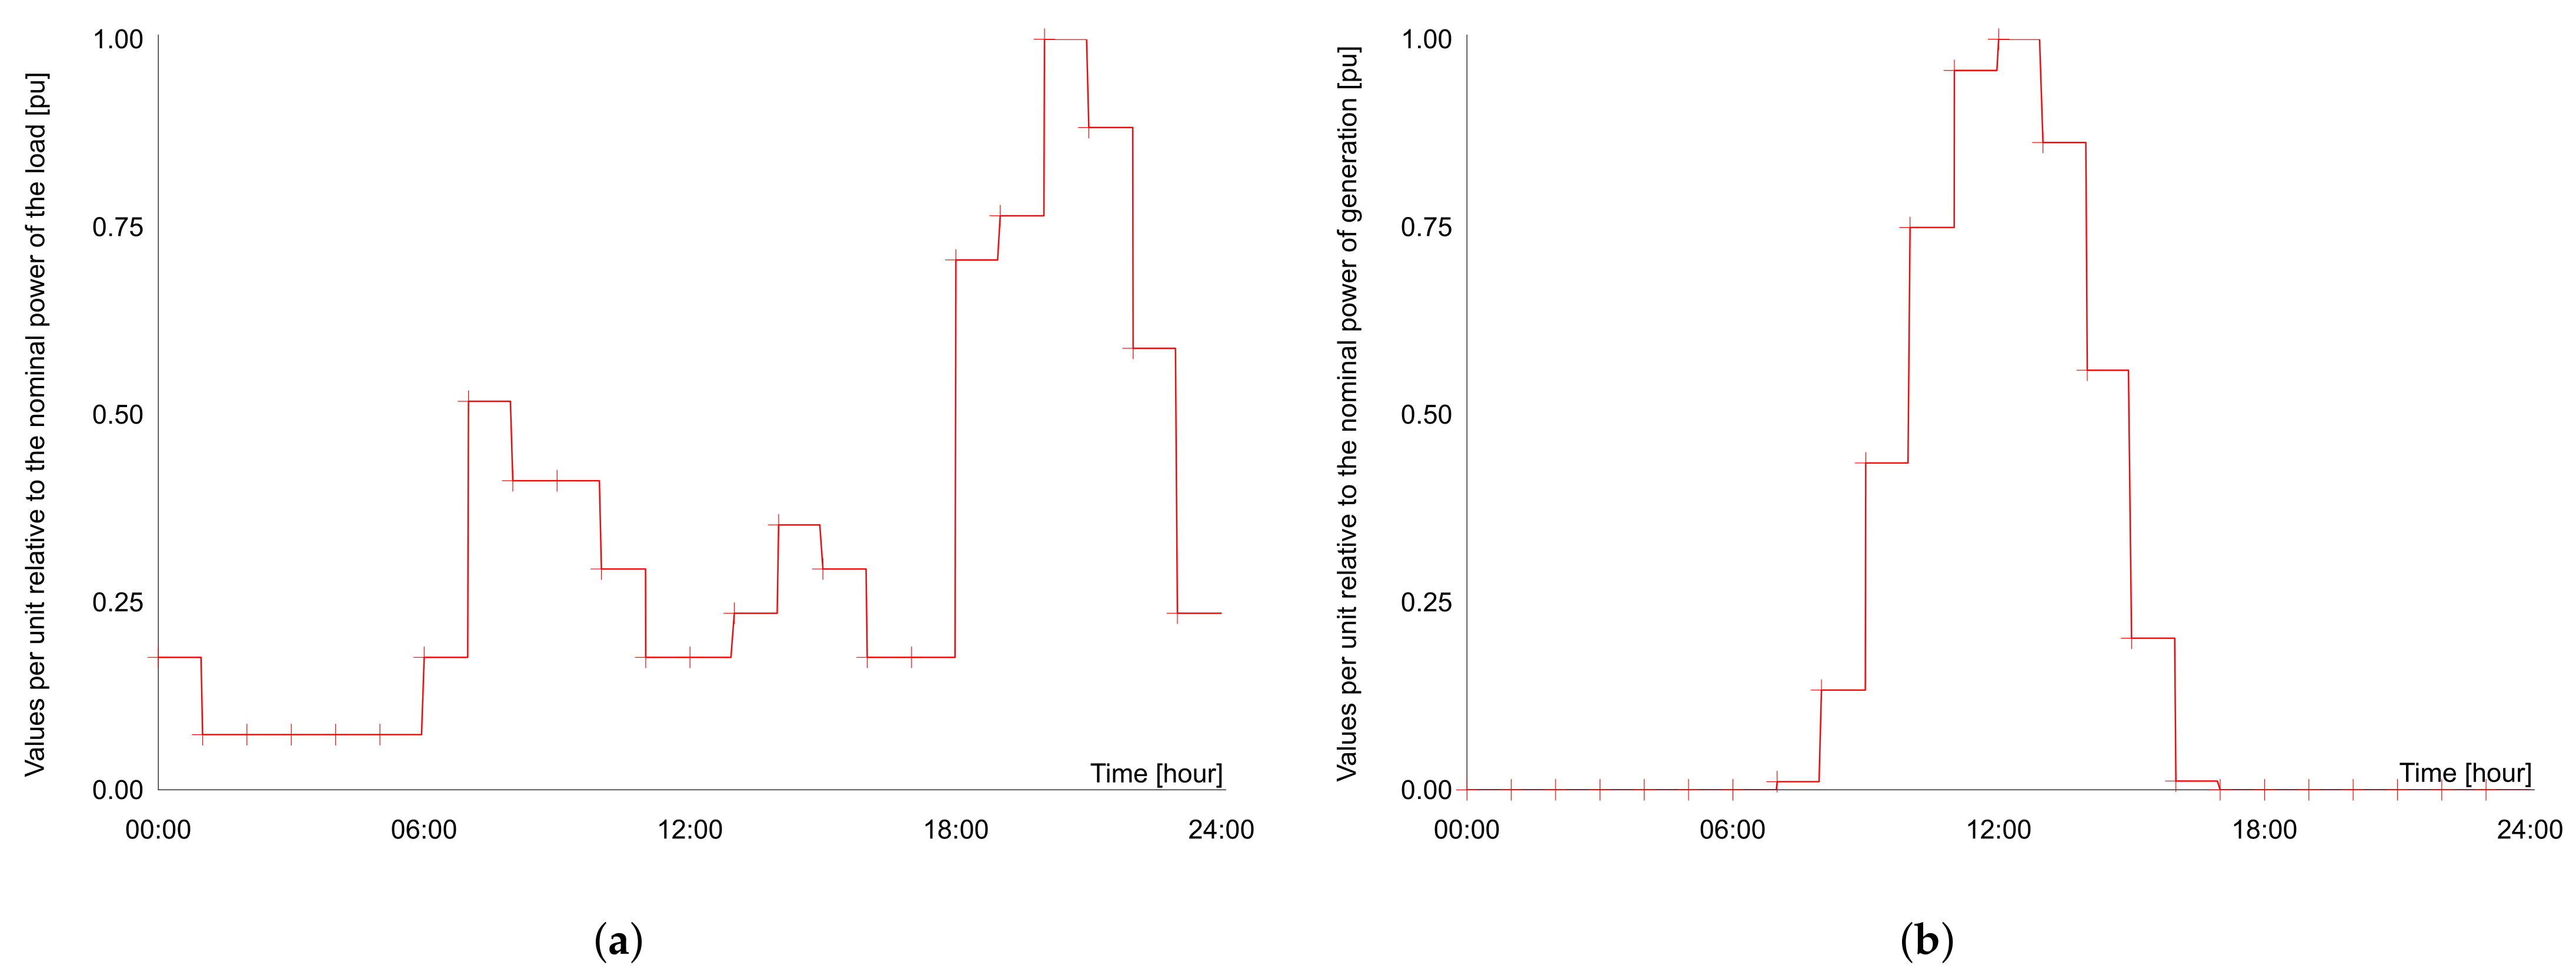
3.1. Baseline Scenario with DG Integration

This scenario is set as a reference to understand the influence and impact of EV charging stations connected to the distribution network. As discussed above, each solar PV power plant has a generation of 2 MW, making 10 MW of DG in the grid. For this scenario, the EV loads shown in Figure 2 are defined as “Out of Service” in order not to consider any influence of the charging stations.

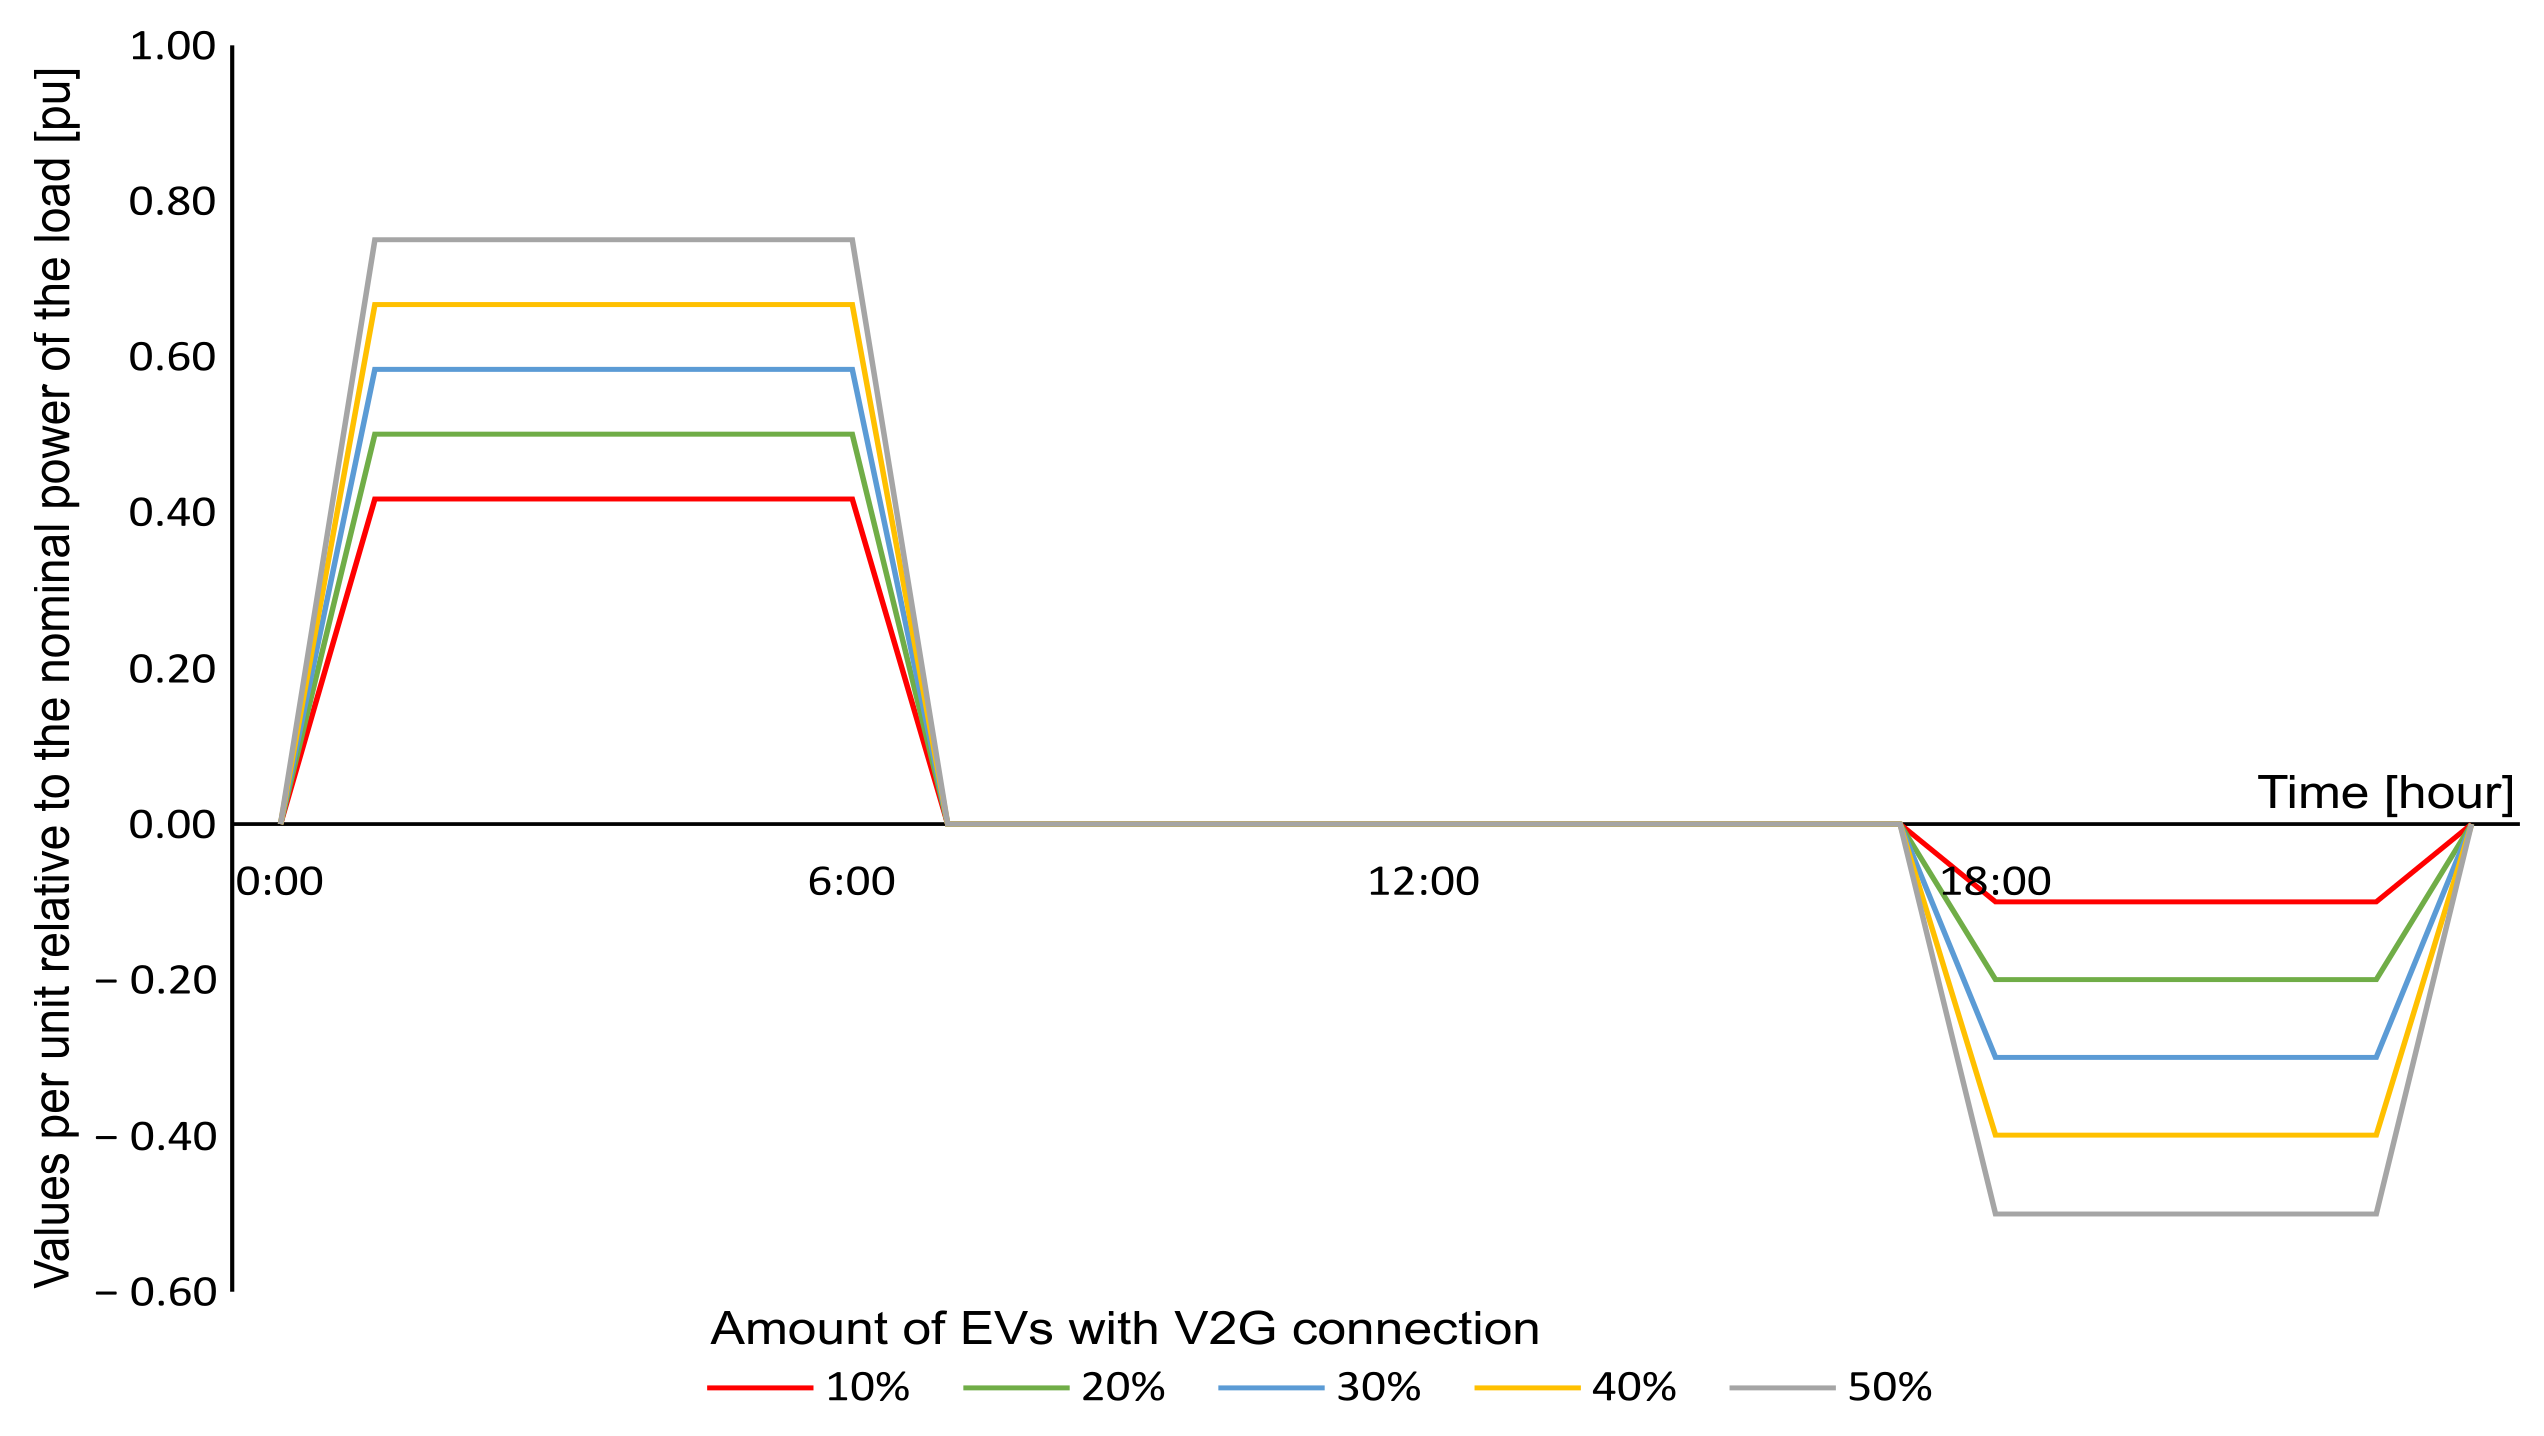
3.2. EV Scenarios with V2G Connection

In this case study, all users of EVs are assumed to have a special electricity tariff that provides for three energy billing periods, depending on hourly ranges. The most economical period for charging this type of vehicle is from 01:00 h to 07:00 h, and therefore the vehicle is supposed to arrive home and plug into the station, but the charger has a user-defined schedule that prevents the EV from charging until the set time is met. For normal use of the vehicle, considering a charging energy of 7.70 kWh for each EV, calculated according to Equation (3), and assuming the special period of 6 h, the power required to charge the vehicles homogeneously during the entire period is 1.28 kW for each EV, which is 34.68 % of the maximum power that a charger can supply.
In order to analyze the impact of V2G technology, between 10% and 50% of EVs connected are assumed to have the capacity to transfer their battery power to the grid at times of peak demand. This helps EV users more rapidly obtain profitability by supplying electricity during the most expensive hours and consuming it during the most economical ones. In this way, EVs inject energy into the grid for 5 h, from 18:00 h to 23:00 h, according to the peak demand period shown in Figure 1b. This power is charged uniformly during the 6 h of the night period, from 01:00 h to 07:00 h. This power is additional to that involved in the normal use of EV (calculated above).
Since in each of these five scenarios the load depends on the number of EVs with V2G, the quasi-dynamic profile is adapted according to the penetration of vehicles. It is worth noting that, as the total area covered by the distribution network contains 2000 EVs, a load proportional to 400 EVs per node is considered at each of the five nodes. Therefore, if the power of the EV charging stations is 3.70 kW, the nominal power of each of the five loads is 1480 kW. Equations (5) to (8), drawn by the authors, show the calculations performed to generate the load profile.
P n o r m a l u s e = E c h a r g e · n E V s t c h a r g i n g p e r i o d ,
where P n o r m a l u s e is the power discharged from the EV batteries due to normal operation of the vehicles (in kW), n E V s is the number of EVs associated with that load and t c h a r g i n g p e r i o d is the duration of the charging period (in hours). E c h a r g e is calculated according to Equation (3).
P V 2 G d i s c h a r g e = E V 2 G d i s c h a r g e t c h a r g i n g p e r i o d = P c h a r g e · n E V s · % V 2 G · t i n j e c t i o n p e r i o d t c h a r g i n g p e r i o d ,
where P V 2 G d i s c h a r g e is the power discharged from the EV batteries due to energy injection with V2G technology (in kW), % V 2 G is the percentage of EVs with V2G and t i n j e c t i o n p e r i o d is the duration of the period in which energy is injected from the EVs to the grid (in hours).
P c h a r g i n g p e r i o d = P n o r m a l u s e + P V 2 G d i s c h a r g e ,
where P c h a r g i n g p e r i o d is the power of the load in the period from 01:00 h to 07:00 h (in kW). P n o r m a l u s e and P V 2 G d i s c h a r g e are calculated according to Equations (5) and (6), respectively.
P i n j e c t i o n p e r i o d = P c h a r g e · n E V s · % V 2 G ,
where P i n j e c t i o n p e r i o d is the power of the load in the period from 18:00 h to 23:00 h (in kW).
To explain the applied methodology, a case study of 50% EV with V2G connection will be used as an example. All the values involved in this scenario, both design and calculated, are shown in Table 2. This method is followed for each of the scenarios, obtaining the power of the load in the period from 01:00 h to 07:00 h ( P c h a r g i n g p e r i o d ) and from 18:00 h to 23:00 h ( P i n j e c t i o n p e r i o d ).
Therefore, the load profile shown in Figure 3 illustrates two clear situations, a period for charging the EVs and a phase for feeding energy from the batteries into the grid:
  • From 01:00 h to 07:00 h, all vehicles are being charged, both those with and without V2G technology, based on Equation (7). To calculate the amount of power that needs to be supplied during this period, the normal discharge of EVs due to driving, according to Equation (5), and the additional discharge of EVs with V2G when injecting energy into the grid (in another time period), according to Equation (6), are assumed.
  • From 18:00 h to 23:00 h, negative load values are presented, which implies that energy is being injected into the electrical system from the EV batteries. In this period, only those EVs with a V2G connection are considered, based on Equation (8). EVs incorporating V2G technology have been proven to have enough energy to inject into the grid. Considering the average capacity of current EVs, the SOC of the batteries, calculated based on Equation (2), is 87.35%. This represents the amount of available energy ( 42.54 kWh) that can be injected into the electric system from the batteries in case of V2G capacity. The authors have considered that V2G-capable vehicles will have power limitations imposed by the charger. Thus, since the EV charging station has a power of 3.70 kW, it will be able to inject that amount of power in the period of 5 h, i.e., an energy of 18.50 kWh, which is below the energy capable of being injected into the grid.
To clarify these load profiles, Table 3 presents the assumptions applied based on Equations (7) and (8) provided by the authors.

4. Results and Analysis

This study evaluates the impact of EV charging stations on the voltage profiles of the grid buses and on the active power flow with regard to the grid upstream the simulated distribution network (external grid in Figure 2).

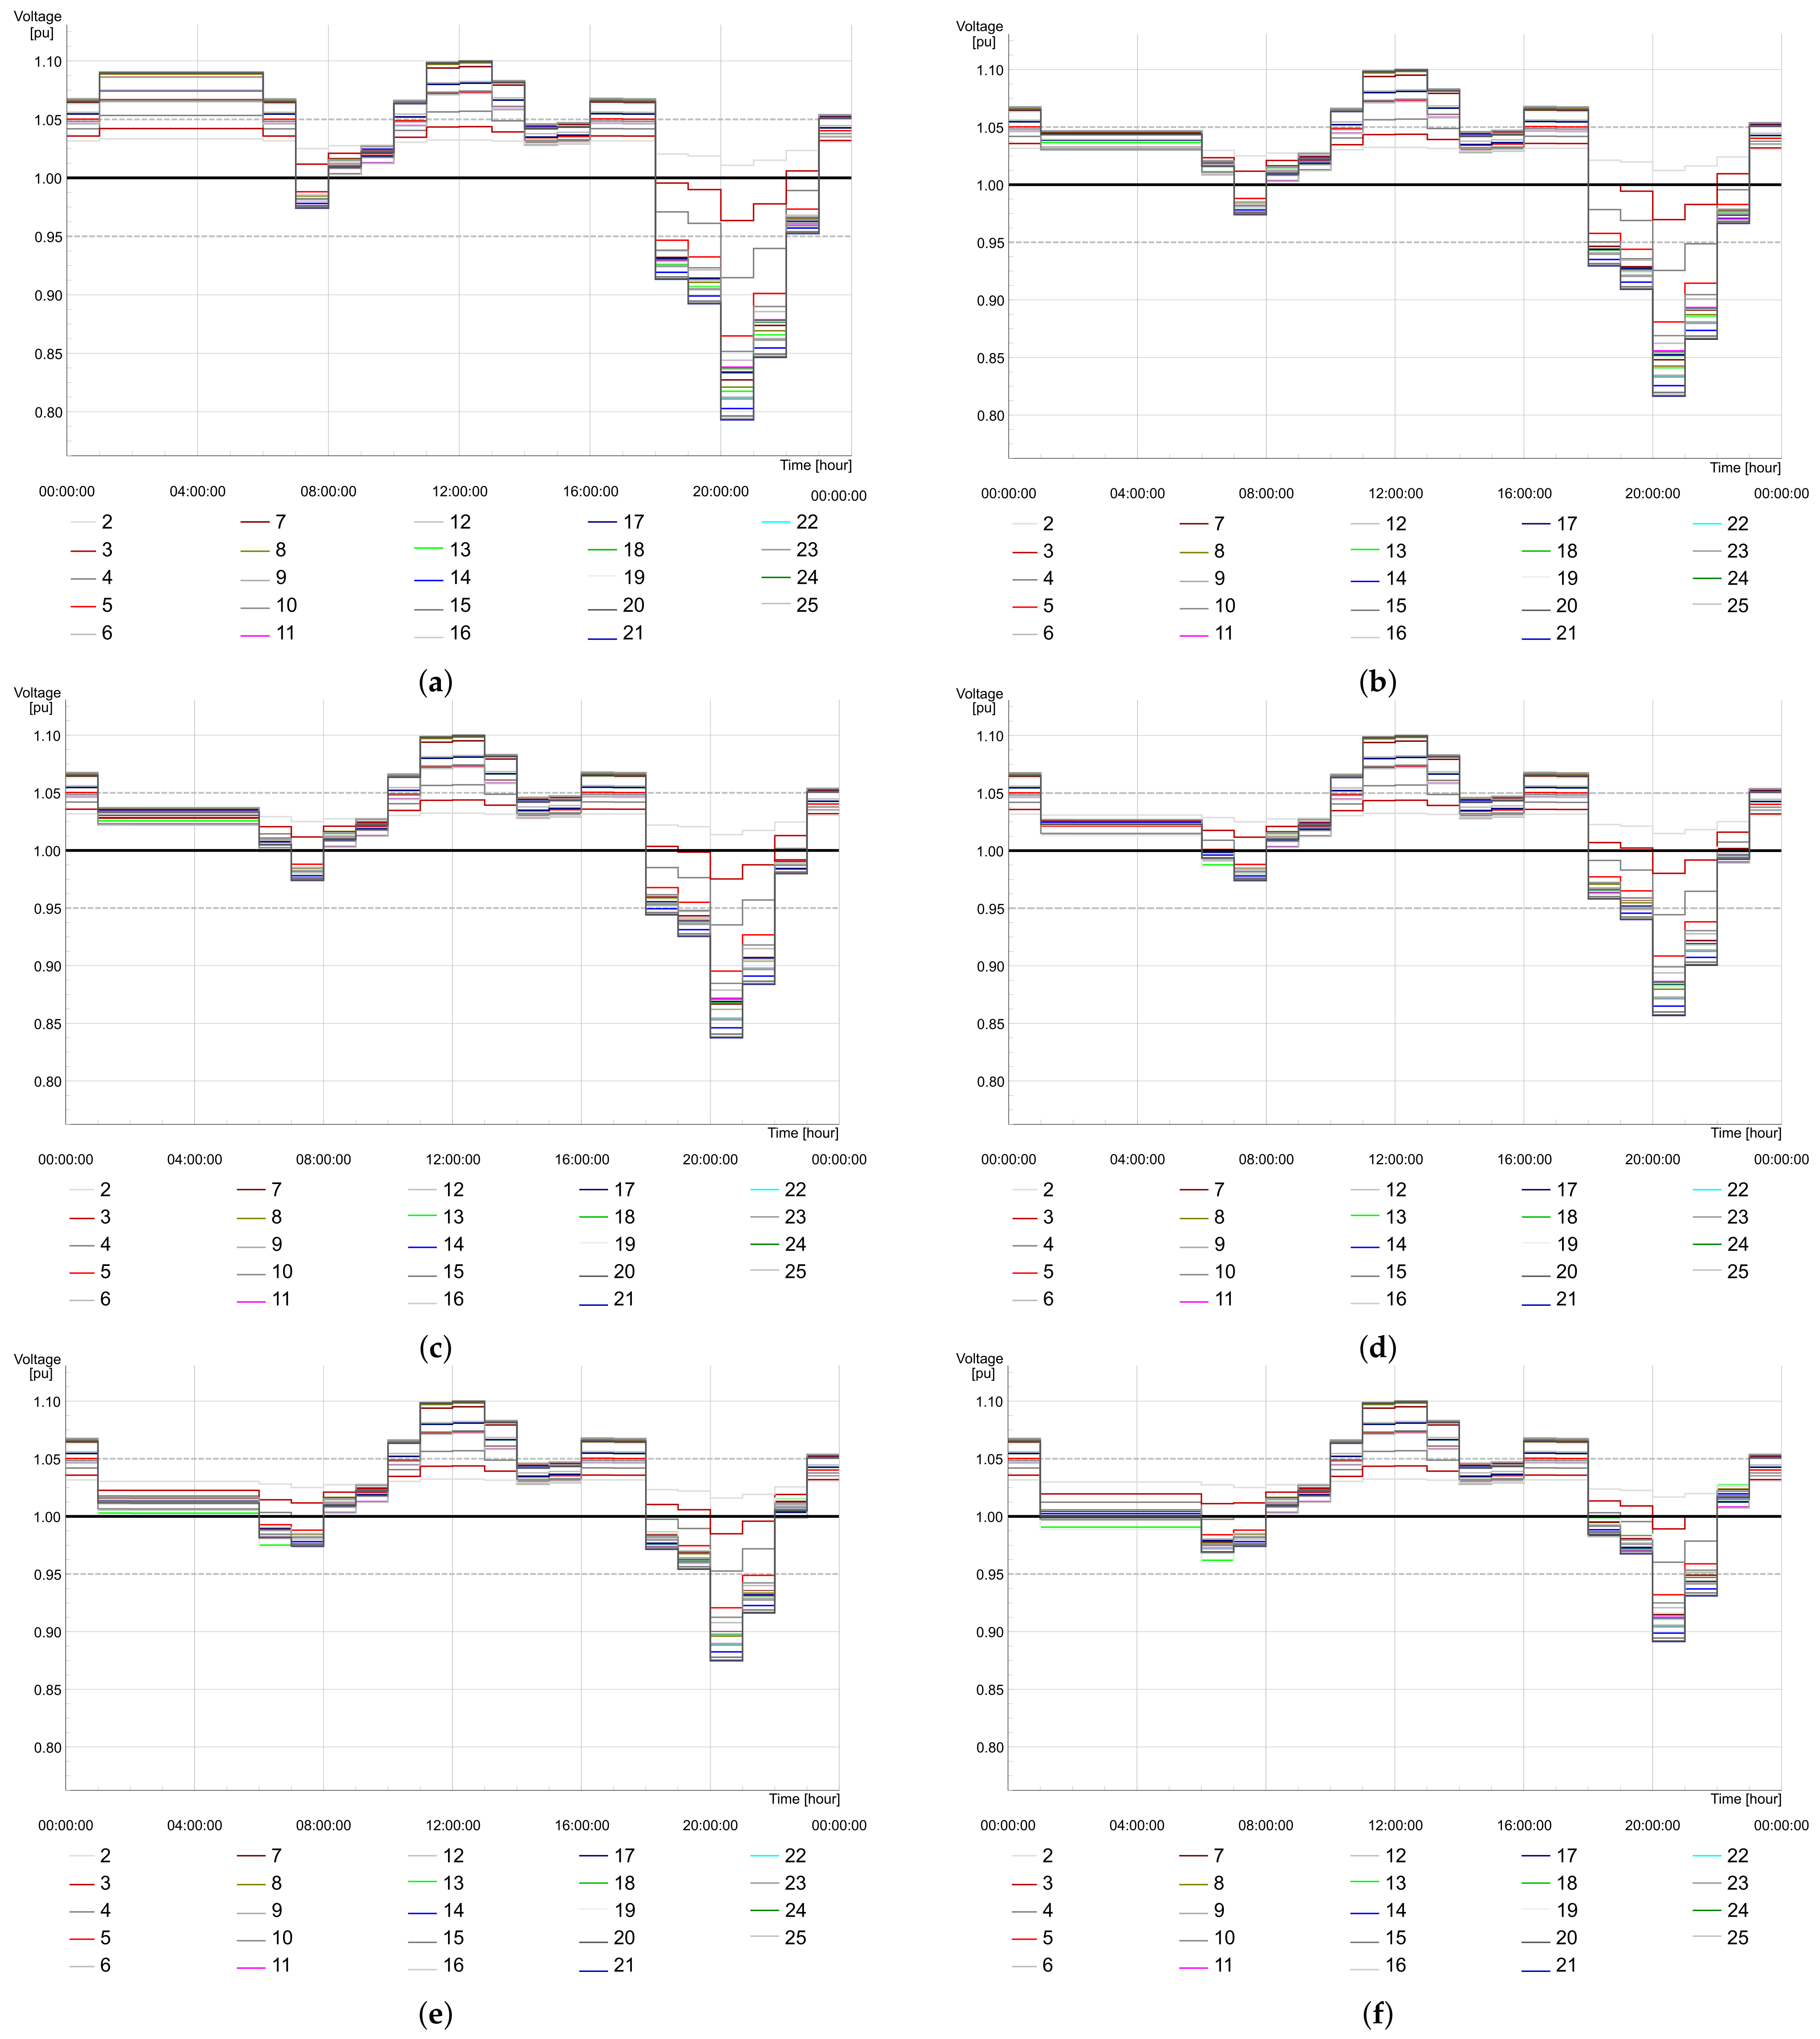
4.1. Voltage Profiles of the System Nodes

The voltage profiles shown in Figure 4 highlight the influence of EVs with a V2G connection on the distribution network. The nominal voltage (1 pu) is highlighted (in black) in each subfigure. Since all the nodes represented are located downstream of the transformer, this nominal voltage corresponds to 20 kV. Node 1 of the distribution network shown in Figure 2, where the external grid is connected, is maintained at its nominal voltage, which in this case is 150 kV, upstream of the transformer.
In the baseline scenario (Figure 4a), an inversely similar trend to that of the residential load profile (Figure 1a) is observed, as there are no EVs connected to the network. This reference scenario (Figure 4a) reveals that very low voltage values are obtained from 18:00 h to 22:00 h, corresponding to the period of maximum demand of the network. This suggests that supply issues may be detected in the network, and, therefore, its quality and reliability is not adequate.
Additionally, Figure 4a also shows overvoltage values in the periods of low demand early in the morning and at midday. This occurs because of the Ferranti effect, which is produced by the pi equivalent model of the lines. In this case, the voltage rises at the end of the receiving line due to the transmission of a weak load through the line. In other words, when there is high power transmission through the line, the line consumes reactive power and the voltage at the output is lower than at the input. However, when the power transmitted is low, the inverse situation appears [12]. This might involve a safety issue for the end user, since the voltage allowed by the electrical devices may be exceeded. For these reasons, it has been proved that the network, in this reference scenario, would not operate correctly, and that it is necessary to consider actions to correct these adverse effects.
Moreover, in all scenarios, high voltage values are obtained at midday, proving that it would not be necessary to integrate so many DG units because the network is not so heavily loaded.
The main effect of V2G technology over voltage profiles is that, with the increase in the number of EV charging stations integrated in this connection, a flatter, i.e., more ideal, voltage profile is achieved, close to the nominal voltage. This is because the aim is to inject power as if it were an energy storage system connected to the grid, providing support during high-load periods. By being able to configure this injection period thanks to the smart charger, these results are not only valid with residential loads, but can also be applied to other load profiles.
In addition, for the charging of these EVs, special tariff periods are available, designed to take advantage of times when the grid is less loaded in order to balance the voltage of the buses. For example, Figure 4f shows that in the period of the special tariff (from 01:00 h to 07:00 h), the voltage of most of the nodes is close to a nominal value. This also illustrates that there may be a point when a high level of EVs with V2G connections may not be favorable because high loads due to charging these vehicles will lead to low voltages.

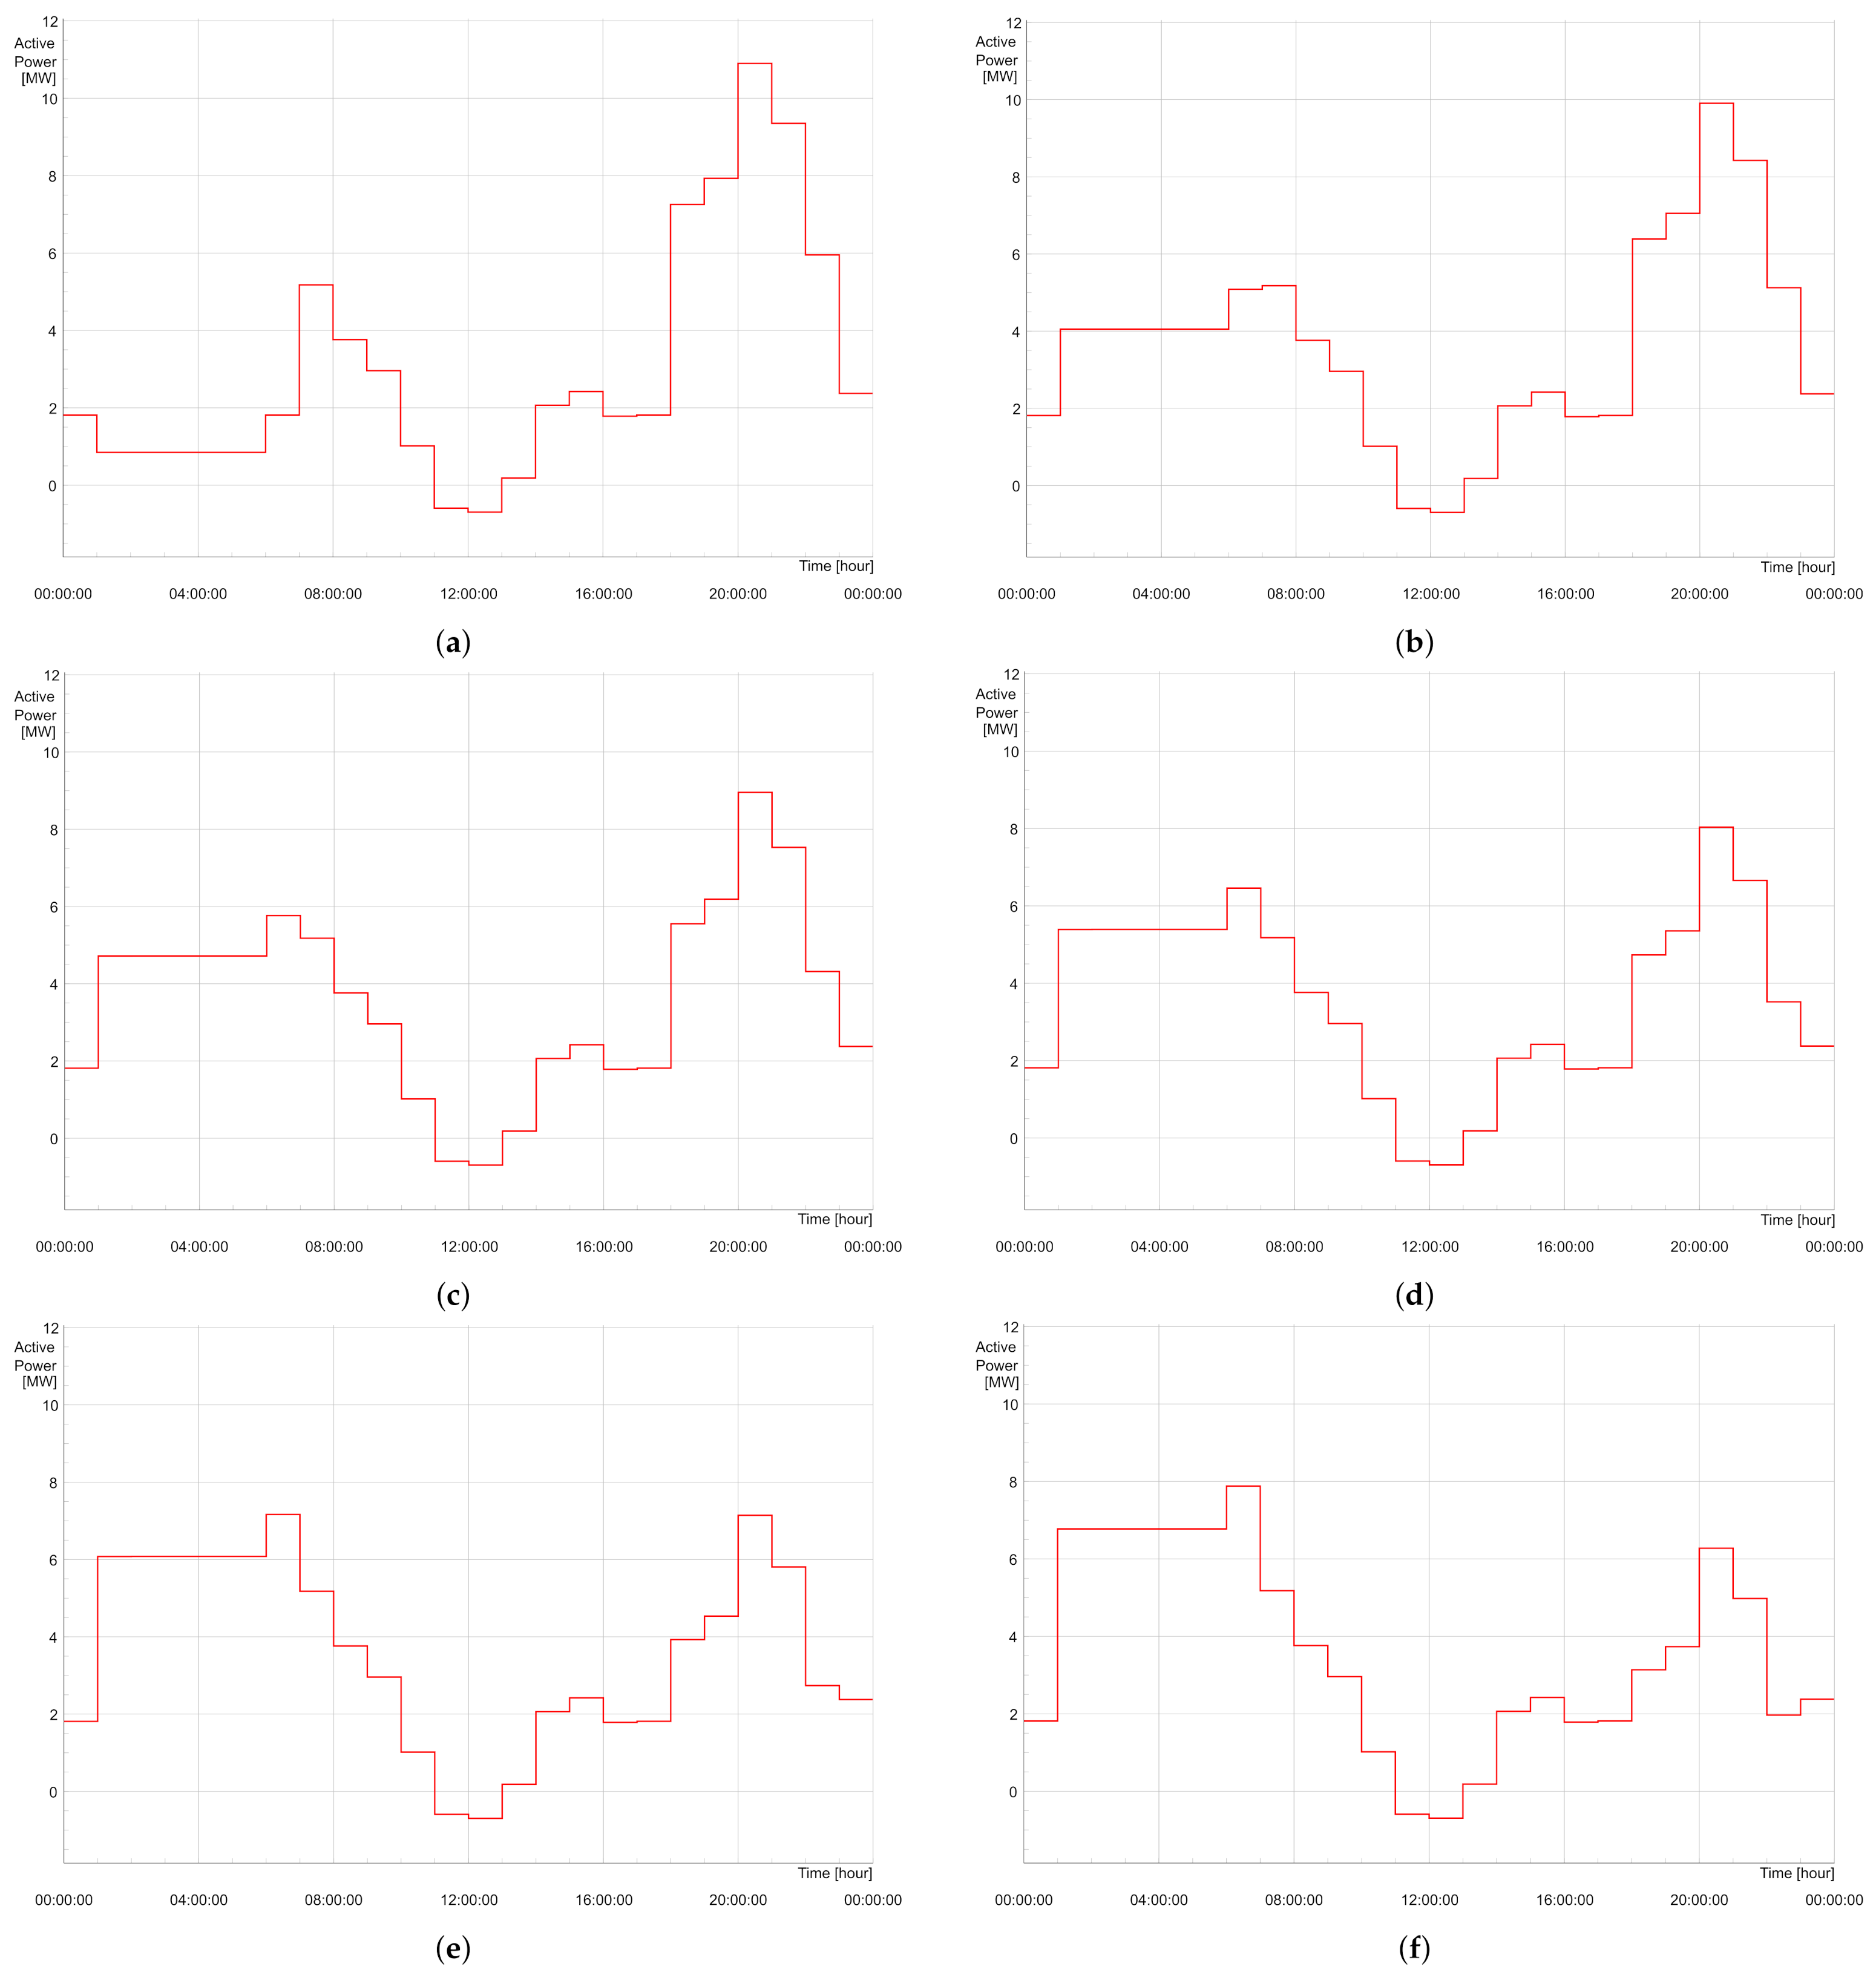
4.2. Active Power Flow Profiles and Losses of the System

The present work also studied the impact of EV charging stations on the active power flow with the external grid, as shown in Figure 5. In the baseline scenario (Figure 5a), without implementing a V2G connection, the high power demand of the distribution network between 18:00 h and 21:00 h can be highlighted, given that all loads follow the same residential profile defined in Figure 1a. With the increase in EVs with V2G technology, a significant reduction in the power flow with the external grid in the peak demand period is achieved, since power is supplied directly from the EV batteries without relying significantly on the upstream grid. This reduction in power flow means that energy must travel shorter distances and, therefore, there is not much power loss in the overall system, as shown in Table 4.
In contrast, the progress of the proposed scenarios also demonstrates the impact of charging EVs in the early morning, the period allowed by the special tariff (from 01:00 h to 07:00 h). A notable increase in the power required by the MV network is observed, especially if the baseline scenario (Figure 5a) is compared to the study case with the largest number of EVs with a V2G connection (Figure 5f). As seen in Table 4, with this increase, a high percentage of EVs will be achieved. Due to their charging, this will introduce a very high load, causing the power to be supplied from the external grid and, therefore, more power losses will be obtained in the entire power system. Figure 5e also shows that a balance is obtained between the charge of EVs and their contribution to the grid.
On the other hand, negative values for active power flow at midday are observed in all scenarios. This reflects that power is exported to the external grid, upstream of the MV distribution network. This is known as reverse flow, because, traditionally, in a distribution network the power flow is unidirectional, from the generation connected in the high-voltage (HV) transmission grids to the demand side of the MV and LV distribution networks. Reverse flow appears because the energy generated over the network is too high for its consumption values. Here, PV generation takes place during a period where there is little demand, and therefore, since not all the energy generated is consumed, it must be exported upstream of the distribution network. An extremely high value of reverse flow is not obtained; thus, it is not expected to have any noticeable effect on the power losses of the system. However, if the impact of reverse flow were higher, reducing the number of DG units should be considered.

5. Discussion and Conclusions

This contribution focuses on studying the technical impact of the penetration level of EVs in a real distribution network in terms of their voltage profiles, active power transferred from the external grid and power losses, which is highly useful in demonstrating the reinforcement measures that DSOs must implement in these networks. The MV distribution network studied in this paper was designed in the DIgSILENT PowerFactory simulation software. To determine the loads associated with the EV charging stations, a calculation was made considering average and statistical values in order to obtain a theoretical model as realistic as possible.
The voltage profiles resulting from the simulations highlight the influence on the distribution network of EVs with V2G technology. The baseline scenario, without V2G connections, reveals that very low voltage values are obtained from 18:00 h to 23:00 h, corresponding to the period of maximum demand of the network. This suggests that supply issues may be detected in the network, and, therefore, its quality and reliability is not adequate. On the other hand, the baseline scenario also shows overvoltage values in the periods of lower demand, early in the morning and at midday, because of the Ferranti effect. In this case, the voltage rises at the end of the receiving line due to the transmission of a weak load through the line. This could cause a safety issue for the end user, since the voltage allowed by the electrical devices may be exceeded. The main effect of V2G on voltage profiles is that by connecting V2G technology and smart chargers that limit the charging hours of EVs, the distribution network can operate much more efficiently and with a greater balance between generation and demand, achieving a flatter, i.e., more ideal, profile, close to the nominal voltage, with the increase in the number of EV charging stations integrated in this connection.
The impact of EV charging stations on the active power flow with the external grid was also studied in the present work. With the increase in EVs with a V2G connection, a significant reduction in the power flow with the external grid in the peak demand period is achieved, since power is supplied directly from the EV batteries without relying greatly on the upstream grid. This reduction in power flow means that energy must travel shorter distances and, therefore, there is less power loss in the overall system. In contrast, the progress of the proposed scenarios also demonstrates the impact of charging EVs in the early morning, that is, the period allowed by the special tariff (from 01:00 h to 07:00 h). A notable increase in the power required by the MV network is observed and, in the case of there being a large number of EVs with a V2G connection, a very high load will be generated due to their charging. This will cause the power to be supplied from the external grid and, therefore, more power losses will be obtained in the entire power system.
Regarding the effect of DG units, both voltage and active power flow profiles show that it would be unnecessary to have such a high level of PV generation, since the highest generation does not coincide with the periods of peak demand of the grid. This leads to high voltage values at the network buses and reverse flow, causing the network to export power upstream because the demand of the network is not large enough. A possible solution to this effect could be to adjust vehicle charging to the period of maximum PV generation, although this would require a study of the residential occupancy profile or having EV charging stations at workplaces.

Author Contributions

Conceptualization and ideas: A.S.-G., R.V.-R., A.H.-E. and E.G.-L.; investigation: A.S.-G.; methodology and creation of models: A.S.-G. and R.V.-R.; supervision: R.V.-R., A.H.-E. and E.G.-L.; validation: A.S.-G., R.V.-R., A.H.-E. and E.G.-L.; visualization: A.S.-G.; writing—original draft: A.S.-G. All authors have read and agreed to the published version of the manuscript.

Funding

This research was partially funded by the Council of Communities of Castilla–La Mancha (Junta de Comunidades de Castilla–La Mancha, JCCM) through Project SBPLY/19/180501/000287; by the State Research Agency (Agencia Estatal de Investigación, AEI) and by the European Regional Development Fund (Fondo Europeo de Desarrollo Regional, FEDER) through project PID2021-126082OB-C21.

Institutional Review Board Statement

Not applicable because this study does not require ethical approval.

Informed Consent Statement

Not applicable because this study does not involve humans.

Data Availability Statement

The data are contained within this article. More information is available upon request.

Acknowledgments

The authors are thankful to the Regional Government of Castilla–La Mancha, the State Research Agency and the EU FEDER for funding this research. In addition, the authors would like to thank the editors and reviewers for their valuable comments and constructive suggestions.

Conflicts of Interest

The authors declare no conflict of interest.

Abbreviations

The following abbreviations are used in this manuscript:
DGDistributed Generation
DSODistribution System Operator
EEAEuropean Environmental Agency
ENTSO-EEuropean Network of Transmission System Operators for Electricity
EUEuropean Union
EVElectric Vehicle
GHGGreenhouse Gas
HVHigh Voltage
LEZLow-Emission Zones
LVLow-Voltage
MDPIMultidisciplinary Digital Publishing Institute
MVMedium-Voltage
PVPhotovoltaic
RESRenewable Energy Source
UCLMUniversity of Castilla–La Mancha
V2GVehicle-to-Grid

References

  1. Transport—European Environment Agency. Available online: https://www.eea.europa.eu/themes/transport (accessed on 6 February 2023).
  2. Colmenar-Santos, A.; Muñoz Gómez, A.M.; Rosales-Asensio, E.; López-Rey, A. Electric vehicle charging strategy to support renewable energy sources in Europe 2050 low-carbon scenario. Energy 2019, 183, 61–74. [Google Scholar] [CrossRef]
  3. EU Deal to End Sale of New CO2 Emitting Cars by 2035—European Commission Oficial Website. Available online: https://ec.europa.eu/commission/presscorner/detail/en/ip_22_6462 (accessed on 7 February 2023).
  4. Low Emissions Zones—Urban Access Regulations in Europe. Available online: https://urbanaccessregulations.eu/low-emission-zones-main (accessed on 7 February 2023).
  5. Hatziargyriou, N.; Karfopoulos, E.; Tsatsakis, K. The Impact of EV Charging on the System Demand. In Electric Vehicle Integration into Modern Power Networks; Garcia-Valle, R., Peças Lopes, J., Eds.; Springer: New York, NY, USA, 2013; pp. 57–85. [Google Scholar] [CrossRef] [Green Version]
  6. Documento Básico HE Ahorro de Energía—Sección HE6: Dotaciones Mínimas para la Infraestructura de Recarga de Vehículos Eléctricos. Available online: https://www.mitma.gob.es/recursos_mfom/audienciainfopublica/recursos/anejo_de_real_decreto.pdf (accessed on 8 March 2023).
  7. European Network of Transmission System Operators for Electricity (ENTSO-E). Electric Vehicle Integration into Power Grids; Technical Report, ENTSO-E; European Network of Transmission System Operators for Electricity (ENTSO-E): Brussels, Belgium, 2021.
  8. CIRCE. Deliberable (D) No: 6.1: Identification of the Scenarios and Distributed Intelligence Solutions. In Distributed Intelligence for Cost-Effective and Reliable Distribution Network Operation (DISCERN); Technical Report, DISCERN: Project coordinated by RWE; Germany Corporation: Essen, Germany, 2014. Available online: https://cordis.europa.eu/project/id/308913 (accessed on 8 February 2023).
  9. Verband der Netzbetreiber (VDN) (‘German Association of Electricity Network Operators’ in German). Daten und Fakten, Stromnetze in Deutschland 2007 (‘Data and Figures, Electricity Networks in Germany 2007’); Technical Report; German Association of Electricity Network Operators(VDN): Bonn, Germany, 2007; Available online: https://www.bundesnetzagentur.de/SharedDocs/Mediathek/Berichte/2007/Monitoringbericht2007Id12086pdf.html (accessed on 8 February 2023). (In German)
  10. Anastasiadis, A.G.; Kondylis, G.P.; Vokas, G.A. Effect of augmented distributed generation in distribution networks. Energy Rep. 2020, 6, 177–187. [Google Scholar] [CrossRef]
  11. Himabindu, N.; Hampannavar, S.; Deepa, B.; Swapna, M. Analysis of microgrid integrated Photovoltaic (PV) Powered Electric Vehicle Charging Stations (EVCS) under different solar irradiation conditions in India: A way towards sustainable development and growth. Energy Rep. 2021, 7, 8534–8547. [Google Scholar] [CrossRef]
  12. Honrubia-Escribano, A.; Villena-Ruiz, R.; Artigao, E.; Gómez-Lázaro, E.; Morales, A. Advanced teaching method for learning power system operation based on load flow simulations. Comput. Appl. Eng. Educ. 2021, 29, 1743–1756. [Google Scholar] [CrossRef]
  13. Proedrou, E. A Comprehensive Review of Residential Electricity Load Profile Models. IEEE Access 2021, 9, 12114–12133. [Google Scholar] [CrossRef]
  14. Gottwalt, S.; Ketter, W.; Block, C.; Collins, J.; Weinhardt, C. Demand side management-A simulation of household behavior under variable prices. Energy Policy 2011, 39, 8163–8174. [Google Scholar] [CrossRef]
  15. Road Transport, Vehicle Fleet Statistisc—Hellenic Statistical Authority. Available online: https://www.statistics.gr/en/statistics/-/publication/SME18/- (accessed on 8 February 2023).
  16. Km Medios Recorridos al año por los Vehículos pasa uso Personal, por Relación con la Actividad Económica de la Persona de Referencia y Antigüedad del Vehículo—Instituto Nacional de Estadística. Available online: https://www.ine.es/jaxi/Tabla.htm?path=/t25/p500/2008/p10/l0/&file=10020.px&L=0 (accessed on 8 February 2023).
  17. Murnane, M.; Ghazel, A. A Closer Look at State of Charge (SOC) and State of Health (SOH) Estimation Techniques for Batteries. Analog Devices 2017. Technical Article. Available online: https://www.analog.com/media/en/technical-documentation/technical-articles/acloser-look-at-state-of-charge-and-state-health-estimation-techniques.pdf (accessed on 8 February 2023).
  18. Klayklueng, T.; Dechanupaprittha, S.; Kongthong, P. Analysis of unbalance Plug-in Electric Vehicle home charging in PEA distribution network by stochastic load model. In Proceedings of the 2015 International Symposium on Smart Electric Distribution Systems and Technologies, EDST, Vienna, Austria, 8–11 September 2015. [Google Scholar] [CrossRef]
  19. LugEnergy2020ESP. Modos de Recarga Coches Eléctricos|Modo 1, 2, 3 y 4 —LuGenerGy. Available online: https://www.lugenergy.com/modos-de-recarga-vehiculos-electricos/ (accessed on 8 February 2023).
  20. Balsells Canals, J.F. Guía de Diseño de Aparcamientos Urbanos; Universitat Politècnica de Catalunya: Barcelona, Spain, 2004. [Google Scholar]
  21. Park, W.J.; Song, K.B.; Park, J.W. Impact of electric vehicle penetration-based charging demand on load profile. J. Electr. Eng. Technol. 2013, 8, 244–251. [Google Scholar] [CrossRef] [Green Version]
  22. Holland, S.P.; Mansur, E.T.; Muller, N.Z.; Yates, A.J. Are there environmental benefits from driving electric vehicles? The importance of local factors. Am. Econ. Rev. 2016, 106, 3700–3729. [Google Scholar] [CrossRef] [Green Version]
  23. Mwasilu, F.; Justo, J.J.; Kim, E.K.; Do, T.D.; Jung, J.W. Electric vehicles and smart grid interaction: A review on vehicle to grid and renewable energy sources integration. Renew. Sustain. Energy Rev. 2014, 34, 501–516. [Google Scholar] [CrossRef]
  24. Ma, C.T. System Planning of Grid-Connected Electric Vehicle Charging Stations and Key Technologies: A Review. Energies 2019, 12, 4201. [Google Scholar] [CrossRef] [Green Version]
  25. Khalid, M.R.; Alam, M.S.; Sarwar, A.; Jamil Asghar, M.S. A Comprehensive review on electric vehicles charging infrastructures and their impacts on power-quality of the utility grid. eTransportation 2019, 1, 100006. [Google Scholar] [CrossRef]
  26. Mancini, E.; Longo, M.; Yaici, W.; Zaninelli, D. Assessment of the Impact of Electric Vehicles on the Design and Effectiveness of Electric Distribution Grid with Distributed Generation. Appl. Sci. 2020, 10, 5125. [Google Scholar] [CrossRef]
  27. Lee, Z.J.; Lee, G.; Lee, T.; Jin, C.; Lee, R.; Low, Z.; Chang, D.; Ortega, C.; Low, S.H. Adaptive Charging Networks: A Framework for Smart Electric Vehicle Charging. IEEE Trans. Smart Grid 2021, 12, 4339–4350. [Google Scholar] [CrossRef]
  28. Yang, Y.; Tan, Z.; Ren, Y. Research on factors that influence the fast charging behavior of private battery electric vehicles. Sustainability 2020, 12, 3439. [Google Scholar] [CrossRef] [Green Version]
  29. Zhou, C.; Xiang, Y.; Huang, Y.; Wei, X.; Liu, Y.; Liu, J. Economic analysis of auxiliary service by V2G: City comparison cases. Energy Rep. 2020, 6, 509–514. [Google Scholar] [CrossRef]
  30. Aguilar-Dominguez, D.; Dunbar, A.; Brown, S. The electricity demand of an EV providing power via vehicle-to-home and its potential impact on the grid with different electricity price tariffs. In Proceedings of the 4th Annual CDT Conference in Energy Storage and Its Applications, Southampton, UK, 7–19 July 2019; Volume 6. [Google Scholar] [CrossRef]
  31. Aguilar-Dominguez, D.; Ejeh, J.; Dunbar, A.D.F.; Brown, S.F. Machine learning approach for electric vehicle availability forecast to provide vehicle-to-home services. Energy Rep. 2021, 7, 71–80. [Google Scholar] [CrossRef]
  32. Guo, S.; Qiu, Z.; Xiao, C.; Liao, H.; Huang, Y.; Lei, T.; Wu, D.; Jiang, Q. A multi-level vehicle-to-grid optimal scheduling approach with EV economic dispatching model. Energy Rep. 2021, 7, 22–37. [Google Scholar] [CrossRef]
  33. Luo, L.; Gu, W.; Zhou, S.; Huang, H.; Gao, S.; Han, J.; Wu, Z.; Dou, X. Optimal planning of electric vehicle charging stations comprising multi-types of charging facilities. Appl. Energy 2018, 226, 1087–1099. [Google Scholar] [CrossRef]
  34. Diaz-Londono, C.; Colangelo, L.; Ruiz, F.; Patino, D.; Novara, C.; Chicco, G. Optimal strategy to exploit the flexibility of an electric vehicle charging station. Energies 2019, 12, 3834. [Google Scholar] [CrossRef] [Green Version]
  35. Ahmad, F.; Iqbal, A.; Ashraf, I.; Marzband, M.; khan, I. Optimal location of electric vehicle charging station and its impact on distribution network: A review. Energy Rep. 2022, 8, 2314–2333. [Google Scholar] [CrossRef]
  36. Simarro-García, A.; Villena-Ruiz, R.; Honrubia-Escribano, A.; Gómez-Lázaro, E. Impacts of electric vehicle charging stations on a greek distribution network. In Proceedings of the CIRED Porto Workshop 2022: E-Mobility and Power Distribution Systems, Porto, Portugal, 2–3 June 2022. [Google Scholar]
  37. Actual Generation per Generation Unit—ENTSO-E. Available online: https://transparency.entsoe.eu/ (accessed on 8 February 2023).
Figure 1. Quasi-dynamic profiles: (a) Residential load, (b) PV generation.
Machines 11 00416 g001
Figure 2. HEDNO distribution network modeled in DIgSILENT PowerFactory.
Machines 11 00416 g002
Figure 3. Relative quasi-dynamic V2G load profiles.
Machines 11 00416 g003
Figure 4. Voltage profiles obtained in the HEDNO distribution network simulation (each color represents the node voltage of the electrical system): (a) Baseline scenario, (b) 10% of EVs with V2G, (c) 20% of EVs with V2G, (d) 30% of EVs with V2G, (e) 40% of EVs with V2G, (f) 50% of EVs with V2G.
Machines 11 00416 g004
Figure 5. Active power flow profiles with the external grid: (a) Baseline scenario, (b) 10% of EVs with V2G, (c) 20% of EVs with V2G, (d) 30% of EVs with V2G, (e) 40% of EVs with V2G, (f) 50% of EVs with V2G.
Machines 11 00416 g005
Table 1. Design characteristics considered.
EVs on the distribution network2000 EVs
Discharge of EV batteries 6.16  kWh
SOC 87.35 %
E c h a r g e 7.70  kWh
t c h a r g e 2 h
Table 2. EV scenario with 50% V2G connection (calculations for each node).
n E V s 400 EVs per node
% V 2 G 0.50 in this scenario
t c h a r g i n g p e r i o d 6 h
t i n j e c t i o n p e r i o d 5 h
E c h a r g e 7.70  kWh
P c h a r g e 3.70  kW
P c h a r g i n g p e r i o d 1130.00  kW
P i n j e c t i o n p e r i o d 740.00  kW
Table 3. Power requirements in EVs scenarios with V2G connection (calculations for each load).
ScenarioCharging Period (from 01:00 h to 07:00 h)Injection Period (from 18:00 h to 23:00 h)
10% of EVs with V2G 636.66  kW ( 0.43  pu) 148.00  kW ( 0.10  pu)
20% of EVs with V2G 760.00  kW ( 0.51  pu) 296.00  kW ( 0.20  pu)
30% of EVs with V2G 883.33  kW ( 0.60  pu) 444.00  kW ( 0.30  pu)
40% of EVs with V2G 1006.66  kW ( 0.68  pu) 592.00  kW ( 0.40  pu)
50% of EVs with V2G 1130.00  kW ( 0.76  pu) 740.00  kW ( 0.50  pu)
Table 4. Active power losses in the HEDNO distribution network for the different scenarios considered.
Baseline Scenario10% EVs20% EVs30% EVs40% EVs50% EVs
0.39  MW 0.30  MW 0.23  MW 0.17  MW 0.13  MW 0.10  MW
Disclaimer/Publisher’s Note: The statements, opinions and data contained in all publications are solely those of the individual author(s) and contributor(s) and not of MDPI and/or the editor(s). MDPI and/or the editor(s) disclaim responsibility for any injury to people or property resulting from any ideas, methods, instructions or products referred to in the content.

