

Laser Directed Energy Deposition-Based Additive Manufacturing of Fe20Cr5.5AlY from Single Tracks to Bulk Structures: Statistical Analysis, Process Optimization, and Characterization


Abstract
1. Introduction
2. Materials and Methods
2.1. Materials
2.2. LDED-PF of Fe20Cr5.5AlY
2.3. Characterization
3. Results and Discussion
3.1. Effect of Process Parameters
3.1.1. Track Width
3.1.2. Track Height
3.1.3. Build Rate
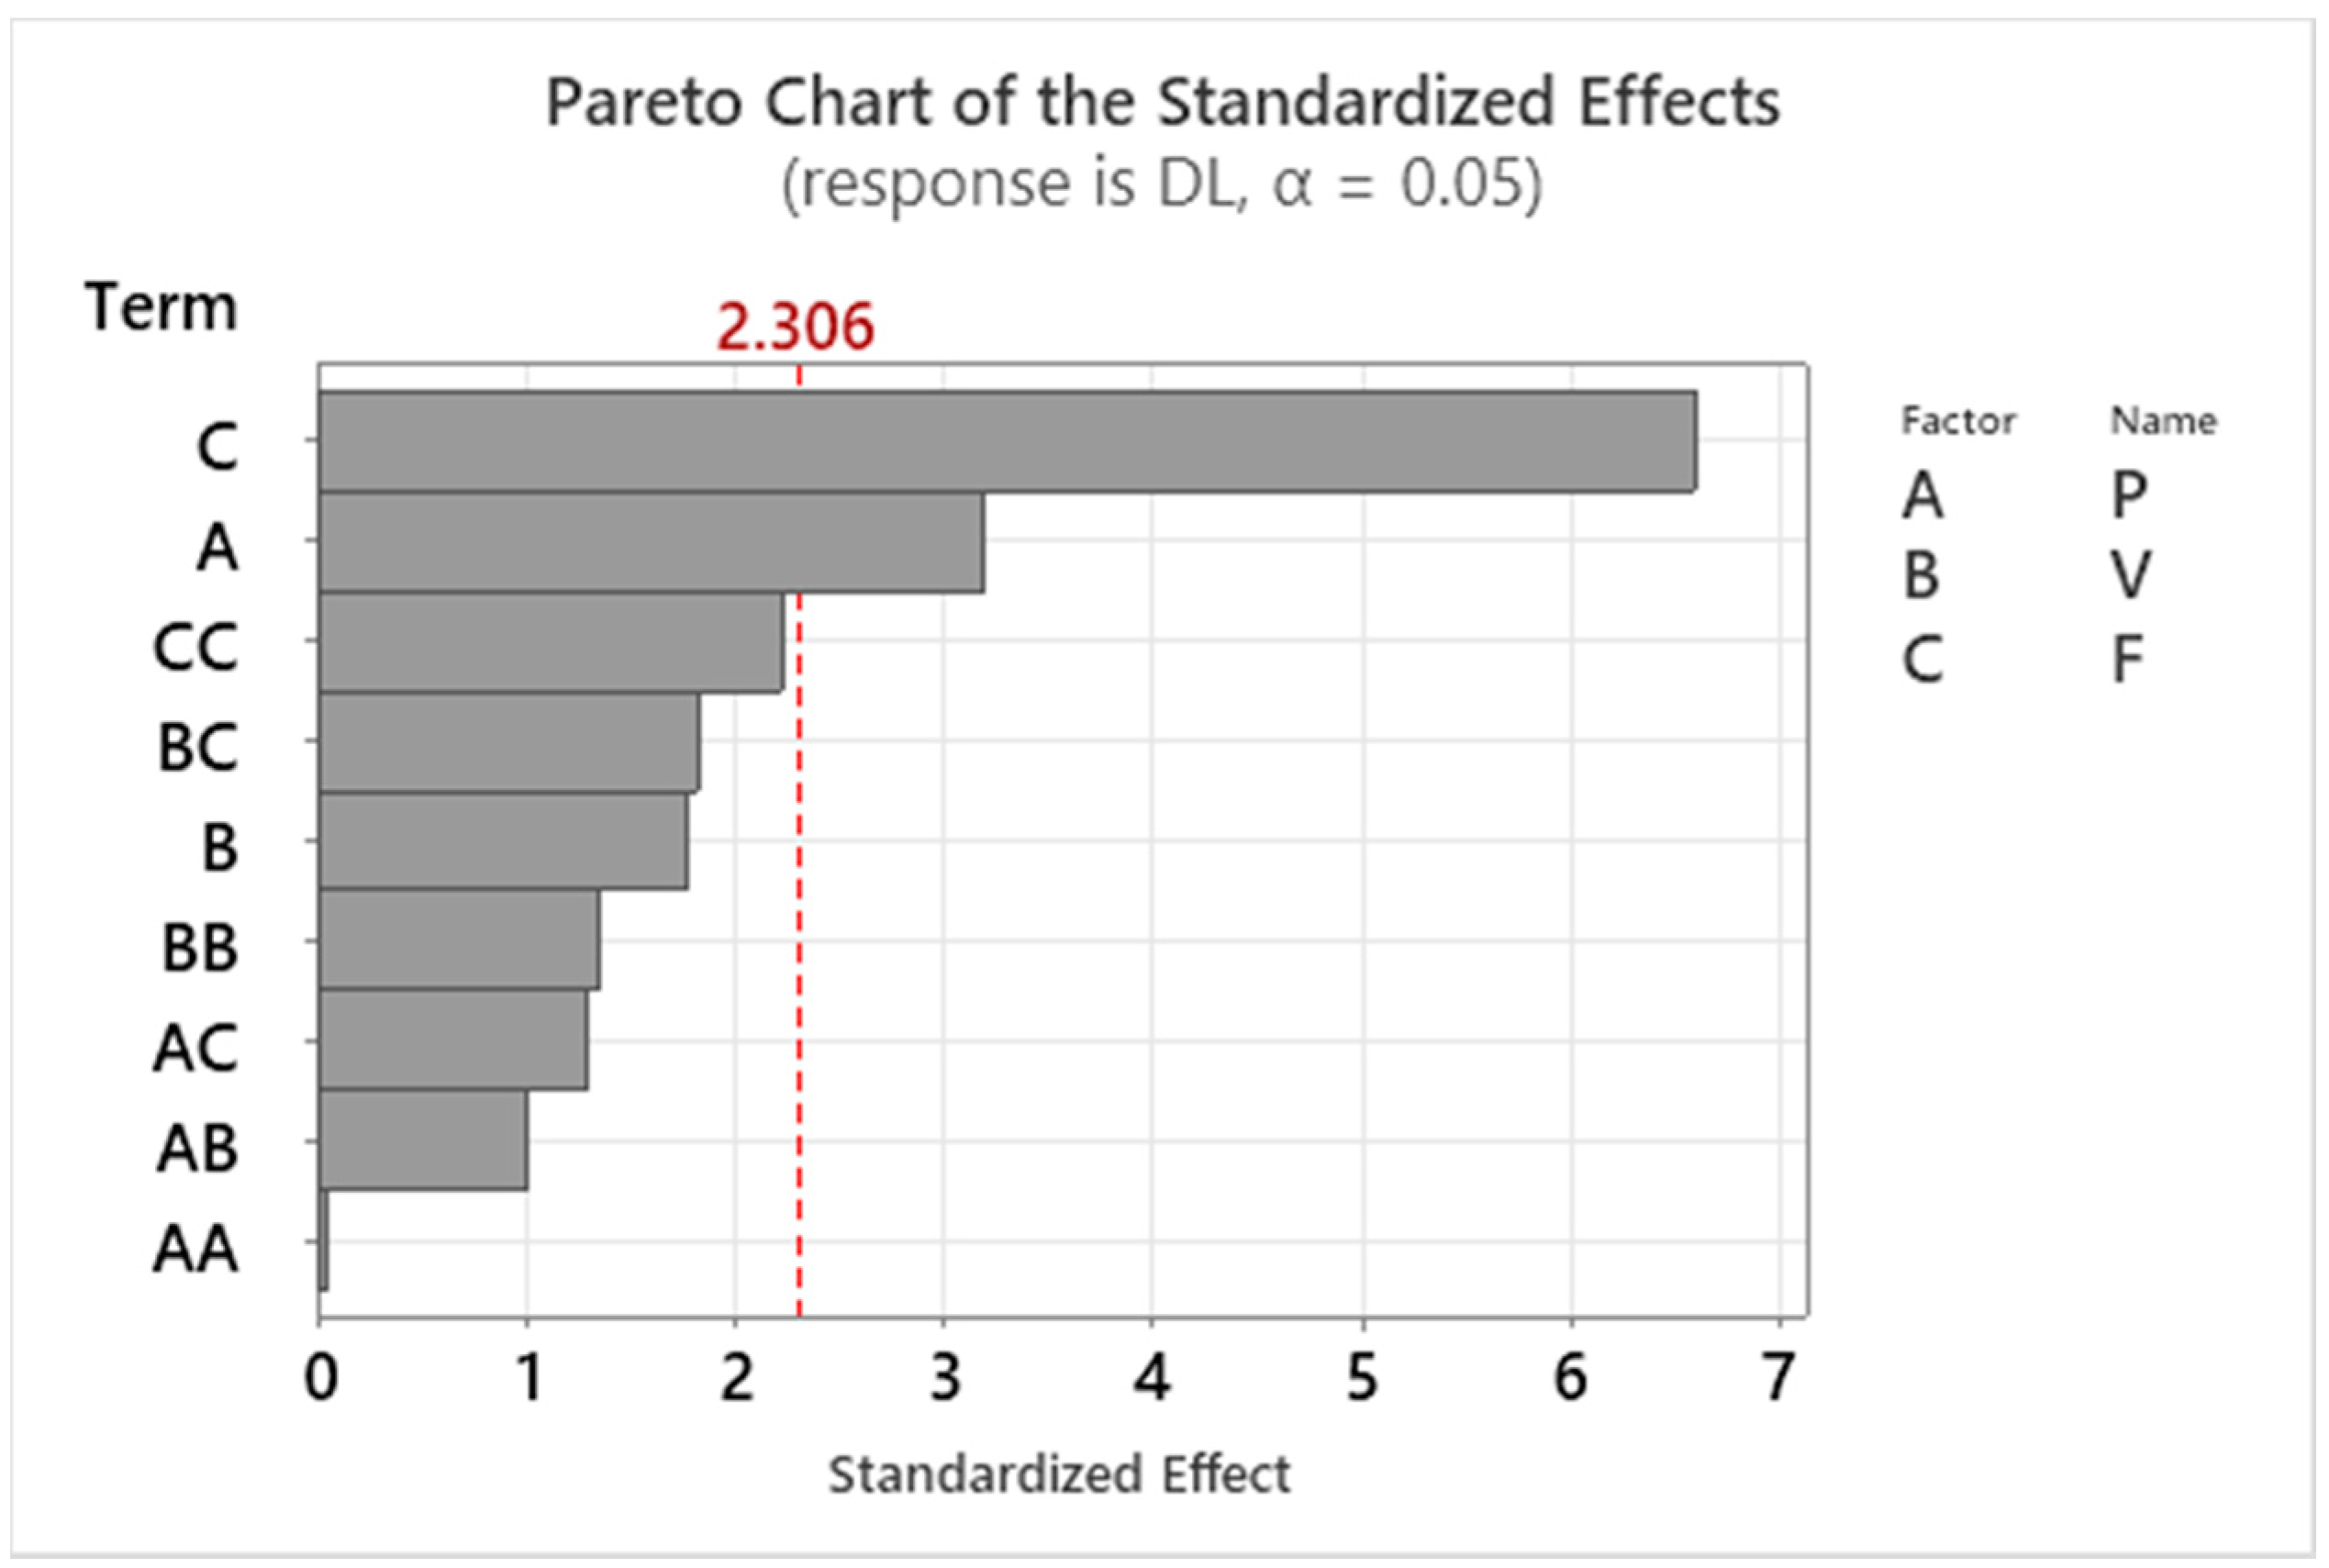
3.1.4. Dilution
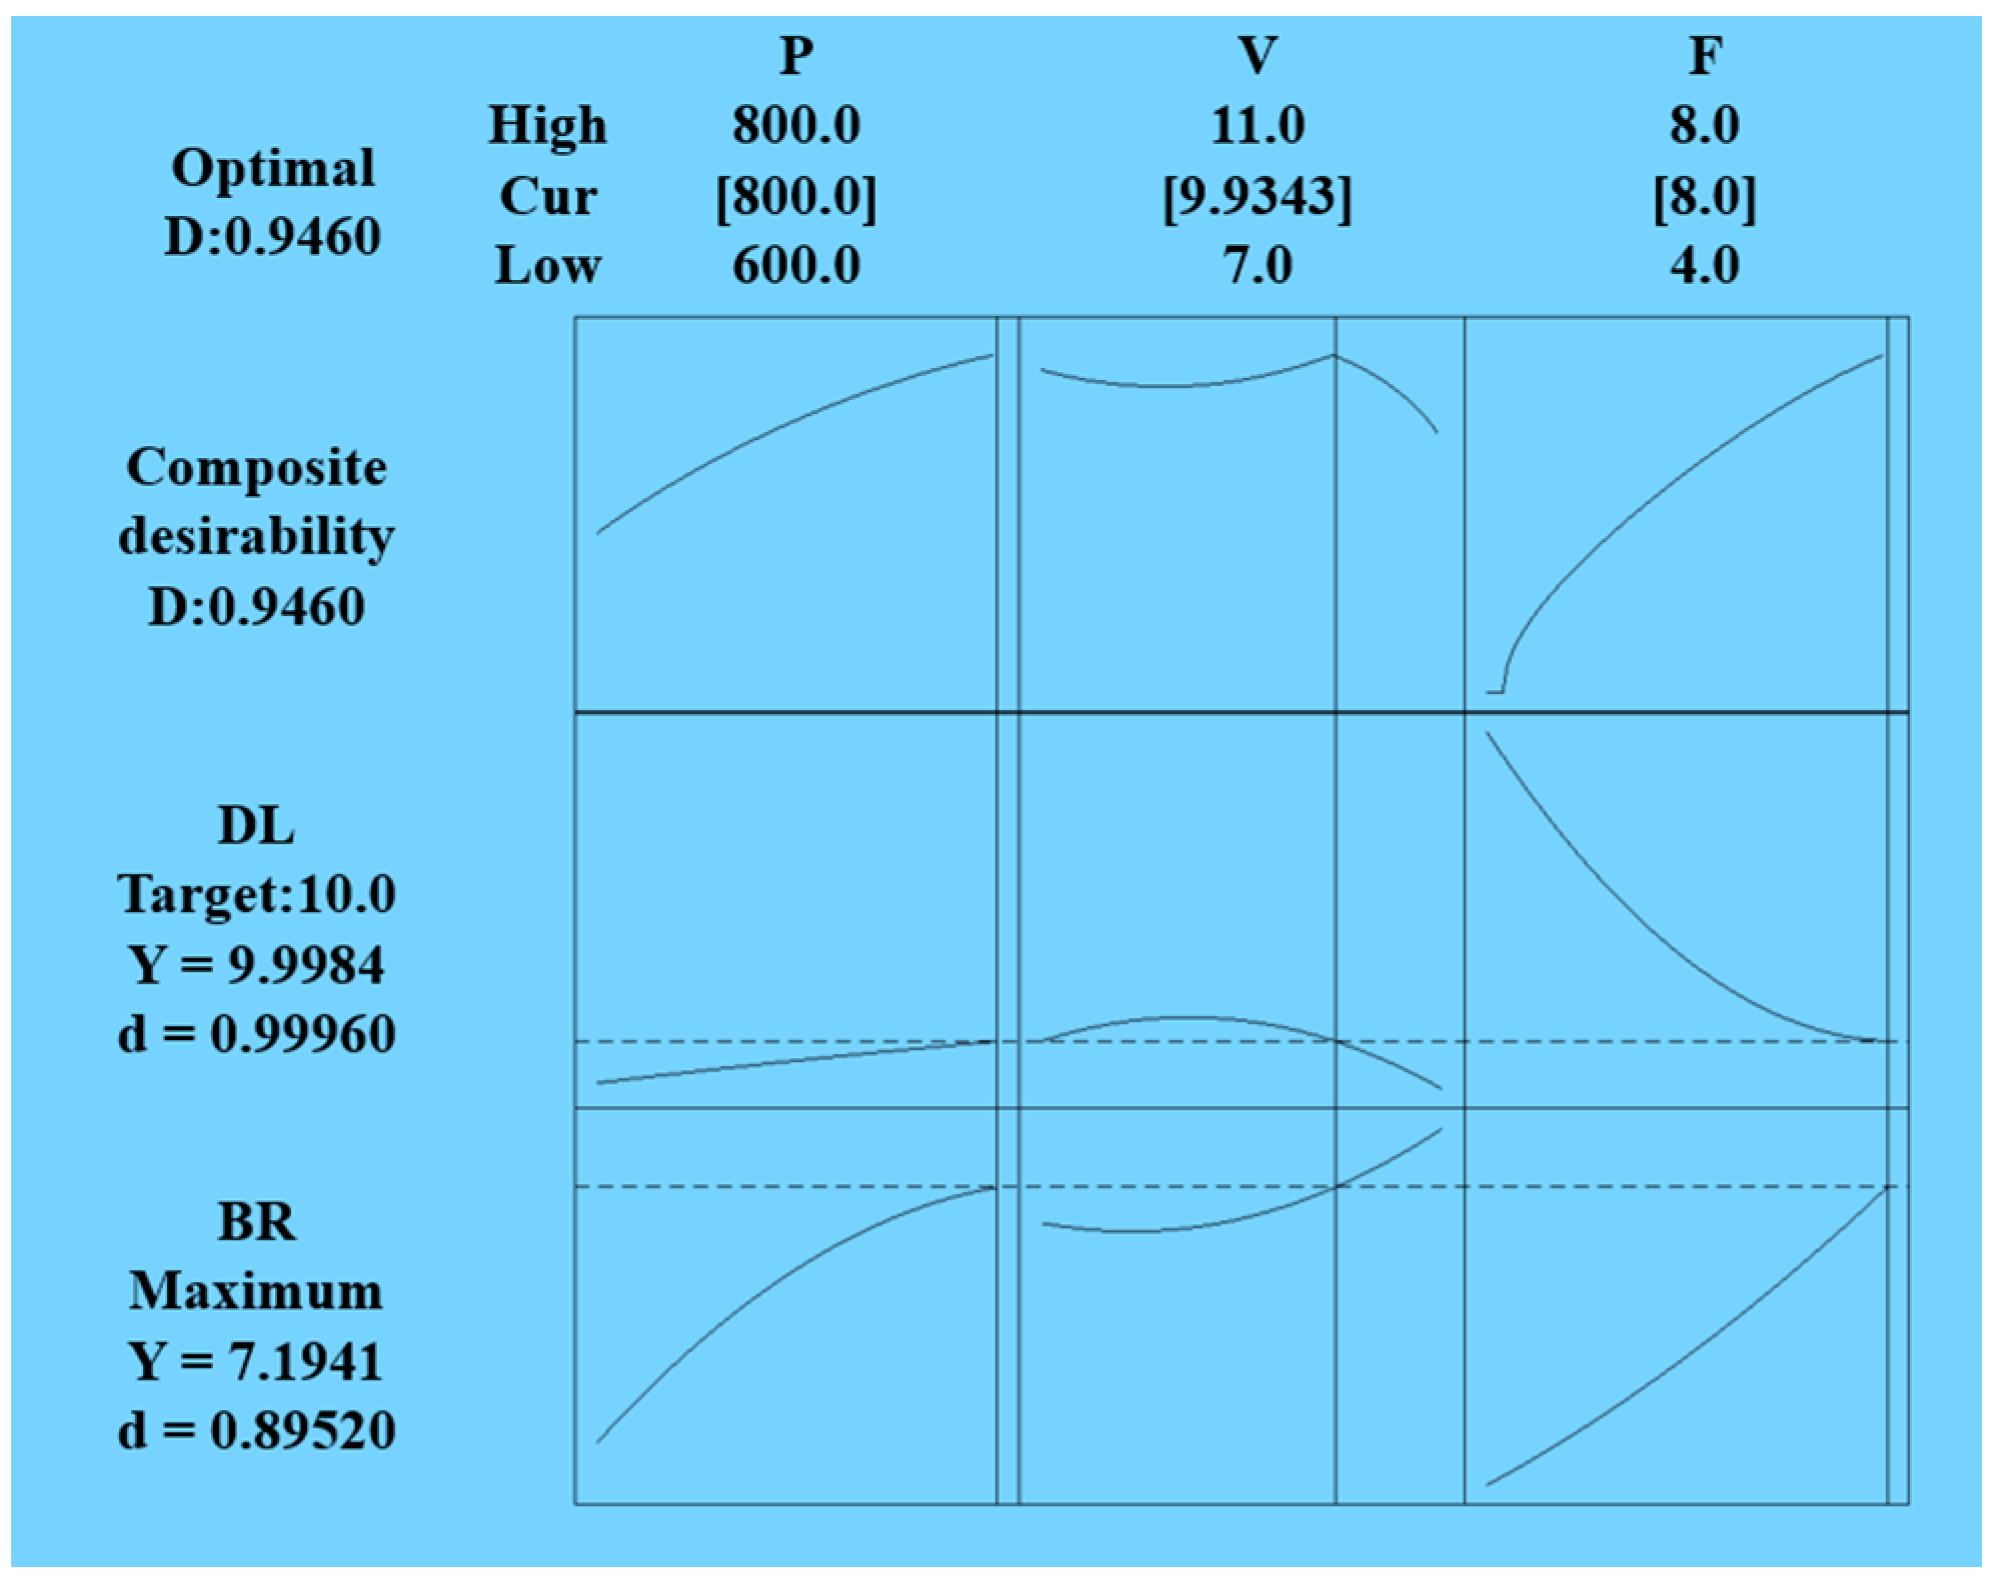
3.2. Multi-Objective Optimization
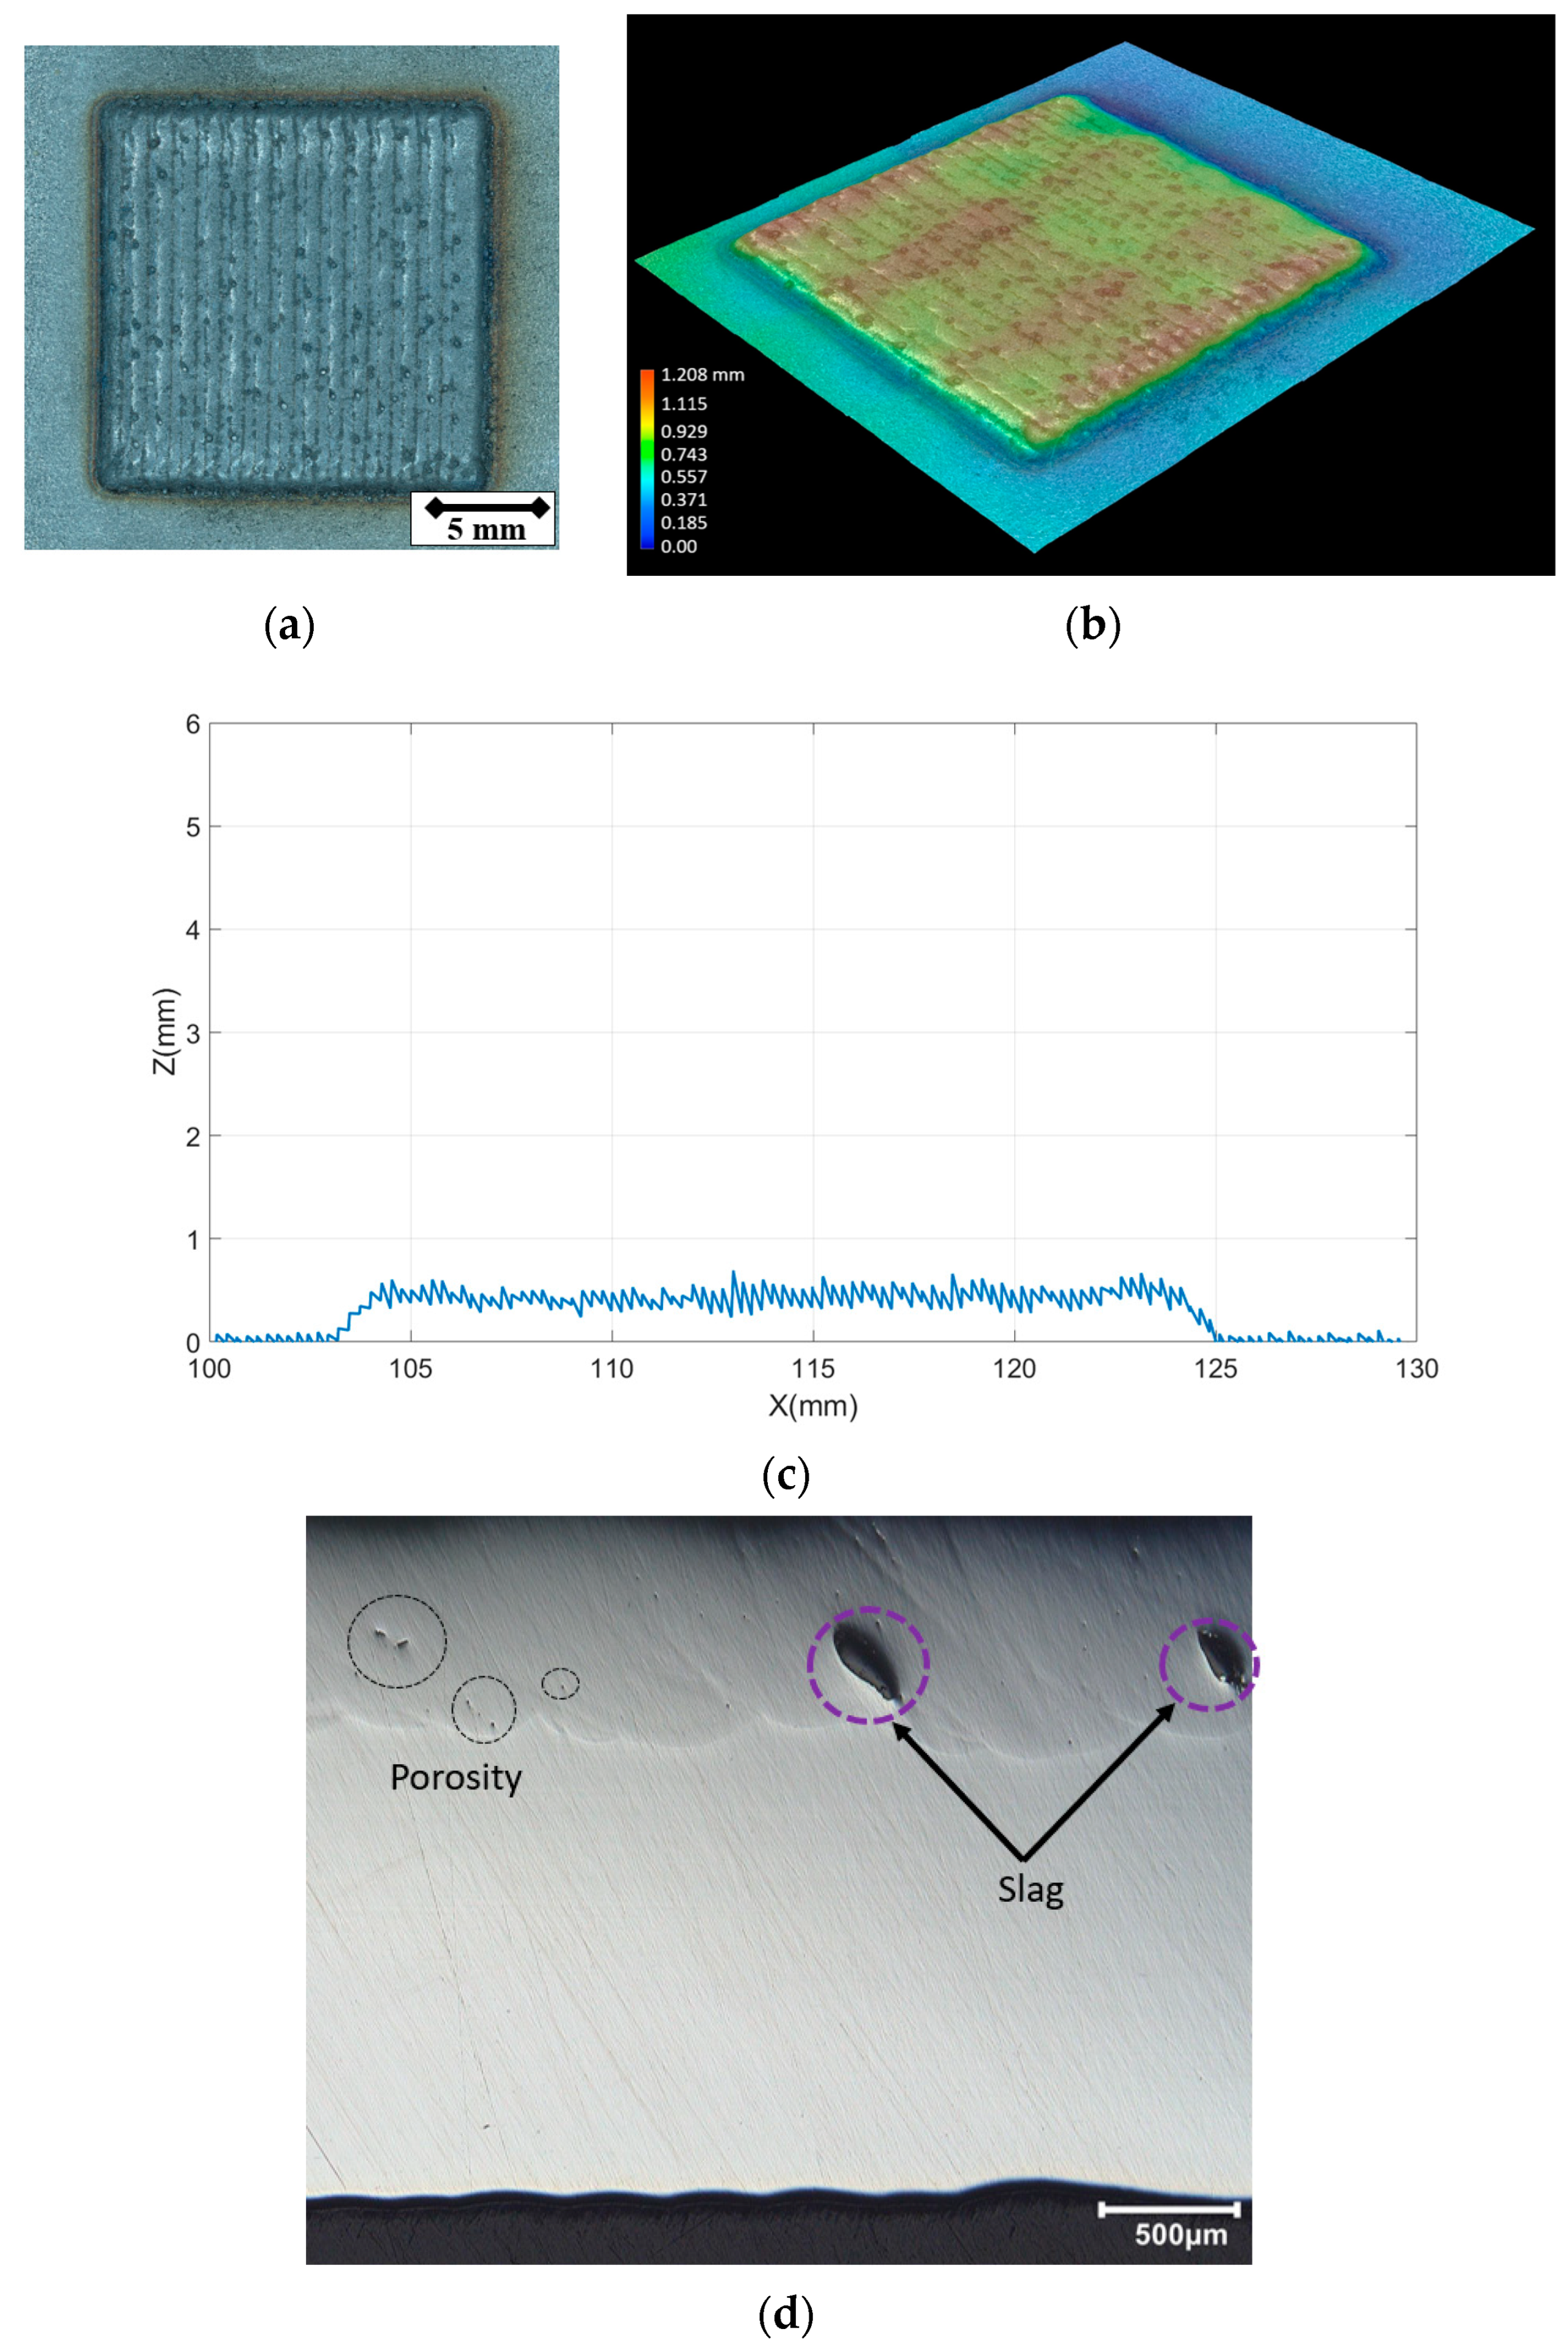
3.3. Multi-Track Deposition
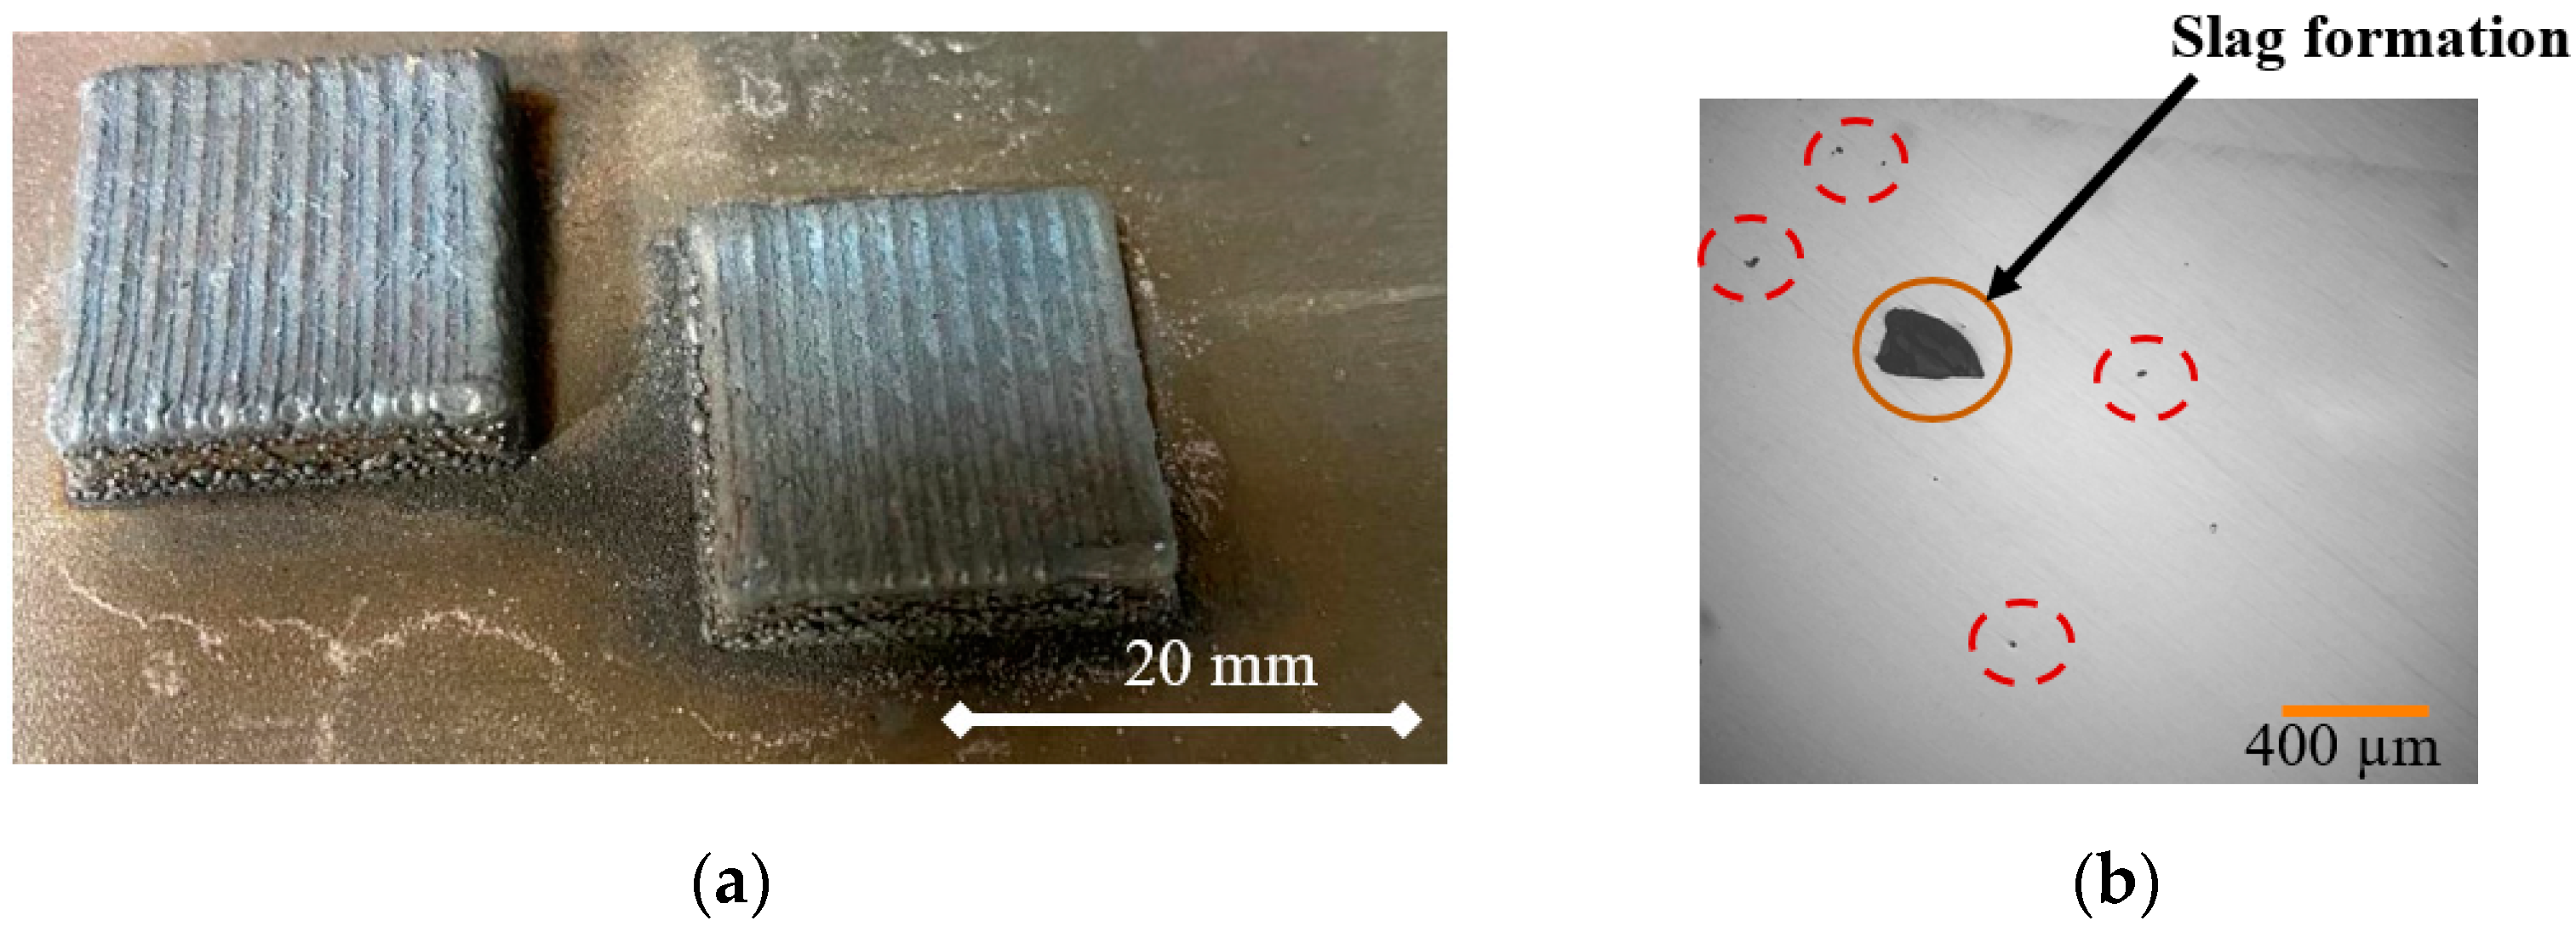
3.4. Multi-Layer Deposition
4. Conclusions
- The single-track analysis shows that W and H are mainly governed by LEL and PFL, respectively. P contributes significantly to the W, while V and F mainly govern the H.
- BR and DL were considered for optimizing the process parameters. BR and DL are mainly dependent on the F, and the effect of P on the BR and DL is found to be more significant than that of V.
- The multi-objective optimization approach using the desirability function indicates that the most desirable operating conditions for maximum BR and desired DL are P = 800 W, V = 10 mm/s, and F = 8 g/min. The established prediction models were found to accurately predict the geometric characteristics of single tracks satisfactorily.
- The multi-track deposition yielded densely clad layers with the presence of few micro-pores. The microstructure was mainly columnar and the microhardness ranged from 240 to 285 HV. The presence of irregularly shaped inclusions was observed occasionally in the as-deposited sample, which was rich in the oxides of Al, Y, and Zr, with a hardness of 1088–1276 HV.
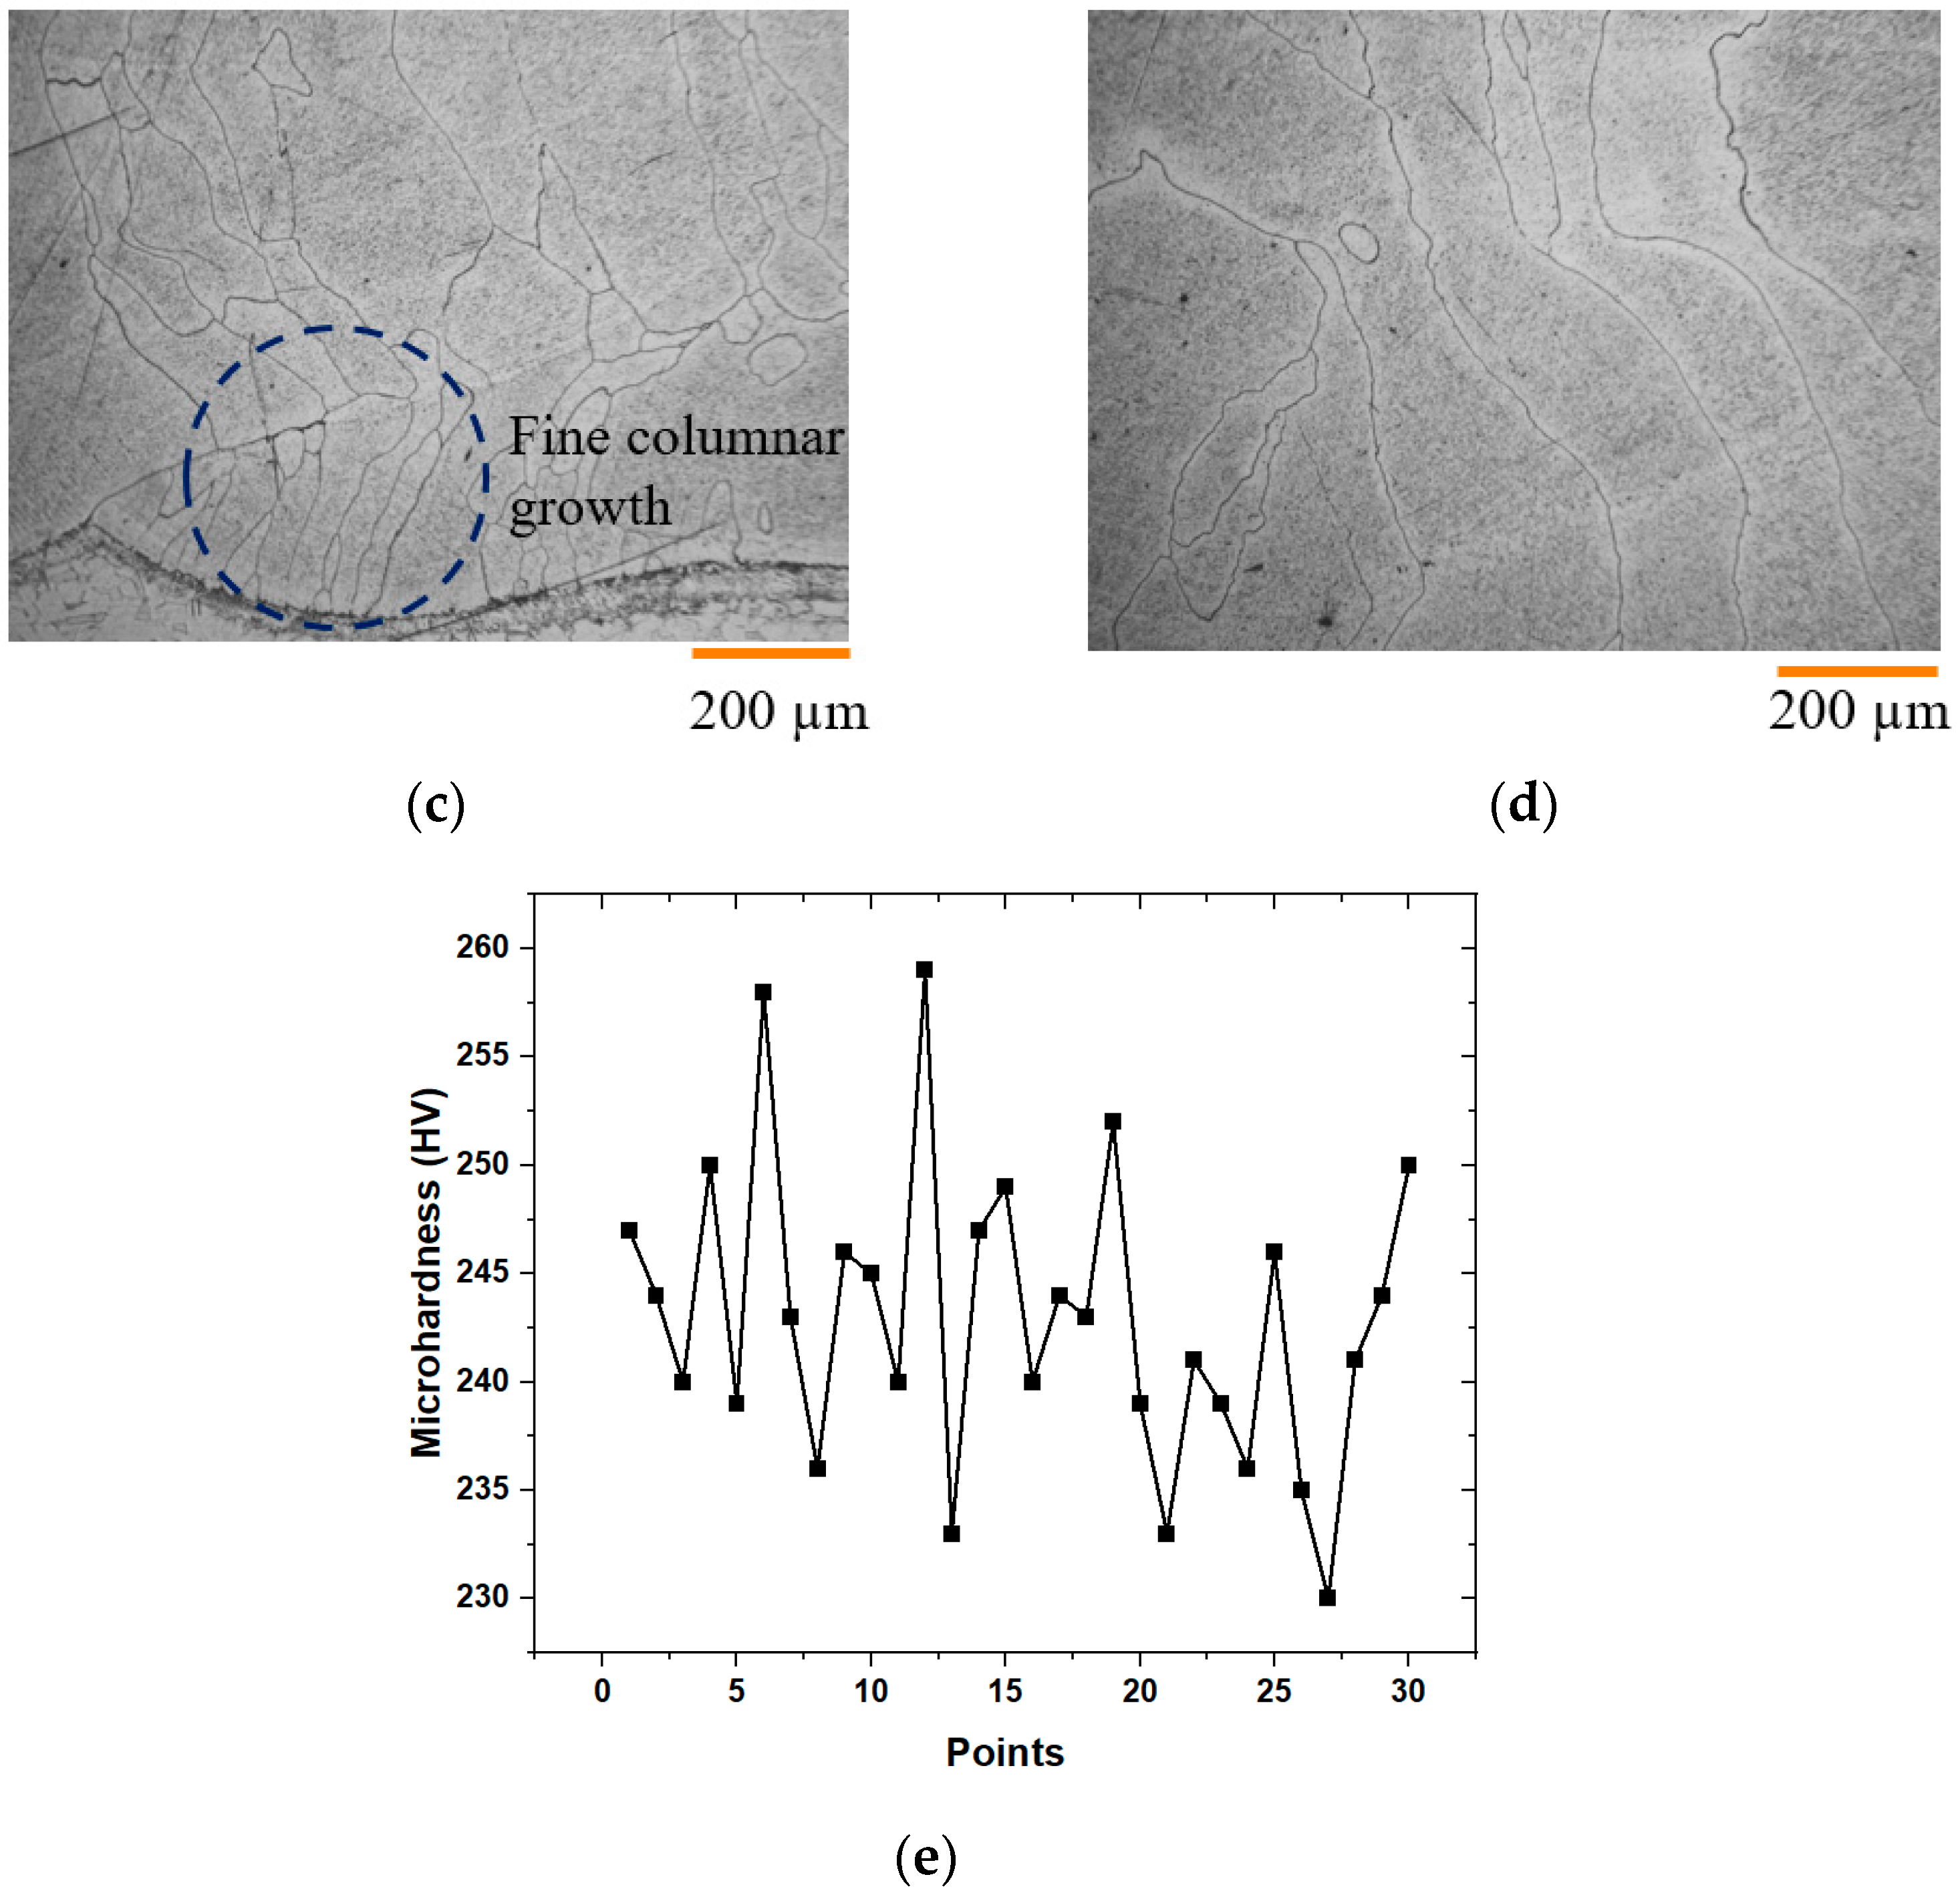
- The multi-layer deposition indicated a density of 99.7%, and the presence of micro-pores and slag layers were also observed. The columnar growth was finer at the bottom layers, with an increase in the grain size as the deposition moved to the top layer. The average micro-hardness of multi-layered bulk structures was 243 HV, which is higher than the average microhardness reported for commercially available Kanthal® APM.
Author Contributions
Funding
Data Availability Statement
Conflicts of Interest
References
- Reddy, L.; Sattari, M.; Davis, C.J.; Shipway, P.H.; Halvarsson, M.; Hussain, T. Influence of KCl and HCl on a Laser Clad FeCrAl Alloy: In-Situ SEM and Controlled Environment High Temperature Corrosion. Corros. Sci. 2019, 158, 108076. [Google Scholar] [CrossRef]
- Bryers Livingston, R.W. Fireside Slagging, Fouling and High-Temperature Corrosion of Heat-Transfer Surface Due to Impurities in Steam-Raising Fuels. Prog. Energy Combust. Sci. 1996, 22, 29–120. [Google Scholar] [CrossRef]
- Israelsson, N.; Unocic, K.A.; Hellström, K.; Jonsson, T.; Norell, M.; Svensson, J.-E.; Johansson, L.-G. A Microstructural and Kinetic Investigation of the KCl-Induced Corrosion of an FeCrAl Alloy at 600 °C. Oxid. Met. 2015, 84, 105–127. [Google Scholar] [CrossRef]
- Tolpygo, V.K.; Viefhaus, H. Segregation at the Al2O3-FeCrAl Interface During High-Temperature Oxidation. Oxid. Met. 1999, 52, 1–29. [Google Scholar] [CrossRef]
- Zhang, Z.L.; Li, D.Y.; Dong, X.Q. Microstructural Study of Fe-Cr-Al/Al Composite Coatings during Oxidation and Sulfidation at 900 °C. Acta Metall. Sin. English Lett. 2007, 20, 87–94. [Google Scholar] [CrossRef]
- Gunduz, K.O.; Visibile, A.; Sattari, M.; Fedorova, I.; Saleem, S.; Stiller, K.; Halvarsson, M.; Froitzheim, J. The Effect of Additive Manufacturing on the Initial High Temperature Oxidation Properties of RE-Containing FeCrAl Alloys. Corros. Sci. 2021, 188, 109553. [Google Scholar] [CrossRef]
- Nicholls, J.R.; Bennett, M.J.; Newton, R. A Life Prediction Model for the Chemical Failure of FeCrAlRE Alloys: Preliminary Assessment of Model Extension to Lower Temperatures. Mater. High Temp. 2003, 20, 429–438. [Google Scholar] [CrossRef]
- Valiente Bermejo, M.A.; Magniez, L.; Jonasson, A.; Selin, S.; Frodigh, M.; Hurtig, K.; Stridh, L.E.; Karlsson, L. Exposure of FeCrAl Overlay Welds on Superheater Tubes: Influence of Local Environment on Degradation. J. Fail. Anal. Prev. 2022, 22, 400–408. [Google Scholar] [CrossRef]
- Quadakkers, W.J.; Naumenko, D.; Wessel, E.; Kochubey, V.; Singheiser, L. Growth Rates of Alumina Scales on Fe–Cr–Al Alloys. Oxid. Met. 2004, 61, 17–37. [Google Scholar] [CrossRef]
- Berthomé, G.; N’Dah, E.; Wouters, Y.; Galerie, A. Temperature Dependence of Metastable Alumina Formation during Thermal Oxidation of FeCrAl Foils. Mater. Corros. 2005, 56, 389–392. [Google Scholar] [CrossRef]
- Josefsson, H.; Liu, F.; Svensson, J.-E.; Halvarsson, M.; Johansson, L.-G. Oxidation of FeCrAl Alloys at 500–900 °C in Dry O2. Mater. Corros. 2005, 56, 801–805. [Google Scholar] [CrossRef]
- Götlind, H.; Liu, F.; Svensson, J.-E.; Halvarsson, M.; Johansson, L.-G. The Effect of Water Vapor on the Initial Stages of Oxidation of the FeCrAl Alloy Kanthal AF at 900 °C. Oxid. Met. 2007, 67, 251–266. [Google Scholar] [CrossRef]
- Ndumia, J.N.; Zhu, J.; Gbenontin, B.V.; Kang, M.; Liu, X.; Nyambura, S.M. Effect of Heat Treatment on the Microstructure and Corrosion Behavior of Arc-Sprayed FeCrAl/Al Coating. J. Mater. Eng. Perform. 2022, 1–9. [Google Scholar] [CrossRef]
- Wang, Y.; Zhou, W.; Wen, Q.; Ruan, X.; Luo, F.; Bai, G.; Qing, Y.; Zhu, D.; Huang, Z.; Zhang, Y.; et al. Behavior of Plasma Sprayed Cr Coatings and FeCrAl Coatings on Zr Fuel Cladding under Loss-of-Coolant Accident Conditions. Surf. Coatings Technol. 2018, 344, 141–148. [Google Scholar] [CrossRef]
- Kim, I.H.; Jung, Y.I.; Kim, H.G.; Jang, J.I. Oxidation-resistant coating of FeCrAl on Zr-alloy tubes using 3D printing direct energy deposition. Surf. Coatings Technol. 2021, 411, 126915. [Google Scholar] [CrossRef]
- Zhang, Y.; Lv, G.; Li, Y.; Tang, Z.; Nie, Z. The Design of Reflected Laser Intensity Testing System and Application of Quality Inspection for Laser Cladding Process. Machines 2022, 10, 821. [Google Scholar] [CrossRef]
- Dai, Q.; Liu, L.; You, F.; Luo, C. Grinding Performance of Laser Cladding WC/Fe Coatings by Different Adding Methods of WC Particles. Machines 2022, 10, 910. [Google Scholar] [CrossRef]
- Toyserkani, E.; Sarker, D.; Ibhadode, O.O.; Liravi, F.; Russo, P. Metal Additive Manufacturing, 1st ed.; Wiley: New York, NY, USA, 2021. [Google Scholar]
- Jinoop, A.N.; Paul, C.P.; Bindra, K.S. Laser-Assisted Directed Energy Deposition of Nickel Super Alloys: A Review. Proc. Inst. Mech. Eng. Part L J. Mater. Des. Appl. 2019, 233, 2376–2400. [Google Scholar] [CrossRef]
- Ahn, D.-G. Directed Energy Deposition (DED) Process: State of the Art. Int. J. Precis. Eng. Manuf. Technol. 2021, 8, 703–742. [Google Scholar] [CrossRef]
- Liu, C.A.; Humphries, M.J.; Krutenat, R.C. Production of Fe-Cr-Al-Y and Co-Cr-Al-Y Coatings by Laser Surface Fusion and Their Oxidation Behavior. Thin Solid Films 1983, 107, 269–275. [Google Scholar] [CrossRef]
- Nagarathnam, K.; Komvopoulos, K. Microstructural Analysis and Oxidation Behavior of Laser-Processed Fe-Cr-AI-Y Alloy Coatings. Metall. Mater. Trans. A 1996, 27, 381–390. [Google Scholar] [CrossRef]
- Yang, Y.; Li, Y.; Liang, Z.; Bai, P.; Nie, J.; Liu, S.; Chen, B.; Wei, S.; Guan, Q.; Cai, J. Continuous Hot Corrosion Behaviour of an FeCrAlSi Coating Prepared by Laser Cladding. Surf. Coatings Technol. 2021, 421, 127424. [Google Scholar] [CrossRef]
- Kaji, F.; Jinoop, A.N.; Zimny, M.; Frikel, G.; Tam, K.; Toyserkani, E. Process Planning for Additive Manufacturing of Geometries with Variable Overhang Angles Using a Robotic Laser Directed Energy Deposition System. Addit. Manuf. Lett. 2022, 2, 100035. [Google Scholar] [CrossRef]
- Kaji, F.; Nguyen-Huu, H.; Budhwani, A.; Narayanan, J.A.; Zimny, M.; Toyserkani, E. A Deep-Learning-Based in-Situ Surface Anomaly Detection Methodology for Laser Directed Energy Deposition via Powder Feeding. J. Manuf. Process. 2022, 81, 624–637. [Google Scholar] [CrossRef]
- Guo, C.; He, S.; Yue, H.; Li, Q.; Hao, G. Prediction Modelling and Process Optimization for Forming Multi-Layer Cladding Structures with Laser Directed Energy Deposition. Opt. Laser Technol. 2021, 134, 106607. [Google Scholar] [CrossRef]
- Lian, G.; Yao, M.; Zhang, Y.; Chen, C. Analysis and Prediction on Geometric Characteristics of Multi-Track Overlapping Laser Cladding. Int. J. Adv. Manuf. Technol. 2018, 97, 2397–2407. [Google Scholar] [CrossRef]
- KANTHAL® APM. Available online: https://www.kanthal.com/en/products/material-datasheets/tube/kanthal-apm/ (accessed on 6 October 2022).
- Kao, A.; Gan, T.; Tonry, C.; Krastins, I.; Pericleous, K. Thermoelectric Magnetohydrodynamic Control of Melt Pool Dynamics and Microstructure Evolution in Additive Manufacturing. Philos. Trans. R. Soc. A Math. Phys. Eng. Sci. 2020, 378, 20190249. [Google Scholar] [CrossRef]
- Le, T.-N.; Lo, Y.-L. Effects of Sulfur Concentration and Marangoni Convection on Melt-Pool Formation in Transition Mode of Selective Laser Melting Process. Mater. Des. 2019, 179, 107866. [Google Scholar] [CrossRef]
- Ali, M.A.; Ishfaq, K.; Jawad, M. Evaluation of Surface Quality and Mechanical Properties of Squeeze Casted AA2026 Aluminum Alloy Using Response Surface Methodology. Int. J. Adv. Manuf. Technol. 2019, 103, 4041–4054. [Google Scholar] [CrossRef]
- Shi, Y.; Lu, Z.; Yu, L.; Xie, R.; Ren, Y.; Yang, G. Microstructure and Tensile Properties of Zr-Containing ODS-FeCrAl Alloy Fabricated by Laser Additive Manufacturing. Mater. Sci. Eng. A 2020, 774, 138937. [Google Scholar] [CrossRef]
- Yang, S.; Xi, B.; Zhang, Y.; Wang, D.; Liu, B.; Szakálos, P.; Ejenstam, J.; Wallenius, J.; He, G.; Zhang, W. Development of a Welding Process to Overlay FeCrAl Alloy on a Thin Wall Austenitic Stainless Steel Tube. Nucl. Mater. Energy 2021, 27, 100958. [Google Scholar] [CrossRef]


| Element | Weight Percentage (%) |
|---|---|
| Cr | 20.6 |
| Al | 5.3 |
| Si | 0.34 |
| Hf | 0.18 |
| Mn | 0.16 |
| Ni | 0.10 |
| N | 0.05 |
| Zr | 0.04 |
| Y | 0.03 |
| C | 0.01 |
| Fe | Balance |
| Parameter | Code Levels | ||
|---|---|---|---|
| −1 | 0 | +1 | |
| P (W) | 600 | 700 | 800 |
| V (mm/s) | 7 | 9 | 11 |
| F (g/min) | 4 | 6 | 8 |
| Source | DF | Adj SS | Adj MS | F-Value | p-Value |
|---|---|---|---|---|---|
| Model | 9 | 0.376492 | 0.041832 | 23.36 | 0.000 |
| Linear | 3 | 0.364450 | 0.121483 | 67.83 | 0.000 |
| P | 1 | 0.335256 | 0.335256 | 187.19 | 0.000 |
| V | 1 | 0.011972 | 0.011972 | 6.68 | 0.032 |
| F | 1 | 0.017223 | 0.017223 | 9.62 | 0.015 |
| Square | 3 | 0.008997 | 0.002999 | 1.67 | 0.249 |
| P × P | 1 | 0.001527 | 0.001527 | 0.85 | 0.383 |
| V × V | 1 | 0.000021 | 0.000021 | 0.01 | 0.917 |
| F × F | 1 | 0.007401 | 0.007401 | 4.13 | 0.077 |
| Two-Way Interaction | 3 | 0.003045 | 0.001015 | 0.57 | 0.652 |
| P × V | 1 | 0.000545 | 0.000545 | 0.30 | 0.596 |
| P × F | 1 | 0.001922 | 0.001922 | 1.07 | 0.331 |
| V × F | 1 | 0.000578 | 0.000578 | 0.32 | 0.586 |
| Error | 8 | 0.014328 | 0.001791 | ||
| Lack-of-Fit | 5 | 0.013970 | 0.002794 | 23.41 | 0.013 |
| Pure Error | 3 | 0.000358 | 0.000119 | ||
| Total | 17 | 0.390820 |
| Source | DF | Adj SS | Adj MS | F-Value | p-Value |
|---|---|---|---|---|---|
| Model | 9 | 0.412403 | 0.045823 | 21.91 | 0.000 |
| Linear | 3 | 0.376645 | 0.125548 | 60.03 | 0.000 |
| P | 1 | 0.000029 | 0.000029 | 0.01 | 0.909 |
| V | 1 | 0.200789 | 0.200789 | 96.01 | 0.000 |
| F | 1 | 0.175828 | 0.175828 | 84.07 | 0.000 |
| Square | 3 | 0.021678 | 0.007226 | 3.46 | 0.071 |
| P × P | 1 | 0.006191 | 0.006191 | 2.96 | 0.124 |
| V × V | 1 | 0.016998 | 0.016998 | 8.13 | 0.021 |
| F × F | 1 | 0.000310 | 0.000310 | 0.15 | 0.710 |
| Two-Way Interaction | 3 | 0.014079 | 0.004693 | 2.24 | 0.160 |
| P × V | 1 | 0.008256 | 0.008256 | 3.95 | 0.082 |
| P × F | 1 | 0.005778 | 0.005778 | 2.76 | 0.135 |
| V × F | 1 | 0.000045 | 0.000045 | 0.02 | 0.887 |
| Error | 8 | 0.016731 | 0.002091 | ||
| Lack-of-Fit | 5 | 0.016227 | 0.003245 | 19.29 | 0.017 |
| Pure Error | 3 | 0.000505 | 0.000168 | ||
| Total | 17 | 0.429135 |
| Source | DF | Adj SS | Adj MS | F-Value | p-Value |
|---|---|---|---|---|---|
| Model | 9 | 18.2006 | 2.02229 | 30.83 | 0.000 |
| Linear | 3 | 15.0137 | 5.00457 | 76.29 | 0.000 |
| P | 1 | 5.3092 | 5.30915 | 80.93 | 0.000 |
| V | 1 | 0.0366 | 0.03655 | 0.56 | 0.477 |
| F | 1 | 9.6680 | 9.66801 | 147.38 | 0.000 |
| Square | 3 | 0.9055 | 0.30185 | 4.60 | 0.037 |
| P × P | 1 | 0.5625 | 0.56250 | 8.57 | 0.019 |
| V × V | 1 | 0.4761 | 0.47609 | 7.26 | 0.027 |
| F × F | 1 | 0.1040 | 0.10403 | 1.59 | 0.243 |
| Two-Way Interaction | 3 | 2.2813 | 0.76044 | 11.59 | 0.003 |
| P × V | 1 | 0.7780 | 0.77802 | 11.86 | 0.009 |
| P × F | 1 | 1.1486 | 1.14856 | 17.51 | 0.003 |
| V × F | 1 | 0.3547 | 0.35475 | 5.41 | 0.049 |
| Error | 8 | 0.5248 | 0.06560 | ||
| Lack-of-Fit | 5 | 0.5107 | 0.10214 | 21.72 | 0.015 |
| Pure Error | 3 | 0.0141 | 0.00470 | ||
| Total | 17 | 18.7254 |
| Source | DF | Adj SS | Adj MS | F-Value | p-Value |
|---|---|---|---|---|---|
| Model | 9 | 310.460 | 34.496 | 7.62 | 0.004 |
| Linear | 3 | 257.661 | 85.887 | 18.96 | 0.001 |
| P | 1 | 46.094 | 46.094 | 10.18 | 0.013 |
| V | 1 | 14.341 | 14.341 | 3.17 | 0.113 |
| F | 1 | 197.227 | 197.227 | 43.54 | 0.000 |
| Square | 3 | 25.444 | 8.481 | 1.87 | 0.213 |
| P × P | 1 | 0.011 | 0.011 | 0.00 | 0.962 |
| V × V | 1 | 8.299 | 8.299 | 1.83 | 0.213 |
| F × F | 1 | 22.423 | 22.423 | 4.95 | 0.057 |
| Two-Way Interaction | 3 | 27.355 | 9.118 | 2.01 | 0.191 |
| P × V | 1 | 4.622 | 4.622 | 1.02 | 0.342 |
| P × F | 1 | 7.607 | 7.607 | 1.68 | 0.231 |
| V × F | 1 | 15.126 | 15.126 | 3.34 | 0.105 |
| Error | 8 | 36.239 | 4.530 | ||
| Lack-of-Fit | 5 | 34.772 | 6.954 | 14.22 | 0.027 |
| Pure Error | 3 | 1.467 | 0.489 | ||
| Total | 17 | 346.699 |
| Solution | P | V | F | DL Fit | BR Fit | Composite Desirability |
|---|---|---|---|---|---|---|
| 1 | 800.000 | 9.9343 | 8.00000 | 9.9984 | 7.19410 | 0.945959 |
| 2 | 800.000 | 10.0016 | 7.98200 | 9.9133 | 7.20655 | 0.937121 |
| 3 | 800.000 | 10.0728 | 7.98913 | 9.8141 | 7.24508 | 0.929358 |
| 4 | 766.339 | 9.7252 | 8.00000 | 9.9824 | 6.95365 | 0.915554 |
| 5 | 799.675 | 7.0000 | 8.00000 | 10.0000 | 6.84436 | 0.904328 |
| Optimized Process Parameters | BR (mm3/min) | DL (%) | ||||
|---|---|---|---|---|---|---|
| P | V | F | Predicted | Actual | Predicted | Actual |
| 800 | 10 | 8 | 7.19 | 8.9 | 9.99 | 11 |
Disclaimer/Publisher’s Note: The statements, opinions and data contained in all publications are solely those of the individual author(s) and contributor(s) and not of MDPI and/or the editor(s). MDPI and/or the editor(s) disclaim responsibility for any injury to people or property resulting from any ideas, methods, instructions or products referred to in the content. |
© 2023 by the authors. Licensee MDPI, Basel, Switzerland. This article is an open access article distributed under the terms and conditions of the Creative Commons Attribution (CC BY) license (https://creativecommons.org/licenses/by/4.0/).
Share and Cite
Arackal Narayanan, J.; Kaji, F.; Zimny, M.; Toyserkani, E. Laser Directed Energy Deposition-Based Additive Manufacturing of Fe20Cr5.5AlY from Single Tracks to Bulk Structures: Statistical Analysis, Process Optimization, and Characterization. Machines 2023, 11, 58. https://doi.org/10.3390/machines11010058
Arackal Narayanan J, Kaji F, Zimny M, Toyserkani E. Laser Directed Energy Deposition-Based Additive Manufacturing of Fe20Cr5.5AlY from Single Tracks to Bulk Structures: Statistical Analysis, Process Optimization, and Characterization. Machines. 2023; 11(1):58. https://doi.org/10.3390/machines11010058
Chicago/Turabian StyleArackal Narayanan, Jinoop, Farzaneh Kaji, Mark Zimny, and Ehsan Toyserkani. 2023. "Laser Directed Energy Deposition-Based Additive Manufacturing of Fe20Cr5.5AlY from Single Tracks to Bulk Structures: Statistical Analysis, Process Optimization, and Characterization" Machines 11, no. 1: 58. https://doi.org/10.3390/machines11010058
APA StyleArackal Narayanan, J., Kaji, F., Zimny, M., & Toyserkani, E. (2023). Laser Directed Energy Deposition-Based Additive Manufacturing of Fe20Cr5.5AlY from Single Tracks to Bulk Structures: Statistical Analysis, Process Optimization, and Characterization. Machines, 11(1), 58. https://doi.org/10.3390/machines11010058