Article

Bulk Fabrication of SS410 Material Using Cold Metal Transfer-Based Wire Arc Additive Manufacturing Process at Optimized Parameters: Microstructural and Property Evaluation

1
Laboratory for Advanced Manufacturing and Processing, Indian Institute of Technology, Jammu 181221, India
2
Department of Mechatronics Engineering, Indian Institute of Information Technology, Bhagalpur 813210, India
3
Naval Materials Research Laboratory, Defense Research Development Organization, Ambernath 421506, India
*
Author to whom correspondence should be addressed.
Machines 2022, 10(12), 1136; https://doi.org/10.3390/machines10121136
Submission received: 7 November 2022 / Revised: 25 November 2022 / Accepted: 28 November 2022 / Published: 29 November 2022
(This article belongs to the Special Issue Additive Manufacturing of Machine Components)

Abstract

:
To make metallic parts for manufacturing industries, additive manufacturing (AM) has acquired considerable significance. However, most efforts have concentrated on powder-based techniques, and there remains a dearth of the experimental evidence on the mechanical characteristics and structural behavior of metallic elements produced using wire-and-arc additive manufacturing (WAAM). This article examined the optimal parameters to enable bulk fabrication of thick walls made with a SS410 wire. The objective was to assess the optimized variables utilizing response surface methodology (RSM), followed by the microstructural analysis and mechanical property evaluation. During optimization, the influence of wire feed speed, travel speed, and gas flow rate on bead width and height was determined. Further, the optimized variables resulted in the successful formation of thick walls. Secondly, the microstructural analysis mainly featured the martensite and delta ferrite, with the latter’s percentage increasing with build height. The maximum micro-hardness of 452 HV was obtained at the base of the wall. In addition, the remarkable increases in the standard deviation of micro-hardness represent the great extent of anisotropy in the thick wall. Moreover, the maximum UTS (803 ± 8 MPa) and YS (659 ± 10 MPa) are achieved for the OB sample, which is similar to conventional components. However, the current investigation’s percentage elongation of 5% (max) demands more study before the actual use of the WAAM manufactured SS410 material. Therefore, due to the significant degree of anisotropy and poor percentage elongation, the findings conclude that post-processing is required after bulk SS410 manufacturing.

1. Introduction

Additive manufacturing (AM) has gained extensive importance in various applications for a long time because of its potential to lower material waste, total component prices, and production lead time [1]. With time, the AM processes have evolved and discovered their applicability among various materials, from plastics to metals to ceramics. In particular, the laser powder bed fusion (LPBF) process has received prevalent attention due to its ability to form complex parts [2]. However, certain limitations are inherent to the LPBF system, such as expensive feedstock, small build size, and low deposition rates that prevent its mass utilization [3]. Therefore, to overcome the mentioned limitation, wire arc additive manufacturing (WAAM) technology is introduced in the AM toolbox, which is based on basic welding techniques.
The WAAM is the wire-fed-based technique that utilizes arc as a heat source for the required layer-by-layer deposition. The WAAM process has substantially higher deposition rates (around 2.5–8 kg/h) than the LPBF technique (0.1–0.6 kg/h) [4]. Furthermore, the procurement of metal wire in terms of cost is less than the metal powder, resulting in a lower overall production price. Moreover, the type of heat source depends upon the kind of welding technique employed, such as gas metal arc welding (GMAW), plasma arc welding (PAW) and gas tungsten arc welding (GTAW). GMAW is metal-arc welding in which an electric arc is created between a welding wire and the metal object being joined. Contrary to the GMAW, GTAW and PAW utilize the non-consumable tungsten electrode and require an external wire feeder. As a result, the variable wire orientation in the latter instances causes inconsistent deposition and complicates the strategic production plan. Hence, the utilization of GMAW is the simplest approach that tends to eliminate the aforementioned issues of the GTAW and PAW. Apart from the process simplicity, GMAW has high deposition rates, which makes its utilization more appropriate in WAAM technology [5].
WAAM commonly employs heat intakes varying from 10 to 100’s of J/mm, dispersed by conductance through the parts and substrates, convection through the shielding environment, and radiation to the surroundings. This important variable influences the microstructure and the material’s shape (width and height) [6]. With the layer-by-layer deposition, the heat accumulation within the component increases with the build height. Therefore, to form big parts, it is critical to reduce the amount of heat that is generated during processing. Thus, the problem associated with the high heat input can be resolved using two approaches: first, based on the mode of metal transfer used in the process, and second, by optimizing the process parameter to obtain minimum heat input.
The cold metal transfer (CMT) technique is an effective way to deal with heat-related consequences. CMT incorporates a novel wire feed technology combined with high digital control to regulate material deposition with minimal heat input [7]. In CMT, the metal transfer from the partially melted electrode tip to the molten pool is accomplished with the welding wire’s reciprocating movement (in and out of the molten pool). The material is transported due to the surface tension phenomenon during the outward movement of the partially melted electrode. This way, the amount of heat input required and spatter formation in CMT is significantly reduced compared to the other metal transfer techniques [8]. Moreover, WAAM-made structures are substantially dictated by the heat history of the process. Throughout WAAM manufacturing, the thermal cycle consists of repetitive heating and cooling [5]. The increased heat associated with welding results in residual stresses, distortion, and cracking during solidification and delamination [9]. The amount of heat input during the process is related to input parameters such as travel speed (TS) and wire feed speed (WFS). The WFS depends on the current and the voltage employed during the welding process. In the layer-by-layer formation of different beads, the above-mentioned welding input parameters affect the welding thermal cycle (WTC) [10]. WTC is the most essential indicator of welding process quality since it influences structural development and hence the properties of the end product [11,12]. Therefore, taking into account the mentioned complexities, it becomes paramount to optimize the parameter to ensure the successful AM part fabrication using WAAM.
Several works in the past are associated with the parametric optimization of the WAAM process. In their study, Rosli et al. [13] optimized the parameters including WFS, TS, and pulse using the response surface methodology (RSM) approach. The optimization achieved maximum bead width, height, and minimum roughness. However, the study does not analyze the mechanical properties corresponding to the thin wall made using optimized parameters. Similarly, Huang et al. [14] utilized the same RSM technique to optimize the input variables to reduce the solidification cracking defect in the WAAM-fabricated 4043 Al alloy. It has been discovered that the WFS is the sole parameter that has generated substantial cracks during processing. In the study by Le et al. [15], the welding bead characteristics, i.e., height and width of WAAM fabricated SS308L, were optimized using RSM to obtain successful thin wall structures. The results show that the bead width was greatly influenced by voltage and speed of travel, while bead height was strongly affected by welding current and speed. Vora et al. [15] successfully optimized the input variables to obtain the defect free 2.25 Cr-1.0 Mo steel thin wall structures. The trials were carried out using the Box–Behnken design, which considers WFS, TS, and voltage as independent variables with bead width and height as response variables. The findings of the single-objective optimization revealed the maximum height and minimum width of 7.81 mm and 4.73 mm, respectively. Moreover, several studies on different materials were carried out to obtain the optimized parameters to reduce defects, ensure part formability, etc. [16,17,18].
Several research papers have been published in the recent past related to the WAAM process [14,19,20,21]. Most of the journal articles explored different microstructural features and mechanical properties pertaining to materials such as aluminum, titanium, and nickel–titanium shape memory. A few researchers are investigating the resultant material characteristics of WAAM metal alloys, mainly stainless steel (SS) of different grades. In their study, Haden et al. [22] deposited the thin wall of low carbon steel (grade 304) and mild steel (ER70S) using GMAW-based WAAM and evaluated its mechanical properties. They revealed that the WAAM fabricated SS304 and ER70S show tensile strength comparable to their wrought counterparts. Rafieazad et al. [23] investigated the microstructural and mechanical properties of GMAWAM-fabricated multi-bead multi-layer using low-carbon steel, whereas Le [24] employed GMAWAM systems to fabricate a thin-wall utilizing the same feedstock. The authors of their respective research concluded that the microstructure of the walls shows a great extent of anisotropy when varied from one layer to the next along the building axis. Commonly observed microstructure features were granular formations of ferrite, reverted austenite, and pearlite at the grain boundaries. Further, the microstructures of the GMAWAM SS316L walls were investigated by Chen et al. [25]. According to the authors’ findings, GMAWAM SS316L walls’ microstructures are made up of an austenite and delta ferrite and sigma phase, all of which are embedded in an austenite matrix. The connection between the WAAM process’s arc modes, microstructures, and mechanical characteristics of 316L steel was further elucidated by Wang et al. [26]. These researchers noted that finer microstructures were created in the base and top layers when an arc mode with reduced heat input was used. The microstructure and tensile characteristics of GMAWAM fabricated SS316L thin walls produced using two different welding current techniques were compared by Wu et al. [26]. They discovered that increased welding currents resulted in increased heat input, which led to the creation of coarser structures and a corresponding change in the hardness of the manufactured part. Further, thin walls constructed from 9Cr ferrite/martensitic steel using a WAAM technique were studied for their microstructural variation by Gao et al. [27]. A regional variation in wall microstructure was demonstrated by the authors. In contrast to the wall’s middle and upper zones, where larger grains predominated, the lower zone was characterized by smaller grains. This microstructure’s anisotropy was one of the primary causes of the variation in hardness and tensile strengths along the construction direction and the horizontal orientation.
As far as the authors know, few researchers have investigated the mechanical and microstructural features of WAAM-fabricated SS410 parts. SS410 is a type of martensitic stainless steel. It has several uses in areas as diverse as the petroleum and gas industries, manufacturing shafts and screws, turbine, and defense industries. The published literature shows no or very few articles on the WAAM-made SS410 material. However, there are historical examples of SS410 being used in welding applications [28]. The successful welding using SS410 provides the basis for its extension for printing standalone parts in the manufacturing industries. In addition, previous studies concentrated more on thin-wall manufacturing, whereas thick-wall fabrication was seldomly focused on. In addition, there are a lack of studies examining the anisotropic nature of thick walls produced by WAAM. Considering these research gaps, the current investigation was designed to fulfill the bulk fabrication of SS410 parts using CMT-based WAAM. To do so, the parameters were optimized in the first part of the study using RSM and subsequently, the thick walls were fabricated with the optimized parameters. Followed by the bulk fabrication, the mechanical and microstructural investigation was carried out to analyze the material’s behavior at different build heights. Figure 1 illustrates the systematic approach used in the present study to fulfill the mentioned objectives. Consequently, the results at this level are deemed crucial in promoting the usage of CMT-based WAAM fabricated SS410 in manufacturing environments.

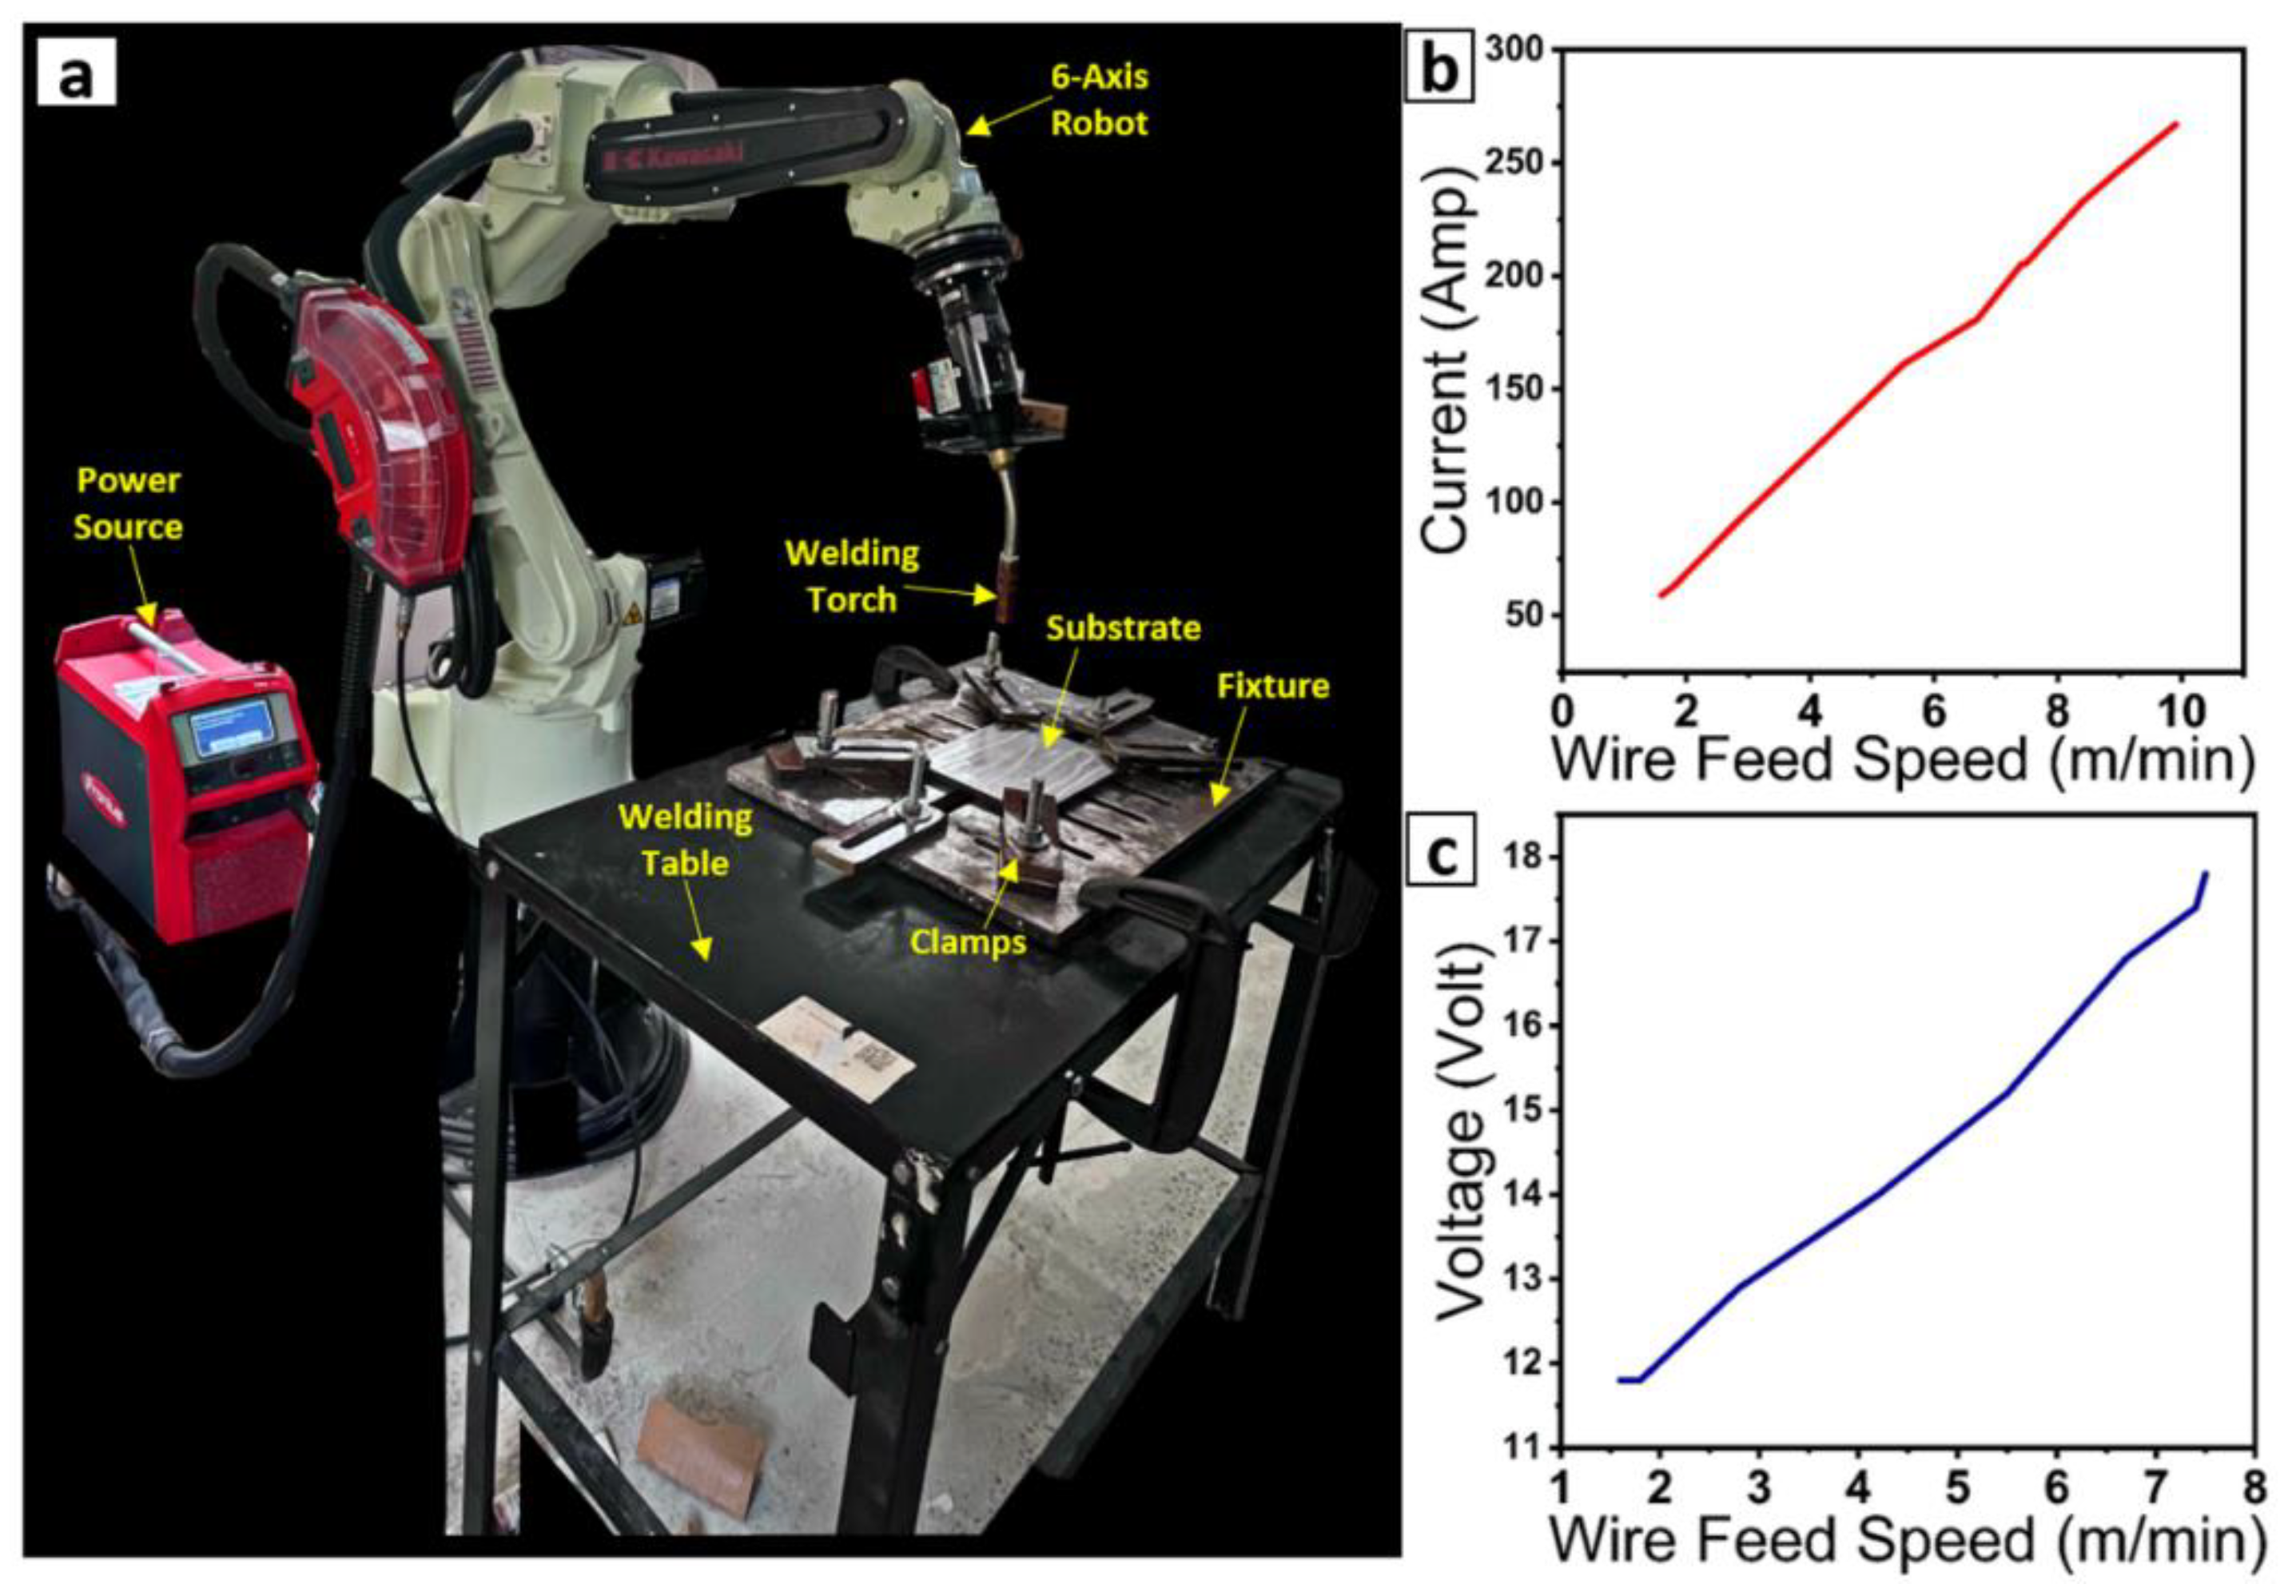
2. Experimental Methodology
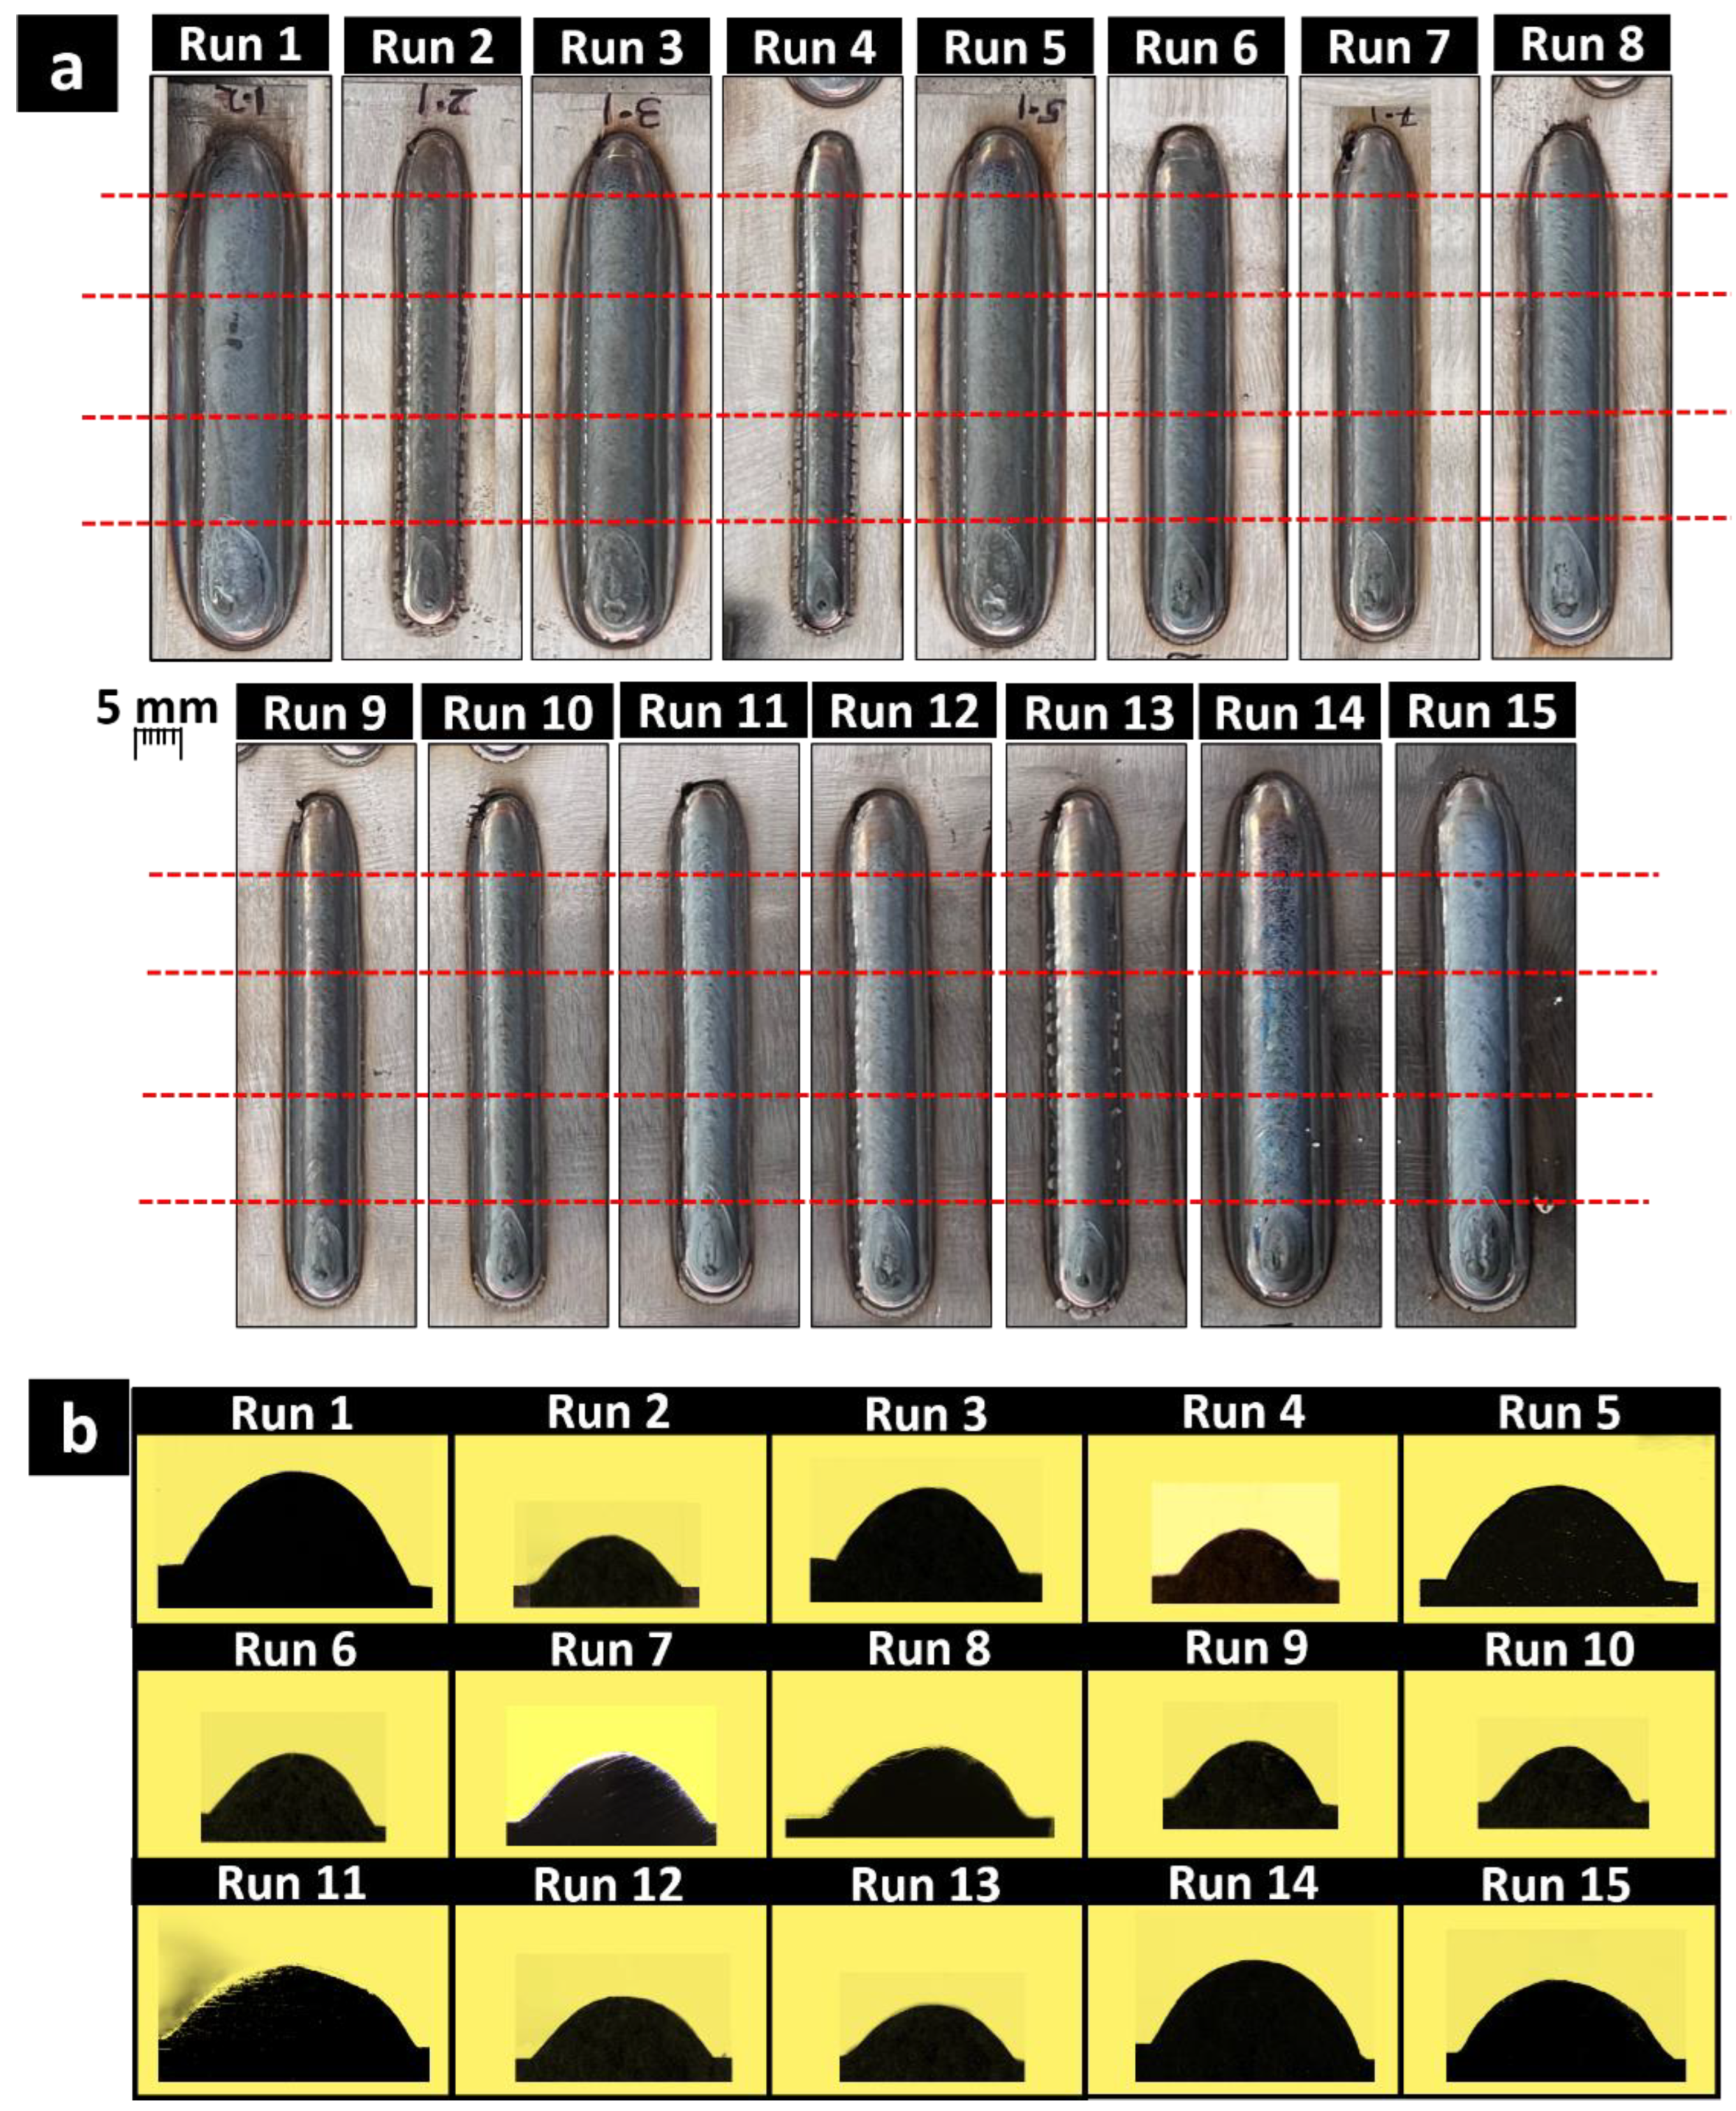
2.1. Optimization

The commercially available SS410 wire of 1.2 mm diameter was employed for the deposition over the mild steel plates with 200 mm × 300 mm × 10 mm of dimensions. The chemical composition of the feedstock wire and substrate is shown in Table 1. Before the welding, the substrate plate was surface finished using the grinder and subsequently cleaned with ethanol to avoid any plate impurities that may hinder the deposition. The required deposition was conducted using the CMT-based MIG welding (TPS400I, Fronius, Wels, Austria) set-up maneuver along the pre-defined paths by a 6-axis robot (Kawasaki, 3BA0061N, Kobe, Japan), Figure 2a. The current and voltage values during the welding process varied with the WFS. As the WFS increases, the current and voltage also increase, as shown in Figure 2b. Furthermore, 98% argon and 2% oxygen were used for shielding purposes throughout the deposition process.
For thick-walled parts, the WAAM process requires weld beads with suitable geometry and quality [29]. Therefore, the first part of this study examined the influence of WFS, TS, and gas flow rate (GFR) on the shape of weld beads. This was carried out to find the best possible set of process variables for achieving the optimal quality of a single bead. Therefore, the parameters were optimized using response surface methodology (RSM), in which independent variables were TS, WFS, and GFR, and the corresponding dependent variables were BH and BW.
Before the design of experiment (DOE), the preliminary tests were conducted to decide the best possible range of operating variables to be optimized. Keeping one variable, either TS or WFS, constant, the other variable was varied to understand the quality of the bead by visual inspection. It was observed that bead having high TS and low WFS resulted in a discontinuity in the bead, commonly known as the humping effect (Figure 3a). On the other hand, with the combination of high WFS and low TS, the heat produced has an adverse effect on the back of the 10 mm mild steel (MS) plate, which can be seen in Figure 3b. Moreover, as per the literature, the GFR can significantly affect the bead’s cooling rate; therefore, it was also used as third independent variable to understand its effect on bead characteristics [30]. The range of GFR was decided as per the manufacturer’s recommendation. Therefore, considering the humping defect, heat-related problems, etc., the mentioned three factors (independent variables) with three levels were decided on and used in the DOE (Table 2). In the following step, the DOE was conducted using a Box–Behnken design. The use of such a design can be attributed to its ability to determine potential relationships between process variables with fewer runs than a traditional factorial method [31].
Table 3 shows the 15 runs of a single bead. The three beads were made corresponding to each run to ensure repeatable results. Consequently, the repeatability results show insignificant variation among BW and BH, proving the process’s reliability. The single beads of length 80 mm, along with their cross-sections for each run, are shown in Figure 4a and Figure 4b, respectively. Moreover, it is imperative to note that the measurement of BW and BH were made at multiple positions shown by red dotted lines. Hence, the final result of bead characteristics was reported as the mean of the values at four different positions measured using a Vernier caliper.
Subsequently, the second-order regression equation was developed with the help of Minitab software for both BW and BH. The model validation was conducted in two ways: first, using ANOVA and second, by comparing the predicted results from the regression equation with the experimental results. Further, the multi-objective optimization was executed to get the optimal parameters for the feasible fabrication of the SS410 thick wall.

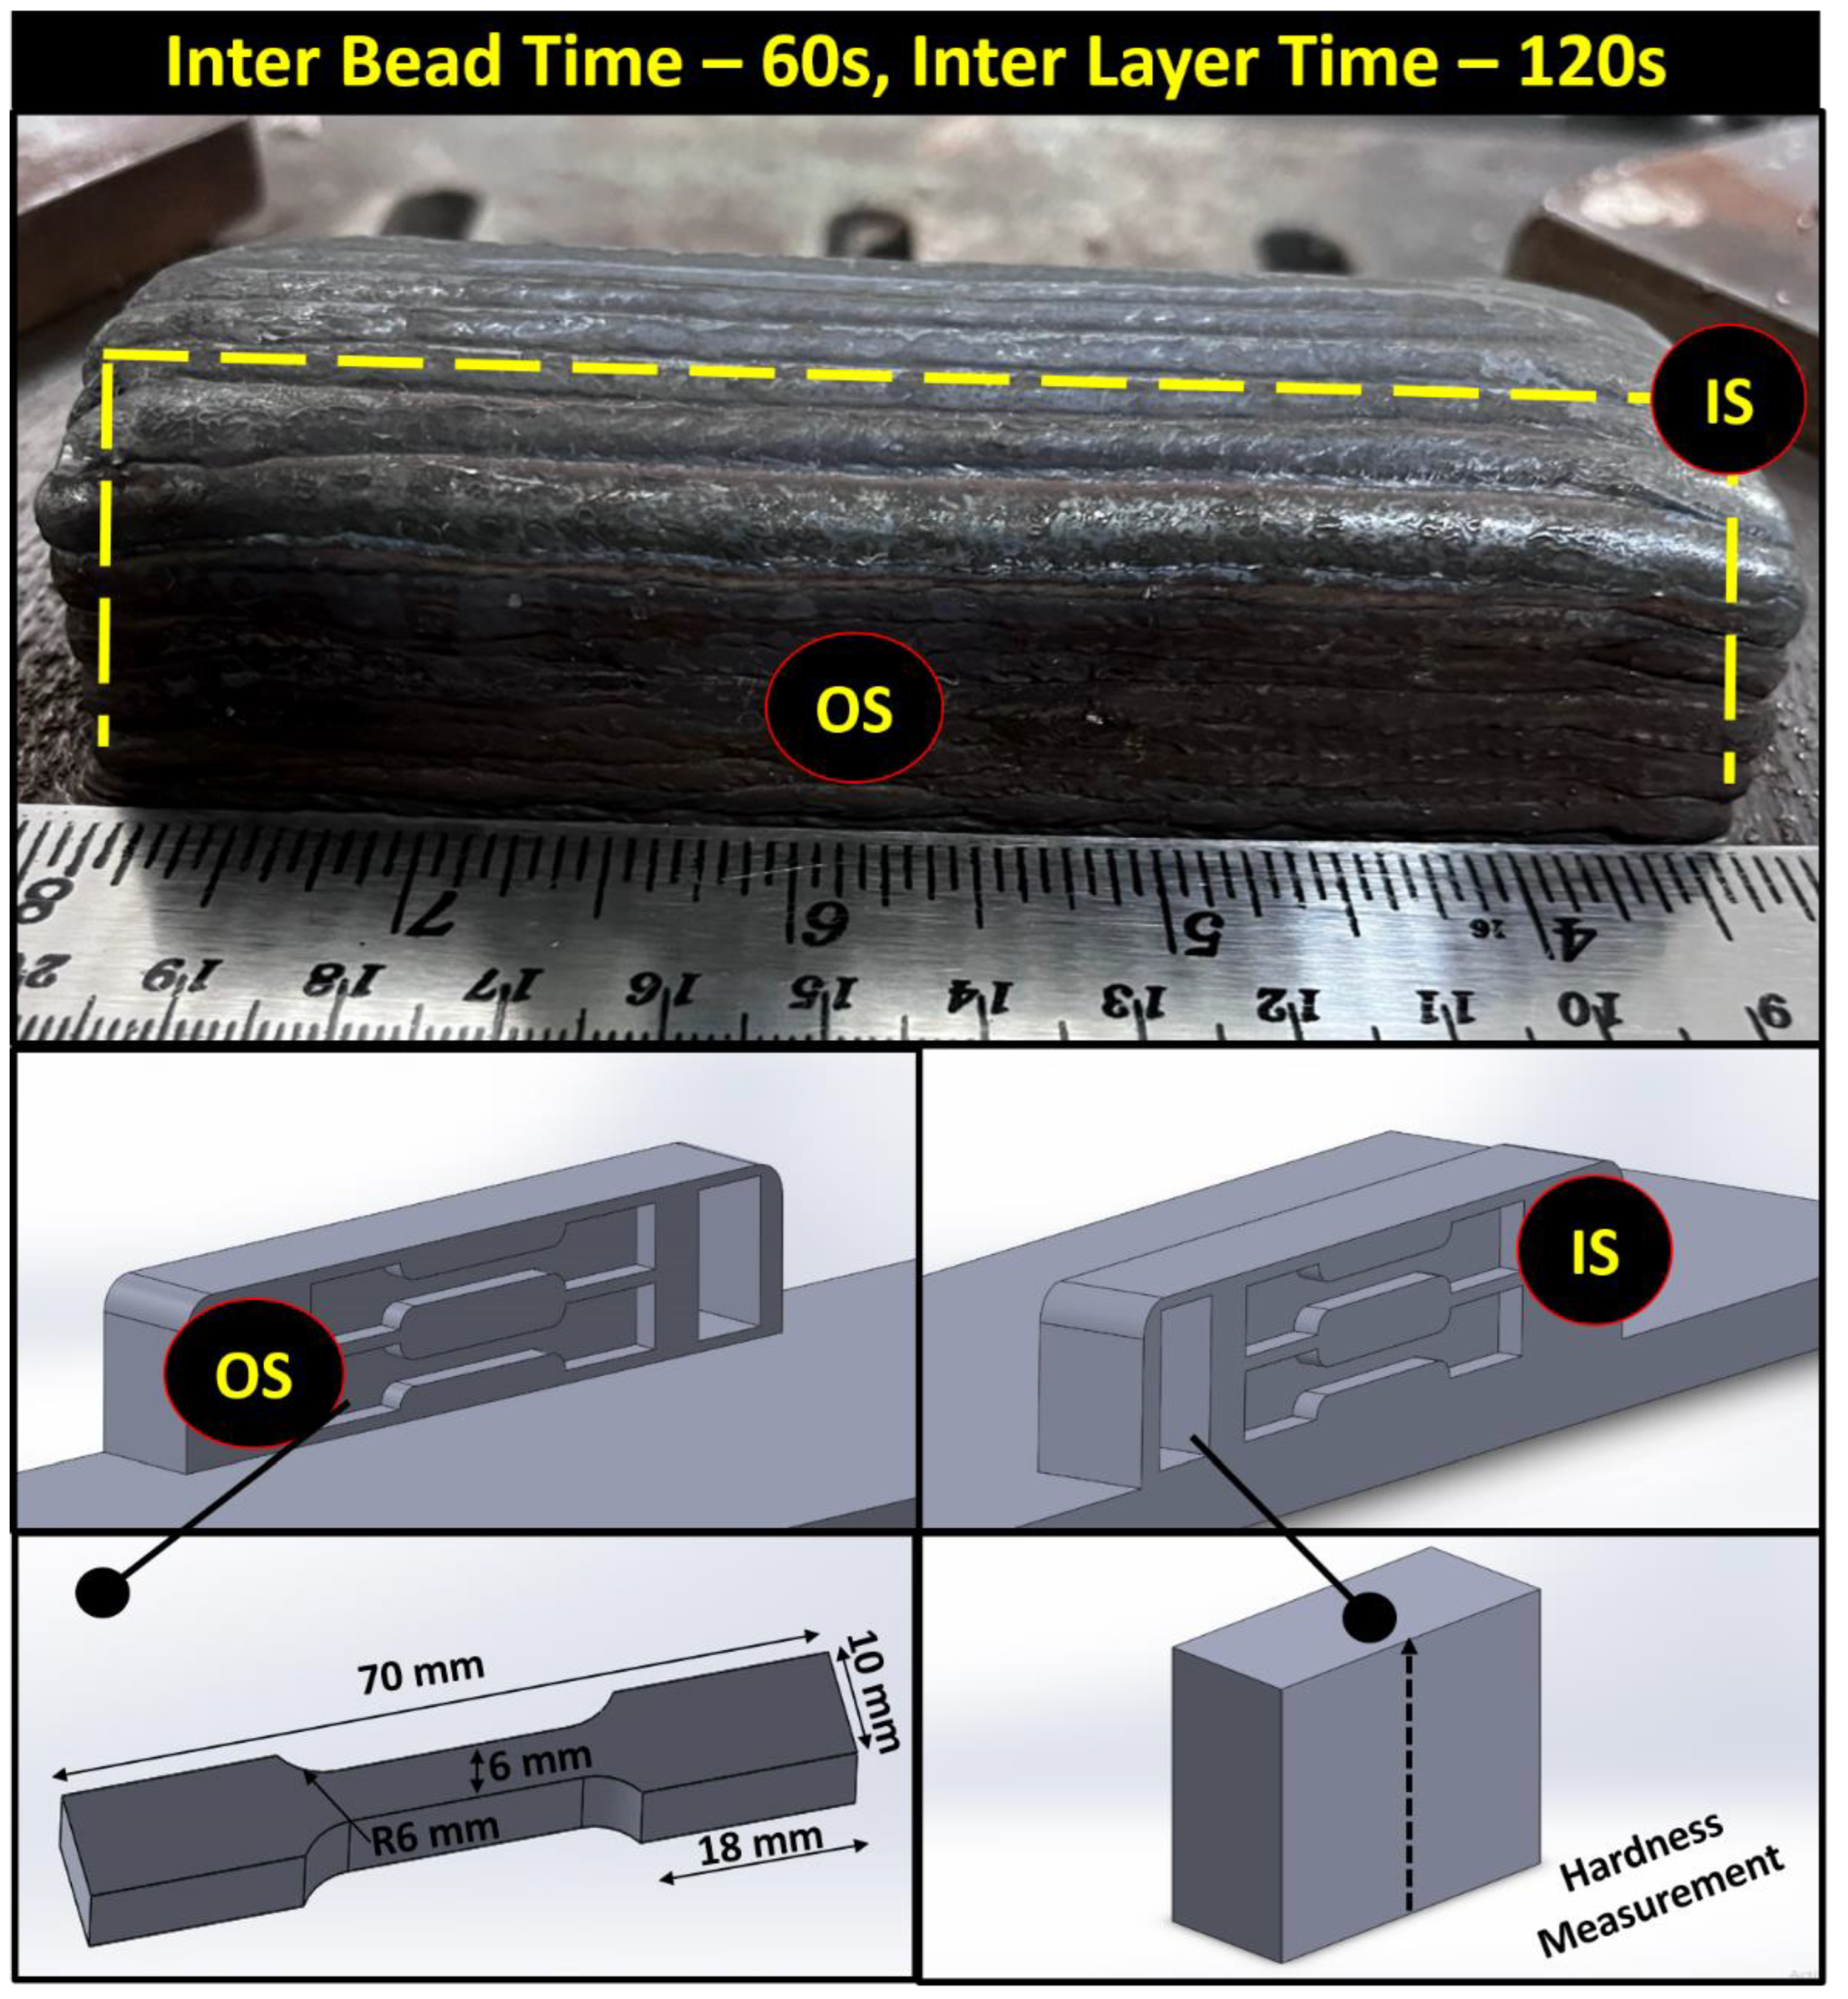
2.2. Development of Thick Walls

The second part of the research paper involves the fabrication of thick walls. The eight different beads were fabricated along the single layer with an overlap of 35%. The fabrication continues for a total of 12 layers. The schematic and scanning strategy opted for different layers is shown in Figure 5a,b. The nozzle outlet of the welding torch was kept at 12 mm from the workpiece. The thick wall was fabricated with a 60 s interlayer and 120 s inter bead time [32]. The final part was made with the length, width, and height of 120, 36, and 26 mm, respectively. After that, the two slices with 4 mm thickness each were cut from the outer surface (OS) and inner surface (IS) of the thick wall, as shown in Figure 6. The four tensile samples were then prepared to study the anisotropy using Wire-EDM (Sprintcut Dlx, Electronica, Kolkata, India) named as the inner bottom (IB) and inner top (IT) from IS and outer bottom (OB) and outer top (OT) from OS. Apart from this, the sample for characterization was cut from the XZ plane. The XZ plane was then divided into two parts, i.e., top and bottom. The referenced coordinate system is shown in the Figure 5a.

2.3. Materials Characterization

After the deposition, the samples were cut from bulk fabricated specimens to perform materials characterization. The standard metallurgical method (ASTM: E1920) was followed during the mounting and polishing of the WAAM samples. Utilizing 40 mL hydrochloric acid, 40 mL distilled water, and 10 g copper sulfate, the specimens were chemically etched for 20 s to reveal the microstructure. The microstructure of the XZ cross-section samples along the build height was examined using an optical microscope (OM) (LEICA, DM2700 M, Wetzlar, Germany) and a scanning electron microscope (SEM) (Jeol, Jsm-6610LV, Tokyo, Japan). Additionally, energy-dispersive X-ray spectroscopy (EDS) (Oxford Instruments, X-mas, Abingdon, UK) was used to ascertain the chemical elements contained in the specimens. Further, the different phases generated were analyzed using an X-ray diffraction (XRD) machine (Malvern Panalytical, Empyrean, Malvern, UK). The XRD measurements were acquired via the Bragg-Brentano scanning technique, with a scanning angle ranging from 20 to 90 degrees, a step size, and a scanning time of 0.01 degrees and 20 s. Moreover, X-ray photoelectron spectroscopy (XPS) (Thermo ScientificTM, NexsaTM, Waltham, MA, USA) was performed to obtain a deep insight on the oxidation states of the samples. The information was normalized by attributing the most prominent signal to adventitious carbon at 284.5 eV [33]. Using WinSpec software 2.5, the XPS data were examined. The Shirley background was utilized for fitting and deleted to facilitate the fitting process. The peaks were generated by mixed singlet.

2.4. Mechanical Properties

To meet the subsize requirements of ASTM E8 for tensile testing, four horizontal dog-bone specimens (IB, IT, OB, OT) were trimmed from the SS410 thick wall, whose measurements are shown in Figure 6. The tensile test was conducted at the tensile rate of 1 mm/min using the universal tensile testing machine (Walter+bai, LFV, Zürich, Switzerland). Followed by tensile testing, the fractography analysis was carried out using the SEM. Moreover, the density measurement of the tensile specimens was accomplished using the Archimedes principle. Vickers Microhardness testing equipment was used to assess the hardness level (Inova Test, Falcon 400, Maastricht, The Netherlands) in two directions (along and perpendicular to the build height in XZ samples). An indenter made of diamond was utilized to exert a 0.2 kgf force for 10 s. The final value reported in the study is the average of five indents corresponding to each distance value. Moreover, the wear analysis of the sample was carried out on the YZ plane of the OS. Prior to the test, the specimen was polished with emery papers of different grit sizes and, subsequently, washed with ethanol. Wear was evaluated using a ball-on-disc tribometer (Ducom, POD 4.0, Bohemia, NY, USA) under ambient conditions. The sample was subjected to a wear process with an applied force, sliding distance, and revolutions of 5 N, 340 m, and 300 rpm, respectively. The wear examination was executed for 30 min at 300 rpm using Al2O3 as the counter body. Further, the morphology of the worn surface was analyzed using SEM. The testing variables utilized in the wear performance of the sample are shown in Table 4.

3. Results and Discussions

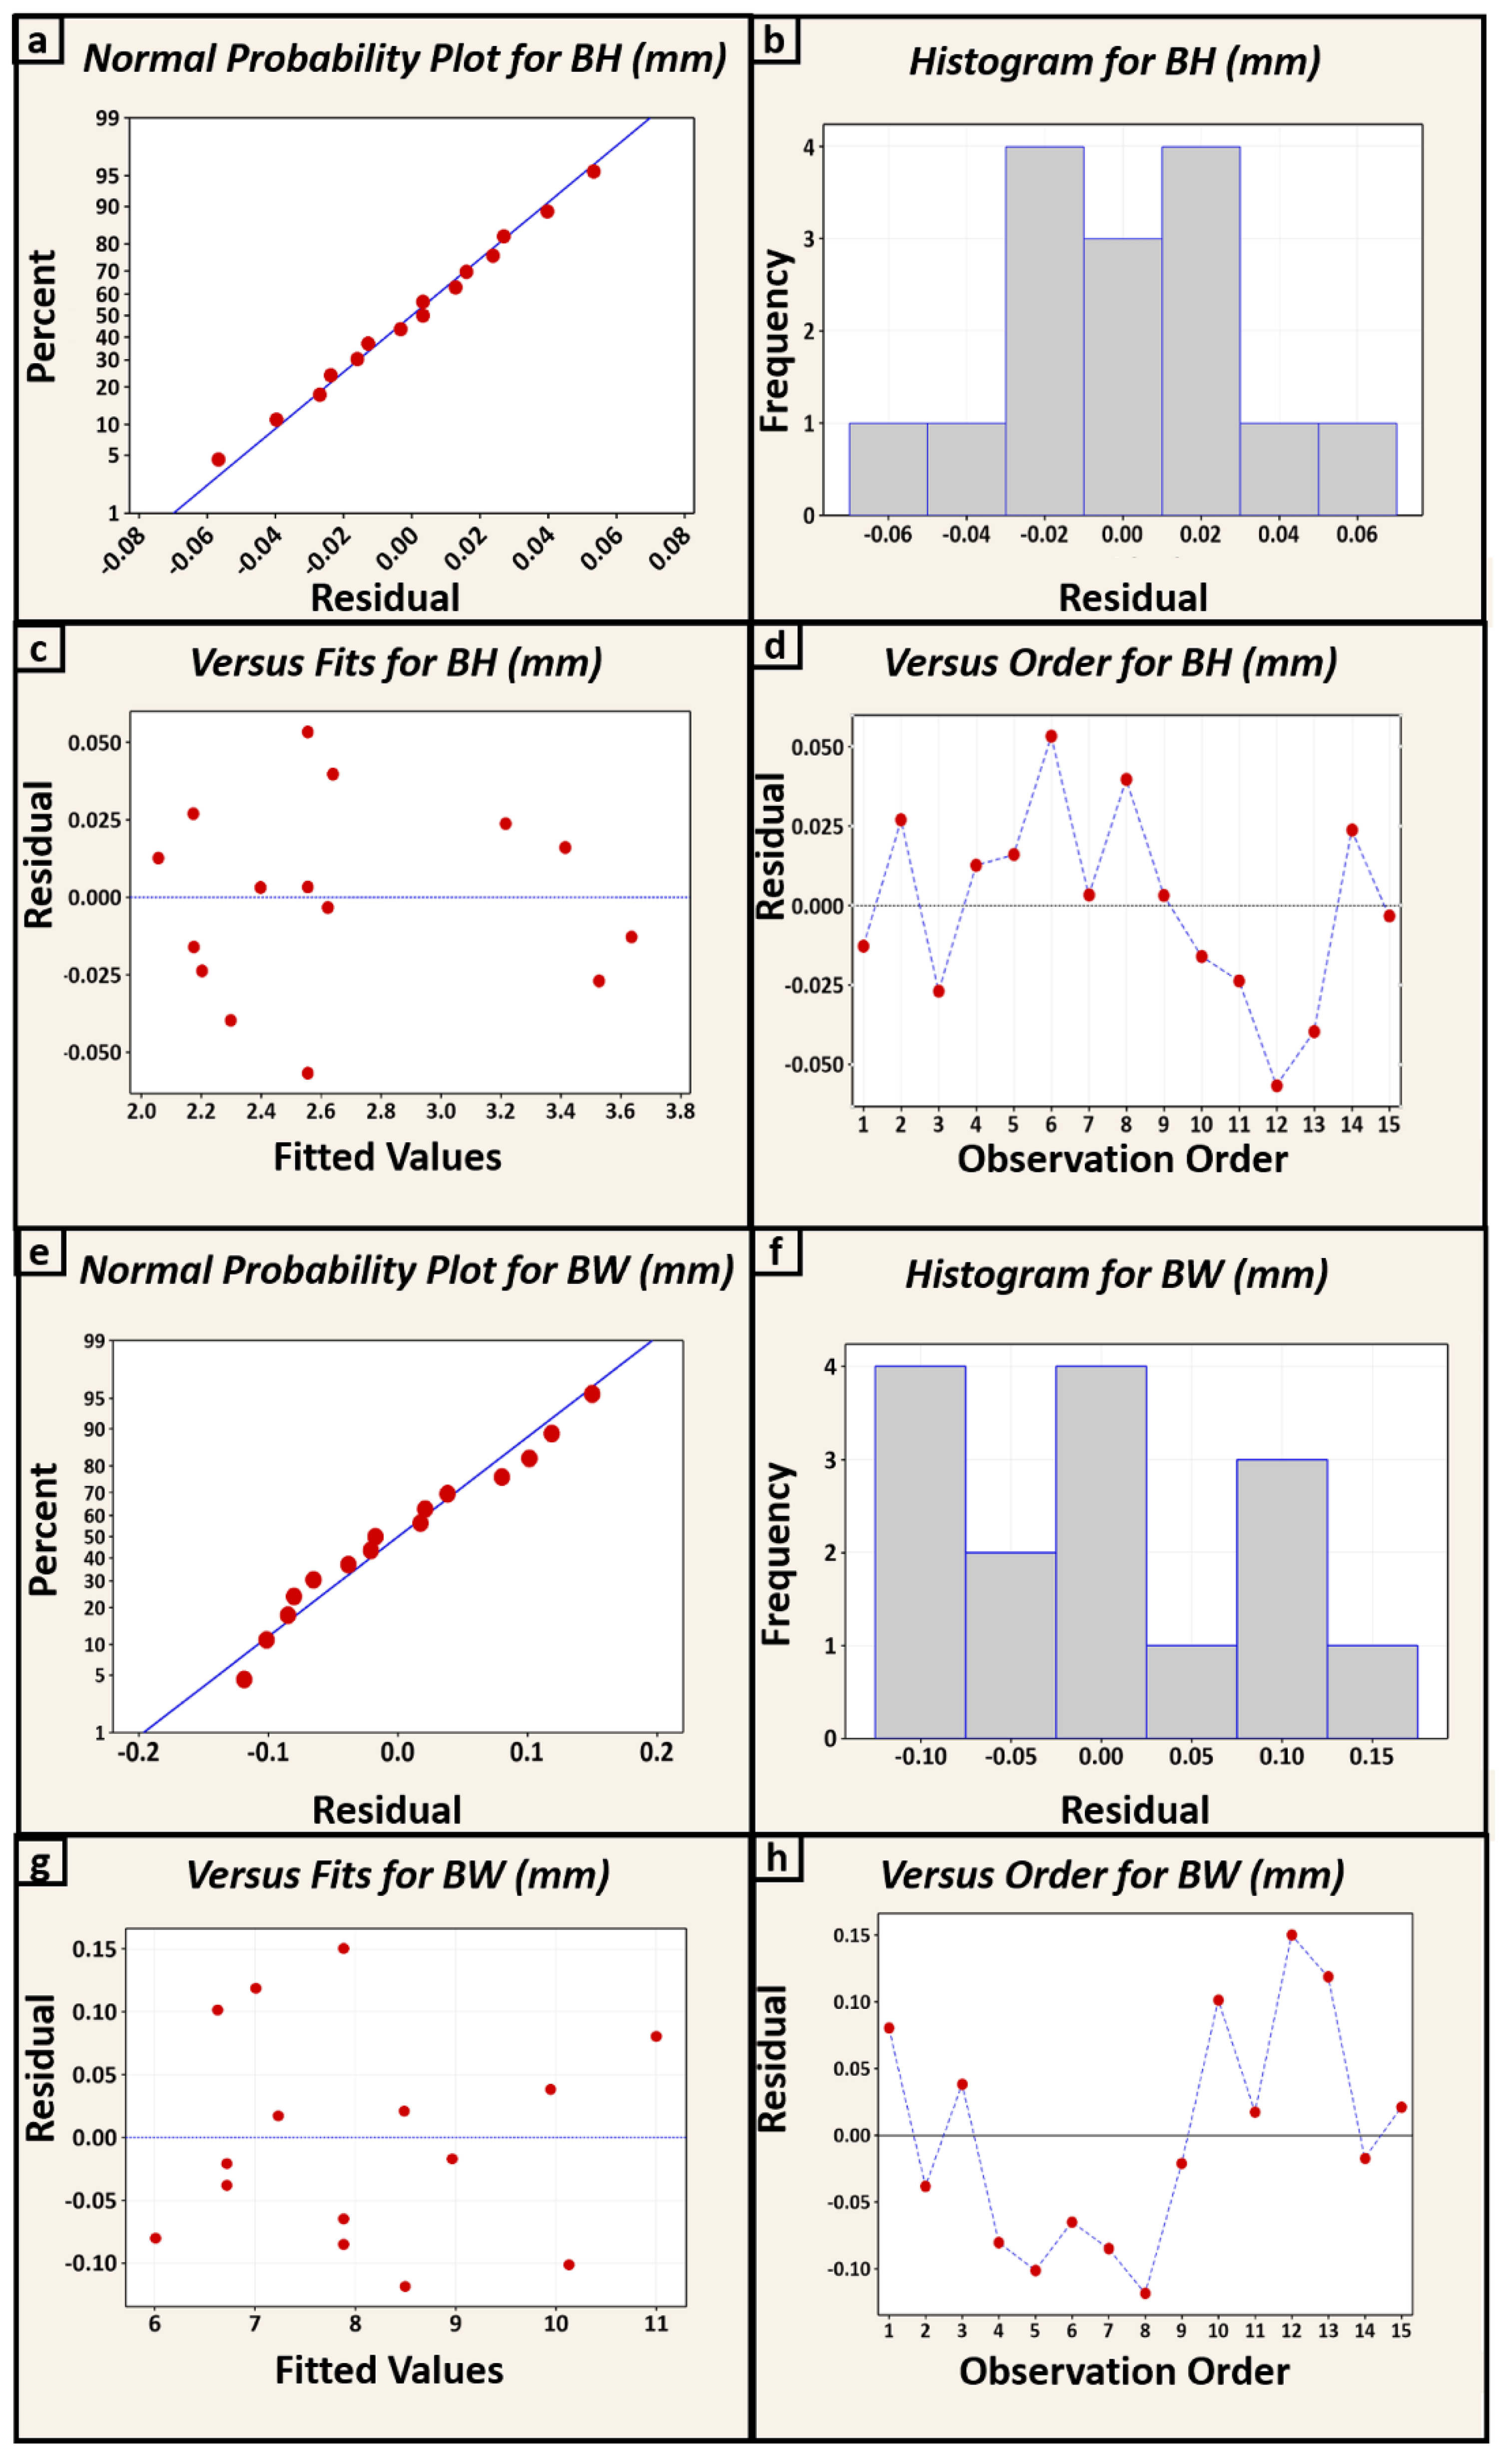
3.1. Development and Validation of Regression Equations

In the present investigation, the second order regression equations are selected to form the forecasted models of BW and BH. The equation is empirically represented as
y = c o + k = 1 3 c k x k + k = 1 3 c kk x k 2 + k . l = 1 ,   k l 3 c kl x k x l
where y is the dependent variables (BW and BH), xk and xl are the independent or process variables (WFS, TS and GFR), co, ck, ckk, ckl etc. are the coefficients of variables. The response value for each run is entered into the Minitab to determine the coefficients for each term in the equation. The regression equations for both BW and BH are
BW   mm = 1.13 +   2.882 ×   WFS   0.1191 ×   TS +   0.383 ×   GFR   0.1298 ×   WFS 2 +   0.000876 ×   TS 2   0.00836 ×   GFR 2   0.00810 ×   WFS   ×   TS   0.025 ×   WFS   ×   GFR   0.000307 ×   TS   ×   GFR
BH   mm = 3.10 +   0.758 ×   WFS   0.06583 ×   TS   0.0320 ×   GFR   0.0555 ×   WFS 2 + 0.000443 ×   TS 2 0.00122 ×   GFR 2   0.00273 ×   WFS   ×   TS + 0.00675 ×   WFS   ×   GFR +   0.000370 ×   TS   ×   GFR
After the development of models, the analysis of variance (Anova) method and experimental approach is used to assess the accuracy of the regression equations. In the Anova, the hypothesis is tested at the 5% level of significance. On the other hand, the predicted values of responses for a particular set of process variables are compared with their experimental outcomes.

3.1.1. Anova

Each process variable is presumed to have a negligible impact on the responses under the null hypothesis for the models. On the other hand, under the statement of alternate hypothesis, WFS, TS, and GFR are assumed to affect the outcomes significantly. Subsequently, the correctness of the null hypothesis is tested by calculating the f and p-value of BW and BH, as shown in Table 5.
The p-value, employed to determine the statistical importance of the variables and model, is calculated using the f-value. The lower p-value below the 5% (0.05) significance level provides more convincing evidence against the null hypothesis. As can be seen in the present study, the value below 0.05 corresponds to the TS, WFS, TS*TS, and WFS*TS. For the mentioned process variables, the null hypothesis is false; hence, these parameters significantly affect the BH and BW. On the other hand, it is relatively intriguing to observe that the GFR is a negligible parameter, indicating that the amount of cooling rate has the most insignificant influence on the bead characteristics. Moreover, the BW and BH models’ appropriateness for predicting the response value is indicated by the high p-value of the lack of fit. Besides, the table shows no explanation in regard to the extent the relevant parameters have influenced the results. Therefore, the Pareto effect chart (Figure 7) is used to quantify the impact of significant variables on the BH and BW. The red dotted line represents the critical value of the standardized effect below which the parameters are insignificant and vice versa. The Pareto chart is in accordance with the p-value shown in Table 5. The TS has been proven to have a more considerable influence on the BH and BW than any other variable.
The adequacy of the model is indicated with the aid of different terms shown in the summary table (Table 6). The S represents the standard deviation between the fitted and experimental values. It is important to note that fitted values are the model’s predicted values. The S value for both the BW and BH is insignificant, showing a better fit. However, a small S value does not always mean that the model fulfils the assumptions. To confirm the assumptions, the residual plots are investigated in the subsequent paragraph. Moreover, the high R-sq, R-sq (adj), and R-sq (pred) further confirm the adequacy of the BH and BW model, as shown in Table 6.
Residual plots show the confirmation of the promising Anova findings. Under certain assumptions, the Anova analysis is deemed valid and appropriate for the chosen model. These assumptions are made before applying the Anova to the model. Therefore, until the accuracy of these assumptions has been established, it is often not advisable to depend on the Anova [34]. The residual graphs for BW and BH are shown in Figure 8. The normality probability plot (NPP) in both responses illustrates linear growth (Figure 8a,e). It implies that the Anova test applied for both models is appropriate. The histogram plot (Figure 8b,f) shows a bell-shaped distribution representing the data essential for a robust Anova. The second graph of verses fit demonstrated that fits are completely random around the source (Figure 8c,g). Moreover, the Anova data are also confirmed by the verses order plot, which shows no specific pattern (Figure 8d,h). This means that all four plots of BW and BH supported the Anova test for a more accurate forecast.

3.1.2. Experimental Validation

In the second validation approach, the BW and BH responses at random parameters are predicted using the previous regression model. Similarly, the same process variables are fed into the machine, and the bead is printed on the substrate plate. However, it is pertinent to mention that the GFR value is held at a constant value as it has an insignificant effect on the BW and BH. The results of the predicted and the actual value are shown in Table 7. The comparison of both results show the insignificant error for BW and BH. The error pertaining to BW is less than 3.7%, and for BH, it is between 0.8 and 1.8%. Hence, this validation approach proves the model’s ability to predict the BH and BW value with a maximum error of 3.7% for BW and 1.8% for BH.

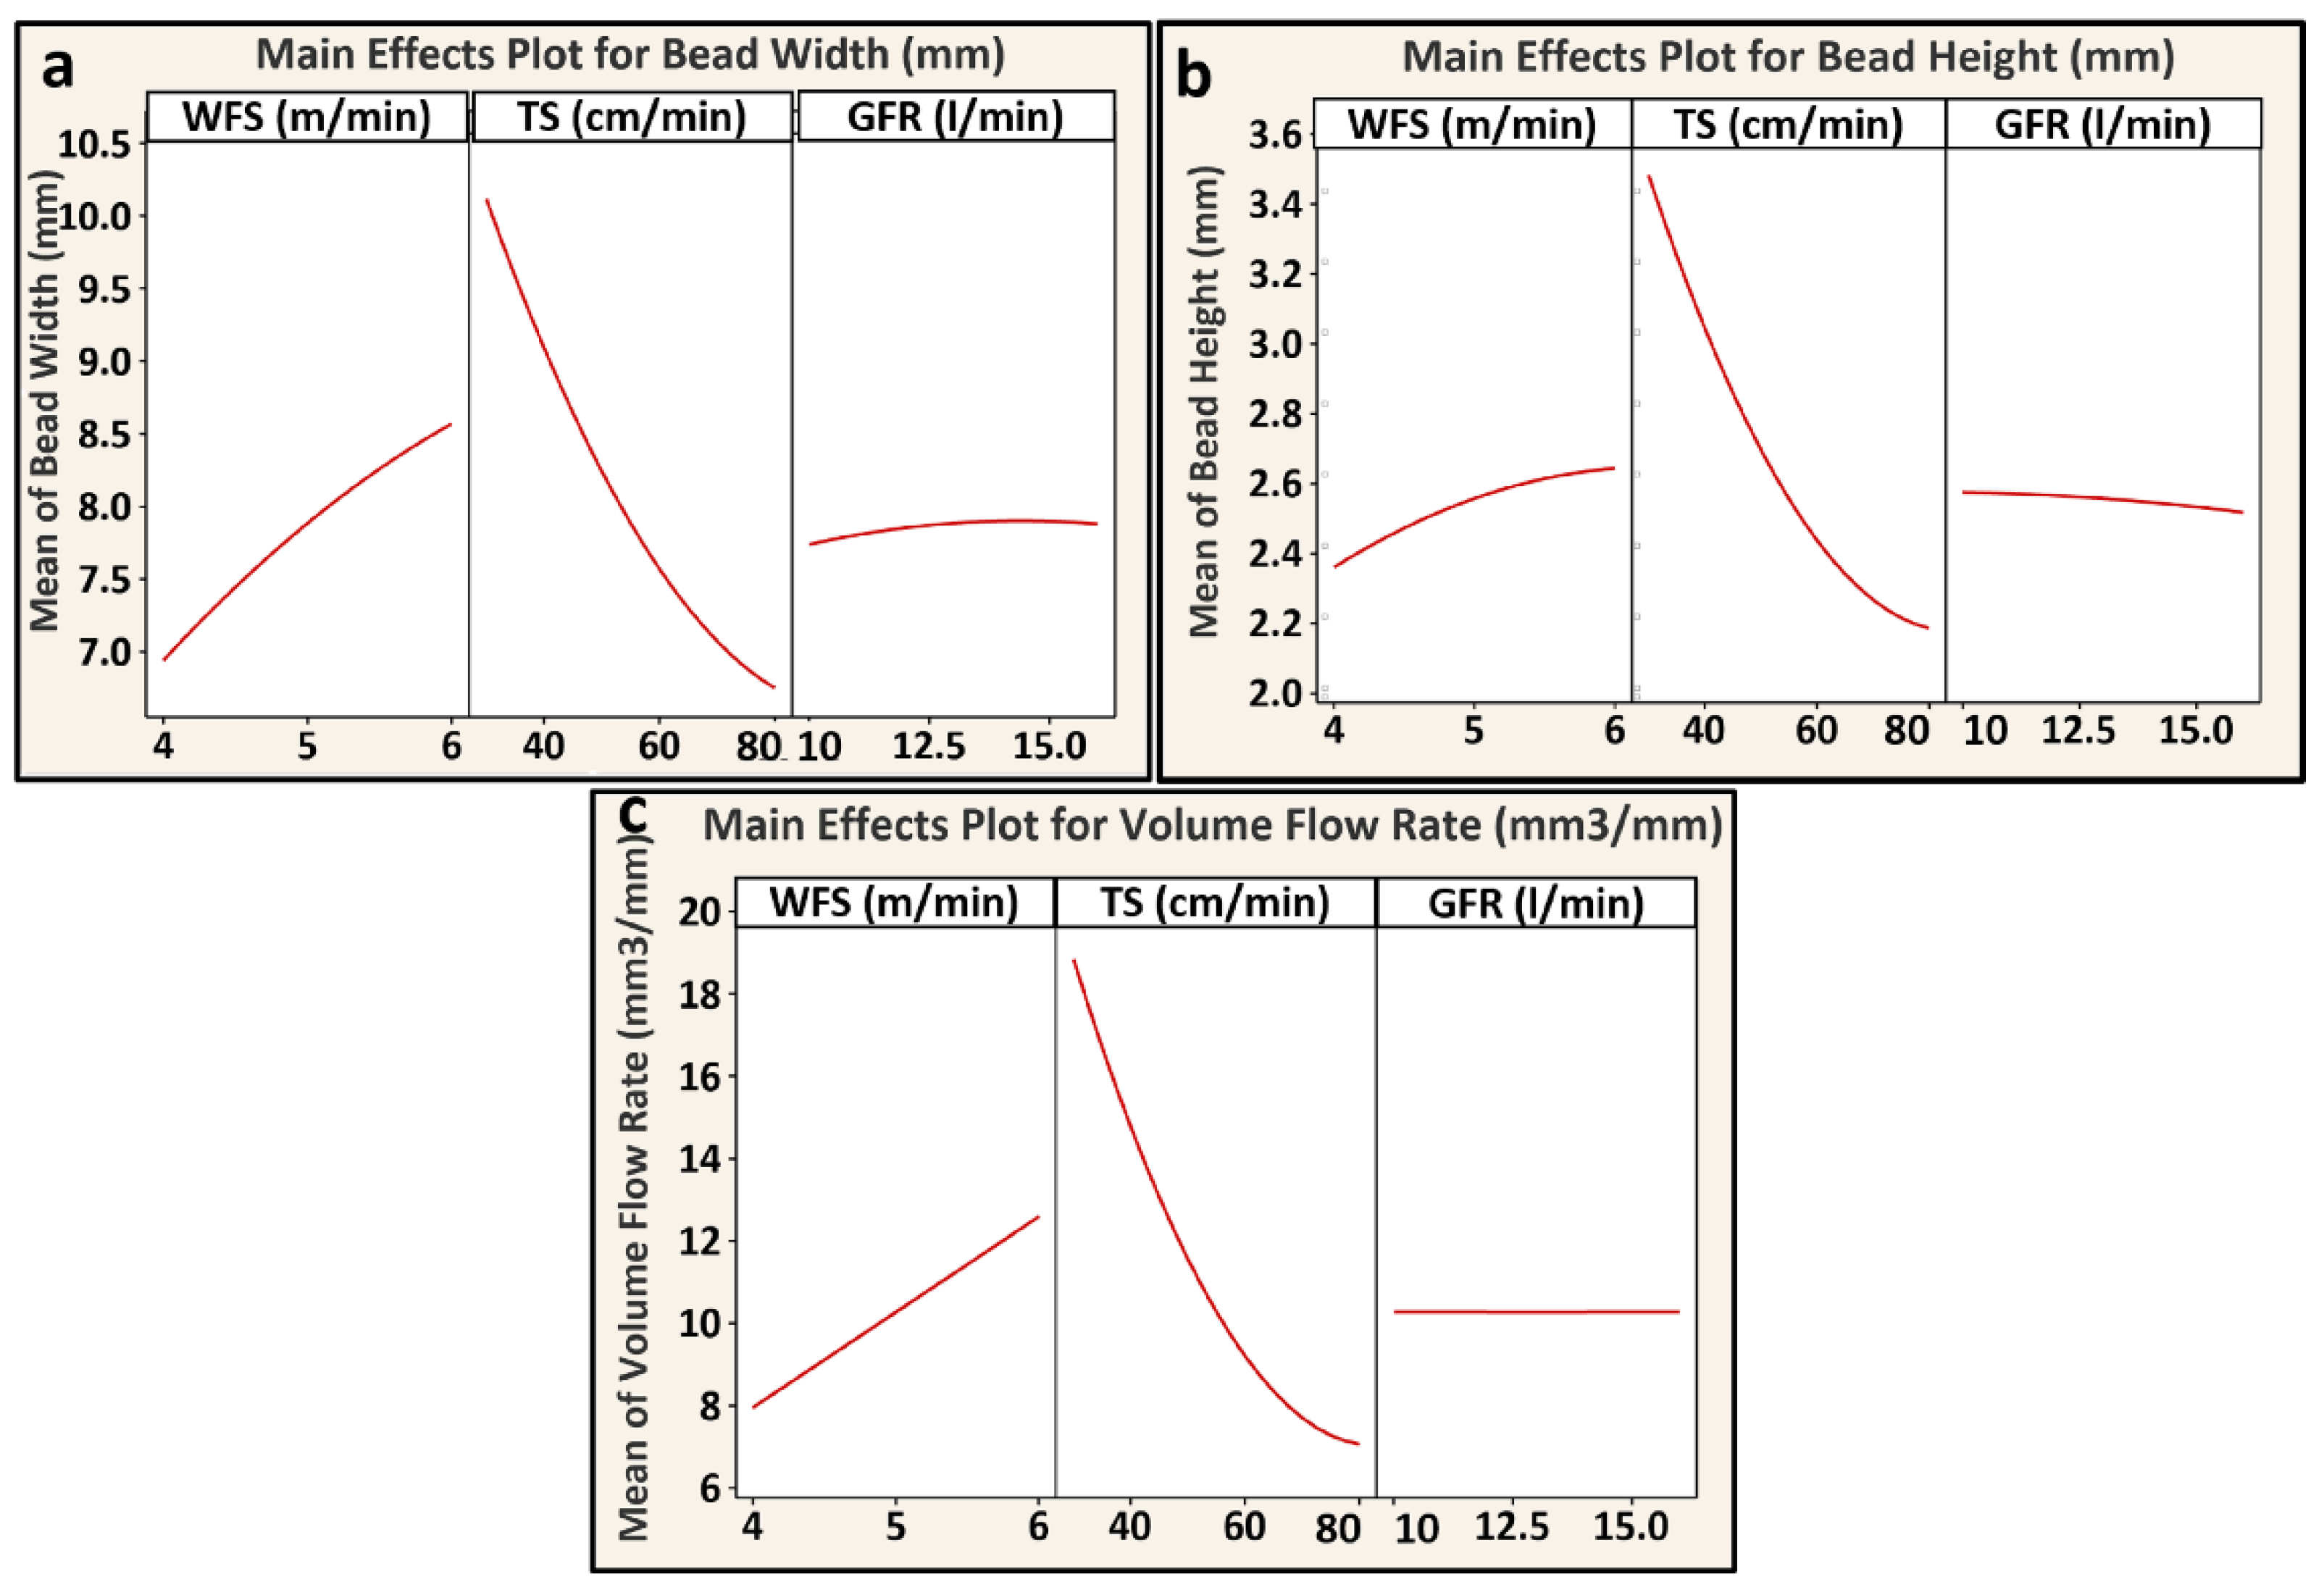
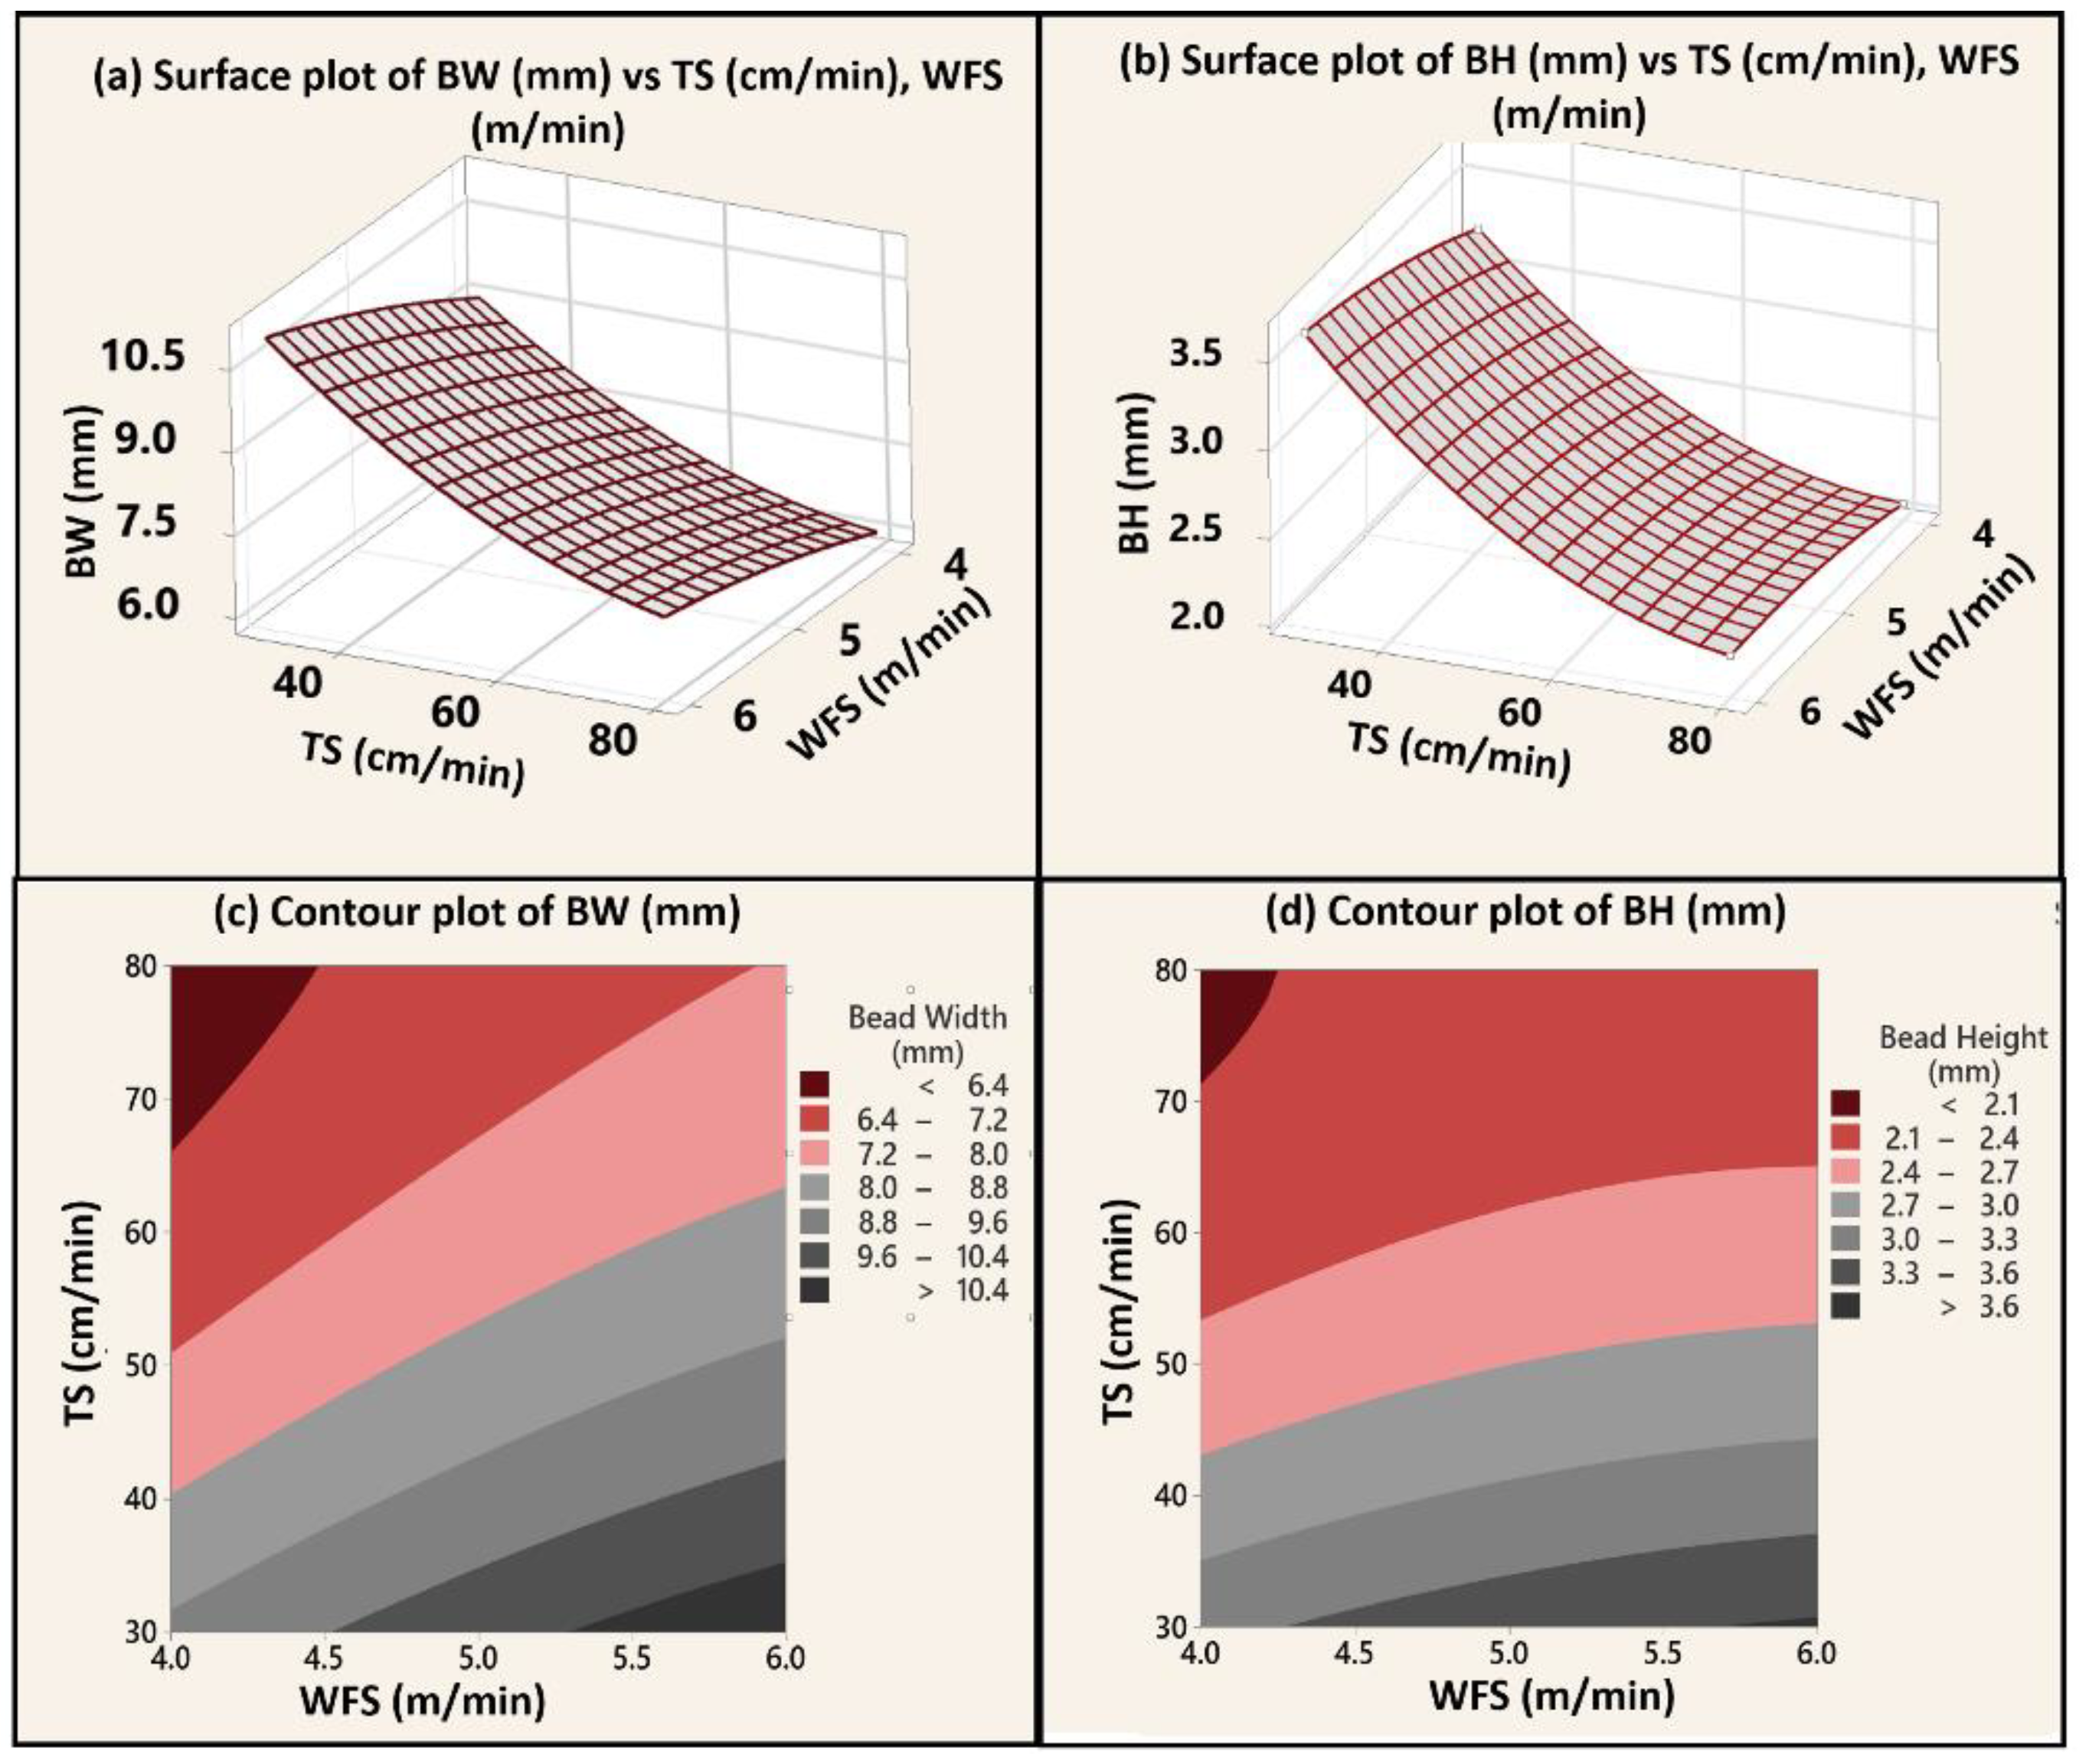
3.2. Effect of Process Variables on BW and BH

The trend that BW followed in response to the change in WFS, TS, and GFR is depicted by the main effect plot in Figure 9a. Akin to the BW plot, BH graphs show similar behavior with respect to each process variable (Figure 9b). The WFS follows a direct relationship with the BW and BH. Due to the alteration of WFS from 4 to 6 m/min, the BW and BH have changed from approximately 7–8.5 mm and 2.4–2.6 mm, respectively. The increase in the BW and BH owing to the WFS can be attributed to the higher speed of wire coming out of the nozzle resulting in a greater volume of material getting deposited per unit length. Moreover, this manifestation also pertains to the increase in the heat input value accounting for more spreading of bead resulting in high BW. It is interesting to note that the width variation is higher than the height. It can also be observed in the surface plots of BW and height shown in Figure 10. On the other hand, with the increase in the TS (30–80 cm/min), the drastic dwell from 10.2–6.5 mm and 3.5–2.2 mm is observed in the width and height value. This could be ascribed to the reduction in the volume deposited per unit length with high TS of bead resulting in less BW and BH. Moreover, when comparing the WFS and TS graphs, the latter has radically altered the BW and BH value. This finding is in agreement with the Pareto effect chart mentioned previously. Consequently, to address such an occurrence, the volume flow deposited is plotted against both TS and WFS. The results in Figure 9c show the TS has affected the volume flow rate more significantly (7–19 mm3/mm) when compared with respect to WFS (8–13 mm3/mm). Therefore, the TS accounts for the more significant variation in both bead characteristics. Moreover, the BW and BH shows almost constant behavior with the GFR, also demonstrated by the p-value. The contour plots in Figure 10c,d represent different color coded BH and BW values at various combinations of TS and WFS (GFR held at 13 L/min). It can be interpreted that the majority of the values lie in the region of 6.4–7.2 mm for BW and 2.1–2.4 mm for BH.

3.3. Multi-Objective Optimization
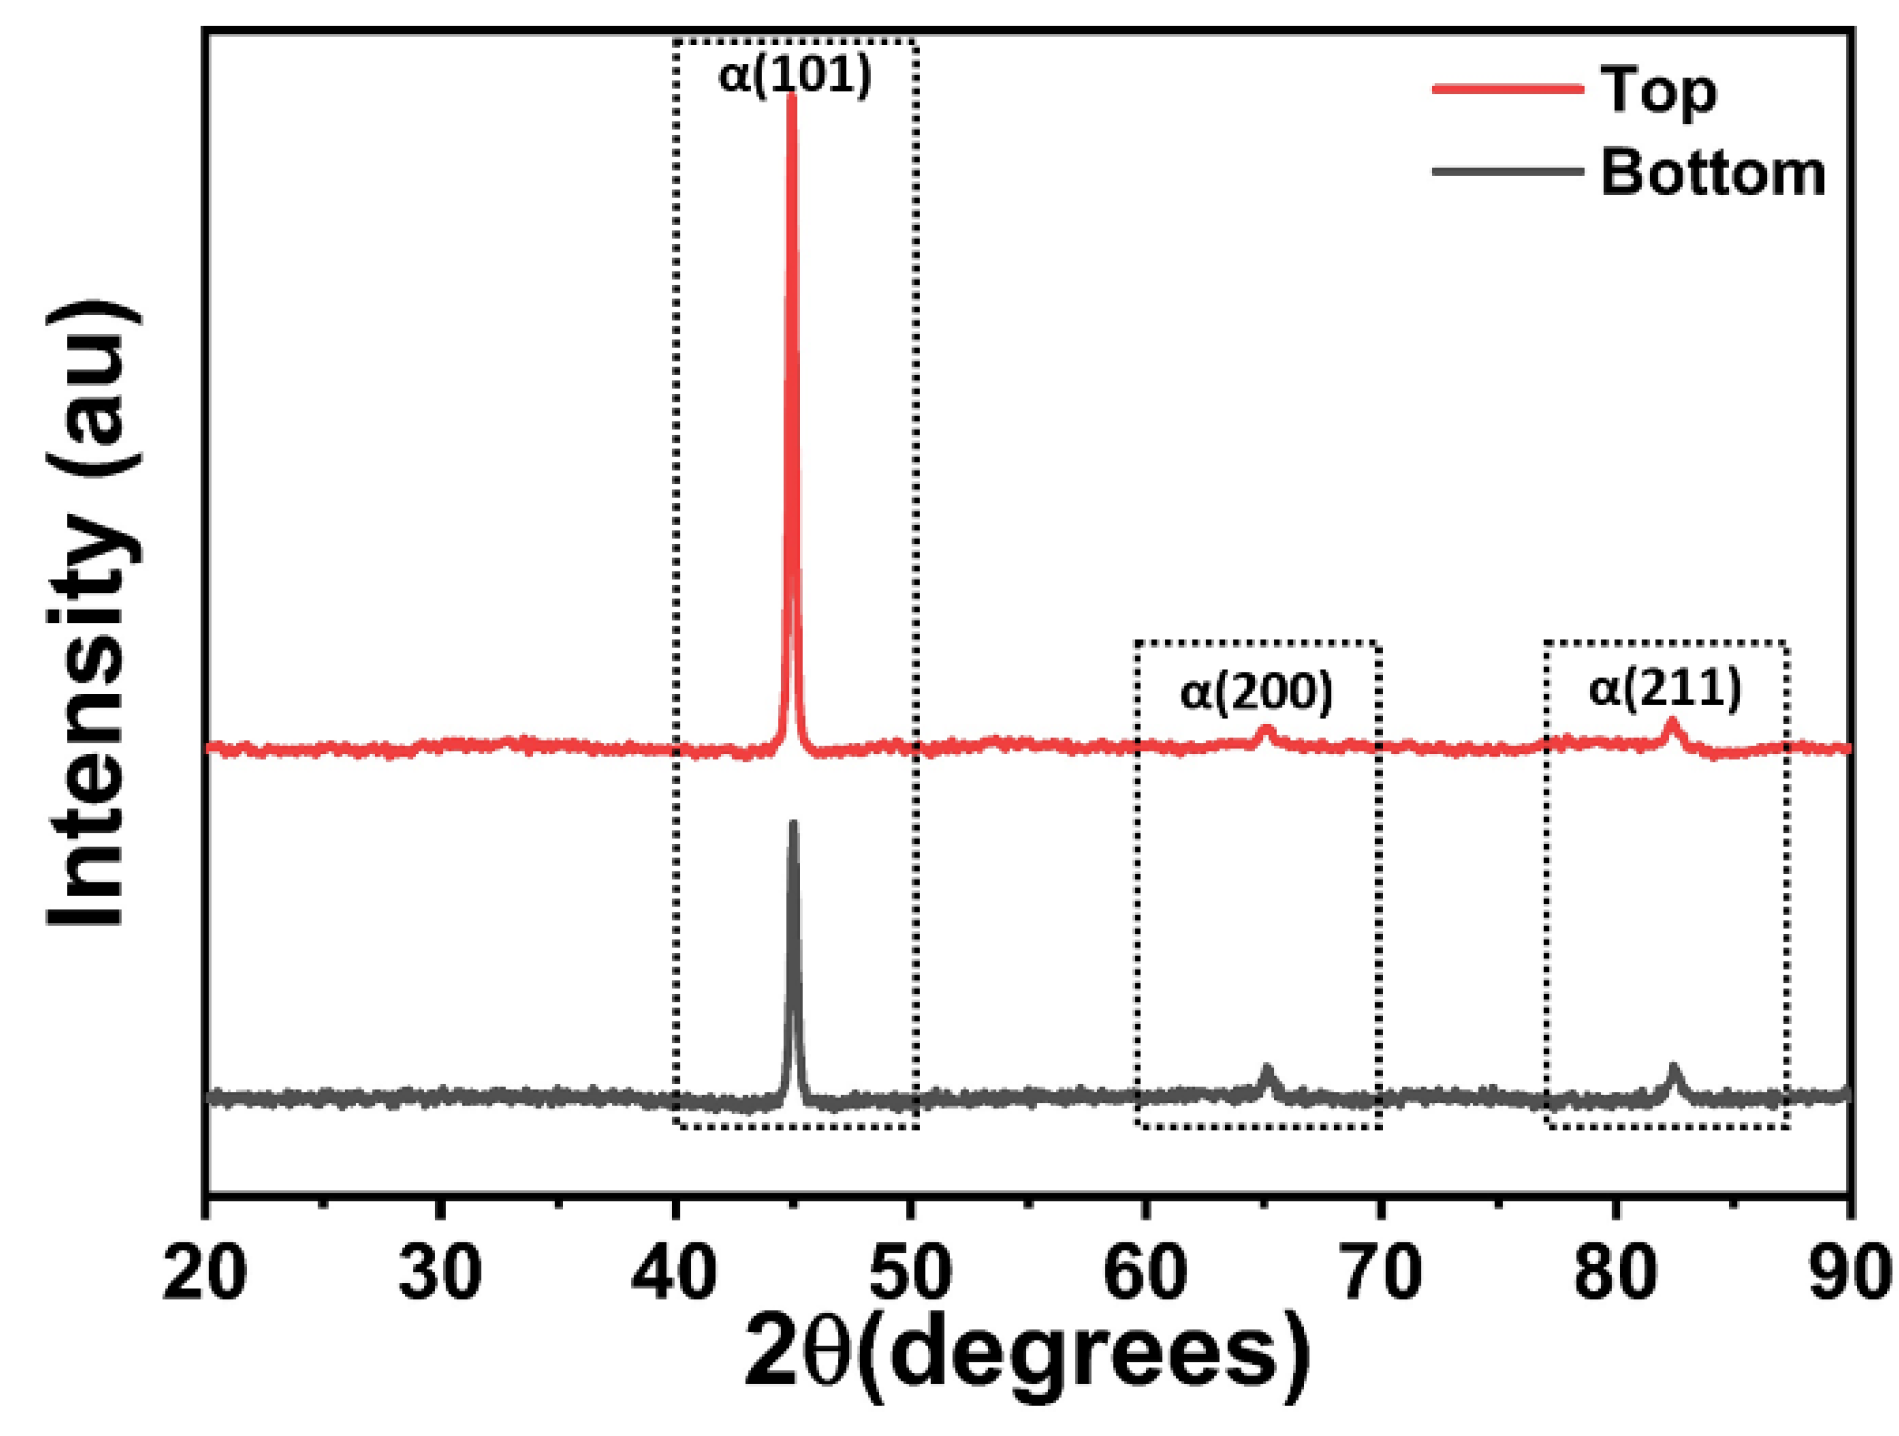
The CMT—WAAM technique depends heavily on the bead shape and the amount of heat input to determine the feasibility of bulk manufacturing. Welding beads with a low heat input, high BW, and little to no height fluctuation are often preferred as they guarantee consistency the deposits [35]. In addition, the schematic in Figure 11 shows the added advantage of deploying a maximum bead width in the optimization. With high width, the surface area of contact with the substrate increases, escalating the heat transfer via conduction. Moreover, it is paramount to note that while performing the experimentation, the WFS greater than 5.5 m/min resulted in significant sputtering. Therefore, to facilitate the spatter-free injection, the constraint was put to WFS at the said value. Furthermore, the GFR has shown insignificant variation in bead characteristics; therefore, it is held at the median value of optimization, i.e., 13 L/min.
The multi-objective optimization of bead geometry is accomplished using Minitab software. The optimized values obtained are 5.5 m/min (WFS), 63 cm/min (TS), and 13 L/min (GFR). The additional parameter used for the development of a thick wall is shown in Table 8.

3.4. Phase Analysis

The phase analysis of the bottom and top regions of the XZ sample is conducted using an XRD plot. The XRD graph is shown in Figure 12. The acquired XRD data suggest that the significant phases in both bottom and top microstructure can either be body-centered cubic (BCC) ferrite or martensite. It is important to state that it is very difficult to distinguish between the BCC and BCT structure of martensite in the XRD analysis. In the current investigation, it is likely to observe BCC in both samples which is attributed to the low carbon content of feedstock material. It is well established that the BCT crystal structure is not stable at room temperature, so it will try to convert to a more stable BCC structure. It is only possible if the c-axis of the BCT shrinks and the a-axis elongates to make the c/a ratio equal to 1. The presence of carbon atoms in the octahedral site of BCT will obstruct the c –axis shrinkage. However, the feedstock utilized in the present study lacks carbon content; therefore, its probability of attaining an octahedral site is less. As a result, the BCC structure of the martensite is found. Furthermore, even if some carbon atoms have acquired the octahedral sites, the thermal cycle in the WAAM process may lead to the migration of those atoms, resulting in the BCC structure. The bcc peaks are distinguished by the crystal planes (101), (200), and (211). No visible difference is observed between the bottom and top samples. Moreover, according to the study by Mayr et al. [36], the type of phases present in the microstructure is the function of the chromium percentage. Enhancing the chromium concentration above 11.4 wt.% will overcome the austenite phase region and allow a certain proportion of delta ferrite trapped in a martensitic structure at room temperature. As we know, the chromium percentage in SS410 material used in thick wall fabrication is between 12.5–14%; thus, the presence of delta ferrite is evident [37]. However, the X-ray diffraction method cannot distinguish between delta ferrite and martensite because the lattice parameters are comparable. Therefore, the OM and SEM are used in the subsequent section to prove the existence of delta ferrite in the microstructure.

3.5. XPS Characterization

As the WAAM bulk fabrication process was performed under ambient conditions, it becomes evident to understand the oxidation states formed after the experimentation is completed. To do so, the results of XPS for the top sample are shown in Figure 13a. Carbon 1s can be separated into three different peaks, namely 284.5 eV, 285.9 eV, and 287.8 eV. Peaks at 285.9 eV and 287.8 eV indicate the existence of hydrocarbon compounds in the alloy. The Cr 2p peaks at 578.26 eV, 577.52 eV, 576.6 eV, and 576 eV represents the existence of oxides of Cr in three different oxidation states [38]. Moreover, the peak at 574.3 eV indicates the presence of pure Cr metal. Out of each spectrum, the most dominant peak corresponds to Cr3+, which, being stable, tends to transform from Cr2+ by losing one electron to form the stable state [39]. Therefore, no peak corresponding to the Cr2+ is observed in the Cr spectra. The peaks pertaining to the Fe at 706.5, 709.8, and 710.5 eV can be allocated to the pure Fe metal, FeO, and Fe2O3,, respectively [40]. Fe2O3 and Fe (metal) formation can be attributed to the by-products formed, owing to the decomposition of FeO [41]. The decomposition of FeO is due to its instability at low-temperature conditions [42]. However, the dominant peak of FeO at room temperature still exists, showing the inability of decomposition. The Mn peaks show the presence of oxides at different oxidation states. The one at 641.8 eV represents the existence of MnO2, 641.4 eV shows MnO, and 640.8 eV can be assigned to Mn2O3 [43]. The synthesis of MnO and Mn2O3 is attributed to the heating of MnO2 under different conditions. The development of Mn2O3 is accomplished by heating the MnO2 at 600 degrees Celsius in the presence of air. On the other hand, the existence of MnO is ascribed to the MnO2 heating under an argon environment [44]. The source of argon gas in the present investigation is the shielding gas (98% Ar, 2% O2) used during bulk fabrication. The O peak indicates the formation of various metal oxides at 529.8 eV, and the peak confirms the development of MnO and FeO at 531.5 eV [45]. The P peaks at 133.5 and 132.5 eV indicate the presence of P-O-C bonds. On the other hand, the peaks at 134.3 and 131.5 eV signify phosphates and pure phosphorus, respectively [46]. The Si spectra at 104, 102.5, and 101.8 eV can be assigned to the SiO2, Si-O-C, and SiC, respectively [47].
Moreover, the XPS findings for the bottom sample are given in Figure 13b. The bottom specimen shows the C peaks at similar binding energy values identical to the top sample. However, unlike of top sample, the bottom specimen indicates the presence of only two oxidation states, i.e., Cr3+ and Cr4+ [48]. Additionally, the akin Cr pure metal is observed in the bottom sample at two different peaks of 575 and 574.3 eV. The peaks associated with the Fe at 709.8 can be allocated to the FeO. On the other hand, both peaks at 711 and 713.9 eV can be assigned to Fe2O3, respectively. Howbeit, it is pertinent to state that in contrast to the top sample, the bottom specimen shows no sign of pure Fe metal. For Mn, the peaks show similarity when compared with the top sample. However, the bottom specimen also indicates the presence of Mn metal in its pure form. The O peak at 529. 6 eV suggests the synthesis of different metal oxides, while the peak at 531.5 eV confirms the presence of FeO [45]. The existence of P-O-C bonds is shown by the inclusion of peaks at 133.5, 133, and 132.5 eV. The spikes at 134.3 and 131.5 eV, on the contrary, represent phosphates and pure phosphorus, respectively. Si peaks at 103.2, 102, and 101.55 eV can be attributed to SiO2, Si-O-C, and silicon carbides, respectively. Moreover, it is important to state that the presence of copper in the chemical composition of wire shows no significant oxide formation in the thick wall.

3.6. Microstructural Evolution

The microstructure images are obtained using OM at different spots starting from bottom to middle and then to the top are shown in Figure 14. The figure shows significant microstructure evolution with build height, proving the anisotropy during the bulk fabrication. It is worthwhile to note that the microstructure at lower build heights (Figure 14 (1)) represents the excessive martensite which could be attributed to the rapid cooling of the SS410 layer deposited over substrate kept at room temperature [47]. The martensite presence is further confirmed with the SEM image in Figure 15a. Moreover, with an increase in the build height, the reduction in the martensitic phase was observed from 80 to 42%. The bright island-like features can be seen in the martensite matrix (Figure 14 (1–4)). As discussed in Section 3.4, this bright phase is delta ferrite, which is common in martensitic SS. This statement is made in light of a study by [49]. The same occurrence is confirmed with the aid of an SEM image (Figure 15b). The delta ferrite phase shown in Figure 14 (3–6) is formed due to non-equilibrium solidification. It is prevalent in steels having strong ferrite-stabilizing constituents such as Cr and Mo [50]. The equilibrium phase diagram of SS410 calculated using Thermocalc software by Mirzaee et al. [51] is shown in Figure 16. With the carbon weight % of 0.014, the first phase formed from liquid to solid transformation is delta ferrite. Consequently, as the temperature reduces, the transition of delta ferrite to austenite initiates at around 975 degree Celsius. Further, some delta ferrite does not undergo any solid to solid transformation and retain its phase, and therefore, three types of phases can be observed at room temperature: delta ferrite, austenite, and small amount of metal carbides. However, in the current investigation, owing to the rapid and non-equilibrium cooling, the austenite phase on rapid cooling rate accounts for martensite formation, which can be observed in the microstructure.
Moreover, as per the XRD peaks, no noticeable diffraction pattern is observed corresponding to the retained austenite (RA). Therefore, it is pertinent to state that there is little or no occurrence of RA in the thick wall fabrication. Moreover, the explanation behind no noticeable RA can be ascribed to the concept of martensitic start (Ms) and finish (Mf) temperature. Similar to other studies in the literature [52,53], the Ms and Mf are the functions of the cooling rate of the samples. With the reduction in the magnitude of cooling rate in SS410, it is witnessed that the Ms and Mf temperature increases and vice-versa [54]. The formation of RA is attributed to the drop of Mf below room temperature, due to which incomplete austenite to martensite transformation takes place, leaving behind the RA. In the bulk fabrication of a thick wall using WAAM, the cooling rate of the samples reduces with an increase in the build height. Hence, as the build height of the thick wall increases, the Mf increases well above the room temperature, thereby reducing the chance of RA formation, as observed in the present investigation. Moreover, it is pertinent to state that during fabrication of the first layer of thick wall, the cooling rate is known to be very high due to the abrupt heat transfer from SS410 material to substrate plate kept at room temperature. Even though the cooling rate is excessive, no discernible austenite peak is present in the XRD of the bottom sample.
In addition, it is interesting to note that the region undergoing re-melting shows reduced martensite content. With the increase in the build height, the overlap regions are observed to form a lesser martensite phase and eventually result in the delta ferrite phase. As the build height increases, the contents of delta ferrite in the overlap (shown by dashed lines) increase rapidly, as seen in the image Figure 14 (1–6). Lower delta ferrite concentration was associated with higher cooling rates in research by Arivazhagan et al. [55], as is observed in Figure 14 (1,2). However, the increase in delta ferrite concentration in overlap region with respect to build height is due to the secondary melting resulting in a wider re-melting zone penetrating deep into adjacent beads, enabling more segregation of ferrite stabilizers during the solidification. With adequate segregation, delta ferrite will become stable throughout the complete phase transformation process [56].
The delta ferrite grains increases in size with build height. It is well-established that grains with larger sizes are regarded as more stable because of the less Gibbs-free energy associated with them [57]. Therefore, the large delta ferrite grains at greater build height are retained even at room temperature. In addition, the explanation for large grains at greater build height is attributed to the slow nucleation rate, and the high diffusion phenomenon during high-temperature transformation results in large-size ferrite grains, few of which are too stable and hence, retained at room temperature [58].
As shown in Figure 15c, the precipitates formation is observed at a certain build height of 5 mm from the substrate. Its occurrence is observed at the grain boundaries and mainly in the ferrite region. As far as the morphology is concerned, elongated precipitates are formed. According to the EDS point analysis (Figure 15d), the elongated precipitates are iron-rich carbides. These findings are in agreement with the study made by Chakraborty at al. [59]. The occurrence of the precipitates at the mentioned height is ascribed to the temperature of 350–650 degree Celsius. However, in the present study, no thermal imaging camera is used to determine the temperature of different layers; therefore, the reason is made in light of a study conducted by Chakraborty et al. [59].

3.7. Mechanical Properties

3.7.1. Tensile Properties

The tensile properties for four different samples from the thick wall are shown in Figure 17. Figure 17a shows the stress–strain curve for all samples. It can be observed that the samples with the designation IB, IT, and OT have shown brittle behavior; on the other hand, the OB sample has revealed ductile behavior. The degree of ductility of the sample is quantified in terms of percentage elongation (Figure 17b). The results have discovered the 5% elongation in the OB specimen; on the contrary, almost 1% in the remaining specimens. Apart from this, the OB has greater ultimate tensile strength (UTS) and yield strength (YS) values of 803 ± 8 and 659 ± 10 MPa compared to others. However, it is pertinent to state that the highest value of UTS and YS achieved in the present study is comparable to its wrought counterparts [60]. Moreover, the UTS values corresponding to the IB, IT, and OT are 735 ± 11, 698 ± 4, and 613 ± 5 MPa, respectively, and the YS values are 631 ± 10, 589 ± 13, and 537 ± 9 MPa, respectively.
The greater anisotropy is observed in the tensile properties of all measured samples. However, despite the significant martensitic structure at the bottom portion of the thick wall, the OB sample shows a greater ductile behavior. This can be attributed to the fact that the deposition of the adjacent layers over the bottom deposited beads leads to martensitic tempering resulting in ductile behavior. Moreover, to prove the mentioned reason, the literature shows the temperature distribution of the WAAM fabricated structures [61,62]. This observation is also in accordance with a study by Zhu et al. [63]. Additionally, the microstructural analysis shown in the Figure 18a signifies the substantial existence of tempered martensite and delta ferrite in the necked region. Moreover, the occurrence of small globular copper precipitates is confirmed using point EDS analysis. According to the literature [64], the copper precipitates usually adds to the strength of the material. Moreover, the combination of high strength and ductility is obtained due to the presence of tempered martensite (exhibiting high strength) and delta ferrite (exhibit ductile nature) along with the precipitation of copper. However, it is important to note that IB sample exhibit poor ductility. This can be ascribed to the precipitation of carbides due to the slow cooling rate at the middle of the thick wall than at the outer portion.
In addition, the tensile properties have shown to degrade for both top samples (IT and OT). This deterioration can be explained by the presence of iron-rich carbides formed at the greater build heights in the delta ferrite (discussed in Section 3.6). Therefore, in top samples such carbides can be considered as the nucleation site for brittle fracture. In addition, the lath type martensite present in the microstructure has not undergone repetitive heating and cooling cycle, as experienced by martensite present at the bottom portion. Therefore, the hard untempered martensite at the top portion also accounts for the poor percentage elongation. Moreover, it is important to state that the phase percentage of the delta ferrite increases significantly with build height. In addition, many studies in the literature have demonstrated the brittle fracture of the delta ferrite [65,66]. However, in the current study, the hardness of the delta ferrite is significantly lower (Section 3.7.2); therefore, it has not contributed to the brittle behavior of top samples.
Moreover, the Young’s modulus (E) value of all samples is between 175 to 189 GPa, which is analogous to the wrought counterpart. Furthermore, the density of all four specimens is calculated using Archimedes’ principle by measuring the specimen’s weight in air and water and putting it into the formula below.
ρ sample = M a M a   M w   ρ a   ρ w +   ρ a
where ρ (sample) is the density of sample (g/cc), M(a) is the mass of sample in the air (g), M(w) is mass in water (g), ρ (a) is the density of air (g/cc) and ρ (w) is the density of water (g/cc).
The calculated density values using the aforementioned formula for IB, IT, OB, and OT are 7.71, 7.67, 7.705, and 7.707 g/cc. From density values, it is witnessed that there is no significant variation of density and consequently the insignificant porosity is observed among the bottom and top samples of both inner and outer cross-sections. In addition, it is essential to note that the density achieved in the present investigation is comparable to the wrought counterpart [67]. Many past studies have developed the inverse relationship between the sample’s porosity and E [68]. Therefore, in the present investigation, no discernable alteration in E value is observed owing to the insignificant variation in the porosity values.
The fractography pictures in Figure 19 demonstrate the type of fracture that transpired during the tensile testing. Figure 19a,b,d shows the presence of cleavage facets, which proves the occurrence of brittle fracture. In addition, the appearance of white bands in the low magnification scan signifies the presence of dimple creation, which is validated by utilizing high magnification images. Moreover, the amount of cleavage facets in contrast to the dimples formation is significantly high, representing the former as the dominant fracture mechanism in the IB, IT, and OT specimens. Furthermore, it is paramount to note that cleavage facet formations occur in the plane perpendicular to the direction of load during tensile testing [69]. According to the literature [70], in the brittle fracture, the crack nucleates first from the brittle carbides present within the grain boundaries. The presence of Ni in the microstructure promotes the crack resistance of the material. However, as per the EDS point analysis, the carbides formed in the delta ferrite lack in Ni content (Ni in carbide and delta ferrite are 0.06% and 0.22%, respectively) and consequently, result as the crack initiation site for brittle fracture. Moreover, the OB sample shows a completely diverse fracture image compared with the other samples. It represents the dimple fracture as a dominant mechanism resulting from ductile behavior. This occurrence of the dimple formation can be attributed to the nucleation of micro-voids, then its elongation and coalescence with the adjacent voids and eventually crack formation and rupture. However, the small intergranular fracture region is also observed in OB. The presence of impurity promotes such a fracturing mechanism [71]. Therefore, the EDS analysis is conducted, and the impurity corresponds to the SiC particles. In addition, the SiC existence is confirmed with XPS analysis.

3.7.2. Micro-Hardness

The micro-hardness value of the thick wall in two directions, mentioned in Figure 20, is evaluated with respect to the distance. The maximum hardness of 452 HV is obtained at a distance of 1 mm from the substrate, as shown in Figure 20a. Moreover, the hardness values gradually decrease as the build height increases. This can be attributed to the presence of the delta ferrite phase resulting in the low hardness value [72]. The presence of low hardness by delta ferrite also proves its ductile behavior during fracture. Moreover, the anisotropy of the samples can be judged from the standard deviation (SD) values shown in Figure 20a. It is observed that with an increase in the build height, the SD increases remarkably. This high SD in the samples is further analyzed using the OM. The analysis shows this variation in values is due to the presence of both martensite and delta phase at a particular height. The indent at the martensite phase resulted in the high hardness value; on the other hand, the indent on delta ferrite corresponds to the low value, resulting in larger SD values. Moreover, in Figure 20b, the highest average hardness value observed is 372 HV. It is paramount to state that the hardness values are obtained from the right end but at a height of 12 mm from the substrate. Therefore, the distinction between the hardness value at 1 mm length in both Figure 20a,b is owing to the lower cooling rate in the latter resulting in comparatively less hardness values. Moreover, the akin SD trend is observed in Figure 20b, proving the anisotropic behavior in the transverse direction.

3.7.3. Wear Properties

The real-time frictional force measurements are obtained, and the coefficient of friction (µ) is determined using the following formulae.
μ = F / N
where F is a force of friction and N is the normal load. The sample’s coefficient of friction (COF) profile is displayed in Figure 21a. The mean value of COF is found to be 0.575. Moreover, the wear rate is used to investigate the sample’s wear resistance. It is calculated using the formula
WR = w 1 w 2 / ρ dF
where WR is wear rate, w1 is the mass of the sample before the wear test (kg), w2 is the mass of the sample after the wear test (kg), ρ is the density of sample (kg/m3), d is the sliding distance (m), and F is normal load (N). The calculated value of wear rate and total wear volume is 1.3 × 10⁻¹¹ m3/N.m and 2.205 × 10⁻⁸ m3, respectively.
Even though the COF curves are primarily constant, certain fluctuations are noticed during the testing. SEM is utilized to examine the deteriorated surface of the sample to assess this COF variation during wear processes. Figure 21b depicts microscopic perspectives of the sample, whereas Figure 21c,d displays the magnified morphology. The existence of an adhesive layer and the production of oxides demonstrate the adhesive wear process in the samples. The presence of oxide layers in the sample is confirmed using an EDS color mapping analysis conducted on the wear track shown in Figure 22. The inclusion of oxide on the pinnacle of the metallic layer works as a protective shield [73]. The oxide layer fractures when the temperature increases due to friction, generating an abrupt shift in the COF curve [74]. Apart from the adhesive, abrasive wear is also present in the worn morphology. The presence of abrasive wear at certain positions is attributed to the lack of asperities at those locations [75]. Moreover, the presence of hard particle impurities such as SiC (confirmed using XPS and EDS) aids in the process of abrasive wear. It is well known that the wear rate of the material is inversely proportional to the hardness of the material. In the current examination, martensite and delta ferrite are the two types of phases that are most prominent in the microstructure. Additionally, martensite has a higher hardness than delta ferrite; therefore, the former’s higher hardness can be presumed to give superior wear resistance. Pertaining to the kind of wear mechanism, the portion with martensitic structure is subjected to abrasive wear, while the zone with delta ferrite is susceptible to adhesive wear [33].

4. Conclusions

In the present research work, the successful bulk fabrication of SS410 material has been achieved without any defects. The study’s primary findings are outlined as follows:
  • The WFS and TS, which are two of the vital processing factors of the CMT-based WAAM process, have a significant impact on the size and form of individual weld beads. The TS is known to have dramatically changed the characteristics of beads. Additionally, there are no obvious effects of the GFR on BH and BW.
  • The adequacy of the mathematical model developed was determined using Anova and the experimental approach. The results prove the model’s accuracy for both BH and BW, with a maximum error of 3.7% and 1.8% for BW and BH, respectively.
  • The optimized parameters obtained were 5.5 m/min (WFS), 63 cm/min (TS), and 13 L/min (GFR), which resulted in the successful fabrication of thick walls without any defects such as solidification cracking (common in SS410) and lack of fusion.
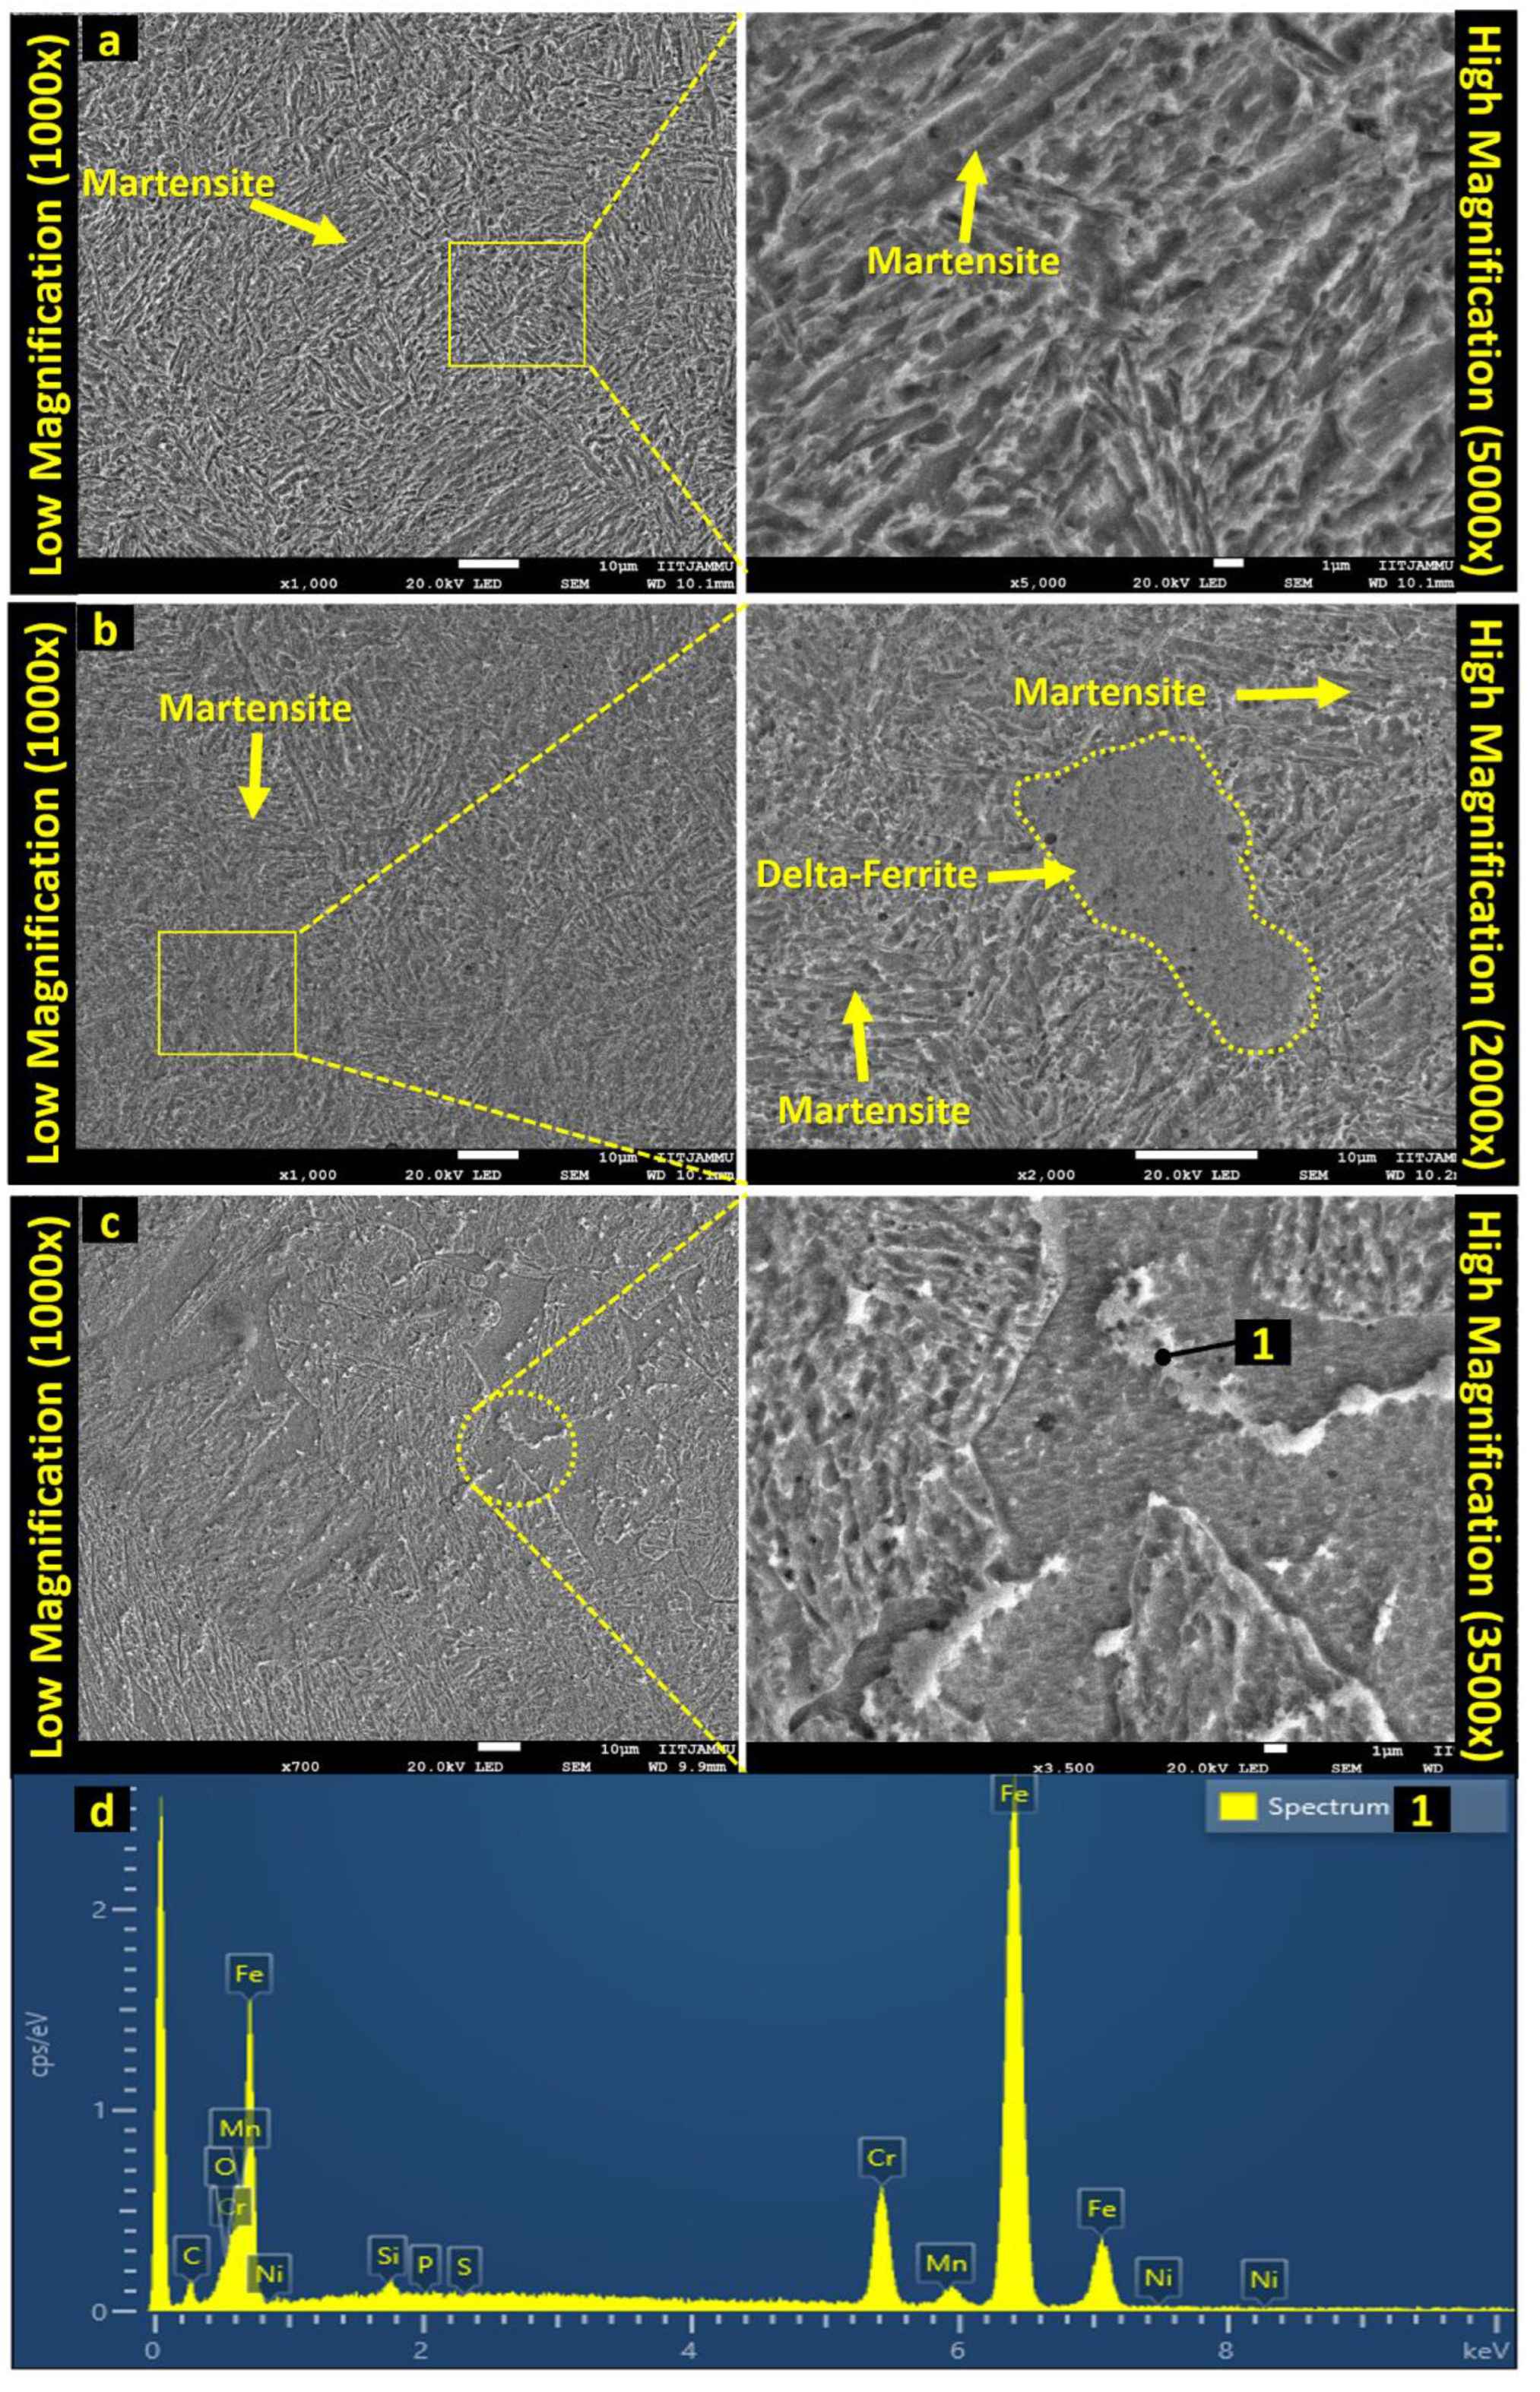
  • SS410 thick walls produced by WAAM typically have a two-phase microstructure: martensite and delta ferrite. The percentage of delta ferrite increased with the build height from 20 to 58%. Moreover, the overlapping zone between two adjacent layers at lower heights resulted in greater delta ferrite content due to secondary re-melting.
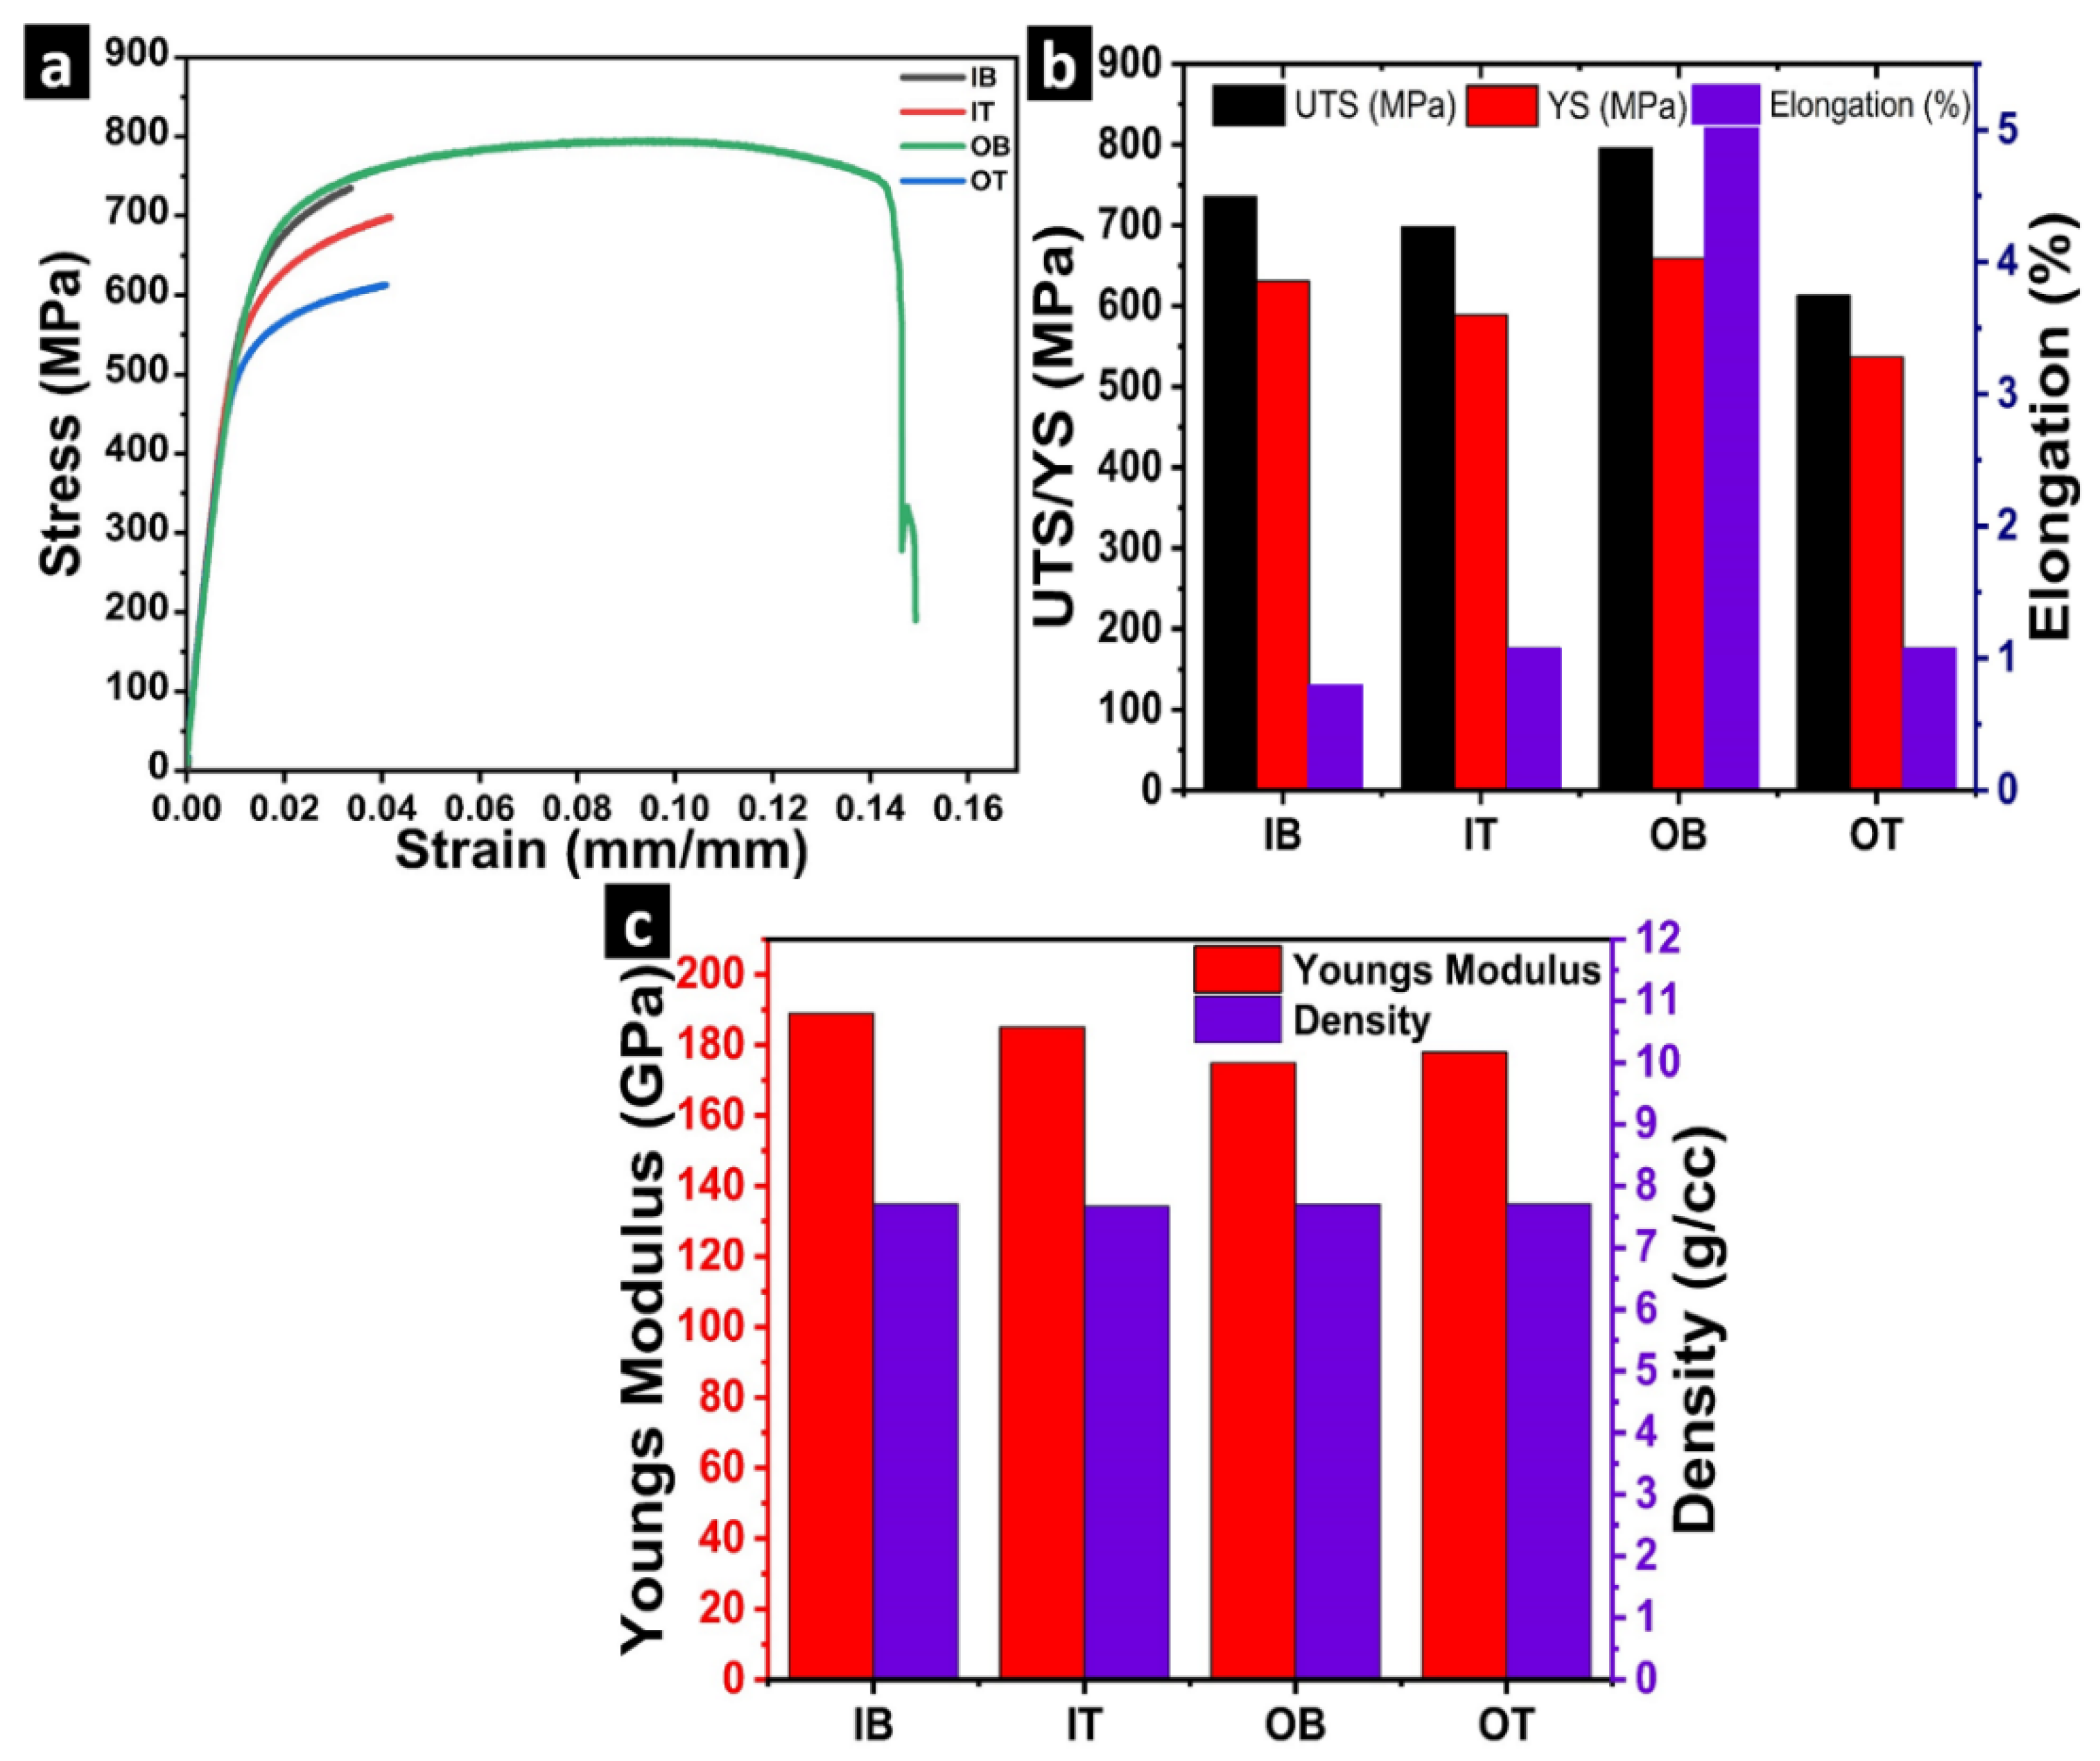
  • The tensile properties were determined to be at a maximum for the OB sample (UTS (803 ± 8 MPa), YS (659 ± 10 MPa), and percentage elongation (5%)). The UTS and YS achieved are comparable to the wrought counterpart; however, the percentage elongation is significantly lower.
  • The average hardness reduced with the build height. This is attributed to the increase in the delta ferrite content with build height. The maximum hardness of 452 ± 8 HV was achieved at the bottom of the thick wall. Moreover, the computed SD values increased drastically, with height representing the anisotropy in the samples.
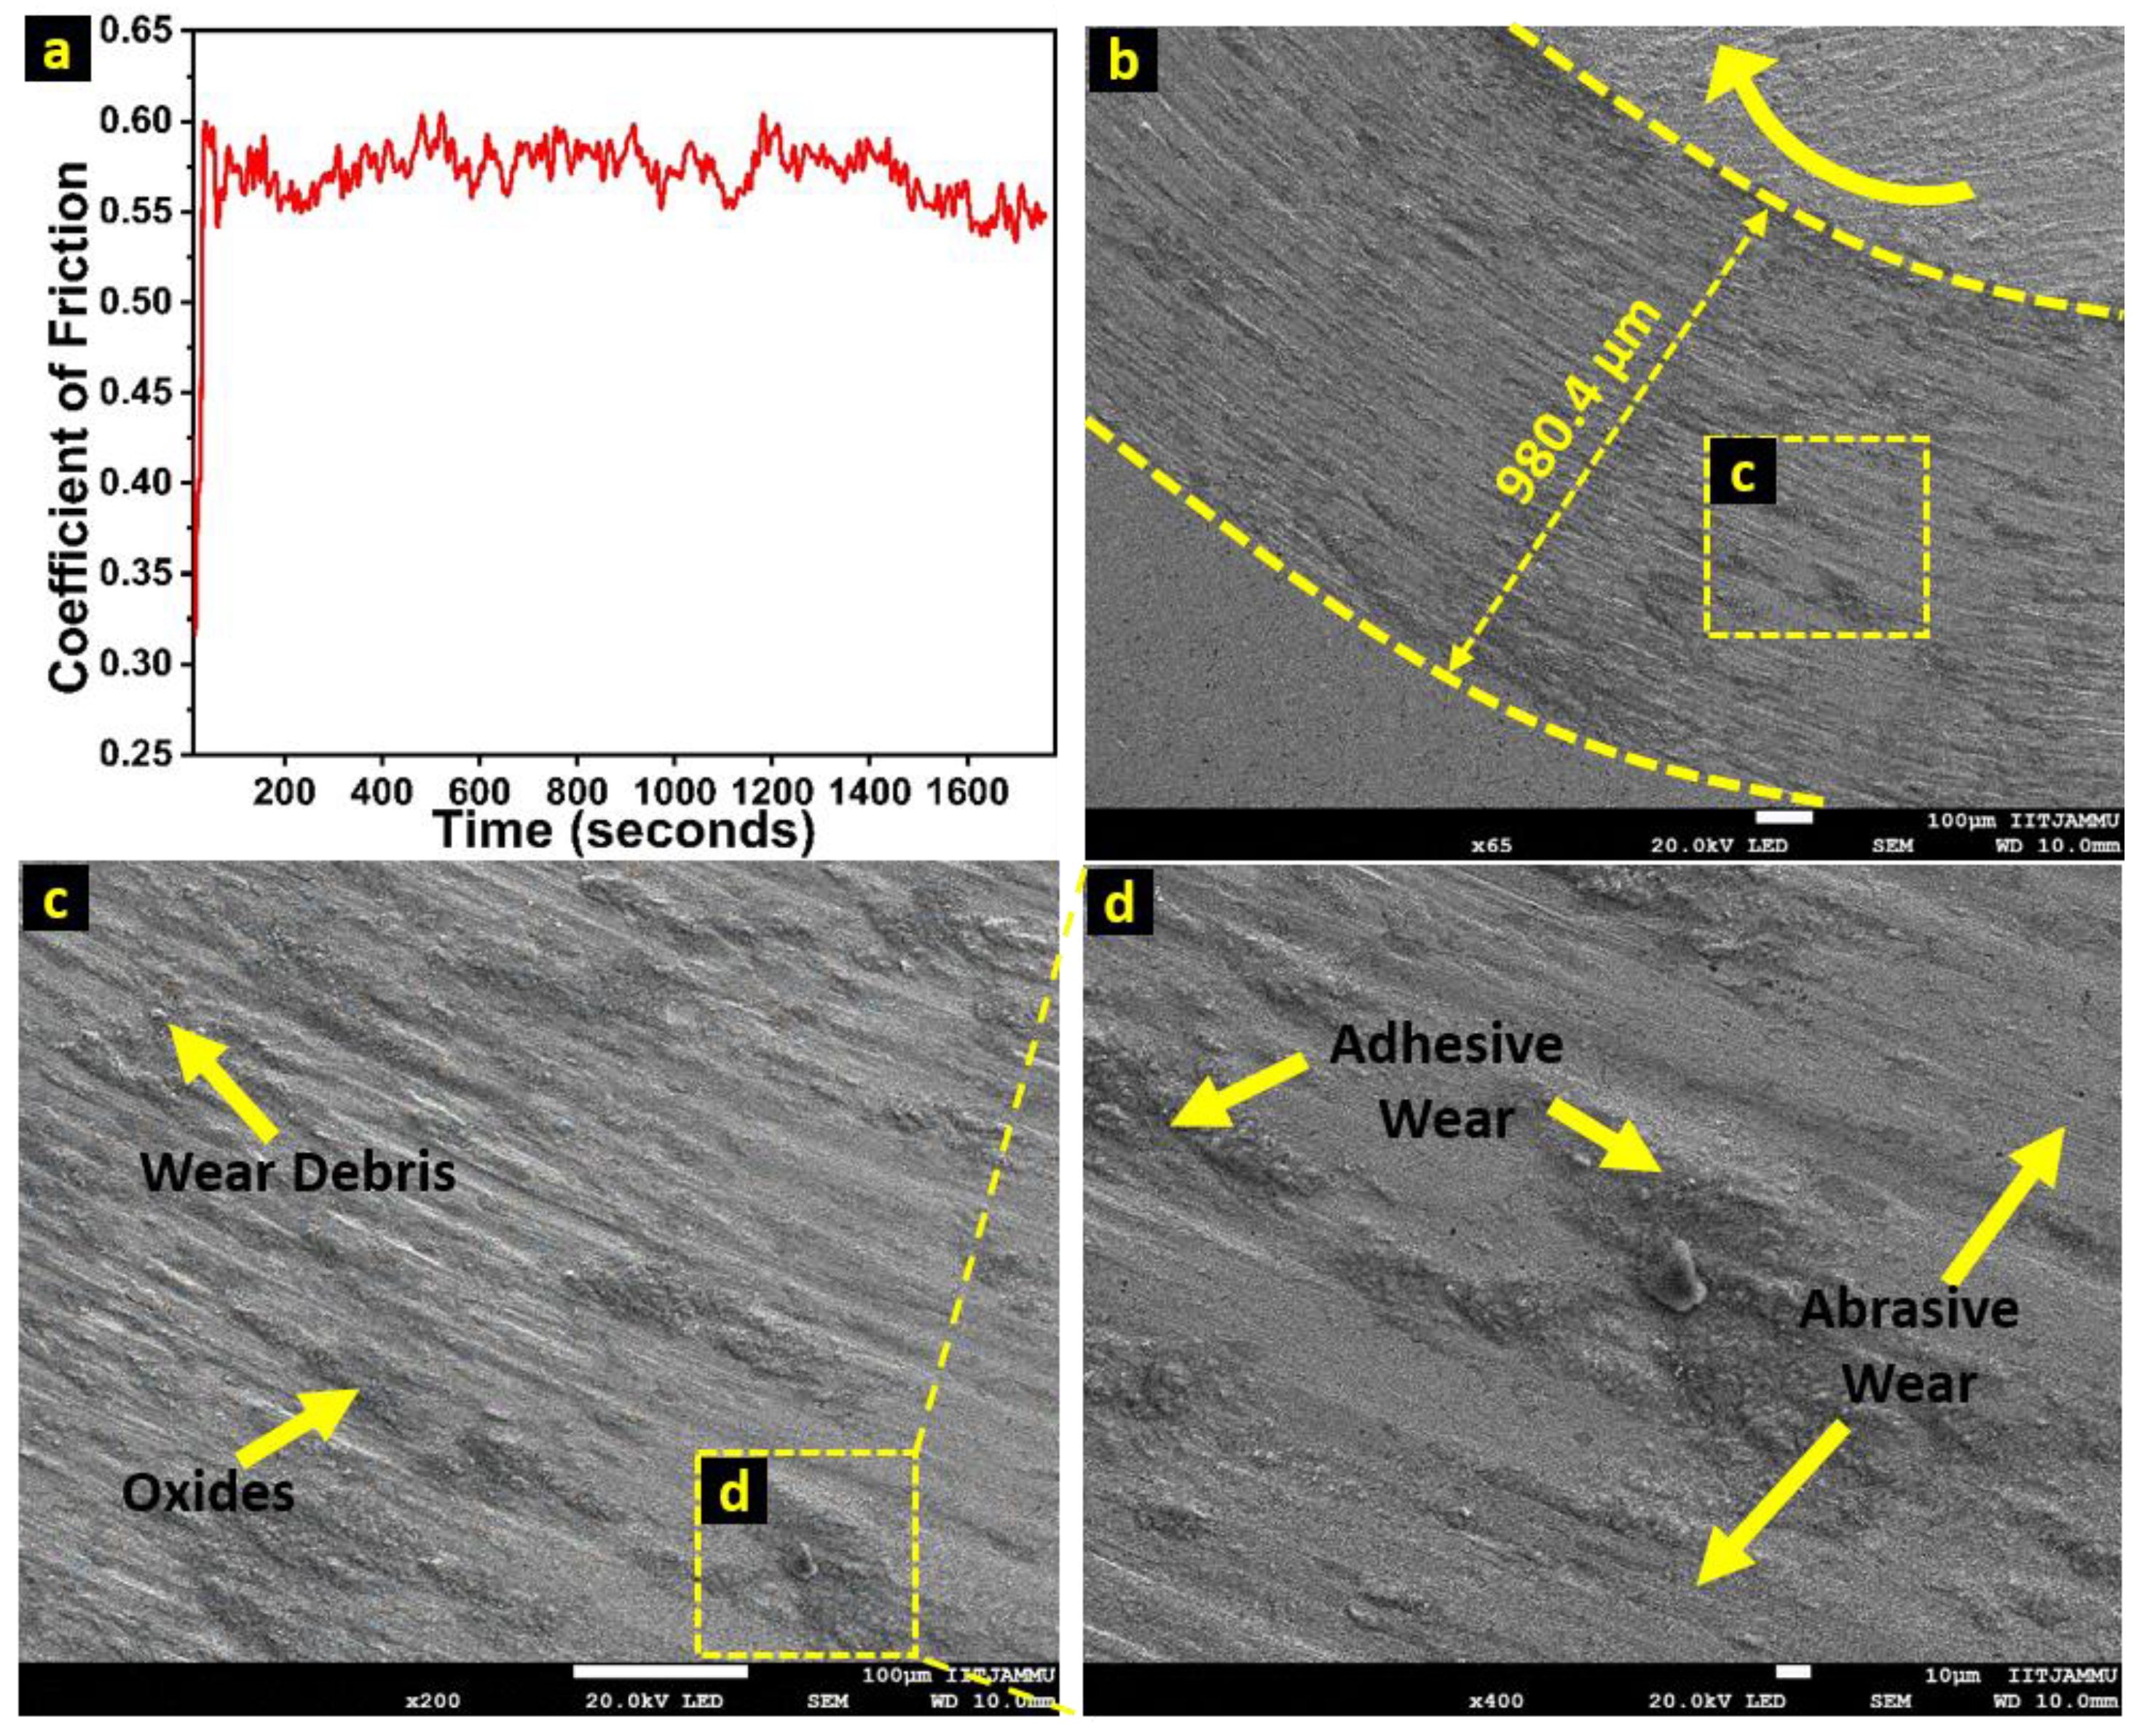
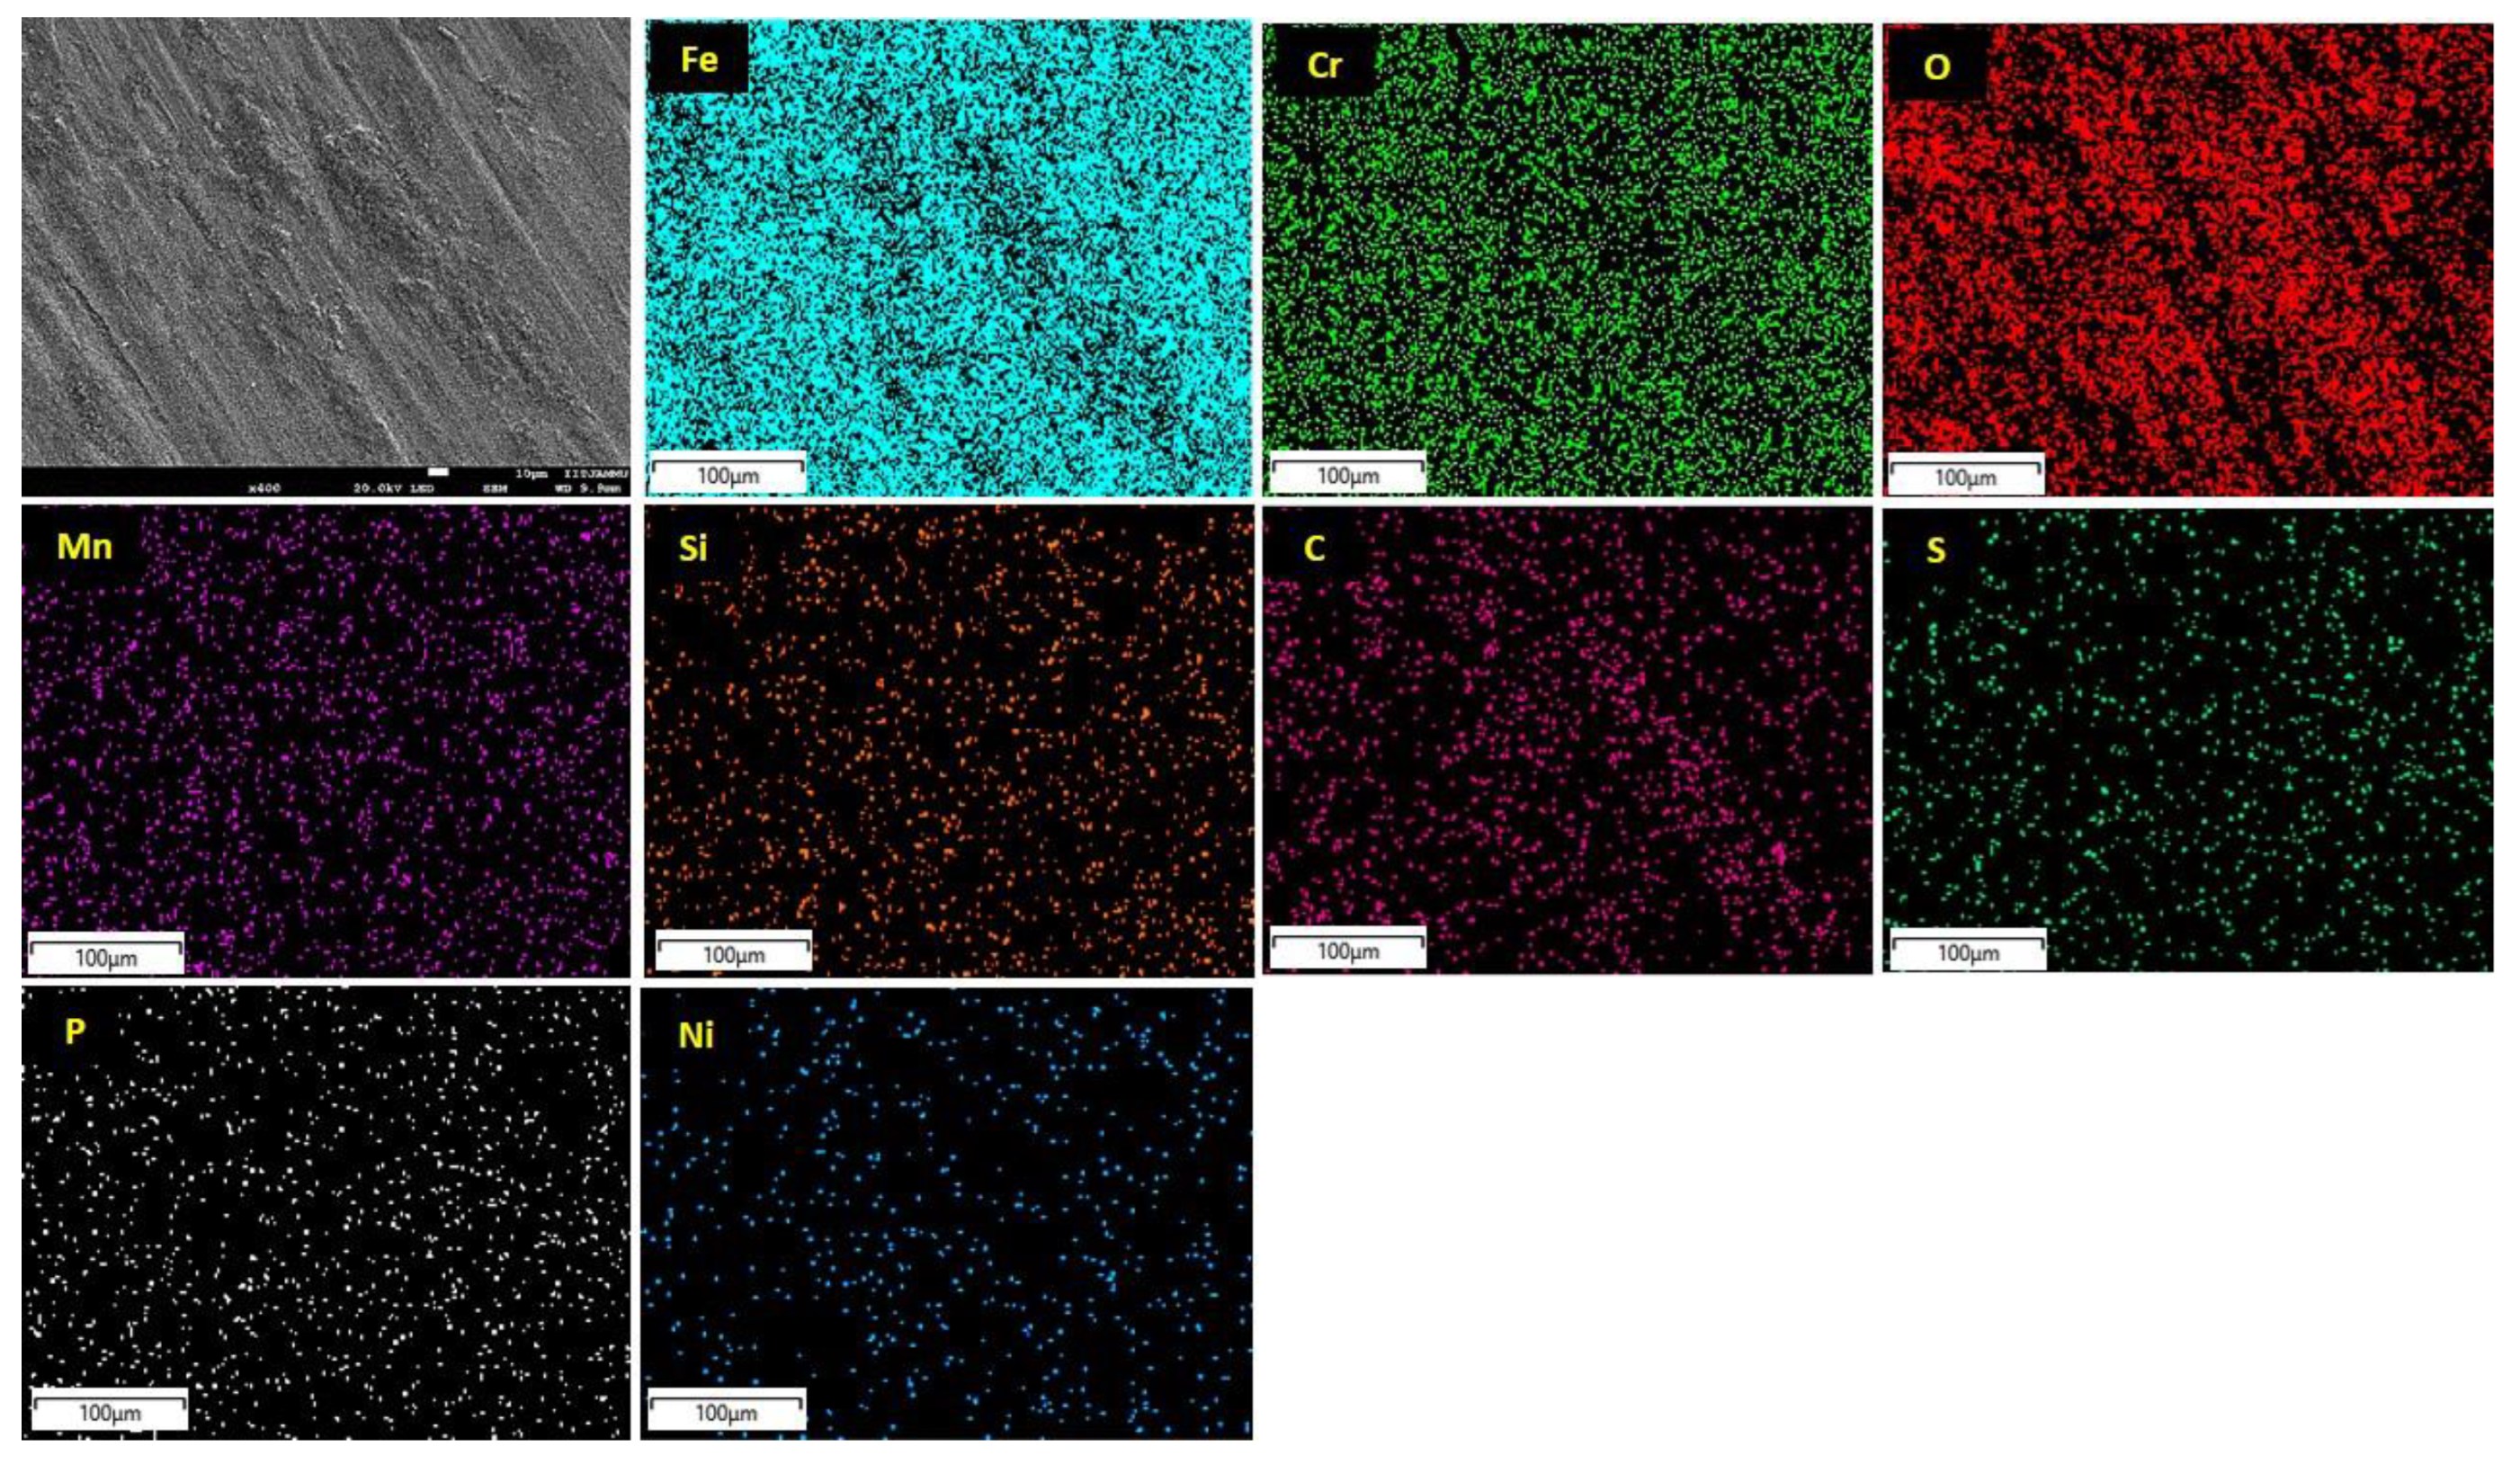
  • The wear rate and volume were computed as 1.3 × 10⁻¹¹ m3/N.m and 2.205 × 10⁻⁸ m3, respectively. Two types of wear mechanisms were involved in the wear track: abrasive and adhesive, and the occurrence of abrasive and adhesive mechanisms were attributed to the region of martensite and delta ferrite, respectively.

Author Contributions

Conceptualization, A.S. and S.S.; methodology, A.S. and S.S.; software, A.S. and S.S.; validation, A.S., S.S. and T.N.; investigation A.S., S.S. and T.N.; resources, S.S., T.N. and S.G.D.; data curation, A.S. and S.S.; writing—original draft preparation, A.S.; writing—review and editing, S.S. and T.N.; visualization, S.S., T.N. and S.G.D.; supervision, S.S., T.N. and S.G.D.; project administration, S.S., T.N. and S.G.D.; funding acquisition, S.S., T.N. and S.G.D. All authors have read and agreed to the published version of the manuscript.

Funding

This research work is financially supported by the Defense Research Development Organization (DRDO) under project no. ERIP/ER/202102001/M/01/1784.

Data Availability Statement

Not applicable.

Acknowledgments

The authors would like to express their gratitude to DRDO for funding this project. The authors extend their gratitude to central instrumentation facility (CIF) at the Indian Institute of Technology Jammu (IIT Jammu) for providing essential characterization facility.

Conflicts of Interest

The authors declare no conflict of interest.

References

  1. Singh, A.; Singh, H. Metal Additive Manufacturing: From History to Applications; Khan, M.A., Jappes, J.T.W., Eds.; Springer International Publishing: Cham, Switzerland, 2022; pp. 3–32. [Google Scholar]
  2. Singh, A.; Singh, P.; Pabla, B.S.; Singh, H.; Shiva, S. Parametric analysis to explore the viability of cold spray additive manufacturing to print SS316L parts for biomedical application. J. Braz. Soc. Mech. Sci. Eng. 2022, 44, 339. [Google Scholar] [CrossRef]
  3. Gibson, I.; Rosen, D.W.; Stucker, B. Powder bed fusion processes. In Additive Manufacturing Technologies: Rapid Prototyping to Direct Digital Manufacturing; Springer: Boston, MA, USA, 2010; pp. 120–159. [Google Scholar]
  4. Shi, Y.; Yan, C.; Zhou, Y.; Wu, J.; Wang, Y.; Yu, S.; Chen, Y. Metal materials for additive manufacturing. In Materials for Additive Manufacturing; Academic Press: Cambridge, MA, USA, 2021; pp. 403–595. [Google Scholar]
  5. Jafari, D.; Vaneker, T.H.J.; Gibson, I. Wire and arc additive manufacturing: Opportunities and challenges to control the quality and accuracy of manufactured parts. Mater. Des. 2021, 202, 109471. [Google Scholar] [CrossRef]
  6. Gornyakov, V.; Sun, Y.; Ding, J.; Williams, S. Modelling and optimising hybrid process of wire arc additive manufacturing and high-pressure rolling. Mater. Des. 2022, 223, 111121. [Google Scholar] [CrossRef]
  7. Cai, H.; Xu, L.; Zhao, L.; Han, Y.; Pang, H.; Chen, W. Cold metal transfer plus pulse (CMT+P) welding of G115 steel: Mechanisms, microstructure, and mechanical properties. Mater. Sci. Eng. A 2022, 843, 143156. [Google Scholar] [CrossRef]
  8. Koli, Y.; Arora, S.; Ahmad, S.; Priya; Yuvaraj, N.; Khan, Z.A. Investigations and Multi-response Optimization of Wire Arc Additive Manufacturing Cold Metal Transfer Process Parameters for Fabrication of SS308L Samples. J. Mater. Eng. Perform. 2022. [Google Scholar] [CrossRef]
  9. Manurung, Y.H.P.; Prajadhiana, K.P.; Adenan, M.S.; Awiszus, B.; Graf, M.; Haelsig, A. Analysis of material property models on WAAM distortion using nonlinear numerical computation and experimental verification with P-GMAW. Arch. Civ. Mech. Eng. 2021, 21, 32. [Google Scholar] [CrossRef]
  10. Zavdoveev, A.; Poznyakov, V.; Baudin, T.; Heaton, M.; Kim, H.S.; Acquier, P.; Skory, M.; Rogante, M.; Denisenko, A. Welding Thermal Cycle Impact on the Microstructure and Mechanical Properties of Thermo–Mechanical Control Process Steels. Steel Res. Int. 2021, 92, 2000645. [Google Scholar] [CrossRef]
  11. Oliveira, J.P.; Curado, T.M.; Zeng, Z.; Lopes, J.G.; Rossinyol, E.; Park, J.M.; Schell, N.; Fernandes, F.M.B.; Kim, H.S. Gas tungsten arc welding of as-rolled CrMnFeCoNi high entropy alloy. Mater. Des. 2020, 189, 108505. [Google Scholar] [CrossRef]
  12. Oliveira, J.; Crispim, B.; Zeng, Z.; Omori, T.; Fernandes, F.B.; Miranda, R. Microstructure and mechanical properties of gas tungsten arc welded Cu-Al-Mn shape memory alloy rods. J. Mater. Process. Technol. 2019, 271, 93–100. [Google Scholar] [CrossRef]
  13. Rosli, N.A.; Alkahari, M.R.; Ramli, F.R.; bin Abdollah, M.F.; Kudus, S.I.A.; Herawan, S.G. Parametric Optimisation of Micro Plasma Welding for Wire Arc Additive Manufacturing by Response Surface Methodology. Manuf. Technol. 2022, 22, 59–70. [Google Scholar] [CrossRef]
  14. Huang, L.; Chen, X.; Konovalov, S.; Wang, M.; Su, C.; Han, L.; Wang, Y. Modeling and Optimization of Solidification Cracking of 4043 Aluminum Alloys Produced by Cold Metal Transfer Welding. J. Mater. Eng. Perform. 2022, 31, 4746–4760. [Google Scholar] [CrossRef]
  15. Vora, J.; Parikh, N.; Chaudhari, R.; Patel, V.K.; Paramar, H.; Pimenov, D.Y.; Giasin, K. Optimization of Bead Morphology for GMAW-Based Wire-Arc Additive Manufacturing of 2.25 Cr-1.0 Mo Steel Using Metal-Cored Wires. Appl. Sci. 2022, 12, 5060. [Google Scholar] [CrossRef]
  16. Dhas, J.E.R.; Dhas, S.J.H. A Review on Optimization of Welding Process. Procedia Eng. 2012, 38, 544–554. [Google Scholar] [CrossRef] [Green Version]
  17. Ahire, P.; Patil, U.; Kadam, M. Genetic Algorithm Based Optimization of the Process Parameters for Manual Metal Arc Welding of Dissimilar Metal Joint. Procedia Manuf. 2018, 20, 106–112. [Google Scholar] [CrossRef]
  18. Ahmad, M.A.; Sheikh, A.K.; Nazir, K. Design of experiment based statistical approaches to optimize submerged arc welding process parameters. ISA Trans. 2019, 94, 307–315. [Google Scholar] [CrossRef]
  19. Qin, J.; Wang, Y.; Ding, J.; Williams, S. Optimal droplet transfer mode maintenance for wire + arc additive manufacturing (WAAM) based on deep learning. J. Intell. Manuf. 2022, 33, 2179–2191. [Google Scholar] [CrossRef]
  20. Ayan, Y.; Kahraman, N. Bending fatigue properties of structural steel fabricated through wire arc additive manufacturing (WAAM). Eng. Sci. Technol. Int. J. 2022, 35, 101247. [Google Scholar] [CrossRef]
  21. Sales, A.; Kotousov, A.; Perilli, E.; Yin, L. Improvement of the Fatigue Resistance of Super Duplex Stainless-Steel (SDSS) Components Fabricated by Wire Arc Additive Manufacturing (WAAM). Metals 2022, 12, 1548. [Google Scholar] [CrossRef]
  22. Haden, C.; Zeng, G.; Carter, F.; Ruhl, C.; Krick, B.; Harlow, D. Wire and arc additive manufactured steel: Tensile and wear properties. Addit. Manuf. 2017, 16, 115–123. [Google Scholar] [CrossRef]
  23. Rafieazad, M.; Ghaffari, M.; Nemani, A.V.; Nasiri, A. Microstructural evolution and mechanical properties of a low-carbon low-alloy steel produced by wire arc additive manufacturing. Int. J. Adv. Manuf. Technol. 2019, 105, 2121–2134. [Google Scholar] [CrossRef]
  24. Le, V.T. A preliminary study on gas metal arc welding-based additive manufacturing of metal parts. Sci. Technol. Dev. J. 2020, 23, 422–429. [Google Scholar] [CrossRef] [Green Version]
  25. Chen, X.; Li, J.; Cheng, X.; He, B.; Wang, H.; Huang, Z. Microstructure and mechanical properties of the austenitic stainless steel 316L fabricated by gas metal arc additive manufacturing. Mater. Sci. Eng. A 2017, 703, 567–577. [Google Scholar] [CrossRef]
  26. Wang, L.; Xue, J.; Wang, Q. Correlation between arc mode, microstructure, and mechanical properties during wire arc additive manufacturing of 316L stainless steel. Mater. Sci. Eng. A 2019, 751, 183–190. [Google Scholar] [CrossRef]
  27. Gao, C.; Chen, X.; Su, C.; Chen, X. Location dependence of microstructure and mechanical properties on wire arc additively manufactured nuclear grade steel. Vacuum 2019, 168, 108818. [Google Scholar] [CrossRef]
  28. Vivekananthan, M.; Saravanakumar, M.; Ross, K.N.S.; Kumar, K.S.S.; Raj, F.S. Experimental investigation of Mechanical properties in friction welding parameters for dis-similar metals (SS-304 & SS-410). Mater. Today Proc. 2021, 37, 3683–3688. [Google Scholar] [CrossRef]
  29. Belotti, L.P.; van Dommelen, J.; Geers, M.; Goulas, C.; Ya, W.; Hoefnagels, J. Microstructural characterisation of thick-walled wire arc additively manufactured stainless steel. J. Mater. Process. Technol. 2022, 299, 117373. [Google Scholar] [CrossRef]
  30. Lee, J.-H.; Yamashita, S.; Ogura, T.; Saida, K. Effects of cooling rate on solidification cracking behaviour in 310S stainless steel. J. Adv. Join. Process. 2021, 3, 100044. [Google Scholar] [CrossRef]
  31. Ferreira, S.L.C.; Bruns, R.E.; Ferreira, H.S.; Matos, G.D.; David, J.M.; Brandão, G.C.; da Silva, E.G.P.; Portugal, L.A.; dos Reis, P.S.; Souza, A.S.; et al. Box-Behnken design: An alternative for the optimization of analytical methods. Anal. Chim. Acta 2007, 597, 179–186. [Google Scholar] [CrossRef]
  32. Miguel Araújo Bruno, J.; Manuel Alves da Silva, C.; Manuel dos Santos Oliveira Baptista, R. WAAM Processing of AISI 410 Stainless Steel for Part Building Mechanical Engineering Examination Committee; Tecnico Lisboa: lisbon, Portugal, 2019. [Google Scholar]
  33. Kumar, H.; Bhaduri, G.A.; Manikandan, S.G.K.; Kamaraj, M.; Shiva, S. Influence of Annealing on Microstructure and Tribological Properties of AlCoCrFeNiTi High Entropy Alloy Based Coating. Met. Mater. Int. 2022. [Google Scholar] [CrossRef]
  34. Fuse, K.; Chaudhari, R.; Vora, J.; Patel, V.K.; de Lacalle, L.N.L. Multi-Response Optimization of Abrasive Waterjet Machining of Ti6Al4V Using Integrated Approach of Utilized Heat Transfer Search Algorithm and RSM. Materials 2021, 14, 7746. [Google Scholar] [CrossRef]
  35. de Oliveira, L.G.; de Paiva, A.P.; Balestrassi, P.P.; Ferreira, J.R.; da Costa, S.C.; Campos, P.H.D.S. Response surface methodology for advanced manufacturing technology optimization: Theoretical fundamentals, practical guidelines, and survey literature review. Int. J. Adv. Manuf. Technol. 2019, 104, 1785–1837. [Google Scholar] [CrossRef]
  36. Mayr, P.; Palmer, T.; Elmer, J.; Specht, E.; Allen, S. Formation of Delta Ferrite in 9 Wt Pct Cr Steel Investigated by In-Situ X-Ray Diffraction Using Synchrotron Radiation. Met. Mater. Trans. A 2010, 41, 2462–2465. [Google Scholar] [CrossRef] [Green Version]
  37. Wegrzyn, T. Delta ferrite in stainless steel weld metals. Weld. Int. 1992, 6, 690–694. [Google Scholar] [CrossRef]
  38. Asami, K.; Hashimoto, K. An X-ray photo-electron spectroscopic study of surface treatments of stainless steels. Corros. Sci. 1979, 19, 1007–1017. [Google Scholar] [CrossRef]
  39. Vinokurov, E.; Bondar', V.V. Prediction of Stability Constants for Cr(III) and Cr(II) Complexes. Russ. J. Coord. Chem. 2003, 29, 66–72. [Google Scholar] [CrossRef]
  40. Upadhyay, N.; Pujar, M.G.; Das, C.R.; Krishna, N.G.; Mallika, C.; Mudali, U.K. Pitting Corrosion Behaviour of Boron Added Modified 9Cr–1Mo Steel: Combined Effects of Alkali and Chloride Ions. Trans. Indian Inst. Met. 2015, 68, 129–141. [Google Scholar] [CrossRef]
  41. Monazam, E.R.; Breault, R.; Siriwardane, R. Reduction of hematite (Fe2O3) to wüstite (FeO) by carbon monoxide (CO) for chemical looping combustion. Chem. Eng. J. 2014, 242, 204–210. [Google Scholar] [CrossRef]
  42. Bruce, D.; Hancock, P. Note on the Temperature Stability of Wüstite in Surface Oxide Films on iron. Br. Corros. J. 1969, 4, 221–222. [Google Scholar] [CrossRef]
  43. Thermo Fisher Manganese. Available online: https://www.thermofisher.com/in/en/home/materials-science/learning-center/periodic-table/transition-metal/manganese.html (accessed on 25 September 2022).
  44. Gu, X.; Yue, J.; Li, L.; Xue, H.; Yang, J.; Zhao, X. General Synthesis of MnOx (MnO2, Mn2O3, Mn3O4, MnO) Hierarchical Microspheres as Lithium-ion Battery Anodes. Electrochim. Acta 2015, 184, 250–256. [Google Scholar] [CrossRef]
  45. Kuznetsov, M.; Zhuravlev, J.; Gubanov, V. XPS analysis of adsorption of oxygen molecules on the surface of Ti and TiNx films in vacuum. J. Electron Spectrosc. Relat. Phenom. 1992, 58, 169–176. [Google Scholar] [CrossRef]
  46. Wu, X.; Gong, K.; Zhao, G.; Lou, W.; Wang, X.; Liu, W. Mechanical synthesis of chemically bonded phosphorus–graphene hybrid as high-temperature lubricating oil additive. RSC Adv. 2018, 8, 4595–4603. [Google Scholar] [CrossRef] [PubMed] [Green Version]
  47. Meškinis, S.; Vasiliauskas, A.; Andrulevičius, M.; Peckus, D.; Tamulevičius, S.; Viskontas, K. Diamond Like Carbon Films Containing Si: Structure and Nonlinear Optical Properties. Materials 2020, 13, 1003. [Google Scholar] [CrossRef] [PubMed] [Green Version]
  48. López, M.F.; Gutiéerrez, A.; García-Alonso, M.C.; Escudero, M.L. Surface analysis of a heat-treated, Al-containing, iron-based superalloy. J. Mater. Res. 1998, 13, 3411–3416. [Google Scholar] [CrossRef]
  49. Zhu, B.; Lin, J.; Lei, Y.; Zhang, Y.; Sun, Q.; Cheng, S. Additively manufactured δ-ferrite-free 410 stainless steel with desirable performance. Mater. Lett. 2021, 293, 129579. [Google Scholar] [CrossRef]
  50. Mabruri, E.; Syahlan, Z.A.; Prifiharni, S.; Anwar, S.; Chandra, S.A.; Romijarso, T.B.; Adjiantoro, B. Influence of Austenitizing Heat Treatment on the Properties of the Tempered Type 410-1Mo Stainless Steel. IOP Conf. Series Mater. Sci. Eng. 2017, 202, 12085. [Google Scholar] [CrossRef] [Green Version]
  51. Mirzaee, M.; Momeni, A.; Aieni, N.; Keshmiri, H. Effect of quenching and tempering on microstructure and mechanical properties of 410 and 410 Ni martensitic stainless steels. J. Mater. Res. 2017, 32, 687–696. [Google Scholar] [CrossRef]
  52. Alvarado-Meza, M.A.; García-Sánchez, E.; Covarrubias-Alvarado, O.; Salinas-Rodríguez, A.; Guerrero-Mata, M.P.; Colás, R. Effect of the High-Temperature Deformation on the M s Temperature in a Low C Martensitic Stainless Steel. J. Mater. Eng. Perform. 2013, 22, 345–350. [Google Scholar] [CrossRef]
  53. Liu, C.; Huang, M.; Ren, Q.; Ren, Y.; Zhang, L. Effect of Grain Size and Cooling Rate on the Martensite Start Temperature of Stainless Steel. Steel Res. Int. 2022, 93, 2200044. [Google Scholar] [CrossRef]
  54. Souza, S.D.S.D.; Moreira, P.S.; de Faria, G.L. Austenitizing Temperature and Cooling Rate Effects on the Martensitic Transformation in a Microalloyed-Steel. Mater. Res. 2020, 23, 1–9. [Google Scholar] [CrossRef] [Green Version]
  55. Arivazhagan, B.; Srinivasan, G.; Albert, S.; Bhaduri, A. A study on influence of heat input variation on microstructure of reduced activation ferritic martensitic steel weld metal produced by GTAW process. Fusion Eng. Des. 2011, 86, 192–197. [Google Scholar] [CrossRef]
  56. Stone, D.J. Optimal Composition Window of Type 410 Welding Consumables and Base Metals for Hydro-processing Applications. Master’s Thesis, Ohio State University, Columbus, OH, USA, 2017. [Google Scholar]
  57. Saber, M.; Koch, C.C.; Scattergood, R.O. Thermodynamic Grain Size Stabilization Models: An Overview. Mater. Res. Lett. 2015, 3, 65–75. [Google Scholar] [CrossRef]
  58. Genck, W.J. Temperature Effects on Growth and Nucleation Rates in Mixed Suspension Crystallization; Iowa State University: Ames, IA, USA, 1969. [Google Scholar]
  59. Chakraborty, G.; Das, C.R.; Albert, S.; Bhaduri, A.; Paul, V.T.; Panneerselvam, G.; Dasgupta, A. Study on tempering behaviour of AISI 410 stainless steel. Mater. Charact. 2015, 100, 81–87. [Google Scholar] [CrossRef]
  60. AISI 410 Stainless Steel Properties, SS410 Heat Treatment, Magnetic, ASTM A276 (UNS S41000). Available online: https://www.theworldmaterial.com/aisi-410-stainless-steel/ (accessed on 24 September 2022).
  61. Singh, S.; Jinoop, A.; Kumar, G.T.; Palani, I.; Paul, C.; Prashanth, K. Effect of Interlayer Delay on the Microstructure and Mechanical Properties of Wire Arc Additive Manufactured Wall Structures. Materials 2021, 14, 4187. [Google Scholar] [CrossRef] [PubMed]
  62. Yildiz, A.S.; Koc, B.; Yilmaz, O. Thermal behavior determination for wire arc additive manufacturing process. Procedia Manuf. 2021, 54, 233–237. [Google Scholar] [CrossRef]
  63. Zhu, H.; Li, Y.; Li, B.; Zhang, Z.; Qiu, C. Effects of Low-Temperature Tempering on Microstructure and Properties of the Laser-Cladded AISI 420 Martensitic Stainless Steel Coating. Coatings 2018, 8, 451. [Google Scholar] [CrossRef] [Green Version]
  64. Xi, T.; Shahzad, M.B.; Xu, D.; Sun, Z.; Zhao, J.; Yang, C.; Qi, M.; Yang, K. Effect of copper addition on mechanical properties, corrosion resistance and antibacterial property of 316L stainless steel. Mater. Sci. Eng. C 2017, 71, 1079–1085. [Google Scholar] [CrossRef]
  65. Li, J.; Cheng, L.; Zhang, P.; Wang, L.; Li, H. Effect of delta ferrites on the anisotropy of impact toughness in martensitic heat-resistant steel. J. Mater. Res. Technol. 2019, 8, 1781–1788. [Google Scholar] [CrossRef]
  66. Haggag, F.M.; Corwin, W.R.; Nanstad, R.K. Effect of Irradiation on the Fracture Properties of Stainless Steel UELD Overlay Cladding. Nucl. Eng. Des. 1990, 124, 129–141. [Google Scholar] [CrossRef]
  67. Onuike, B.; Bandyopadhyay, A. Functional bimetallic joints of Ti6Al4V to SS410. Addit. Manuf. 2020, 31, 100931. [Google Scholar] [CrossRef]
  68. Wang, J.C. Young's modulus of porous materials. J. Mater. Sci. 1984, 19, 801–808. [Google Scholar] [CrossRef]
  69. Pineau, A.; Benzerga, A.A.; Pardoen, T. Failure of metals I: Brittle and ductile fracture. Acta Mater. 2016, 107, 424–483. [Google Scholar] [CrossRef] [Green Version]
  70. Kim, H.; Liu, Z.; Cong, W.; Zhang, H.-C. Tensile Fracture Behavior and Failure Mechanism of Additively-Manufactured AISI 4140 Low Alloy Steel by Laser Engineered Net Shaping. Materials 2017, 10, 1283. [Google Scholar] [CrossRef] [PubMed] [Green Version]
  71. Weishaupt, E.R. Intergranular Fracture. In Failure Analysis and Prevention; ASM International: Almere, The Netherlands, 2021; pp. 356–365. [Google Scholar]
  72. Zala, A.B.; Jamnapara, N.I.; Badheka, V.J.; Sasmal, C.; Sam, S.; Ranjan, M. Delta (δ) Ferrite Formation in the Welds of Aluminized 9Cr-1Mo Steels. Met. Microstruct. Anal. 2019, 8, 256–262. [Google Scholar] [CrossRef]
  73. Kumar, H.; Bhaduri, G.A.; Manikandan, S.G.K.; Kamaraj, M.; Shiva, S. Microstructural Characterization and Tribological Properties of Atmospheric Plasma Sprayed High Entropy Alloy Coatings. J. Therm. Spray Technol. 2022, 31, 1956–1974. [Google Scholar] [CrossRef]
  74. Meghwal, A.; Anupam, A.; Luzin, V.; Schulz, C.; Hall, C.; Murty, B.; Kottada, R.S.; Berndt, C.C.; Ang, A.S.M. Multiscale mechanical performance and corrosion behaviour of plasma sprayed AlCoCrFeNi high-entropy alloy coatings. J. Alloys Compd. 2021, 854, 157140. [Google Scholar] [CrossRef]
  75. Zhou, K.; Xu, J.; Xiao, G.; Huang, Y. A novel low-damage and low-abrasive wear processing method of Cf/SiC ceramic matrix composites: Laser-induced ablation-assisted grinding. J. Mater. Process. Technol. 2022, 302, 117503. [Google Scholar] [CrossRef]
Figure 1. The step-by-step procedure followed in the current investigation to achieve the bulk fabrication of SS410 material using the WAAM process.
Machines 10 01136 g001
Figure 2. (a) The set-up of the WAAM process utilized to fabricate the thick walls out of SS410 material, the variation of (b) current and (c) voltage with respect to the WFS.
Machines 10 01136 g002
Figure 3. The defects include (a) humping and (b) high heat input, observed during the selection of the range of parameters for optimization using the RSM approach.
Machines 10 01136 g003
Figure 4. The formation of (a) 15 single beads and their (b) cross-section made according to runs given by Box–Behnken design using CMT-based WAAM process.
Machines 10 01136 g004
Figure 5. The (a) schematic representation of the process followed and (b) the opted scanning strategy for developing thick walls using the CMT—based WAAM process.
Machines 10 01136 g005
Figure 6. The bulk fabricated thick walls and their corresponding samples for mechanical and microstructural characterization made using the CMT—based WAAM process.
Machines 10 01136 g006
Figure 7. The Pareto effect chart, employed to analyze the significant effect of different process variables on the (a) BH and (b) BW developed using the RSM approach.
Machines 10 01136 g007
Figure 8. The different residual plots include (a,e) normal probability plot, (b,f) histogram plot, Ver− sus fit (c,g), and versus order (d,h) of both BH and BW developed using the RSM approach.
Machines 10 01136 g008
Figure 9. The main effect plots for (a) BW, (b) BH, and (c) volume flow rate with respect to the WFS, TS, and GFR made with the aid of Minitab software.
Machines 10 01136 g009
Figure 10. The (a,b) surface plots and (c,d) contour plots for BW and BH with respect to significant process variables.
Machines 10 01136 g010
Figure 11. The schematic representation of the welding bead with the extent of conduction.
Machines 10 01136 g011
Figure 12. The XRD spectra of bottom and top samples manufactured using the CMT—based WAAM process.
Machines 10 01136 g012
Figure 13. The XPS characterization of different elements in the (a) top and (b) bottom specimens manufactured using the CMT−based WAAM process.
Machines 10 01136 g013
Figure 14. The optical microscope images along the build height of chemically etched SS410 samples prepared using CMT−based WAAM process.
Machines 10 01136 g014
Figure 15. The (ac) SEM image of the samples at different positions and (d) EDS analysis of the precipitates developed using the CMT-based WAAM process (dashed line represent delta—ferrite).
Machines 10 01136 g015
Figure 16. The equilibrium phase diagram of SS410 material obtained with the aid of Thermocalc software to predict the phases formed in the microstructure [51].
Machines 10 01136 g016
Figure 17. The (a) stress–strain curve of four different samples (IB, IT, OB, OT) and their corresponding (b) tensile properties and (c) density and young’s modulus plot.
Machines 10 01136 g017
Figure 18. The chemically etched images of necked section of (a) OB and (b) OT obtained with the aid of SEM.
Machines 10 01136 g018
Figure 19. The fractography images of different samples including (a) IB, (b) IT, (c) OB, and (d) OT obtained with the aid of SEM at both low and high magnification.
Machines 10 01136 g019
Figure 20. The Vickers micro-hardness measurement obtained (a) towards the increased build height and (b) towards the right of the sample at 12 mm build height.
Machines 10 01136 g020
Figure 21. The (a) COF plot with respect to time, (b) the wear track formed with the aid of counter-body and (c,d) magnified image to analyze the type of wear mechanism formed in a sample fabricated using the CMT-based WAAM process.
Machines 10 01136 g021
Figure 22. The EDS analysis conducted on the worn surface of the sample manufactured using the CMT-based WAAM process.
Machines 10 01136 g022
Table 1. The chemical composition of the SS410 feedstock wire and the substrate used in the WAAM process for bulk fabrication.
Chemical CompositionCCrNiMoMnSiPSCuFe
Metal wire (410)0.01412.50.270.080.540.390.020.010.14bal
Substrate (MS)0.05---0.70.120.0160.004-bal
Table 2. Three levels of process parameters, applied to optimize a single bead using the RSM approach in the WAAM process.
ParameterWFS (m/min)TS (cm/min)GFR (L/min)
43010
Levels55513
68016
Table 3. The experimental design and measured data corresponding to each run formed by the CMT—based WAAM process.
Independent VariablesDependent Variables
Run
Order
WFS (m/min)TS
(cm/min)
GFR (L/min)Current (A)Voltage (V)BW
(mm)
BH
(mm)
HI (KJ/cm)
16301320517.811.0803.6235.84
25801619016.76.6852.2011.90
35301018116.89.9833.5004.86
44801315915.55.9302.0701.47
55301618116.910.0303.4304.89
65551319016.77.8202.6102.76
75551319116.77.8002.5602.76
86551021117.68.3802.6803.24
94551015915.46.7002.4012.14
105801018916.66.7302.1601.90
116801321617.47.2502.1802.25
125551319016.88.0352.5002.78
134551616315.47.1302.2602.19
144301316115.58.9503.2403.99
156551621517.38.5102.6203.25
Table 4. The process variables utilized to evaluate wear resistance using the ball-on-disc tribometer on the sample fabricated using the CMT—based WAAM process.
VariablesValueUnits
TestBall on Disk
Normal Load5N
Wear Track Diameter12mm
ConditionsAmbient
Sliding Distance340m
Revolutions300rpm
Counter BodyAl2O3
Counter Body Radius5mm
Table 5. The Anova results related to the mathematical model developed using the RSM approach.
BWBH
Independent VariablesDFSSSF-Valuep-ValueDFSSMSF-Valuep-Value
Model929.38843.2654163.560.00093.854740.42830169.010.000
Linear327.94319.3144466.550.00033.523431.17448463.440.000
WFS15.29755.2975265.350.00010.160180.1601863.210.001
TS122.606122.60611132.330.00013.356643.356641324.520.000
GFR10.03950.03951.980.21910.006610.006612.610.167
Square31.25670.418920.980.00330.307960.1026540.510.001
WFS×WFS10.06220.06223.110.13810.011360.011364.480.088
TS×TS11.10581.105855.390.00110.283390.28339111.830.000
GFR×GFR10.02090.02091.050.35310.000440.000440.170.693
2-Way Interaction30.18860.06293.150.12430.023350.007783.070.129
WFS×TS10.16400.16408.220.03510.018630.018637.350.042
WFS×GFR10.02250.02251.130.33710.001640.001640.650.458
TS×GFR10.00210.00210.110.75810.003080.003081.220.320
Error50.09980.0200 50.012670.00253
Lack of Fit30.06590.02201.290.46430.006600.002200.730.624
Pure Error20.03390.0170 20.006070.00303
Total1429.4882 143.86742
Table 6. The summary table represents the adequacy of the ANOVA findings.
BWBH
SR-sqR-sq (adj)R-sq (pred)SR-sqR-sq (adj)R-sq (pred)
0.10.99660.99050.96170.050.99670.99080.9691
Table 7. The predicted and actual data corresponding to different input variables obtained using CMT—based WAAM process.
BWBH
WFS (m/min)TS (cm/min)GFR (L/min)Predicted
(mm)
Actual
(mm)
Error (%)Predicted
(mm)
Actual
(mm)
Error (%)
5.563137.727.433.72.422.451.2
666137.837.62.92.372.390.8
442137.87.553.22.712.761.8
4.734139.39.052.63.233.291.8
Table 8. The optimized process variables utilized for the bulk fabrication of SS410 thick walls using the CMT—based WAAM process.
WFS (m/min)TS
(cm/min)
GFR
(L/min)
Voltage (V)Current
(I)
Starting Current (%)End Current (%)Gas Pre-Flow (s)Gas Post-Flow (s)
5.5631316.8193.3115500.10.5
Publisher’s Note: MDPI stays neutral with regard to jurisdictional claims in published maps and institutional affiliations.

