1. Introduction
The study of the reliability, availability and efficiency of industrial multistage components poses a constant challenge for the manufacturing industry.
Manufacturing processes can be studied by adopting combinations of different machines that work in a coordinated way, either in series or parallel. The machines can be single stage machines, i.e., machines in charge of one phase of production, or multistage machines, which develop several phases of the production process.
Maintenance strategies must be different for each type of process and machine used. With processes based on a series-parallel combination of single stage machines, an unexpected stoppage caused by the failure of a component does not necessarily stop production altogether, but it may decrease the value of production capacity. With processes based on multistage machines, except for redundancy of these multistage machines, a stop caused by a component failure can cause the entire production process to stop.
Because of this condition in multistage machines, the components, their operating condition and their reliability for the performance of the work they must carry out must be carefully studied. The preventive maintenance strategy [
1] is one of the most popular strategies in the industry. According to Colledani [
2], equipment availability, product quality and system productivity are strongly related. Moreover, Colledani stated that preventive maintenance policies significantly affect the completion time of a batch [
3].
Cheng-Hung [
4] proposed a Dynamic Dispatch and Preventive Maintenance model (DDPM) that considers dispatching-dependent deterioration and machine health-dependent production rates for C, a dynamic decision model. Colledoni [
5,
6] cited in his works that opportunistic maintenance affected the performance in multistage manufacturing systems. Similarly, Xiaojun [
7] proposed opportunistic preventive maintenance for Serial-Parallel Multistage Manufacturing Systems (SP-MMSs).
Recent works of Azimpoor [
8] reveal that a machine’s lifetime is divided into two stages in a failure process, showing defect arrival and then failure arrival. So, the maintenance schedule can be a combination of orders to repair and inspect machines. In this way, Ruiz Hernández [
9] believed that poor maintenance could not reinstate the machine to an “as-new” status and this had to be considered when designing maintenance policies. Additionally, Guanghan [
10] cited four degradations stages of multistage machines: normal stage, slow degradation, fast degradations and fail.
An effective maintenance policy typically seeks high-quality mechanical reliability, and the minimum possible maintenance cost [
11,
12,
13,
14,
15]. Xiaojun [
16] studied the Condition-Based Maintenance (CBM) policy in multistage manufacturing systems and the positive effects on the quality of the machine work with the most appropriate preventive maintenance decisions. Qipeng [
17] proposed using Multistage Stochastic Mixed-Integer Programming (MSMIP) to seek optimal operations regarding maintenance outage scheduling of the machine.
Yingsai [
18] studied preventive maintenance based on a policy to improve operation efficiency by modelling an algorithm to obtain the optimal parameters to ascertain the frequencies of inspections and maintenance. Similarly, Grossmann [
19] concluded that a Markov decision-making process model is an interesting framework for modelling the stochastic dynamic decision-making process of condition-based maintenance.
Qing [
20] proposed preventive maintenance based on quality rework loops for detecting random machine failures. Qiuhua [
21] proposed using a constraint to a two-stage assembly flow shop against a fixed preventive maintenance time, using the Weibull probability distribution to calculate the optimal maintenance interval. This ensures the production flow is continuous and ensures the reliability of the machine.
1.1. Preventive Programming Maintenance
Preventive programming maintenance is used in most manufacturing industries. The work of Jun-Hee [
22] proportionated preventive maintenance scheduling to minimise the risk of failure in a single-process machine. Other studies by Taghipour [
23] and Duffuaa [
24] developed models based on integrating the maintenance schedule into the production to improve the machine’s quality and performance.
The study of the availability to show the performance level of a multistage system was developed by Arvanitoyannis [
25]. Ahmadi [
26] used Reliability-Centred Maintenance (RCM) based on condition-based maintenance to decide which maintenance action must be undertaken. Zhen [
27] studied the health index to obtain and measure the reliability of a complex production process to reflect the in-time operation state of the production process.
Jiři [
28] studied the losses in production and analysed the priority in the corrective and preventive maintenance as the fastest return to the normal activity of the machine. He also used the main time between failure and main time to failure and other delayed times to minimise the cost and improve the availability of the machine. Liberopoulos [
29] analysed all the times involved in main time to repair in a single-parallel multistage machine. He also proposed the use of time lost for production as an indicator of the availability of the process.
1.2. Improved Preventive Programming Maintenance
The improved preventive programming is based on the PPM strategy. This strategy minimises the TTPR of all the components by improving the safety of own stocks to reduce the MTTR and improve efficiency and availability ratios. Ren [
30] analysed the product-service system (PSS) as an important challenge to providers to perform preventive maintenance based on historical data combined with real-time operational data.
Gharbi [
31,
32] analysed the effects of joint production and preventive maintenance controls for manufacturing systems, using a make-to-stock strategy and age-based on preventive maintenance, minimising the inventory cost according to unreliable manufacturing periods.
Hongbing [
33] studied the optimisation of preventive maintenance by a joinder of maintenance and production considering the maintenance costs, processing costs and completion rewards using the Markov model to form a decision process.
García and Salgado [
34] studied the modelling of a multistage machine and preventive maintenance strategies to improve the machine’s efficiency and availability.
Ferreira [
35] introduced the reactive and proactive concepts to evaluate the components obsolescence and then a new Key Performance Indicators (KPI
S) for a matrix decision for industrial maintenance evaluation.
This paper studies a real case based on a MultiStage Thermoforming Machine (MSTM).
The objective is focused on the selection of the most appropriate preventive maintenance strategy for the components of the studied machine. For that purpose, the preventive maintenance strategies PPM and IPPM are studied, and their results compared. Initially the machine works with PPM strategy. Looking for the improvement of efficiency and availability, IPPM strategy is proposed for use. Results show that a combination of different maintenance strategies is more interesting from a cost point of view. In the aim to reach the objective, the authors propose a methodology for selecting PPM or IPPM strategy for the components depending on the location of the component and new indicators, defined in Step 5 in
Section 2. This research proposes a
n dimensional matrix for that purpose.
2. Materials and Methods
The work carried out in this article is based on the analysis of one year working of the MSTM. The results obtained with PPM and IPPM strategies are different, so a multicriteria decision method is studied for selecting the appropriate preventive maintenance strategy for different components in the same machine. The result of this multicriteria analysis is the multidimensional matrix proposed and adopted for the machine.
The methodology used in this research and its ordered executed steps, is as follow:
Step One: First, the MSTM is selected as case study. Then the thermoforming multistage machine is characterised and subsequently all the components are identified and classified by component type. See
Section 3.1;
Step Two: Definition of the concept Global Operation Condition (GOC
i) as an interesting parameter to propose a maintenance strategy. See
Section 3.2;
Step Three: Definition of maintenance times for each component an efficiency and availability definition. See
Section 3.3;
Step Four: Study and collection the individual maintenance times for each component in the MSTM. Evaluation of the results of applying the PPM and IPPM strategies in the same machine in MTTR, TLP, efficiency and availability terms. Evaluation for each component type. See
Section 3.4 and
Section 3.4.1 for PMM strategy and 3.4.2 for IPPM strategy. The results provided by the
Section 3.4 are not part for the results of this research, due to the fact that the objective of this research is the selection of the appropriate preventive maintenance strategy for each component and the results of this section are the efficiency and availability values for both strategies;
Step Five: Definition of Key Performance Indicators (KPIs) as the result of proposed expressions based on maintenance times defined and studied in step four. See
Section 3.5.1;
Step Six: Proposal of a multidimensional matrix for evaluating the maintenance strategy suggested for each component in the same MSTM as a combination of a Global Operation Condition (GOCi), key performance indicators and type of component. See
Section 3.5.2;
This paper is organised following the outlined steps.
Other Considerations
If the analysed machine will present a lot of unexpected failures in different types of components, the authors suggest using FMECA analysis to achieve a better design and manufacture of the multistage machine.
The definition of the maintenance strategies is lined up to EN 13306:2001. Also, the new KPIs proposed are not the same that technical groups in EN 15341:2007 but allow new and interesting results.
3. Case Studied
3.1. Definition of A Multistage Thermoforming Machine and List of Studied Components
Thermoforming and tub-filling machines are one case among the many that exist. This study covers this type of machine.
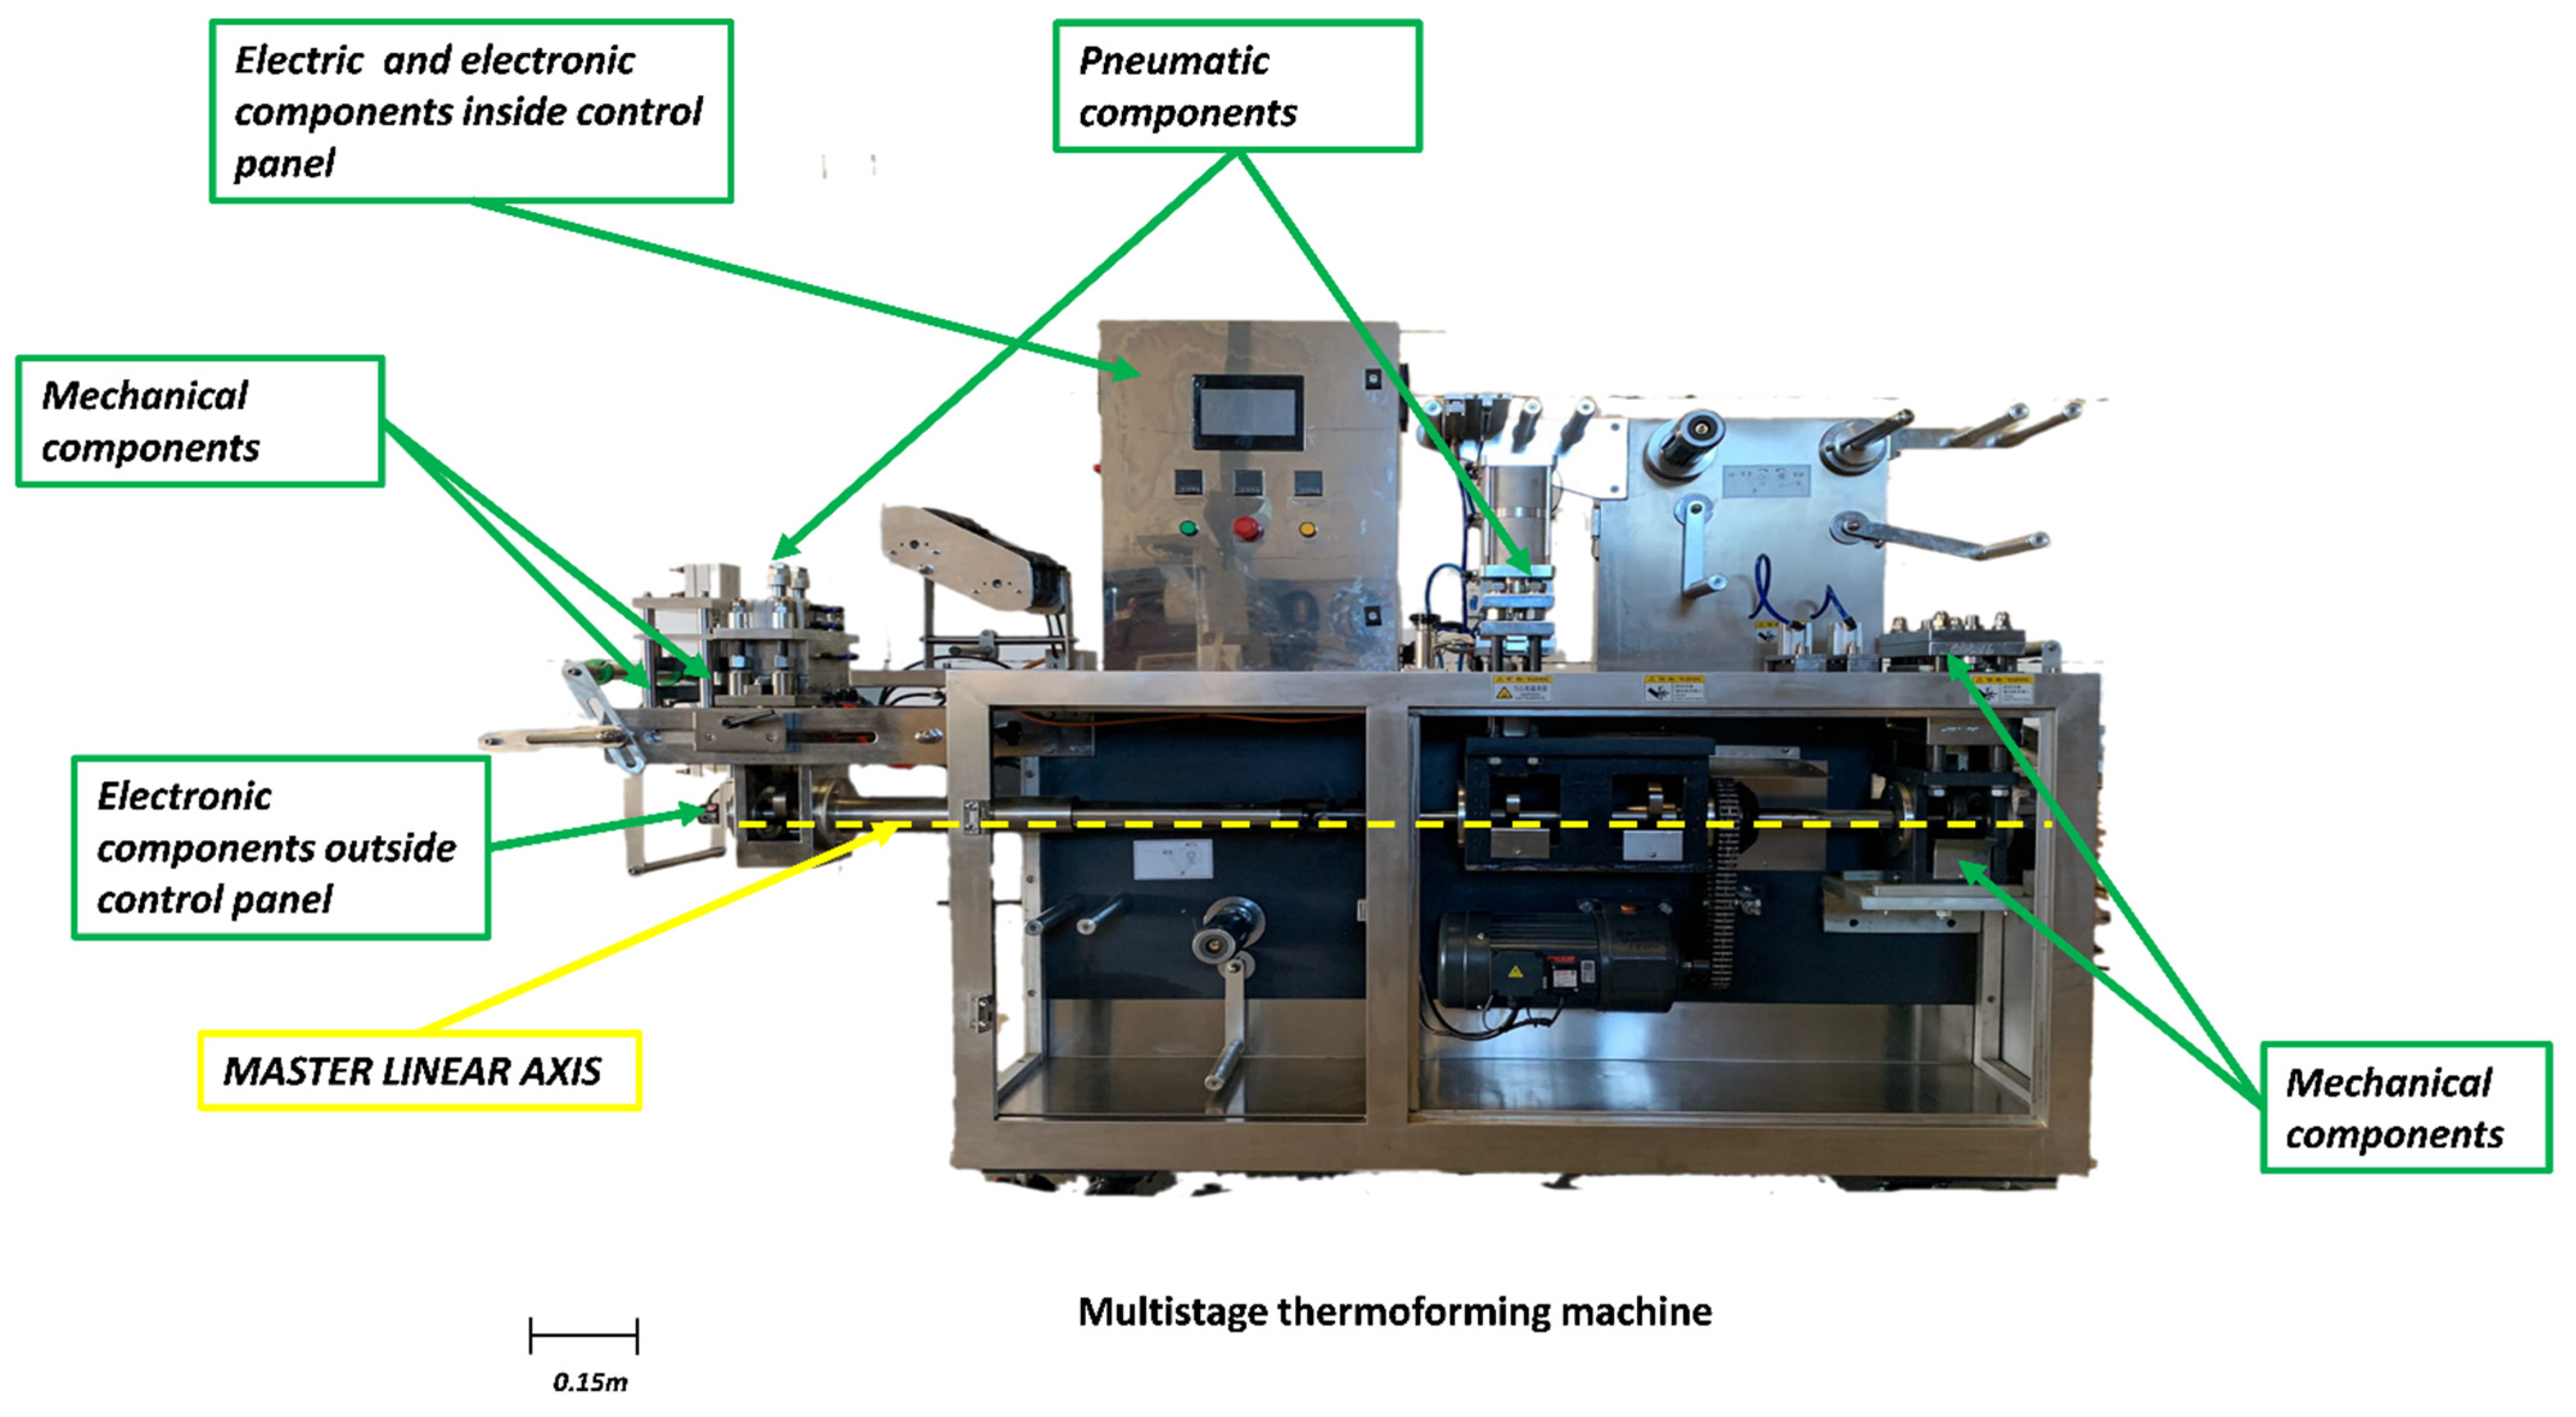
Figure 1 shows the MSTM and the components’ placement.
These machines comprise several steps, from managing the polymer film, the container and the lid to the dosage and final cut.
The cycle time in this machine is 4 s, during which six terrines are manufactured. Standard operation requires the constant coordination of all steps since a failure in one of them means the global failure and loss of the ongoing production.
There is a master linear axis in the lower part of the machine from the thermal conditioner of the polymer for the container thermoformer to the cutter for finished tubs, which ensures the coordinated operation of the entire machine (see
Figure 1).
A structural, fixed part is usually not subject to wear and tear but must be protected against corrosion and meet health and food operation conditions. This multistage machine has many component types. The classification of the components is as follows:
Electrical components;
Electronic components;
Mechanical components;
Pneumatic components.
The assignment of the type of component has been made by applying the following criteria:
Electrical components are all those that works in alternating voltage and current;
Electronic components are all those that need analog signals of voltage or current to work. Those components that use electronic control cards and power electronics equipment in their operating principle, such as thyristors or insulated gate bipolar transistors, are also included;
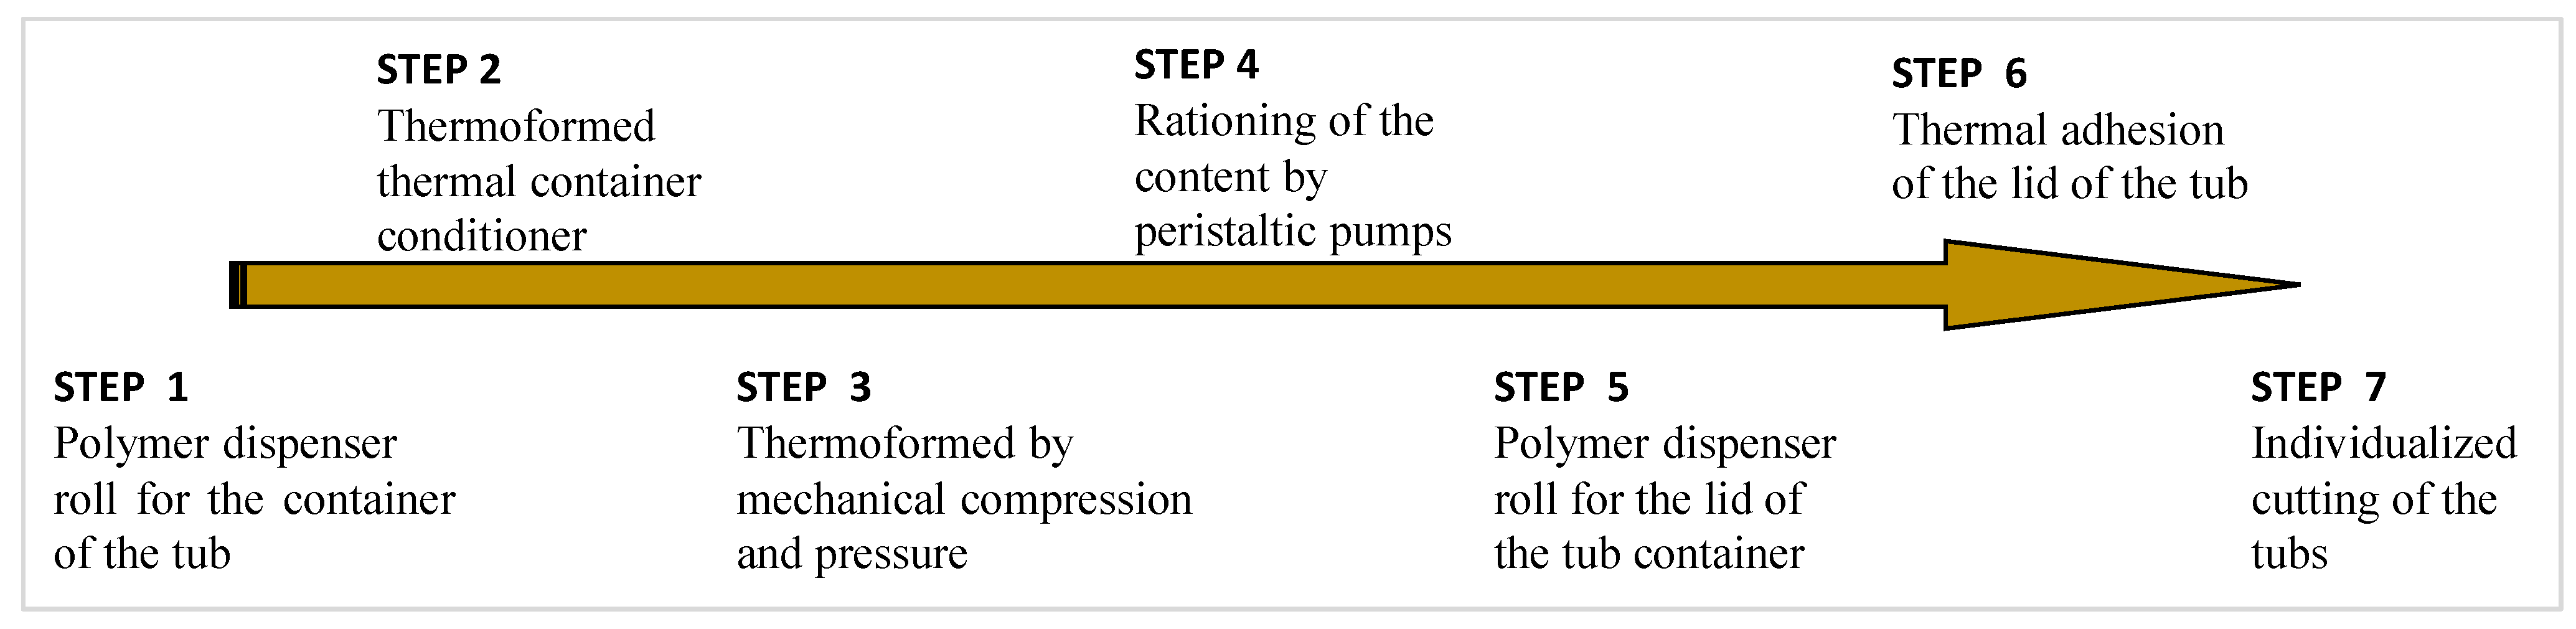
Mechanical components are all those that move or are actuated abruptly. The peristaltic pump is included in this group since its drive is carried out by a servomotor that controls the proper dosage. Additionally, the thermocouple sensor is considered as a mechanical component due to its location is inside of the mechanical base for thermoforming creating tub (see step 3 in
Figure 2) and inside of the mechanical base for the thermal adhesion (see step 6 in
Figure 2). Both mechanical bases are in constant movement;
Pneumatic components are all those that require pressurised air for their operation.
3.1.1. Electrical Components
They are usually inside the control panel, but those that entail human-machine interface (HMI) are on the outer face of the door control panel.
Table 1 shows the list of electrical components in this MSTM, with the failure source and event.
3.1.2. Electronic Components
Electrical components are usually inside the control panel, e.g., the programming logic controller (PLC) and solid-state relays, but some components can be on the outer face of the control panel, as with the electrical components that have human-machine interactions. Sensors are typically distributed around the machine and are subject to degrading and unexpected hits.
Table 2 shows the list of electronic components in this MSTM, with the failure source and event.
3.1.3. Mechanical Components
Some are subject to movement, degrading and unexpected hits. They are selected with fatigue-resistant materials but may be damaged by wear, environmental conditions, and unexpected hits.
Table 3 shows the list of mechanical components in this MSTM, with the failure source and event.
3.1.4. Pneumatic Components
These components are distributed all over the machine and are subject to degrading and unexpected hits.
Table 4 shows the list of pneumatic components in this MSTM, with the failure source and event.
3.2. Operation Conditions
Operation conditions are different depending on the situation and type de component selected. In this study, the operation conditions assessed are:
Work temperature;
Work Humidity, studied by Ingress Protection rating (IP) according to IEC 62262 [
36];
Impact Protection rating (IK) according to IEC 62262 [
36].
Table 5 shows the classification of operation conditions and three operation stages defined in this study.
The authors propose a definition of Global Operation Condition (GOC
i) for each component as a decisive variable to select the appropriate preventive maintenance strategy for the “i” component. This GOC
i is defined by a sequence of three letters (A, B or C) that mention the three operation conditions studied in Step 3 in
Section 2 (see
Table 5). In general, the structure of a GOC
i is expressed at it follows:
First letter: Temperature condition (A, B or C);
Second letter: Humidity condition (A, B or C);
Third letter: IK rating condition (A, B or C).
So, if we consider, for example, a component with a BAA value of GOCi, it means the following:
First letter B: Indoor and ventilated situation;
Second letter A: Indoor with appropriate IP;
Third letter A: Indoor and mechanically protected.
3.3. Expressions Proposed for the Preventive Maintenance Study
As stated in
Section 1, a failure of most components should lead to a global failure in this type of machine. So, if the critical scenario is studied, the MSTM will present a global failure if a component fails.
The times studied for the failures [
28,
29] are:
TTRP: Time to replace a component;
TTC: Time to configure;
TTMA: Time to mechanical adjustment;
TTPR: Time to provisioning;
MTTR: Mean time to repair;
MTTF: Mean time to failure;
MTBF: Mean time between failure;
TTLR: Line restart time, defined by expert knowledge;
TLP: Time lost production.
MTTR (1), TLP (2), MTBF (3), efficiency (4) and availability (5) can be calculated with these equations. Efficiency and availability are used as indicators of success in preventive maintenance.
3.4. Preventive Maintenance Strategies for Multistage Thermoforming Machines
The maintenance strategies studied for this MSTM are PPM and IPPM. The efficiency and availability results improve by applying the IPPM strategy. However, applying the IPPM strategy for all the components is not the best scenario for the end user because the stock costs increase. The value of TTLR for both strategies is set at 14,400 s given by the user experience of the machine.
3.4.1. Preventive Programming Maintenance
This strategy uses its own times per component (TTPR, TTC, TTMA, TTRP). All the times are obtained for the usage of the machine. The results are shown in a different table for each type of component.
Table 6 shows the electrical components times and the value of efficiency and availability calculated with Equations (4) and (5).
Table 7 shows the electronic components times and the value of efficiency and availability calculated with Equations (4) and (5).
Table 8 shows the mechanical components times and the value of efficiency and availability calculated with Equations (4) and (5).
Finally,
Table 9 shows the pneumatic components times and the efficiency and availability value calculated with Equations (4) and (5).
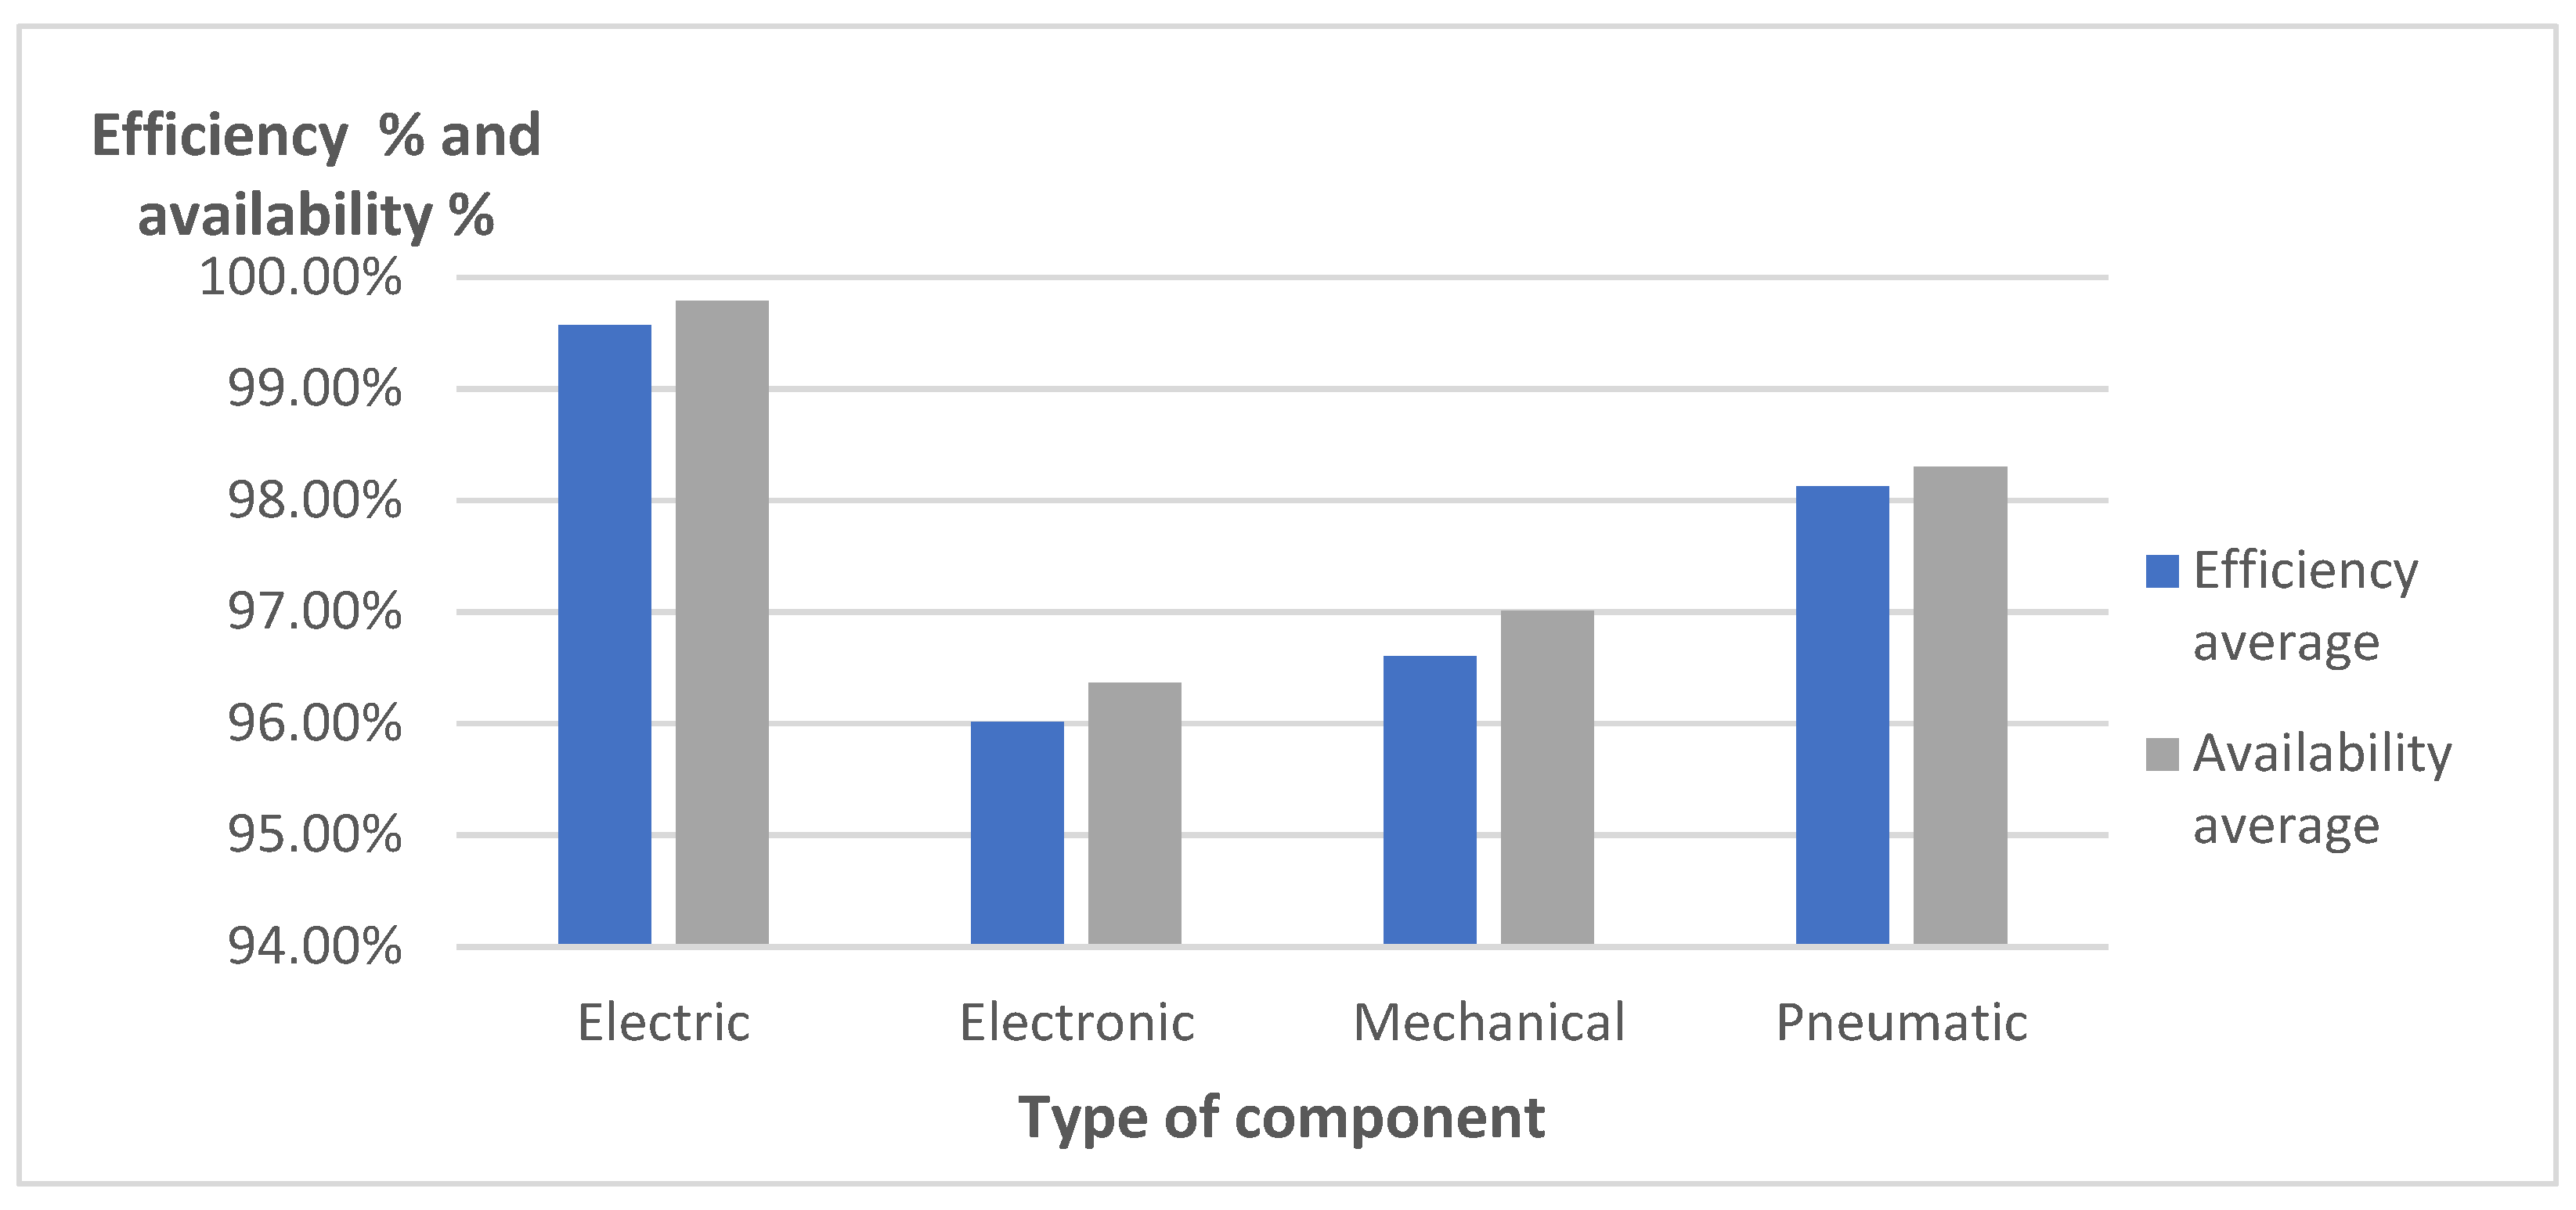
Figure 3 shows a comparative average ratio for efficiency and availability in the PPM strategy by component type.
Electrical components have the higher average values of efficiency and availability, with a maximum value of 99.71% in efficiency and availability.
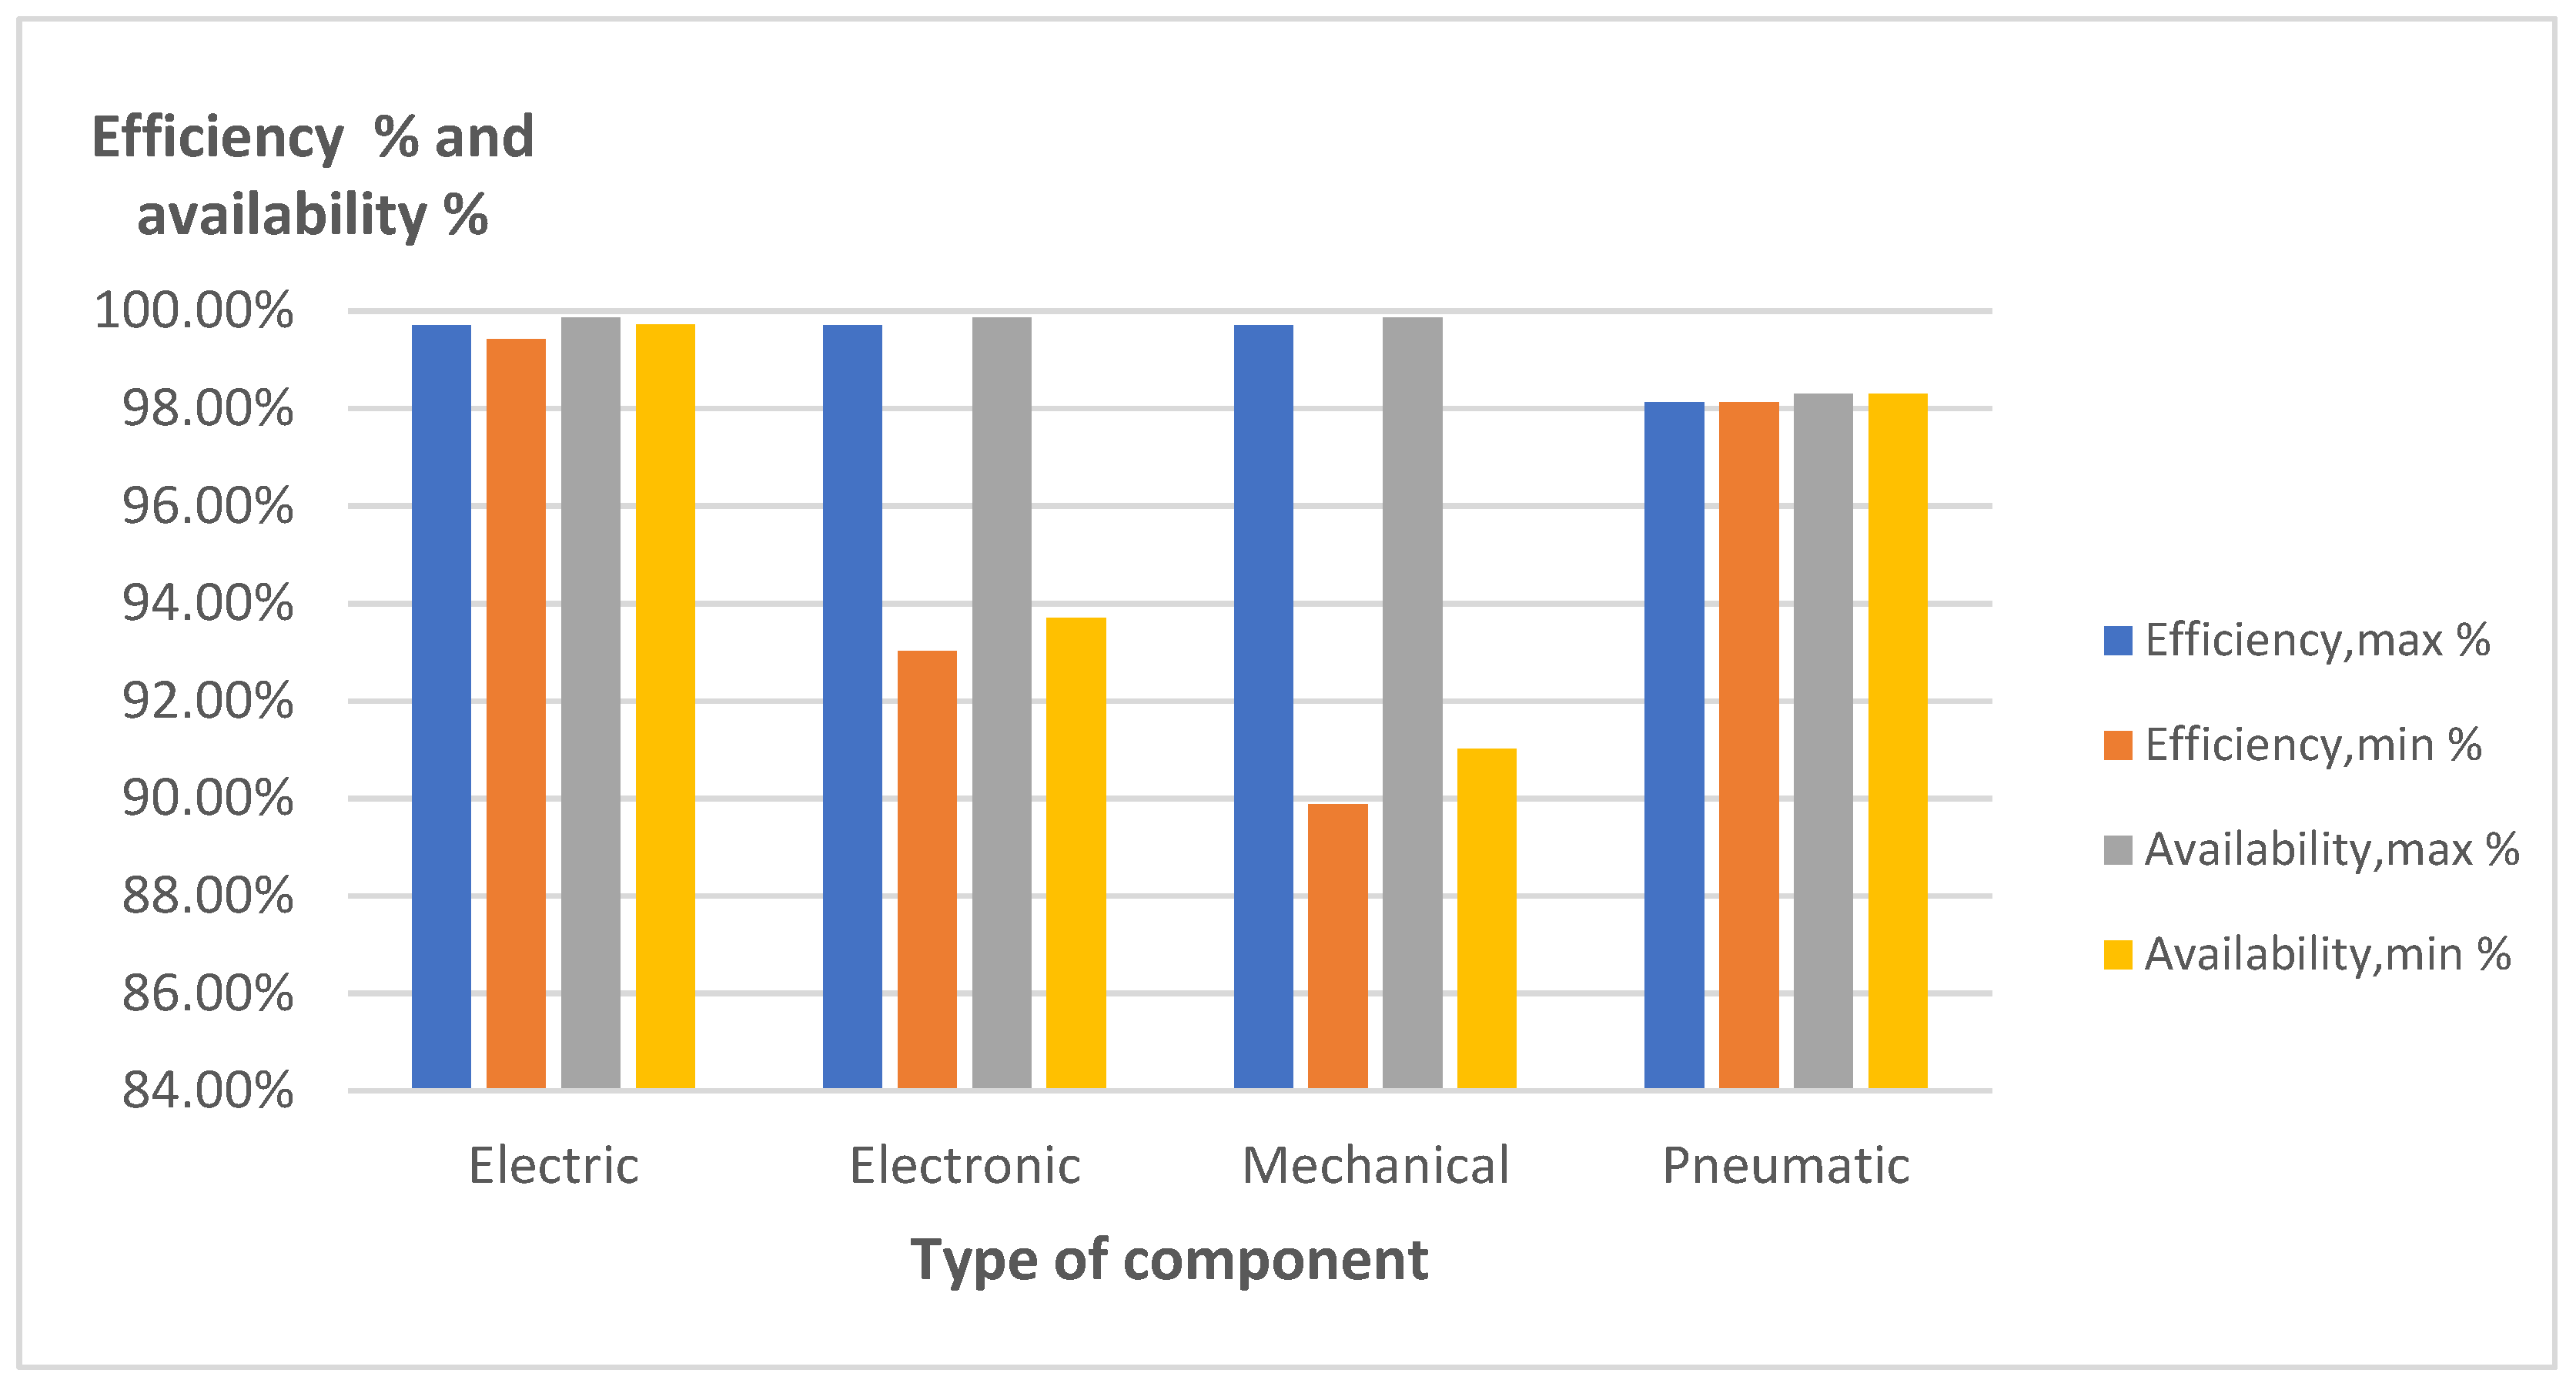
Figure 4 also shows the maximum and minimum values for each type of component. Here, the minimum efficiency and availability values of electronic and mechanical components suggest using another maintenance strategy. The machine efficiency and availability levels depend on the efficiency and availability of all the components. So, the objective of the maintenance strategy is to achieve higher efficiency and availability for all the components and not for just many components.
3.4.2. Improve Preventive Programming Maintenance
The IPPM strategy is based on reducing the TTPR time for all the components by increasing the security stocks for the components. The TTPR value in this strategy is a residual value consisting in the transport and picking time to machine of the component waiting for in the safety stock.
Table 10 shows the electrical components times and the efficiency and availability values calculated with Equations (4) and (5).
Table 11 shows the electronic components times and the efficiency and availability values calculated with Equations (4) and (5).
Table 12 shows the mechanical components times and the efficiency and availability values calculated with Equations (4) and (5).
Finally,
Table 13 shows the pneumatic components times and the efficiency and availability values calculated with Equations (4) and (5).
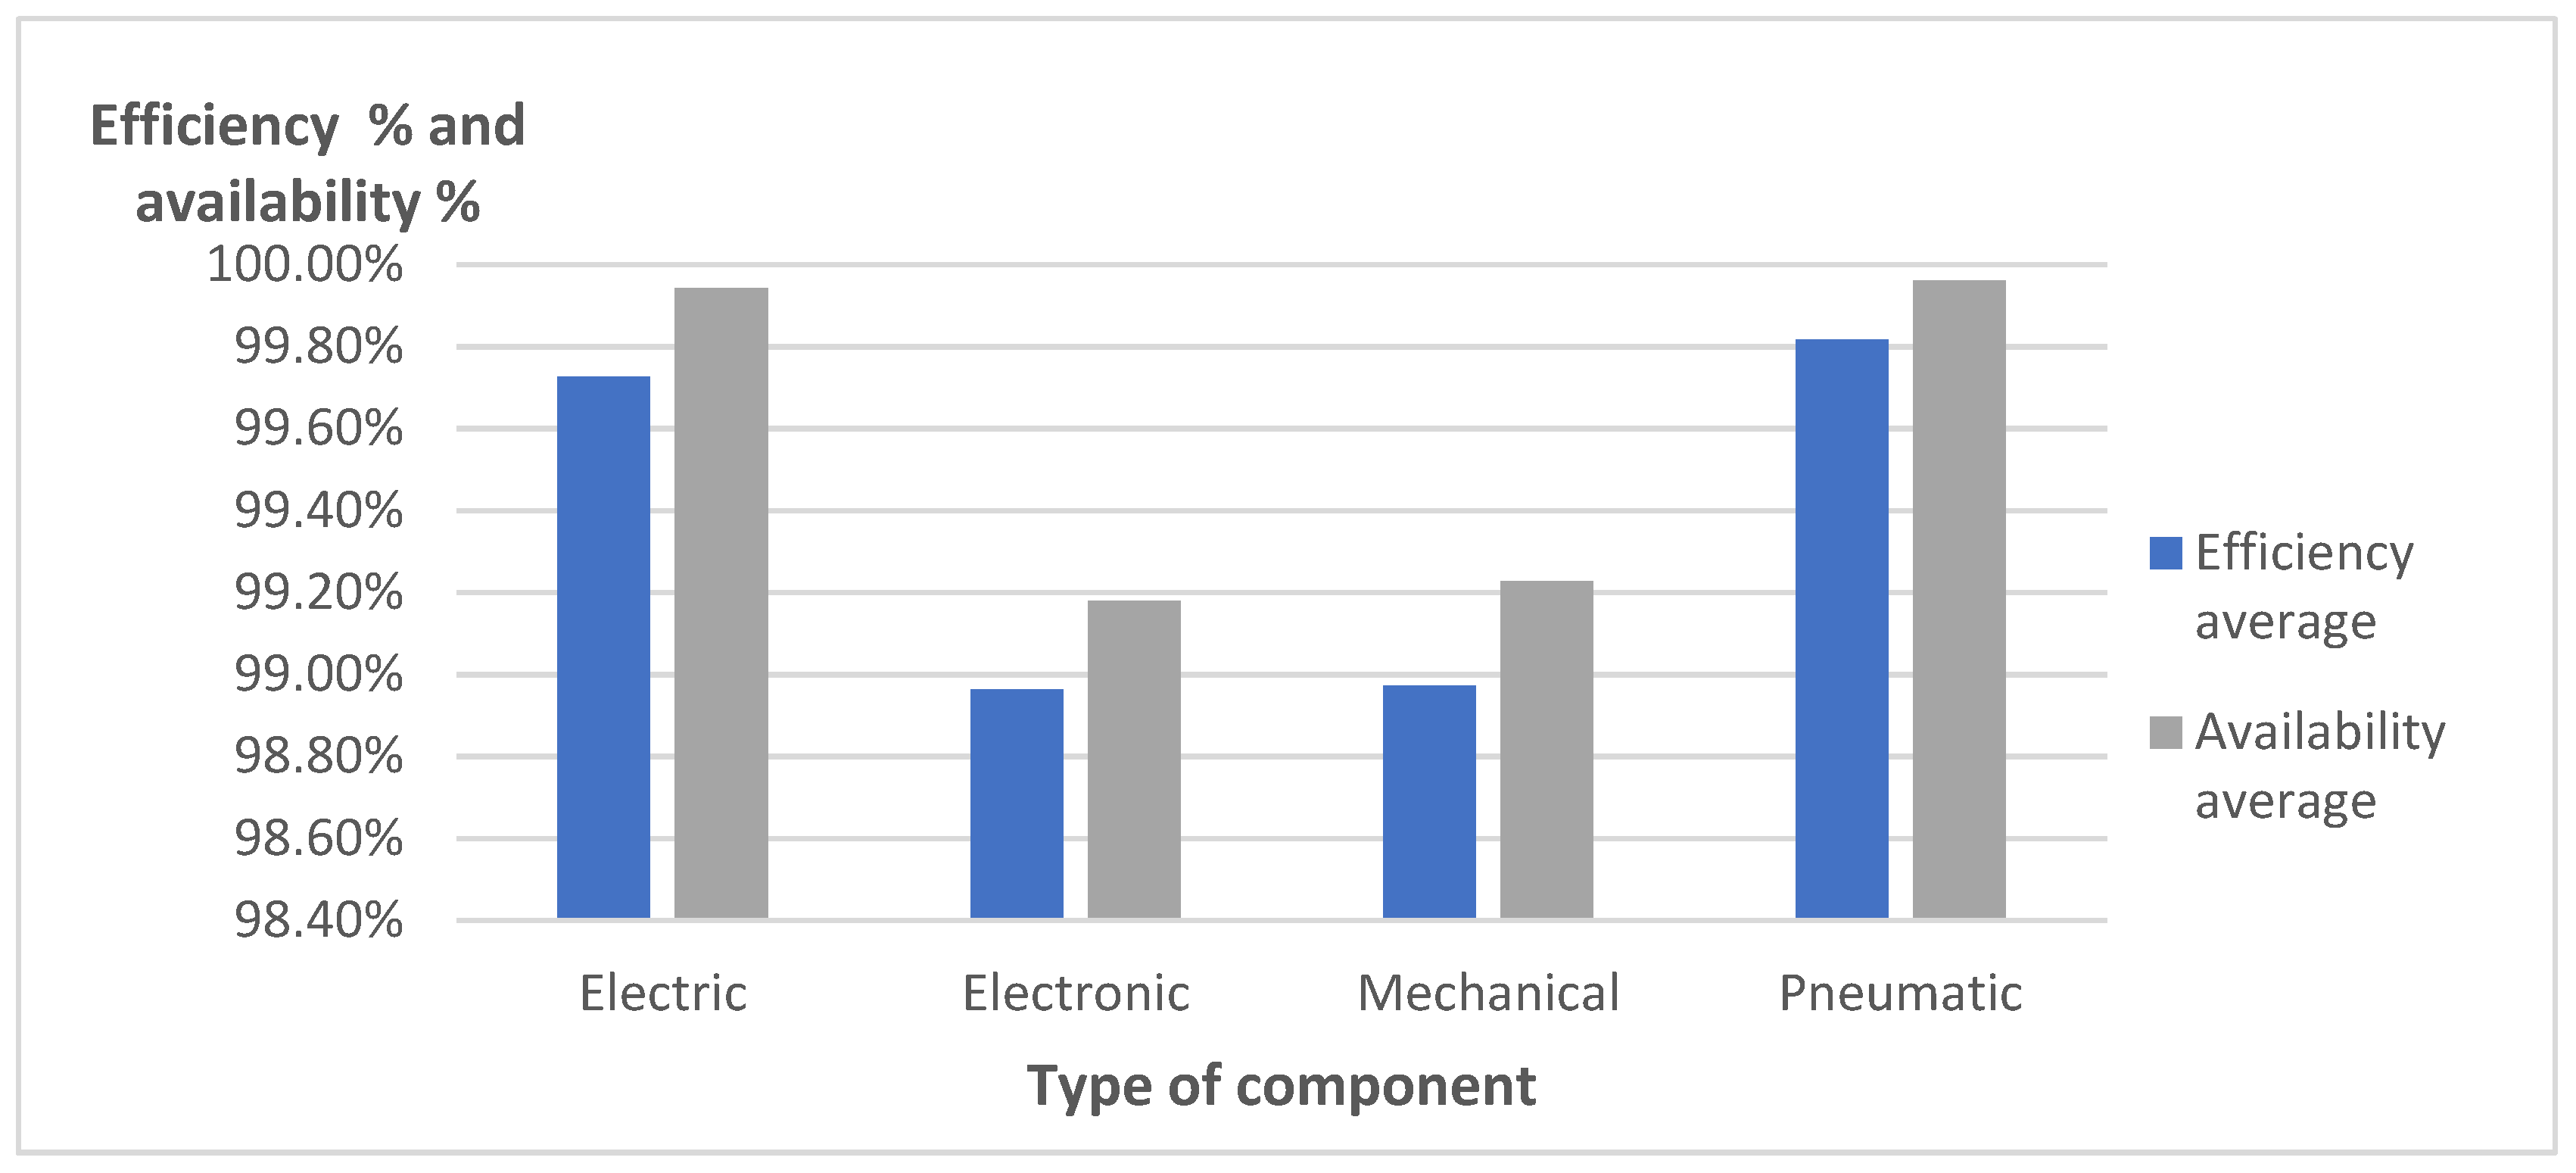
As with
Figure 3 and
Figure 5 shows a comparative average ratio for efficiency and availability in the IPPM strategy by component type.
When comparing
Figure 3 and
Figure 5, the efficiency and availability increase their values in all components, especially in pneumatic components. Electronic and mechanical components also increase their values.
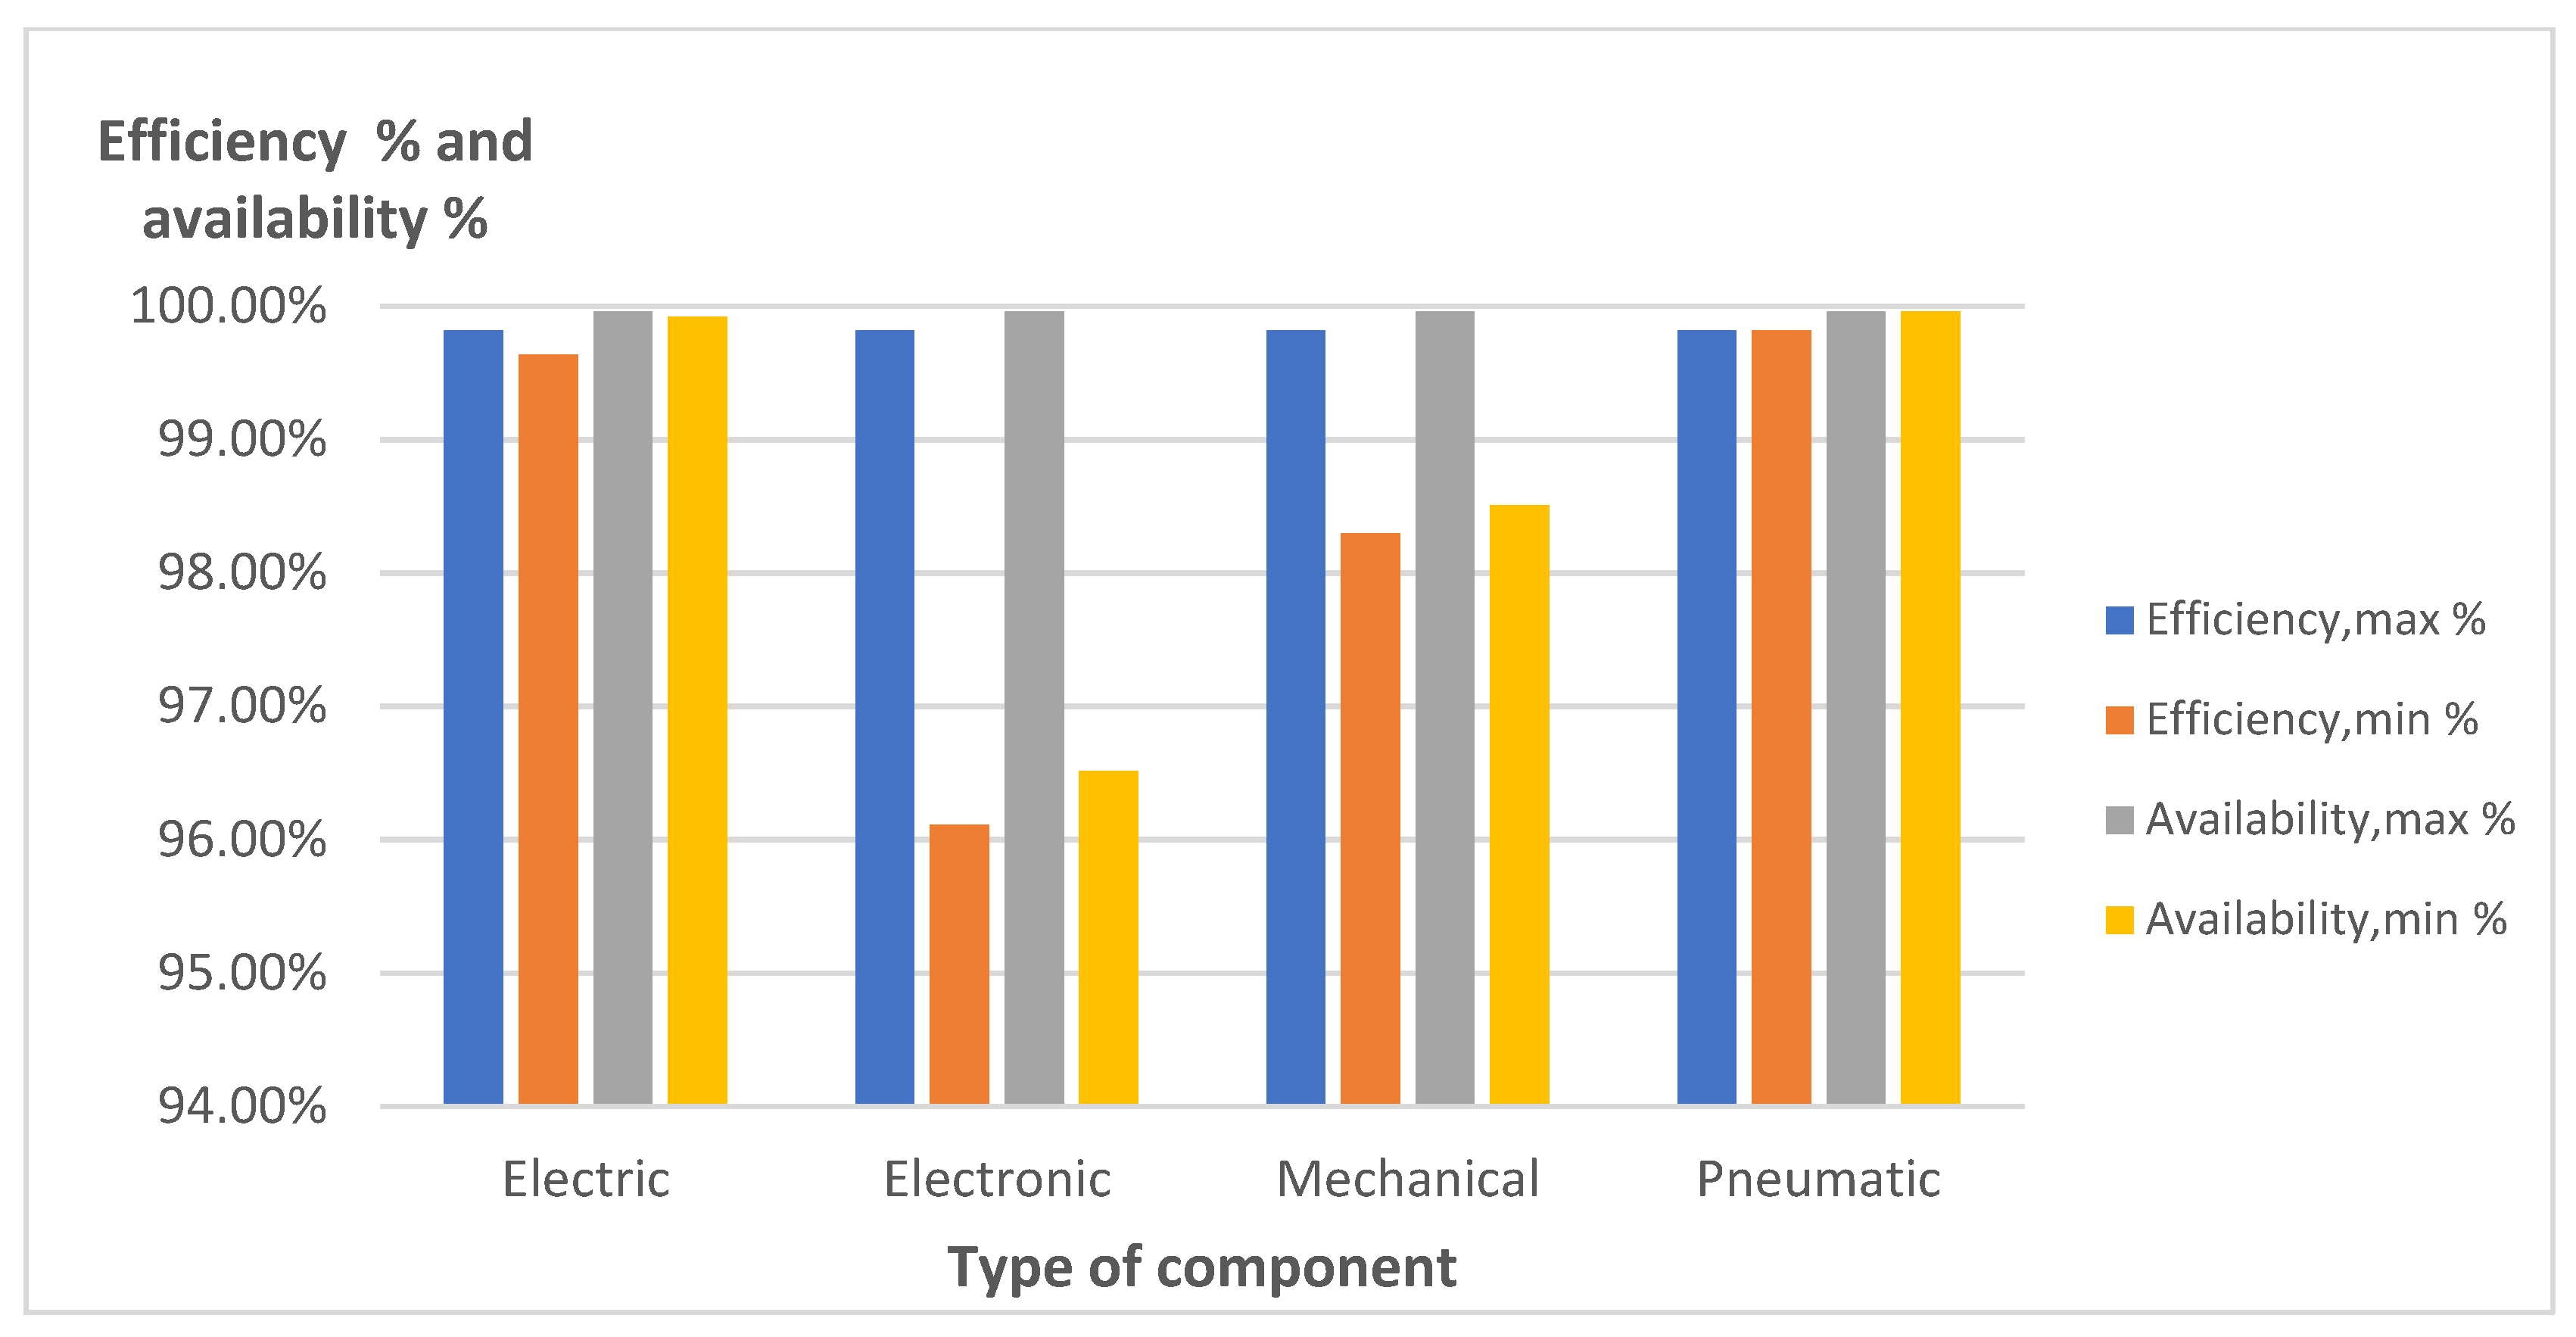
Figure 6 show the minimum and maximum new efficiency and availability values when applying the IPPM strategy.
A simple comparison between
Figure 4 and
Figure 6 show the increase obtained in pneumatic components by applying the IPPM strategy. Their efficiency and availability levels improve to above 99.82% values. Electronic and mechanical components also improve their minimum efficiency and availability values by 3.09% and 2.81% for electronic components and 8.42% and 7.48% for mechanical components. Increasing the components’ minimum efficiency and availability values allows for improving MSTM efficiency and availability globally.
3.5. Selection of Preventive Maintenance Strategies
The results obtained by applying the PPM and IPPM strategies show very interesting efficiency and availability values, but in the same machine, as is well-known, all the components do not have to use the same maintenance strategy. In this section, the authors propose a singular study that allows for selecting the best strategy for each component. This selection depends on parameters such as type of component, operation condition and own time values of all the components.
3.5.1. Parameter for the Selection under Study
An analysis of the results obtained when applying PPM and IPPM shows that component type is an important parameter for deciding on preventive maintenance strategy. For example, applying IPPM in electrical components does not show a remarkable increase, so the conclusion could be not applying IPPM in electrical components.
The operation conditions in
Table 5 denote the relevance of the adequate operation conditions for all the components by selecting the appropriate tolerance to temperature and an appropriate value of IP and IK ratings. A high-quality component working in inadequate operation conditions, compared with their datasheet, could entail unexpected failures and a decrease in efficiency and availability of the MSTM. Each component may have an individual condition, shown by three letters A, B or C for this study.
Attending to the definition of each operation condition, it is easy to understand that many combinations of operation conditions cannot exist simultaneously. For example, a component cannot be located indoors and outdoors, so combinations such as AAA are impossible.
Individual maintenance times of all the components allow for knowing the influence of the MMTR and TLP times in the efficiency and availability of the MSTM, so for this study, these KPIs are used:
Equation (6) states the influence of the TTPR in MTTR. For this KPI1 singular value is used at 25% result.
Equation (7) also shows the influence of the TTPR in the TLP (see Equation (2)). A Higher value of TTPR greater than TLR could entail a considerable stop time in the MSTM and the assumption of undesirable opportunity costs. In this KPI2, the singular value used is 70% result.
3.5.2. N-Dimensional Matrix for Preventive Maintenance Selection
Using the three parameters explained in the previous subsection, an n-dimensional matrix is proposed to select the appropriate maintenance strategy for the component, where n is set in five dimensions:
To understand and use this 5-dimension matrix, the authors propose a plane conversion in which the operation condition is the column, and the rest of the conditions are fixed in mixed lines, as shown in
Table 14.
4. Results
Applying the n-dimensional matrix for the preventive maintenance strategy in the components of a multistage thermoforming machine allows for improving efficiency and availability.
Table 15 shows the application of the n-matrix in this study.
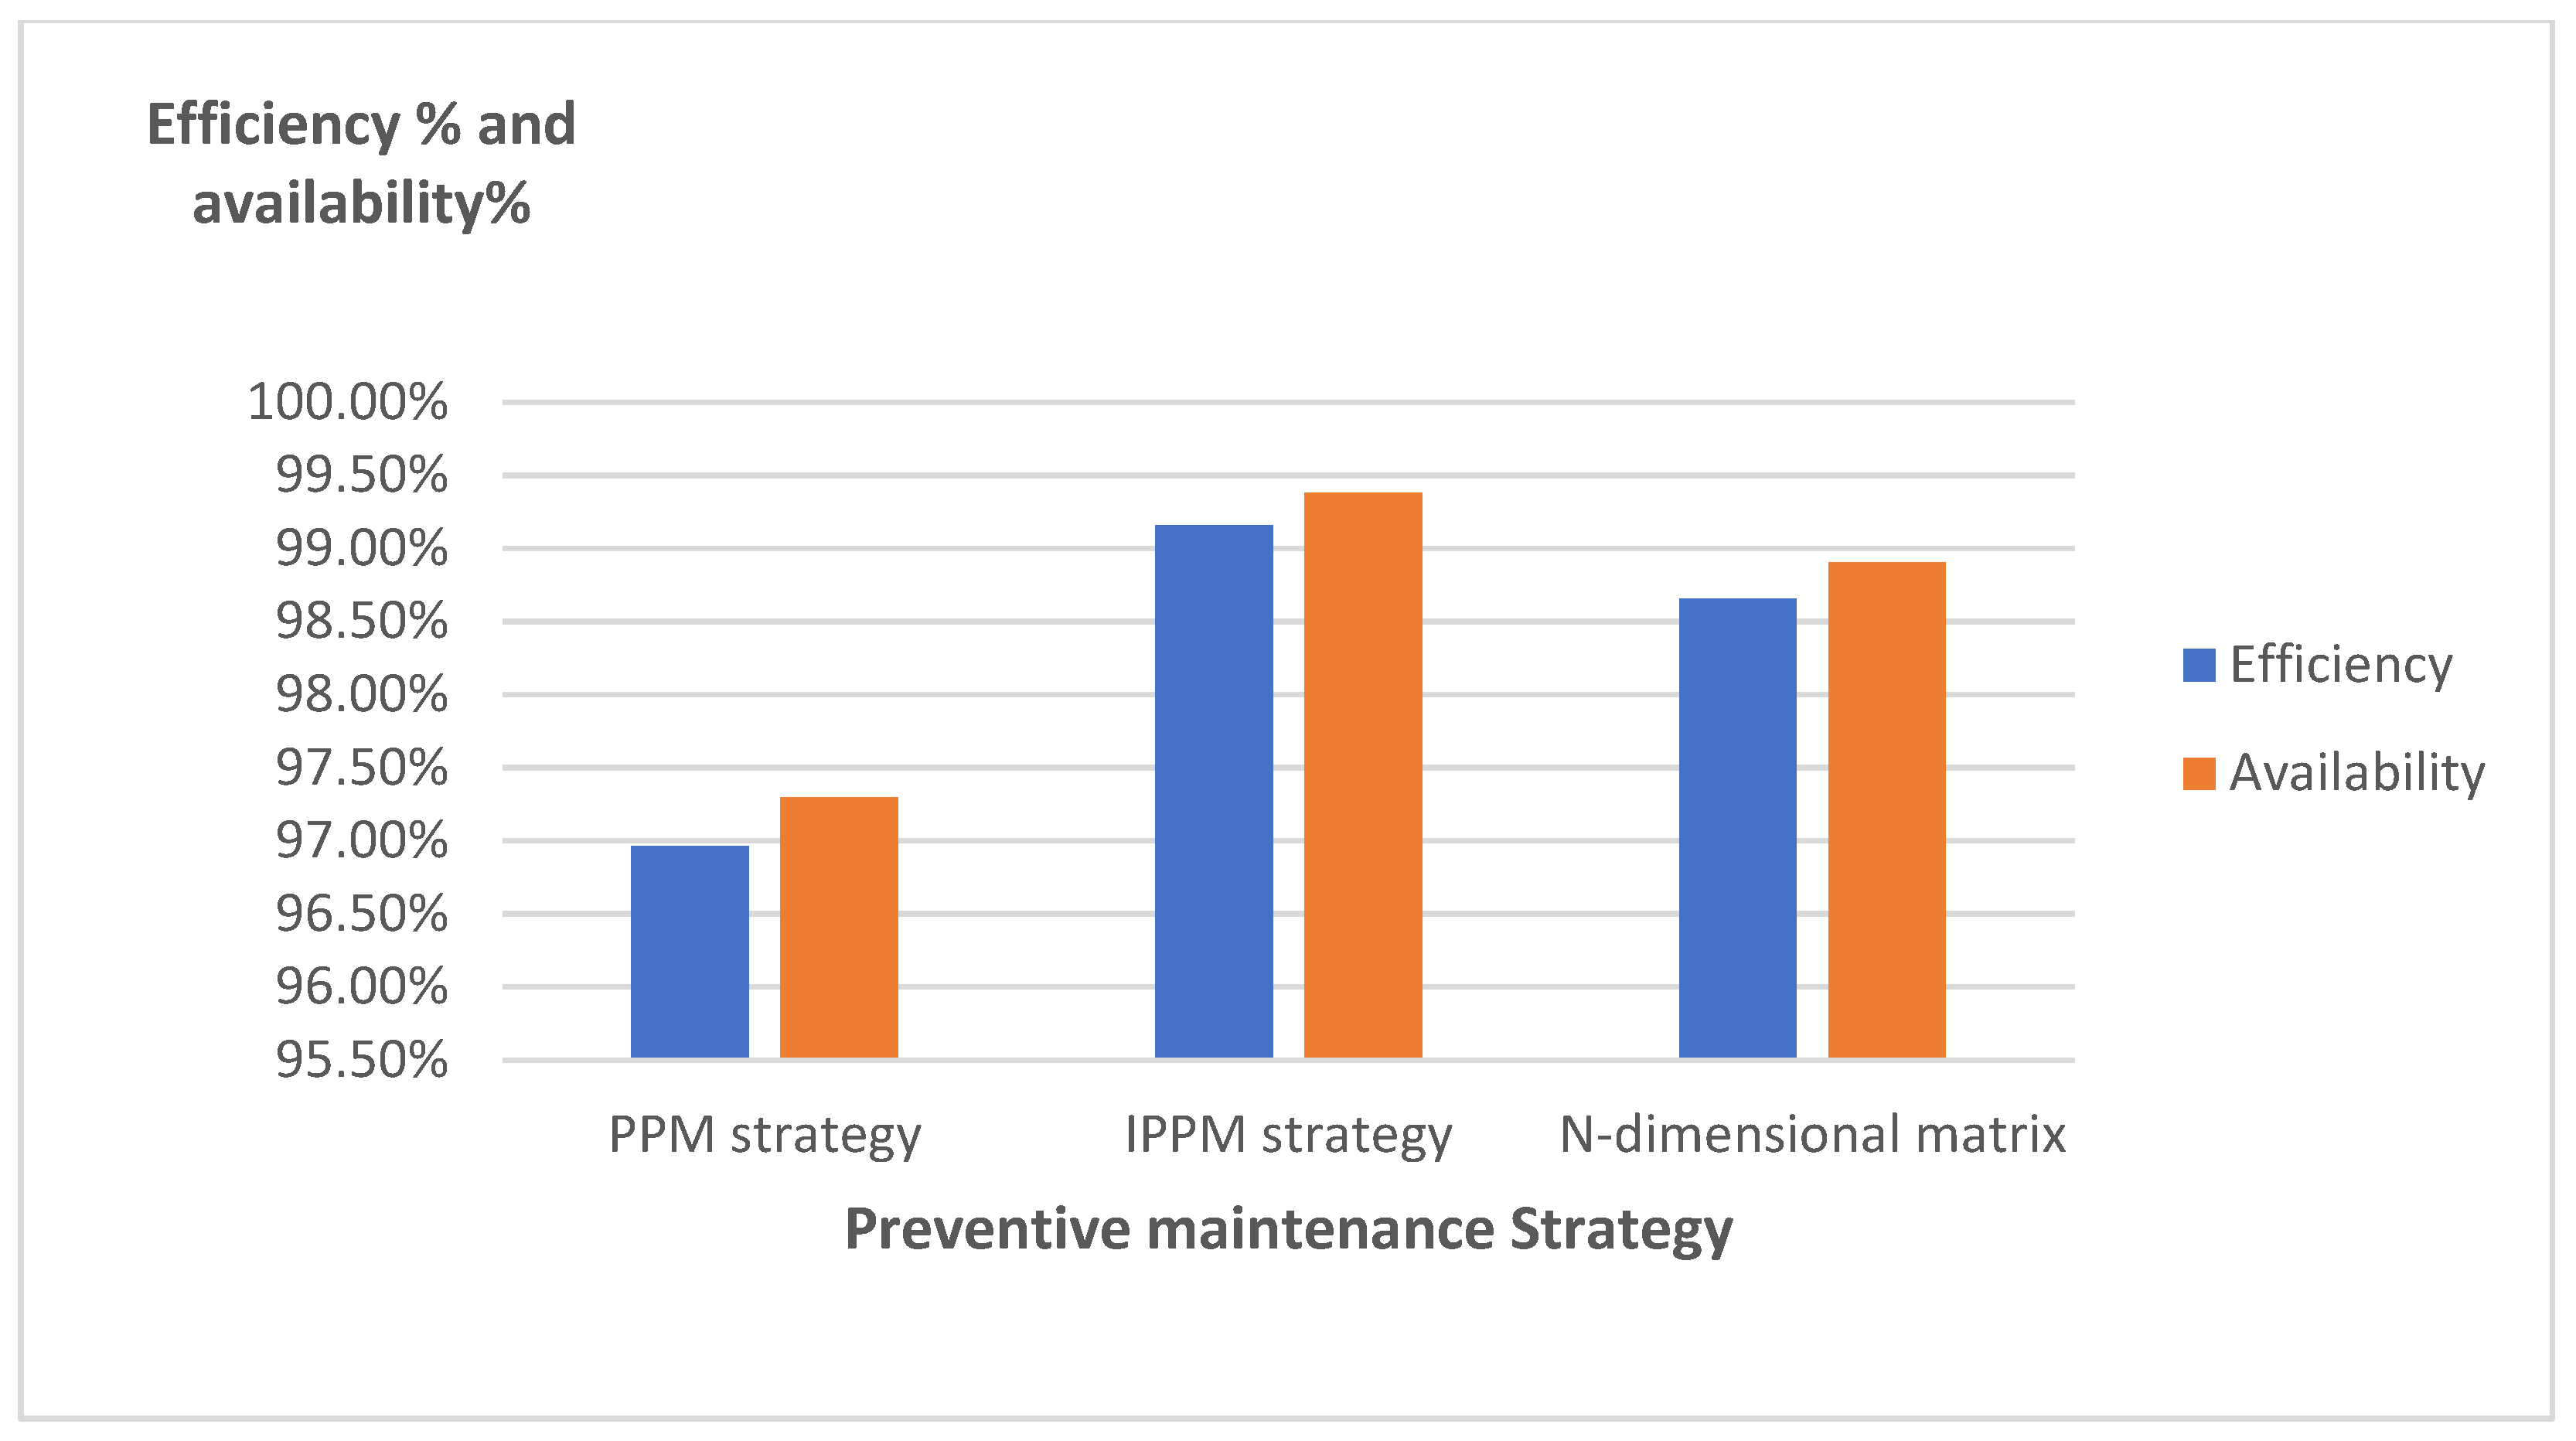
The comparison of combined average values for all the components by efficiency and availability is shown in
Figure 7.
The average values show that a mixed preventive maintenance strategy for the components in a machine is an efficient solution to reach reasonable values of efficiency and availability. The IPPM strategy provides better results for all the components but can increase the maintenance cost for the whole machine, due to PPM strategy does not need stock of components and IPPM strategy that needs stock for all the components (see the beginning of the
Section 3.4.2.).
5. Results Discussion
The results obtained showed an optimisation procedure to select the appropriate maintenance strategy for different components in a multistage machine.
Table 16 shows the efficiency and availability improvements comparing PPM and IPPM strategies for type of component.
For Electrical components, the possibility to not use IPPM strategy selected for a component that only needs PPM strategy is an improve of the global maintenance strategy for the machine. See maximum, minimum and average compared values of efficiency and availability in electrical components.
In the case of Electronic and Mechanical components, the IPPM application improves the efficiency and availability values; this is also demonstrated in Pneumatic components, with minor improvement values in efficiency.
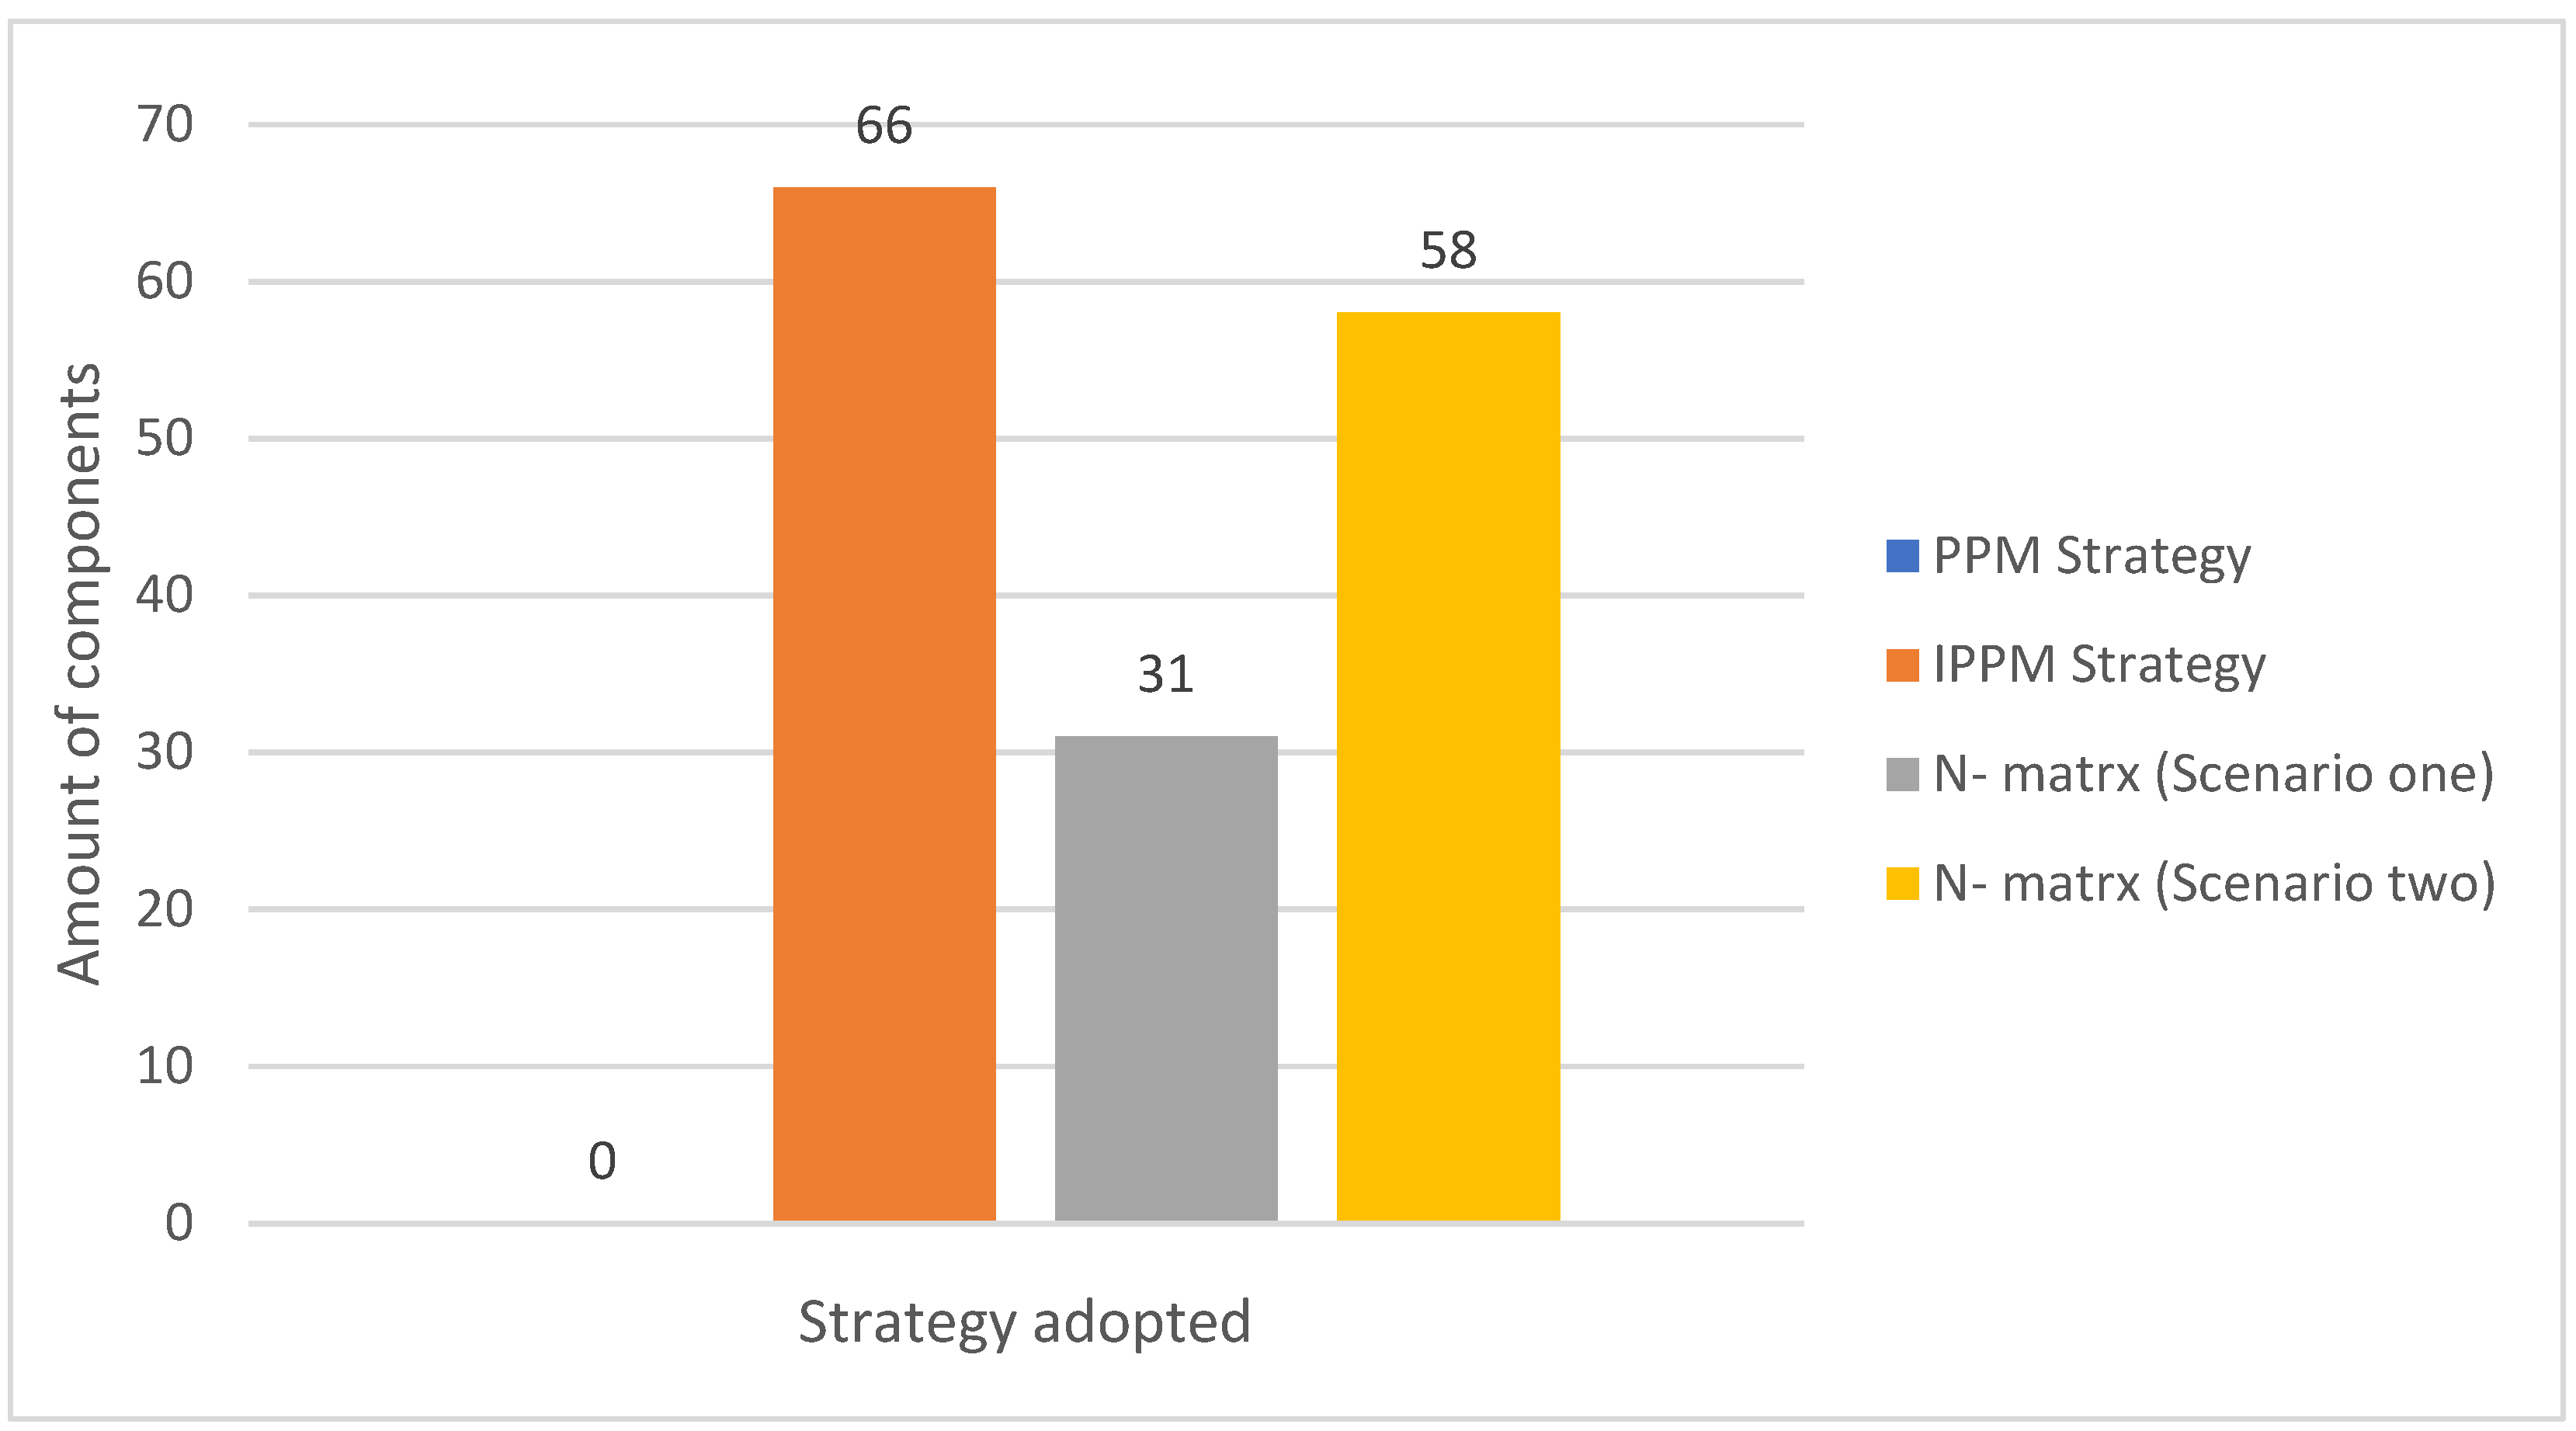
The application of
n dimensional matrix can reduce maintenance costs. In this machine, the application of different strategies for each component supposes a change in the number of components that require stock due to their strategy adopted.
Table 15 shows the maintenance strategy proposed for n-matrix.
Table 17 shows the number of each component used in the MSTM and then compares the number of those that need stock depending on their maintenance strategy adopted, PPM, IPPM and n-matrix. In the outlined comparison data, the authors use two scenarios with n-matrix:
Scenario one. The denominated “PPM to IPPM Interval“ used in
Table 15 is declined to PPM strategy, so the components do not need stock;
Scenario two. The denominated “PPM to IPPM Interval“ used in
Table 15 is declined to IPPM strategy, so the components need stock.
The application of n-matrix supposes a decrease in number of components that required stock due to the maintenance strategy adopted. According to
Table 17,
Figure 8 shows the global number of components that require stock due to their maintenance strategy.
Depending on the scenario adopted with n-matrix, the decrease in the number of components that require stock is between 12.12% and 53.03%. It is easy to understand that this decrease will mean decreases in maintenance costs.
Additionally, as
Figure 7 shows, the efficiency and availability ratios are maintained in higher values. For more understanding, the authors consider relevant the analysis of efficiency and availability values with the application of PPM, IPPM and n-dimensional matrix strategies as follows:
The comparison of PPM and n-dimensional matrix strategies, shown in
Figure 7, indicates an improve of 1.65% in efficiency and 1.6% in availability.
The comparison of IPPM and n-dimensional matrix strategies indicates a decrease of 0.51% in efficiency and 0.48% in availability.
The comparison of PPM and IPPM shows the higher average values, situated at 2.16% in efficiency and 2.08% in availability.
So, the decrease in values of efficiency and availability caused by the application of n-matrix compared with IPPM strategies allows for applying the n-dimensional matrix for the optimal strategy for each component.
The authors consider that the results shown in
Table 14 indicate that the KPI
1 and KPI
2, defined in
Section 3.5.1, suggest a precise cost study for the best decision making. This study can offer the negative impact of a component failure due to its main time to repair and line restart time, as a new dimension for the proposed matrix.
Table 15 shows a Maintenance Strategy called
PPM to IPPM Interval. For real case, a strategy PPM or IPPM must be selected for this component, so the authors consider important the cost analysis for this decision.
6. Conclusions
The preventive maintenance strategy for all the components of a multistage machine depends on the individual maintenance times and depends on the operation condition of each type of component. In this way, the definition of the Global Operation Condition (GOCi.) for each component allows for the study of the optimal preventive maintenance strategy used, PPM or IPPM.
The authors consider the application of the methodology used in this research relevant, step by step, for other industrial multistage or single machines, due to the fact that multistage and single machines need an appropriate preventive maintenance strategy for all their components.
Obtaining an n-dimensional matrix to select the best preventive maintenance strategy by type of component allows for maintaining a higher values of efficiency and availability for type of components. A minor decrease compared with IPPM strategy (see
Table 16) is offset by the decrease on stock cost. The end users of the industrial multistage or single machines always need information and procedures to applying the appropriate maintenance strategy, so this contribution allows them to fulfill that need.
The location of a component in the machine allows for knowing the Global Operation Condition (GOCi) depending on the individual maintenance times and makes it possible to find the same type of components with different preventive maintenance strategies proposed by the n-dimensional matrix. In this way, the results shown and discussed in this research can be interesting for the industrial machinery manufacturer, by the preliminary study of the optimal operation condition for each component of the machine.
For the preventive maintenance strategy, it is necessary to study the individual maintenance times as it shown in
Section 3.3. Additionally, the analysis of the individual values of TTPR, TLP, MTTR for each component allows for calculating the KPI’s used by the n-dimensional matrix. These KPIs are different, as shown in EN 15341:2007, but allow new results.
For a more precise decision with the
PPM to IPPM Interval maintenance strategy proposed by the n-dimensional matrix (see
Table 15), it will be interesting to study the cost of all the components as a new dimension of the matrix.
The authors consider the following future research:
With the applied methodology of this research and given the recent increase in materials costs, it is suggested to study the analysis of the impact and variation in the cost of the components to decide the best preventive maintenance strategy, using a new dimension n-dimensional matrix.
Selective study of the suitability of components with high TTPR in multistage machines significantly influences the efficiency and availability of the industrial multistage machine. This study can determinate the maximum TTPR to maintain the adequate preventive maintenance strategy and then suggest the possible change of the component for another with minor TTPR.
Application of n-dimensional matrix in other multistage industrial machines. Results and comparison of the same used methodology in this research.
Adding predictive maintenance strategy in n-dimensional matrix for undefined interval PPM and IPPM maintenance strategies.
Author Contributions
Conceptualisation, F.J.Á.G. and D.R.S.; methodology, F.J.Á.G.; validation, F.J.Á.G. and D.R.S.; formal analysis, F.J.Á.G.; investigation, F.J.Á.G. and D.R.S.; resources, F.J.Á.G.; writing-original draft preparation, F.J.Á.G.; writing-review and editing, F.J.Á.G. and D.R.S.; visualisation, F.J.Á.G.; supervision F.J.Á.G.; project administration, F.J.Á.G. and D.R.S.; funding acquisition, F.J.Á.G. and D.R.S. All authors have read and agreed to the published version of the manuscript.
Funding
This study has been carried out through the Research Project GR-18029 linked to the VI Regional Research and Innovation Plan of the Regional Government of Extremadura.
Institutional Review Board Statement
Not applicable.
Informed Consent Statement
Not applicable.
Data Availability Statement
Not applicable.
Acknowledgments
The authors wish to thank the European Regional Development Fund “Una manera de hacer Europa” for their support towards this research. This study has been carried out through the Research Project GR-21098 linked to the VI Regional Research and Innovation Plan of the Regional Government of Extremadura.
Conflicts of Interest
The authors declare no conflict of interest.
References
- Hoffmann Souza, M.L.; Da Costa, C.A.; Oliveira Ramos, G.D.; Da Rosa Righi, R. A survey on decision-making based on system reliability in the context of Industry 4.0. J. Manuf. Syst. 2020, 56, 133–156. [Google Scholar] [CrossRef]
- Colledani, M.; Tolio, T. Integrated quality, production logistics and maintenance analysis of multi-stage asynchronous manufacturing systems with degrading machines. CIRP Ann. Manuf. Technol. 2012, 61, 455–458. [Google Scholar] [CrossRef]
- Colledani, M.; Angius, A.; Yemane, A. Impact of condition-based maintenance policies on the service level of multi-stage manufacturing systems. Control Eng. Pract. 2018, 76, 65–78. [Google Scholar] [CrossRef]
- Wu, C.-H.; Yao, Y.-C.; Dauzère-Pérès, S.; Yu, C.-J. Dynamic dispatching and preventive maintenance for parallel machines with dispatching-dependent deterioration. Comput. Oper. Res. 2020, 113, 104779. [Google Scholar] [CrossRef]
- Colledani, M.; Magnanini, M.C.; Tolio, T. Imapct of opportunistic maintenance on manufacturing system performance. Manuf. Technol. 2018, 67, 499–502. [Google Scholar] [CrossRef]
- Colledani, M.; Angius, A.; Silipo, L.; Yemane, A. Impact of Preventive Maintenance on the Service Level of Multi-stage Manufacturing Systems with Degrading Machines. IFAC PapersOnLine 2016, 49, 568–573. [Google Scholar] [CrossRef]
- Lu, B.; Zhou, X. Opportunistic preventive maintenance scheduling for serial-parallel multistage manufacturing systems with multiple streams of deterioration. Reliab. Eng. Syst. Saf. 2017, 168, 116–127. [Google Scholar] [CrossRef]
- Azimpoor, S.; Taghipour, S.; Farmanesh, B.; Sharifi, M. Joint Planning of Production and Inspection od parallel Machines with two-phase of Failure. Reliab. Eng. Syst. Saf. 2022, 217, 108097. [Google Scholar] [CrossRef]
- Ruiz-Hernández, D.; Pinar-Pérez, J.M.; Delgado-Gómez, D. Multi-machine preventive maintenance scheduling with imperfect interventions: A restless bandit approach. Comput. Oper. Res. 2020, 119, 104927. [Google Scholar] [CrossRef]
- Wang, J.; Han, H.; Zhang, Y.; Bai, G. Modelling the varying effects of shocks for a multi-stage degradation process. Reliab. Eng. Syst. Saf. 2021, 215, 107925. [Google Scholar] [CrossRef]
- Farahani, A.; Tohidi, H. Integrated optimization of quality and maintenance. A literature review. Comput. Ind. Eng. 2021, 151, 16924. [Google Scholar] [CrossRef]
- Resaei-Malek, M.; Siadat, A.; Dantan, J.Y.; Tavakkoli-Moghaddam, R. An approximation Approach for a Integrated Part Quality Inspection and Preventive maintenance Planning in a Nonlinear Deteriorating Serial Multi-stage Manufacturing System. IFAC PapersOnLine 2018, 51, 270–275. [Google Scholar] [CrossRef]
- He, Y.; Liu, F.; Cui, J.; Han, X.; Zhao, Y.; Chen, Z.; Zhou, D.; Zhang, A. Reliability-oriented design of integrated model of preventive maintenance and quality control policy with time-between-events control chart. Comput. Ind. Eng. 2019, 129, 228–238. [Google Scholar] [CrossRef]
- Wang, K.; Yin, Y.; Du, S.; Xi, L. Variation management key control characteristics in multistage machining processes considering quality-cost equilibrium. J. Manuf. Syst. 2021, 59, 441–452. [Google Scholar] [CrossRef]
- Bouslah, B.; Gharbi, A.; Pellerin, R. Joint production, quality and maintenance control of two-machine line subject to operation-dependent and quality-dependent failures. Int. J. Prod. Econ. 2018, 195, 210–226. [Google Scholar] [CrossRef]
- Lu, B.; Zhou, X. Quality and reliability oriented maintenance for multistage manufacturing systems to condition monitoring. J. Manuf. Syst. 2019, 52, 76–85. [Google Scholar] [CrossRef]
- Huang, Z.; Zheng, Q.P. A multistage stochastic programming approach for preventive maintenance scheduling of GENCOs with natural gas contract. Eur. J. Oper. Res. 2020, 287, 1036–1051. [Google Scholar] [CrossRef]
- Cao, Y. Modeling the effects of dependence between competing failure processes on the condition-base preventive maintenance policy. Appl. Math. Model. 2021, 99, 400–417. [Google Scholar] [CrossRef]
- Ye, Y.; Grossmann, I.E.; Pinto, J.M.; Ramaswamy, S. Integrated optimization of design, storage sizing, and maintenance policy as a Markov decision process considering varying failure rates. Comput. Chem. Eng. 2020, 142, 107052. [Google Scholar] [CrossRef]
- Cheng, Z.; Qing, C.; Arinez, J. Data-Enabled Modelling and Analysis of Multistage Manufacturing Systems with Quality Rework Loops. J. Manuf. Syst. 2020, 56, 573–584. [Google Scholar] [CrossRef]
- Zhang, Z.; Tang, Q. Integrating flexible preventive maintenance activities into two-stage assembly flow shop scheduling with multiple assembly machines. Comput. Ind. Eng. 2021, 159, 107493. [Google Scholar] [CrossRef]
- Yu, T.-S.; Han, J.-H. Scheduling proporcionate flow shops with preventive machine maintenance. Int. J. Prod. Econ. 2021, 231, 107874. [Google Scholar] [CrossRef]
- Ghaleb, M.; Taghipour, S.; Sharifi, M.; Zolfagharinia, H. Integrated production and maintenance scheduling for a single machine with deterioration-based failures. Comput. Ind. Eng. 2020, 143, 16432. [Google Scholar] [CrossRef]
- Duffuaa, S.; Kolus, A.; Al-Turki, U.; El-Khalifa, A. An integrated model of production scheduling, maintenance and quality for a single machine. Comput. Ind. Eng. 2020, 142, 106239. [Google Scholar] [CrossRef]
- Panagiotis, H.T.; Atvanitoyannis, I.S.; Varzakas, T.H. Reliability and maintainability analysis of cheese (feta) production line in a Greek medium-size company: A case Study. J. Food Eng. 2009, 94, 233–240. [Google Scholar] [CrossRef]
- Rahmati, S.H.A.; Ahmadi, A.; Karimi, B. Developing simulation-based optimization mechanism for a novel stochastic reliability centered maintenance problem. Trans. E Ind. Eng. 2018, 25, 2788–2806. [Google Scholar] [CrossRef] [Green Version]
- Niu, G.-C.; Wang, Y.; Hu, Z.; Zhao, Q.; Hu, D.-M. Application of AHP and EJE in reliability Analysis of Complex production Lines Systems. Math. Probl. Eng. 2019, 2019, 7238785. [Google Scholar] [CrossRef] [Green Version]
- Jiři, D.; Tuhý, T.; Jančíková, Z.K. Method for optimizing maintenance location within the industrial plant. Int. Sci. J. Logist. 2019, 6, 55–62. [Google Scholar] [CrossRef]
- Liberopoulos, G.; Tsarouhas, P. Reliability analysis of an automated pizza production line. J. Food Eng. 2005, 69, 79–96. [Google Scholar] [CrossRef]
- Wang, N.; Ren, S.; Liu, Y.; Yang, M.; Wang, J.; Huisingh, D. An active preventive maintenance approach of complex equipment based on novel product-service system operation mode. J. Clean. Prod. 2020, 177, 123365. [Google Scholar] [CrossRef]
- Gharbi, A.; Kenne, J.-P.; Beit, M. Optimal safety stocks and preventive maintenance periods in unreliable manufacturing systems. Int. J. Prod. Econ. 2007, 107, 422–434. [Google Scholar] [CrossRef] [Green Version]
- Ait El Cadi, A.; Gahrbi, A.; Dhouib, K.; Artiba, A. Joint production and preventive maintenance controls for unreliable and imperfect manufacturing systems. J. Manuf. Syst. 2021, 58, 263–279. [Google Scholar] [CrossRef]
- Yang, H.; Li, W.; Wang, B. Joint optimization of preventive maintenance and production scheduling for multi-stage production systems based on reinforcement learning. Reliab. Eng. Syst. Saf. 2021, 214, 107713. [Google Scholar] [CrossRef]
- García, F.J.Á.; Salgado, D.R. Maintenance Strategies for Industrial Multi-Stage Machines: The study of a Thermoforming Machine. Sensors 2021, 21, 6809. [Google Scholar] [CrossRef] [PubMed]
- Ferreira, S.; Silva, F.J.G.; Casais, R.B.; Pereira, M.T.; Ferreira, L.P. KPI development and obsolescence management in industrial maintenance. Procedia Manuf. 2019, 38, 1427–1435. [Google Scholar] [CrossRef]
- Webstore International Electrotechnical Commission. Available online: https://webstore.iec.ch/publication/64485 (accessed on 21 April 2021).
Figure 1.
A multistage thermoforming machine of 6 terrines per cycle and its type of components.
Figure 1.
A multistage thermoforming machine of 6 terrines per cycle and its type of components.
Figure 2.
Subprocess in the studied MSTM.
Figure 2.
Subprocess in the studied MSTM.
Figure 3.
Average efficiency and availability values in % by type of component with the PPM strategy.
Figure 3.
Average efficiency and availability values in % by type of component with the PPM strategy.
Figure 4.
Maximum and minimum efficiency and availability values in % by type of component with the PPM strategy.
Figure 4.
Maximum and minimum efficiency and availability values in % by type of component with the PPM strategy.
Figure 5.
Average efficiency and availability values in % by component type with the IPPM strategy.
Figure 5.
Average efficiency and availability values in % by component type with the IPPM strategy.
Figure 6.
Maximum and minimum efficiency and availability values in % by component type with the IPPM strategy.
Figure 6.
Maximum and minimum efficiency and availability values in % by component type with the IPPM strategy.
Figure 7.
Comparison of mixed average values in applying the PPM strategy, the IPPM strategy and the n-dimensional matrix preventive maintenance proposal.
Figure 7.
Comparison of mixed average values in applying the PPM strategy, the IPPM strategy and the n-dimensional matrix preventive maintenance proposal.
Figure 8.
Comparison of the global number of components that require stock due to the maintenance strategy adopted.
Figure 8.
Comparison of the global number of components that require stock due to the maintenance strategy adopted.
Table 1.
Electrical components in the studied MSTM with failure source and event.
Table 1.
Electrical components in the studied MSTM with failure source and event.
| Component | Failure Source | Failure Event |
|---|
| Master power switch | Ambient condition, Power supplier event | Stop |
| Plug-in relay | Ambient condition, Power supplier event, Unexpected hit | Malfunction |
| Command and signalling | Ambient condition, Power supplier event | Stop |
| Safety limit switch | Ambient condition, Power supplier event, Unexpected hit | Stop |
Table 2.
Electronic components in the studied MSTM with failure source and event.
Table 2.
Electronic components in the studied MSTM with failure source and event.
| Component | Failure Source | Failure Event |
|---|
| PLC | Ambient condition, Power supplier event | Stop |
| HMI | Ambient condition, Power supplier event | Stop |
| Chromatic sensor | Ambient condition, Power supplier event | Stop |
| Safety relay | Ambient condition, Power supplier event | Stop |
| Temperature controller | Ambient condition, Power supplier event, Unexpected hit | Stop |
| Solid-state relay | Ambient condition, Power supplier event | Stop |
| Frecuency inverter | Ambient condition, Power supplier event | Malfunction |
| Pressure sensor | Pressure failure, Global fatigue | Malfunction |
| Servo drive peristaltic pump | Ambient condition, Power supplier event | Stop |
| Absolute encoder | Ambient condition, Power supplier event, Unexpected hit | Malfunction |
Table 3.
Mechanical components in the studied MSTM with failure source and event.
Table 3.
Mechanical components in the studied MSTM with failure source and event.
| Component | Failure Source | Failure Event |
|---|
| Safety button | Ambient condition, Power supplier event | Stop |
| Thermal resistance | Ambient condition, Power supplier event | Malfunction |
| Thermocouple sensor | Global fatigue | Malfunction |
| Motor belt | Ambient condition, Power supplier event | Stop |
| Bronze cap | Global fatigue | Malfunction |
| Linear axis | Global fatigue | Malfunction |
| Linear bearing | Global fatigue | Malfunction |
| Peristaltic pump | Ambient condition, Power supplier event | Stop |
| Terrine cutter | Global fatigue | Malfunction |
Table 4.
Pneumatic components in the studied MSTM with failure source and event.
Table 4.
Pneumatic components in the studied MSTM with failure source and event.
| Component | Failure Source | Failure Event |
|---|
| Pneumatic valve | Ambient condition, Power supplier event, Global fatigue, Pressure failure | Malfunction |
| Pneumatic cylinder | Ambient condition, Power supplier event, Global fatigue, Pressure failure, Failure pneumatic valve | Malfunction |
Table 5.
Type of operation conditions for temperature, humidity and IK.
Table 5.
Type of operation conditions for temperature, humidity and IK.
| Type of Operation Condition | Temperature | Humidity | IK Rating |
|---|
| A | Outdoor and ventilated situation | Indoor with appropriate IP | Indoor and mechanically
protected |
| B | Indoor and ventilated situation | Outdoor with appropriate IP | Outdoor and protected against mechanical shock |
| C | Indoor and non-ventilated
situation | Outdoor with not appropriate IP | Outdoor and not protected against mechanical shock |
Table 6.
Electrical components times in seconds. Efficiency and availability calculated in % with PPM strategy.
Table 6.
Electrical components times in seconds. Efficiency and availability calculated in % with PPM strategy.
| Component | MTTR | TTPR | MTTF | TLP | Efficiency | Availability |
|---|
| Master power switch | 14,400 | 10,800 | 9,999,999 | 28,800 | 99.71% | 99.86% |
| Plug-in relay | 14,400 | 10,800 | 4,999,999.5 | 28,800 | 99.43% | 99.71% |
| Command and signalling | 14,400 | 10,800 | 4,999,999.5 | 28,800 | 99.43% | 99.71% |
| Safety limit switch | 14,400 | 10,800 | 9,999,999 | 28,800 | 99.71% | 99.86% |
Table 7.
Electronic components times in seconds. Efficiency and availability calculated in % with PPM strategy.
Table 7.
Electronic components times in seconds. Efficiency and availability calculated in % with PPM strategy.
| Component | MTTR | TTPR | MTTF | TLP | Efficiency | Availability |
|---|
| PLC | 435,600 | 345,600 | 9,999,999 | 450,000 | 95.69% | 95.99% |
| HMI | 435,600 | 345,600 | 9,999,999 | 450,000 | 95.69% | 95.99% |
| Chromatic sensor | 176,520 | 172,800 | 4,999,999.5 | 190,920 | 96.31% | 96.70% |
| Safety relay | 14,400 | 10,800 | 9,999,999 | 28,800 | 99.71% | 99.86% |
| Temperature controller | 435,600 | 345,600 | 9,999,999 | 450,000 | 95.69% | 95.99% |
| Solid-state relay | 176,400 | 172,800 | 4,999,999.5 | 190,800 | 96.31% | 96.70% |
| Frecuency inverter | 435,600 | 345,600 | 9,999,999 | 450,000 | 95.69% | 95.99% |
| Pressure sensor | 176,700 | 172,800 | 4,999,999.5 | 191,100 | 96.31% | 96.70% |
| Servo drive peristaltic pump | 435,600 | 345,600 | 9,999,999 | 450,000 | 95.69% | 95.99% |
| Absolute encoder | 360,000 | 172,800 | 4,999,999.5 | 374,400 | 93.01% | 93.71% |
Table 8.
Mechanical components times in seconds. Efficiency and availability calculated in % with PPM strategy.
Table 8.
Mechanical components times in seconds. Efficiency and availability calculated in % with PPM strategy.
| Component | MTTR | TTPR | MTTF | TLP | Efficiency | Availability |
|---|
| Safety button | 14,400 | 10,800 | 9,999,999 | 28,800 | 99.71% | 99.86% |
| Thermal resistance | 25,500 | 10,800 | 3,700,800 | 39,900 | 98.93% | 99.32% |
| Thermocouple sensor | 14,700 | 10,800 | 3,700,800 | 29,100 | 99.22% | 99.61% |
| Motor belt | 187,200 | 172,800 | 4,999,999.5 | 201,600 | 96.11% | 96.52% |
| Bronze cap | 288,000 | 172,800 | 7,750,000 | 302,400 | 96.24% | 96.54% |
| Linear axis | 288,000 | 172,800 | 7,625,000 | 302,400 | 96.18% | 96.49% |
| Linear bearing | 288,000 | 172,800 | 7,500,000 | 302,400 | 96.12% | 96.43% |
| Peristaltic pump | 547,200 | 518,400 | 4,999,999.5 | 561,600 | 89.88% | 91.02% |
| Terrine cutter | 288,000 | 172,800 | 9,999,999 | 302,400 | 97.06% | 97.28% |
Table 9.
Pneumatic components times in seconds. Efficiency and availability calculated in % with PPM strategy.
Table 9.
Pneumatic components times in seconds. Efficiency and availability calculated in % with PPM strategy.
| Component | MTTR | TTPR | MTTF | TLP | Efficiency | Availability |
|---|
| Pneumatic valve | 176,400 | 172,800 | 9,999,999 | 190,800 | 98.13% | 98.30% |
| Pneumatic cylinder | 176,400 | 172,800 | 9,999,999 | 190,800 | 98.13% | 98.30% |
Table 10.
Electrical component times in seconds. Efficiency and availability calculated in % with the IPPM strategy.
Table 10.
Electrical component times in seconds. Efficiency and availability calculated in % with the IPPM strategy.
| Component | MTTR | TTPR | MTTF | TLP | Efficiency | Availability |
|---|
| Master power switch | 3900 | 300 | 9,999,999 | 18,300 | 99.82% | 99.96% |
| Plug-in relay | 3900 | 300 | 4,999,999.5 | 18,300 | 99.63% | 99.92% |
| Command and signalling | 3900 | 300 | 4,999,999.5 | 18,300 | 99.63% | 99.92% |
| Safety limit switch | 3900 | 300 | 9,999,999 | 18,300 | 99.82% | 99.96% |
Table 11.
Electronic component times in seconds. Efficiency and availability calculated in % with IPPM strategy.
Table 11.
Electronic component times in seconds. Efficiency and availability calculated in % with IPPM strategy.
| Component | MTTR | TTPR | MTTF | TLP | Efficiency | Availability |
|---|
| PLC | 90,300 | 300 | 9,999,999 | 104,700 | 98.96% | 99.11% |
| HMI | 90,300 | 300 | 9,999,999 | 104,700 | 98.96% | 99.11% |
| Chromatic sensor | 4020 | 300 | 4,999,999.5 | 18,420 | 99.63% | 99.92% |
| Safety relay | 3900 | 300 | 9,999,999 | 18,300 | 99.82% | 99.96% |
| Temperature controller | 90,300 | 300 | 9,999,999 | 104,700 | 98.96% | 99.11% |
| Solid-state relay | 3900 | 300 | 4,999,999.5 | 18,300 | 99.63% | 99.92% |
| Frecuency inverter | 90,300 | 300 | 9,999,999 | 104,700 | 98.96% | 99.11% |
| Pressure sensor | 4200 | 300 | 4,999,999.5 | 18,600 | 99.63% | 99.92% |
| Servo drive peristaltic pump | 90,300 | 300 | 9,999,999 | 104,700 | 98.96% | 99.11% |
| Absolute encoder | 187,500 | 300 | 4,999,999.5 | 201,900 | 96.11% | 96.51% |
Table 12.
Mechanical component times in seconds. Efficiency and availability calculated in % with the IPPM strategy.
Table 12.
Mechanical component times in seconds. Efficiency and availability calculated in % with the IPPM strategy.
| Component | MTTR | TTPR | MTTF | TLP | Efficiency | Availability |
|---|
| Safety button | 3900 | 300 | 9,999,999 | 18,300 | 99.82% | 99.96% |
| Thermal resistance | 15,000 | 300 | 3,700,800 | 29,400 | 99.21% | 99.60% |
| Thermocouple sensor | 4200 | 300 | 3,700,800 | 18,600 | 99.50% | 99.89% |
| Motor belt | 14,700 | 300 | 4,999,999.5 | 29,100 | 99.42% | 99.71% |
| Bronze cap | 115,500 | 300 | 7,750,000 | 129,900 | 98.35% | 98.55% |
| Linear axis | 115,500 | 300 | 7,625,000 | 129,000 | 98.32% | 98.53% |
| Linear bearing | 115,500 | 300 | 7,500,000 | 129,900 | 98.29% | 98.51% |
| Peristaltic pump | 29,100 | 300 | 4,999,999.5 | 43,500 | 99.14% | 99.42% |
| Terrine cutter | 115,500 | 300 | 9,999,999 | 129,900 | 98.72% | 98.87% |
Table 13.
Pneumatic component times in seconds. Efficiency and availability calculated in % with the IPPM strategy.
Table 13.
Pneumatic component times in seconds. Efficiency and availability calculated in % with the IPPM strategy.
| Component | MTTR | TTPR | MTTF | TLP | Efficiency | Availability |
|---|
| Pneumatic valve | 3900 | 300 | 9,999,999 | 18,300 | 99.82% | 99.96% |
| Pneumatic cylinder | 3900 | 300 | 9,999,999 | 18,300 | 99.82% | 99.96% |
Table 14.
N-dimensional matrix for preventive maintenance selection in MSTM.
Table 14.
N-dimensional matrix for preventive maintenance selection in MSTM.
| Type of Component | KPI | Operation Condition |
|---|
| ABB | ABC | ACB | ACC | BAA | CAA |
| Electrical | KPI1 > 25% KPI2 < 70% | II | III | II | III | II | II |
| KPI1 < 25% | I | II | II | II | I | II |
| KPI2 > 70% | III | III | III | III | III | III |
| Electronic | KPI1 > 25% KPI2 < 70% | II | III | III | III | II | III |
| KPI1 < 25% | II | III | II | III | II | III |
| KPI2 > 70% | III | III | III | III | III | III |
| Mechanical | KPI1 > 25% KPI2 < 70% | II | III | II | III | II | III |
| KPI1 < 25% | I | III | I | III | I | III |
| KPI2 > 70% | III | III | III | III | III | III |
| Pneumatic | KPI1 > 25% KPI2 < 70% | II | III | III | III | III | III |
| KPI1 < 25% | II | III | II | III | III | III |
| KPI2 > 70% | III | III | III | III | III | III |
Table 15.
Results and comparison of the application of n-dimensional matrix for maintenance strategy decision.
Table 15.
Results and comparison of the application of n-dimensional matrix for maintenance strategy decision.
| | PPM Strategy | IPPM Strategy | N-MATRIX PROPOSAL |
|---|
| Component | Efficiency | Availability | Efficiency | Availability | Efficiency | Availability | Maintenance Strategy |
|---|
| Master power switch | 99.71% | 99.86% | 99.82% | 99.96% | 99.71% | 99.86% | PPM |
| PLC | 95.69% | 95.99% | 98.96% | 99.11% | 98.96% | 99.11% | IPPM |
| HMI | 95.69% | 95.99% | 98.96% | 99.11% | 98.96% | 99.11% | IPPM |
| Chromatic sensor | 96.31% | 96.70% | 99.63% | 99.92% | 99.63% | 99.92% | IPPM |
| Plug-in relay | 99.43% | 99.71% | 99.63% | 99.92% | 99.43% | 99.71% | PPM |
| Command and signalling | 99.43% | 99.71% | 99.63% | 99.92% | 99.43% | 99.71% | PPM |
| Safety limit switch | 99.71% | 99.86% | 99.82% | 99.96% | 99.71% | 99.86% | PPM |
| Safety relay | 99.71% | 99.86% | 99.82% | 99.96% | 99.71% | 99.86% | PPM |
| Safety button | 99.71% | 99.86% | 99.82% | 99.96% | 99.71% | 99.86% | PPM |
| Temperature controller | 95.69% | 95.99% | 98.96% | 99.11% | 98.96% | 99.11% | IPPM |
| Solid-state relay | 96.31% | 96.70% | 99.63% | 99.92% | 99.63% | 99.92% | IPPM |
| Thermal resistance | 98.93% | 99.32% | 99.21% | 99.60% | 98.93% | 99.32% | Interval PPM to IPPM |
| Thermocouple sensor | 99.22% | 99.61% | 99.50% | 99.89% | 99.22% | 99.61% | Interval PPM to IPPM |
| Frequency inverter | 95.69% | 95.99% | 98.96% | 99.11% | 98.96% | 99.11% | IPPM |
| Motor belt | 96.11% | 96.52% | 99.42% | 99.71% | 99.42% | 99.71% | IPPM |
| Bronze cap | 96.24% | 96.54% | 98.35% | 98.55% | 96.24% | 96.54% | PPM to IPPM Interval |
| Linear axis | 96.18% | 96.49% | 98.32% | 98.53% | 96.18% | 96.49% | PPM to PPM Interval |
| Linear bearing | 96.12% | 96.43% | 98.29% | 98.51% | 96.12% | 96.43% | PPM to PPM Interval |
| Pneumatic valve | 98.13% | 98.30% | 99.82% | 99.96% | 99.82% | 99.96% | IPPM |
| Pneumatic cylinder | 98.13% | 98.30% | 99.82% | 99.96% | 99.82% | 99.96% | IPPM |
| Pressure sensor | 96.31% | 96.70% | 99.63% | 99.92% | 99.63% | 99.92% | IPPM |
| Servo drive peristaltic pump | 95.69% | 95.99% | 98.96% | 99.11% | 98.96% | 99.11% | IPPM |
| Peristaltic pump | 89.88% | 91.02% | 99.14% | 99.42% | 99.14% | 99.42% | IPPM |
| Terrine cutter | 97.06% | 97.28% | 98.72% | 98.87% | 97.06% | 97.28% | PPM to IPPM Interval |
| Absolute encoder | 93.01% | 93.71% | 96.11% | 96.51% | 93.01% | 93.71% | PPM to IPPM Interval |
Table 16.
Efficiency and availability improvements comparing PPM and IPPM strategies for type of component.
Table 16.
Efficiency and availability improvements comparing PPM and IPPM strategies for type of component.
Type of
Component | Efficiency
Maximum % | Efficiency
Minimum % | Availability
Maximum % | Availability
Minimum % | Efficiency Average | Availability Average |
|---|
| Electrical | 0.10% | 0.21% | 0.10% | 0.21% | 0.16% | 0.16% |
| Electronic | 0.10% | 3.09% | 0.10% | 2.81% | 2.95% | 2.82% |
| Mechanical | 0.10% | 8.42% | 0.10% | 7.48% | 2.37% | 2.22% |
| Pneumatic | 1.69% | 1.69% | 1.66% | 1.66% | 1.69% | 1.66% |
Table 17.
Comparing the number of type of components that require stock due to the maintenance strategy adopted.
Table 17.
Comparing the number of type of components that require stock due to the maintenance strategy adopted.
| Number of Type Component | Component | Number of Components Who Require Stock due to Their Maintenance Strategy Adopted |
|---|
| PPM Strategy | IPPM Strategy | N-Matrix (Scenario One) | N-Matrix (Scenario Two) |
| 1 | Master power switch | 0 | 1 | 0 | 0 |
| 1 | PLC | 0 | 1 | 1 | 1 |
| 1 | HMI | 0 | 1 | 1 | 1 |
| 1 | Chromatic sensor | 0 | 1 | 1 | 1 |
| 3 | Plug-in relay | 0 | 3 | 0 | 0 |
| 1 | Command and signalling | 0 | 1 | 0 | 0 |
| 1 | Safety limit switch | 0 | 1 | 0 | 0 |
| 1 | Safety relay | 0 | 1 | 0 | 0 |
| 1 | Safety button | 0 | 1 | 0 | 0 |
| 4 | Temperature controller | 0 | 4 | 4 | 4 |
| 4 | Solid state relay | 0 | 4 | 4 | 4 |
| 4 | Thermal resistance | 0 | 4 | 0 | 4 |
| 4 | Thermocouple sensor | 0 | 4 | 0 | 4 |
| 2 | Frequency inverter | 0 | 2 | 2 | 2 |
| 2 | Motor Belt | 0 | 2 | 2 | 2 |
| 8 | Bronze cap | 0 | 8 | 0 | 8 |
| 1 | Linear axis | 0 | 1 | 0 | 1 |
| 8 | Linear bearing | 0 | 8 | 0 | 8 |
| 4 | Pneumatic valve | 0 | 4 | 4 | 4 |
| 6 | Pneumatic cylinder | 0 | 6 | 6 | 6 |
| 2 | Pressure sensor | 0 | 2 | 2 | 2 |
| 1 | Servo drive peristaltic pump | 0 | 1 | 1 | 1 |
| 3 | Peristaltic pump | 0 | 3 | 3 | 3 |
| 1 | Terrine cutter | 0 | 1 | 0 | 1 |
| 1 | Absolute encoder | 0 | 1 | 0 | 1 |
| Publisher’s Note: MDPI stays neutral with regard to jurisdictional claims in published maps and institutional affiliations. |
© 2022 by the authors. Licensee MDPI, Basel, Switzerland. This article is an open access article distributed under the terms and conditions of the Creative Commons Attribution (CC BY) license (https://creativecommons.org/licenses/by/4.0/).


