1. Introduction
Common bone diseases in the human body generally include bone trauma (fracture) caused by accidents; congenital bone deformities; and acquired osteoarthritis, osteoporosis, bone tumors, etc. [
1,
2]. These bone diseases are difficult to recover through self-healing and usually require surgical repair or replacement. According to statistics, hundreds of millions of residents in my country are affected by skeletal diseases to varying degrees, and with the aging of the population and traffic accidents increase, people’s demand for human bone replacement surgery is also increasing [
3].
Usually, after a patient receives an allogeneic tissue or organ transplant, the patient’s own immune system considers the transplanted foreign tissue or organ as an “alien component”, and carries out immune responses such as attacking, destroying and clearing the implant. This poses a great threat to the patient’s safety, and also affects the normal operation of the implant. Therefore, it is a necessary condition to select a material with good biocompatibility as the implant. At present, metals such as titanium alloys, magnesium alloys, and stainless steel have been widely used in clinical human bone replacement surgery, such as artificial spine, artificial joints, and dental implants [
4,
5,
6].
In the actual application of bone implants, since the elastic modulus of metal materials is higher than that of human bones, it is easy to produce a stress-shielding phenomenon on the contact surface of bone implants and human bones, thereby hindering the transmission of load and causing bone stress absorption around the bone implant, which eventually leads to loosening or fracture of the bone implant [
7,
8]. In order to solve the above problems, scientists have proposed a method of introducing pores into metal materials. Compared with traditional dense materials, porous metal materials are closer to the strength and elastic modulus of human bones, which can alleviate the “stress shielding” phenomenon and increase the service life of bone implants [
9,
10]. In addition, the design of the porous structure is conducive to the adhesion, proliferation and differentiation of human bone cells, thereby promoting the formation of biological fixation between the bone implant and the human bone to improve the strength of osseointegration and can promote the transmission of body fluids and nutrients in the pores, thereby promoting the regeneration and reconstruction of human bone tissue [
11,
12].
Because the morphology of human bones is highly personalized, the use of traditional processing methods can easily cause mismatch between porous bone implants and human bones, which affects the treatment effect; the preparation cycle is long, and the migration is weak [
13]. With the rapid development of additive manufacturing (AM) technology, the manufacture of porous bone implants has become possible, and selective laser melting [
14] (SLM) technology, as a kind of additive manufacturing technology, has been widely used in the research field of medical biological bones. Compared with traditional porous metal preparation methods, SLM technology can effectively control the pore size, porosity and pore distribution of porous bone implants, and has high processing efficiency, a short production cycle, and high precision of molded parts; therefore, SLM technology is particularly suitable for the personalized customization of porous bone implants and is one of the most promising technologies in additive manufacturing technology [
15,
16]. However, when using SLM technology to print metal parts, there will be a temperature gradient. When the temperature gradient is too large, it will cause cracks, warpage, and deformation when printing parts with more complicated structures [
17]. How to improve the performance of laser powder bed fusion forming porous metal parts has become a hot research topic.
Vasinonta et al. [
18], Tsopanos et al. [
19], Schleifenbaum, H et al. [
20] Badrossamay et al. [
21] and Wang Linzhi et al. [
22] conducted SLM experiments on different materials and found that the laser parameters affect the quality of SLM molded parts, and this effect is not linear. Russia’s V. Sh. Sufiiar ov et al. [
23] further found that the thickness of the powder layer has a significant effect on the mechanical properties (such as strength and plasticity) of SLM molded parts. Loh L and Loh, Liu et al et al. [
24,
25], K. Dal et al. [
26], Child T.H.C. et al. [
27] further found through experiments that the temperature field has a significant effect on the surface quality of the SLM formed metal. Shi Xuezhi et al. [
28] obtained the result that the laser parameters can produce a smooth, flat, continuous and stable melt trajectory within a certain range by optimizing the process parameters of SLM molding parts.
According to previous studies, various complex and changeable physical phenomena such as phase change, heat transfer, and mass transfer will occur simultaneously in the laser powder bed fusion process, and temperature will affect the physical characteristics of the metal powder, and the performance of laser powder bed fusion molded parts largely depends on process parameters such as laser power, scanning speed, powder layer thickness, and scanning distance; however, the previous research contents are less involved in porous structure.
As one of the most widely studied materials in metal additive manufacturing, stainless steel, especially 316L stainless steel, has the advantages of high strength, low density, corrosion resistance and good biocompatibility, and is widely used in medical biological bones. Therefore, in this paper, a personalized artificial tibia design and processing method based on laser powder bed fusion is proposed. Firstly, the personalized model of the damaged part of the patient is reconstructed through three-dimensional CT image, and the Boolean operation is carried out with the forward designed hole structure, and finally, the tibial implant model is obtained; then, using stainless steel 316L as the material, the implant with porous structure matching the elastic modulus of human tibia is manufactured by selective laser melting technology. Finally, the comprehensive mechanical properties of metal porous structure samples are tested. The remainder of paper is organized as follows.
Section 2 provides a mathematical model of droplet deposition and fusion processes.
Section 4 presents the numerical simulation of droplet impacting processes and droplet coalescence simulation, and the conditions and results of an experiment of linear bio-structure printing. The paper is concluded in
Section 5.
2. Materials and Methods
The material used in this experiment is 316L stainless steel spherical powder prepared by the plasma atomization process of Sandvik, Sweden. The bulk density is 3.55 g/cm
3 and the tap density is 4.8 g/cm
3, which meets the requirements of use. Its specific chemical composition is shown in
Table 1. From the scanning electron micrograph in
Figure 1, it can be seen that the 316L stainless steel powder used in this experiment has the advantages of high sphericity, less satellite sphere particles, good fluidity, and no segregation of components.
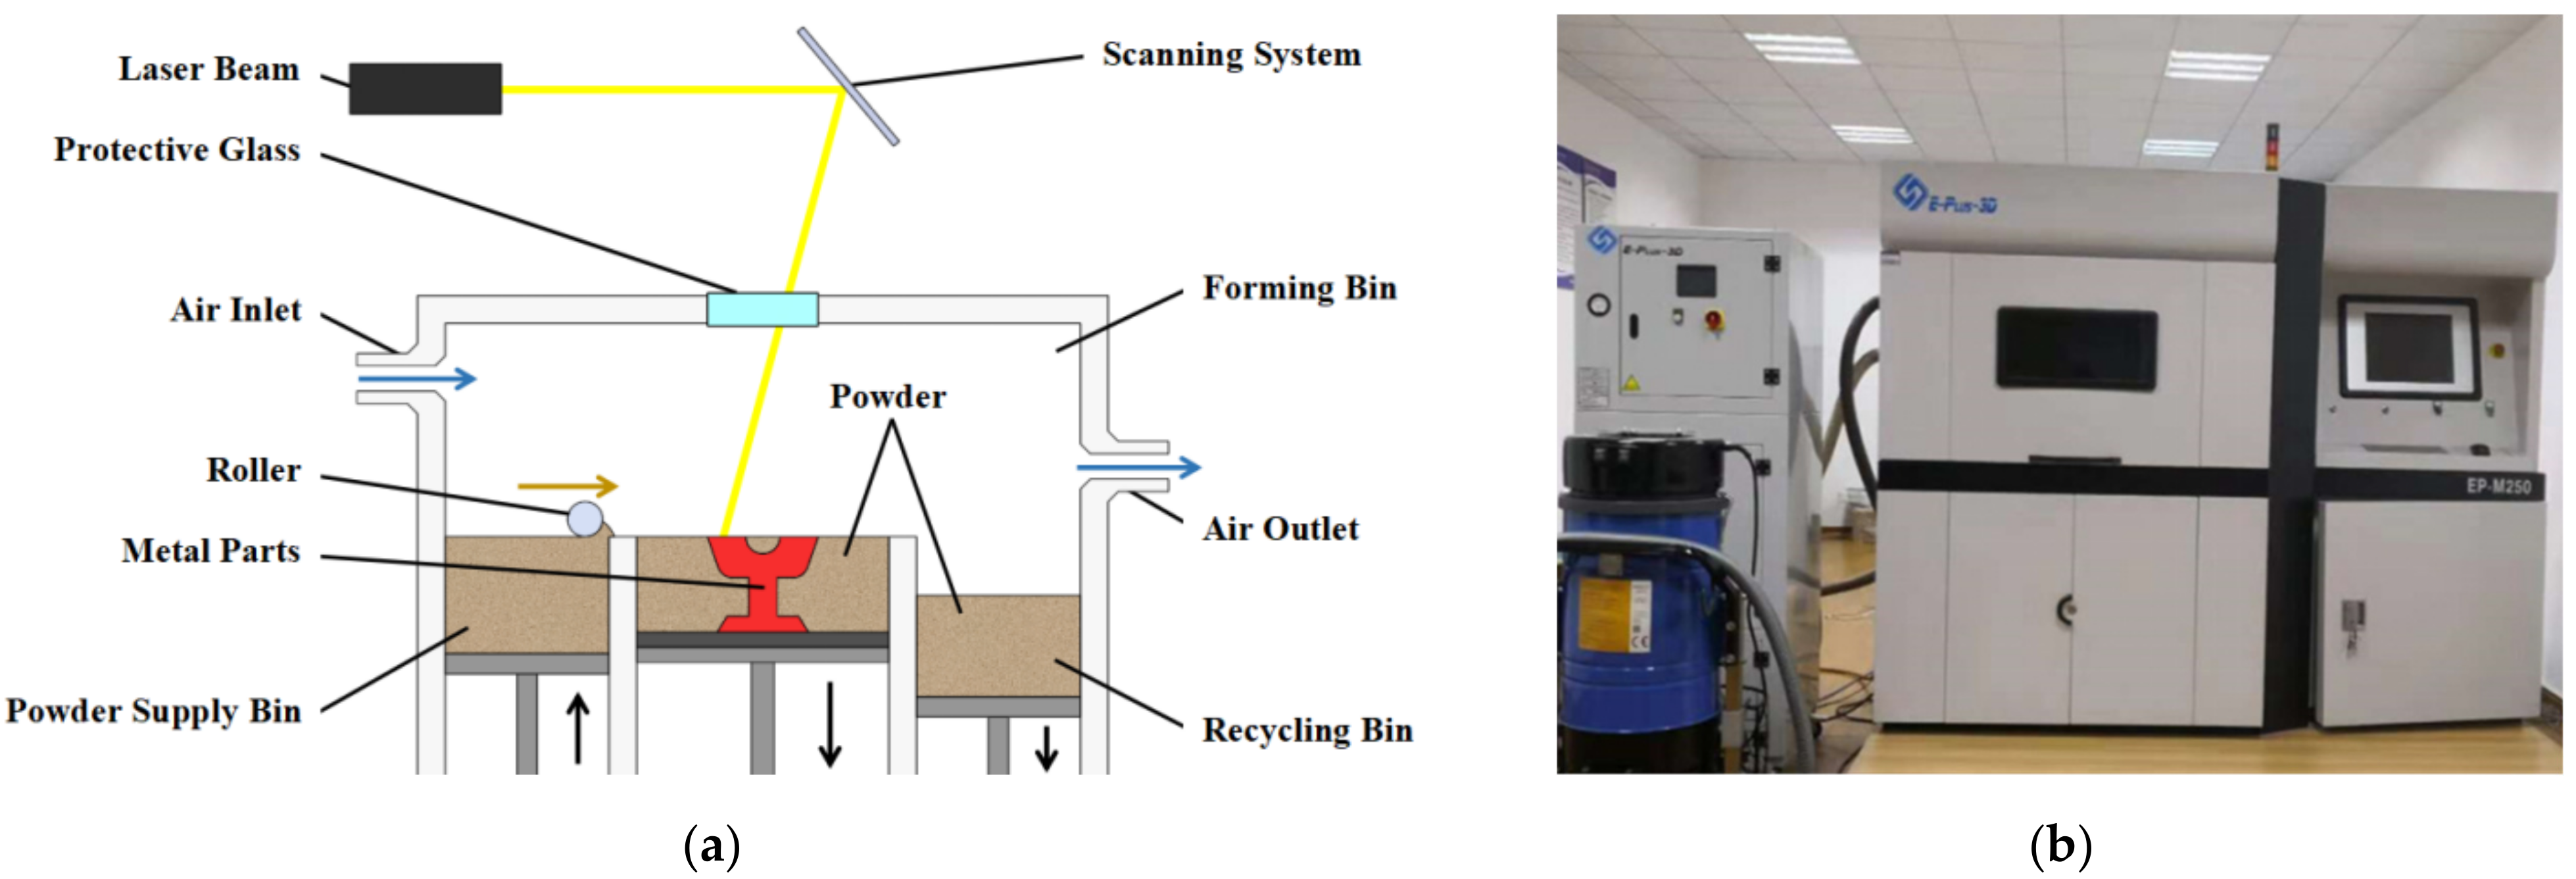
Selective laser melting (SLM) technology is a kind of additive manufacturing (AM) technology, as shown in
Figure 2a; its forming principle is: according to the two-dimensional profile information of the design model, the metal powder is melted layer by layer with a high-energy laser beam, and finally superimposed to produce a three-dimensional part.
The laser powder bed fusion forming equipment used in this study is shown in
Figure 2b. It was the laser powder bed fusion rapid prototyping machine EP-M250 developed by Beijing Yijia 3D Technology Co., Ltd (Beijing, China). The main parameters were as follows: laser wavelength was 1075 nm; spot diameter was 70–100 μm; maximum molding size was 250 mm × 250 mm × 300 mm; molding layer thickness was 20–100 μm; scanning speed was 5–7000 m/s. The molding chamber was filled with argon or nitrogen, and the oxygen content can be controlled below 0.1%. When the indoor environment was at a constant temperature and humidity, the equipment could reach the best condition.
In this experiment, the working parameters of the EP-M250 equipment are set as “laser power is 180 W, laser scanning speed is 1000 mm/s, laser beam diameter is 80 μm, and powder layer thickness is 50 μm”.
3. Laser Powder Bed Fusion Forming Process Principle and Simulation Model
3.1. Heat Source Model
Common heat source models mainly include volume heat source models and surface heat source models. The surface heat source model believes that the laser light source acts on the surface of the powder layer, and then transfers heat to the inside of the powder and the substrate through thermal conduction, while the bulk heat source model believes that the laser will enter the powder through the gap between the powder to heat [
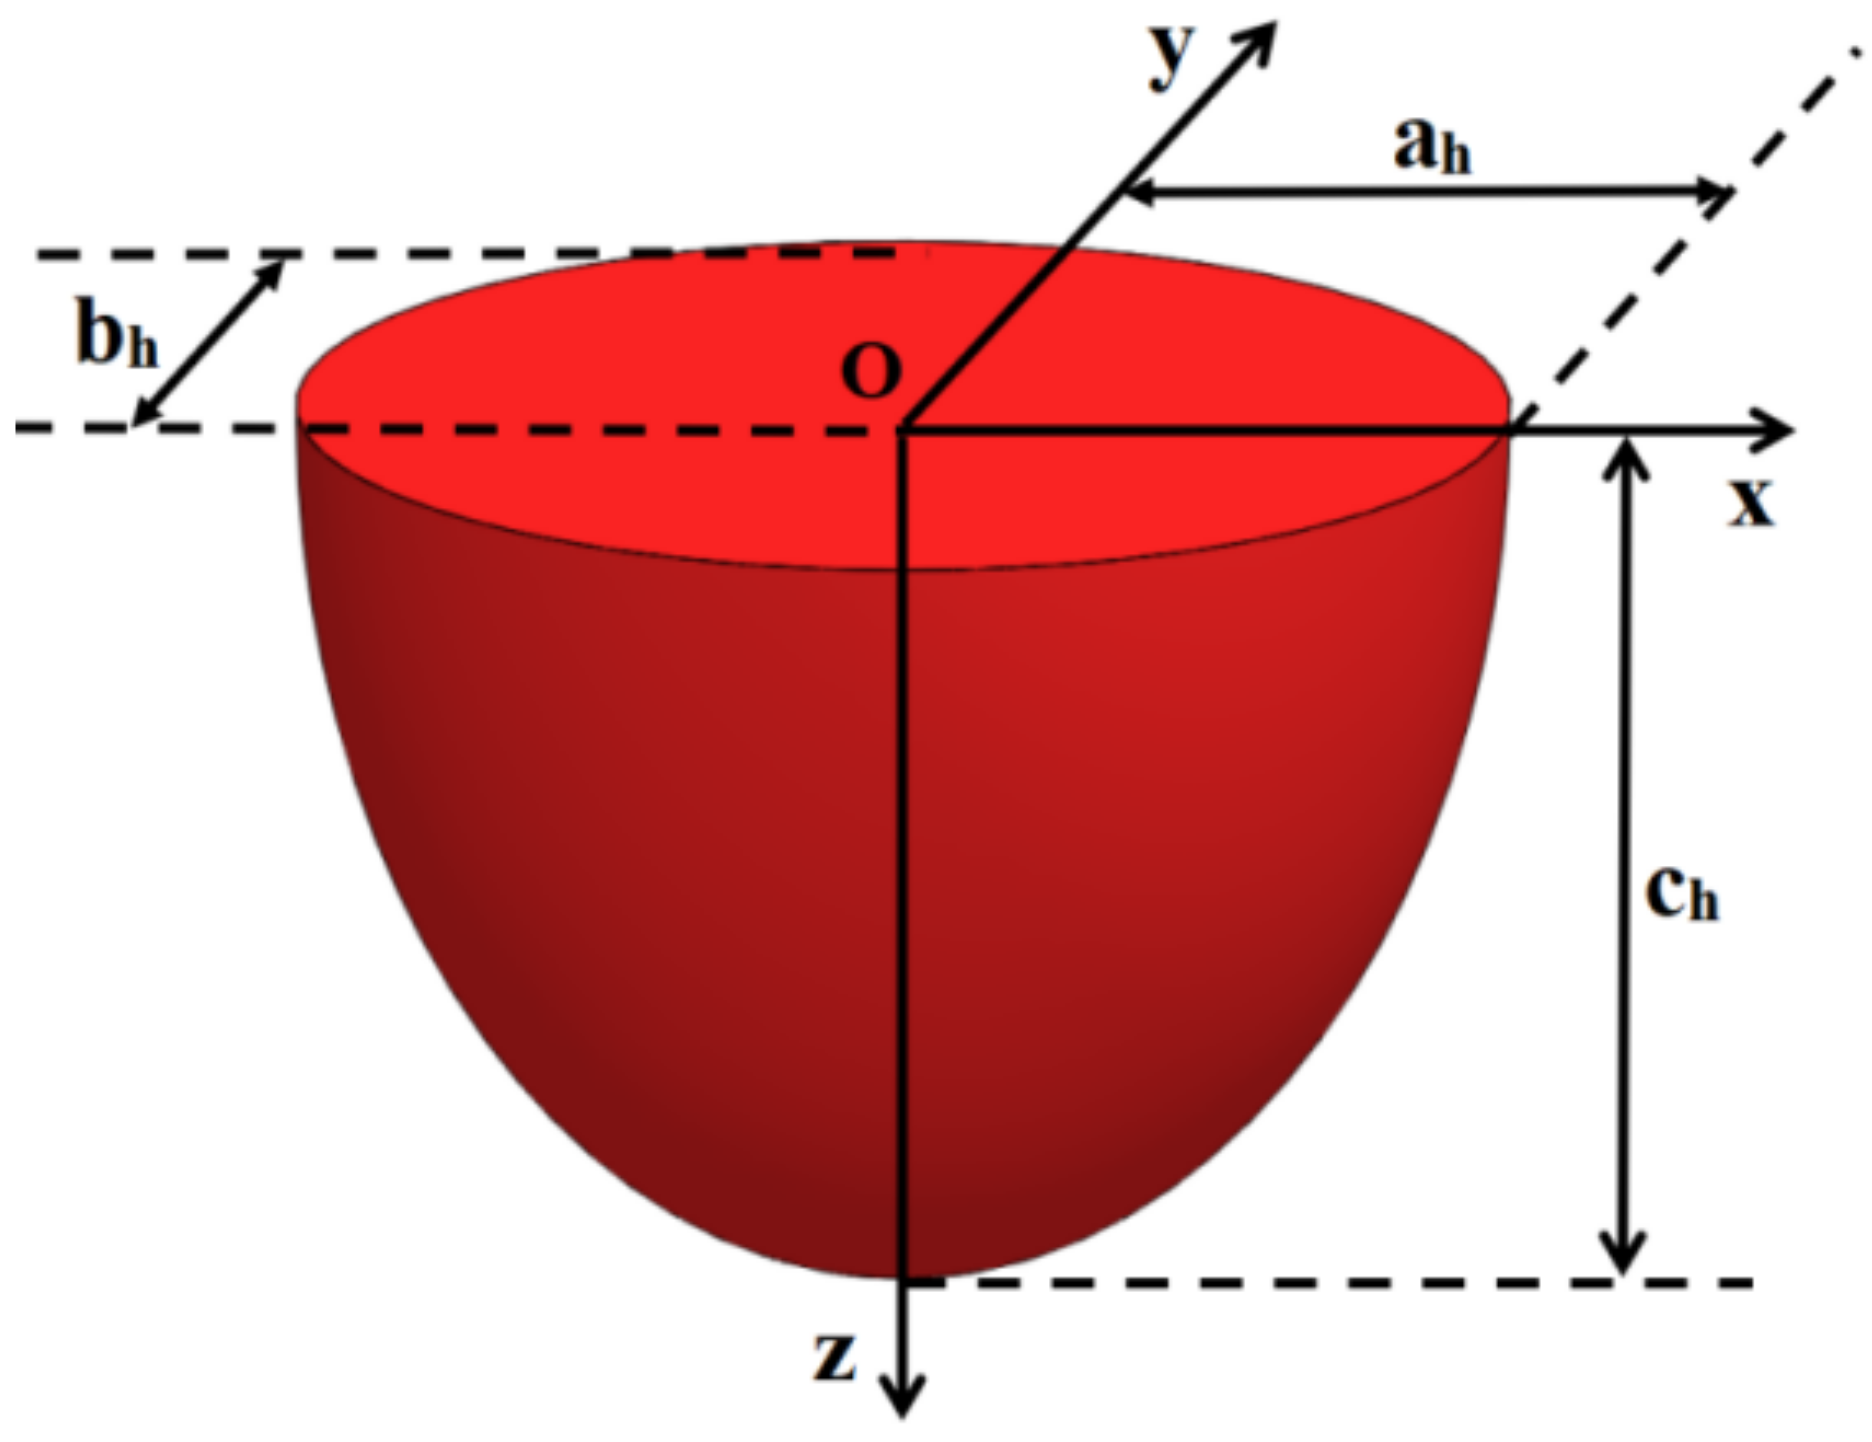
29]. Since the energy distribution of the traditional Gaussian surface heat source cannot penetrate deep into the powder bed, the semi-ellipsoidal heat source model can reflect the penetration of the laser in the powder bed; therefore, this article uses the semi-ellipsoid heat source model shown in
Figure 3 to replace the traditional surface heat source model [
30].
The semi-ellipsoid heat source model formula is shown in Equation (1):
where
x,
y, and
z are local coordinate axes with the origin of the spot center of the laser projected on the powder bed;
ah,
bh, and
ch are the size of the ellipsoid;
A is the absorption coefficient of the powder to the laser energy;
P is the laser power; and
f is the energy distribution coefficient of the molten pool.
3.2. Laser Scattering Model
As shown in
Figure 4a, when using laser powder bed fusion technology to actually prepare parts, the laser beam is irradiated on the surface of the powder bed, part of the energy is reflected into the air, and the other part of the energy is reflected multiple times in the gap between the powders and finally absorbed. Its reaching depth is roughly equivalent to the thickness of the powder layer.
Assuming that the irradiated powder is a uniformly absorbing scattering medium, the radiation transfer equation is shown in Equation (2) [
31,
32,
33,
34]:
where
μ = cosθ;
I is the radiation intensity;
z is the depth;
β is the molar absorption coefficient;
ω is the scattering albedo; and
P(
μ, μ′) is the scattering phase function.
In the case of opaque powder particles, the effective values of extinction coefficient and illuminance are shown in Equation (3):
where
S is the pore volume per unit area of the powder and
ρ is the hemispherical reflectivity of the dense powder material.
For spherical metal particles, the law of specular reflection with constant directional reflectivity can be applied to obtain isotropic scattering, as shown in Equation (4):
When the boundary condition of the powder surface
z = 0, the laser collimated incident radiation is shown in Equation (5):
where
Q0 is the power density of the laser and
δ is the Dirac delta formula.
When the bottom surface
z = L, the laser collimated incident radiation is shown in Equation (6):
The radiation intensity
I is divided into two collimated entry and one diffusion term, its formula is shown in Equation (7):
where
Q+ and
Q− are the forward and backward power density, respectively, and
F is the scattering from the collimated component.
Simultaneous Formulas (2), (5) and (7) and finally get Formula (8):
where
ξ = βz is a non-dimensional quantity; and
λ = βL represents the optical thickness, which is a non-dimensional quantity.
The diffusion term formula is shown in Equation (9):
The laser power density formula is shown in Equation (10):
3.3. Heat Transfer Model between Particles
Figure 4b is a schematic diagram of the heat conduction between powder particles. Assuming that only conductive heat transfer occurs between powders, the heat transfer formula of Equation (11) can be obtained [
35]:
where
H is the heat source from the laser,
K is the thermal conductivity, and
Aij is the contact area between particle
i and particle
j.
If the particles intersect, the formula for calculating the contact area is shown in Equations (12)–(14):
The laser heating term in Formula (11) can be obtained from Equation (15):
where
α (
) is the absorptance,
I is the laser intensity, and
Ai is the incident area of the laser.
The laser intensity I can be obtained by the Beer–Lambert law of Equation (16):
where
I0 is the intensity of the incident light,
a is the absorption coefficient, and
z is the penetration depth.
3.4. Heat Transfer in the Molten Pool
In the laser powder bed fusion molding process, the laser heat source scans quickly and releases a large amount of heat. The area scanned by the laser heat source will complete the melting and solidification reaction in an instant, sometimes accompanied by an evaporation reaction. During the whole process, the temperature of the powder bed changes sharply with time and space. Therefore, it can be considered that the laser powder bed fusion molding process conforms to the typical three-dimensional transient heat conduction process. The basic formula is shown in Equation (17) [
36]:
where
ρ is the material density,
c is the specific heat capacity of the material,
T is the surface temperature of the powder bed,
t is the interaction time between the laser and the powder bed,
k is the thermal conductivity of the material, and
Q is the thermal power consumption per unit volume.
As shown in
Figure 5b, the schematic diagram of heat transfer in the molten pool, the contact parts inside the powder layer exchange energy in the form of heat conduction, and the molten pool and the outer surface of the model use convection and radiation to achieve the purpose of heat dissipation [
37].
Its surface thermal radiation boundary conditions is shown in Equation (18):
where
αb is the equivalent emission coefficient,
σb is the Stefen–Boltzmann constant, and
Ta is the ambient temperature.
Its natural convection boundary conditions is shown in Equation (19):
where
hc is the natural convection coefficient.
3.5. Flow in the Molten Pool
This article assumes that the molten pool flow is Newtonian incompressible laminar flow, and does not consider the thermal expansion caused by the liquid phase of 316L stainless steel, that is, it is considered that the liquid phase density of 316L stainless steel is constant, and the molten pool flow satisfies the following three conditions:
Continuity equation is shown in Equation (20):
Law of Conservation of Momentum is shown in Equation (21):
Energy conservation law is shown in Equation (22):
Figure 5c shows the schematic diagram of the flow in the molten pool. In addition to gravity and buoyancy, the factors that drive the liquid flow in the molten pool include surface tension, Marangoni effect, and steam recoil.
The boundary conditions of the volume force (gravity, buoyancy) are shown in Equations (23)–(25):
where
Fg is the gravity generated on the unit volume of liquid,
Fb is the buoyancy generated on the unit volume of liquid,
ρ is the material density,
T is the surface temperature of the powder bed, and
Ta is the ambient temperature.
As shown in
Figure 5a, the surface tension on the free surface is simplified to an equivalent pressure, and the corresponding expression is shown in Equation (26):
where
r is the radius of curvature of the free surface and
σs is the surface tension coefficient.
Assuming a linear relationship between the surface tension coefficient and temperature, it is shown in Equation (27) that:
where
σs0 is the surface tension coefficient at the reference temperature
T0; and
σTs is the coefficient of surface tension changing with temperature, which is generally a positive value.
When the temperature of the metal powder exceeds its own melting point under the irradiation of the laser beam, the metal particles melt into a liquid state. When the laser energy disappears instantly, the liquid metal will rapidly cool and solidify. At this time, there is a temperature gradient on the surface of the molten pool in the radial direction, which leads to a surface tension gradient, which drives the liquid metal to flow. This phenomenon is called the Marangoni effect, as shown in
Figure 6b. The specific expression is shown in Equation (28):
where
is the temperature gradient along the surface.
Assuming that the recoil pressure is a normal impulse applied to the surface, as shown in
Figure 5c, when the temperature of the laser beam is greater than the boiling point of the liquid metal, the liquid metal will evaporate into a metal gas. When the metal gas escapes from the liquid surface, it will produce a vertical downward impulse. This value is equal to the momentum of the metal gas molecule in the vertical direction of the liquid surface. The expression of the vapor recoil force is obtained from Equation (29) [
38,
39,
40,
41]:
where
P0 is the boiling point vapor pressure,
TLV is the boiling point temperature, and
ΔHLV is the effective enthalpy when the metal evaporates.
It is worth noting that when the energy density of the laser beam is large, the steam recoil pressure will replace the Marangoni effect as the main driving force for the liquid flow in the molten pool.
3.6. Heat Transfer Model of Porous Parts
The differential equation for general heat conduction problems is shown in Equation (30) [
42]:
where
ρ is the material density,
Cp is the specific heat capacity at a constant pressure,
t is the time,
T is the temperature,
λ2T is the heat diffusion term of the net introduction in the three coordinate directions, and
Q is the heat flux density of the internal heat source.
The theoretical basis of Formula (30) is Fourier’s law and conservation of energy. It describes the temperature distribution of an object when time and space change. It is a general expression.
When solving the differential equation of a particular problem, additional conditions are often required, which generally include the initial conditions of the object temperature and the boundary conditions of the heat transfer on the boundary and the ambient temperature. Common boundary conditions include Dirichlet conditions for a given temperature and Riemann conditions for a given heat flux, expressed by Equations (31) and (32):
where
is the thermal conductivity of the material along the
x,
y, and
z directions;
qs is the heat flux along the direction of discovery on
ΓQ; and
is the given temperature on
ΓT.
The problem of steady-state heat conduction means that the heat conduction process reaches an equilibrium state, and the temperature distribution of the object does not change with time, that is,
It can be assumed that the material is isotropic
; to further simplify the heat transfer equation, the simplified heat transfer differential derivative equation is written as Equation (33):
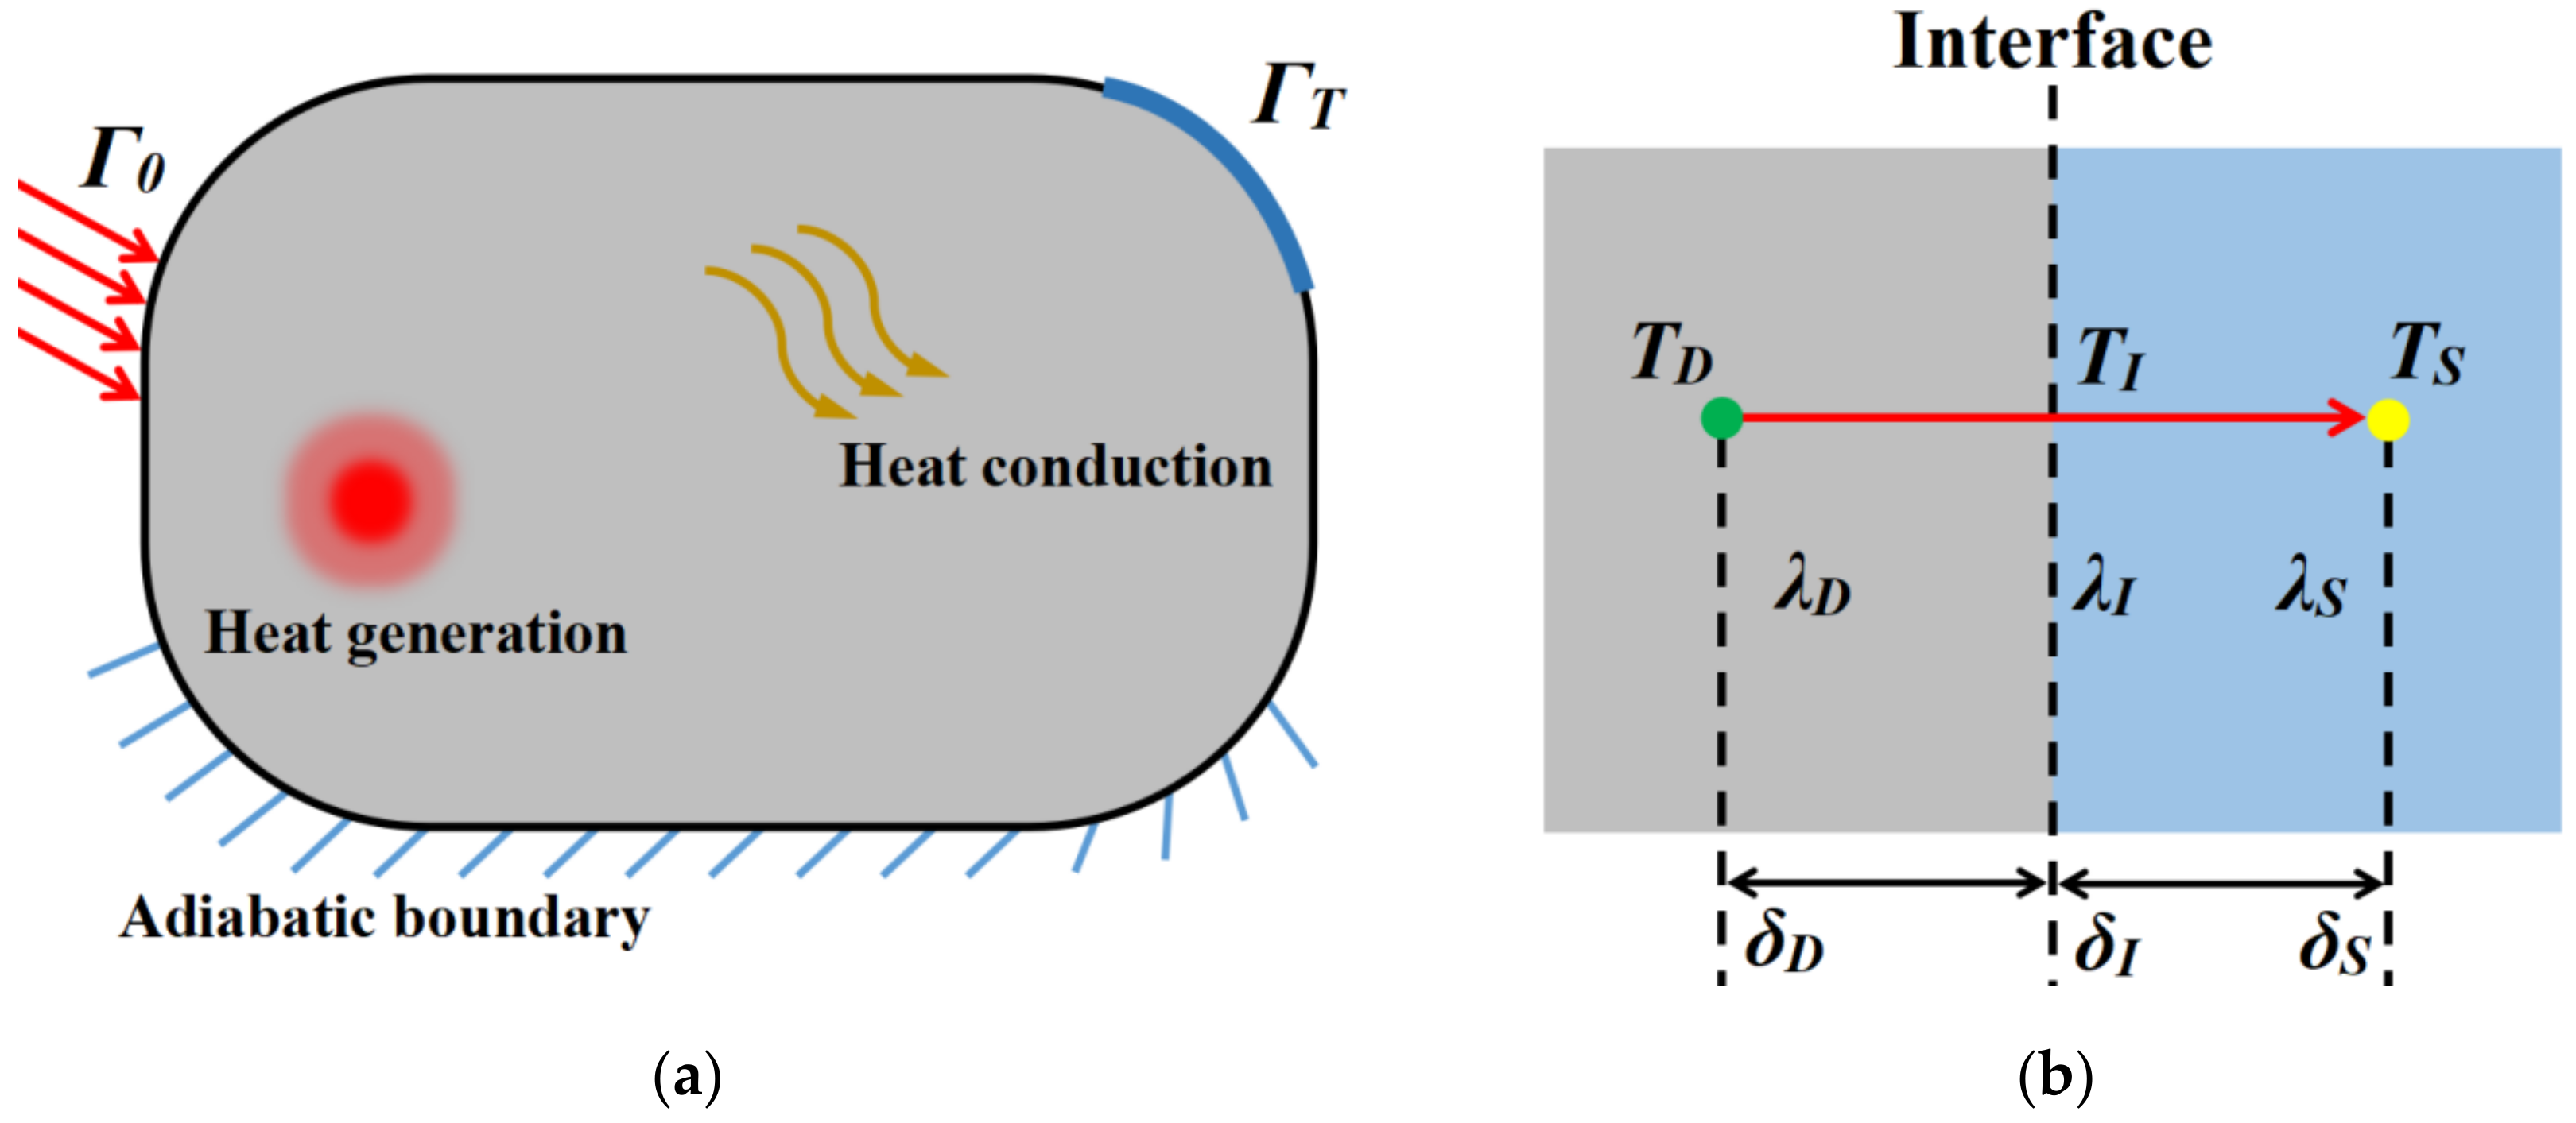
The heat conduction area under given boundary conditions is shown in
Figure 7a.
This article adopts the porous structure part. There are two parts of solid structure and hole in the whole part area. Therefore, the porous structure part can be regarded as a part composed of two materials with different thermal conductivity.
The thermal conductivity of this structure generally has the following three forms:
The first is the heat conduction from the solid structural material to the solid structural material;
The second is the heat conduction from the material inside the hole to the material inside the hole;
The third type is the heat conduction between the solid structure material and the material inside the hole.
The first two forms of thermal conductivity can be easily found from the tables of thermal conductivity of various materials. For the third case, the direct linear solution of the thermal conductivity at the interface of the two materials does not conform to the actual situation. Therefore, it is necessary to solve the thermal conductivity of the composite structure of two or more materials by the harmonic average method [
43].
Figure 6b is a schematic diagram of heat conduction near the composite material interface,
λD is the thermal conductivity of the material on the left,
λI is the thermal conductivity of the composite interface, and
λS is the thermal conductivity of the material on the right.
TD is the temperature at the green point,
TI is the temperature at the interface, and
TS is the temperature at the yellow point.
δD is the distance from the green point to the interface in a one-dimensional problem, and
δD is the relative density at the green point in a three-dimensional problem; in the same way,
δI is the relative density at the interface of the composite material in a three-dimensional problem, and
δS is the relative density at the yellow point in a three-dimensional problem.
The specific derivation process of the thermal conductivity of composite materials is as follows:
From the heat flux equation, the heat flux at the interface of Equation (34) can be obtained:
Since the heat fluxes on the left and right sides of the interface are equal, so there is Equation (35):
So, we can deduce Equation (36):
From Equations (34) and (36), the thermal conductivity at the interface can be obtained as shown in Equation (37):
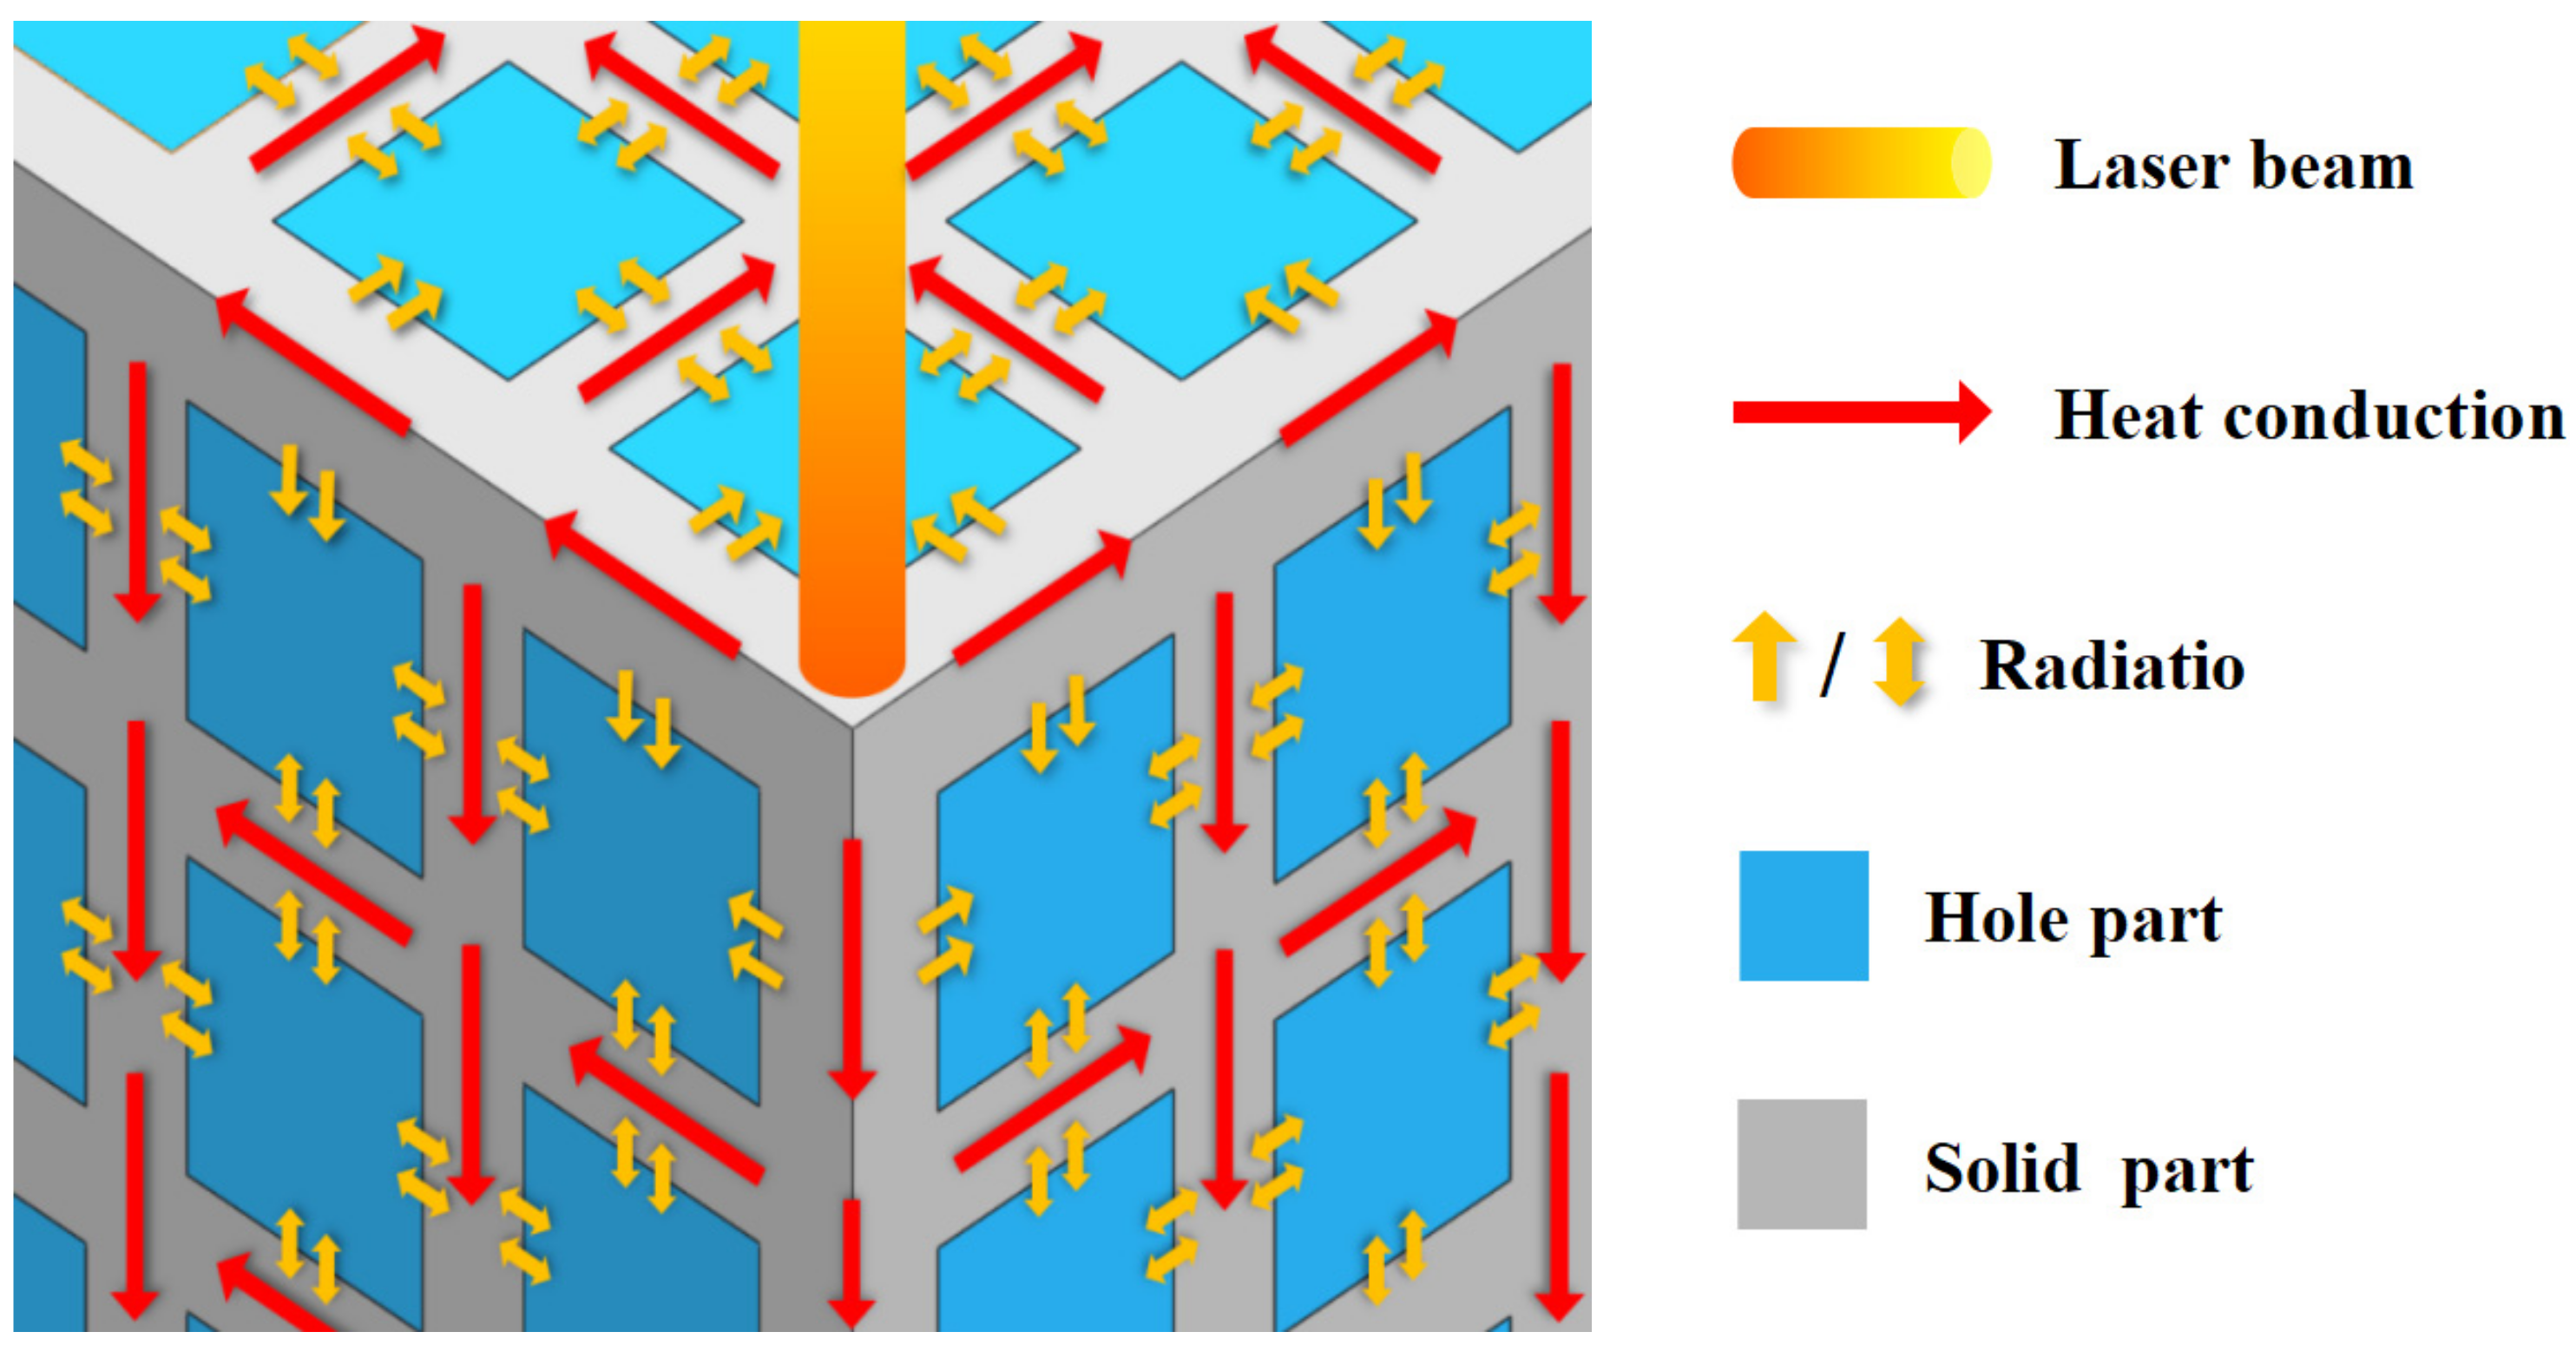
Combined with the above analysis, when laser sintering powder, the heat transfer mode of the laser heat source in the molded porous structure part is shown in
Figure 7. The farther away from the heat source, the less the influence of heat conduction and radiation.
3.7. Numerical Simulation
In this simulation experiment, four pieces of software—FLOW-3D v11.1, Visual Studio 2013, FORTRAN, and EDEM—are mainly used. First, build a single powder layer required for laser powder bed fusion numerical simulation through EDEM, then build the substrate in the FLOW-3D v11.1 software, and set the key parameter information (including Finish time, Surface tension, Density, Specific Heat, Thermal Conductivity and other parameters). The FORTRAN software is mainly used to create the scanning path of the laser and build the heat source model. Visual Studio 2013 software acts as an intermediate bridge between FORTRAN software and FLOW-3D v11.1 software to realize the compilation function.
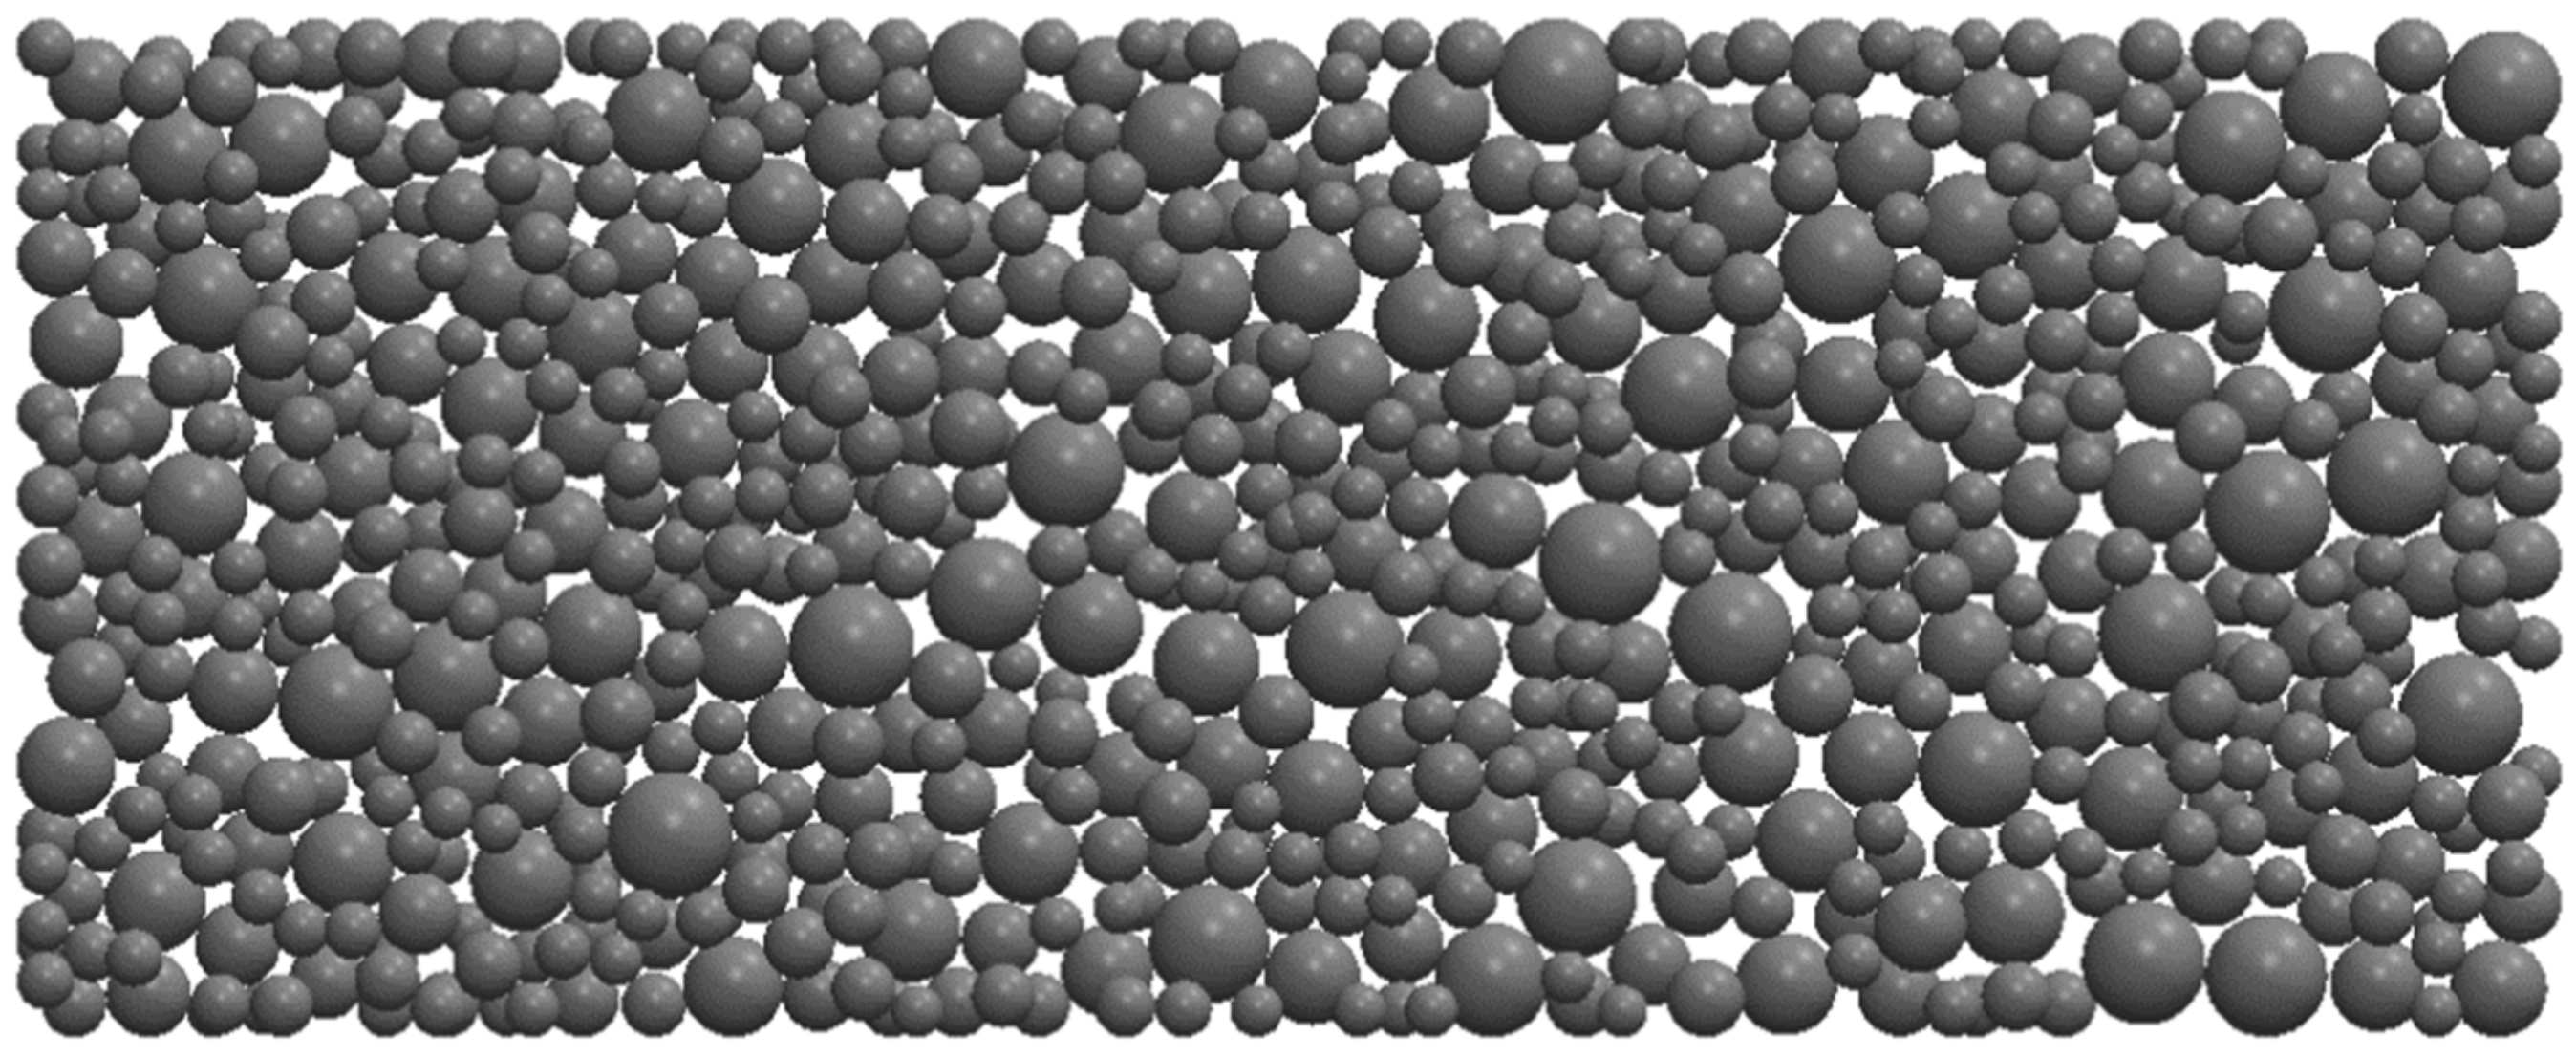
In this experiment, 316L stainless steel powder was used as a raw material, a single-layer powder layer model with a size of 1000 μm × 400 μm × 60 μm was constructed using EDEM software, and the powder diameter was randomly generated from 20 μm to 50 μm.
Figure 8 shows the generated 316L stainless steel single-layer powder layer model.
Import the model into FLOW-3D v11.1. Comprehensively consider the calculation speed and accuracy in the laser powder bed fusion numerical simulation process, as well as the influence of the size of the powder layer grid on the accuracy of the VOF model, and the optimal laser process parameters determined in this paper; set the initial time step to 10−6 s, the minimum time step to 10−10 s, the maximum time step to 10−8 s, and the powder layer unit particle mesh size to 4 μm; the final number of meshes is 1.8 million.
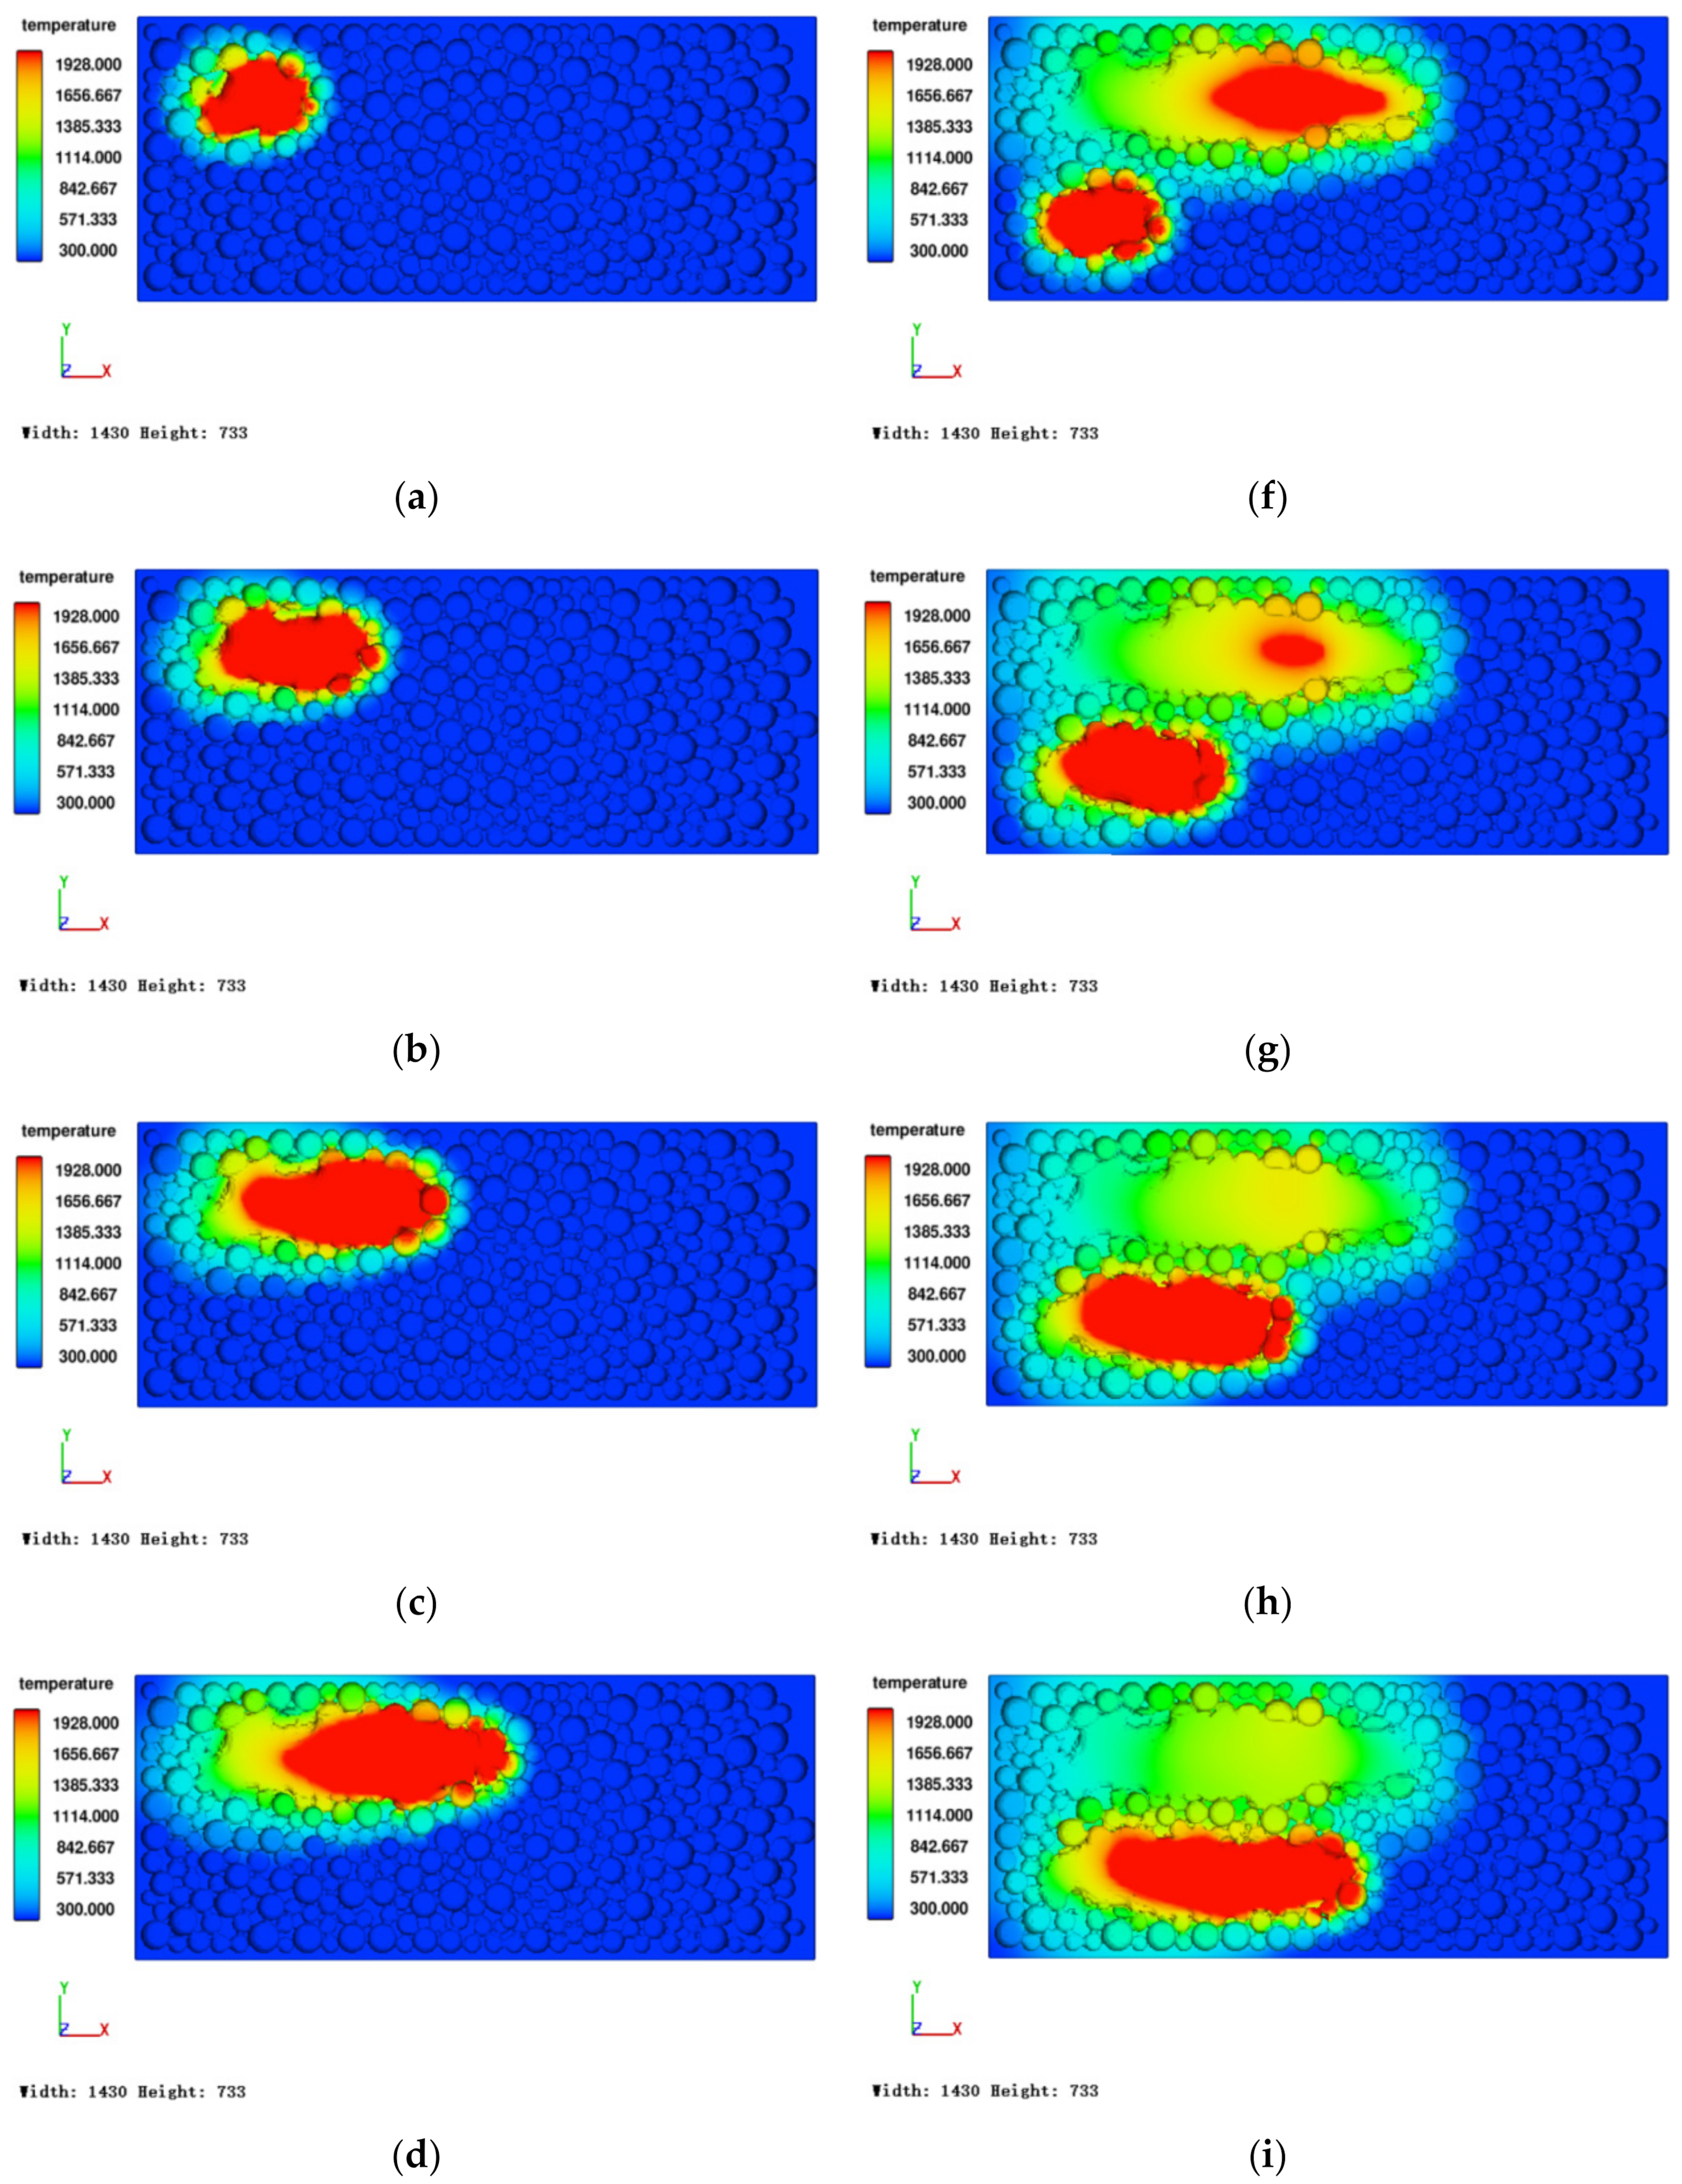
Figure 9 shows the temperature distribution in the molten pool during single-layer single-pass scanning and single-layer double-pass scanning. The set laser process parameters are: laser power 180 W, laser scanning speed 1000 mm/s, laser beam diameter 80 μm, powder layer thickness 50 μm.
Figure 10 is the YZ cross-sectional view when x = 0.17 mm, and then observe the changes in the molten pool morphology of the cross-section at different time points. This can better show the changes (melting and solidification) in the powder during single-layer single-pass scanning and dual-pass scanning; at the same time, we can further observe the heat transfer between the two channels.
It can be found from
Figure 9 that the melting and solidification of the powder are symmetrical during single-layer single-pass scanning. Due to the gaps between the powder particles, when the powder particles are melted, the height of the molten liquid level is slightly lower than the height of the powder layers on both sides. There is a small amount of air bubbles between the melted powder particles and the unmelted powder layer. During the printing process, the air bubbles will cause cracks or depressions on the surface of the molded part, which affects the morphology and mechanical properties of the molded part. In order to avoid the abovementioned problems of molded parts, we should set the laser scanning pitch to be smaller than the minimum width of the molten pool.
It can be found from
Figure 9 that in single-layer dual-channel scanning, the heat absorbed by the second channel will be transferred to the first channel, which slows down the final solidification speed of the first channel, thereby further ensuring the flatness of the surface of the first channel and reducing the number of bubbles inside. The second channel also benefits from the first channel. The two channels influence each other, thereby reducing the number of bubbles inside the molded part and ensuring the flatness of the surface of the molded part.
It can be found from
Figure 9 that the surface flatness of the liquid metal after solidification in the melt channel is good. Although there are still a small amount of bubbles inside, it is still within the acceptable range, which further verifies the superiority of the laser process parameters used in this experiment.
4. Results and Discussion
4.1. Measurement and Accuracy Improvement of Surface Morphology of Porous Structure
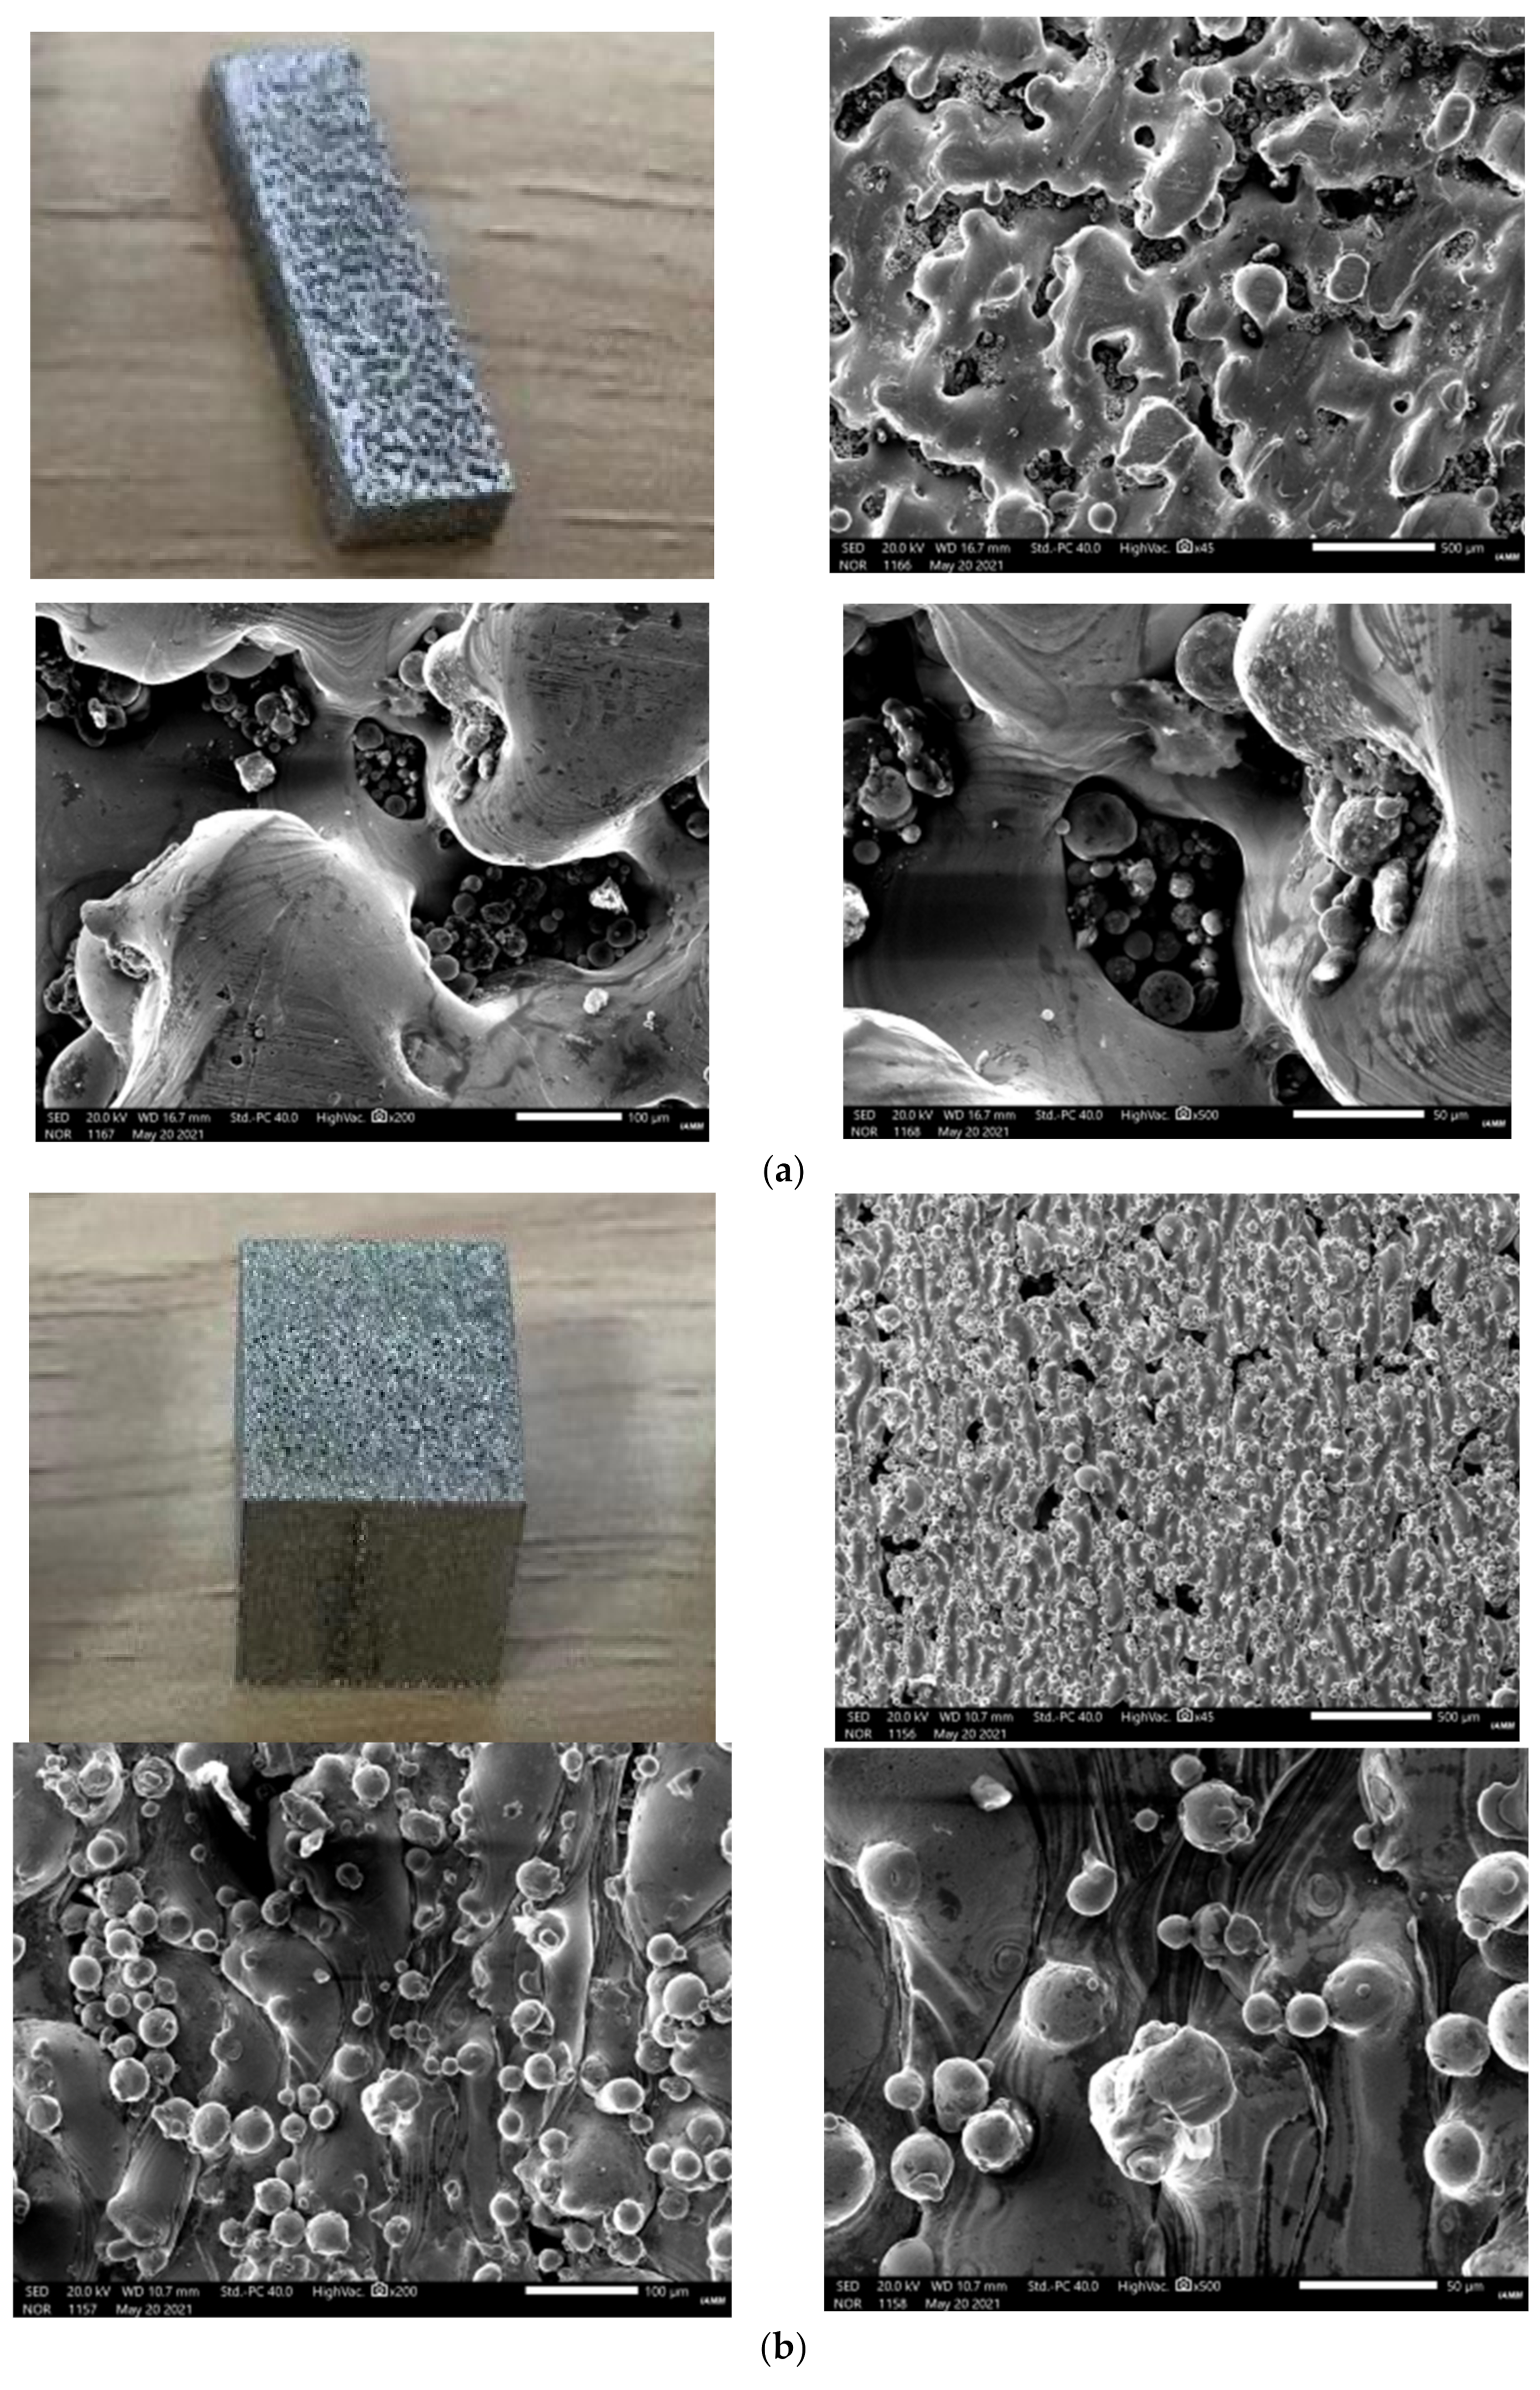
According to the above simulation experiment results, the optimized laser parameters were used to print porous stainless steel parts using EP-M250 equipment, and three sets of control models were set up at the same time: the first group is the sheet-shaped stainless steel parts printed with unoptimized laser parameters; the second group is cubic stainless steel parts printed with unoptimized laser parameters; the third group is porous stainless steel parts printed with unoptimized laser parameters.
Figure 11a shows a sheet-like stainless steel part printed with unoptimized laser parameters and its scanning electron microscope image. It can be clearly seen from the physical picture that the surface of the sheet-shaped stainless-steel parts is rough and there are a lot of pores inside. From the electron micrograph, it can be seen that there is obvious layering and partitioning on the surface of the sheet-shaped stainless-steel parts, with a large number of cracks inside, and the overall density is not high; at the same time, there are some unmelted metal powder particles inside the pores.
Figure 11b shows a cubic stainless-steel part printed with unoptimized laser parameters and its scanning electron microscope image. It can be seen from the physical picture that there are many small pores on the surface of the cube stainless steel parts. From the electron microscope image, it can be seen that the laser scanning path is vertical, and there is a large number of unmelted metal powder particles on the surface of the cube stainless steel parts. In the high-power scanning electron microscope image, you can see that the chromatic aberration in the scanning area is large, the pores are deep, there are obvious cracks and delamination, the surface is relatively rough, and the unmelted metal powder particles are mostly concentrated in the cracks.
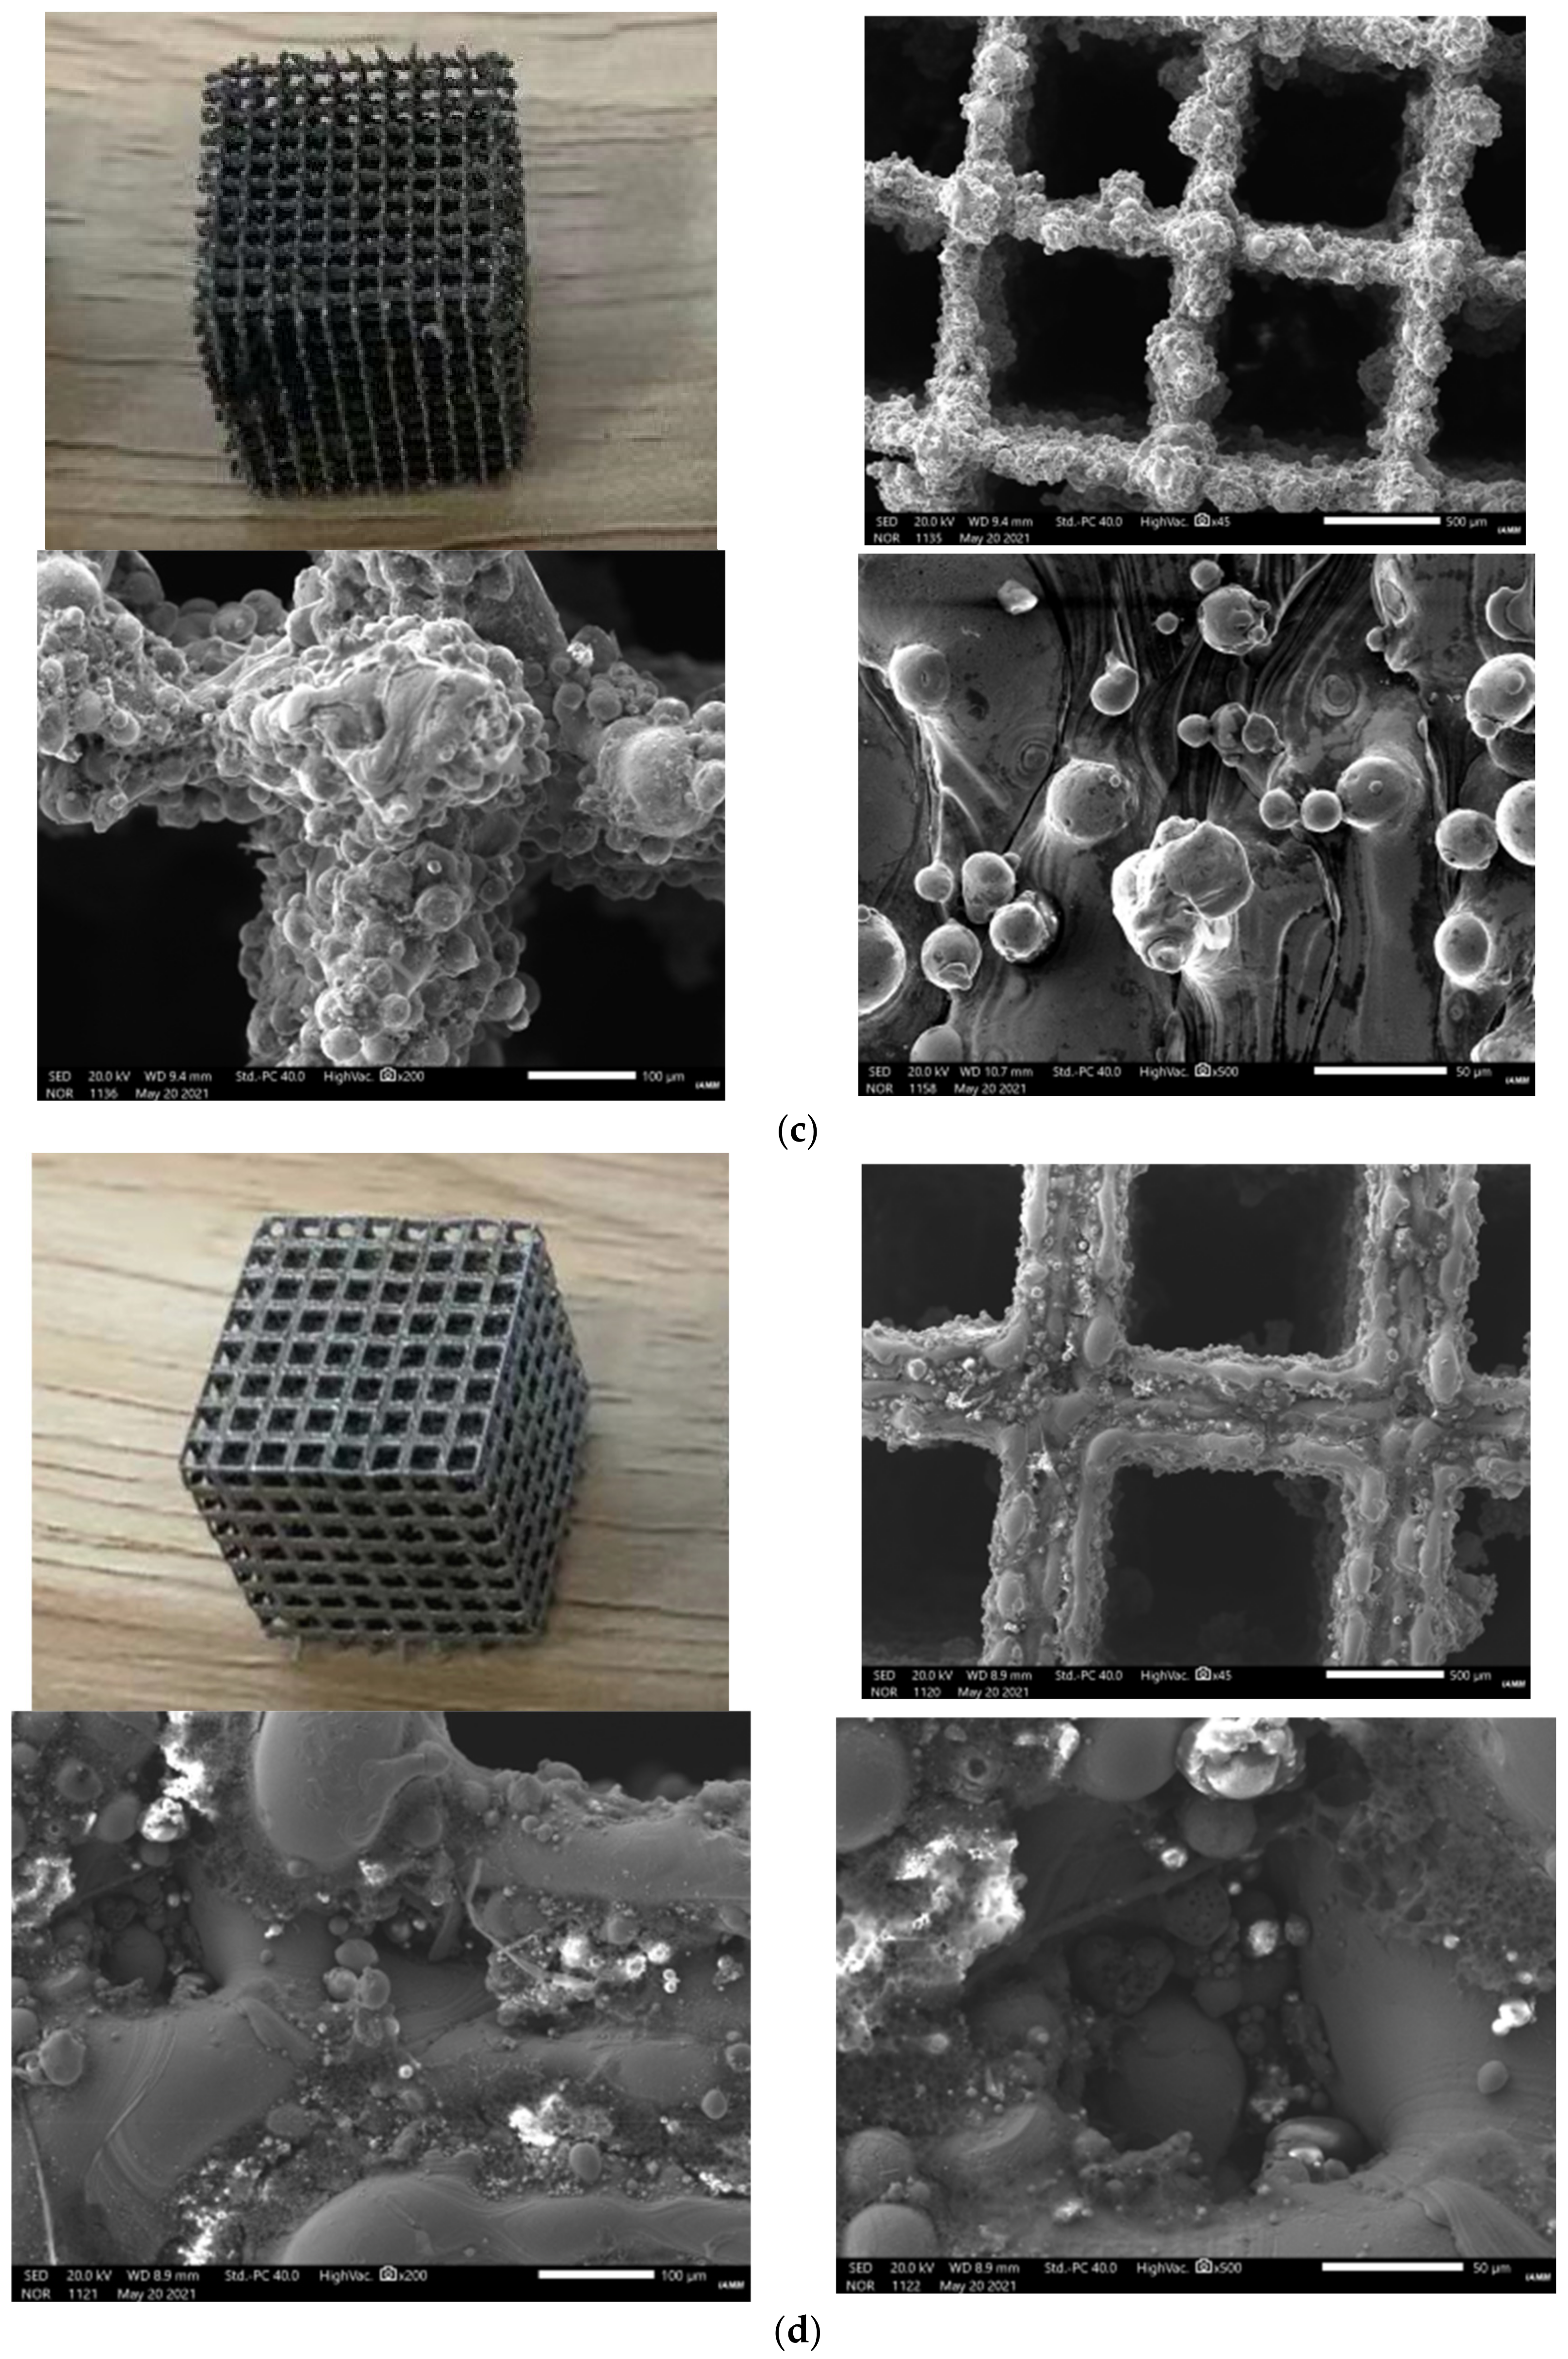
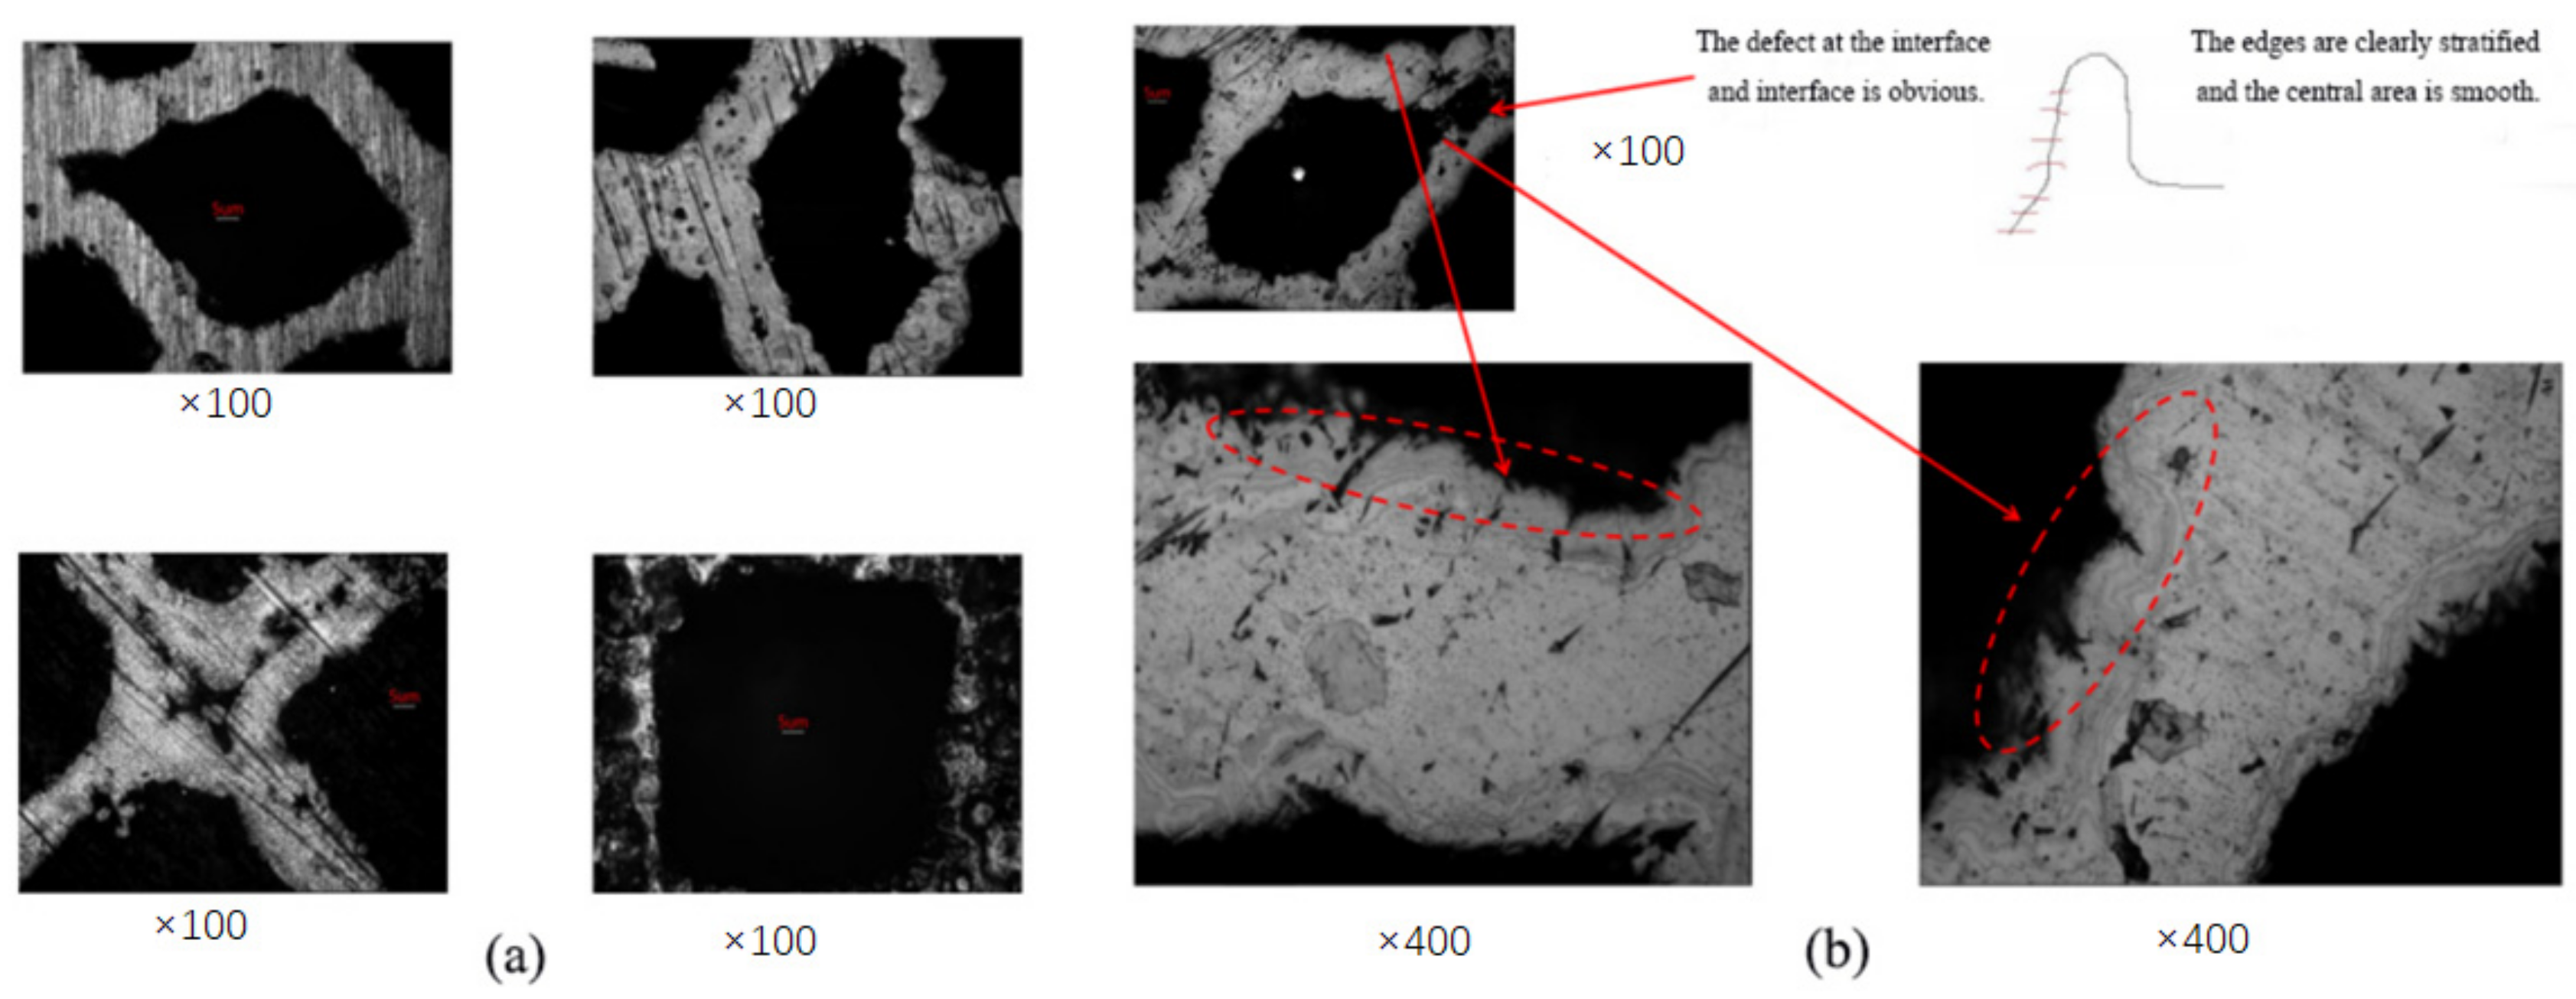
Figure 11c shows a porous stainless-steel part printed with unoptimized laser parameters and its scanning electron microscope image. It can be seen from the physical picture that there are obvious burrs on the surface of the porous stainless-steel parts. From the electron microscope image, it can be clearly seen that the radial dimensions of the porous stainless-steel parts bracket are obviously different, the surface is very rough, there are obvious cracks and recesses at the junction of the vertical and horizontal brackets, and there are more metal powder particles that are not completely melted attached to the stent, and the overall density is lower.
Figure 11d shows the porous stainless-steel part printed with optimized laser parameters and its scanning electron microscope image. It can be seen from the physical picture that there are no obvious defects on the surface of the optimized porous stainless-steel parts. It can be clearly seen from the electron micrograph that the radial dimension of the optimized porous stainless steel component bracket remains almost unchanged, the surface is relatively flat, and the transition is natural at the junction of the vertical and horizontal brackets without obvious cracks, and there is a certain height difference between the edge part and the middle part of the stent. In the high-magnification scanning electron microscope image, it can be seen that there are also tiny pores inside the stent, and some metal powder particles that are not completely melted are wrapped in the pores.
Figure 12 shows a scanning electron microscope image of the section of the porous stainless-steel part optimized in
Figure 11e; it can be seen that more obvious defects and cracks have occurred in the central area of the structure. The main reason for this phenomenon is that during the laser powder bed fusion molding process, the laser heat source scans quickly and releases a large amount of heat, and the area scanned by the laser heat source will complete the melting and solidification reaction in an instant. therefore, there is a large temperature gradient phenomenon in the scanning area; if the temperature gradient is too large, it will cause the parts to crack, warp, and deform due to the influence of thermal stress during the molding process.
Through the analysis of the experimental results, it is first clear that when the external conditions are consistent, the quality of porous stainless-steel parts printed with optimized parameters is obviously better than that of porous stainless-steel parts printed with unoptimized parameters. However, there are still defects and cracks in the optimized porous stainless-steel parts. Through further analysis of the causes of defects and cracks, we proposed two methods of “heating the substrate” and “preheating the material” to suppress cracks and defects.
When heating the substrate, the input of external energy is indirectly increased, and the input of laser energy can be reduced. The temperature distribution of the entire substrate will tend to be consistent, which can effectively reduce the temperature gradient in the laser scanning area, thereby reducing the effect of residual stress and avoiding defects and cracks in the central area of the formed part structure.
When the material is preheated, the temperature gradient between the materials in the Z direction can be reduced, and the increase in the temperature of the material can enhance the toughness of the material and reduce the brittleness of the material, thereby reducing the occurrence of defects and cracks when the formed parts are deformed unevenly.
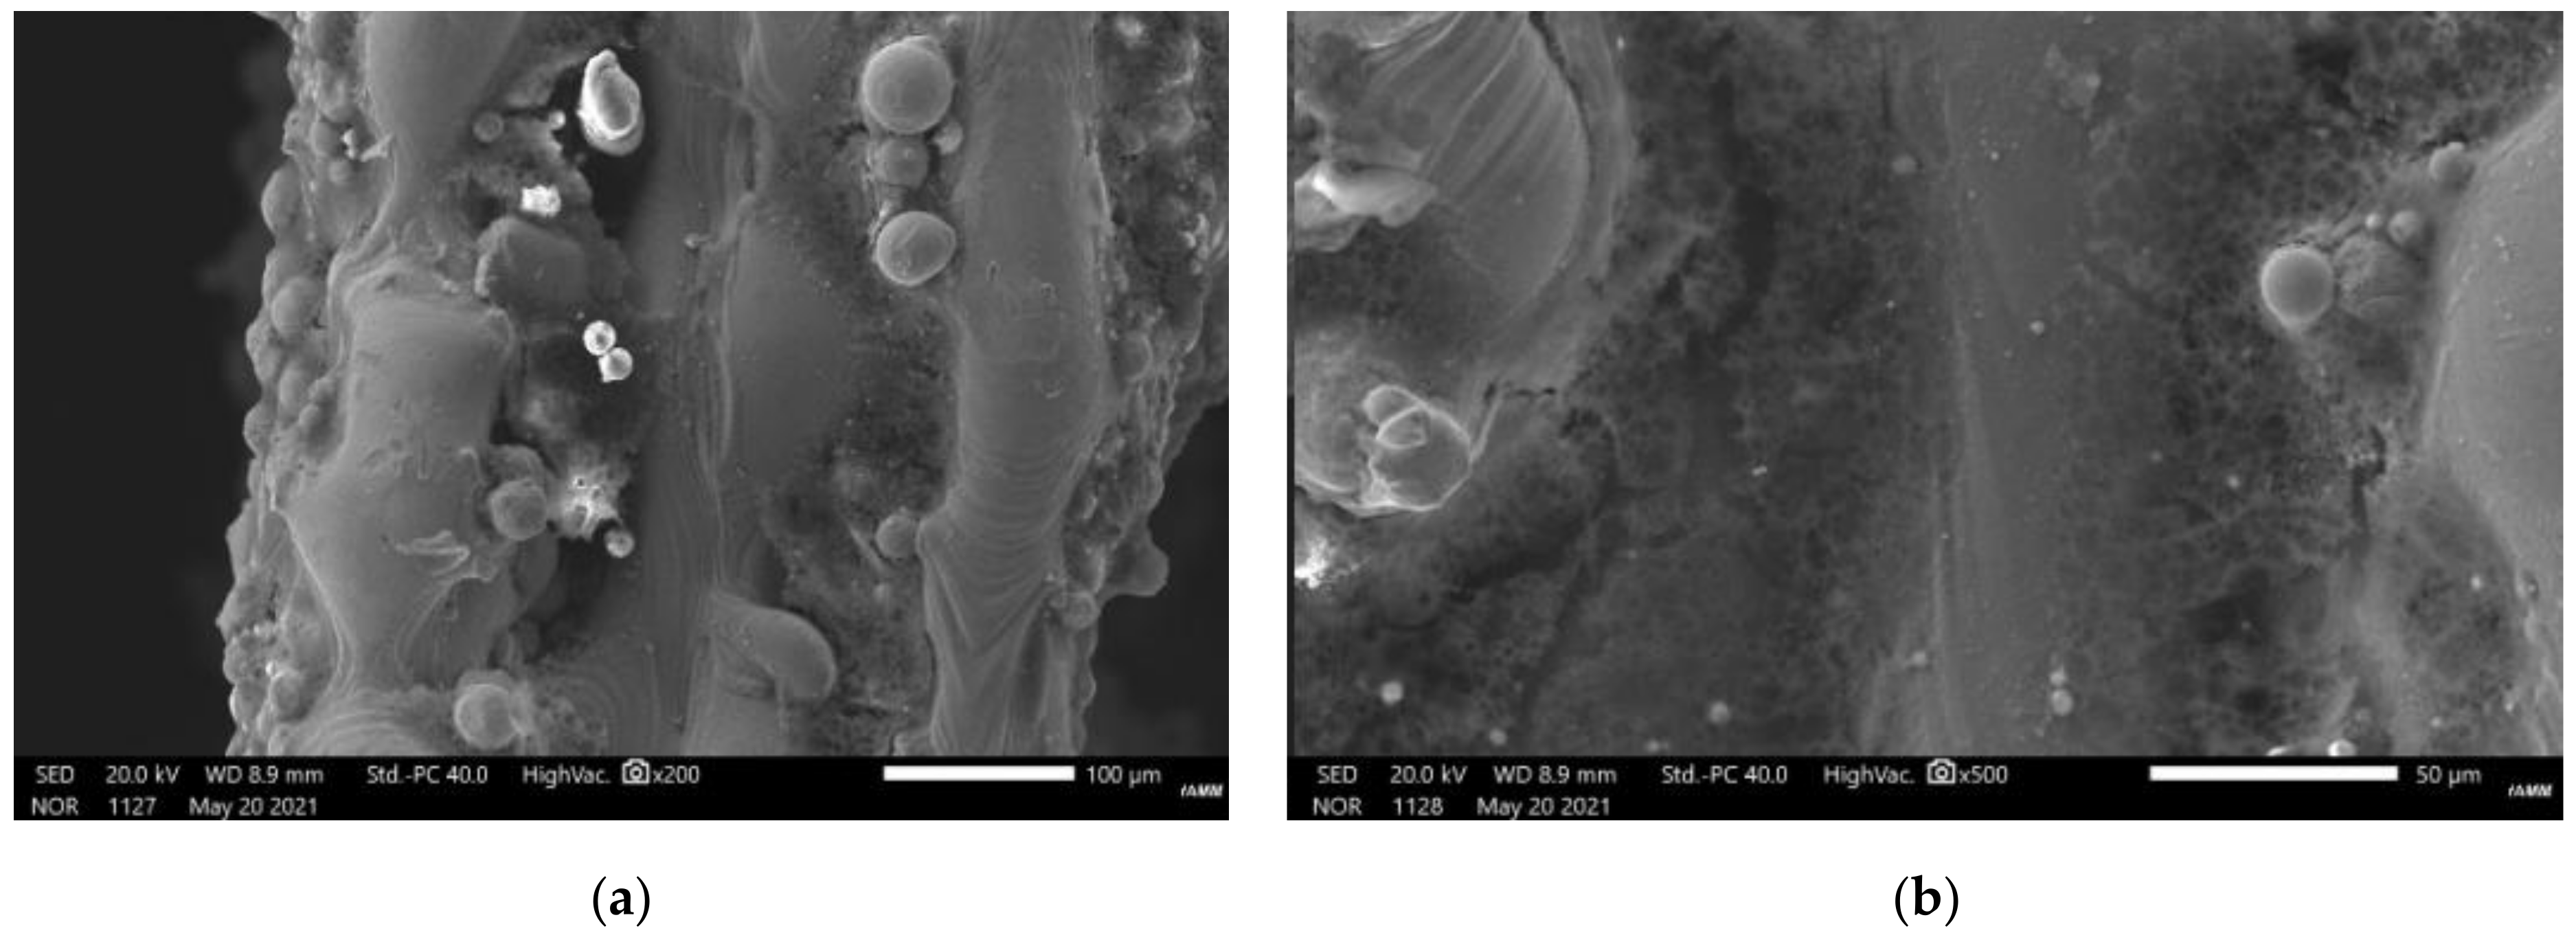
Figure 13 shows a scanning electron microscope image of porous stainless-steel parts printed using the above method and optimized parameters. It can be clearly seen that the internal cracks and defects of the porous stainless-steel parts are greatly suppressed, and the microscopic appearance is good.
4.2. Personalized 3D Printing and Comprehensive Mechanical Property Test of Tibia
In order to avoid the stress shielding caused by the implant implanted into the human body due to excessive strength and elastic modulus, the octahedral porous structure we designed should be close to the human bone tissue in the range of 10–40 GPa. In addition, the pore size of the octahedral porous structure should also be appropriate. If the pore size is too large, the elastic modulus and strength of the octahedral porous structure will become smaller; if the aperture is too small, it will hinder the transportation of nutrients required by cells and the generation of bone tissue.
As shown in
Table 2, four groups of regular octahedral porous structures are designed. There are two groups with the side length of the cubic cell body unit 1 mm, the pillar diameters are 0.3 and 0.35, respectively, and the specifications are 12 × 12 × 12 cells. There are two groups of square body cells with side length of 1.2 mm, pillar diameters of 0.35 and 0.4, and specifications of 10 × 10 × 10 cells. The four octahedral porous structure specimens were named a
1-0.3, a
1-0.35, a
1.2-0.35, and a
1.2-0.4, respectively. The four groups of porous structures have the same length, width, and height.
The finite element analysis of the above four groups of regular octahedral porous structures is carried out, and the elastic moduli shown in
Table 3 are obtained.
It can be seen from
Table 3 that the elastic modulus of a
1.2-0.35 is about 17.99 GPa, which is consistent with the natural mechanical properties of the tibia, and the porosity of a
1.2-0.35 is also the largest, which meets the medical standards for personalized implantation. Therefore, after comprehensively considering the pore size, porosity, equivalent elastic modulus, laser powder bed fusion molding constraint and tensile strength, the regular octahedron structure with square cell body unit side length a = 1.2 mm and pillar diameter d = 0.35 mm is selected as the best parameter for the design of porous structure of tibial implant.
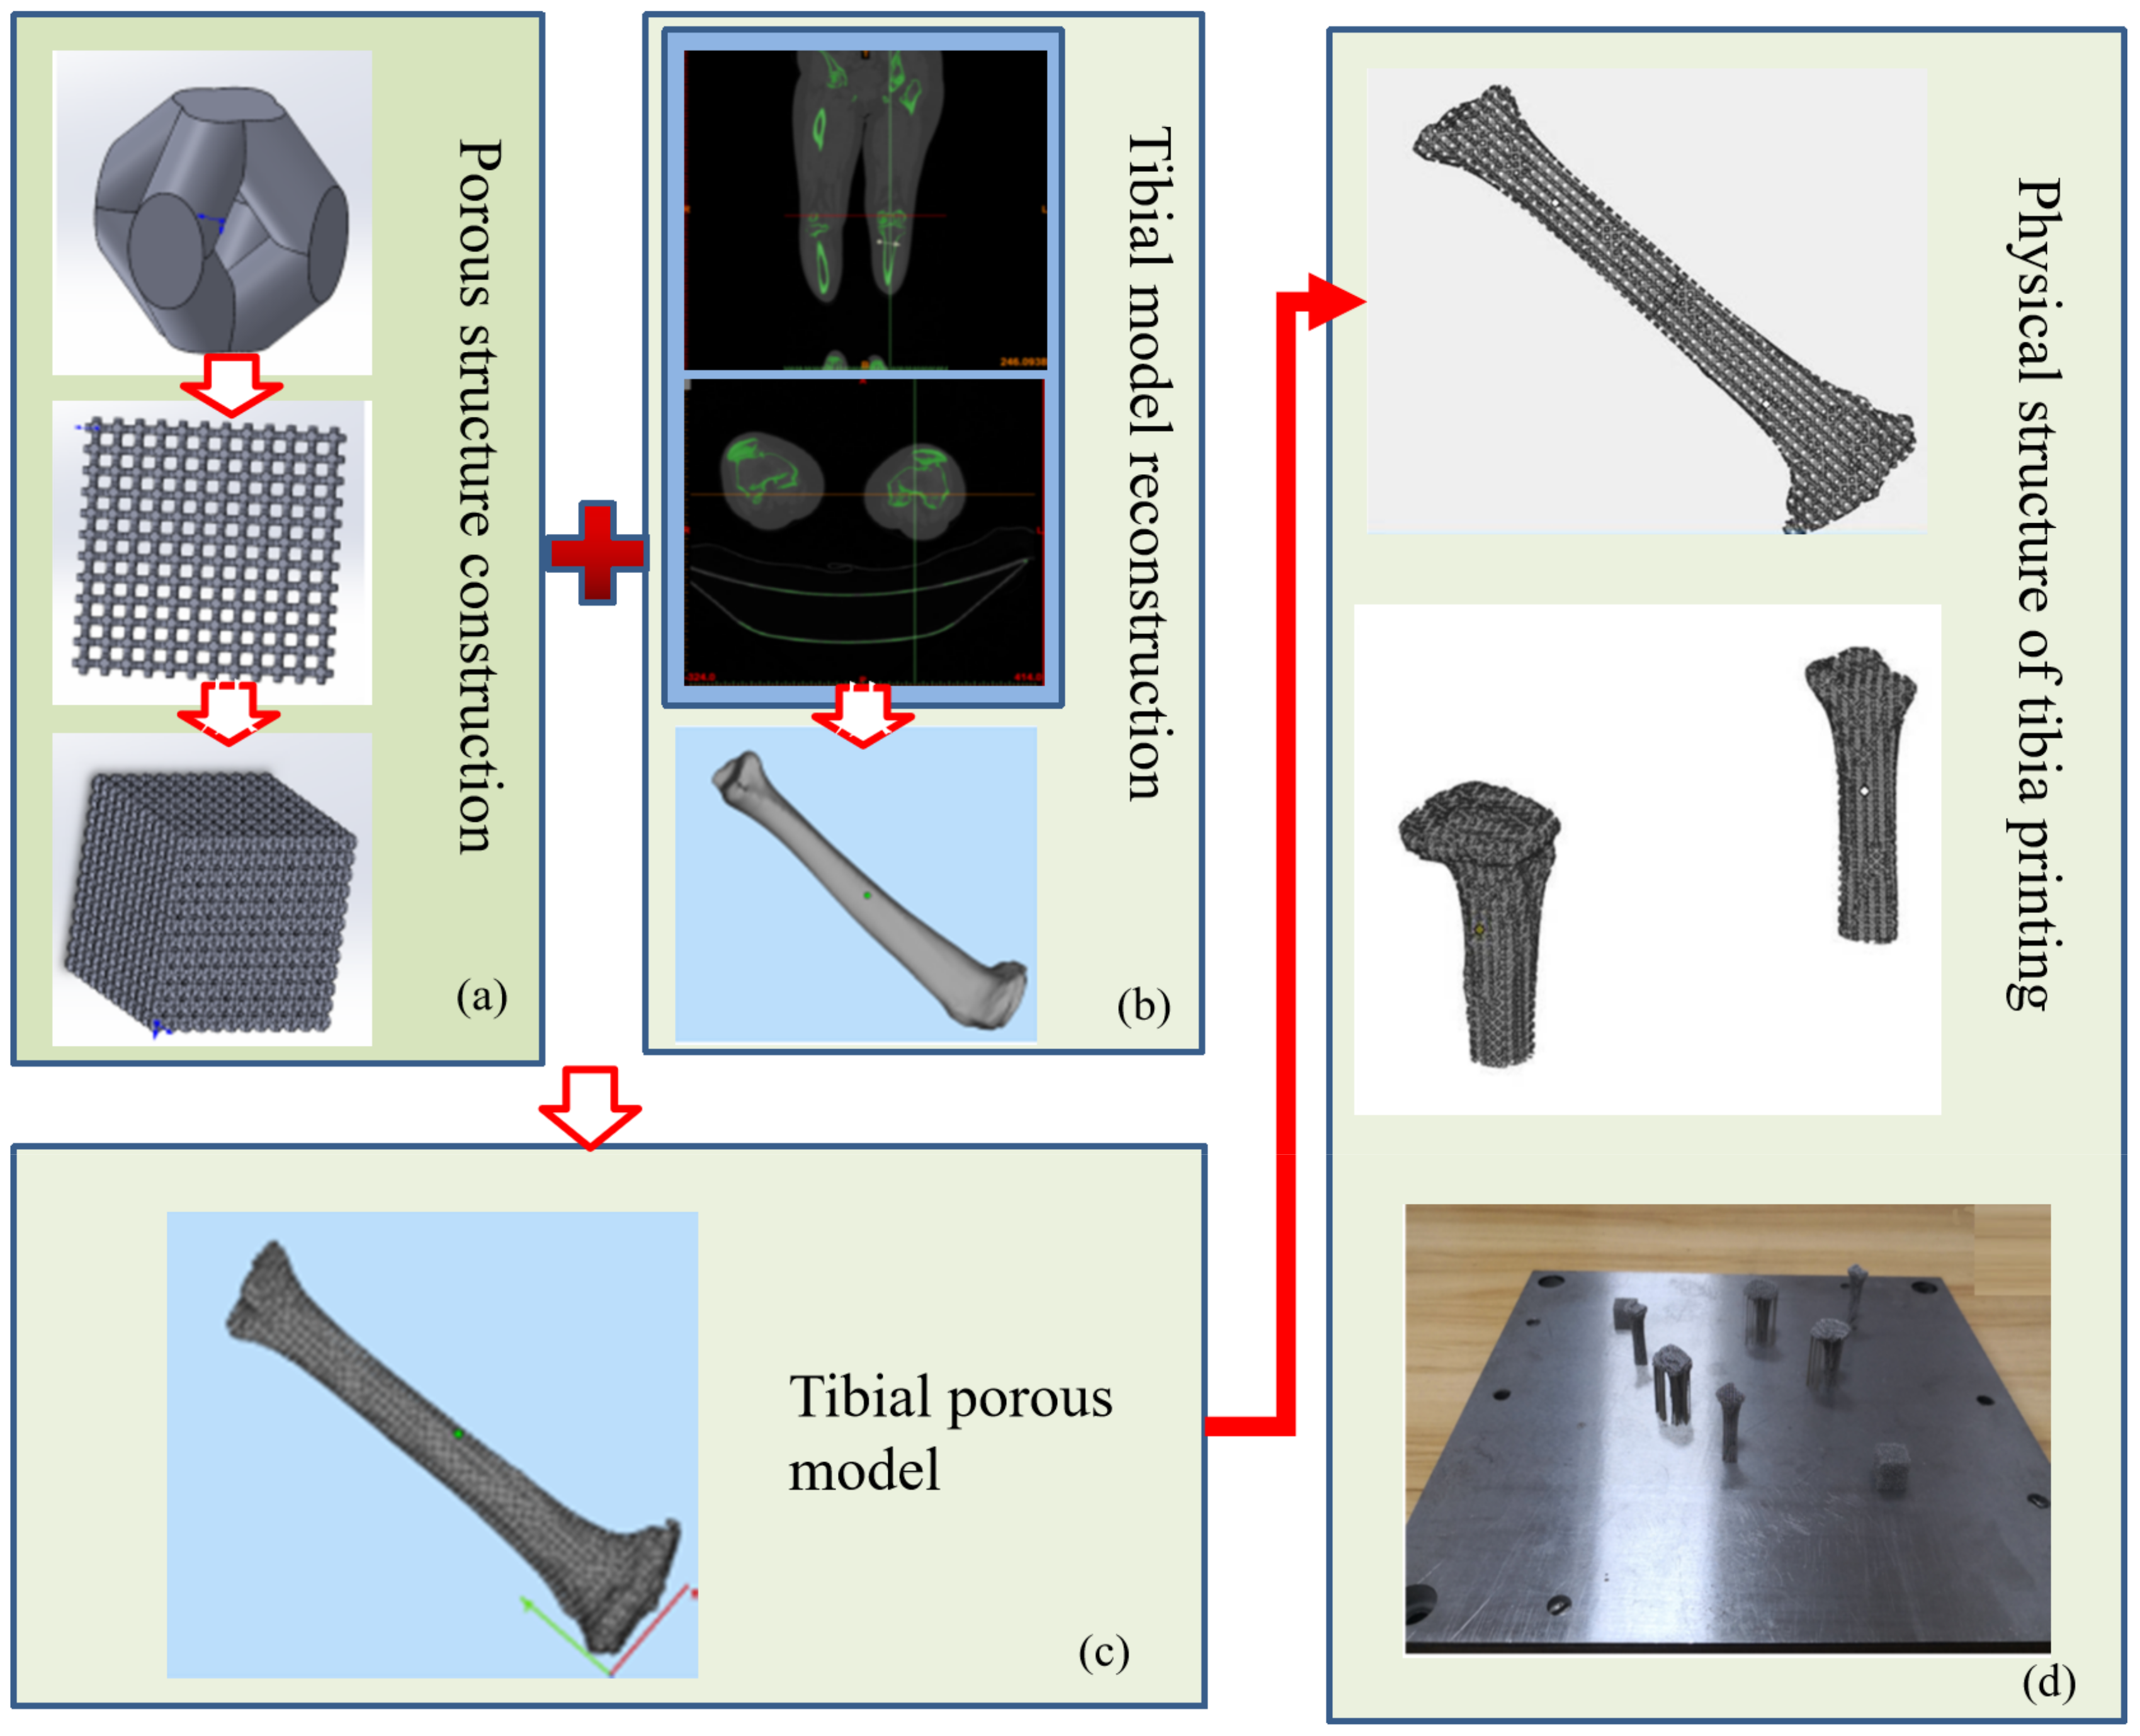
The detailed modeling steps of a porous tibial implant are as shown in
Figure 14:
Using the scanning command of SolidWorks software, first scan a square scanning body with diameter D through the center of the upper surface, the lower surface, and the two side planes. Similarly, scan another scanning body with diameter D in the plane perpendicular to the scanning body. Finally, the regular octahedron structure model is obtained by cutting off the vertices of six faces through a cube with side length.
The regular octahedral cell body unit is used to generate the regular octahedral structure porous model through plane and spatial array, and then the tibial implant solid model and spatial regular octahedral porous structure are transformed into STL format.
The Boolean intersection operation is carried out in magics software to obtain the porous tibial implant model with the external characteristics of tibial implant and the porous characteristics of regular octahedron, which is used for the pretreatment of laser powder bed fusion manufacturing.
In order to verify the comprehensive mechanical properties of porous structure, the tensile samples of stainless steel 316L material are prepared by using metal 3D printing equipment ep-m250: the size is formulated according to the ASTM standardized test method for a tensile test of metal materials, with gauge distance g = 35 mm and section width t = 6 mm, as shown in
Figure 15a [
44].The tensile samples are formed by using the optimized process parameters of laser power P = 180 W, scanning speed v = 1000 mm/s, scanning spacing S = 0.08 mm, and powder layer thickness ∆ z = 0.05 mm. The standard samples and porous structures samples printed results was shown in
Figure 15b; among them, the design porosity of the porous structures sample is 71.07%.
At room temperature, fix both ends of the samples on the special fixture of the microcomputer controlled electronic universal testing machine, so that the length direction of the specimen is perpendicular to the horizontal plane. In order to ensure the requirements of the standard tensile test for the measured displacement accuracy, the electronic extensometer is clamped on the test piece, the testing machine is opened, and the loading speed is set to 2 mm/min. In the experiment, the load displacement curve is observed. As shown in
Figure 15c, the tensile deformation process of stainless steel 316L sample mainly experienced three stages: elastic stage, strengthening stage, and local deformation stage. In the elastic stage, the samples of the three tensile samples are relatively close, and the real stress–strain curve is approximately a straight line. The elastic modulus of the three stainless steel 316L samples is obtained by calculating the slope of the straight line. It includes the tensile strength, yield strength, elongation and elastic modulus. According to the data in the table, the average value of tensile strength is 608.21 MPa, the average value of yield strength is 478.10 MPa, the average value of elongation after fracture is 37.67%, and the average value of elastic modulus is 193.6 GPa. The tensile deformation process of the porous stainless steel 316L sample mainly experienced two stages: an elastic stage and strengthening stage. In the elastic stage, the samples of the three porous tensile samples are relatively close, and the real stress–strain curve is approximately a straight line. The elastic modulus of the three stainless steel 316L samples is about 3.63 MPa by calculating the slope of the straight line. After the elastic stage, there is no obvious yield stage. The material recovers its ability to resist deformation and enters the strengthening stage. It shows a certain plasticity without necking, and soon breaks at the highest load. The average tensile strength is 17.88 MPa, which is far less than that of the standard sample. This is because the existence of porous holes significantly reduces the load borne by the sample, and the inner circle of the octahedral porous structure is a sphere. Therefore, the edge of the porous hole is a circular arc, resulting in more concentrated stress at the connection of the porous structure, which will produce a lot of cracks, resulting in the tensile performance of the porous tensile part being much lower than that of the standard solid tensile sample. Moreover, the pore diameter, pore spacing, pore regularity and porosity of porous structure will also have a great impact on the tensile properties of porous structure. Although the tensile strength of the octahedral porous structure is not as good as that of standard tensile parts, its elastic modulus is reduced due to the characteristics of porous structure, which makes it closer to natural bone.
5. Conclusions
In this paper, 316L stainless steel powder is used as the main material. Firstly, the influence of different process parameters on thermal strain is explored, and the optimal process parameter is determined as “the laser power is 180 W, the laser scanning speed is 1000 mm/s, the laser beam diameter is 80 μm, and the powder layer thickness is 50 μm”.
We then constructed the heat transfer model under the irradiation of the semi-elliptical heat source model and the multi-field coupling model of the molten state; the determined optimal process parameters are used in the numerical simulation of the laser powder bed fusion process, and the simulation results of the temperature distribution in the molten pool and the change of the molten pool during single-layer single-pass scanning and single-layer double-pass scanning are obtained. It is revealed that the quality of SLM (selective laser melting) molded parts is mainly affected by the steam recoil and Marangoni effect. It can be seen from the figure that the surface flatness of the solidified liquid metal in the melt channel is good. Although there is still a small amount of bubbles inside, it is still within the acceptable range.
Then, EP-M250 equipment is used to print the porous stainless steel tibial using the above-mentioned optimal process parameters. According to the scanning electron microscope image, it can be clearly seen that the quality of porous stainless steel tibial printed with optimized parameters is obviously better than that of porous stainless-steel parts printed with unoptimized parameters; however, there are still defects and cracks inside the optimized porous stainless-steel parts, which are consistent with the simulation results.
By observing the electron microscope image of the printed porous stainless steel 316L cube, it can be clearly observed that the surface quality of the porous stainless steel 316L cube printed with the optimal laser parameters is consistent with the analysis results of the numerical simulation. At the same time, according to the results of the tensile experiment, it can be obtained that the porous stainless steel 316L tensile specimen printed with the optimal laser parameters has good tensile strength and elastic modulus, which meets the requirements of implants.
Through further analysis of the causes of defects and cracks, we proposed two methods of “heating the substrate” and “preheating the material” to suppress cracks and defects. After using the above method to print the porous stainless-steel parts, it can be clearly seen from the scanning electron micrograph that the internal cracks and defects of the porous stainless-steel parts are greatly suppressed, and the microscopic appearance is good.


 ,
, 


