
On the Estimation of the Binary Response Model

 , ,
, ,  , , and
Abstract
:1. Introduction
2. Statistical Method
2.1. The Proposed Estimator
2.2. Theoretical Comparison
2.3. Parameter Estimation
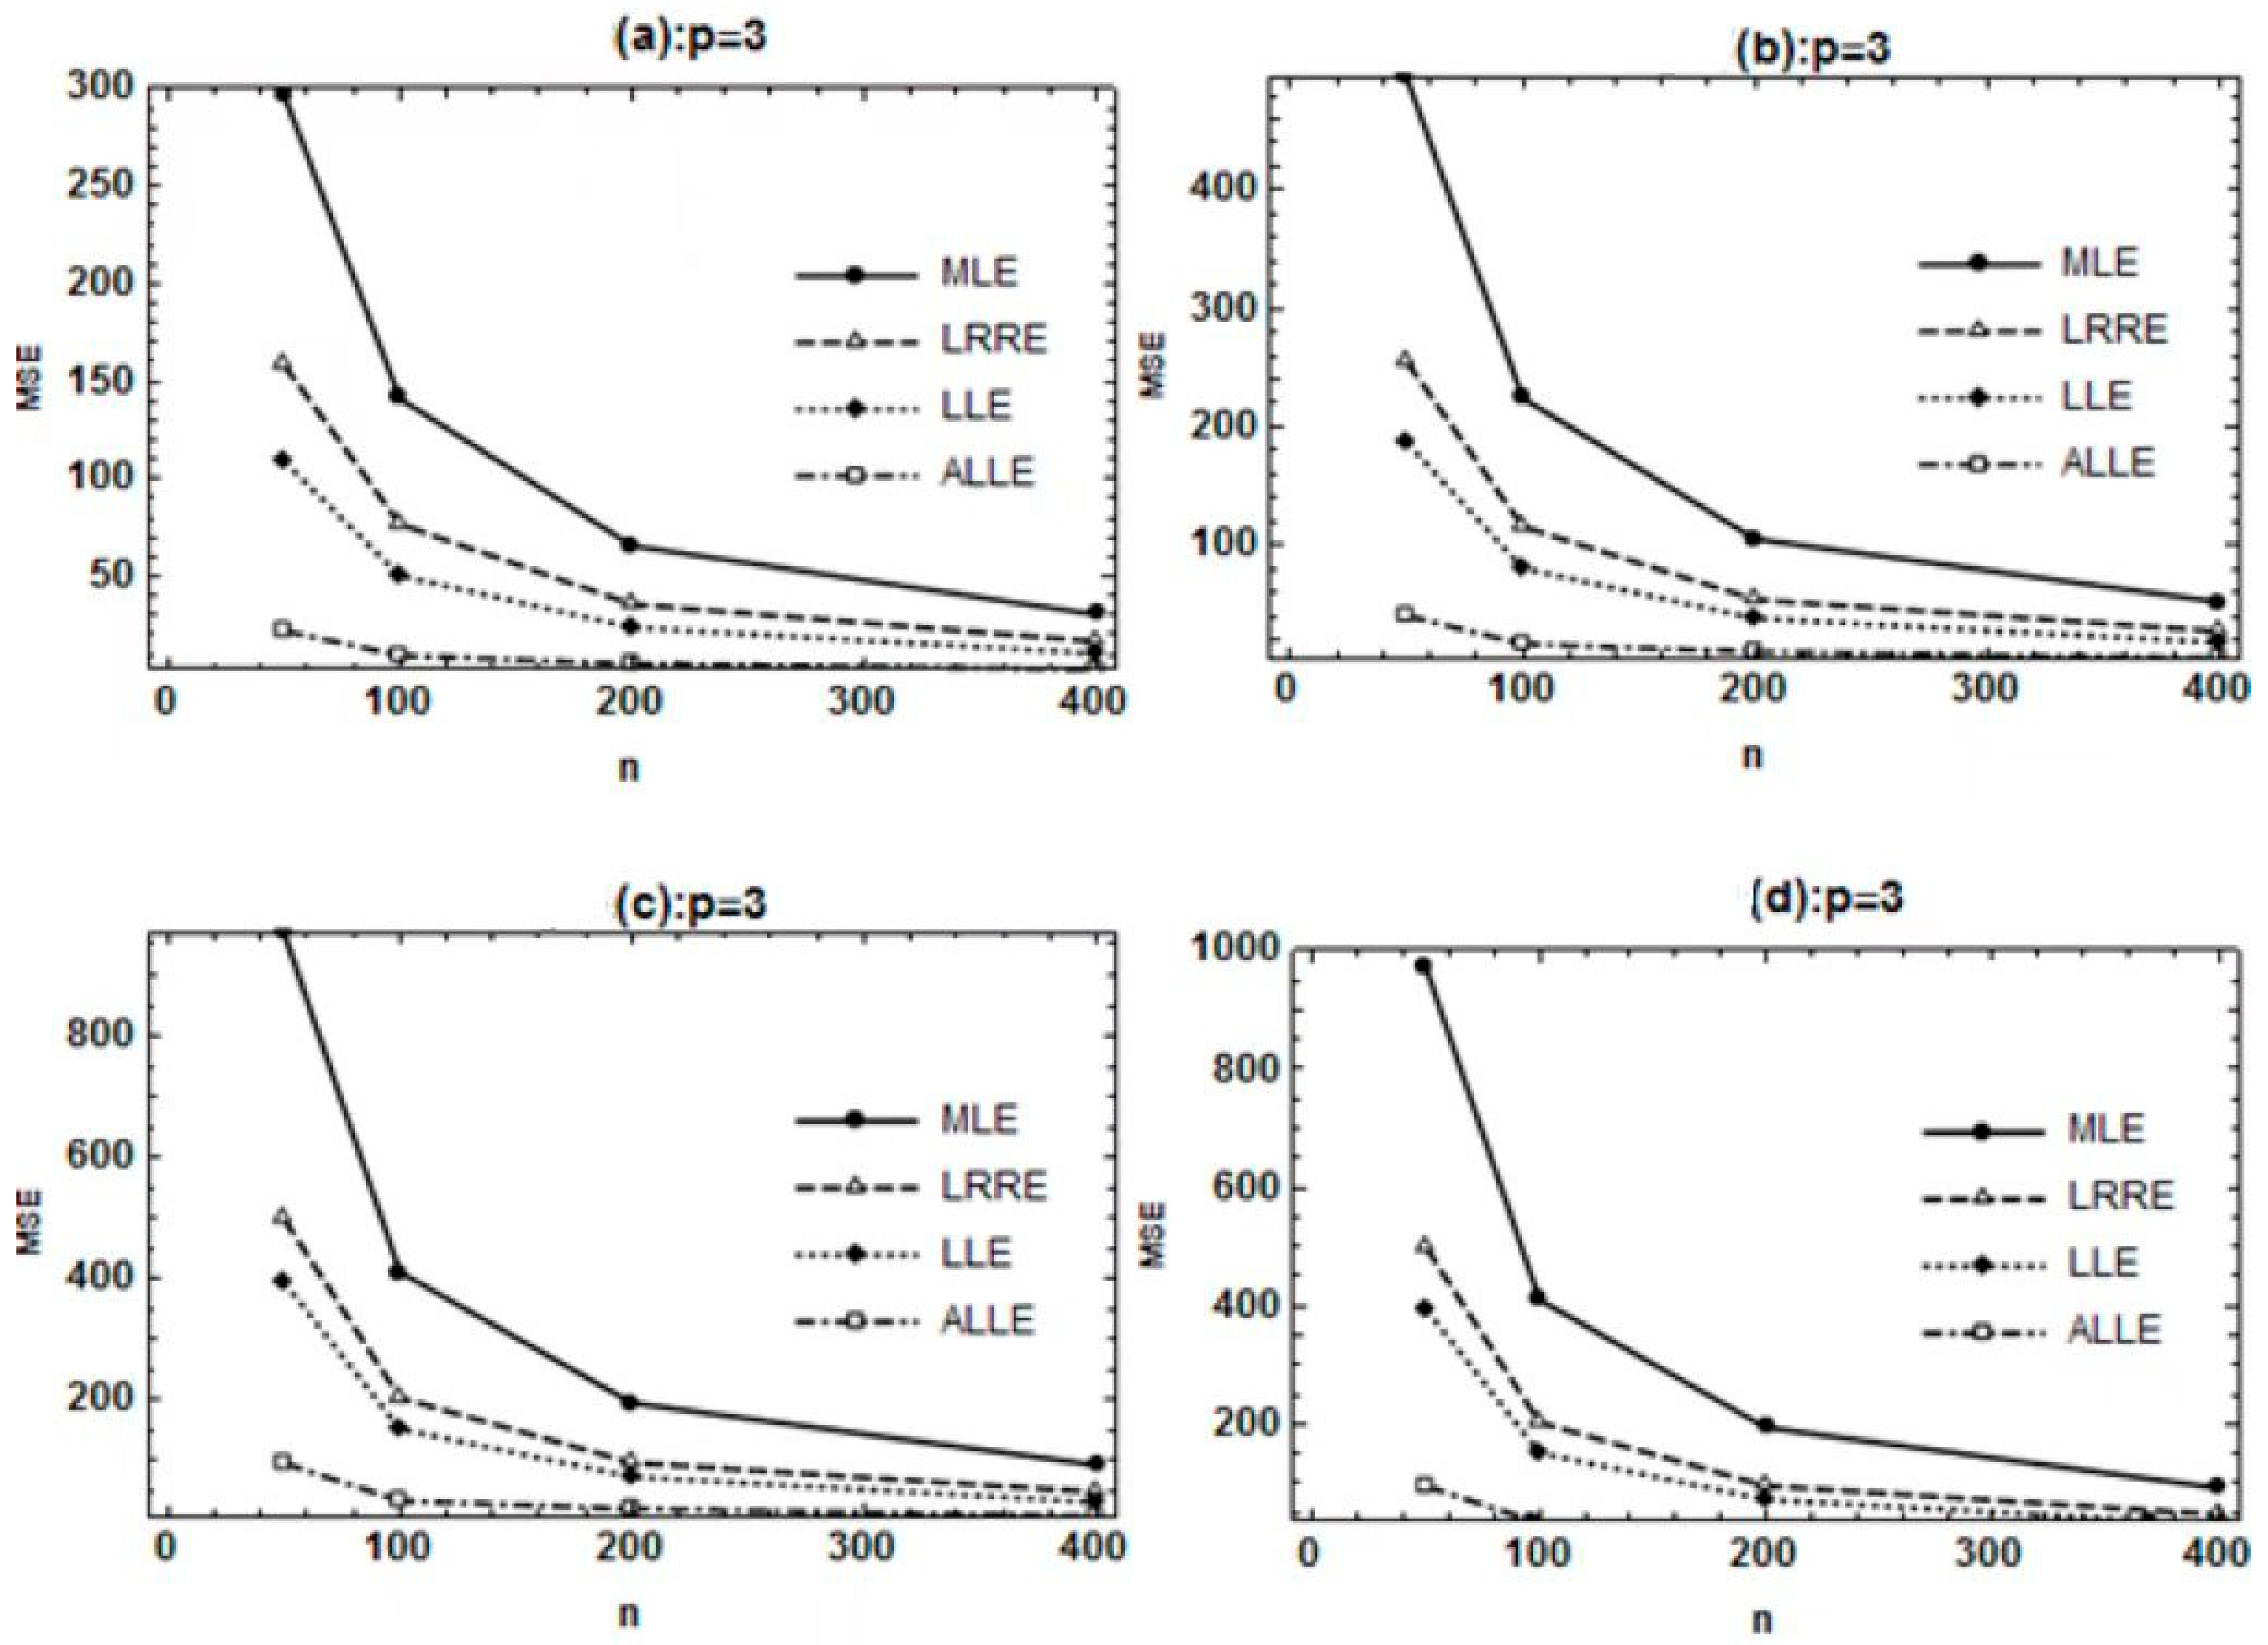
3. Simulation
3.1. Design
3.2. Discussion
4. Application
5. Concluding Remarks
Author Contributions
Funding
Data Availability Statement
Acknowledgments
Conflicts of Interest
Appendix A
References
- Lin, E.; Lin, C.-H.; Lane, H.-Y. Logistic ridge regression to predict bipolar disorder using mRNA expression levels in the N-methyl-D-aspartate receptor genes. J. Affect. Disord. 2022, 297, 309–313. [Google Scholar] [CrossRef] [PubMed]
- Afzal, N.; Amanullah, M. Dawoud–Kibria Estimator for the Logistic Regression Model: Method, Simulation and Application. Iran. J. Sci. Tech. Trans. A Sci. 2022, 46, 1483–1493. [Google Scholar] [CrossRef]
- Schaefer, R.L. Alternative estimators in logistic regression when the data are collinear. J. Stat. Comput. Simul. 1986, 25, 75–91. [Google Scholar] [CrossRef]
- Lukman, A.F.; Ayinde, K. Review and classifications of the ridge parameter estimation techniques. Hacet. J. Math. Stat. 2017, 46, 953–967. [Google Scholar] [CrossRef]
- Frisch, R. Statistical confluence analysis by means of complete regression systems. Econ. J. 1934, 45, 741–742. [Google Scholar]
- Hoerl, A.E.; Kennard, R.W. Ridge regression: Biased estimation for nonorthogonal problems. Technometrics 1970, 12, 55–67. [Google Scholar] [CrossRef]
- Schaefer, R.L.; Roi, L.D.; Wolfe, R.A. A ridge logistic estimator. Commun. Stat.—Theor. Methods 1984, 13, 99–113. [Google Scholar] [CrossRef]
- Lee, A.H.; Silvapulle, M.J. Ridge estimation in logistic regression. Commun. Stat. Simul. Comput. 1988, 17, 1231–1257. [Google Scholar] [CrossRef]
- Cessie, S.L.; Houwelingen, J.C.V. Ridge estimators in logistic regression. J. R. Stat. Soc. C 1992, 41, 191–201. [Google Scholar] [CrossRef]
- Segerstedt, B. On ordinary ridge regression in generalized linear models. Commun. Stat. Theor. Method. 1992, 21, 2227–2246. [Google Scholar] [CrossRef]
- Akram, M.N.; Amin, M.; Elhassanein, A.; Aman Ullah, M. A new modified ridge-type estimator for the beta regression model: Simulation and application. AIMS Math. 2022, 7, 1035–1057. [Google Scholar] [CrossRef]
- Kibria, B.M.G.; Månsson, K.; Shukur, G. Performance of some logistic ridge regression estimators. Comput. Econ. 2012, 40, 401–414. [Google Scholar] [CrossRef]
- Asar, Y. Some new methods to solve multicollinearity in logistic regression. Commun. Stat. Simul. Comput. 2017, 46, 2576–2586. [Google Scholar] [CrossRef]
- Hadia, M.; Amin, M.; Akram, M.N. Comparison of link functions for the estimation of logistic ridge regression: An application to urine data. Commun. Stat. Simul. Comput. 2022. [Google Scholar] [CrossRef]
- Liu, K. A new class of biased estimate in linear regression. Commun. Stat. 1993, 22, 393–402. [Google Scholar]
- Mansson, K.; Kibria, B.M.G.; Shukur, G. On Liu estimators for the logit regression model. Econ. Model. 2012, 29, 1483–1488. [Google Scholar] [CrossRef]
- Qasim, M.; Amin, M.; Amanullah, M. On the performance of some new Liu parameters for the gamma regression model. J. Stat. Comput. Simul. 2018, 88, 3065–3080. [Google Scholar] [CrossRef]
- İnan, D.; Erdoğan, B.E. Liu-type logistic estimator. Commun. Stat. Simul. Comput. 2013, 42, 1578–1586. [Google Scholar] [CrossRef]
- Şiray, G.Ü.; Toker, S.; Kaçiranlar, S. On the restricted Liu estimator in the logistic regression model. Commun. Stat. Simul. Comput. 2015, 44, 217–232. [Google Scholar] [CrossRef]
- Asar, Y.; Genc, A. New shrinkage parameters for the Liu-type logistic estimators. Commun. Stat. Simul. Comput. 2016, 45, 1094–1103. [Google Scholar] [CrossRef]
- Wu, J. Modified restricted Liu estimator in logistic regression model. Comput. Stat. 2016, 31, 1557–1567. [Google Scholar] [CrossRef]
- Wu, J.; Asar, Y. More on the restricted Liu estimator in the logistic regression model. Commun. Statist. Simul. Comput. 2017, 46, 3680–3689. [Google Scholar] [CrossRef]
- Lukman, A.F.; Kibria, B.M.G.; Ayinde, K.; Jegede, S.L. Modified one-parameter Liu estimator for the linear regression model. Model. Simul. Eng. 2020, 2020, 9574304. [Google Scholar] [CrossRef]
- Wu, J.; Asar, Y.; Arashi, M. On the restricted almost unbiased Liu estimator in the logistic regression model. Commun. Stat. Theor. Method. 2018, 47, 4389–4401. [Google Scholar] [CrossRef]
- Varathan, N.; Wijekoon, P. Logistic Liu estimator under stochastic linear restrictions. Stat. Pap. 2019, 60, 595–612. [Google Scholar] [CrossRef]
- Pregibon, D. Logistic regression diagnostics. Ann. Stat. 1981, 9, 705–724. [Google Scholar] [CrossRef]
- Li, Y.; Asar, Y.; Wu, J. On the stochastic restricted Liu estimator in logistic regression model. J. Stat. Comput. Simul. 2020, 90, 2766–2788. [Google Scholar] [CrossRef]
- Amin, M.; Akram, M.N.; Kibria, B.M.G. A new adjusted Liu estimator for the Poisson regression model. Concurr. Comput. Pract. Exper. 2021, 33, e6340. [Google Scholar] [CrossRef]
- Farebrother, R.W. Further results on the mean square error of ridge regression. J. R. Stat. Soc. 1976, 38, 248–250. [Google Scholar]
- Mustafa, S.; Amin, M.; Akram, M.N.; Afzal, N. On the performance of link functions in the beta ridge regression model: Simulation and application. Concurr. Comput. Pract. Exper. 2022, 34, e7005. [Google Scholar] [CrossRef]
- Kutner, M.H.; Nachtsheim, C.J.; Neter, J.; Li, W. Applied Linear Statistical Models, 5th ed.; McGraw Hill: New York, NY, USA, 2005. [Google Scholar]


| Bias | MSE | |||||||
|---|---|---|---|---|---|---|---|---|
| n | LRRE | LLU | ALLE | MLE | LRRE | LLU | ALLE | |
| 50 | 0.80 | −0.1164 | −0.0706 | −0.0181 | 297.24 | 158.62 | 109.11 | 22.15 |
| 0.90 | 0.1104 | 0.0454 | −0.0059 | 495.09 | 255.09 | 187.01 | 40.57 | |
| 0.95 | −0.0601 | −0.0047 | −0.0572 | 970.93 | 498.44 | 393.88 | 95.04 | |
| 0.99 | 0.2172 | 0.1165 | −0.0585 | 4195.40 | 1971.66 | 1634.97 | 431.22 | |
| 100 | 0.80 | 0.2245 | 0.1493 | −0.0182 | 141.16 | 76.78 | 50.44 | 9.45 |
| 0.90 | 0.1207 | 0.0485 | −0.0047 | 224.26 | 115.77 | 80.56 | 16.53 | |
| 0.95 | 0.1288 | 0.0948 | −0.0192 | 410.35 | 202.71 | 151.40 | 32.77 | |
| 0.99 | −0.0330 | −0.0106 | −0.0178 | 1858.28 | 873.64 | 698.43 | 166.81 | |
| 200 | 0.80 | 0.0348 | 0.0297 | −0.0201 | 65.68 | 35.79 | 23.81 | 5.17 |
| 0.90 | 0.1545 | 0.0914 | −0.0048 | 105.27 | 54.22 | 38.29 | 9.97 | |
| 0.95 | 0.1235 | 0.0583 | 0.0107 | 194.05 | 95.79 | 72.44 | 19.80 | |
| 0.99 | 0.2043 | 0.0872 | 0.0328 | 925.09 | 423.63 | 348.39 | 118.45 | |
| 400 | 0.80 | 0.0584 | 0.0394 | 0.0067 | 30.47 | 16.65 | 10.46 | 2.32 |
| 0.90 | 0.2181 | 0.1382 | 0.0566 | 52.09 | 27.34 | 17.83 | 4.48 | |
| 0.95 | 0.1036 | 0.0689 | 0.0183 | 91.95 | 47.21 | 30.58 | 7.20 | |
| 0.99 | 0.0694 | 0.0341 | 0.0212 | 435.24 | 213.83 | 142.51 | 37.29 | |
| Bias | MSE | |||||||
|---|---|---|---|---|---|---|---|---|
| n | LRRE | LLU | ALLE | MLE | LRRE | LLU | ALLE | |
| 50 | 0.80 | 0.2889 | 0.1538 | −0.0200 | 983.86 | 547.58 | 350.62 | 21.41 |
| 0.90 | 0.0248 | 0.0232 | −0.0343 | 1820.37 | 982.09 | 656.32 | 44.56 | |
| 0.95 | 0.2548 | 0.1422 | 0.0029 | 3505.32 | 1879.78 | 1249.99 | 67.30 | |
| 0.99 | 0.4358 | 0.2714 | −0.0154 | 17,361.14 | 9256.68 | 6295.43 | 407.18 | |
| 100 | 0.80 | 0.1648 | 0.1086 | −0.0137 | 349.73 | 200.38 | 114.25 | 6.74 |
| 0.90 | 0.1927 | 0.0948 | 0.0303 | 617.50 | 339.62 | 195.78 | 12.17 | |
| 0.95 | 0.2478 | 0.1529 | 0.0361 | 1224.53 | 666.51 | 392.01 | 24.99 | |
| 0.99 | 0.0427 | 0.0111 | 0.0100 | 5899.93 | 3172.73 | 1845.47 | 120.22 | |
| 200 | 0.80 | 0.2858 | 0.2014 | 0.0484 | 152.74 | 89.51 | 48.15 | 3.12 |
| 0.90 | 0.3155 | 0.1970 | 0.0865 | 273.10 | 155.04 | 84.30 | 4.79 | |
| 0.95 | 0.3309 | 0.2162 | 0.0968 | 516.23 | 285.45 | 156.09 | 8.09 | |
| 0.99 | 0.2304 | 0.1557 | 0.0749 | 2529.83 | 1393.39 | 756.02 | 37.58 | |
| 400 | 0.80 | 0.1762 | 0.1265 | 0.0719 | 73.58 | 43.07 | 22.74 | 2.16 |
| 0.90 | 0.1934 | 0.1410 | 0.0957 | 135.46 | 76.29 | 40.17 | 3.36 | |
| 0.95 | 0.2236 | 0.1625 | 0.1109 | 252.20 | 139.15 | 72.36 | 5.01 | |
| 0.99 | 0.2450 | 0.1807 | 0.1292 | 1203.21 | 652.75 | 330.89 | 18.81 | |
| Bias | MSE | |||||||
|---|---|---|---|---|---|---|---|---|
| n | LRRE | LLU | ALLE | MLE | LRRE | LLU | ALLE | |
| 50 | 0.80 | 0.6909 | 0.5045 | −0.0052 | 3448.20 | 1847.27 | 1398.01 | 17.48 |
| 0.90 | 0.5428 | 0.3454 | 0.0074 | 1,049,972.88 | 3275.03 | 2453.74 | 29.13 | |
| 0.95 | 0.6166 | 0.4575 | 0.0142 | 884,816.47 | 6229.80 | 4808.46 | 63.91 | |
| 0.99 | 0.4064 | 0.2876 | −0.0199 | 2,162,403.68 | 30,159.23 | 23,554.65 | 590.93 | |
| 100 | 0.80 | 0.4906 | 0.3261 | 0.0717 | 818.31 | 495.73 | 265.91 | 3.52 |
| 0.90 | 0.2566 | 0.1681 | 0.0480 | 1447.22 | 861.72 | 454.04 | 5.08 | |
| 0.95 | 0.3170 | 0.2055 | 0.0675 | 2849.43 | 1697.90 | 906.36 | 8.21 | |
| 0.99 | 0.0922 | 0.0587 | 0.0131 | 13,816.37 | 8172.86 | 4350.73 | 30.44 | |
| 200 | 0.80 | 0.2717 | 0.1904 | 0.1051 | 322.54 | 200.00 | 94.28 | 3.01 |
| 0.90 | 0.1694 | 0.1185 | 0.0773 | 586.96 | 357.99 | 169.71 | 3.78 | |
| 0.95 | 0.3037 | 0.2306 | 0.1461 | 1144.84 | 698.86 | 330.32 | 4.79 | |
| 0.99 | 0.2496 | 0.1941 | 0.1276 | 5603.54 | 3422.06 | 1606.92 | 16.26 | |
| 400 | 0.80 | 0.3649 | 0.2926 | 0.2101 | 143.93 | 91.70 | 41.90 | 2.77 |
| 0.90 | 0.2928 | 0.2394 | 0.1839 | 257.25 | 160.64 | 71.30 | 2.82 | |
| 0.95 | 0.2859 | 0.2350 | 0.1873 | 498.05 | 309.52 | 136.67 | 3.23 | |
| 0.99 | 0.2874 | 0.2443 | 0.1925 | 2399.74 | 1479.83 | 647.96 | 6.25 | |
| N | Regressor Call | Explanation |
|---|---|---|
| 1 | PSA level | Serum prostate- specific antigen level (mg/mL). |
| 2 | Cancer volume (CV) | Estimate of prostate cancer volume (cc). |
| 3 | Weight | Prostate weight (gm) |
| 4 | Age | Age of patients (years) |
| 5 | Benign prostatic hyperplasia (BPH) | Amount of benign prostatic hyperplasia (cm2) |
| 6 | Capsular penetration (CP) | Degree of capsular penetration (cm) |
| 7 | Gleason score (GS) | Pathologically determined grade of disease using total score of two patterns (summed scores were either 6, 7, or 8 with higher scores indicating more prognosis). |
| MLE | LRRE | LLE | ALLE | |
|---|---|---|---|---|
| (Intercept) | −10.1574 | −2.3825 | −5.8266 | 0.4431 |
| x1 | 0.1189 | 0.1090 | 0.1134 | 0.0985 |
| x2 | −0.1345 | −0.1146 | −0.1234 | −0.0915 |
| x3 | 0.0001 | 0.0002 | 0.0001 | −0.0001 |
| x4 | 0.0973 | 0.0220 | 0.0553 | −0.0169 |
| x5 | −0.2281 | −0.2185 | −0.2228 | −0.2021 |
| x6 | 0.6487 | 0.6513 | 0.6501 | 0.5976 |
| x7 | −0.0673 | −0.4491 | −0.2799 | −0.4555 |
| MSE | 45.6873 | 4.0569 | 15.9075 | 2.2935 |
Disclaimer/Publisher’s Note: The statements, opinions and data contained in all publications are solely those of the individual author(s) and contributor(s) and not of MDPI and/or the editor(s). MDPI and/or the editor(s) disclaim responsibility for any injury to people or property resulting from any ideas, methods, instructions or products referred to in the content. |
© 2023 by the authors. Licensee MDPI, Basel, Switzerland. This article is an open access article distributed under the terms and conditions of the Creative Commons Attribution (CC BY) license (https://creativecommons.org/licenses/by/4.0/).
Share and Cite
Amin, M.; Akram, M.N.; Kibria, B.M.G.; Alshanbari, H.M.; Fatima, N.; Elhassanein, A. On the Estimation of the Binary Response Model. Axioms 2023, 12, 175. https://doi.org/10.3390/axioms12020175
Amin M, Akram MN, Kibria BMG, Alshanbari HM, Fatima N, Elhassanein A. On the Estimation of the Binary Response Model. Axioms. 2023; 12(2):175. https://doi.org/10.3390/axioms12020175
Chicago/Turabian StyleAmin, Muhammad, Muhammad Nauman Akram, B. M. Golam Kibria, Huda M. Alshanbari, Nahid Fatima, and Ahmed Elhassanein. 2023. "On the Estimation of the Binary Response Model" Axioms 12, no. 2: 175. https://doi.org/10.3390/axioms12020175
APA StyleAmin, M., Akram, M. N., Kibria, B. M. G., Alshanbari, H. M., Fatima, N., & Elhassanein, A. (2023). On the Estimation of the Binary Response Model. Axioms, 12(2), 175. https://doi.org/10.3390/axioms12020175