Article

Sensitivity Analysis of a 2D Stochastic Agent-Based and PDE Diffusion Model for Cancer-on-Chip Experiments

1
Institute of Systems Analysis and Informatics “A. Ruberti” (IASI), National Research Council of Italy, Via dei Taurini 19, 00185 Rome, Italy
2
CNR—Institute for Applied Mathematics “Mauro Picone”, University Campus Biomedico of Rome, LUISS Carlo Guidi, Via Álvaro del Portillo 21, 00128 Rome, Italy
3
Institute for Applied Mathematics “Mauro Picone” (IAC), National Research Council of Italy, Via dei Taurini 19, 00185 Rome, Italy
4
Institute for Biomedical Research and Innovation (IRIB), National Research Council of Italy (CNR), Via Ugo la Malfa 153, 90146 Palermo, Italy
5
Department of Biomatics, Óbuda University, Bécsi út 96/B, 1034 Budapest, Hungary
*
Author to whom correspondence should be addressed.
Axioms 2023, 12(10), 930; https://doi.org/10.3390/axioms12100930
Submission received: 9 August 2023 / Revised: 17 September 2023 / Accepted: 26 September 2023 / Published: 28 September 2023
(This article belongs to the Special Issue Dynamical Systems: Theory and Applications in Mathematical Biology)

Abstract

:
The present work extends a previous paper where an agent-based and two-dimensional partial differential diffusion model was introduced for describing immune cell dynamics (leukocytes) in cancer-on-chip experiments. In the present work, new features are introduced for the dynamics of leukocytes and for their interactions with tumor cells, improving the adherence of the model to what is observed in laboratory experiments. Each system’s solution realization is a family of biased random walk trajectories, affected by the chemotactic gradients and in turn affecting them. A sensitivity analysis with respect to the model parameters is performed in order to assess the effect of their variation on both tumor cells and on leukocyte dynamics.

1. Introduction

In recent years, mathematical modeling has become an increasingly important tool for studying biological systems. Previous works in this field have employed various modeling techniques, including agent-based ODE models [1,2,3], cellular automata [4,5], partial differential models (PDE models) describing cell density or chemical gradient variations [6,7,8], or hybrid models [9] mixing PDEs (partial differential equations) and ODEs (ordinary differential equations), in order to investigate the behavior of cells and of other agents and the diffusion of molecules. These models combine discrete-based methods for cell migration with continuum-based methods for solute transport. Cellular automata, in particular, were first shown to be effective for modeling migrating tissue cells by Zygourakis and colleagues in the early 1990s [10,11,12]. This approach was later extended in order to develop hybrid models for other applications, such as modeling heterogeneous biofilms, biofilms in microfluidic chips, and proliferating tumors [13,14,15].
In vitro experiments are often used to mimic in vivo phenomena with representations of reduced complexity, which allow experimentalists to isolate and analyze the underlying mechanisms.
In the context of cancer-on-chip (COC) experiments, several publications [16,17,18,19,20] have provided a biological framework for the representation in vitro of different in vivo scenarios, as in, for example, the work of Paul et al. [21], which provides a concise overview of the usefulness of microfluidic experiments for the migration of tumor cells in engineered confined spaces.
In recent publications of some of the authors, the macroscopic modeling of COC experiments and related estimation techniques for model parameters have been proposed [22,23]. Moreover, a discrete-in-continuous hybrid approach was formulated as a PDE reaction–diffusion partial model for the evolution of chemicals, coupled with an ODE particle model for cell motion [24]. Some of the present authors proposed a rather general agent-based cellular automata model for the representation of leukocyte dynamics in COC experiments [25], and a first validation of the model was carried out by visually calibrating the model parameters against aggregated real data (using the time of transition from the right to left compartment and a fraction of leukocytes in the chip’s compartments as indicators).

Motivation and Original Contribution of the Present Work

In the framework of in silico models for COC experiments, our current study aims to extend the previous version of the model we already developed [25]. Since our approach is based on relatively simple computational algorithms (cellular automata and agents), it makes it easier to reproduce the chip geometry with respect to other possible approaches like those mentioned above. However, the main obstacle of this approach in its original implementation was represented by the extremely high computational cost of the simulations, making its general applications impractical. One of the main improvements introduced here consists in developing efficient computational tools to allow fast simulations, also with a view to integrate them in a formally correct procedure for parameter estimation from observational data.
Summarizing, the main motivations inspiring the present work are (i) adding features to the model [25] in order to make it more adherent to experimentally observed dynamics; (ii) gaining insights on the effect of some model parameters on the model outputs; and (iii) setting up computationally efficient simulation tools.
In particular, the changes made with respect to the previous model are the following:
  • Besides chemotactic migration, leukocytes also randomly explore the environment;
  • Both leukocytes and tumor cells have an upper bound for their lifetimes (i.e., they have a limited number of iterations in the simulation in which they are considered to be active);
  • The interaction between tumor cell agents and leukocyte agents leads to a reduction in the lifetime of the former (immune-mediated toxicity to the tumor cells);
  • The width of the microchannels is marginally reduced to deny leukocyte movement along the y axis (in accordance with empirical observations);
  • Even in the absence of annexin, leukocytes randomly explore the environment around them;
  • The code is optimized, translated in Julia v1.8.3, and parallelized in order to vastly improve the performance of the algorithm and drastically reduce simulation time.
It is worth noting that in the present version of the model, the dynamics (annexin diffusion and leukocytes behavior) are bidirectionally “coupled”, since the evolution of the concentration of annexin produced by cancer cells may vary depending on the killing rate of these cells caused by the leukocytes. This implies that it is no longer possible to numerically simulate the diffusion of annexin once and for all, and then, in one or more separate instances, the movement of leukocytes is based on the annexin gradient in the microchip. While the computational cost of a single simulation increases substantially, the resulting model behavior is clearly more general.
This paper is structured as follows. In Section 2, we provide an overview of the biological framework that serves as the inspiration for our study. Section 3.1 introduces the mathematical formulation of the COC agent-based model, and the innovations introduced in this new version of the model are highlighted. In Section 4, we present numerical simulations, along with the results of our calibration of the model parameters and sensitivity analysis. Finally, Section 5 provides a discussion of the results and concluding remarks.

2. Biological Experiment

The monitored area in the COC experiment [16,26,27] consists of three main culture chambers: one for plating adherent tumor cells, one for microchannels, and one where floating leukocytes are introduced.
Microchannels allow for chemical and physical contacts between chambers. This type of configuration is able to quite realistically reproduce the physiochemical environment and the mechanical stresses acting on the living cells within a tissue hosting a tumor colony. Here, we focus on the laboratory experiments provided in [17], and, among the experimental settings proposed there, we focus on the case where cancer cells are dying (they are subjected to chemotherapy) and immune cells are wild-type. The immune population under examination consists of different cell species: monocytes, dendritic cells, and T and B lymphocytes. Figure 1 shows a screenshot of the experiment extracted from video footage reported in the open repository provided by the original authors as Supplementary Material in [17]. The whole experiment lasts 48–72 h, and the timeframe of the video recordings is 2 min.

3. The Mathematical Model

3.1. Hybrid Agent-Based Cellular Automata Model

Cellular automata are computational tools that have been extensively used for modeling complex systems in different fields, including physics, chemistry, biology, and engineering. One of the significant advantages of cellular automata is their ability to study phenomena that display emergent behavior, including pattern formation, self-organization, and phase transitions [4]. These automata consist of a grid of cells that undergo evolution over time, subject to simple rules based on the states of their neighboring cells. Over such a cellular automaton, it is possible to have moving agents, which interact among themselves and with the underlying cells through proximity effects.
The present computer model formalizes the behavior of leukocytes and tumor cells as they respond to chemical gradients, i.e., annexin, and allows for the analysis of the resulting interaction dynamics between these cells: as such, it improves and extends the previous agent-based model formulation reported in [25] in order to make the model more adherent to experimental evidence and allow us to extrapolate more realistic scenarios. The present improved model is able to numerically reproduce the random exploration of the environment as well as the migration of leukocytes towards cancer cells in a physical microchip as well as the time evolution of the chemoattractant field given by annexin, where the production, diffusion, and elimination of this substance cause a gradient of its concentration to be progressively established over the chip environment.
We simulate the movement of cells and their interactions with each other as determined via this annexin gradient, making it possible to replicate the directed migration of leukocytes towards cancer cells, based upon local biological assumptions.
The model depends on a set of parameters (see Table 1), such as time step, cell sizes, chip dimensions and geometry, the number of tumor and leukocyte cells and their rate of accrual, and the properties of the annexin gradient. As described in Table 1, some model parameters are taken from the literature or depend on experimental settings, while other parameters are obtained from the calibration of the model performed in [25] in order to reproduce the dynamics in the video footage of the experiment in [17].
The simulation results can be synthesized, obtaining statistical information about the time-course of the simulated experiments, such as aggregated cell positions or cell death rates.
The movement of the lth leukocyte is described by the time/space discrete equation between time t and time t + Δ t in the case of the presence of annexin concentration:
p l ( t + Δ t ) = p l n ( t ) , with probability P M ( p , t ) · P ( p n , t ) , n = 1 , , N p ( t ) , p ( t ) , with probability P ( p , t ) ,
with M p l = { p n centered at ( i n , j n ) | ( x n x l ) 2 + ( y n y l ) 2 R L } the set of N p Moore neighbors of the pixel p l , where the l t h leukocyte center is located, and R L is the radius of leukocytes (assumed all of the same size in the present version of the model). The movement of leukocytes is tracked at the pixel occupied in the grid ( p = ( i , j ) ), and we define p l = ( i l , j l ) as the pixel occupied by the center of the leukocyte, with P ( p n ) the probability of movement towards p n (the generic neighboring pixel in the N p -sized Moore neighborhood of p), at time t:
P ( p n , t ) = A ( p n , t ) λ T A ( λ , t ) , n = 1 , , N p ( t ) ,
with A ( p n , t ) the concentration of annexin at pixel p n and T A ( λ , t ) = n = 1 N p ( t ) A ( p n , t ) λ + A ( p , t ) λ the λ -corrected total concentration of annexin in the area (including the central pixel), varying in time and depending on parameter λ R + . In more detail, λ is an amplification parameter expressing the tendency of leukocytes to migrate towards higher annexin concentrations; γ > 0 is a threshold parameter regulating leukocytes migration (the lower the value of γ , the higher the neighboring annexin concentrations needed for the leukocyte to move); N L ( t ) is the total number of leukocytes at time t and P ( p , t ) the probability of remaining in place:
P ( p , t ) = 1 P M ( p , t ) n N p ( t ) A ( p n , t ) λ T A ( λ , t ) ,
while the probability of moving at all is as P M ( p , t ) = exp ( γ T A ( λ , t ) ) ; p corresponds to the (central) pixel where the leukocyte stays at time t.
In the absence of annexin, the leukocytes move randomly among one of their neighbors, following the equation below:
p l ( t + Δ t ) = p l n ( t ) , with probability 1 1 N p ( t ) + 1 , p ( t ) , with probability 1 N p ( t ) + 1 .
At the moment, no interactions among leukocytes are considered in the model, such as alignment, crowd effects, or the production of chemotactic factors.
The evolution of the chemoattractant, i.e., annexin, is modeled by the parabolic discrete equation describing its production, diffusion, and elimination similarly to the Keller–Segel model [6]:
A ( x , y , t ) t = k A + D A ( x , y , t ) k X A A ( x , y , t ) ,
including the production, diffusion, and elimination of the chemical substance for ( x , y , t ) Ω × [ 0 , T f ] . The final observation time is T f , which for the current experiment is 48 h. The initial condition at time t = 0 for the chemical concentration is A ( x , y , 0 ) = 0 , and we assume no inflow/outflow at the outer boundaries of the computational domain.
Since the leukocytes are immersed in an aqueous phase and the number of tumor cells is small, the effect of the extracellular matrix (ECM) secreted by the cancer cells [32] was not considered. Furthermore, annexin is considered independent of the direct action of leukocytes, since the production of annexin only depends on the presence of tumor cells.

3.2. Innovation: Leukocyte and Tumor Cell Death

Every agent in the present model has its own finite life span L, calculated as a random value between 0 and L L = 144 h for the leukocytes (they may have entered the chip at some unknown moment during their natural lifetime) and fixed to L T = 1000 h for tumor cells. We also define an age for each agent; the biological hypothesis is that a tumor cell lives (if not killed) much longer than the 48 h of simulation, while leukocytes tend to live a maximum of 144 h if they are not eliminated sooner by some process [31]. The age of each agent (variable A g e ) is increased at each time step: when its value becomes greater than or equal to its programmed lifetime, the agent is declared dead.
When a leukocyte moves to the location of a tumor cell (i.e., adheres to the tumor cell), the effect of its toxic action is modeled as an increase in the tumor cell’s age, thus accelerating its progression to death. The age increment is expressed as
A g e = A g e + k T L A g e L T + 1 ,
with k T L a parameter representing the interaction between leukocytes and tumor cells. In this way, the intensity of the interaction increases with the age of the tumor cell, thus making older tumor cells (i.e., the cells that have interacted more with leukocytes) die first.
Note that, since at the moment we do not have quantitative estimates of this value from real experiments, we calibrated k T L in such a way as to have an average value of 18% of dead tumor cells during the 48 h of the experiment, consistent with observations.

3.3. Innovation: Numerical Algorithm

The movement of the cells is considered, as before, to happen at a single-microchip depth, allowing for discretization on a bidimensional computational domain Ω , including the two chambers and the intervening channels. The whole chip is represented by a matrix M of square computational cells: considering a space mesh size of Δ x = Δ y = 10   μ m over a rectangle of size L x × L y   μ m ( L x = 1704   μ m and L y = 1560   μ m), when simulating the entire chip (including the N C = 31 horizontal microchannels), we deal with a pixel matrix of size N r × N c , with N r = 159 rows and N c = 171 columns.
The radius of each tumor cell is assumed to be R T = 10   μ m, while the radius of leukocytes is fixed at R L = 4   μ m. We used a time discretization step Δ t = 4   μ m, with N t = [ ( c e i l ) T f Δ t ] + 1 , so that we compute concentrations and positions at the discrete times t m , m = 0 , 1 , , N t 1 .
While the original model was implemented in a Matlab environment on an 8-core CPU, the current implementation of the simulation environment is Julia v1.8.3 on a 48-core CPU (2x AMD EPYC 74F3 24-core CPU @ 3.19 GHz): this change, together with some code optimization, has determined a huge increment in simulation speed (one complete 48 h simulation taking approximately 3 s instead of about 1 month). Code parallelization is used for sensitivity analysis.

3.4. Computational Steps

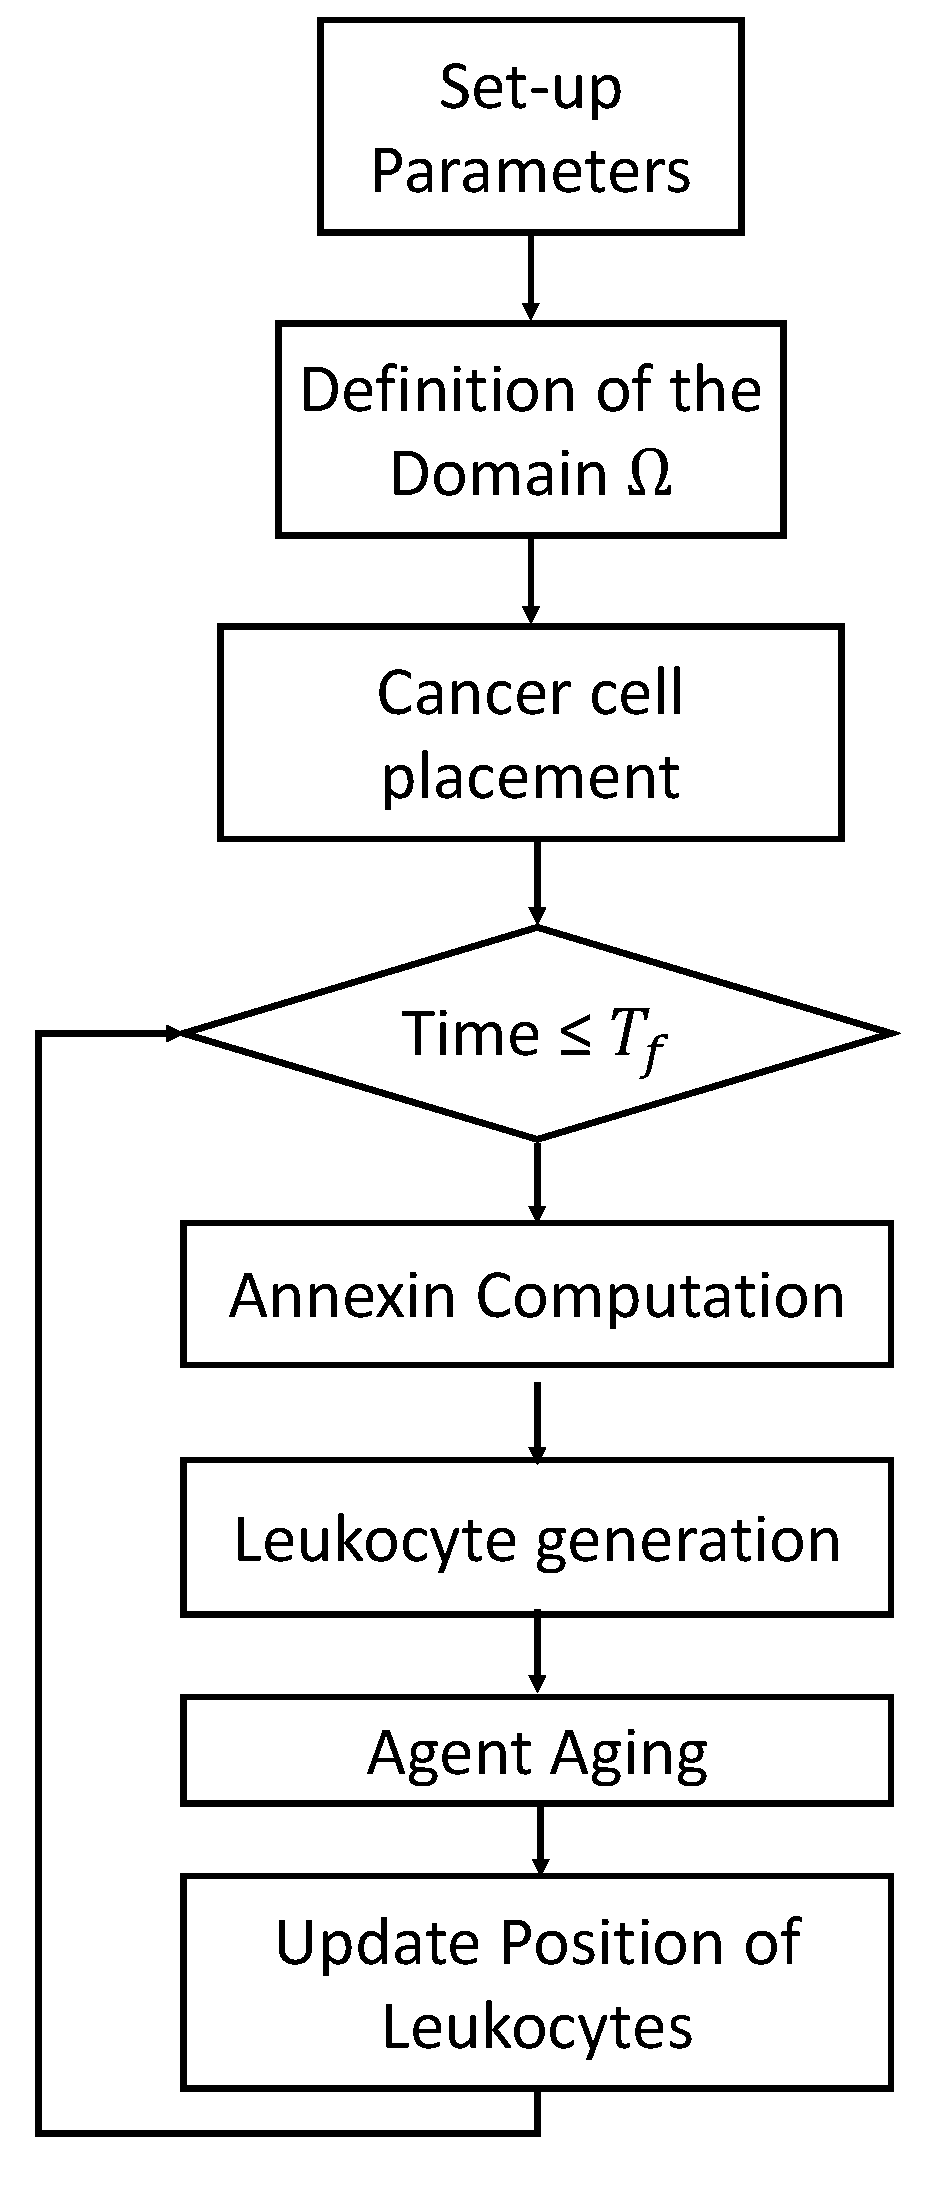
After defining the rules for annexin creation, diffusion, and loss, as well as for agent movement and death (Section 3.1, Section 3.2 and Section 3.3), the numerical solutions of the model are computed as shown in Figure 2.
The first step is the definition of model parameters, as reported in Table 1, and the discretization of the domain Ω described in Section 3.3. Cancer cells are then randomly placed in the left compartment and the simulation is started with their producing annexin, which diffuses and is lost according to Equation (3). The annexin concentration in the chip is represented as a bidimensional matrix A having size given by the number of rows and columns of the grid N r × N c . At the initial time t = 0 , the matrix A assumes the value zero over the whole domain.
The numerical solution is then computed up to t = T f . Each computational step includes the following:
  • Solving Equation (3) in the discretized domain. If A ( p n , t ) is the concentration of annexin at pixel p at each time step, we compute
    A ( p , t + Δ t ) = A ( p , t ) + k A Δ t k X A A ( p , t ) Δ t + D A d i f f ( p ) ,
    with A d i f f ( p , t + Δ t ) = A ( p , t ) n = 1 N p A ( p n , t ) / d n being the concentration of annexin obtained after the sharing among the N p neighbors of pixel p, with d n = | p p n | being the Euclidean distance among the pixel p and its neighbors. Then, neighboring pixels p n receive the amount of annexin shared by pixel p: A ( p n , t + Δ t ) = A ( p n , t ) + n = 1 N p A ( p n , t ) / d n .
    Note that the production in the grid cells not occupied by the tumor is zero, while the elimination and diffusion of annexin in the environment occurs in each cell of the computational domain;
  • Aging the agents to increase the age of both tumor cells and leukocytes;
  • Randomly generating new leukocytes appearing in the right chamber;
  • Determining the new leukocyte positions based on the calculated annexin concentration (as described in Section 3.1). In this step, it is also considered that if a leukocyte moves to the same location as a tumor cell, the age of that cancer cell increases, as shown in Equation (4).
By considering the annexin concentration and the agent positions in each computational step and remembering that the model is in a no-flow condition (nothing enters or leaves the domain), it is possible to track the behavior of the variables over time.

3.5. Sensitivity Analysis

In order to assess the effect of each model parameter on the numerical results, we set up a procedure for sensitivity analysis [33,34]. We selected 8 model parameters that we consider crucial for the behavior of the dynamical system, as deduced from the observation of model outcomes when they vary. In particular, for sensitivity analysis, we consider the following parameters:
  • k L , the normalized rate of new leukocyte accrual;
  • k A , the production rate of annexin;
  • k X A , the consumption rate of annexin;
  • λ , the parameter enforcing migration towards high concentration;
  • γ , the threshold value for migration;
  • k T L , the interaction coefficient between leukocytes and tumor cells;
  • L T , the tumor cells lifetime;
  • L L , the maximum leukocytes lifetime.
Sensitivity analysis was performed by increasing/decreasing the values of the 8 parameters, one at a time, by ± 20 % of their starting values (reported in Table 1).
Note that appreciably different trajectories are expected to be produced by the simulation algorithm with fixed parameters, due to the intrinsic stochasticity of our model. For this reason, we realized 10,000 simulations for each perturbed parameter value. As an indicative statistic of model outcomes, we computed the percentage of leukocytes in the left chamber and the percentage of dead tumor cells at each run for a single parameter value, and these statistics were then averaged. In addition, for control, 10,000 realizations of the model were carried out without varying the starting parameter values to obtain the reference simulation values.
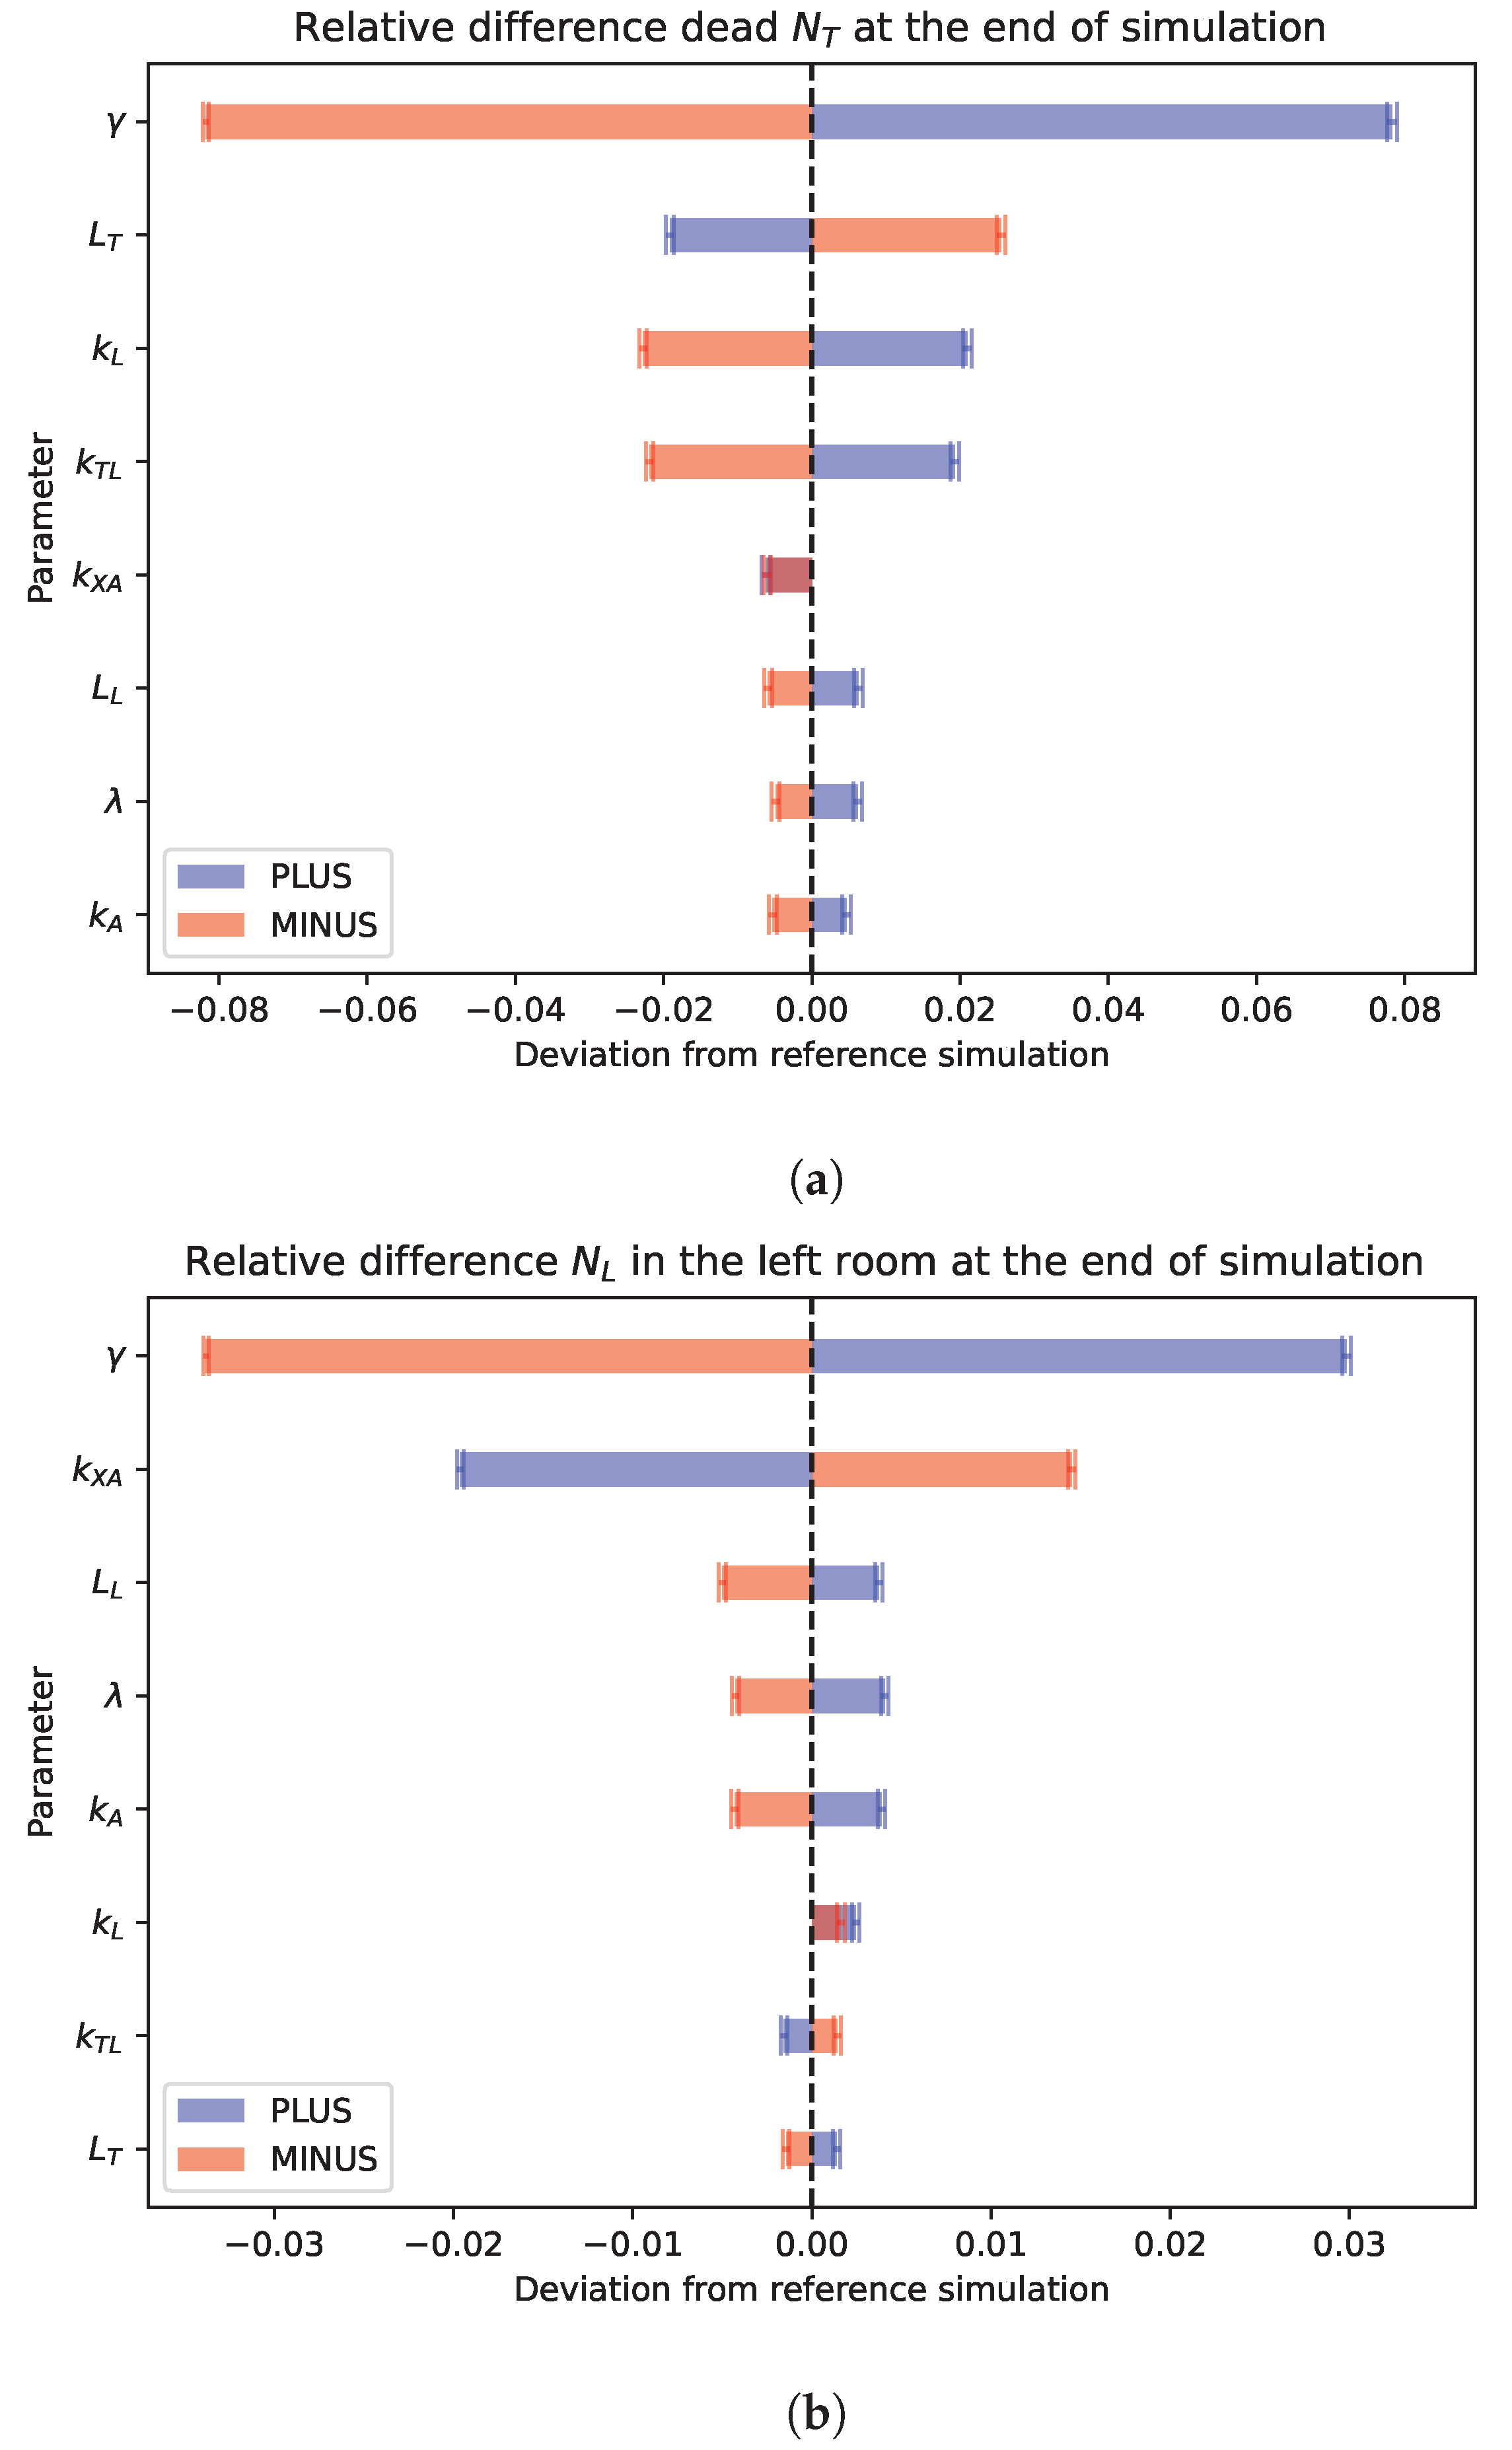
Obtained results are displayed using tornado diagrams with bars reporting the deviation of model parameters from the reference simulation and the related values of the indicators (see Figure 3a,b).

3.6. Preferred Direction

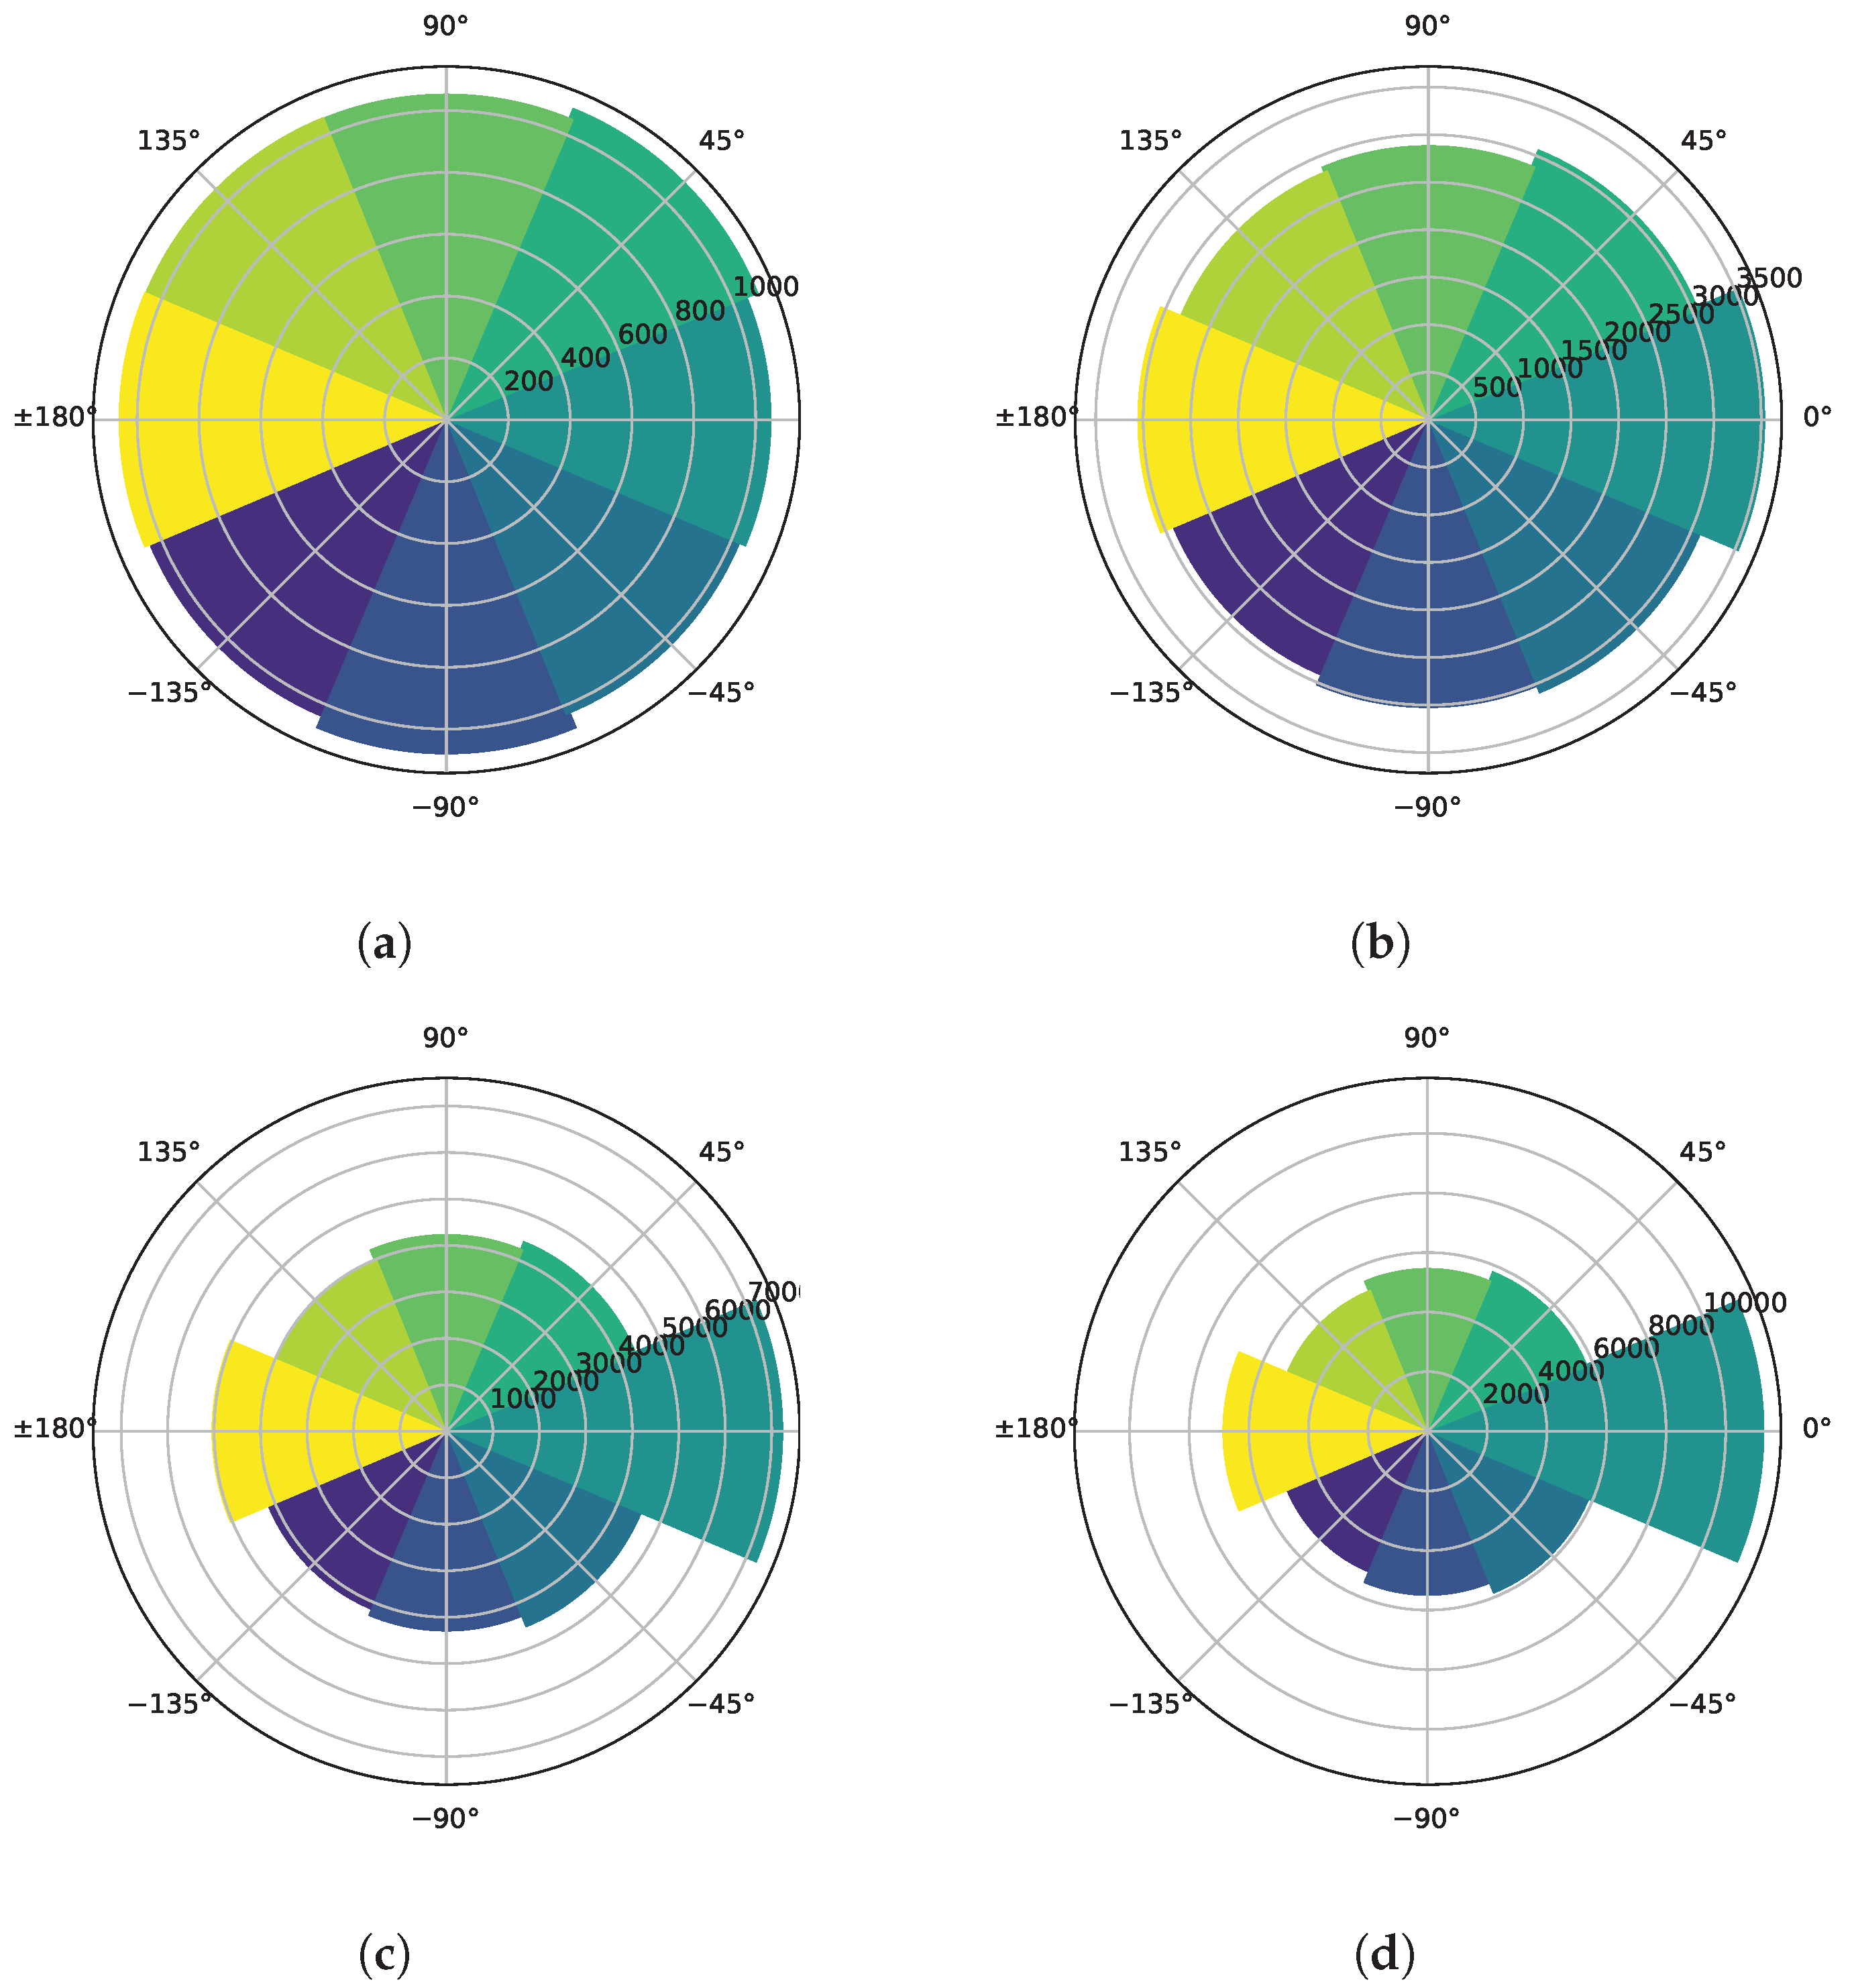
A single simulation with the parameter values reported in Table 1 was performed to assess the preferential direction of the leukocytes with respect to the annexin concentration gradient over time. The preferred direction is expressed as the angular difference between the annexin concentration gradient at time t and the direction of movement of the leukocyte between times t and t + Δ t . Angular differences are normalized to lie in the ( 180 , 180 ] interval.
In the case of the absence of annexin, hence in the case when an annexin concentration gradient cannot be detected (as for the initial simulation period over most of the domain), its direction was taken at random.
The results are then displayed as a polar histogram of the angular differences of the leukocyte preferred movement direction with respect to the annexin gradient.
In order to obtain the polar histogram, the following procedure was conducted:
  • The simulation of the migration of the leukocytes within the microfluidic chip environment.
  • The identification of the leukocyte positions at different time intervals throughout the simulation.
  • The computation of the “difference angle”, the angle between the displacement vector of each leukocyte and the local annexin gradient (this last identified as the direction of the neighboring cell with the highest annexin concentration; in cases where multiple neighboring cells contained the same amount of annexin, one of these cells was selected at random).
  • The grouping of difference angles into different time intervals.
  • The plotting of polar histograms to visualize the distribution of the difference angles for each time interval.
By following this procedure, we were able to analyze the directional preferences of leukocyte movement in relation to the annexin gradient across various time intervals.

4. Results

Using fixed parameter values reported in Table 1, leukocytes’ dynamics in the microchip subdomain is illustrated by ten movies obtained with ten realizations of the numerical algorithm and they are provided as Supplementary Material.
For the numerical simulations, at time t = 0 , we assume the initial condition:
A ( x , y , 0 ) = 0 , and N L ( 0 ) = 0 .
A continuous inflow of leukocytes is considered, randomly placed in the right chamber. The probability of adding a new leukocyte is proportional to the time step used Δ t :
P L = k L Δ t .
The movies show stationary tumor cells in the left chamber (green diamonds) and leukocytes in the right chamber (orange circles with purple tails, representing previously occupied positions) migrating to regions of high annexin concentration (field colored from blue, absence of annexin, to yellow, maximum concentration). A representation of the dynamics observed in the movies obtained via the numerical algorithm is provided in Figure 4, where four screenshots of the movie in the supporting movie files are depicted.
In order to analyze the sensitivity of each of the parameters in the simulation algorithm, we conducted multiple experiments in which the parameters were changed by ± 20 % with respect to the reference simulation parameters reported in Table 1. The results are depicted in the next Figure 3a,b, with error bars evaluated as the σ N , where σ = i N ( μ x i ) 2 / N is the sample variance and N is the number of simulations. Figure 3a shows the fraction of dead tumor cells at final time, while Figure 3b shows the relative difference of the leukocytes lying in the left chamber at final time. In both cases, the most sensitive parameter is γ , with more than 10% of variability of the index.
The directional preference of the leukocytes with respect to the annexin gradient during different simulation time intervals is shown in Figure 5. Initially, from 0 to 25 percent of the simulation time, leukocytes exhibit random movement patterns relative to the annexin maximum and the corresponding polar histogram is essentially uniform over 2 π . This result is expected since, at this stage, the chemical has not reached the left chamber, where the leukocytes are located, in sufficient amounts to generate a strong annexin gradient.
In the time span from 25 to 50 percent, a significant amount of annexin reaches the right chamber, leading leukocytes to preferentially move towards regions with higher annexin concentrations. This trend persists until the end of the simulation, making the histogram slice corresponding to 0 progressively larger.
It is worth noting that an additional preferred direction, albeit much less important than that at 0 , is observed at 180 . This is likely due to the confinement of the leukocytes within the channels, where the annexin gradient is essentially aligned with the microchannel and where the channel diameter restricts leukocyte movement to be either towards the left chamber ( 0 difference with respect to the annexin gradient) or, randomly, with smaller probability, towards the right chamber ( 180 difference with respect to the annexin gradient).
Looking at the obtained results in Figure 5, at times between 24 and 48 h (when the chemoattractant field is well established in the microenvironment), we can see that they match perfectly with the results reported in Figure 4 of the work by Biselli et al. [18]. Indeed, from the left picture of Figure 4 in [18], it is evident that the movement of wild-type leukocytes (CC) shows a focused trajectory (preferred direction) pointing straight to its target, as can also be observed in panels (c) and (d) of Figure 5.

5. Discussion

The previous model of leukocyte migration [25] was improved by adding features, making it more closely adapted to representing the actual experiments, and reimplementing it numerically in the vastly more powerful and efficient programming language Julia v1.8.3. This new version of the model includes new features for the dynamics of leukocytes and the interaction of leukocytes with tumor cells, limiting the life span of all cells and considering immune-induced toxicity.
The results obtained numerically, reported in Figure 4, as well as the movies in the Supplementary Material, show the directed migration of leukocytes from the right to the left chamber where tumor cells are located, as observed experimentally. The migration is biased by chemical stimuli: higher annexin concentrations increase the probability of movement in the corresponding direction (as suggested in [35,36]). As in the COC laboratory experiment, the numerical simulation shows that in the early hours leukocytes only occupy the right-hand chamber and they move randomly, according to an isotropic, two-dimensional Brownian motion hypothesized in the absence of sufficiently high driving concentrations of annexin. Migration begins approximately at time 24 h, when the diffused chemical flows through the microchannels. At the end of the simulation, a few leukocytes reach the left chamber and some of them kill tumor cells: consequently, a reduction in the concentration of annexin is observed.
Figure 3a,b show the difference between two observable statistics (respectively, the percentage of dead tumor cells and the percentage of leukocytes in the left chamber) as the simulation parameters shown on the y axis are perturbed. The statistics in both tornado diagrams indicate that the model is most sensitive to parameter γ . More in detail, as the threshold value for migration γ increases, we observe an increment in the number of leukocytes that migrate towards the left chamber of the simulated chip. This results in a higher number of interactions between leukocytes and tumor cells, allowing for a greater effect in eliminating the latter.
Considering the results reported in Figure 3b, another sensitive parameter is k X A . We noticed that as the parameter k X A —the apparent linear rate of annexin elimination—increases, the percentage of leukocytes in the left chamber and the percentage of dead cells decreases. This phenomenon can be explained as follows: when k X A increases, annexin is eliminated faster and its concentration in the chip decreases, thus leading to fewer leukocytes following the chemical gradient and moving towards the tumor cell chamber on the left. Conversely, when the k X A parameter decreases, a greater number of leukocytes move towards the left chamber, but they actually kill a smaller number of tumor cells (as it is possible to see in Figure 3a). This paradoxical effect can be explained by the fact that, as observed numerically, the concentration of annexin is initially higher around cancer cells, thus favoring the migration of leukocytes towards them. However, as the concentration of annexin near tumor cells becomes very high, it tends to be equally distributed over the (local) domain, and this excess of signal determines an essentially isotropic random walk of the leukocytes, which have less opportunity to damage cancer cells.
The simulation results also appear to be significantly affected by the parameter L T (the lifetime of tumor cells), as shown in Figure 3a. This is due to the fact that the longer tumor cells survive, the more annexin they produce, attracting more leukocytes towards the left chamber.

6. Conclusions

New features were added to the model, making it more realistic, such as the random movement of leukocytes for the exploration of the environment and the death of tumor cells caused by the interaction with leukocytes, as observed experimentally. Moreover, the improvements applied to the computational model and to its implementation made it more efficient and generally applicable, also in view of integrating it in a calibration procedure for tuning model parameters against laboratory data.
The sensitivity analysis carried out in the present work shows the effect of some model parameters on the overall results and indicates that our model apparently captures the important role of the cancer microenvironment for the migration and effectiveness of the leukocytes. The establishment of the chemical gradient, here represented by annexin, is evidently crucial in attracting leukocytes towards the tumor cells and causing their elimination. However, in order to develop a dependable in silico model of the biological experiment, fine tuning of the model parameters against available experimental data is still needed: this will require collecting and studying a large number of data extracted from laboratory experiments, such as leukocyte positions and trajectories from sequential images of ad hoc COC preparation using efficient tracking algorithms, as well as using appropriate statistical methods to derive accurate model parameter estimates. This could be the object of future research.
We believe that, with the necessary fine tuning of the model parameters, the mathematical/computational model here presented could serve as a support tool for biologists and clinicians, to explain and predict phenomena occurring in COC laboratory experiments. Moreover, such a tool could be used to quantify critical biomedical variables which are still difficult to be estimated via in vivo/in vitro techniques only (such as chemical gradients). This aspect is crucial in experimental drug testing in oncology. Although animal models are undoubtedly still necessary for the preclinical evaluation of drugs before first-in-human studies, highly predictive in vitro human cancer experiments (such as can be performed with COCs preparations), together with the application of appropriate theoretical methods, can play a very significant role in rationally prioritizing the drug candidates identified via large-size in vitro screenings.

Supplementary Materials

The following supporting information can be downloaded at https://www.mdpi.com/article/10.3390/axioms12100930/s1, Movie S1: Time evolution of leukocytes’ dynamics (realization 1). Video S2: Time evolution of leukocytes’ dynamics (realization 2). Movie S3: Time evolution of leukocytes’ dynamics (realization 3). Movie S4: Time evolution of leukocytes’ dynamics (realization 4). Movie S5: Time evolution of leukocytes’ dynamics (realization 5). Movie S6: Time evolution of leukocytes’ dynamics (realization 6). Movie S7: Time evolution of leukocytes’ dynamics (realization 7). Movie S8: Time evolution of leukocytes’ dynamics (realization 8). Movie S9: Time evolution of leukocytes’ dynamics (realization 9). Movie S10: Time evolution of leukocytes’ dynamics (realization 10).

Author Contributions

Methodology, G.B. and A.D.G.; Conceptualization, G.B. and A.D.G.; Software, M.P. and D.T.; Validation, M.P. and D.T.; Visualization, M.P. and D.T.; Data curation, M.P. and D.T.; Investigation, M.P., D.T., G.B. and A.D.G.; Writing, G.B., M.P. and D.T. All authors have read and agreed to the published version of the manuscript.

Funding

This research received no external funding.

Data Availability Statement

All data are contained within the article.

Conflicts of Interest

The authors declare no conflict of interest.

Abbreviations

The following abbreviations are used in this manuscript:
COCCancer-On-Chip

References

  1. An, G.; Mi, Q.; Dutta-Moscato, J.; Vodovotz, Y. Agent-based models in translational systems biology. Wiley Interdiscip. Rev. Syst. Biol. Med. 2009, 1, 159–171. [Google Scholar] [CrossRef] [PubMed]
  2. Politopoulos, I. Review and Analysis of Agent-Based Models in Biology; University of Liverpool: Liverpool, UK, 2007. [Google Scholar]
  3. Lee, S.W.L.; Seager, R.J.; Litvak, F.; Spill, F.; Sieow, J.L.; Leong, P.H.; Kumar, D.; Tan, A.S.M.; Wong, S.C.; Adriani, G.; et al. Integrated in silico and 3D in vitro model of macrophage migration in response to physical and chemical factors in the tumor microenvironment. Integr. Biol. 2020, 12, 90–108. [Google Scholar] [CrossRef]
  4. Wolfram, S. A New Kind of Science; Wolfram Media Champaign: Champaign, IL, USA, 2002; Volume 5. [Google Scholar]
  5. Reher, D.; Klink, B.; Deutsch, A.; Voss-Böhme, A. Cell adhesion heterogeneity reinforces tumour cell dissemination: Novel insights from a mathematical model. Biol. Direct 2017, 12, 1–17. [Google Scholar] [CrossRef] [PubMed]
  6. Keller, E.F.; Segel, L.A. Initiation of slime mold aggregation viewed as an instability. J. Theor. Biol. 1970, 26, 399–415. [Google Scholar] [CrossRef] [PubMed]
  7. Hillen, T.; Painter, K.J. A user’s guide to PDE models for chemotaxis. J. Math. Biol. 2009, 58, 183–217. [Google Scholar] [CrossRef]
  8. Mohammadi, V.; Dehghan, M. A POD-RBF-FD scheme for simulating chemotaxis models on surfaces. Eng. Anal. Bound. Elem. 2022, 143, 316–330. [Google Scholar] [CrossRef]
  9. Ciarletta, P.; Hillen, T.; Othmer, H.; Preziosi, L.; Trucu, D.; Othmer, H.G. Cell-based, continuum and hybrid models of tissue dynamics. In Mathematical Models and Methods for Living Systems. Lecture Notes in Mathematics; Springer: Cham, Switzerland, 2016; pp. 1–72. [Google Scholar]
  10. Zygourakis, K.; Bizios, R.; Markenscoff, P. Proliferation of anchorage-dependent contact-inhibited cells: I. Development of theoretical models based on cellular automata. Biotechnol. Bioeng. 1991, 38, 459–470. [Google Scholar] [CrossRef]
  11. Lee, Y.; Kouvroukoglou, S.; McIntire, L.V.; Zygourakis, K. A cellular automaton model for the proliferation of migrating contact-inhibited cells. Biophys. J. 1995, 69, 1284–1298. [Google Scholar] [CrossRef]
  12. Cheng, G.; Youssef, B.B.; Markenscoff, P.; Zygourakis, K. Cell population dynamics modulate the rates of tissue growth processes. Biophys. J. 2006, 90, 713–724. [Google Scholar] [CrossRef]
  13. Picioreanu, C.; Van Loosdrecht, M.C.; Heijnen, J.J. Mathematical modeling of biofilm structure with a hybrid differential-discrete cellular automaton approach. Biotechnol. Bioeng. 1998, 58, 101–116. [Google Scholar] [CrossRef]
  14. Kapellos, G.E.; Alexiou, T.S.; Payatakes, A.C. Hierarchical simulator of biofilm growth and dynamics in granular porous materials. Adv. Water Resour. 2007, 30, 1648–1667. [Google Scholar] [CrossRef]
  15. Shirinifard, A.; Gens, J.S.; Zaitlen, B.L.; Popławski, N.J.; Swat, M.; Glazier, J.A. 3D multi-cell simulation of tumor growth and angiogenesis. PLoS ONE 2009, 4, e7190. [Google Scholar] [CrossRef]
  16. Businaro, L.; De Ninno, A.; Schiavoni, G.; Lucarini, V.; Ciasca, G.; Gerardino, A.; Belardelli, F.; Gabrieleb, L.; Mattei, F. Cross talk between cancer and immune cells: Exploring complex dynamics in a microfluidic environment. Lab Chip 2013, 13, 229–239. [Google Scholar] [CrossRef] [PubMed]
  17. Vacchelli, E.; Ma, Y.; Baracco, E.E.; Sistigu, A.; Enot, D.P.; Pietrocola, F.; Yang, H.; Adjemian, S.; Chaba, K.; Semeraro, M.; et al. Chemotherapy-induced antitumor immunity requires formyl peptide receptor 1. Science 2015, 350, 972–978. [Google Scholar] [CrossRef]
  18. Biselli, E.; Agliari, E.; Barra, A.; Bertani, F.R.; Gerardino, A.; De Ninno, A.; Mencattini, A.; Di Giuseppe, D.; Mattei, F.; Schiavoni, G.; et al. Organs on chip approach: A tool to evaluate cancer-immune cells interactions. Sci. Rep. 2017, 7, 12737. [Google Scholar] [CrossRef]
  19. Comes, M.; Casti, P.; Mencattini, A.; DiGiuseppe, D.; Mermet-Meillon, F.; De Ninno, A.; Parrini, M.C.; Businaro, L.; Di Natale, C.; Martinelli, E.; et al. The influence of spatial and temporal resolutions on the analysis of cell-cell interaction: A systematic study for time-lapse microscopy applications. Sci. Rep. 2019, 9, 6789. [Google Scholar] [CrossRef]
  20. Gori, M.; Simonelli, M.C.; Giannitelli, S.M.; Businaro, L.; Trombetta, M.; Rainer, A. Investigating nonalcoholic fatty liver disease in a liver-on-a-chip microfluidic device. PLoS ONE 2016, 11, e0159729. [Google Scholar] [CrossRef]
  21. Paul, C.D.; Mistriotis, P.; Konstantopoulos, K. Cancer cell motility: Lessons from migration in confined spaces. Nat. Rev. Cancer 2017, 17, 131–140. [Google Scholar] [CrossRef]
  22. Braun, E.C.; Bretti, G.; Natalini, R. Mass-preserving approximation of a chemotaxis multi-domain transmission model for microfluidic chips. Mathematics 2021, 9, 688. [Google Scholar] [CrossRef]
  23. Braun, E.C.; Bretti, G.; Natalini, R. Parameter estimation techniques for a chemotaxis model inspired by Cancer-on-Chip (COC) experiments. Int. J.-Non-Linear Mech. 2022, 140, 103895. [Google Scholar] [CrossRef]
  24. Bretti, G.; DeNinno, A.; Natalini, R.; Peri, D.; Roselli, N. Estimation Algorithm for a Hybrid PDE–ODE Model Inspired by Immunocompetent Cancer-on-Chip Experiment. Axioms 2021, 10, 243. [Google Scholar] [CrossRef]
  25. Bretti, G.; DeGaetano, A. An Agent-Based Interpretation of Leukocyte Chemotaxis in Cancer-on-Chip Experiments. Mathematics 2022, 10, 1338. [Google Scholar] [CrossRef]
  26. Mattei, F.; Andreone, S.; Mencattini, A.; DeNinno, A.; Businaro, L.; Martinelli, E.; Schiavoni, G. Oncoimmunology meets organs-on-chip. Front. Mol. Biosci. 2021, 8, 627454. [Google Scholar] [CrossRef] [PubMed]
  27. Parlato, S.; DeNinno, A.; Molfetta, R.; Toschi, E.; Salerno, D.; Mencattini, A.; Romagnoli, G.; Fragale, A.; Roccazzello, L.; Buoncervello, M.; et al. 3D Microfluidic model for evaluating immunotherapy efficacy by tracking dendritic cell behaviour toward tumor cells. Sci. Rep. 2017, 7, 1093. [Google Scholar] [CrossRef]
  28. Murray, J.D. Mathematical Biology II: Spatial Models and Biomedical Applications; Springer: New York, NY, USA, 2001; Volume 3. [Google Scholar]
  29. Wiśniewski, J.R.; Hein, M.Y.; Cox, J.; Mann, M. A “proteomic ruler” for protein copy number and concentration estimation without spike-in standards. Mol. Cell. Proteom. 2014, 13, 3497–3506. [Google Scholar] [CrossRef] [PubMed]
  30. Boulter, E.; Grall, D.; Cagnol, S.; Van Obberghen-Schilling, E. Regulation of cell-matrix adhesion dynamics and Rac-1 by integrin linked kinase. FASEB J. 2006, 20, 1489–1491. [Google Scholar] [CrossRef]
  31. Bagge, U.; Gustav, V.; Gaehtgens, P. White Blood Cells: Morphology and Rheology as Related to Function; Springer Science & Business Media: Berlin/Heidelberg, Germany, 2013; Volume 1. [Google Scholar]
  32. Kapellos, G.E.; Alexiou, T.S. Modeling momentum and mass transport in cellular biological media: From the molecular to the tissue scale. In Transport in Biological Media; Elsevier: Amsterdam, The Netherlands, 2013; pp. 1–40. [Google Scholar]
  33. McCabe, C.; Paulden, M.; Awotwe, I.; Sutton, A.; Hall, P. One-Way Sensitivity Analysis for Probabilistic Cost-Effectiveness Analysis: Conditional Expected Incremental Net Benefit. Pharmacoeconomics 2020, 38, 135–141. [Google Scholar] [CrossRef]
  34. Reilly, T. Sensitivity Analysis for Dependent Variables. Decis. Sci. 2000, 31, 551–572. [Google Scholar] [CrossRef]
  35. Byrne, H.M.; Cave, G.; Mcelwain, D.L.S. The effect of chemotaxis and chemokinesis on leukocyte locomotion: A new interpretation of experimental results. Math. Med. Biol. J. IMA 1998, 15, 235–256. [Google Scholar] [CrossRef]
  36. Byrne, H.M.; Owen, M.R. A new interpretation of the Keller-Segel model based on multiphase modelling. J. Math. Biol. 2004, 49, 604–626. [Google Scholar] [CrossRef]
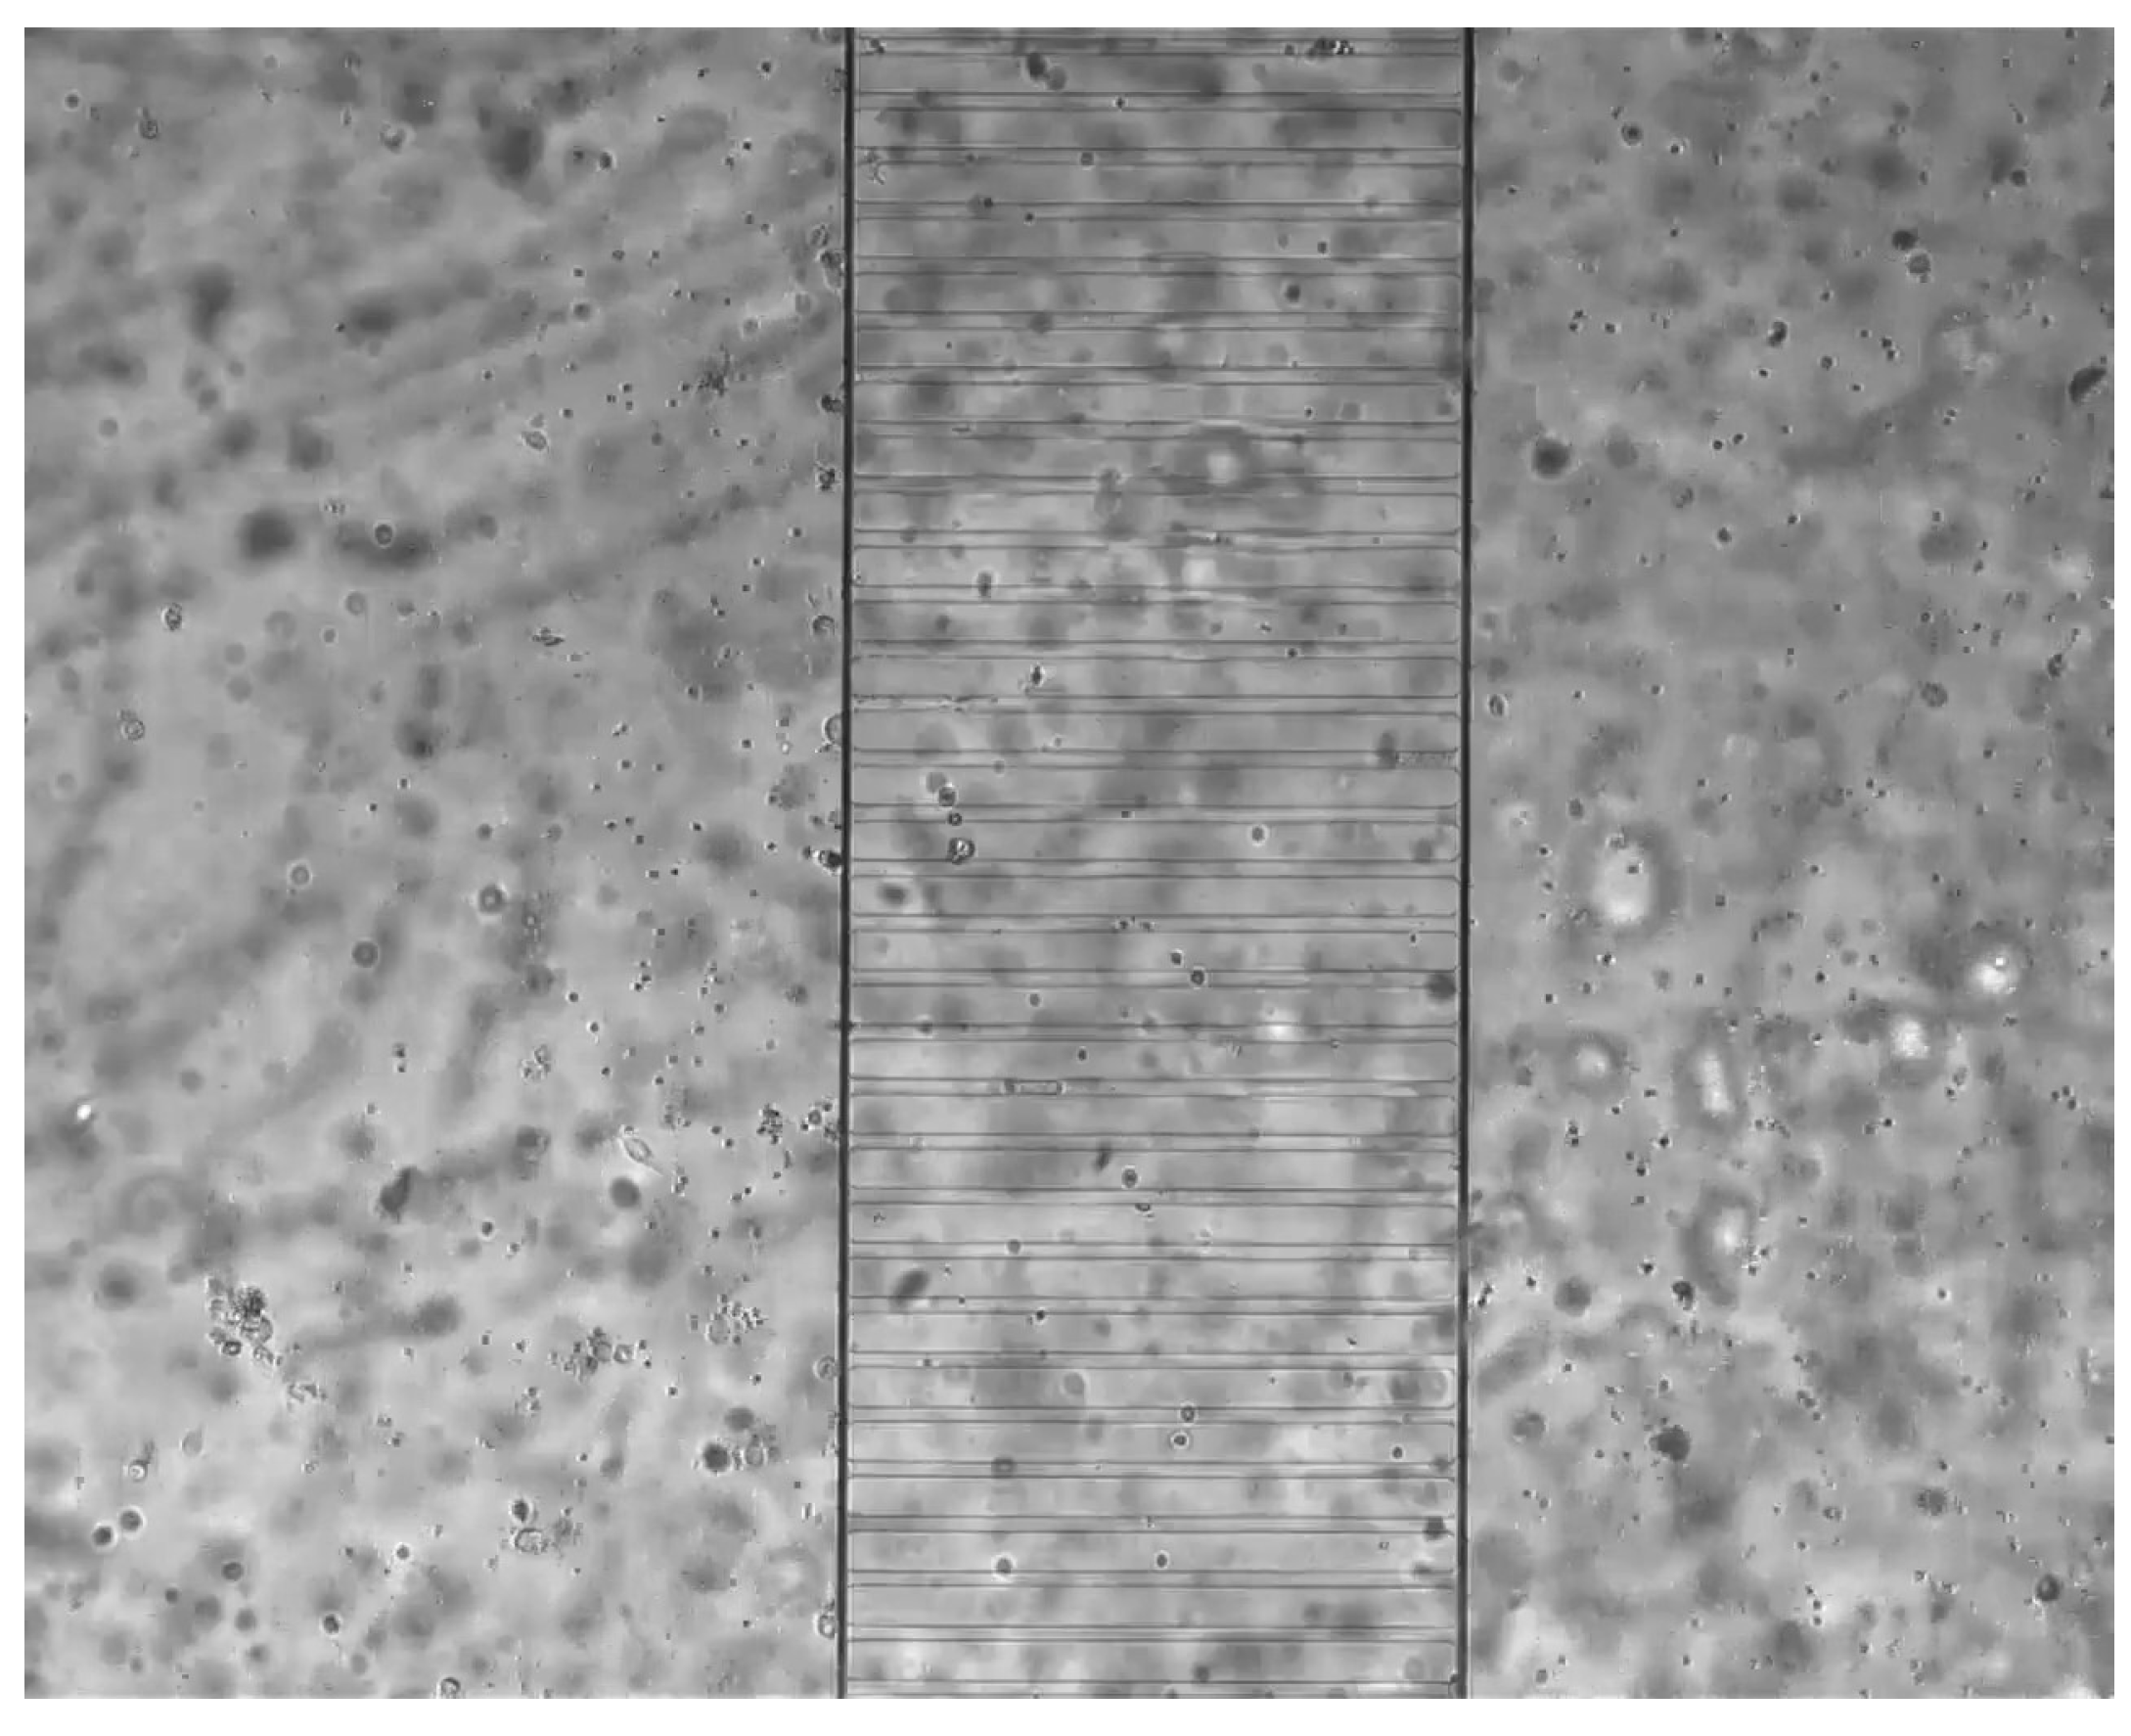
Figure 1. Screenshot of Movie 13 (Supplementary Material in [17]), showing the situation at a fixed time of the experiment described in Section 2.
Axioms 12 00930 g001
Figure 2. Graphical representation of the computational algorithm.
Axioms 12 00930 g002
Figure 3. Tornado diagrams: PLUS (MINUS) indicates an increase (decrease) in the corresponding parameter by ±20% compared with the reference value reported in Table 1. (a) Relative difference of dead tumor cells at the end of the simulation: perturbed parameter values compared with the reference values. (b) Relative difference of leukocytes remaining in the left chamber at the end of the simulation: perturbed parameter values compared with the reference values.
Axioms 12 00930 g003
Figure 4. Four screenshots of a single simulation with the parameters reported in Table 1, taken at times (a) 0 h, (b) 24 h, (c) 36 h, and (d) 48 h. Tumor cells: green diamonds; leukocytes: red circles (the pink tails indicate previous positions, to show trajectories); background: annexin concentration (with reference color scale on the right).
Axioms 12 00930 g004
Figure 5. Polar histograms depicting the angular displacements of the leukocyte agent with respect to the maximum value of annexin in the adjacent cells, segmented into four distinct time intervals. (a) Time interval: 0–25% (0–12 h). (b) Time interval: 25–50% (12–24 h). (c) Time interval: 50–75% (24–36 h). (d) Time interval: 75–100% (36–48 h).
Axioms 12 00930 g005
Table 1. Parameters of the model.
ParameterDescriptionUnitsValueRef.
Δ t discretization time step min 4design
d x discretization along the x axis μ m10design
d y discretization along the y axis μ m10design
Ddiffusivity of chemoattractant μ m 2 / min 1.5 × 10 4  [28]
k A production rate of chemicals M min 1 40calibration
k X A consumption rate of chemicals min 1 5 × 10 3 calibration
γ threshold value for migration- × 10 5 calibration
λ parameter enforcing migration towards high concentration-2calibration
L c length of the channels μ m500datum
L x horizontal size of the box μ m1704datum
L y vertical size of the box μ m1560datum
N C number of microchannels in the video footage-31datum
δ width of each microchannel μ m8datum
ω width of obstacles μ m32datum
T f observation time min 48 × 60 datum
R L radius of leukocytes μ m4[29]
R T radius of tumor cells μ m10[30]
N T number of tumor cells μ m31datum
k L normalized rate of new leukocyte accrual min 1 0.15 calibration
N f number of frames in the laboratory experiment-1440datum
k T L tumor cells life reducing by leukocytes min 1600calibration
L T tumor cells lifetime min 1000 × 60 calibration
L L maximum leukocytes lifetime min 144 × 60  [31]
Design: defined a priori. Calibration: calibrated in order to reproduce leukocyte dynamics similar to that reported in [17]. Datum: measures taken from [17].
Disclaimer/Publisher’s Note: The statements, opinions and data contained in all publications are solely those of the individual author(s) and contributor(s) and not of MDPI and/or the editor(s). MDPI and/or the editor(s) disclaim responsibility for any injury to people or property resulting from any ideas, methods, instructions or products referred to in the content.