Article

Geological and Petrological Study on Debris Avalanche Deposits at the Eastern Foot of Zao Volcano, Japan


1
Department of Sciences, Faculty of Science, Yamagata University, 1-4-12, Kojirakawa-machi, Yamagata 990-8560, Japan
2
Volcanic Disaster Prevention Department, Sabo & Landslide Technical Center, Chiyoda-ku, Tokyo 102-0093, Japan
*
Author to whom correspondence should be addressed.
Minerals 2026, 16(5), 517; https://doi.org/10.3390/min16050517
Submission received: 1 April 2026 / Revised: 30 April 2026 / Accepted: 8 May 2026 / Published: 13 May 2026

Abstract

Debris avalanche deposits related to the edifice collapse of the summit area of Zao Volcano are reported for the first time at the volcano’s eastern foot. These deposits extend approximately 11–15 km from the summit. Based on their spatial distribution and clast petrology, the deposits are interpreted to have originated from the Umanose caldera. Deposit thickness ranges from 20 to 30 m in the western and northern parts to over 50 m in the eastern part, with an estimated volume of approximately 0.3–0.4 km3, comparable to that of the summit caldera depression. Matrix facies occur at most outcrops, whereas block facies are found at only three sites. The vertical drop-to-runout distance ratio (H/L) is ~0.09, which falls within the typical range for debris avalanches but still indicates relatively high mobility. Based on its volume and stratigraphic relationships, the collapse may have been associated with eruptive activity (e.g., phreatic processes) or alternatively with a non-eruptive large-scale failure of a hydrothermally altered zone beneath the summit area. The collapse is considered to mark the onset of the latest activity stage of Zao Volcano, although the precise temporal relationship remains uncertain. The petrological characteristics of the magma differ markedly from those of the preceding stage, but the relationship between collapse processes and magma evolution remains hypothetical and is not directly demonstrated in this study.

1. Introduction

Debris avalanche events caused by volcanic edifice collapse—exemplified by the 1980 eruption of Mount St. Helens (e.g., [1,2]) and the 1888 collapse of Mount Bandai (e.g., [3,4,5])—have been extensively studied, particularly since the former event. Related studies have revealed that such collapses have occurred at many stratovolcanoes worldwide (e.g., [6,7]). Recent research suggests that volcanic edifice collapse has occurred somewhere in the world more than five times per century [8]. Debris avalanches generated by edifice collapse are typically large-scale and pose a significant volcanic hazard (e.g., [6,7]). In addition, changes in eruptive behavior and magma characteristics before and after edifice collapse have been reported (e.g., [9]), indicating that edifice collapse is also an important factor in reconstructing a volcano’s developmental history.
Because such deposits usually occur at the foot of the volcano and are often covered by well-developed vegetation, their presence and distribution are often difficult to determine. As a result, the history of past edifice collapses remains unclear for many active volcanoes. In this study, we focus on Zao Volcano, one of the representative active volcanoes in northeastern Japan, and report the discovery of past debris avalanche deposits. We describe their distribution, facies, and clast characteristics and discuss the source, mobility, age, and trigger of the debris avalanche.
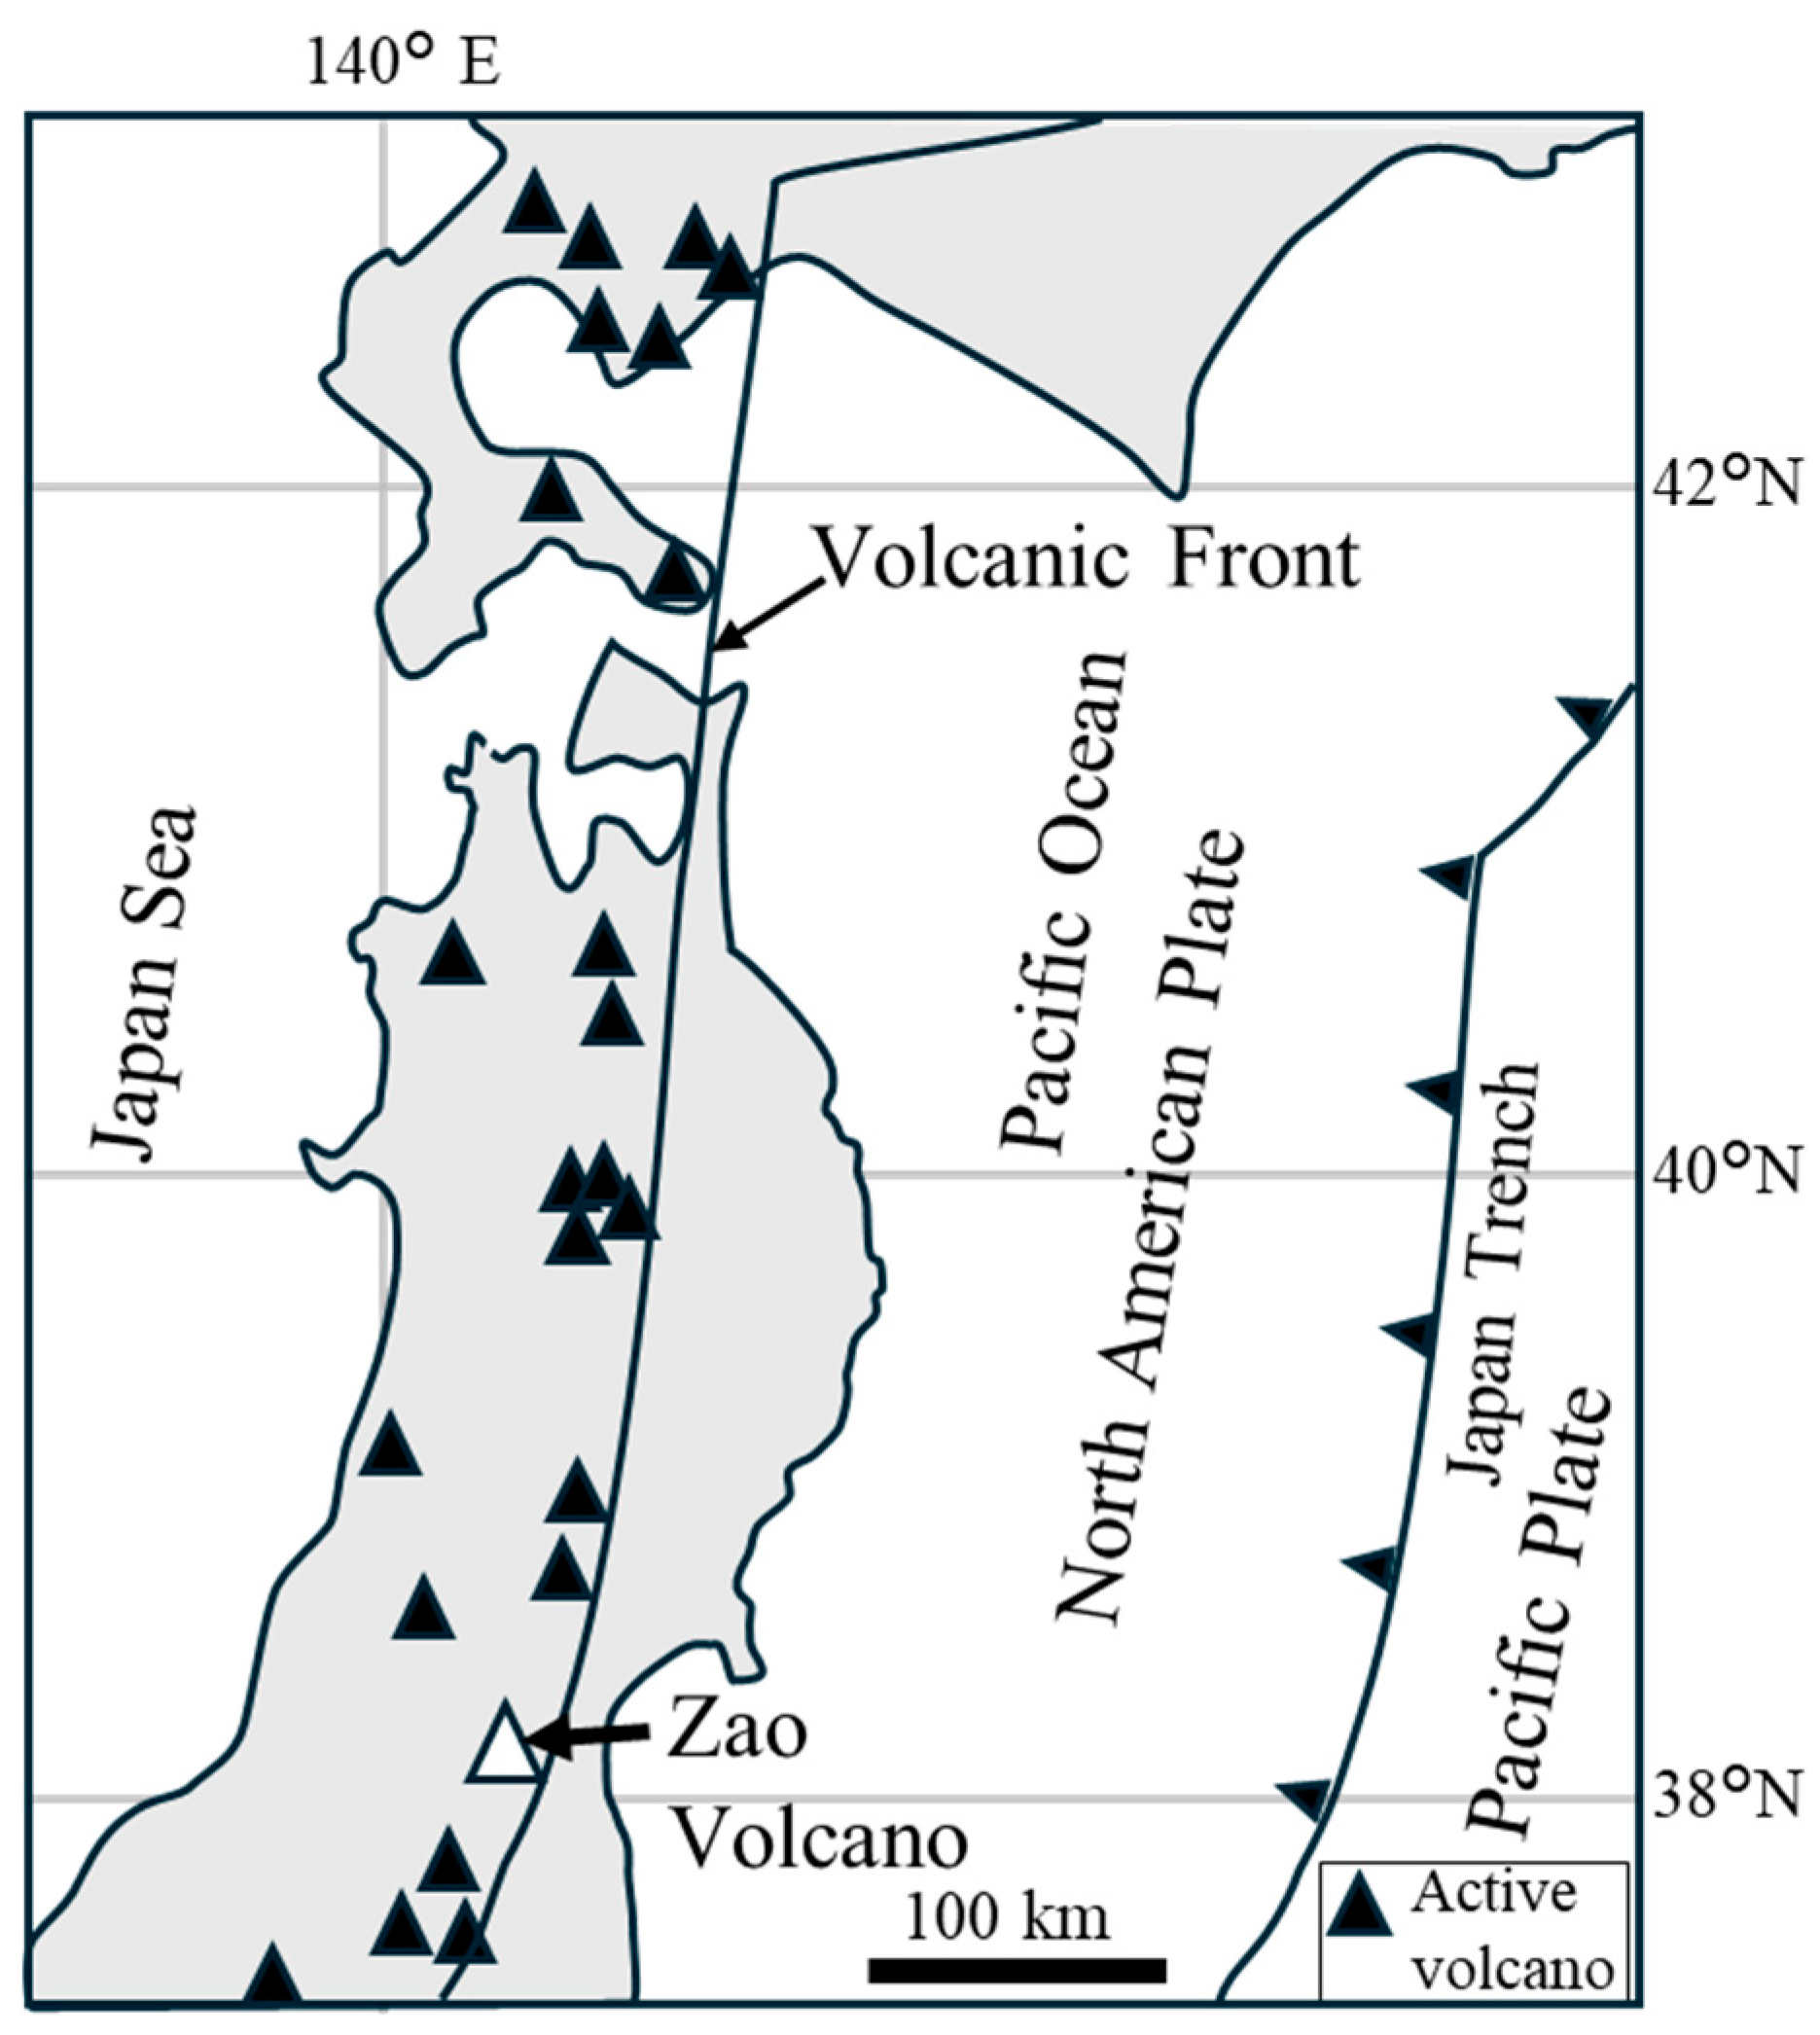
Zao Volcano is an active stratovolcano in the central part of the volcanic front of the NE Japan arc (Figure 1). Volcanic activity is divided into six stages, and the most recent stage began at approximately 35 ka (e.g., [10]). The newest stage began with the formation of the Umanose caldera. The formation mechanism of this caldera remains unclear.
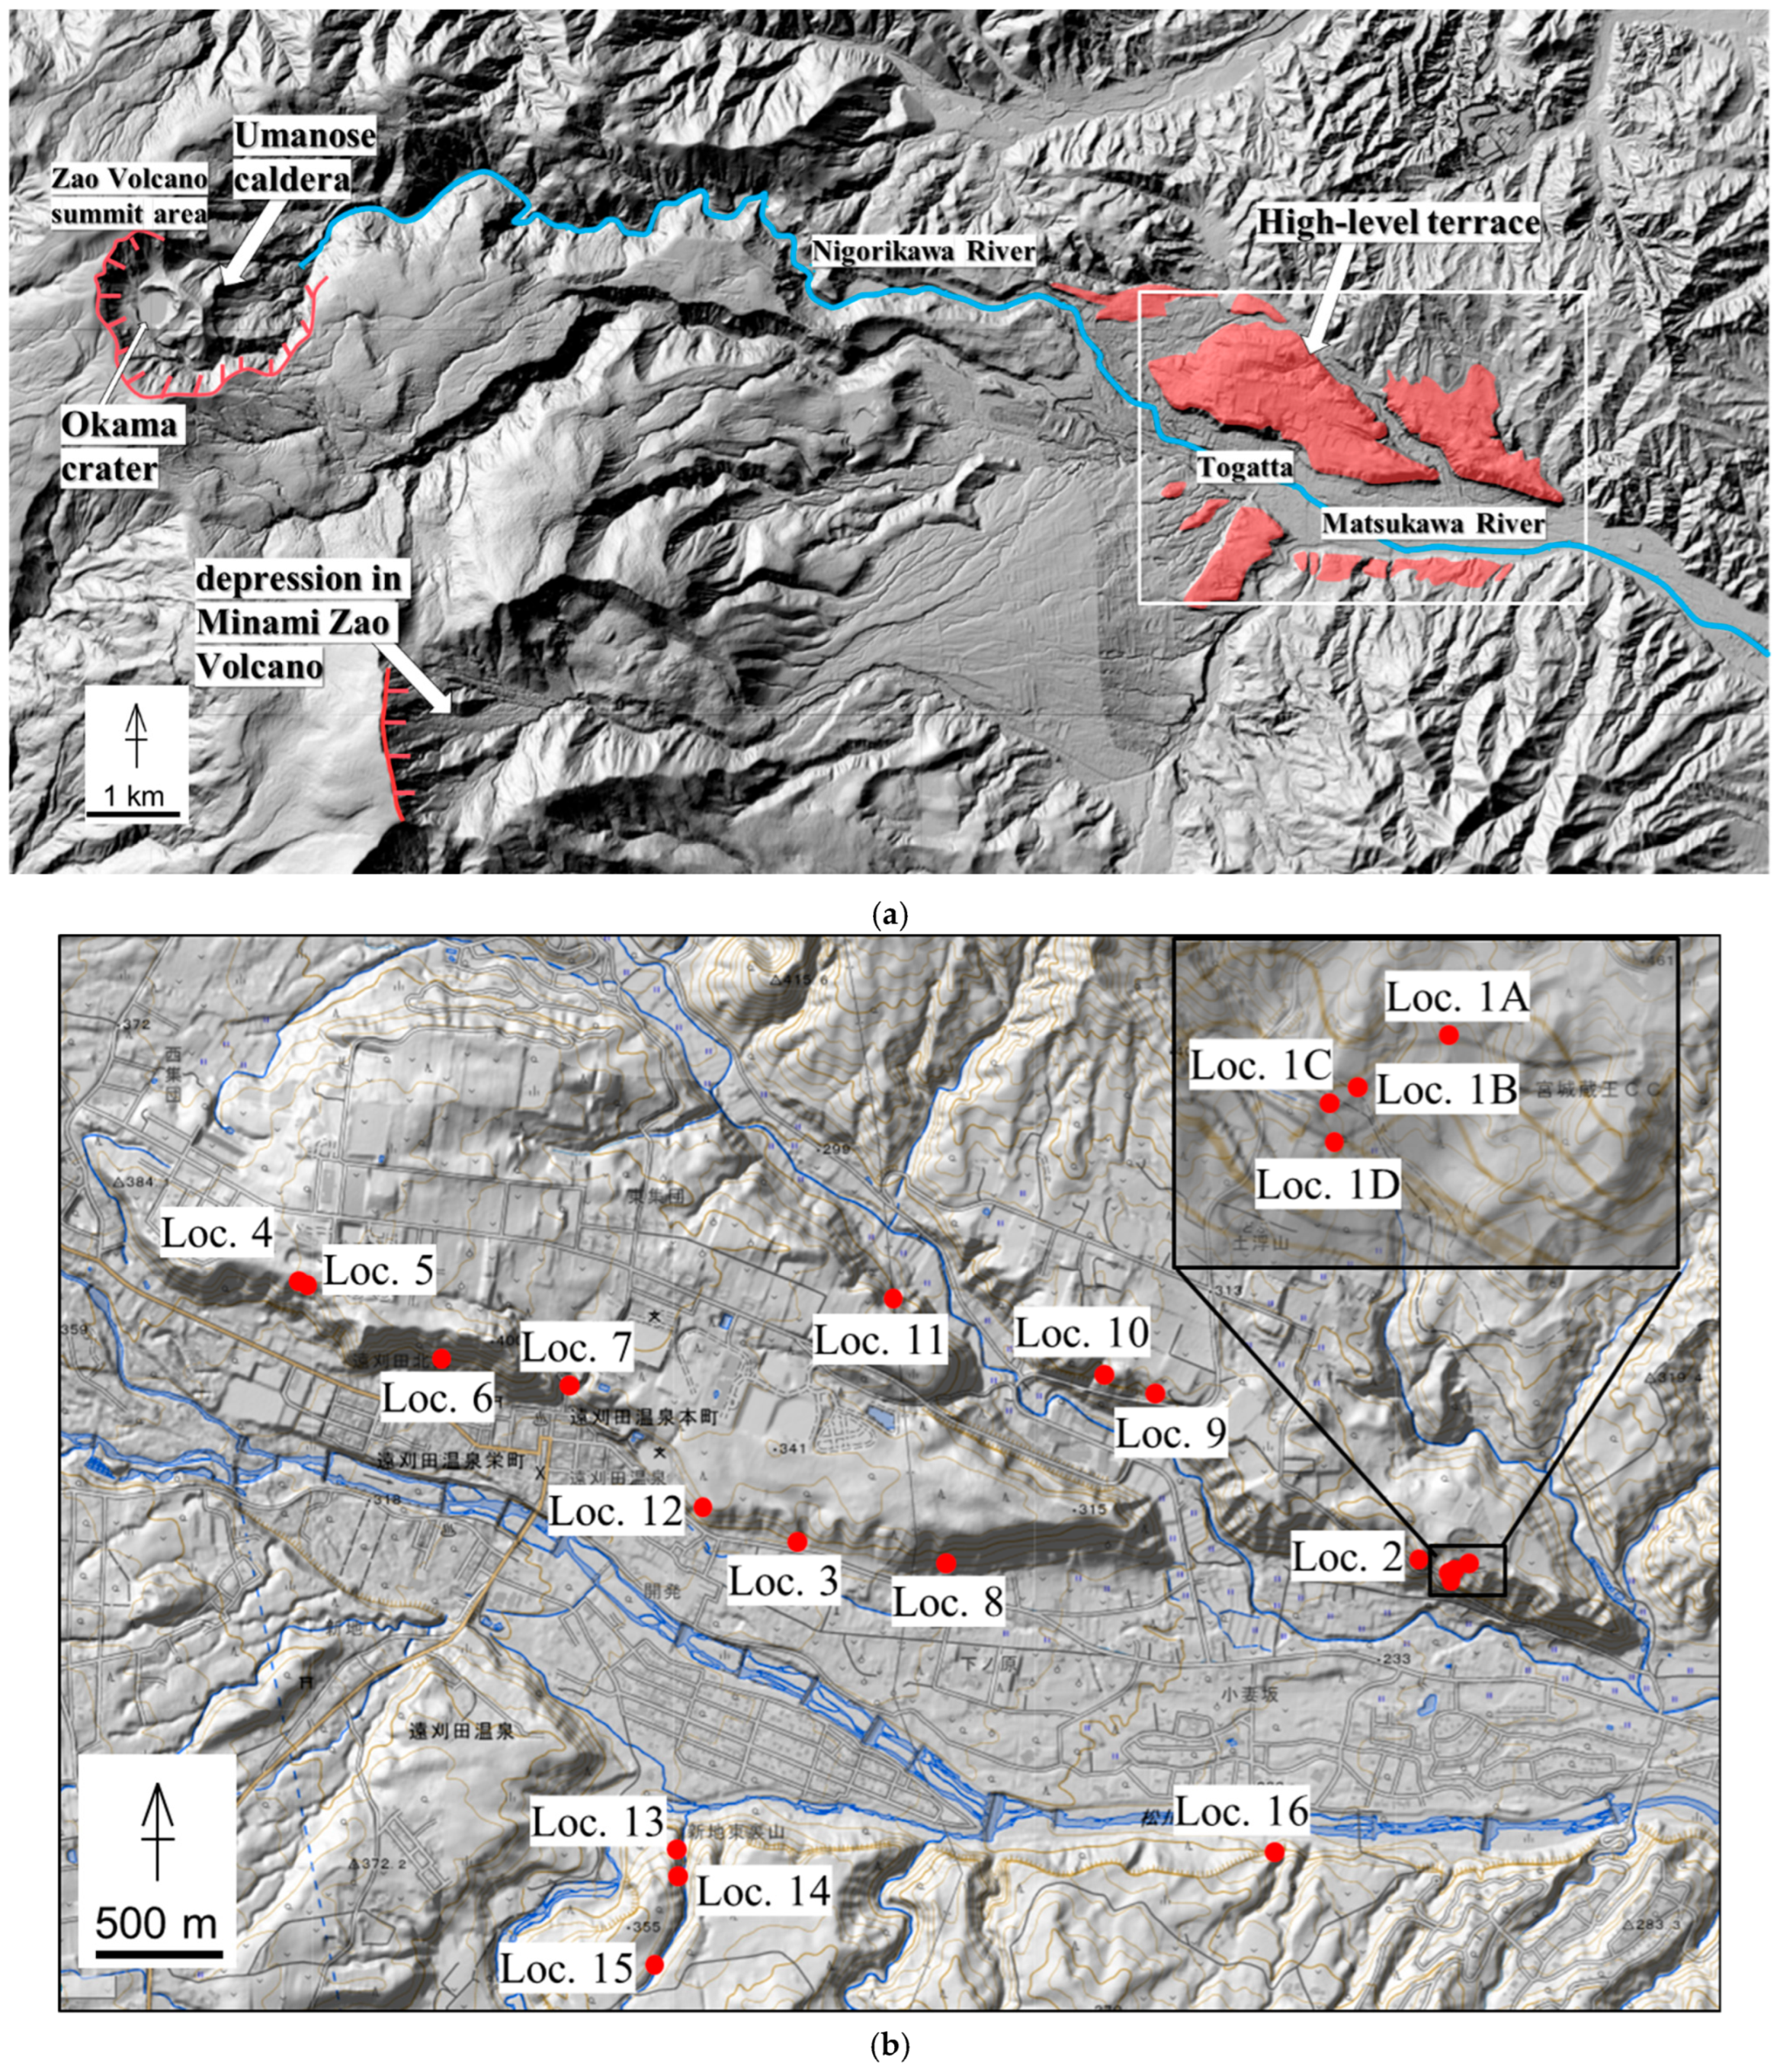
In the Togatta area, located about 10 km east of Okama—the youngest crater of Zao Volcano—river terraces are developed along the Nigorikawa/Matsukawa River (Figure 2a). Although it had been suggested that the high-level terrace may consist of debris avalanche deposits [11], no detailed investigation had been conducted. In this study, a field investigation of the high-level terrace was carried out, confirming that it is composed of debris avalanche deposits. The source of these deposits was examined by comparing the characteristics of the rock fragments with those of the rocks that constitute the summit caldera. The results obtained in this study will provide useful information for future hazard mitigation, as well as for understanding the eruption history and magma evolution of Zao Volcano.

2. Materials and Methods

Geomorphological and field observations were conducted to determine the distribution of the debris avalanche deposits. The facies of these deposits were described based on field observations.
14C dating was performed on a sample collected from a mudstone below the debris avalanche deposit. The dating was conducted using accelerator mass spectrometry at the High Sensitivity Accelerator Center (AMS Center) of Yamagata University. The sample was carefully collected using a stainless steel tool and wrapped in aluminum foil. The sample was sieved to <250 µm and then pretreated with HCl (80 °C for 1 h, repeated twice) at the AMS Center of Yamagata University to remove carbonate phases. Although detailed conditions were not provided by the laboratory, the procedure is designed to isolate organic carbon by removing carbonate contaminants prior to measurement.
No alkali treatment was applied, and thus humic substances may not have been completely removed. The measurement was conducted on carbon extracted from the bulk mudstone sample, which includes dispersed organic carbon. There is a possibility that reworked or old carbon may be included. Calibration of the 14C age was performed using IntCal20 [12] and the OxCal v4.4 software.
Petrographic observations were conducted using a polarizing microscope. A total of 42 representative samples were selected based on field occurrence and lithological variability. Of these samples used for petrographic analysis, 34 were further selected for whole-rock chemical analysis to cover the observed petrographic variation. Only fresh, unaltered samples, as confirmed by petrographic observation, were selected for whole-rock chemical analysis. Samples showing visible signs of hydrothermal alteration were excluded from the analysis. Whole-rock chemical compositions were analyzed using a wavelength-dispersive X-ray fluorescence spectrometer (ZSX Primus III+, Rigaku Corporation, Rigaku, Japan) at Yamagata University. Major (Si, Ti, Na, Ca, K, Mg, Fe, Al, Mn, and P) and trace (Ba, Sr, Cr, Ni, V, Rb, Zr, Nb, Y, Cu, and Zn) elements were determined on glass beads prepared by fusing 1.8 g of powdered sample with 3.6 g of analytical flux (Spectroflux 100B, Johnson Matthey, Tochigi, Japan) in a high-frequency bead sampler (NT-2120, Tokyo Kagaku, Kanagawa, Japan) at 1200 °C. Analyses were performed under an accelerating voltage of 50 kV and a current of 50 mA. The standards used in the analyses were the Geological Survey of Japan (GSJ) igneous rock series. The calibration method followed that of [13,14] for both major and trace elements. Analytical reproducibility was evaluated based on repeated measurements (n = 24) of the monitor sample KB-1. Relative standard deviations (RSD) are generally <0.5% for major elements and <5% for most trace elements, although Ba shows slightly larger variability (up to ~10%).

3. Results

3.1. Distribution of High-Level Terraces Around the Togatta Area

In the Togatta area, a high-level terrace surface with a relative height of approximately 70–100 m above the Nigorikawa/Matsukawa riverbed can be identified. Its distribution is shown in Figure 2. It is distributed at distances of 10–15 km in a straight line from the summit crater. The remnant terrace surface corresponds to the Togatta Terrace described by [15]. Although [15] examined only the left bank of the Matsukawa River, a terrace of the same level is also distributed on the right bank.
Terrace classification in the Matsukawa drainage basin was first carried out by [16], who, although not illustrating it, divided the terraces—listed from the highest—into the Hara Terrace, the Nagano Terrace, and the Nagafukuro Terrace. The Togatta Terrace is considered to correspond to the Hara Terrace among these. According to [17], this terrace is correlated with the Uemachi Terrace, which is well developed around the Sendai area. As for the age of the Uemachi Terrace, dates of around 40,000 yr BP based on pollen analysis have been reported for the conglomerate layer that forms its main part, and a 14C age of 31,950 ± 3000 yr BP (ca. 49–31 cal ka BP) has been reported for the overlying peaty silt layer [18,19]. Reference [20] reported an age of 31,500 + 2610/−1970 yr BP (ca. 42–32 cal ka BP) for a wood fragment contained in the conglomerate layer that constitutes the Togatta Terrace.

3.2. Geological Descriptions of the Debris Avalanche Deposits Around the Togatta Area

The debris avalanche deposit comprises the high-level terrace, which is called the Togatta debris avalanche deposit hereafter. Debris avalanche deposits can be divided into block facies, which exhibits depositional features that preserve the original lithological boundaries and structures despite intense fragmentation and deformation, and matrix facies, which is matrix-supported, poorly sorted, and contains a mixture of various clast types (e.g., [21]). The matrix facies sometimes shows heterogeneity; mixing leads to the preservation of original stratigraphy and abrupt facies changes along the deposit and/or includes clasts showing jigsaw-like structures. In this case, they are also sometimes referred to as mixed facies (e.g., [22]).
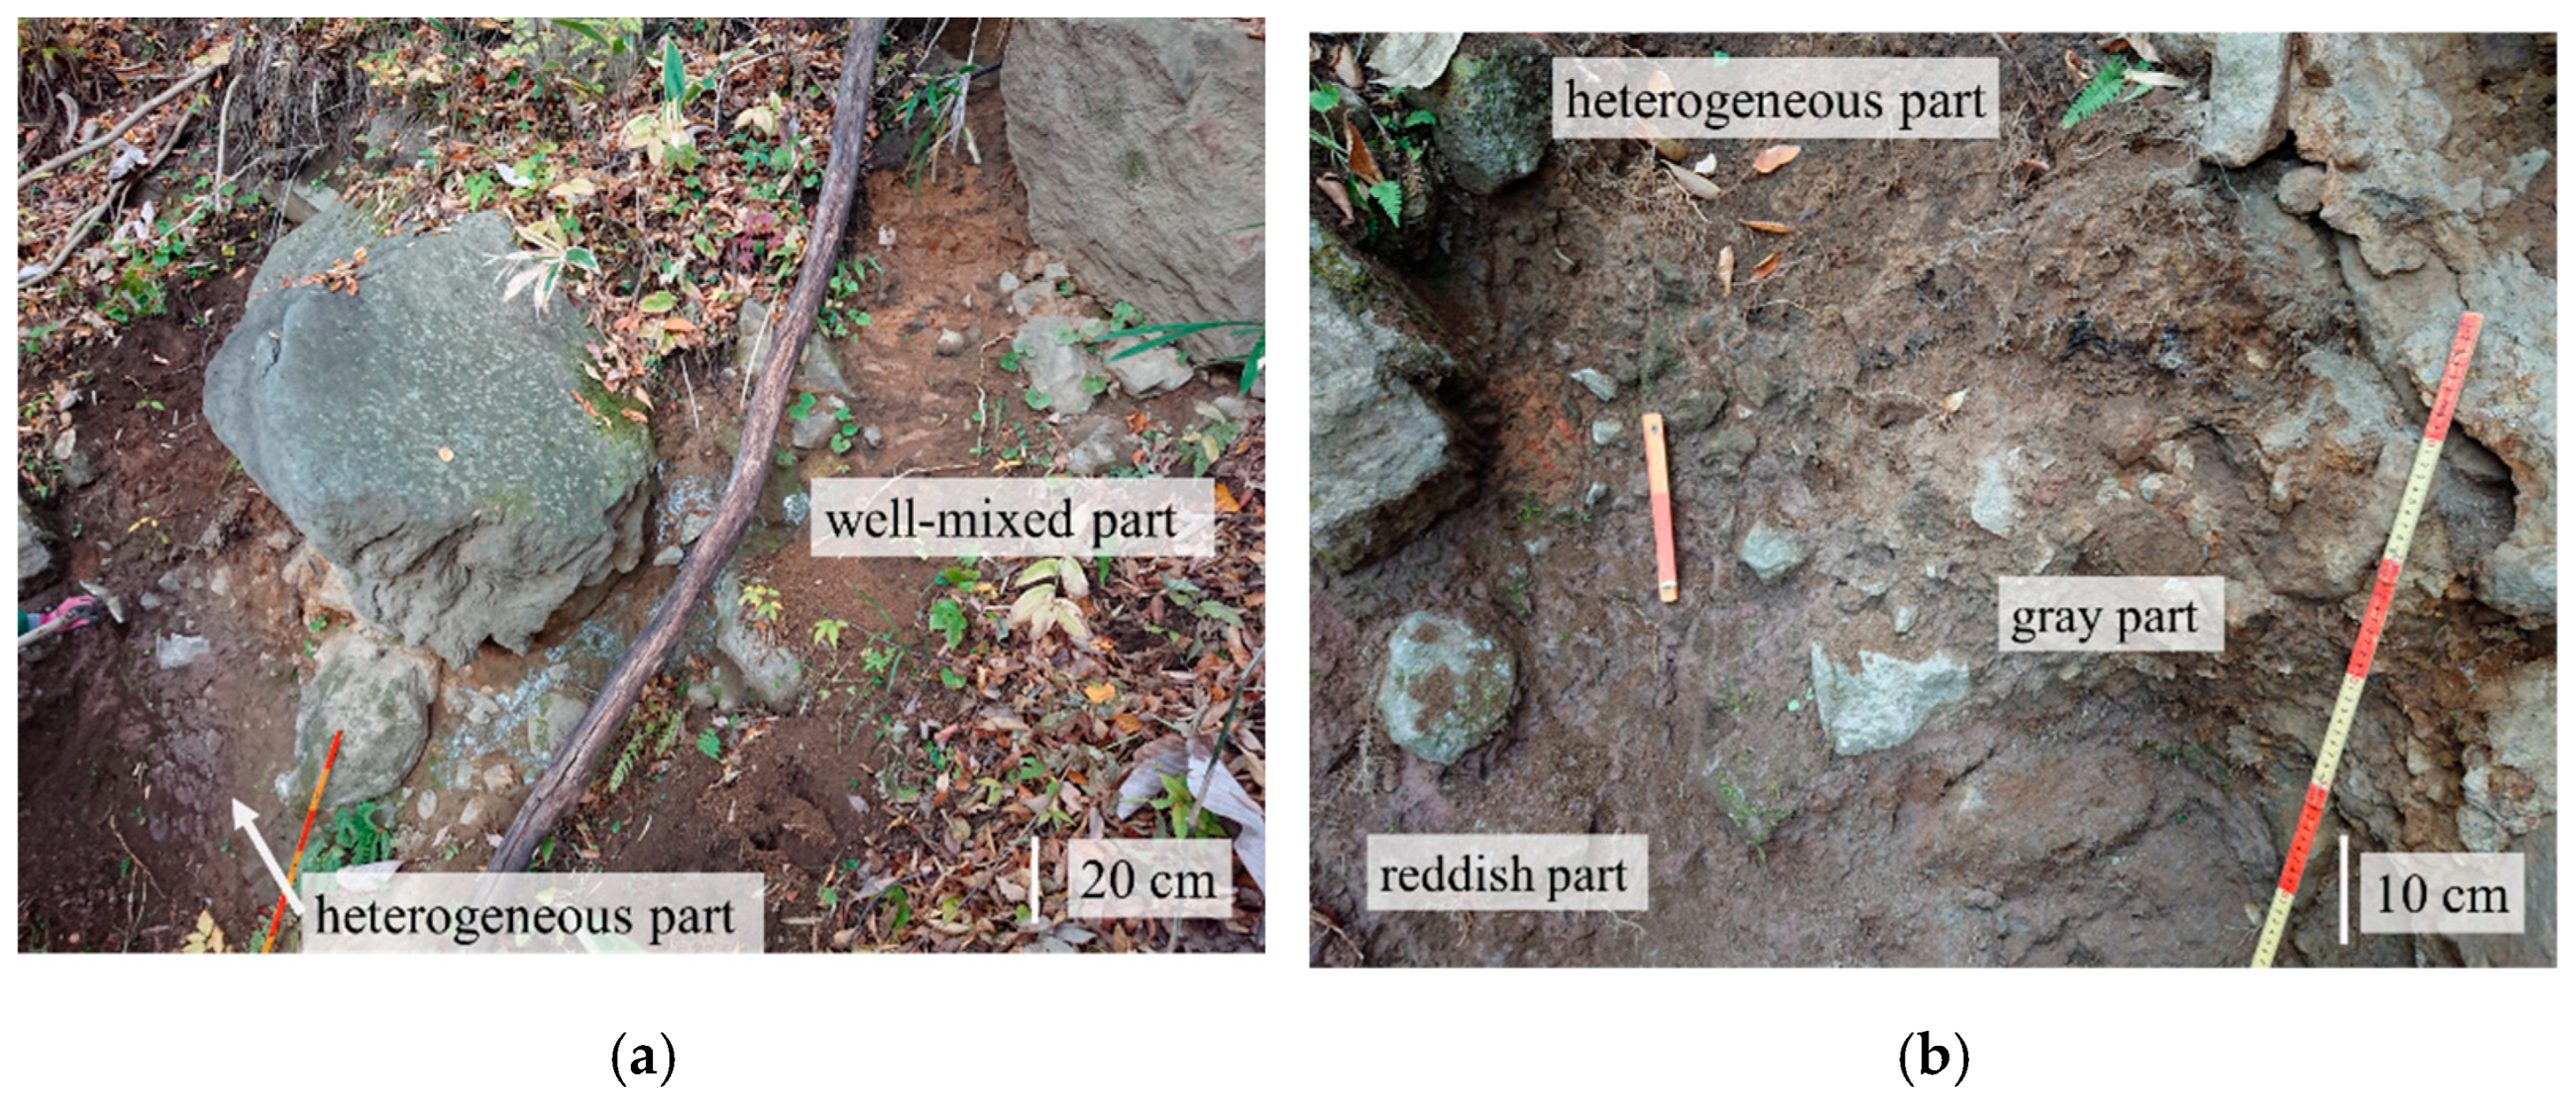
Because of dense vegetation, outcrops are difficult to identify in this area except along rivers, which has hindered progress in the investigation. We therefore conducted a systematic field survey of the area and, where necessary, removed vegetation using a shovel, enabling us to identify debris avalanche deposits at Locations 1, 2, 3, 4, 8, 9, 10, 11, 12, 13, 14, 15, and 16 shown in Figure 2b. Deposits showing the block facies were observed at Locations 1, 2, and 13. At the other locations, the deposits showing mainly matrix facies were observed. The basement rocks were observed at Locations 5, 6, and 7. These are pumice tuff deposits, which would correspond to the Togatta Formation [23]. At Location 11, the debris avalanche deposit covers alterations of sand and mudstones. The presence of sandstone and mudstone interbeds has not yet been documented in this area.

3.2.1. Block Facies

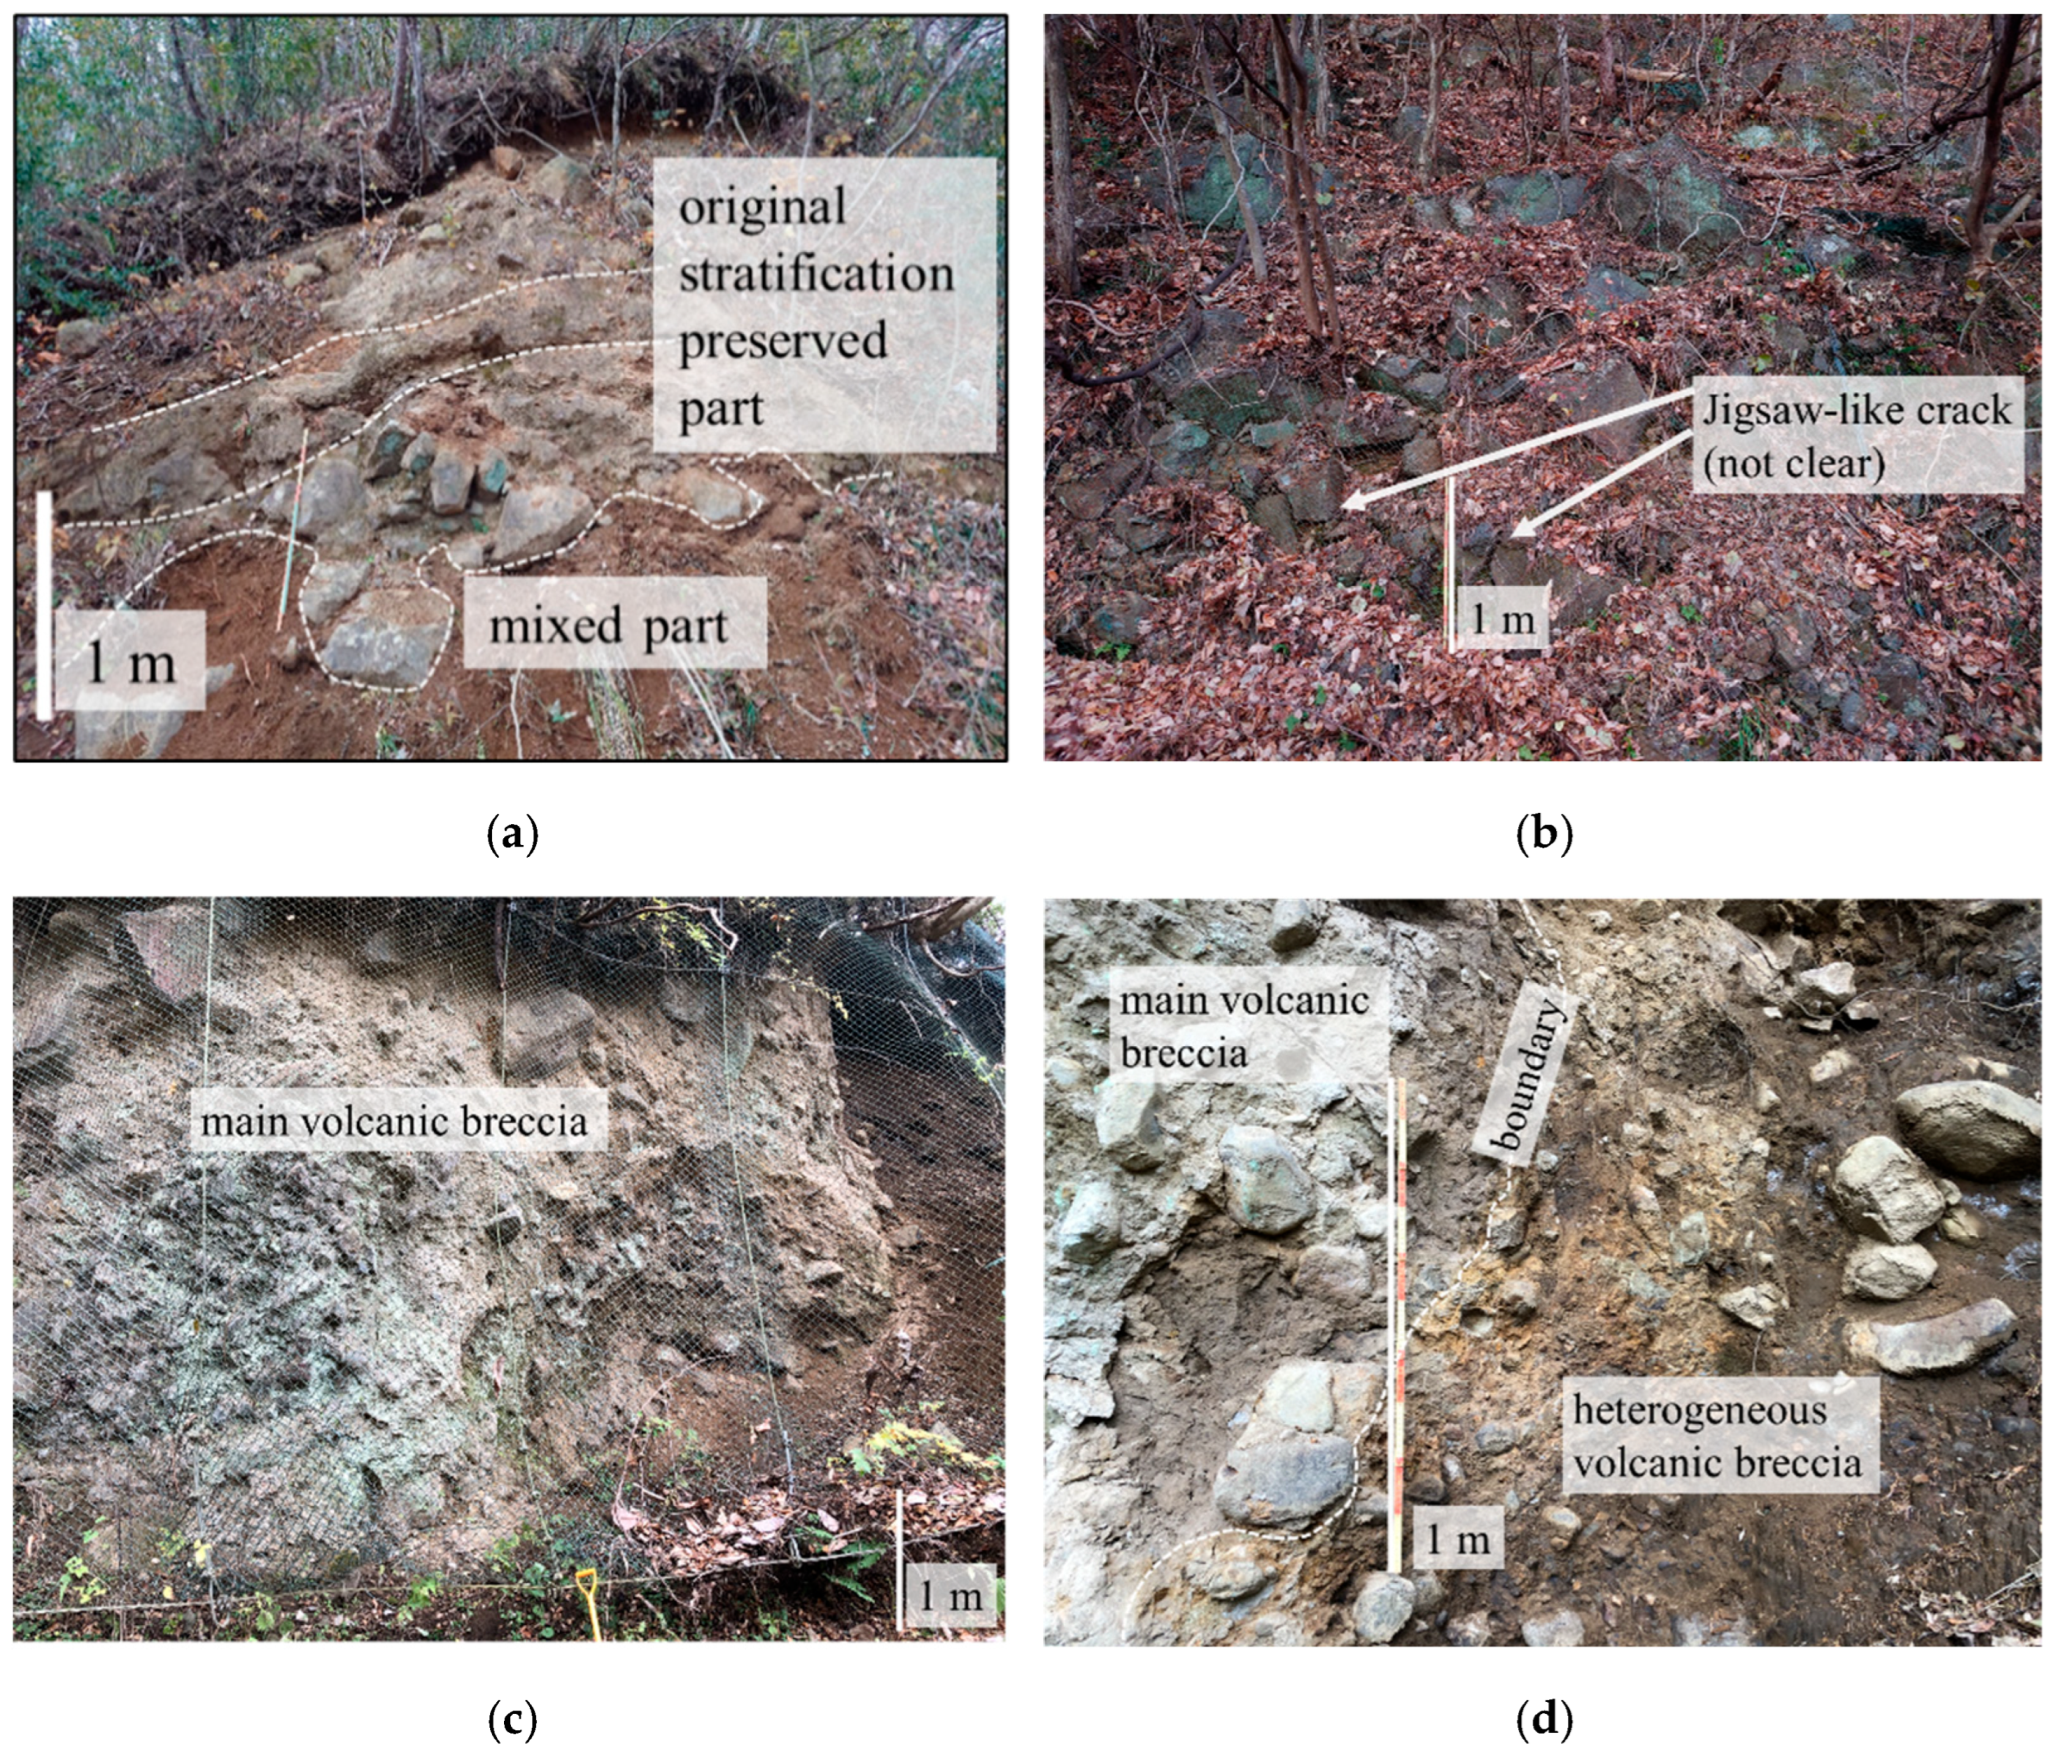
Block facies of the deposit occur at Locations 1, 2, and 13 (Figure 3). At Location 1, the original stratification of several pyroclastic deposit layers is preserved, as illustrated in the figure, although the lower two layers are incompletely mixed (Figure 3a). The outcrop at Location 2 is approximately 20 m high and 30 m wide and consists of andesite lava with well-developed joints (Figure 3b). The orientations of the joints appear to be random due to minor near-surface disturbance, but they were originally dominated by horizontal and vertical sets. The fractured and blocky nature of the lava is interpreted as being consistent with transported blocks, although diagnostic internal textures are not clearly observable. Its occurrence within the debris avalanche deposit and its distance from known in situ lava distributions further support this interpretation.
The outcrop at Location 13 is ca. 8 m in width and ca. 5 m in height. The main part consists of light-blue-colored to dark-brown-colored volcanic breccia (Figure 3c). On the right-hand side of the outcrop (Figure 3d), a different heterogeneous volcanic breccia layer, composed of light-brown-colored and dark-brown-colored parts, is in contact with the main volcanic breccia. The boundary plane is steep, which suggests the deposits are not primary ones. At the boundary, the volcanic breccias are mixed to some extent.

3.2.2. Matrix Facies

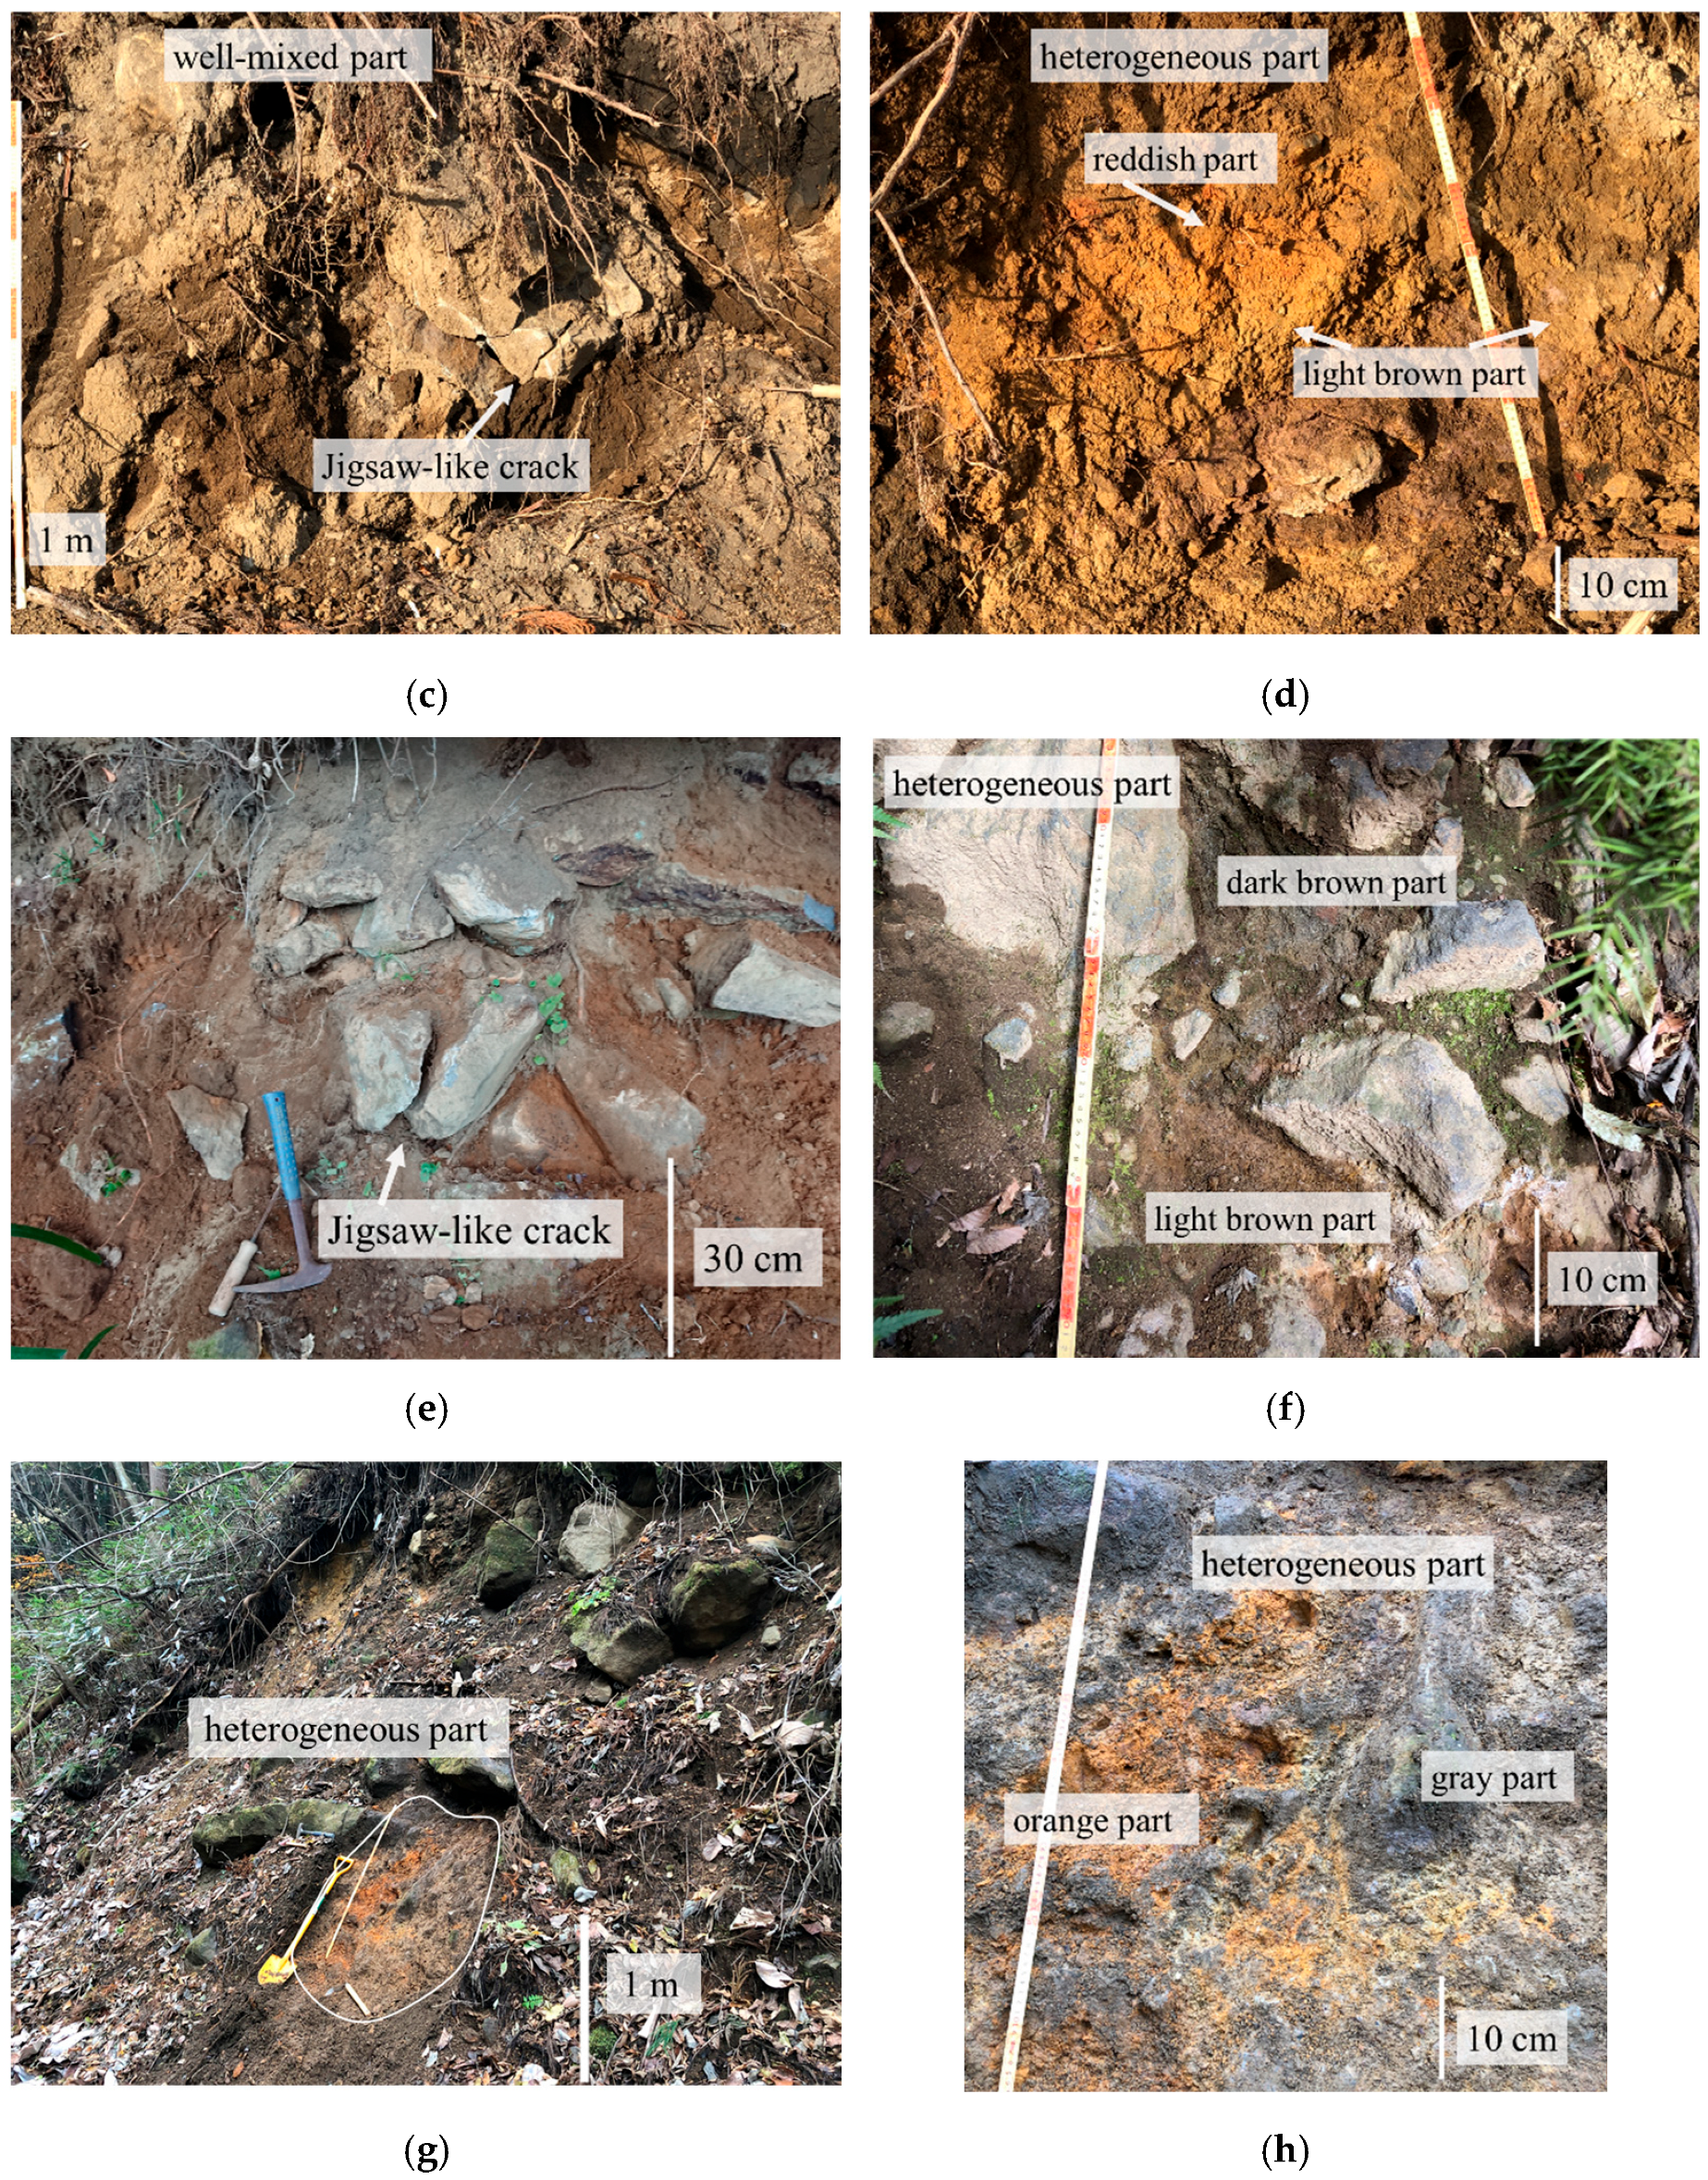
At Locations 3, 4, 8, 9, 10, 11, 12, 14, 15, and 16, the matrix facies were observed. Photographs of the deposits at Locations 4, 8, 12, and 14 are shown in Figure 4. The matrix facies are composed of well-mixed (Figure 4a,c,e) and/or heterogeneous (Figure 4b,d,f–h) parts. The heterogeneity of the matrix is evident in a color difference as well as the difference in constituents. The clasts, ranging from a few centimeters to 1.5 m in length, were present. Jigsaw-like cracks are sometimes developed in these clasts (Figure 4c,e).

3.2.3. The Thickness of the Deposit

At Location 5, the basement rocks are exposed at 368 m a.s.l. The elevation of Location 4 is 370 m, and the high-level terrace surface reaches 390 m. Therefore, the thickness of the deposit is approximately 20 m here. At Locations 6 and 7, the basement rocks were observed at 355 m and 340 m, respectively, and the high-level terrace surface reaches approximately 390 m. Therefore, the thickness of the deposit is less than approximately 35 m here. At Location 11, the boundary between the basement rocks and the debris avalanche deposits is at 300 m a.s.l., and the high-level terrace surface reaches 340 m. Therefore, the thickness of the deposit is approximately 30 m here. At Locations 3, 8, and 12, the debris avalanche deposits are exposed at the base of the high-level terrace. Considering that the elevation of the high-level terrace surface in this area is 320–330 m, the thickness of the deposits is estimated to be approximately 40 m. At Locations 1, 2, 9, and 10, the lowest elevation of the exposed debris avalanche deposits is 260 m. Considering that the elevation of the high-level terrace surface in this area is approximately 310 m, the thickness of the deposits is estimated to be more than 50 m. Consequently, the deposit is thinner in the western and northern parts (20–30 m) and thicker in the eastern part (>50 m). Based on the estimated thickness of the deposits described above and the distribution (mapped) area shown in Figure 2a, the total remnant volume is calculated to be approximately 0.2 km3. For the volume estimation, the thickness in the main distribution area was approximated by an average value of ~45 m, based on the site-specific estimates described above. In peripheral areas where direct constraints are limited, the thickness was conservatively assumed to be ~10 m, based on the elevation difference between exposed deposits and the terrace surface. These assumptions introduce uncertainty; therefore, the resulting volume (~0.2 km3) should be regarded as a first-order approximation rather than a precise measurement.

3.3. Result of 14C Dating

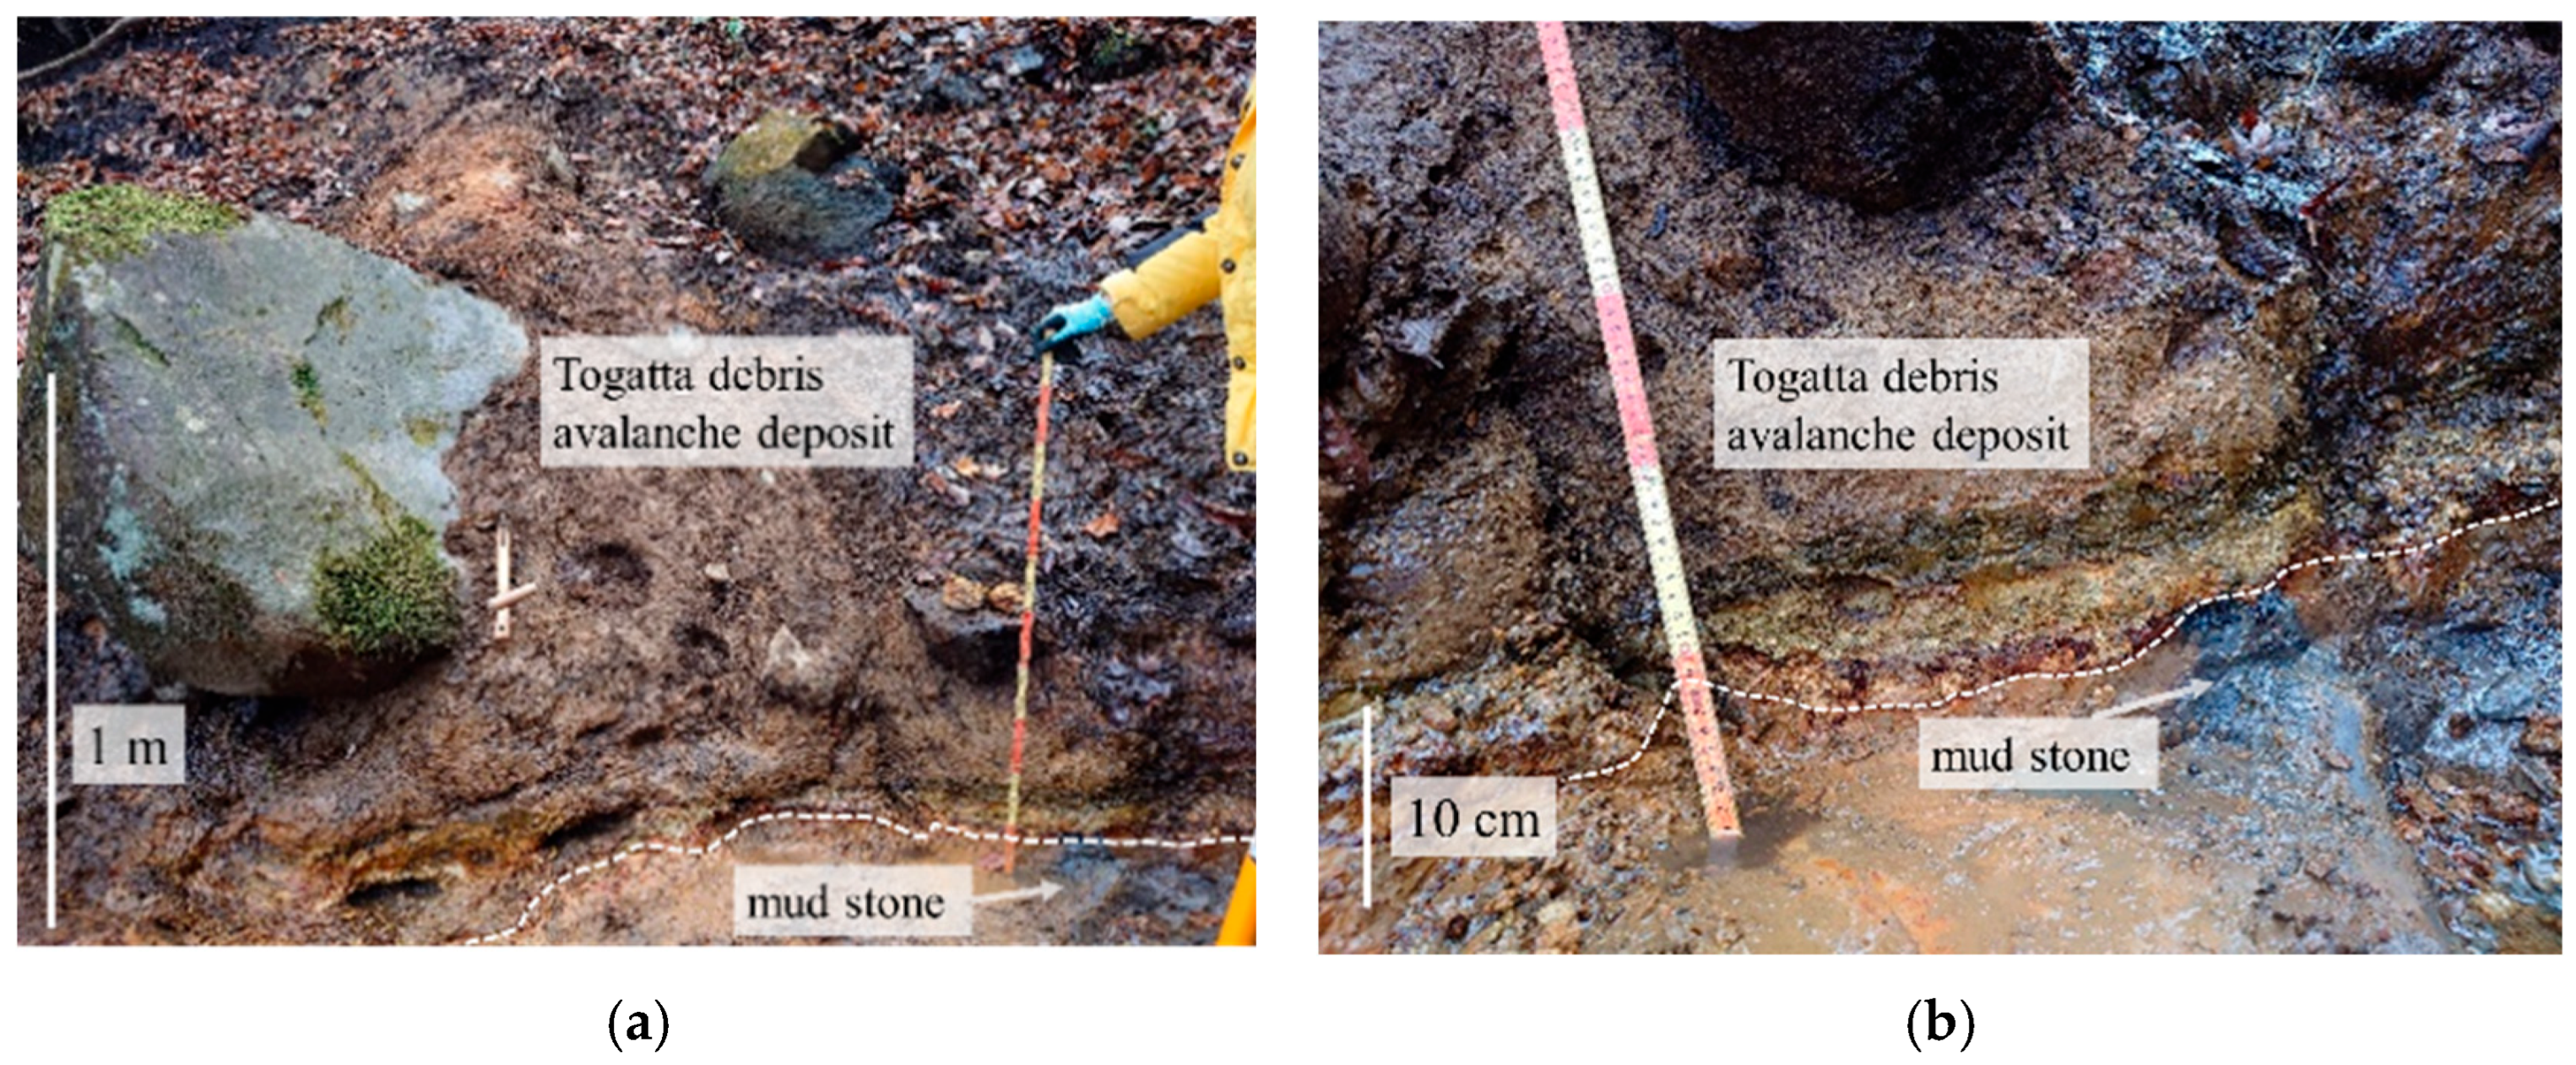
The sample collected from the mudstone (Figure 5) beneath the debris avalanche deposit at Location 11 was dated by the 14C method. The result is presented in Table 1. The reported age is a conventional radiocarbon age corrected for δ13C. Calibration using the IntCal20 curve yields an age of approximately 43 cal ka BP, and the calibrated ranges (1σ and 2σ) are shown in Table 1.

3.4. Rock Type and Whole-Rock Compositions of the Clasts in the Debris Avalanche Deposit

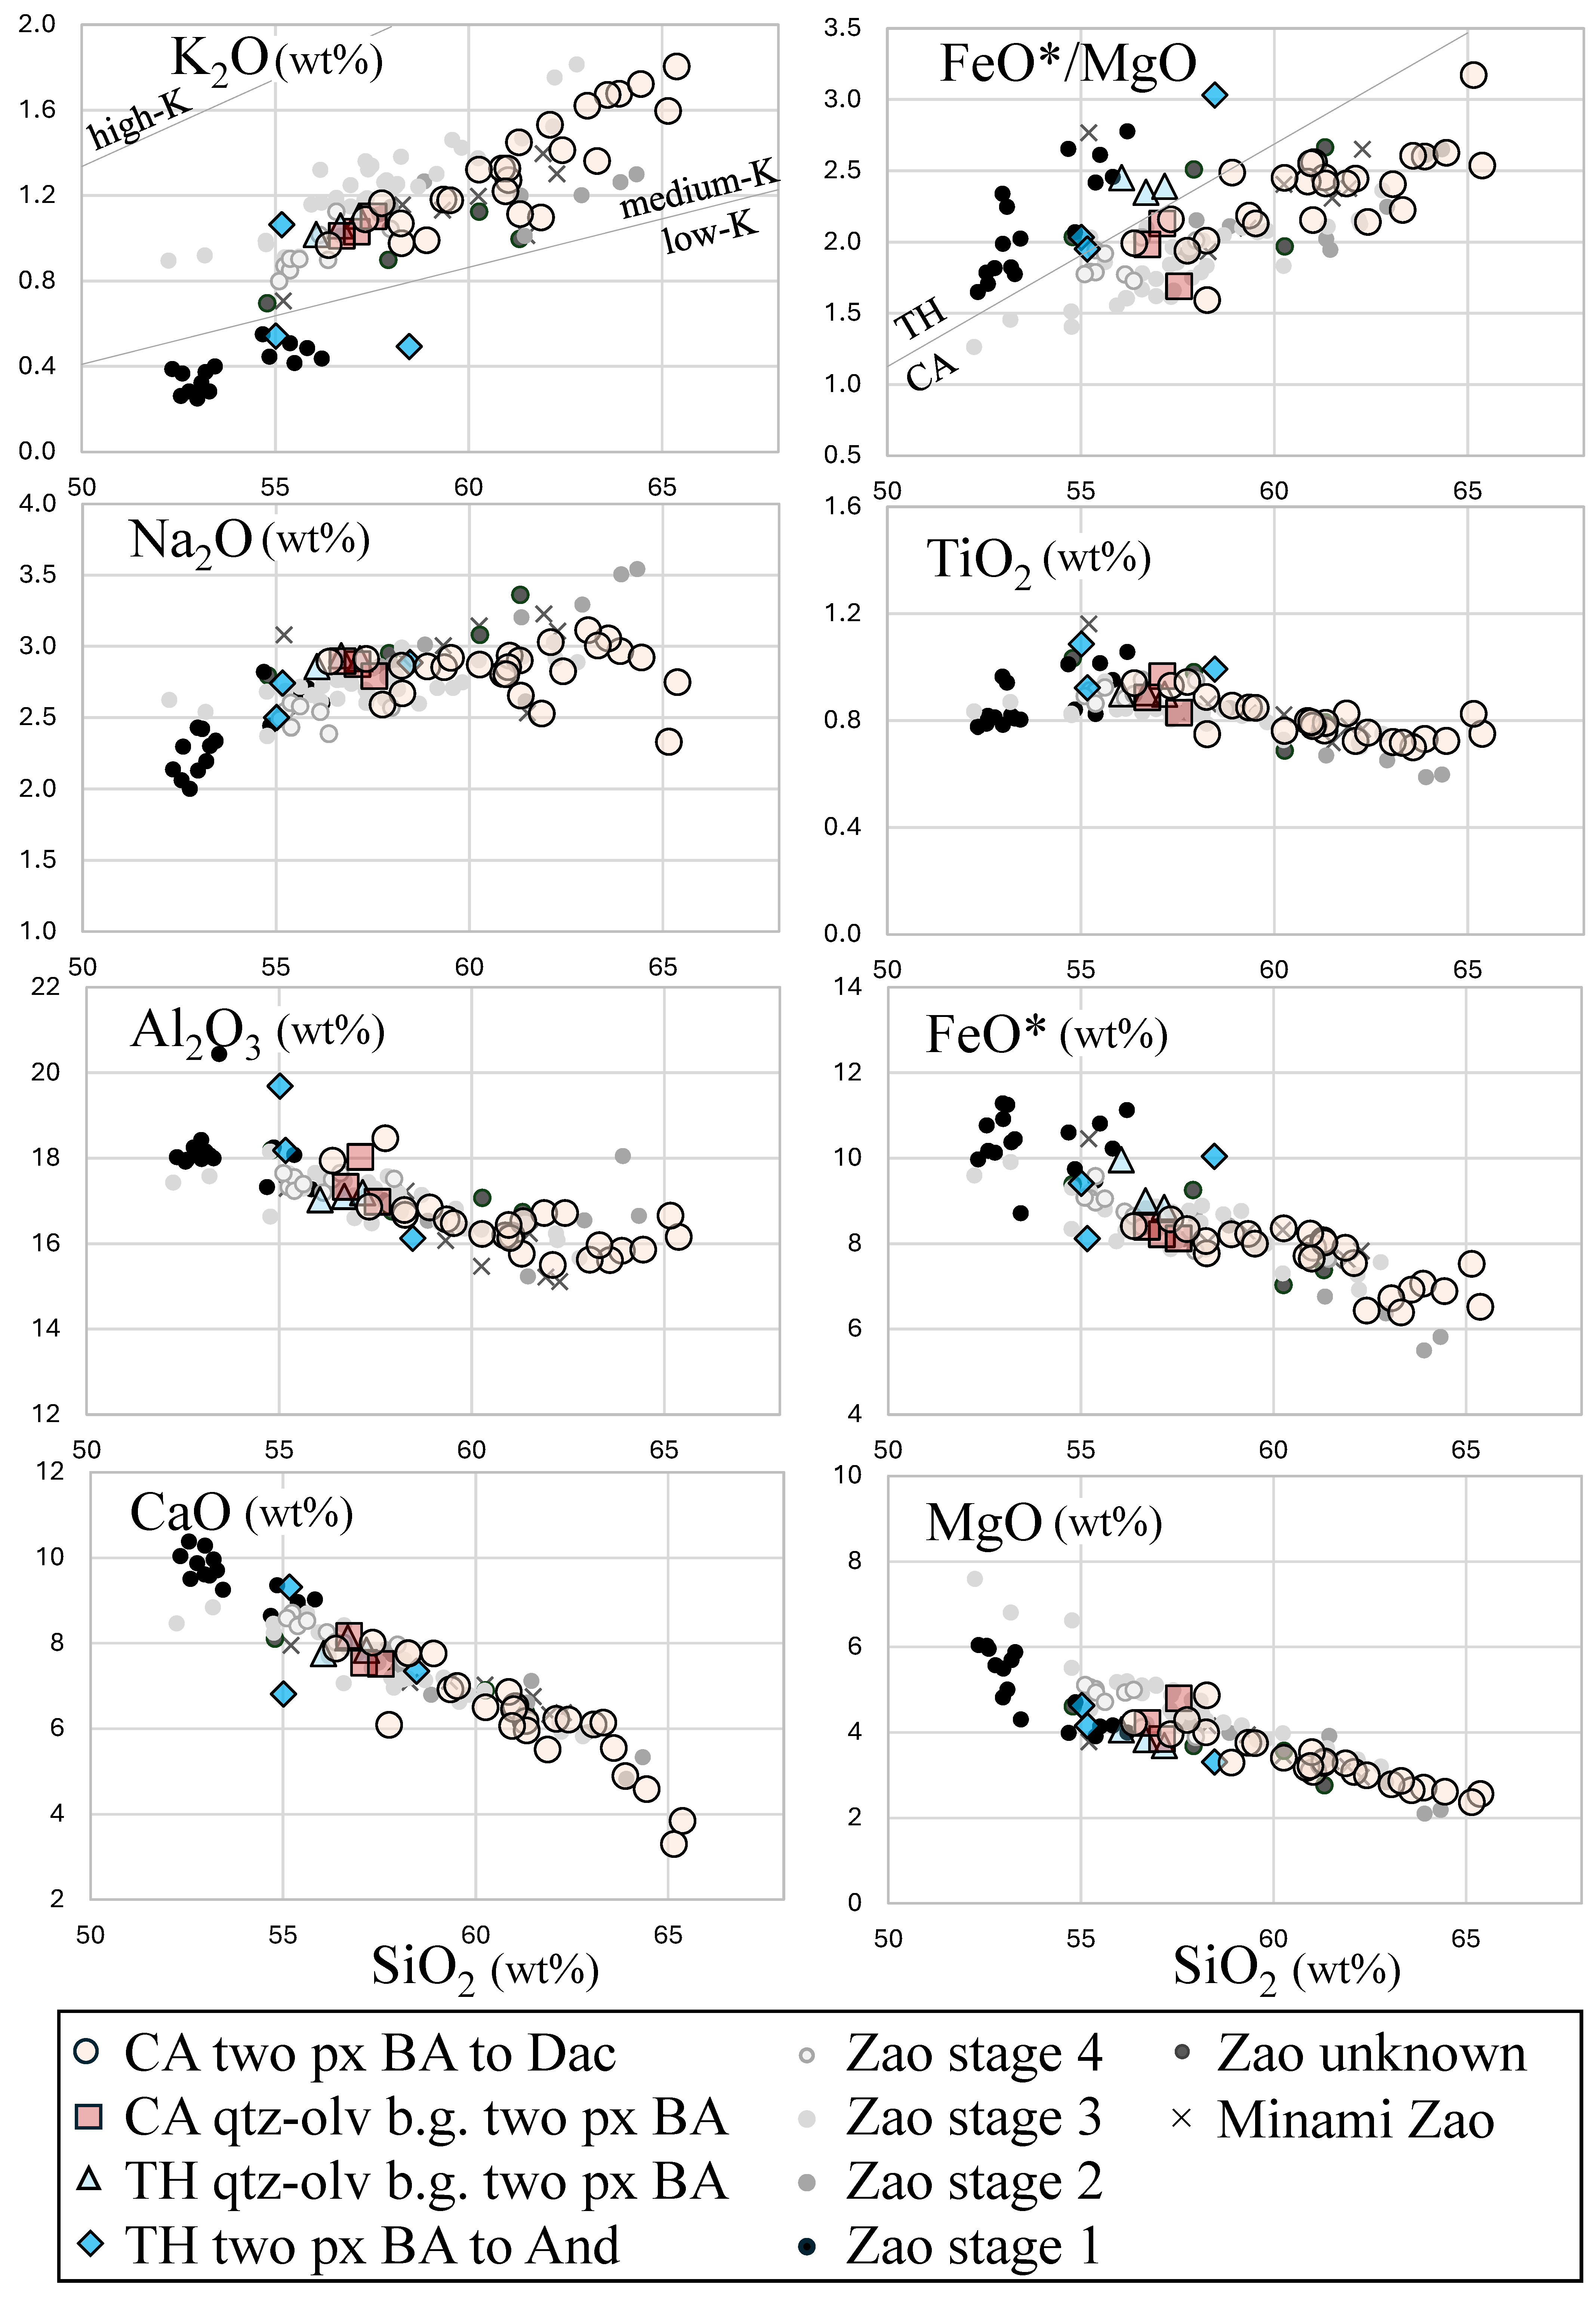
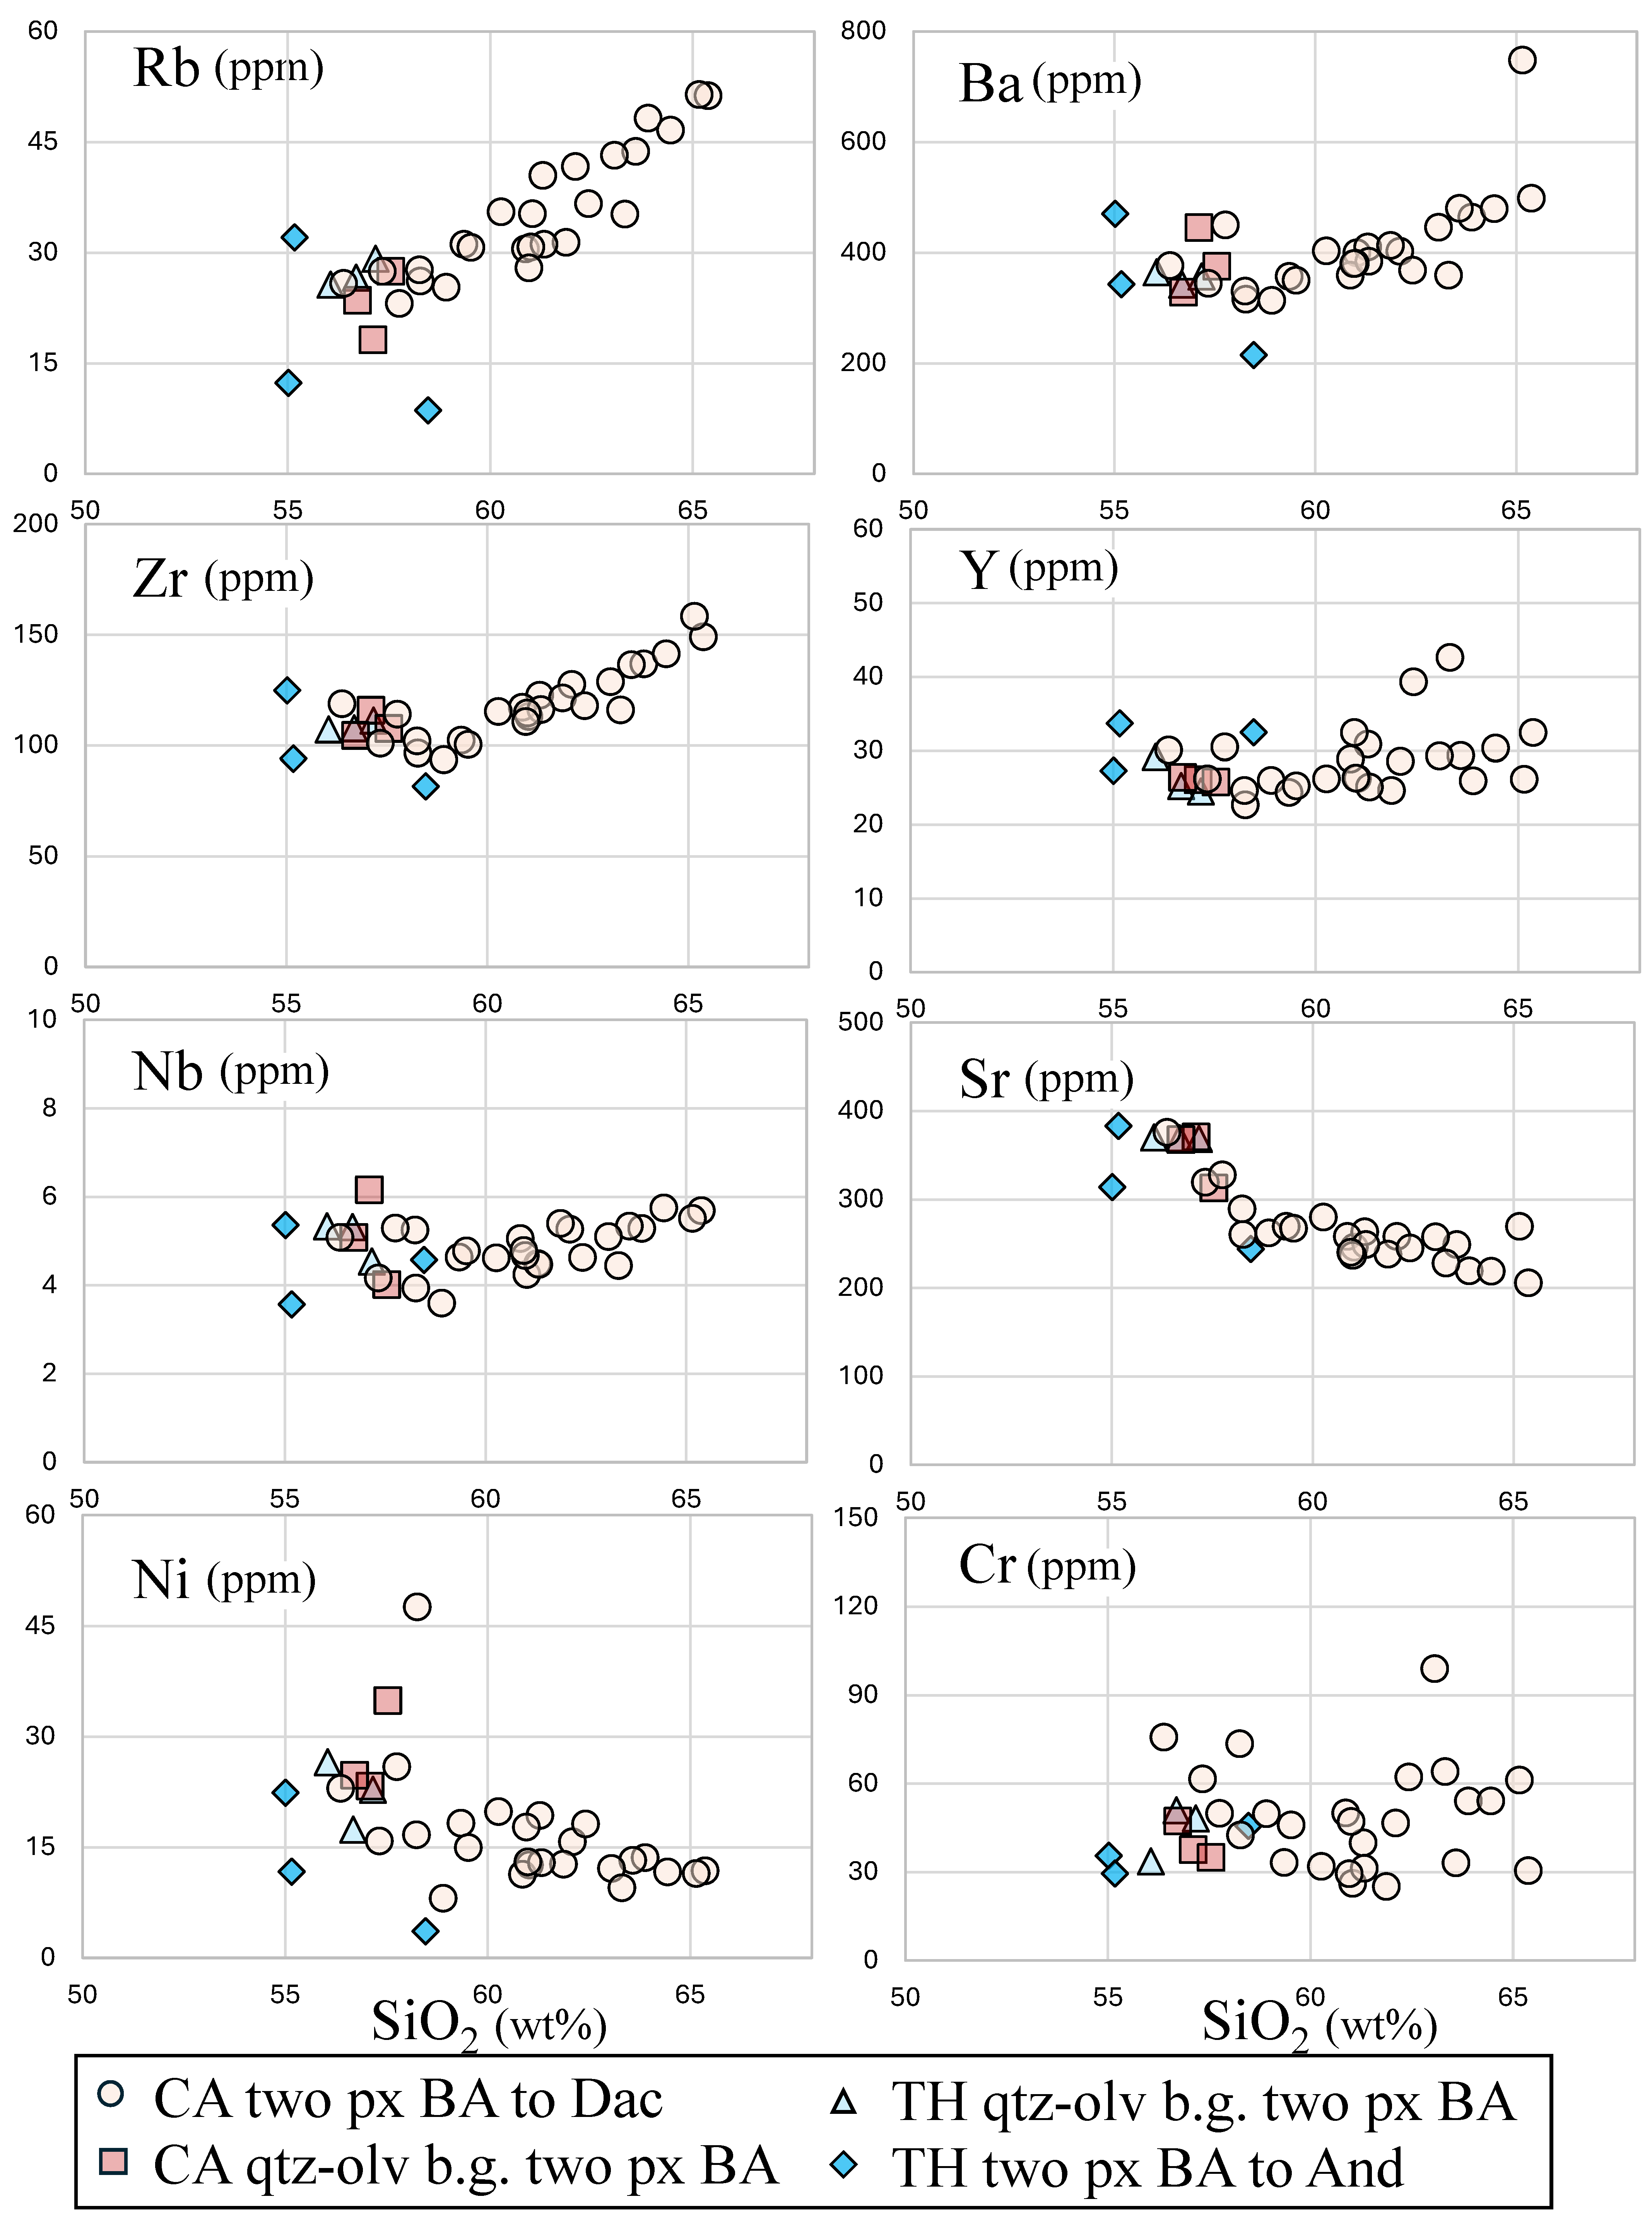
Whole-rock compositions of representative clasts are presented in Table 2. The variation diagrams are presented in Figure 6 and Figure 7. Some elements discussed in this study, particularly K, Na, Rb, Sr, and Ba, are known to be potentially mobile during hydrothermal alteration. However, as described in the Section 2, only fresh samples without visible alteration were selected for analysis. Therefore, although minor modification of mobile elements cannot be completely excluded, the overall geochemical characteristics are considered to largely reflect primary magmatic compositions. In this study, interpretations are based primarily on the overall compositional trends and consistency among multiple samples, rather than on small variations in individual mobile elements.
In this study, interpretations of clast provenance and magmatic affinity are based primarily on major-element compositions and overall compositional trends, rather than on individual trace elements that may be affected by alteration. Although some trace elements (e.g., K, Na, Rb, Sr, and Ba) may be mobile during hydrothermal alteration, the main conclusions are supported by the consistency of bulk compositional characteristics across multiple samples and by comparison with previously reported data for Zao Volcano and Minami Zao Volcano. Therefore, the influence of element mobility on the overall interpretation is considered to be limited.
The clasts can be divided into the following four types: (1) medium-K calc-alkaline two-pyroxene basaltic andesite to dacite, (2) medium-K calc-alkaline quartz-olivine-bearing two-pyroxene basaltic andesite to andesite, (3) medium-K tholeiitic quartz-olivine-bearing two-pyroxene basaltic andesite, and (4) low- to medium-K tholeiitic two-pyroxene basaltic andesite to andesite. Type (1) is predominant, followed by Type (2). Types (3) and (4) are rarely observed.
SiO2 contents of the clasts are 55–65 wt.%. In general, K2O, Na2O, Rb, Ba, Zr, Y, and Nb contents increase, whereas TiO2, Al2O3, CaO, MgO, Sr, V, and Ni contents decrease with increasing SiO2 content. The data show moderate scatter in the Cr plot. Two tholeiitic rocks are plotted in the low-K series region (Figure 6). These two samples are plotted on the lower part of the Rb diagram (Figure 7).

3.5. Petrographic Characteristics of the Clasts in the Debris Avalanche Deposit

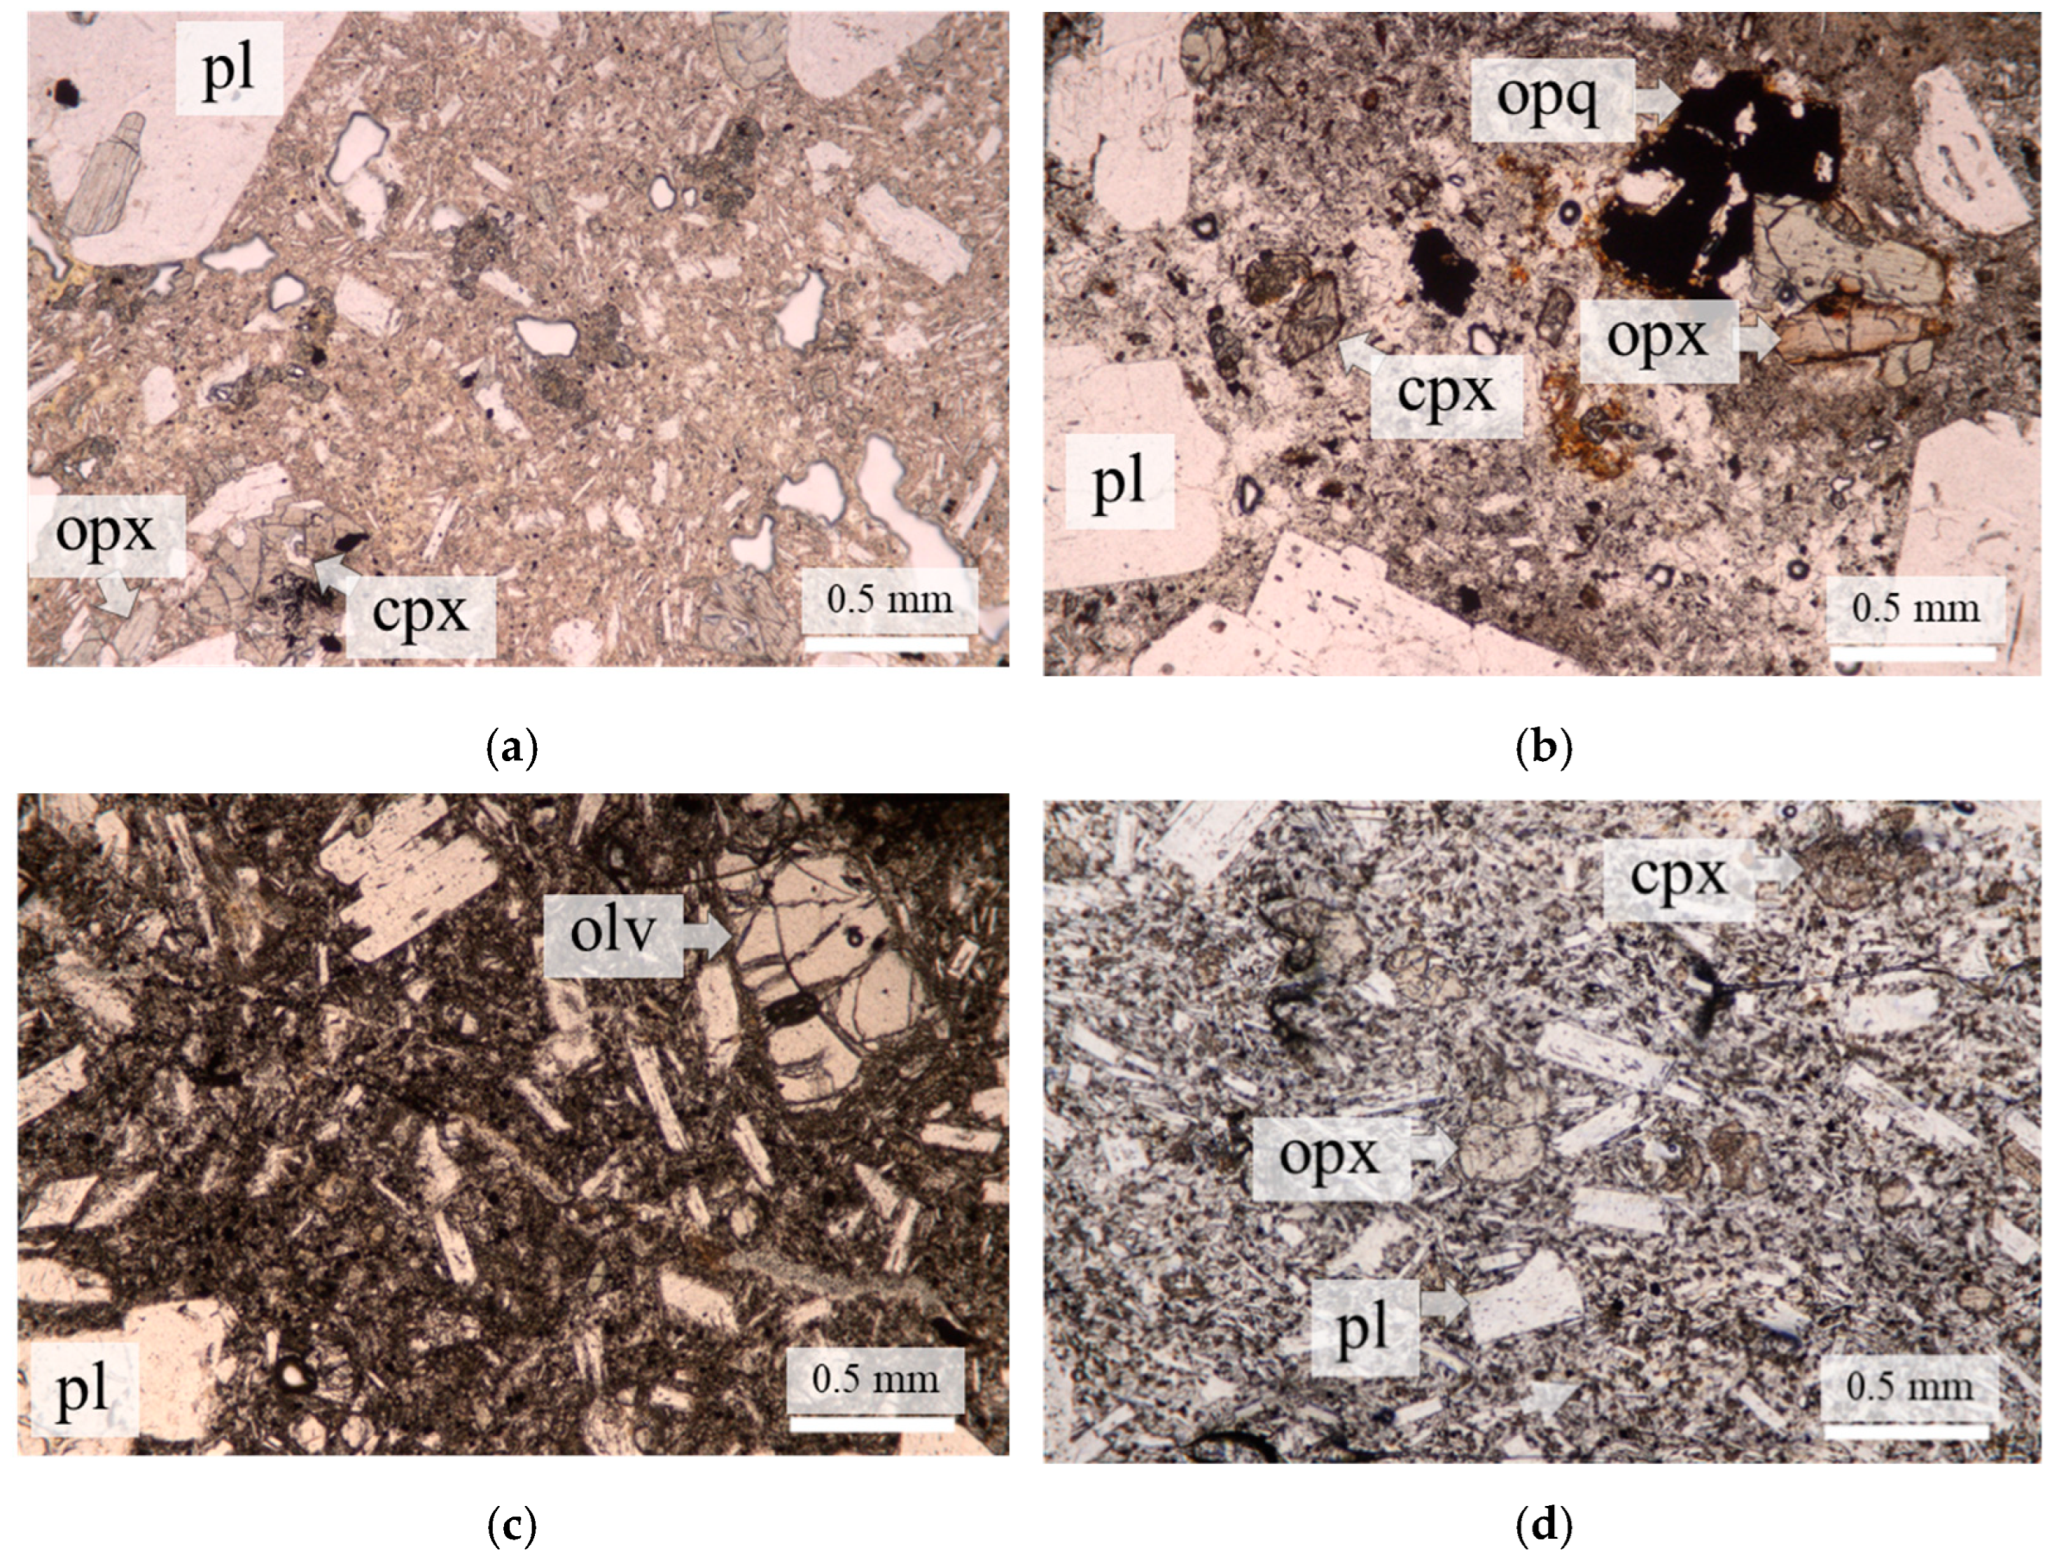
The petrographic characteristics of calc-alkaline two-pyroxene basaltic andesite to dacite, calc-alkaline quartz-olivine-bearing two-pyroxene basaltic andesite, tholeiitic two-pyroxene basaltic andesite to andesite, and tholeiitic quartz-olivine-bearing two-pyroxene basaltic andesite are described below. The photomicrographs of the representative samples are shown in Figure 8.

3.5.1. Calc-Alkaline Two-Pyroxene Basaltic Andesite to Dacite

This type has phenocrystic plagioclase (up to 4.5 mm), orthopyroxene (up to 1.2 mm), clinopyroxene (up to 2.2 mm), and opaque minerals (up to 0.6 mm) in a hyalo-ophitic-textured groundmass (Figure 8a,b). The phenocrysts are mostly subhedral. More than half of the plagioclase grains exhibit dissolution textures, such as honeycomb, dusty, and patchy textures, whereas the others do not. Orthopyroxene phenocrysts are without a reaction rim of clinopyroxene. Glomerocrysts, composed of plagioclases, pyroxenes, and opaque minerals, are occasionally observed.

3.5.2. Calc-Alkaline Quartz-Olivine-Bearing Two-Pyroxene Basaltic Andesite

This type contains phenocrystic plagioclase, two pyroxenes, and opaque minerals, with minor amounts of phenocrystic olivine and quartz in an intersertal-textured groundmass (Figure 8c). Plagioclase (up to 2.5 mm), orthopyroxene (up to 1.3 mm), clinopyroxene (up to 2.0 mm), and olivine (up to 0.8 mm) phenocrysts mostly show euhedral to subhedral, whereas quartz phenocrysts (up to 1.2 mm) and the opaque minerals (up to 0.6 mm) show anhedral to subhedral. Approximately half of the plagioclase phenocrysts exhibit dissolution textures. Orthopyroxene phenocrysts do not have clinopyroxene reaction rims. Olivine phenocrysts sometimes have a thin reaction rim of pyroxenes.

3.5.3. Tholeiitic Quartz-Olivine-Bearing Two-Pyroxene Basaltic Andesite

This type shares petrographic characteristics with the calc-alkaline quartz-olivine-bearing two-pyroxene basaltic andesite.

3.5.4. Tholeiitic Basaltic Andesite to Andesite

This type contains phenocrystic plagioclase (up to 3.2 mm), orthopyroxene (up to 1.1 mm), and clinopyroxene (up to 1.2 mm) in an intersertal-textured groundmass (Figure 8d). The phenocrysts mostly show euhedral to subhedral. Approximately half to one-third of the plagioclase phenocrysts exhibit the dissolution texture, whereas the others do not.
This type includes both low-K and medium-K. The medium-K rocks rarely include basaltic groundmass [29] and glomerocrysts composed of plagioclases, pyroxenes, and opaque minerals, which are not observed in the low-K rocks. In contrast, the low-K rocks include orthopyroxene phenocrysts having clinopyroxene reaction rims, which are not included in the medium-K rocks. Pyroxene phenocrysts in the low-K rocks are relatively scarce compared to the medium-K rocks.

4. Discussion

4.1. Source Area of the Togatta Debris Avalanche Deposit

As described in the Section 3, the debris avalanche deposit was recognized for the first time at the eastern foot of Zao Volcano. This deposit is distributed along the Nigorikawa/Matsukawa River, which originates from the summit area of Zao Volcano (Figure 2a). Therefore, it likely formed as a result of a summit collapse that formed the Umanose caldera. To further confirm this interpretation, the rock types of the clasts within the deposit were compared with those of the volcanic edifice. The chemical compositions of products forming the Zao volcanic edifice are plotted using the stage classification of [24]. Although the stages defined in [24] were later revised into six stages by [10], the classification of [24] is adopted here because it provides a larger dataset. The stages 1, 2, 3, and 4 of [24] approximately correspond to stages 1, 2–3, 4–5, and 6 of [10], respectively. In addition, data from [25], which reported further analyses of products from stages 1 and 3 of [24], are also included. All rocks, except those from the most recent stage, potentially occur in the Umanose caldera.
The oldest stage (Stage 1 in [24]) rocks of Zao Volcano belong to the low-K tholeiitic series, whereas rocks from the younger stages (Stages 2–4 in [24]) belong to the medium-K calc-alkaline series. As described in the Section 3, most clasts in the debris avalanche deposit belong to the medium-K calc-alkaline series, including Type (1) two-pyroxene basaltic andesite to dacite and Type (2) quartz-olivine-bearing two-pyroxene basaltic andesite to andesite. In contrast, the two minor types (Types (3) and (4)) belong to the tholeiitic series.
The whole-rock compositions of the medium-K calc-alkaline clasts fall within the compositional range of medium-K calc-alkaline rocks of Zao Volcano. Among the tholeiitic clasts, the low-K tholeiitic type two samples plot within or along the extension of the trends defined by Stage 1 rocks of Zao Volcano; however, the medium-K tholeiitic clasts have not been reported from rocks composing Zao Volcano.
Moreover, such medium-K tholeiitic rocks have not been reported from volcanoes along the volcanic front of the Northeast Japan arc north of Nasu Volcano (e.g., [30]). In addition, Type (3) clasts exhibit disequilibrium petrographic features that have not been described in tholeiitic rocks from volcanoes in Northeast Japan. The origin of the medium-K tholeiitic clasts remains unclear, and they are treated here as rare and exceptional components.
Based on the above considerations, it is reasonable to conclude that the Umanose caldera of Zao Volcano is the source of the Togatta debris avalanche deposit.
For comparison, the compositions of Minami Zao Volcano are also plotted in Figure 6. Minami Zao Volcano is located south of Zao Volcano. In the northern part of Minami Zao Volcano, a depression can be observed (Figure 2a), which can be interpreted as an erosional caldera or edifice collapse caldera by a phreatic eruption [26]. To further examine this, the whole-rock compositions of the rocks composing the caldera area are plotted in Figure 6. All rocks belong to the medium-K calc-alkaline series, and no tholeiitic series rocks are present. Since the clasts in the Togatta debris avalanche deposit include low-K tholeiitic rocks that are absent from Minami Zao Volcano but present in the Zao volcanic edifice, the petrographic evidence further suggests that the depression at Minami Zao Volcano is unlikely to have been the source. Therefore, this area is unlikely to have been the source of the Togatta debris avalanche deposit, although the genesis of the depression remains unresolved.

4.2. The Volume of the Togatta Debris Avalanche Deposit

The estimated remnant volume of the Togatta debris avalanche deposit is approximately 0.2 km3, although this value is subject to uncertainty due to limited exposure and simplified assumptions in thickness estimation. Taking this uncertainty into account, the initial volume is estimated to be on the order of 0.3–0.4 km3, assuming that approximately one-third to one-half of the original volume was removed mainly by fluvial erosion. This assumption is based on geomorphological observations, including the fact that the area enclosed by the high-level terraces along the Nigorikawa/Matsukawa Rivers is on the order of one-third of the surrounding terrace area (Figure 2a), while acknowledging that this relationship is approximate. This volume is comparable to that of the Umanose caldera depression, which is estimated to be on the order of 0.4 km3. The estimate is based on a simplified cylindrical model, in which a representative radius of approximately half that of the caldera is used to approximate the effective area of the depression. The height is defined as the elevation difference between the average caldera rim and the near-average elevation of the exposed older products within the inner caldera. Both the geometry and elevation values are approximate, and the resulting volume should be regarded as a first-order estimate.
Reported volumes of volcanic debris avalanche deposits vary widely, depending on the dataset considered. In Japan, reference [31] examined 71 cases and reported volumes ranging from 0.03 to 9 km3, with a median of approximately 1 km3 for those events with available estimates. Reference [32] later compiled 128 Japanese cases and found that the median volume of the 39 events with quantified estimates is approximately 0.5 km3. Reference [33] examined 58 examples, and based on the diagrams in [33], the median volume is estimated at approximately 0.12–0.15 km3. Globally, among the 50 subaerial volcanic landslides compiled by [34], the median volume is about 0.8 km3. In contrast, more recent historical events (≥0.01 km3 since 1500 CE) compiled by [35] show a median of roughly 0.15 km3, reflecting the predominance of smaller, well-documented modern events.
The estimated initial volume of 0.3–0.4 km3 for the Togatta debris avalanche deposit therefore falls within the small-to-medium range of Japanese Quaternary volcanic examples and is close to the median of global compilations.

4.3. The Mobility of the Togatta Debris Avalanche Deposit

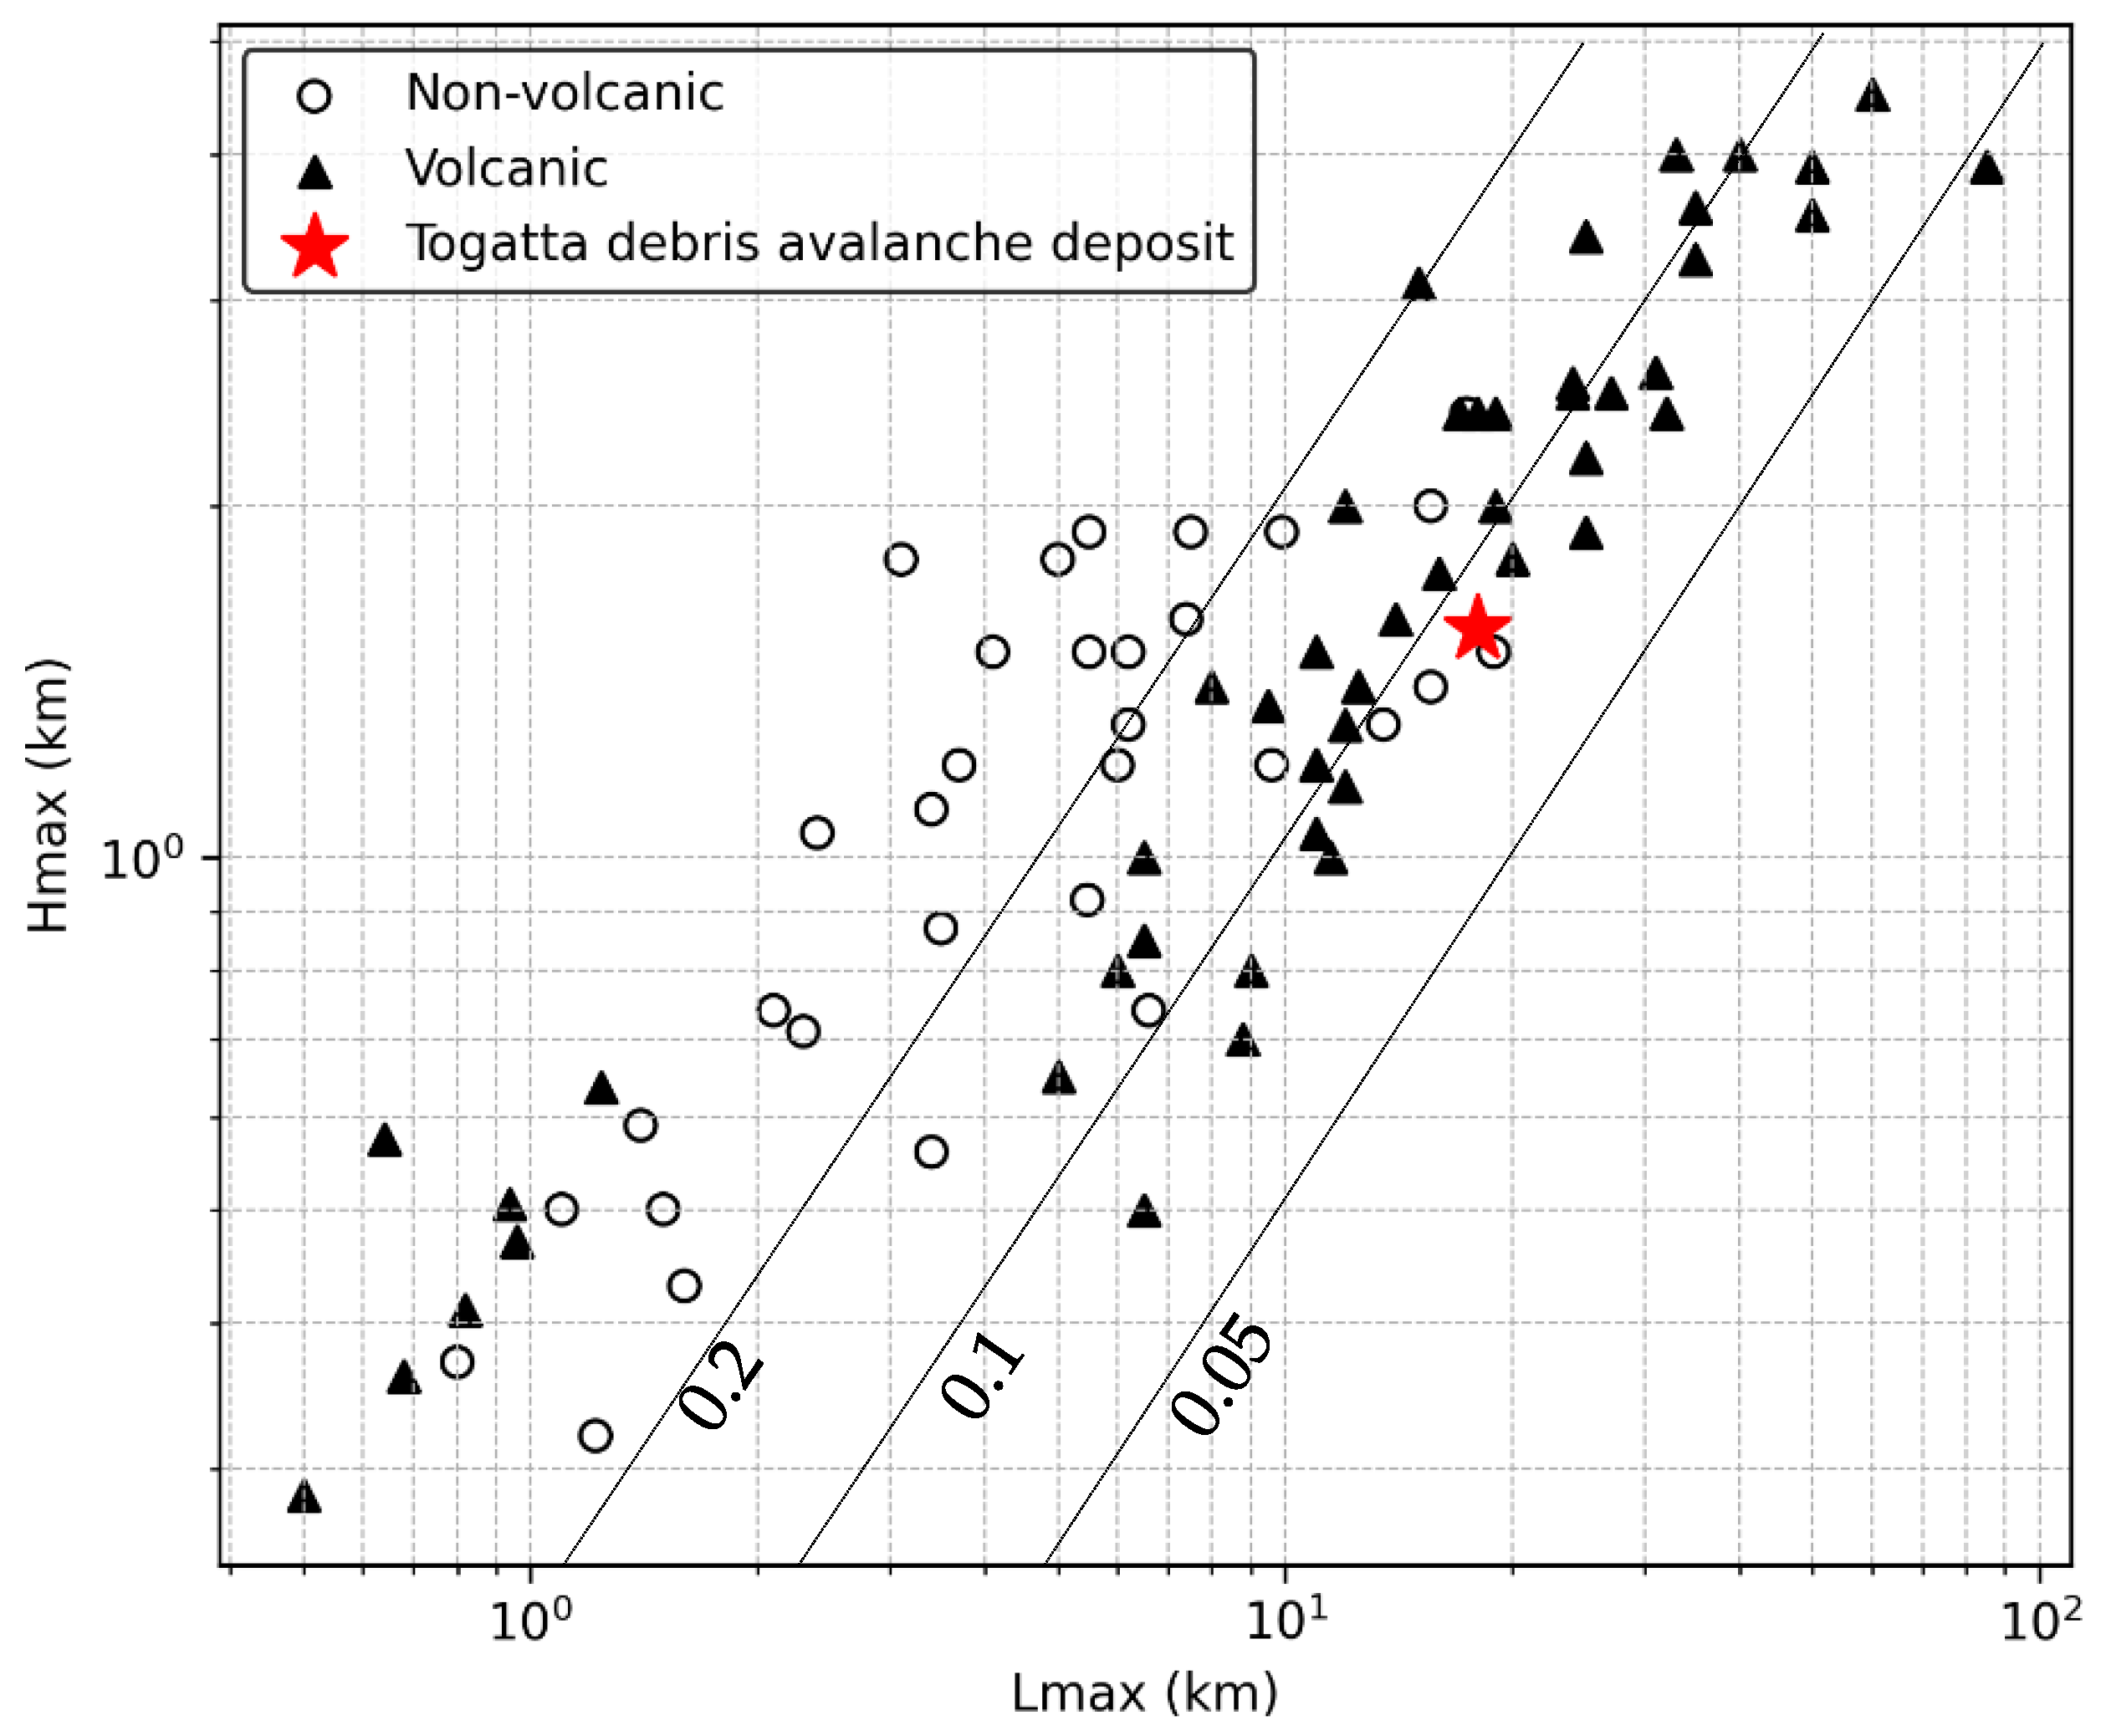
The mobility of a debris avalanche can be assessed using the ratio of vertical drop-to-runout distance of the deposit. The maximum distribution distance of the deposit is 15 km in a straight line from the summit crater, but when measured along the present river course, it is approximately 18 km. The H/L (fall height versus runout distance) relationships compiled for volcanic and non-volcanic debris avalanches demonstrate that volcanic cases systematically exhibit lower H/L values (i.e., higher mobility) than non-volcanic ones (Japanese volcanoes: e.g., [31,32]; global compilations: e.g., [8,34,36]).
For the Togatta debris avalanche deposit, Hmax is estimated from the highest elevation of the caldera rim (1810 m) and the elevation at the distal end of the deposit (240 m), yielding an Hmax of 1570 m. The flow distance along the present river channel is approximately 18 km, resulting in an Hmax/Lmax value of ~0.09. Because the transport pathway follows a curved valley, the use of a straight-line distance would not be appropriate. However, this value remains subject to uncertainty, as the present river course may not exactly reflect the original runout path and the preserved distal extent may be affected by erosion. Therefore, the mobility of the deposit is reasonably represented by H/L ~0.09. These data are plotted in the Hmax–Lmax diagram (Figure 9).
The Togatta debris avalanche deposit plots within the lower H/L range among volcanic debris avalanches, indicating relatively high mobility. Although H/L generally shows a negative correlation with volume, the Togatta deposit, despite being small to medium in scale, has an H/L value comparable to those of large-scale debris avalanche deposits.

4.4. The Age of the Togatta Debris Avalanche Deposit

A calibrated radiocarbon age obtained from the underlying mudstone is approximately 43 cal ka BP (calibrated range shown in Table 1). The dated carbon was extracted from bulk mudstone (see Methods for details); therefore, the result should be interpreted as a maximum age constraint. This age does not directly date the debris avalanche event. This result is generally consistent with previously reported ages for the high terrace (ca. 49–31 cal ka BP based on [18,19]; ca. 42–32 cal ka BP based on [20]) and does not contradict the previously proposed onset of the latest volcanic stage (~35 ka).

4.5. The Trigger of the Togatta Debris Avalanche

Edifice collapses rarely result from a single factor; rather, they typically occur through the interaction of preconditioning factors (e.g., steep slopes or weak rocks) and external triggers. Previous studies have identified a variety of processes capable of triggering slope failures in volcanic edifices [9,35,37,38,39]. For simplicity, these triggers can be broadly classified into three categories: (1) magmatic eruption-related processes, including magma intrusion and eruptive activity; (2) phreatic eruption-related processes, involving increases in subsurface fluid pressure associated with hydrothermal systems, which may lead to phreatic or hydrothermal eruptions; and (3) non-eruptive processes, such as intense rainfall-induced slope instability or strong seismic shaking from large earthquakes.

4.5.1. Possibility of Magmatic or Phreatic Eruption

As described in the Introduction, based on the geomorphological relationships between the caldera and eruptive products distributed around the summit area, the Umanose Caldera is considered to have formed at the onset of the newest stage, although the precise time gap between these eruptions and the caldera collapse remains unclear. The Togatta debris avalanche deposit, however, has only been identified at the foot of the volcano, and its direct stratigraphic relationship with the summit eruptive products remains unclear.
To evaluate whether the Togatta debris avalanche was triggered by an eruption, the stratigraphic relationship between the tephra layers of the newest stage and the Togatta debris avalanche deposit is examined below. Tephra layers of the newest stage are collectively referred to as the Zao-Togatta (Za-To) tephra. The Za-To tephra was originally defined by [11], and the stratigraphic numbering of the layers has subsequently been revised [10,40,41]. The oldest recognized layer is Za-To1.
Reference [20] reported that a tephra layer equivalent to Za-To2 occurs above a conglomerate bed interpreted here as the Togatta debris avalanche deposit, with approximately 1 m of loam intervening between them [42]. The outcrop described in their study is currently covered by vegetation and is no longer observable. Previous studies have shown that a thin loam layer, only a few centimeters thick, is intercalated between Za-To1 and Za-To2 and that Za-To1 is locally absent in some outcrops. Considering these stratigraphic relationships, although Za-To1 was not reported in the outcrop described by [20], it would most likely have been located immediately below Za-To2 if present. Therefore, no tephra layers corresponding to the same or a nearby stratigraphic horizon as the Togatta debris avalanche deposit have been reported, indicating that a direct temporal link between the debris avalanche and eruptive activity remains uncertain.
Previous studies have examined the relationship between the volume of volcanic debris avalanches and their triggering mechanisms. For example, reference [35] reported that the median volume of eruption-triggered debris avalanches is approximately 0.3–0.4 km3, whereas that of non-eruptive collapses is about 0.05 km3. The volume of the Togatta debris avalanche examined in this study is estimated at approximately 0.3 km3. This value is comparable to the median volume of eruption-triggered events reported by [35] and is substantially larger than the typical scale of non-eruptive collapses. These observations suggest that the collapse volume (0.3–0.4 km3) is comparable to the median volume of eruption-triggered debris avalanches reported by [35] and is larger than the typical scale of non-eruptive collapses. This relationship is consistent with the possibility that the collapse was associated with eruptive activity.
However, no tephra layers directly corresponding to the same stratigraphic horizon as the Togatta debris avalanche deposit have been identified. This lack of direct stratigraphic evidence means that a temporal linkage between eruptive activity and the collapse cannot be demonstrated conclusively. Although no eruptive deposits directly associated with the debris avalanche have been identified in the study area, this may reflect the relatively distal location of the investigated outcrops. Therefore, while a magmatic eruption cannot be confirmed, a phreatic eruption remains a plausible but unverified trigger.

4.5.2. Possibility of Non-Eruptive Cases

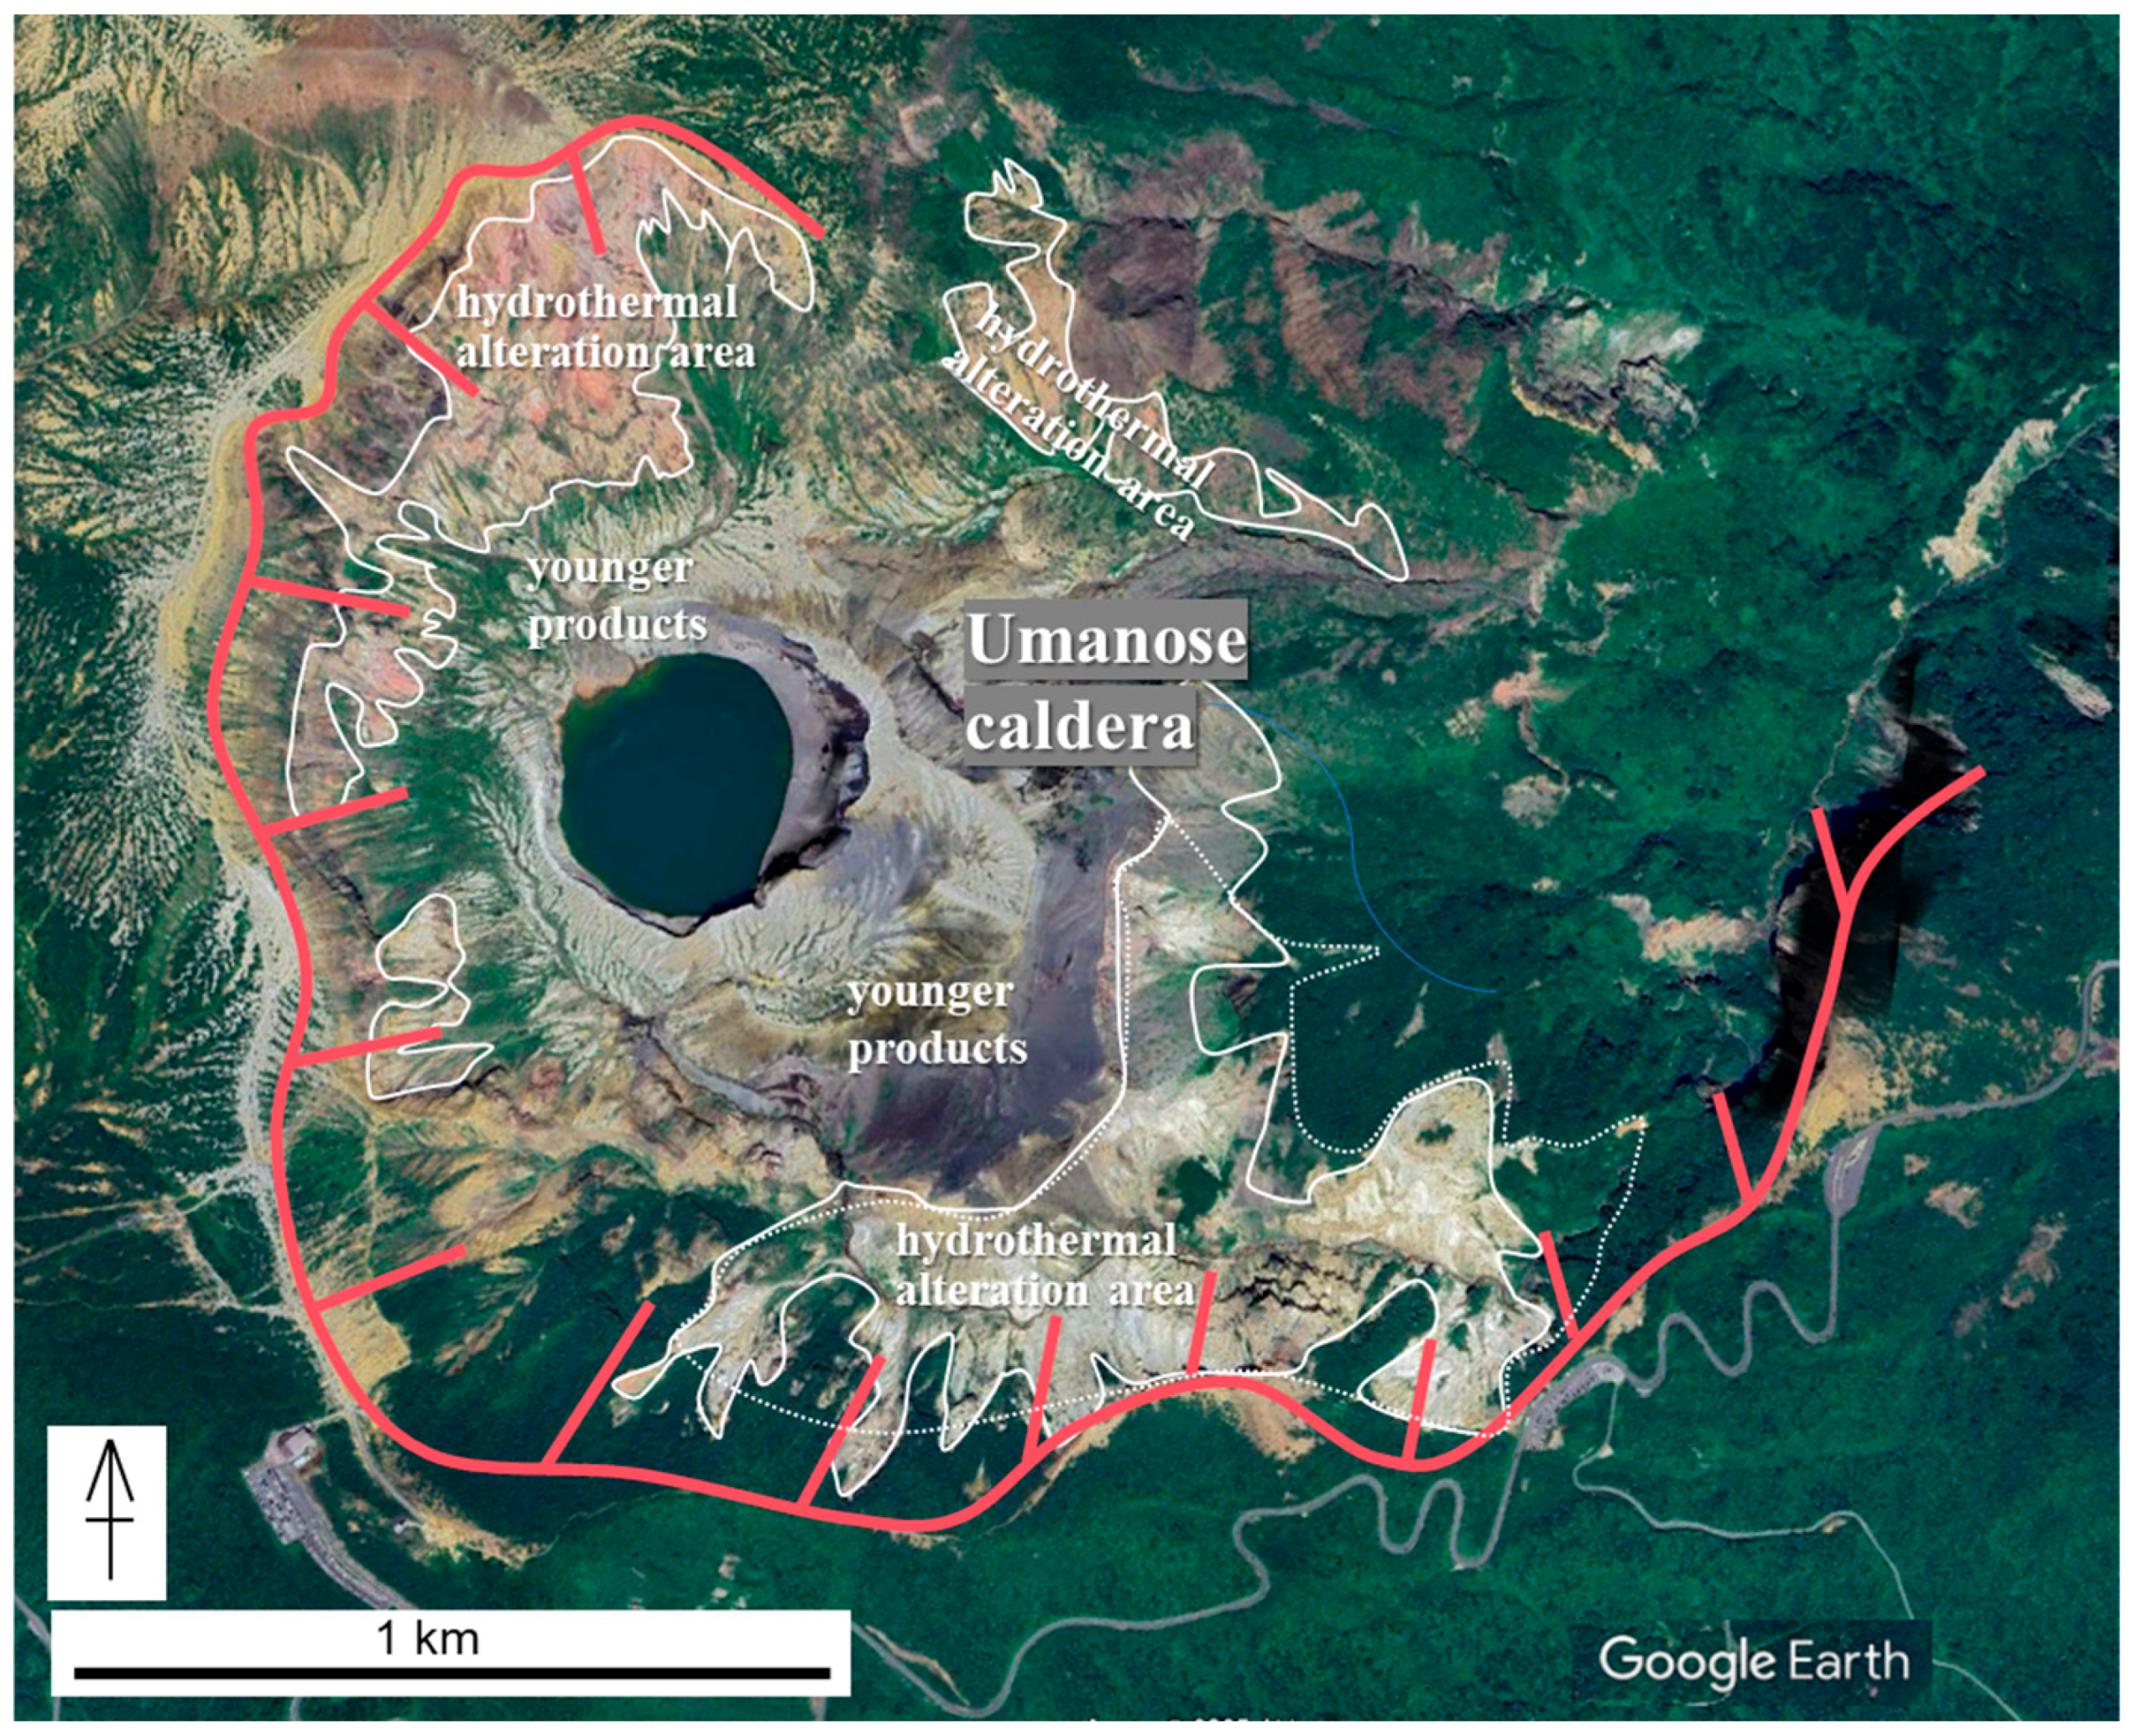
Alternatively, the debris avalanche may have been triggered by non-eruptive processes, such as a large earthquake or intense rainfall. In this scenario, the event would represent an unusually large debris avalanche not directly associated with eruptive activity. Although much of the present Umanose caldera floor is covered by younger volcanic deposits, several areas are thought to preserve remnants of the former caldera floor. Outcrops in these areas commonly exhibit older strata that have undergone hydrothermal alteration (Figure 10). The distribution of altered zones shown in Figure 10 is interpretative and not based on systematic mapping. In addition, portions of the caldera wall expose older units that are locally hydrothermally altered.
These observations suggest that hydrothermally altered rocks may be present within parts of the volcanic edifice, although their spatial distribution remains uncertain (Figure 10). Because hydrothermal alteration can significantly reduce rock strength, the presence of such weakened zones could have predisposed the edifice to failure. In this context, a non-eruptive trigger such as seismic shaking or intense rainfall could have initiated collapse under mechanically weakened conditions, even in the absence of a contemporaneous eruption.

4.5.3. Synthesis of Possible Triggering Mechanisms

Taken together, the available evidence allows for multiple possible triggering mechanisms. The relatively large volume of the collapse (0.3–0.4 km3) is consistent with previously reported eruption-triggered events, suggesting that an eruption-related process is a viable explanation. However, the absence of direct stratigraphic evidence linking the debris avalanche to eruptive deposits prevents a definitive interpretation. At the same time, field observations indicate that hydrothermally altered rocks are locally present within the volcanic edifice. Such alteration may have reduced rock strength and preconditioned the summit area for collapse, meaning that even a non-eruptive trigger could have produced a large-scale failure.
Therefore, the available data do not uniquely constrain the trigger of the Togatta debris avalanche. Both eruption-related and non-eruptive mechanisms remain plausible, and the collapse is best interpreted as the result of a combination of preconditioning and triggering factors, rather than a single deterministic cause.

4.6. The Compositional Changes in Eruption Products Across the Caldera Collapse

Changes in magma composition are sometimes associated with variations in the stress state and structural evolution of volcanic edifices, including edifice collapse and unloading (e.g., [44,45,46,47,48]).
At Zao Volcano, eruption products of the most recent stage show systematically higher K2O contents than those of the preceding stage (Figure 6) [10,24]. This compositional shift is a robust observation. However, magma beneath Zao Volcano is thought to result from mixing between deep and shallow components. Therefore, the observed compositional differences likely reflect changes in one or both magma sources.
Although edifice collapse and associated gravitational unloading could influence magma storage conditions, the data presented in this study do not directly demonstrate such a causal relationship. The link between caldera collapse and magma compositional change thus remains hypothetical and requires further investigation.

5. Conclusions

  • Debris avalanche deposits associated with the collapse of the summit area of Zao Volcano are reported for the first time at the eastern foot of the volcano. Although dense vegetation in the area generally limits exposure, careful field surveys allowed observation of the deposits at 13 sites. Deposits showing block facies were observed at Locations 1, 2, and 13, while matrix facies dominate at other locations.
  • The deposits extend 11–15 km from the summit, with thicknesses ranging from 20 to 30 m in the western and northern parts to over 50 m in the eastern part. The estimated initial volume is approximately 0.3–0.4 km3, comparable to the volume of the Umanose caldera depression. The vertical drop-to-runout distance ratio (H/L) is 0.09, which falls within the typical range for volcanic debris avalanches but indicates relatively high mobility.
  • Petrological and geochemical analyses of representative clasts reveal SiO2 contents ranging from 55 to 65 wt.%. Based on the petrographic and compositional characteristics, the clasts can be grouped into the following four types: (1) medium-K calc-alkaline two-pyroxene basaltic andesite to dacite, (2) medium-K calc-alkaline quartz-olivine-bearing two-pyroxene basaltic andesite to andesite, (3) medium-K tholeiitic quartz-olivine-bearing two-pyroxene basaltic andesite, and (4) low- to medium-K tholeiitic two-pyroxene basaltic andesite to andesite.
  • Comparison of clast compositions with those of the Zao Volcano edifice suggests that the Togatta debris avalanche deposit originated from the summit of the Umanose caldera. Apart from a few medium-K tholeiitic clasts, which are not widely reported from other volcanoes along the northeast Japan arc, the rock types of the clasts correspond closely to those of the volcanic edifice.
  • The chronological data are presented as supporting constraints and are consistent with previously proposed eruptive stages, rather than forming the primary basis of our conclusions.
  • While the collapse may have been associated with the phreatic eruption activity, hydrothermally altered rocks within the edifice—especially remnants of the caldera floor and sections of the caldera wall—may have preconditioned the edifice for large-scale summit collapse even in the absence of direct eruptive activity. Therefore, a non-eruptive collapse mechanism cannot be completely ruled out.
  • Observed changes in magma composition at Zao Volcano are likely related to variations in the relative contributions of deep and shallow magma components. The potential influence of gravitational unloading due to summit collapse on magma composition remains uncertain and a subject for future study.

Author Contributions

Conceptualization, M.B. and F.O.; methodology, M.B. and F.O.; software, M.B. and F.O.; validation, M.B., F.O., M.S. and T.I.; formal analysis, M.B. and F.O.; investigation, M.B., F.O., M.S. and T.I.; resources, F.O. and M.B.; data curation, M.B. and F.O.; writing—original draft preparation, M.B. and F.O.; writing—review and editing, M.B., F.O., M.S. and T.I.; visualization, M.B.; supervision, M.B.; project administration, M.B.; funding acquisition, M.B. All authors have read and agreed to the published version of the manuscript.

Funding

This work was supported by MEXT “Integrated Program for Next Generation Volcano Research”.

Data Availability Statement

All data presented in this study are included in this article.

Acknowledgments

We are especially grateful to Kirika Kitagawa and Tomoya Murakami of the Zao Town Geopark Promotion Office, Miyagi Prefecture, for their assistance in obtaining permission to conduct research on private land in the town, and we also thank the other staff members and the people in Zao Town for their support. We sincerely appreciate the encouragement and support of Naoyoshi Iwata and Kae Tsunematsu throughout this study. We would also like to express our appreciation to Takeshi Hasegawa for recommending the submission of this study to this Special Issue. We also thank the two anonymous reviewers for their constructive comments, which helped improve the clarity and quality of this manuscript.

Conflicts of Interest

The authors declare no conflicts of interest.

References

  1. Voight, B.; Janda, R.J.; Glicken, H.; Douglass, P.M. Nature and mechanics of the Mount St. Helens rockslide-debris avalanche of 18 May 1980. Geotechnique 1983, 33, 243–273. [Google Scholar] [CrossRef] [Scilit]
  2. Christiansen, R.L.; Peterson, D.W. Chronology of the 1980 eruptive activity. In The 1980 Eruptions of Mount St Helens, Washington; Lipman, P.W., Mullineaux, D.R., Eds.; U.S. Geological Survey Professional Paper 1250; U.S. Government Printing Office: Washington, DC, USA, 1981; Volume 1250, pp. 17–30. [Google Scholar]
  3. Nakamura, Y.; Glicken, H. Blast and debris-avalanche deposits of the 1888 eruption Bandai volcano. J. Geogr. (Chigaku Zasshi) 1988, 97, 309–316, (In Japanese with English abstract). [Google Scholar] [CrossRef] [Scilit]
  4. Ui, T. Pyroclastic flows and eruptions at Mount Bandai, Japan. J. Volcanol. Geotherm. Res. 1983, 18, 135–150. [Google Scholar] [CrossRef] [Scilit]
  5. Yamamoto, T.; Nakamura, Y.; Glicken, H. Pyroclastic density current from the 1888 phreatic eruption of Bandai volcano, NE Japan. J. Volcanol. Geotherm. Res. 1999, 90, 191–207. [Google Scholar] [CrossRef] [Scilit]
  6. Siebert, L. Large volcanic debris avalanches: Characteristics of source areas, deposits, and associated eruptions. J. Volcanol. Geotherm. Res. 1984, 22, 163–197. [Google Scholar] [CrossRef] [Scilit]
  7. Siebert, L. Hazards of Large Volcanic Debris Avalanches and Associated Eruptive Phenomena. In Monitoring and Mitigation of Volcano Hazards; Lipman, P.W., Mullineaux, D.R., Eds.; Springer: Berlin/Heidelberg, Germany, 1996; pp. 541–572. [Google Scholar]
  8. Dufresne, A.; Siebert, L.; Bernard, B. Distribution and Geometric Parameters of Volcanic Debris Avalanche Deposits. In Volcanic Debris Avalanches; Roverato, M., Dufresne, A., Procter, J., Eds.; Advances in Volcanology; Springer: Cham, Switzerland, 2021; Volume 6, pp. 75–90. [Google Scholar]
  9. van Wyk de Vries, B. Landslides, debris avalanches, and volcanic gravitational deformation. In Encyclopedia of Volcanoes, 2nd ed.; Sigurdsson, H., Houghton, B., McNutt, S.R., Rymer, H., Stix, J., Siebert, L., Eds.; Academic Press: Cambridge, MA, USA, 2015; pp. 665–685. [Google Scholar]
  10. Ban, M.; Oikawa, N.; Yamazaki, S. Geological Map of Zao Volcano. In Geological Map of Volcanoes, no 18; Geological Survey of Japan, AIST: Tsukuba, Japan, 2015. [Google Scholar]
  11. Imura, R. Eruption history of Goshikidake, Zao Volcano. In Proceedings of the Abstracts of the 1994 Autumn Meeting of the Volcanological Society of Japan, Sendai City, Japan, 20 October 1994; p. 92. (In Japanese) [Google Scholar]
  12. Reimer, P.J.; Austin, W.E.N.; Bard, E.; Bayliss, A.; Blackwell, P.G.; Bronk Ramsey, C.; Butzin, M.; Cheng, H.; Edwards, R.L.; Friedrich, M.; et al. The IntCal20 Northern Hemisphere radiocarbon age calibration curve (0–55 cal kBP). Radiocarbon 2020, 62, 725–757. [Google Scholar] [CrossRef] [Scilit]
  13. Yamada, Y.; Kohno, H.; Murata, M. A low dilution fusion method for major and trace element analysis of geological samples. Adv. X-Ray Anal. 1995, 26, 33–44, (In Japanese with English abstract). [Google Scholar]
  14. Ban, M.; Takahashi, K.; Horie, T.; Toya, N. Petrogenesis of mafic inclusions in rhyolitic lavas from Narugo Volcano, Northeastern Japan. J. Petrol. 2005, 46, 1543–1563. [Google Scholar] [CrossRef] [Scilit]
  15. Matsui, K.; Abe, M.; Inoue, T.; Masago, S.; Ishino, K.; Oide, K.; Nakagawa, H.; Shoji, M.; Kaneko, S.; Ando, Y.; et al. Geological Survey Report of the Zao Volcano Foot Area; Tohoku Regional Agricultural Administration Bureau, Planning Department, Ed.; Tohoku Regional Agricultural Administration Bureau: Sendai, Japan, 1971; pp. 21–48. (In Japanese) [Google Scholar]
  16. Tayama, R. Geomorphological study of river terraces near Sendai. Saito Hōonkai Sci. Rep. 1933, 17, 1–83. (In Japanese) [Google Scholar]
  17. Nakagawa, H.; Ogawa, S.; Suzuki, Y. Quaternary geology and geomorphology near Sendai. Quat. Res. 1960, 1, 219–227, (In Japanese with English abstract). [Google Scholar] [CrossRef] [Scilit]
  18. Takeuchi, S. Pollen analysis of low terraces near Sendai. In Professor Nobu Kitamura Memorial Geological Papers; Nakagawa, H., Ed.; Commemorative Society for Professor Nobu Kitamura’s Retirement: Sendai, Japan, 1986; pp. 517–526. (In Japanese) [Google Scholar]
  19. Takeuchi, S. 14C dating of Sendai Kamimachi terrace deposits. Chikyu Kagaku 1986, 40, 301–302, (In Japanese with English abstract). [Google Scholar]
  20. Itagaki, N.; Toyoshima, M.; Terado, T. Holocene scoria layers in Sendai and surrounding areas. Tohoku Geogr. 1981, 33, 48–53. (In Japanese) [Google Scholar]
  21. Glicken, H. Rockslide-Debris Avalanche of May 18, Mount St. Helens Volcano, Washington; USGS Open-File Report 96-677; U.S. Government Printing Office: Washington, DC, USA, 1996; pp. 1–90. [Google Scholar]
  22. Sánchez-Núñez, J.M.; Macías, J.L.; Arce, J.L.; Gómez, J.C. The Chuquibamba Landslide Western Cordillera, Peru revisited: New evidence of a dry debris avalanche. Geofís. Int. 2025, 64, 48–53. [Google Scholar] [CrossRef] [Scilit]
  23. Kitamura, N.; Nakagawa, H. Basic Land Classification 1:50,000 “Shiroishi”: Surficial Geology Map and Explanatory Notes; Miyagi Prefecture: Sendai, Japan, 1983; pp. 25–36. [Google Scholar]
  24. Sakayori, A. Geology and petrology of Zao Volcano. J. Jpn. Assoc. Mineral. Petrol. Econ. Geol. 1992, 87, 433–444, (In Japanese with English abstract). [Google Scholar] [CrossRef] [Scilit]
  25. Tatsumi, Y.; Takahashi, T.; Hirahara, Y.; Chang, Q.; Miyazaki, T.; Kimura, J.I.; Ban, M.; Sakayori, A. New insights into andesite genesis: The role of mantle-derived calc-alkalic and crust-derived tholeiitic melts in magma differentiation beneath Zao Volcano, NE Japan. J. Petrol. 2008, 49, 1971–2008. [Google Scholar] [CrossRef] [Scilit]
  26. Sakayori, A. Geology of Minami Zao volcano. J. Jpn. Assoc. Mineral. Petrol. Econ. Geol. 1985, 80, 94–103, (In Japanese with English abstract). [Google Scholar] [CrossRef] [Scilit]
  27. Gill, J.B. Orogenic Andesites and Plate Tectonics; Springer: Berlin/Heidelberg, Germany; New York, NY, USA, 1981; pp. 1–392. [Google Scholar]
  28. Miyashiro, A. Volcanic rock series in island arcs and active continental margins. Am. J. Sci. 1974, 274, 321–355. [Google Scholar] [CrossRef] [Scilit]
  29. Sakuyama, M. Evidence of magma mixing: Petrological study of Shirouma-Oike calc-alkaline andesite volcano, Japan. J. Volcanol. Geotherm. Res. 1979, 5, 179–208. [Google Scholar] [CrossRef] [Scilit]
  30. Ban, M.; Kimura, J.-I.; Takahashi, T.; Hirahara, Y.; Ohba, T.; Fujinawa, A.; Hayashi, S.; Yoshida, T.; Miyazaki, T.; Tsuchiya, N.; et al. The significant role of the mafic lower crust in the chemical diversity of arc magmas. Isl. Arc 2025, 34, e70033. [Google Scholar] [CrossRef] [Scilit]
  31. Ui, T.; Yamamoto, H.; Suzuki-Kamata, K. Characterization of debris avalanche deposits in Japan. J. Volcanol. Geotherm. Res. 1986, 29, 231–243. [Google Scholar] [CrossRef] [Scilit]
  32. Inokuchi, T. Properties of sector-collapse and debris avalanche on quaternary volcanoes in Japan. J. Jpn. Landslide Soc. 2006, 42, 409–420, (In Japanese with English abstract). [Google Scholar] [CrossRef] [Scilit] [PubMed]
  33. Yoshida, H. Catastrophic Sector Collapses of Quaternary Volcanoes as Significant Sediment Sources in Japan. J. Geogr. (Chigaku Zasshi) 2010, 119, 568–578, (In Japanese with English abstract). [Google Scholar] [CrossRef] [Scilit]
  34. Legros, F. The mobility of long-runout landslides. Eng. Geol. 2002, 63, 301–331. [Google Scholar] [CrossRef] [Scilit]
  35. Siebert, L.; Reid, M.E. Lateral edifice collapse and volcanic debris avalanches: A post-1980 Mount St. Helens perspective. Bull. Volcanol. 2023, 85, 61. [Google Scholar] [CrossRef] [Scilit]
  36. Scheidegger, A. On the prediction of the reach and velocity of catastrophic landslides. Rock Mech. 1973, 5, 231–236. [Google Scholar] [CrossRef] [Scilit]
  37. Siebert, L.; Glicken, H.; Ui, T. Volcanic hazards from Bezymianny- and Bandai-type eruptions. Bull. Volcanol. 1987, 49, 435–459. [Google Scholar] [CrossRef] [Scilit]
  38. McGuire, W.J. Volcano instability: A review of contemporary themes. Geol. Soc. Lond. Spec. Publ. 1996, 110, 1–23. [Google Scholar] [CrossRef] [Scilit]
  39. Ui, T.; Takarada, S.; Yoshimoto, M. Debris avalanches. In Encyclopedia of Volcanoes; Tobin, H., Witter, C., Eds.; Academic Press: Cambridge, MA, USA, 2000; pp. 617–626. [Google Scholar]
  40. Ban, M.; Sagawa, H.; Miura, K.; Hirotani, S. Evidence for a short-lived stratified magma chamber: Petrology of the Za-To tephra layer (~5.8 ka) at Zao volcano, NE Japan. In Dynamics of Crustal Magma Transfer, Storage, and Differentiation; Zellmer, G.F., Annen, C., Eds.; Geological Society of London: London, UK, 2008; Volume 304, pp. 149–168. [Google Scholar]
  41. Ban, M.; Oikawa, T.; Imura, T.; Tsunematsu, K.; Jin, H.; Takahashi, Y. An Example of the Magma Discharge Step-diagram: Zao Volcano. In Magma Discharge Step-Diagrams of Japanese Active Volcanoes; Technical Note of the National Research Institute for Earth Science and Disaster Resilience; National Research Institute for Earth Science and Disaster Resilience: Tsukuba, Japan, 2023; Volume 500, pp. 37–43, (In Japanese with English abstract). [Google Scholar]
  42. Miura, K.; Ban, M.; Yagi, K. The tephra layers distributed around the eastern foot of the Zao volcano-Ages and volumes of the Za-To 1 to 4 tephras-. Bull. Volcanol. Soc. Jpn. 2008, 53, 151–157. [Google Scholar]
  43. Imura, T.; Ohba, T.; Takahashi, R.; Manalo, P.; Sato, H.; Ban, M.; Hirata, A.; Alvarez-Valero, A. Sulfur isotopic variations in the products of the 1895 CE eruption at Zao volcano (NE Japan): Implications for connecting eruption source and syn-eruptive magmatic-hydrothermal processes. J. Volcanol. Geotherm. Res. 2024, 452, 108127. [Google Scholar] [CrossRef] [Scilit]
  44. Manconi, A.; Bagnardi, M.; Tait, S.; Walter, T.R. Sector collapses and magmatic system response at ocean island volcanoes. J. Volcanol. Geotherm. Res. 2009, 182, 85–100. [Google Scholar]
  45. Boudon, G.; Villemant, B.; Le Friant, A.; Paterne, M.; Cortijo, E. Role of large flank-collapse events on magma evolution of volcanoes: Insights from the Lesser Antilles Arc. J. Volcanol. Geotherm. Res. 2013, 263, 224–237. [Google Scholar] [CrossRef] [Scilit]
  46. Longpré, M.-A.; Troll, V.R.; Walter, T.R.; Hansteen, T.H. Volcanic and geochemical evolution of the Teno massif, Tenerife, Canary Islands: Some repercussions of giant landslides on ocean island magmatism. Geochem. Geophys. Geosyst. 2009, 10, Q12017. [Google Scholar] [CrossRef] [Scilit]
  47. Pinel, V.; Albino, F. Consequences of volcano sector collapse on magmatic storage zones: Insights from numerical modeling. J. Volcanol. Geotherm. Res. 2013, 252, 29–37. [Google Scholar] [CrossRef] [Scilit]
  48. Wat, S.F.L. The evolution of volcanic systems following sector collapse. J. Volcanol. Geotherm. Res. 2019, 384, 280–303. [Google Scholar] [CrossRef] [Scilit]
Figure 1. Location of Zao Volcano.
Minerals 16 00517 g001
Figure 2. (a) Distribution of the high-level terrace (red-colored part). The debris avalanche deposits are preserved within the high-level terrace. The present river course is shown (blue-colored line) as a reference in (a), as the reconstruction of the original avalanche pathway is uncertain. (b) An enlarged map of the square area in (a) showing observation points. The shaded relief map is by the Geospatial Information Authority of Japan.
Minerals 16 00517 g002
Figure 3. (a) A photograph of the outcrop of the block facies at Location 1C. (b) A photograph of the outcrop of the block facies at Location 2. (c,d) Photographs of the outcrop of the block facies at Location 13. (d) is an enlarged one of the right part of (c).
Minerals 16 00517 g003
Figure 4. (a,b) Outcrop photographs of the matrix facies at Location 4. The right and left sides of (a) represent a well-mixed and a heterogeneous part, respectively. (b) is an enlargement of the lower left part of (a). (c,d) Photographs of the outcrop of the matrix facies at Location 8. (c) is a well-mixed part, and (d) is a heterogeneous part. A jigsaw-like crack in a clast (central part) is observed in (c). (e) A photograph of the outcrop of the matrix facies at Location 10, including a small block showing a jigsaw-like crack (central part) in a well-mixed matrix. (f) A photograph of the outcrop of the matrix facies at Location 12, showing a heterogeneous matrix observed in a color difference. (g,h) Photographs of the outcrop of the matrix facies at Location 14. (h) is an enlargement of the lower middle part of (g), showing a heterogeneous matrix observed in a color difference. (bf,h) are representative close-up views highlighting diagnostic features of the deposits.
Minerals 16 00517 g004aMinerals 16 00517 g004b
Figure 5. (a) A photograph of a mudstone beneath a debris avalanche deposit at Location 11. (b) Close-up of the basal part of (a).
Minerals 16 00517 g005
Figure 6. Major element SiO2 variation diagrams of the clasts in the Togatta debris avalanche deposits. The rock data from Zao Volcano [24,25] and the Minami Zao Volcano [26] are also plotted. The boundary lines in the K2O vs. SiO2 and FeO*/MgO vs. SiO2 diagrams are from [27] and [28], respectively. TH, tholeiite; CA, calc-alkaline; BA, basaltic andesite; And, andesite; Dac, dacite; px, pyroxene; qtz, quartz; olv, olivine; FeO*, total iron calculated as FeO.
Minerals 16 00517 g006
Figure 7. Trace element SiO2 variation diagrams of the clasts in the Togatta debris avalanche deposits. TH, tholeiite; CA, calc-alkaline; BA, basaltic andesite; And, andesite; Dac, dacite; px, pyroxene; qtz, quartz; olv, olivine.
Minerals 16 00517 g007
Figure 8. Photomicrographs of the clasts in the Togatta debris avalanche deposits. (a) Calc-alkaline two-pyroxene andesite, (b) Calc-alkaline two-pyroxene dacite, (c) Calc-alkaline quartz-olivine-bearing two-pyroxene basaltic andesite, and (d) Tholeiitic two-pyroxene basaltic andesite. pl, plagioclase; olv, olivine; opx, orthopyroxene; cpx, clinopyroxene; opq, opaque mineral. The images were taken under plane-polarized light.
Minerals 16 00517 g008
Figure 9. Relationships between total fall height (Hmax) and runout distance (Lmax) for the Toggata debris avalanche deposit. Comparison data of the subaerial volcanic and subaerial non-volcanic landslides are plotted from [34]. Numbers indicate H/L values of the reference lines.
Minerals 16 00517 g009
Figure 10. Distribution of the hydrothermal alteration area in the Umanose caldera. The surrounding area of the crater lake Okama is composed of the eruption products younger than the edifice collapse. The distribution of hydrothermally altered zones is interpretive and is based on field observations (enclosed by a white solid line) and a previous study (enclosed by a white dashed line) [43].
Minerals 16 00517 g010
Table 1. Result of 14C age dating.
LocationSample
(Laboratory Code)
δ13C
(‰)
Conventional 14C Age
(BP ± 1σ)
Calibration Age
(Relative Probability, 1σ)
Calibration Age
(Relative Probability, 2σ)
11mudstone
(YU-22266)
−28.72 ± 0.2239,627 ± 24841,082–40,803 BCE
43,032–42,753 cal ka BP
41,281–40,657 BCE
43,231–42,607 cal ka BP
The sample was pretreated by HCl washing; see the text for details.
Table 2. Major and trace element chemical compositions of the clasts from the Togatta debris avalanche deposit.
(wt%)SiO2TiO2Al2O3FeO*MnOMgOCaONa2OK2OP2O5FeO*/MgO
Type: CA two px BA to Dac
20211125_1A-261.030.7916.197.910.143.086.532.941.270.122.56
20211125_1C-161.290.7715.778.080.123.296.182.901.450.142.45
20211125_1C-363.890.7315.847.070.122.724.902.971.680.092.60
20211125_3-360.860.8016.207.710.133.186.872.811.330.122.43
20211125_3-463.580.7015.626.930.122.665.563.061.670.112.61
20211125_3-760.260.7616.238.370.133.416.512.871.320.132.45
20211100_1C-162.090.7215.517.550.123.086.233.031.530.122.45
20221128_3-scoria58.260.7516.687.780.154.887.762.670.980.091.59
20221108_4WH-163.060.7215.636.730.112.796.113.111.620.122.41
20221128_8A-364.440.7315.866.890.112.624.592.921.720.112.63
20221128_8B-265.370.7516.166.530.122.573.852.751.810.112.54
20221111_9-161.870.8316.727.910.133.285.522.531.100.122.41
20221111_9-261.320.7916.538.030.133.335.972.651.120.122.41
20231203_11-L158.240.8916.798.070.164.017.772.871.070.142.01
20231203_11-L257.320.9316.878.570.163.978.022.911.090.162.16
20231203_11-L458.900.8616.858.230.143.307.772.860.990.102.49
20231203_11-U159.340.8516.578.230.143.776.932.851.180.142.19
20231203_11-U259.520.8516.498.010.143.757.012.921.180.142.13
20231203_11-U357.750.9418.478.340.154.306.092.591.160.191.94
20231203_11-U660.990.7816.137.650.143.556.462.851.330.112.16
20231123_14-163.310.7215.976.390.112.876.153.011.360.102.23
20231123_14-262.410.7616.726.440.103.006.222.831.410.102.14
20231123_14-760.950.7916.458.240.133.226.072.811.220.122.56
20231123_14-865.150.8316.667.530.102.373.312.331.600.123.17
20231203_12-356.370.9417.958.420.154.227.882.890.970.201.99
Type: CA qtz-olv b.g. two px BA
20221108_5-157.100.9718.048.220.153.857.552.881.030.212.13
20221108_10-357.540.8316.988.130.154.807.522.791.100.141.69
20231123_14-456.710.8917.348.400.154.238.182.901.010.201.98
Type: TH qtz-olv b.g. two px BA
20211125_1A-156.690.9017.109.010.153.838.132.931.060.202.35
20211125_3-156.050.9017.039.960.154.067.762.861.020.212.45
20211125_3-257.170.9017.198.850.153.707.832.911.100.202.39
Type: TH two px BA to And
20231203_11-U855.021.0919.699.420.174.636.812.500.540.142.03
20231203_12-155.170.9218.188.120.154.169.322.741.060.181.95
20231203_11-U458.470.9916.1210.040.143.317.352.890.490.193.03
(ppm)RbBaSrYZrNbCrNiVCuZn
Type: CA two px BA to Dac
20211125_1A-235.340024626.31134.226.212.616327.766.9
20211125_1C-140.541126430.91234.539.919.416921.666.1
20211125_1C-348.246421926.01375.354.113.617824.265.2
20211125_3-330.535925828.91175.150.011.418626.494.9
20211125_3-443.748024929.41375.333.113.316420.760.1
20211125_3-735.640328026.31154.631.919.914123.870.9
20211100_1C-141.740325828.61285.346.615.815121.065.2
20221128_3-scoria26.131626122.7973.942.647.714920.967.9
20221108_4WH-143.244625829.41295.199.012.217019.357.7
20221128_8A-346.648021930.41425.854.111.719821.965.5
20221128_8B-251.349920632.51495.730.411.913728.666.7
20221111_9-131.441323824.61225.425.112.713320.1100.2
20221111_9-231.138524925.21164.531.313.016122.296.4
20231203_11-L127.733128924.71025.373.516.718223.869.6
20231203_11-L227.534532026.21014.261.615.918334.371.9
20231203_11-L425.331426226.1943.649.78.118812.166.1
20231203_11-U131.135726924.41024.633.318.316328.872.0
20231203_11-U230.735026725.31014.845.915.019332.368.3
20231203_11-U323.145032830.61145.349.926.018323.276.5
20231203_11-U630.838123726.41154.747.213.118227.469.6
20231123_14-135.235922842.71164.464.19.622917.897.8
20231123_14-236.636824539.41184.662.318.212233.455.2
20231123_14-728.038024032.51114.829.417.816323.385.0
20231123_14-851.574826926.21585.561.211.518541.451.3
20231203_12-325.937737630.11195.175.823.021326.176.1
Type: CA qtz-olv b.g. two px BA
20221108_5-118.244637126.11166.237.623.314119.775.4
20221108_10-327.537531325.81084.034.934.916523.869.4
20231123_14-423.632836726.51045.147.324.819731.873.3
Type: TH qtz-olv b.g. two px BA
20211125_1A-126.634236925.21085.350.817.419124.469.7
20211125_3-125.636437029.21075.333.526.512517.269.7
20211125_3-229.135736824.51114.548.022.818637.669.5
Type: TH two px BA to And
20231203_11-U812.347031427.31255.435.522.422915.389.2
20231203_12-132.034238333.7943.629.411.716340.971.1
20231203_11-U48.621424432.5824.645.63.618127.394.4
CA, calc-alkaline; TH, tholeiite; BA, basaltic andesite; And, andesite; Dac, dacite; px, pyroxene; qtz, quartz; olv, olivine; b.g., bearing; FeO*, total iron calculated as FeO. All oxide values are normalized to 100%.
Disclaimer/Publisher’s Note: The statements, opinions and data contained in all publications are solely those of the individual author(s) and contributor(s) and not of MDPI and/or the editor(s). MDPI and/or the editor(s) disclaim responsibility for any injury to people or property resulting from any ideas, methods, instructions or products referred to in the content.