Article

Geochronology, Geochemistry, and Petrogenesis of Nepheline Syenites from Granite Mountain, Arkansas Alkaline Province, USA


Department of Geosciences, Auburn University, Auburn, AL 36849, USA
*
Author to whom correspondence should be addressed.
Minerals 2026, 16(6), 587; https://doi.org/10.3390/min16060587
Submission received: 5 April 2026 / Revised: 12 May 2026 / Accepted: 28 May 2026 / Published: 1 June 2026

Abstract

The Arkansas Alkaline Province (AAP) is made up of intrusive bodies throughout central Arkansas, one of which is a nepheline syenite body called Granite Mountain. The crystallization age and origin of nepheline syenites from Granite Mountain are still uncertain, in part due to the rarity of zircon grains in silica-undersaturated rocks, such as nepheline syenite. This study reports new zircon U-Pb ages and trace element contents from three nepheline syenite samples from Granite Mountain. The zircon U-Pb ages of these samples are 90.4 ± 0.6 Ma, reflecting the crystallization age for nepheline syenite from Granite Mountain. Zircon rare-earth element patterns display remarkable positive Eu anomalies, indicative of their mantle affinity. Whole-rock geochemical characteristics include depleted Nd–Hf isotopic compositions, high 206Pb/204Pb ratios (19.5), and positive Nb-Ta anomalies. Their Sr-Nd-Pb-Hf isotopic compositions and trace element ratios display characteristics of ocean island basalts (OIBs). The probable magmatic source of these samples is a mixture of enriched mantle 2 (EM2) and high 238U/204Pb (HIMU). Taken together, the geochemical data, in particular, the HIMU signature, suggest that the Granite Mountain nepheline syenites formed within a mantle plume (likely Bermuda) tectonic setting at 90.4 Ma, although a rifting origin cannot be ruled out.

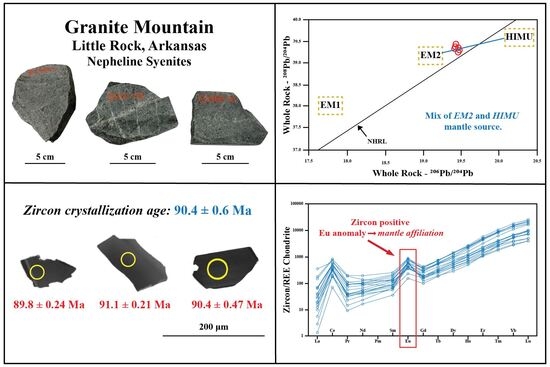
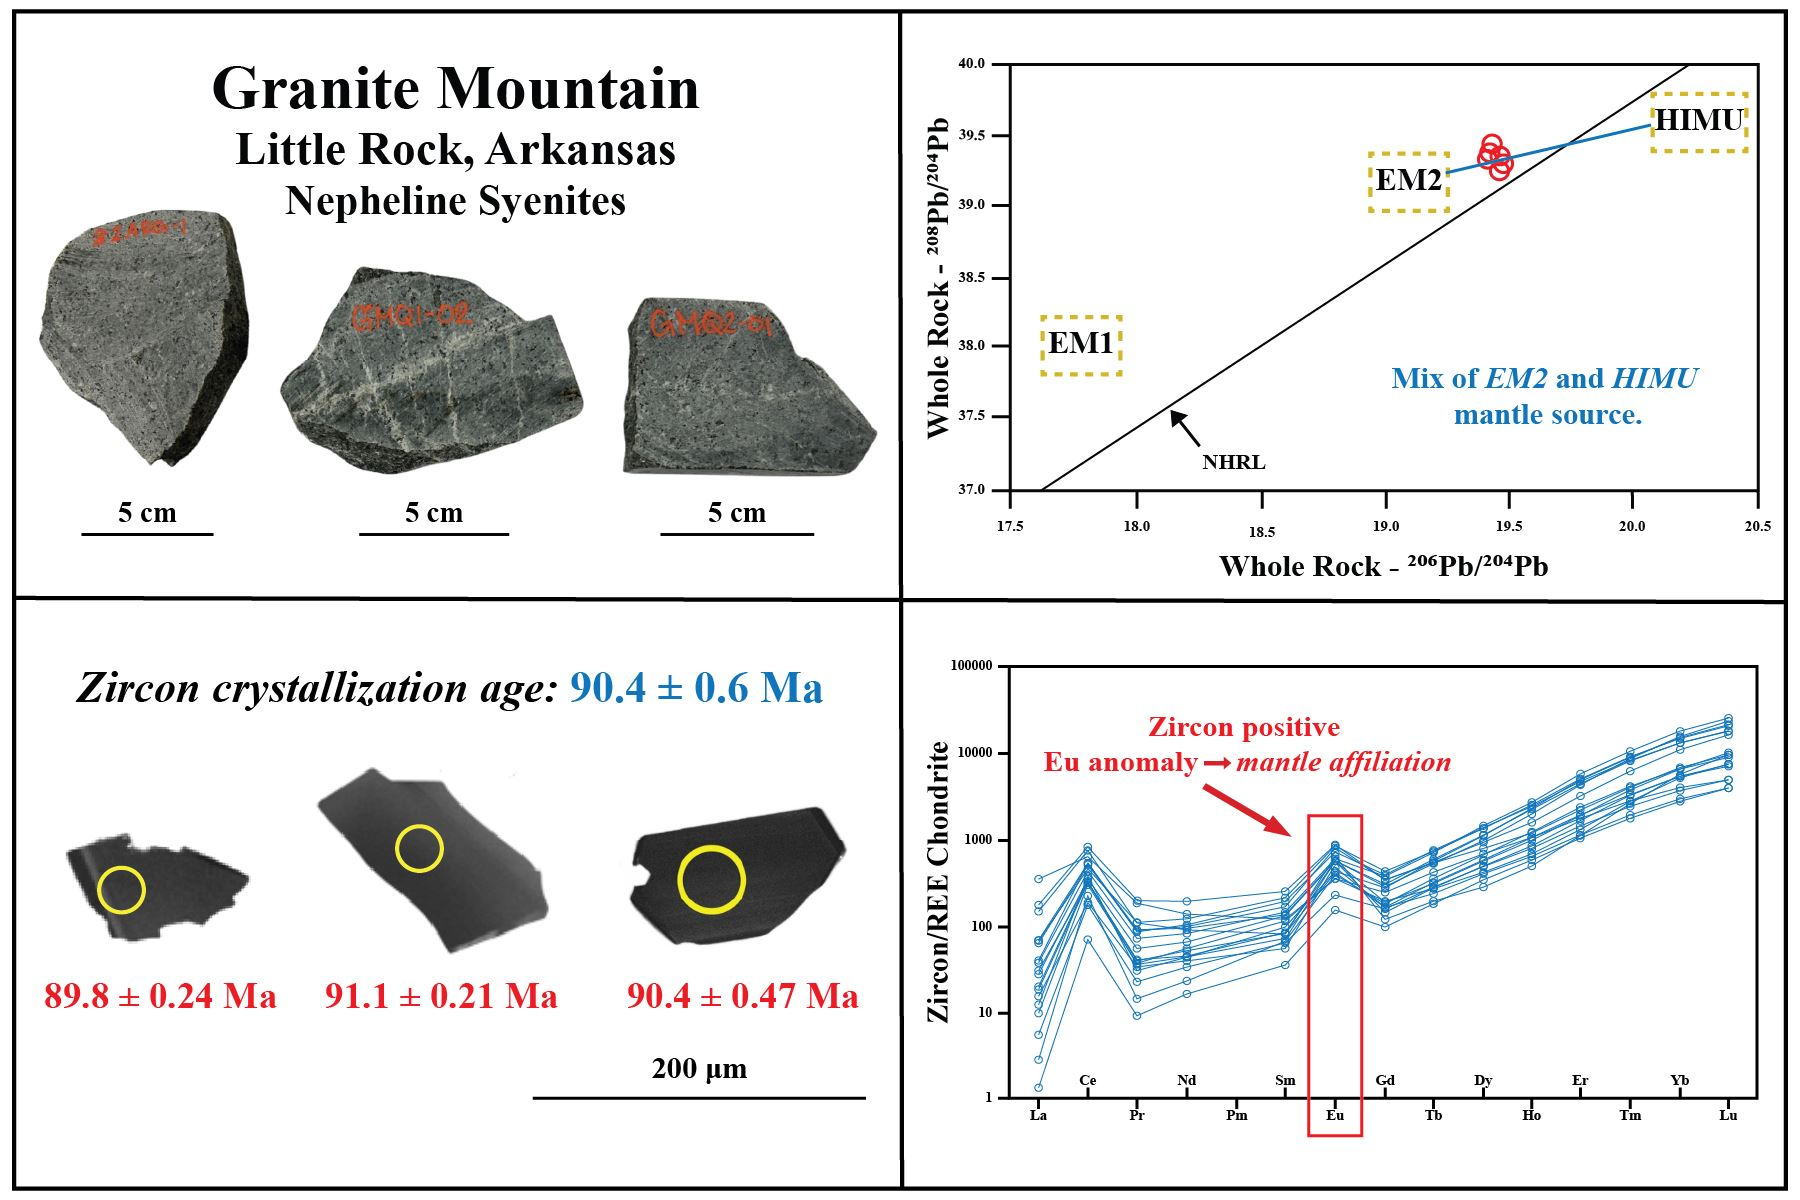
Graphical Abstract

1. Introduction

The Arkansas Alkaline Province (AAP) is composed of seven intrusive complexes throughout central Arkansas along the NE-SW trend of the Mississippi Valley graben from Murfreesboro, Arkansas, to outside of Little Rock, Arkansas, USA [1,2]. Lithologies throughout the AAP include lamproite, carbonatites, ijolites, jacupirangites, phonolites, and nepheline syenite [3]. The ultra-mafic intrusions are distributed in the southwestern portion of the AAP, and the felsic and evolved lithologies are found in the northeastern portion near Little Rock, Arkansas [4]. The proposed origins of these AAP rocks range from mantle plume and regional extension to slab edge-driven convections [3,4,5,6]. Subsurface Cretaceous alkaline rocks in drill holes are widespread in the northern Gulf of Mexico basin. The surface-exposed AAP rocks provide information on the formation of the northern Gulf of Mexico basin.
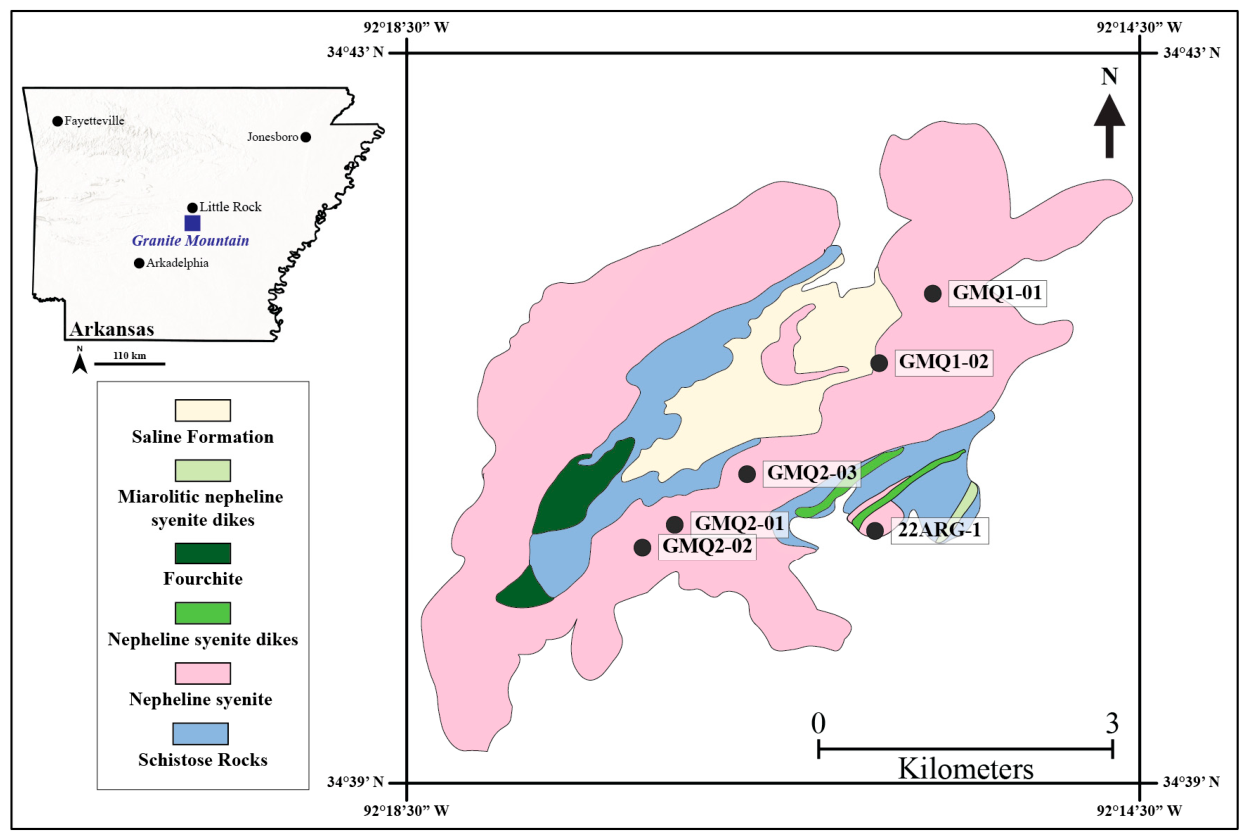
Granite Mountain consists primarily of nepheline syenite (Figure 1). Granite Mountain syenite is the major intrusive body in AAP. Previous studies have gathered whole-rock geochemical and isotopic data on several syenites from Granite Mountain throughout the years [1,5,7]. These nepheline syenites have been dated using K-Ar, Rb-Sr, and Ar-Ar of biotite [8,9] as well as fission track ages of apatite and titanite [3,10], with typical age uncertainty of 5 to 6 Ma [10]. Available ages (e.g., Ar-Ar ages and fission track ages) are cooling ages of plutonic rocks, and crystallization ages are lacking for the Granite Mountain. High-precision crystallization ages are more useful for constructing plate motion models [6,11]. In addition, additional comprehensive geochemical and Sr-Nd-Pb-Hf isotope studies of fresh nepheline syenites are needed to better understand the petrogenesis of nepheline syenites from Granite Mountain.
This study aimed to provide new crystallization ages for and trace element and isotopic characteristics of the nepheline syenites from Granite Mountain. By finding rare zircons in these samples and performing age dating using LA-ICP-MS on the zircons, this study was able to provide a more robust and precise crystallization age. Zircon trace element content and whole-rock major and trace element analysis, as well as Sr-Nd-Pb-Hf isotopes, were used to investigate the origin of these syenites. New Sr-Nd-Pb-Hf isotope data, coupled with zircon trace element contents, provide new clues and insights into the formation of these nepheline syenites. Understanding the origin of these nepheline syenites from Granite Mountain could provide insight into the tectonic evolution of the AAP.

2. Materials and Methods

2.1. Samples

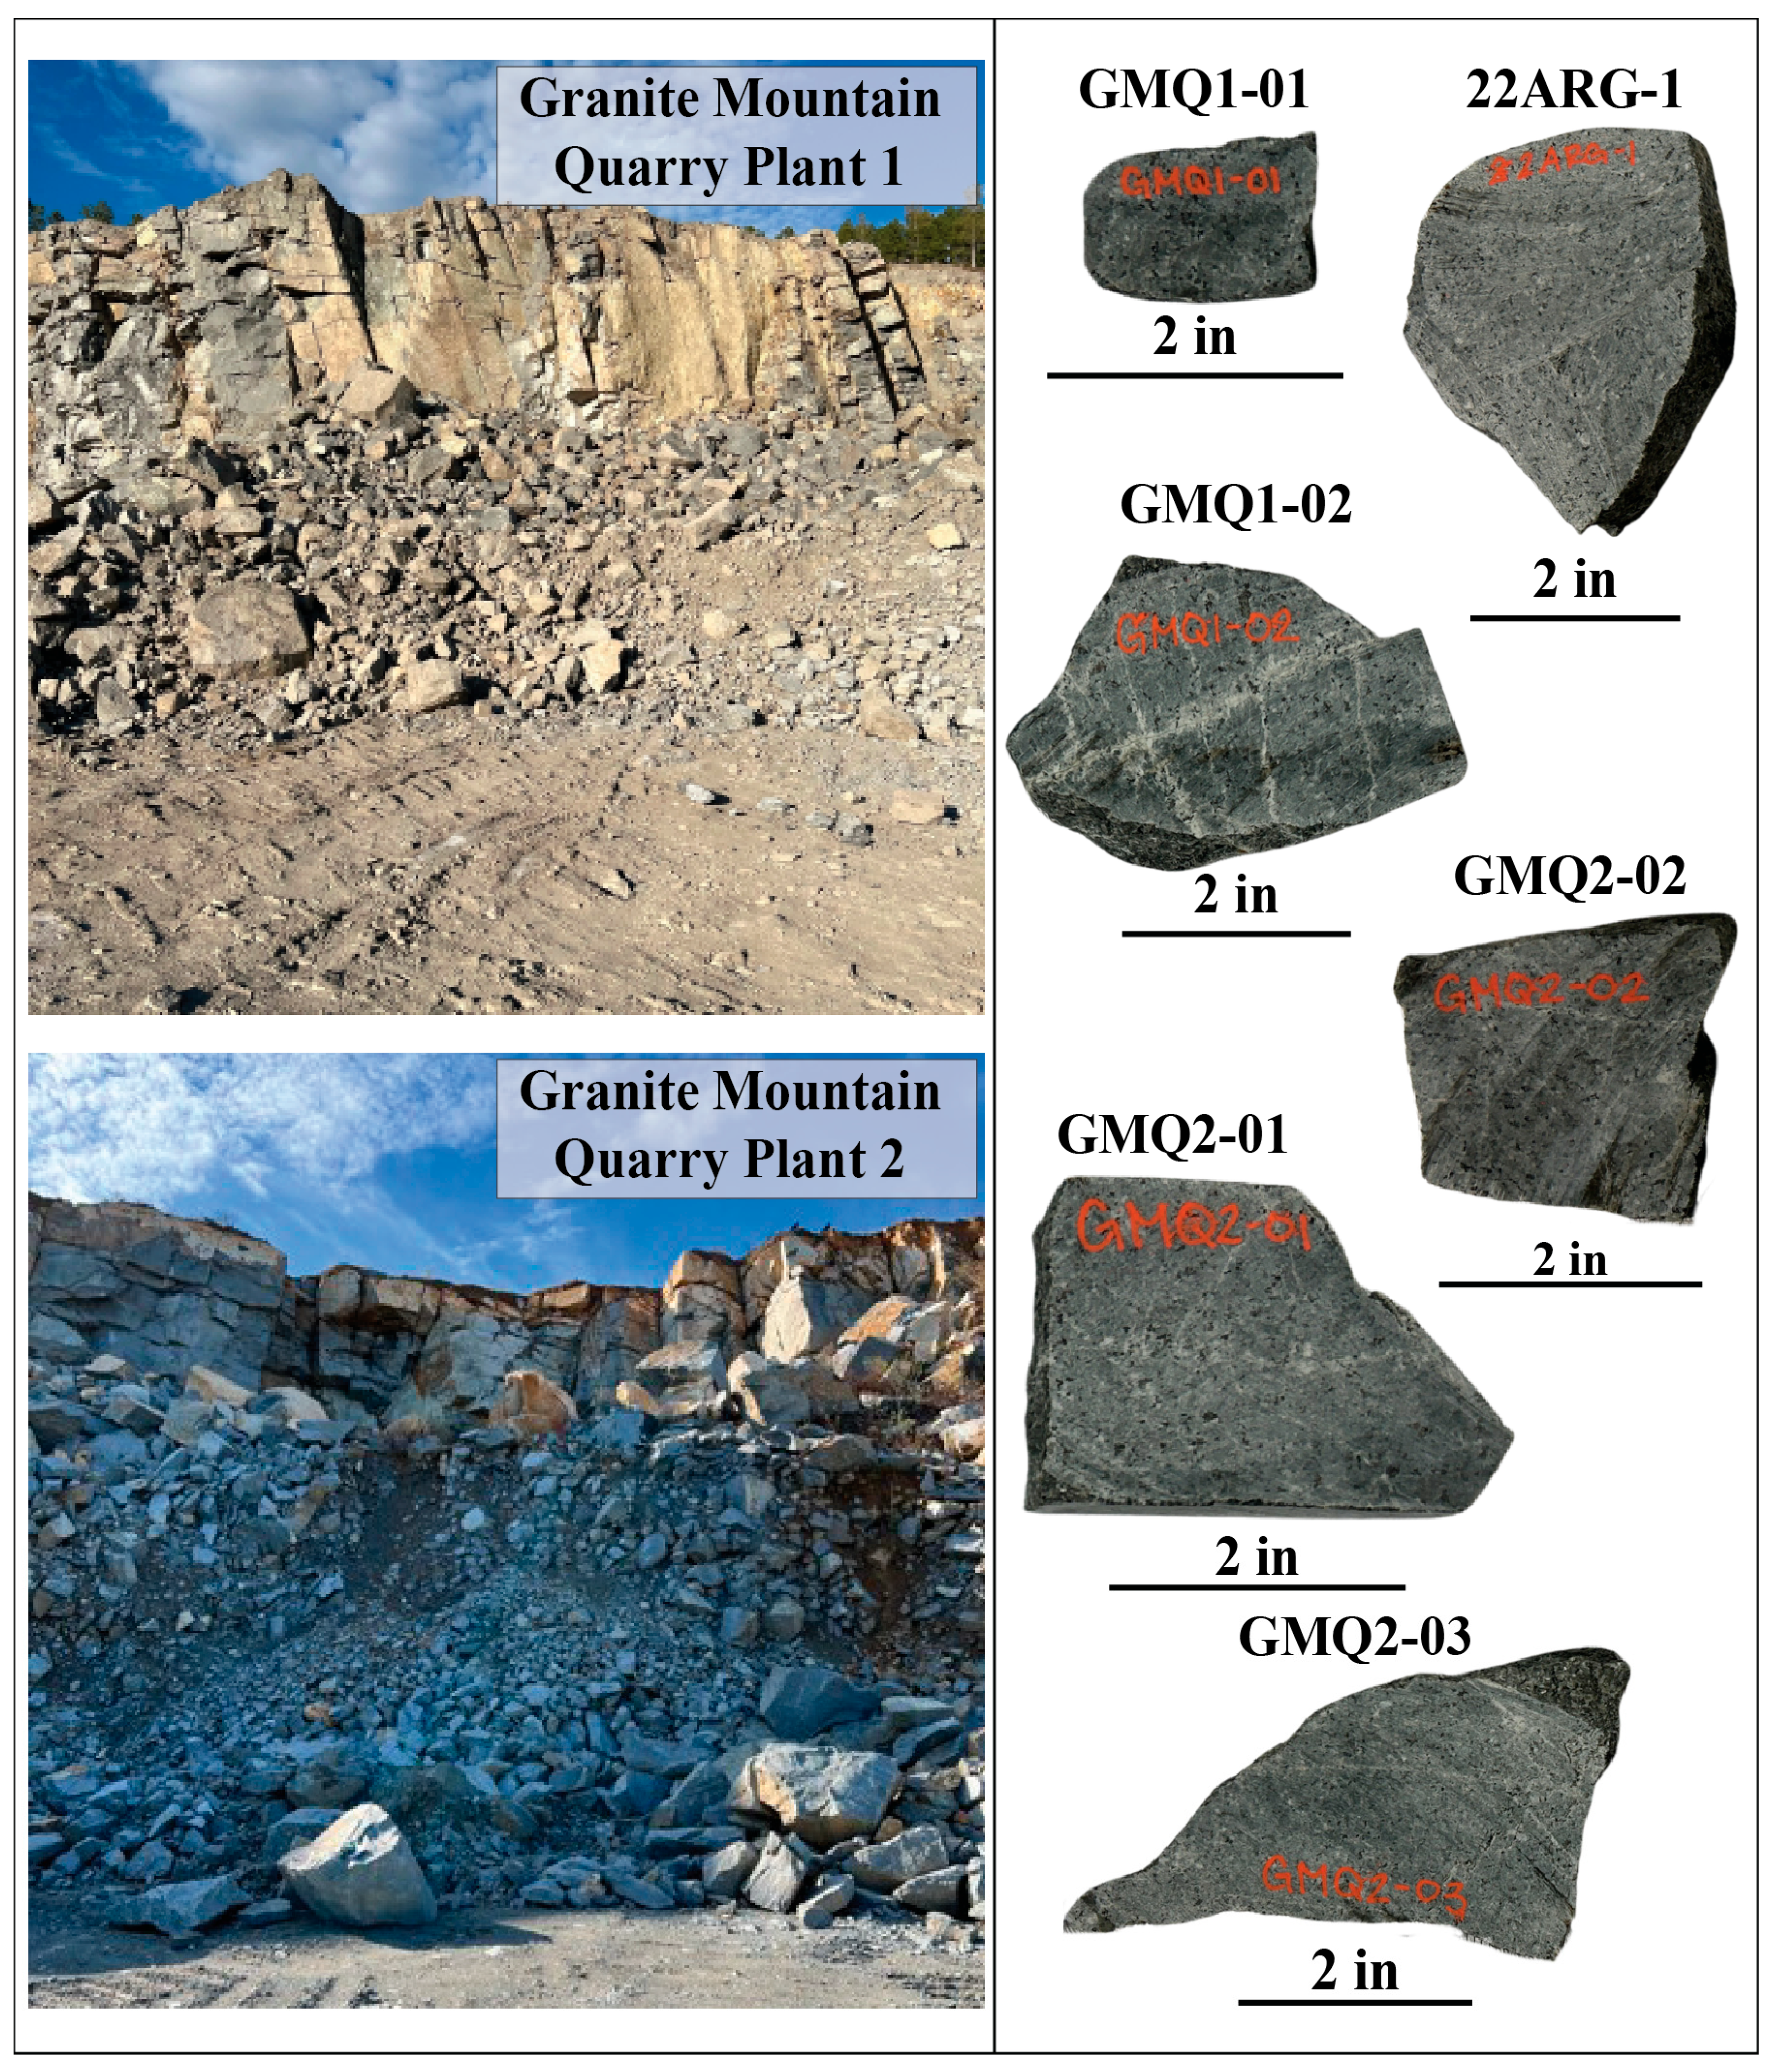
Six samples were collected from Granite Mountain (Figure 2). Two samples (GMQ1-01, -02) were collected from Quarry Plant 1, three samples (GMQ2-01, -02, -03) were collected from Quarry Plant 2, and one sample (22ARG-1) was collected outside of these quarries. All samples were fresh (Figure 3). This study produced geochemical data (whole-rock major oxides, trace elements, and Sr-Nd-Hf-Pb isotopes) and zircon U-Pb geochronology and zircon trace element contents. All the samples were analyzed for geochemical data. One sample (GMQ1-01) from Quarry Plant 1, one sample (GMQ2-02) from Quarry Plant 2, and the one outside sample (22ARG-1) were selected for zircon dating and zircon trace element contents.
The nepheline syenites of Granite Mountain are medium-grained, holocrystalline, phaneritic intrusive igneous rocks characterized by a hypidiomorphic granular fabric. The primary mineral assemblage consists of nepheline, alkali feldspar, biotite, and some amphiboles. Accessory minerals include pyroxenes, titanite, apatite, and opaque minerals. Representative photomicrographs are provided in Supplemental Materials (Figure S1).

2.2. U-Pb Zircon Geochronology and Trace Element Contents

Zircon grains from 22ARG-1, GMQ1-01 and GMQ2-02 were separated using conventional magnetic and heavy-liquid density techniques to concentrate the non-magnetic, heavy fractions and subsequently hand-picked under a binocular microscope. Cathodoluminescence (CL) imaging of zircon grains was carried out using a scanning electron microscope (JSM-IT300HR, JOEL, Tokyo, Japan). Zircon standard 91500 (or Tanz) and glass NIST610 were used as external standards for U-Pb dating and trace element calibration, respectively [13]. Detailed operating conditions for the LA-ICP-MS instrument and data reduction have been documented in the literature [14]. The measured U-Pb ages of zircon standards GJ-1, Plesovice and Tanz (or 91500) are identical to their reported ages. Data deductions were conducted by Excel-based software ICPMSDataCal (version 10.8) [15,16] and Isoplot/Ex (version 3.75) [17].

2.3. Sr-Pb-Nd-Hf Isotope Methods

Cut samples were cleaned using 400-grit sandpaper before going into a sonic cleaner to avoid contamination from the wet saw. The samples were then crushed using a ceramic mortar and pestle, and then an agate mortar and pestle was used to pulverize the samples into a fine flour-like powder approximately 75 microns (200 mesh) thick. Sample contamination in the mortar and pestles was avoided by thoroughly rinsing with ultra-pure water and pre-contaminating them by crushing a small amount of sample and discarding it. This powder was used for Sr-Nd-Hf-Pb and whole-rock major, trace, and rare-earth element (REE) analysis.
Sr isotope analysis at Auburn University involved using the procedure for silicates documented in [18,19]. The method for Pb isotope analysis at Auburn University used the method described in [20]. The sample powders for all six samples were digested in Teflon beakers with a mixture of hot ultrapure concentrated nitric and hydrofluoric acid for a few days and then dried down. Once dried, 2M nitric acid was used to redissolve the samples to be loaded onto ion exchange columns filled with 200 µL of Eichrom’s Sr-spec resin for strontium column chromatography. High-molarity nitric acid was used to trap the Sr in the columns, allowing the other elements to pass through, and low-molarity nitric acid (0.05M) was used to release the Sr. The MAT 262 thermal ionization mass spectrometer (TIMS) (Finnigan, Bremen, Germany) at the Isotope Geoscience Laboratory (ISOLAB) at Auburn University was used to analyze Sr and Pb isotope ratios. Sr samples were loaded onto single tungsten filaments, and Pb samples were loaded onto single rhenium filaments. For Sr isotope analysis, Faraday cup detector bias was canceled out by using dynamic double collector mode.
Approximately 2–5 g of 75-micron powder from each of the six samples was sent to Wuhan Sample Solution Analytical Technology for Nd and Hf analysis on a Neptune Plus multi-collector inductively coupled plasma mass spectrometer (MC-ICP-MS) (Thermo Fisher Scientific, Dreieich, Germany). For both Nd and Hf analysis, the chromatography columns were filled with LN resin. Nd was isolated in the columns by using 0.18M hydrochloric acid and was extracted using 0.3M hydrochloric acid. Hf was isolated using different molarities of hydrochloric acid (3M and 6M) as well as a 4M mixture of hydrochloric acid and hydrogen peroxide before being extracted using 2M hydrofluoric acid. The MC-ICP-MS was equipped with nine Faraday cup receivers for Nd analysis and eight for Hf.

2.4. Whole-Rock Major and Trace Element Abundances

Some of the 75-micron powder for each sample was sent to ALS Geochemistry for whole-rock rare-earth, major, and trace element analysis using the ME-MS81d™ method, which uses lithium borate fusion and nitric acid digestion to prepare the samples for analysis. ALS Geochemistry used an inductively coupled plasma atomic emission spectrometer (ICP-AES) to measure the major oxide data for each sample, and an inductively coupled plasma mass spectrometer (ICP-MS) was used to measure the rare earth and trace element data. The sample preparation method used by ALS Geochemistry is unsuitable for Pb analysis as it requires the sample to be heated to 1000 °C and Pb is volatile by nature [21]. Therefore, additional sample powder was sent to Wuhan Sample Solution Analytical Technology for trace element analysis using a different preparation method. The lab digested samples using a mixture of nitric and hydrofluoric acid that was heated to approximately 190 °C before analysis in an Agilent 7700e ICP-MS (Agilent, Santa Clara, CA, USA).

3. Result

3.1. Zircon U-Pb Ages and Trace Element Contents

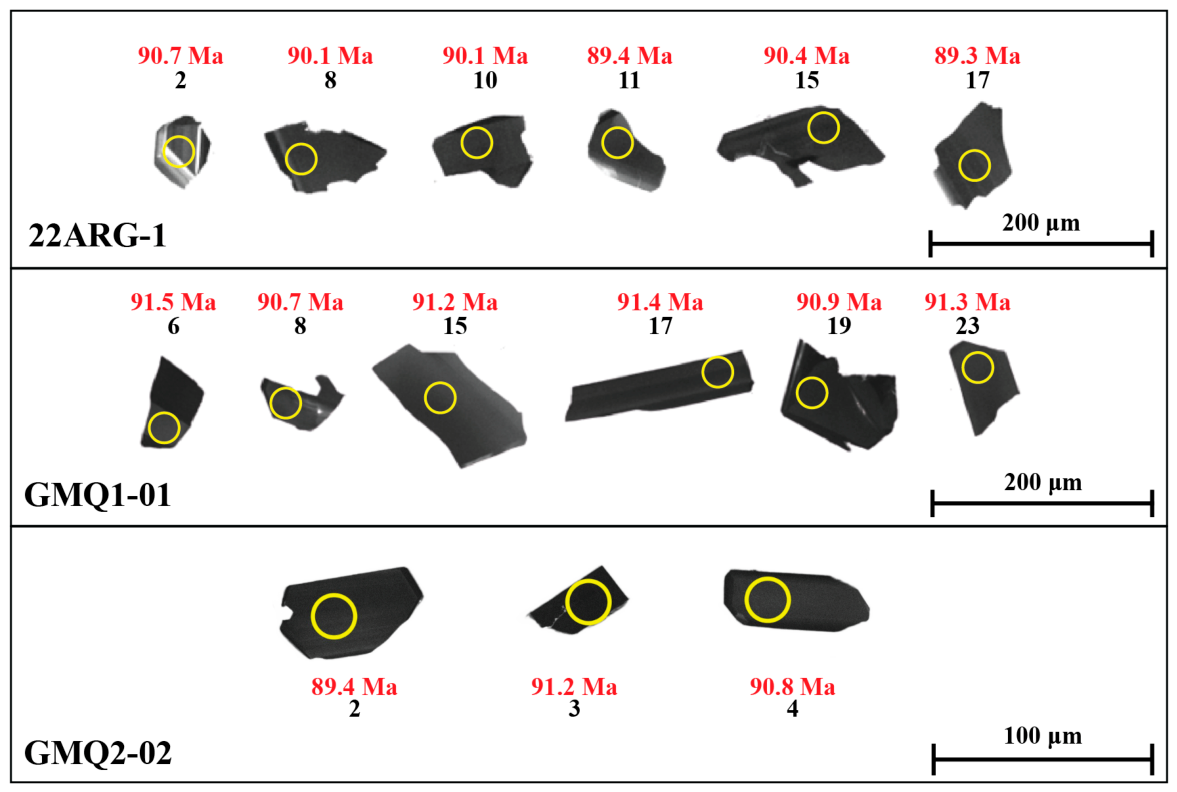
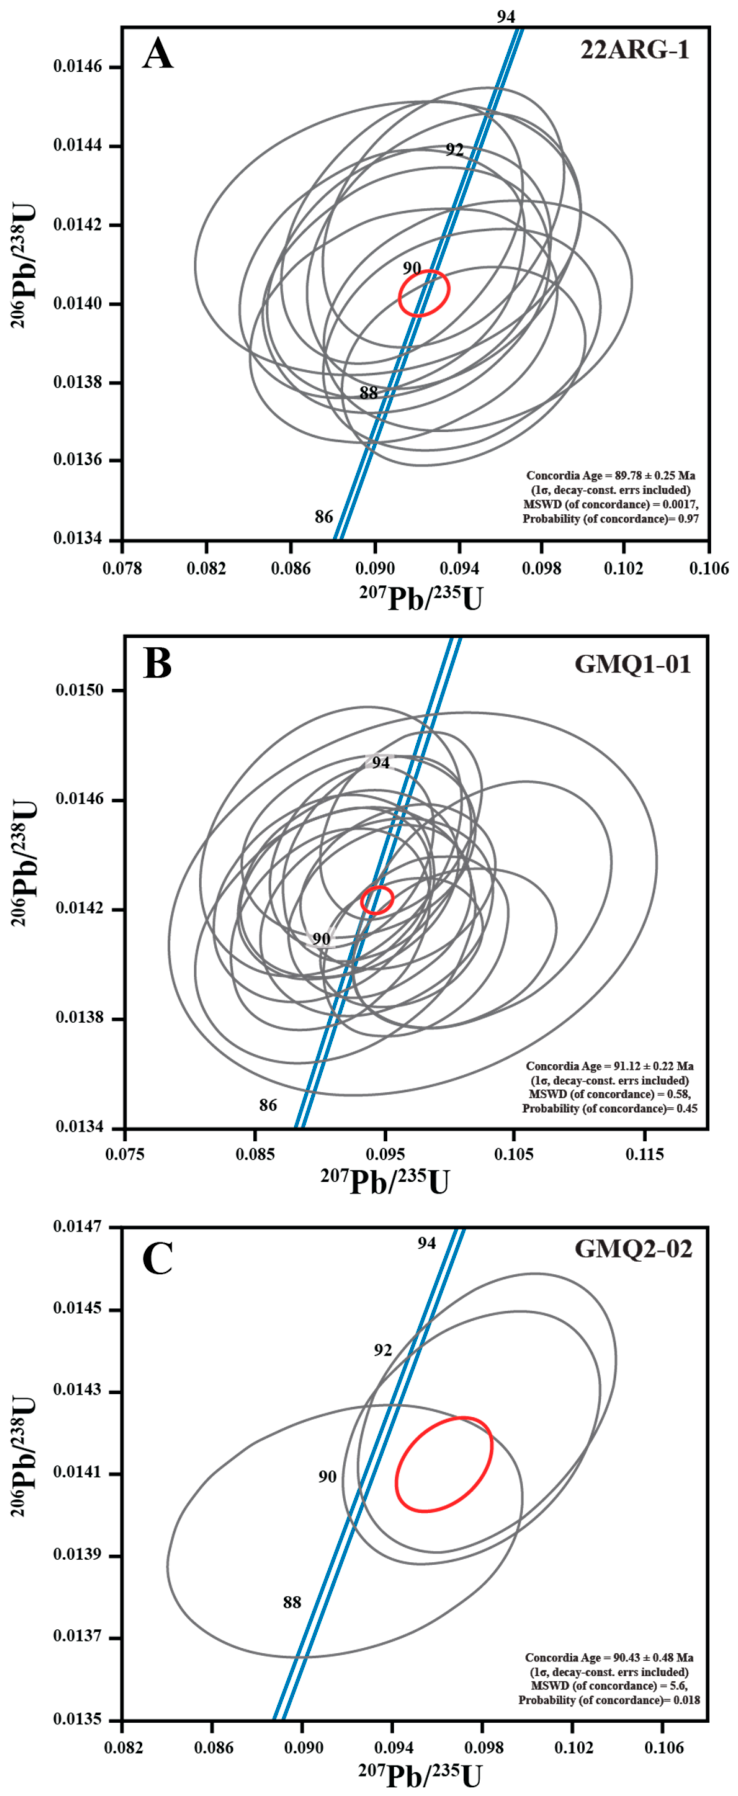
Selected zircon CL images for 22ARG-1, GMQ1-01 and GMQ2-02 are provided in Figure 4. Only concordant zircons with concordance better than 90% are selected [22]. Of the 20 zircons analyzed for 22ARG-1, 11 crystals yield a viable Concordia age of 89.78 ± 0.25 (Ma) (Figure 5A). Of the 25 zircons analyzed from GMQ1-01, 18 crystals yield a Concordia age of 91.12 ± 0.22 Ma (Figure 5B). Only four zircon grains were found in GMQ2-02. Of these four zircons, three of the crystals provided viable results and yield a Concordia age of 90.43 ± 0.48 Ma (Figure 5C), and the other zircon (GMQ2-02-1) has high common Pb content (9.68 ppm) and its age is not reliable. Thus, the zircon U-Pb ages for all three samples range from 90 to 91 Ma. Using quadratic error propagation [23,24], the average age for the three samples is 90.44 ± 0.58 Ma (or 90.4 ± 0.6 Ma).
Concordant zircon U/Pb ages are used as the criteria to distinguish phenocrysts and xenocrysts. The Mesozoic (89–91 Ma) concordant zircons are considered as phenocrysts. The Paleozoic, Proterozoic, and Archean concordant zircons (332–2625 Ma) are regarded as zircon xenocrysts. Concordant zircon xenocrysts (332 Ma, 384 Ma, 1799 Ma, 1851 Ma, 1854 Ma, 2452 Ma, 2625 Ma) occur in 22ARG-1. Concordant zircon xenocrysts do not occur in GMQ1-01 or GMQ2-02. These zircon xenocryst ages in 22ARG-1 are similar to those of detrital zircons from lower Cretaceous and upper Jurassic sandstones in Arkansas [25]. It is likely that sample 22ARG-1 was contaminated by country rock sandstones whereas GMQ1-01 and GMQ2-02 were not. We will show that 22ARG-1 has the same Sr-Nd-Pb-Hf isotopic compositions to GMQ1-01 and GMQ2-02 and thus the contamination of 22ARG-1 is minor.
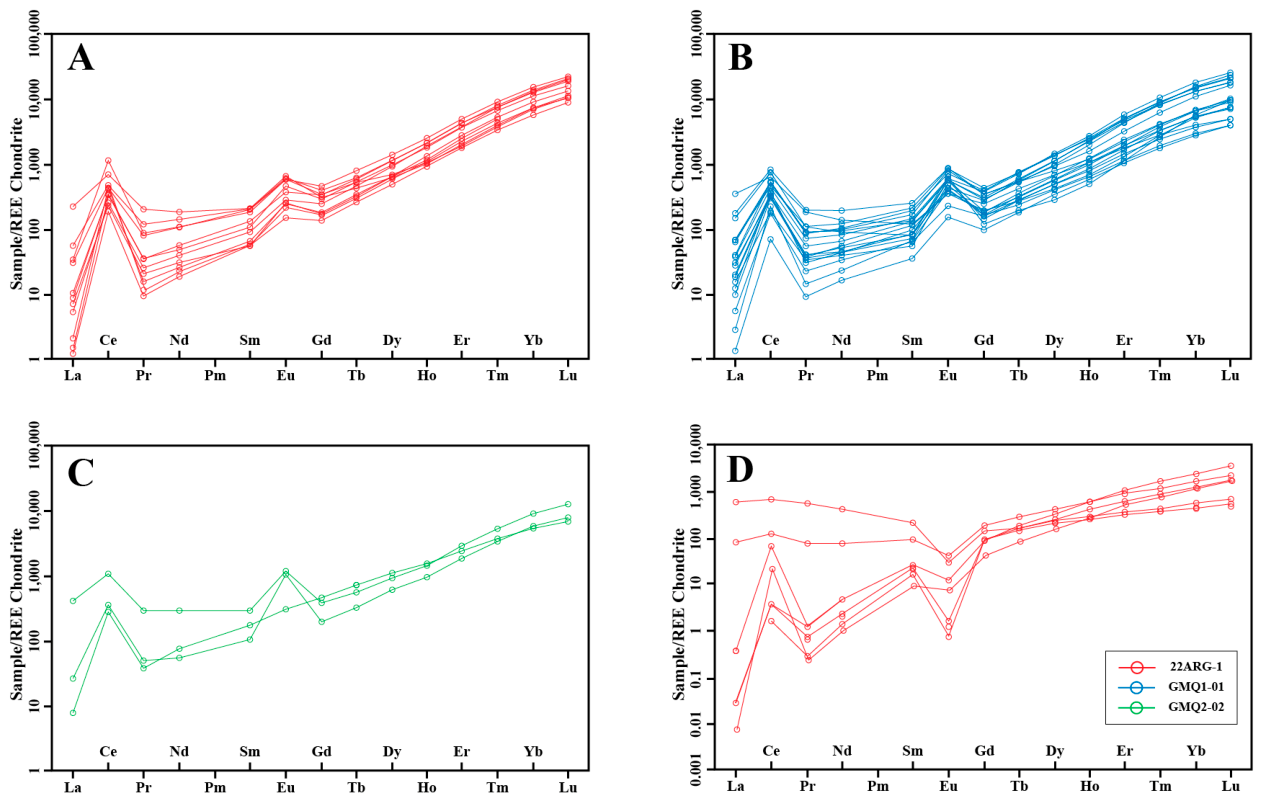
Chondrite-normalized rare-earth element patterns show that these 90.4-Ma zircon phenocrysts in all three samples display positive Ce and Eu anomalies (Figure 6A–C). By comparison, rare-earth element patterns for all concordant zircon xenocrysts show negative Eu anomalies (Figure 6D). Notably, all zircon phenocrysts lack negative Eu anomalies.
Figure 5. (A) Concordia diagram [26] for sample 22ARG-1; (B) Concordia diagram for sample GMQ1-01; (C) Concordia diagram for sample GMQ2-02. Blue lines: Concordia curve; Red ellipses: Concordant ages; Gray ellipses: individual analyses.
Minerals 16 00587 g005

3.2. Whole-Rock Major and Trace Element Data

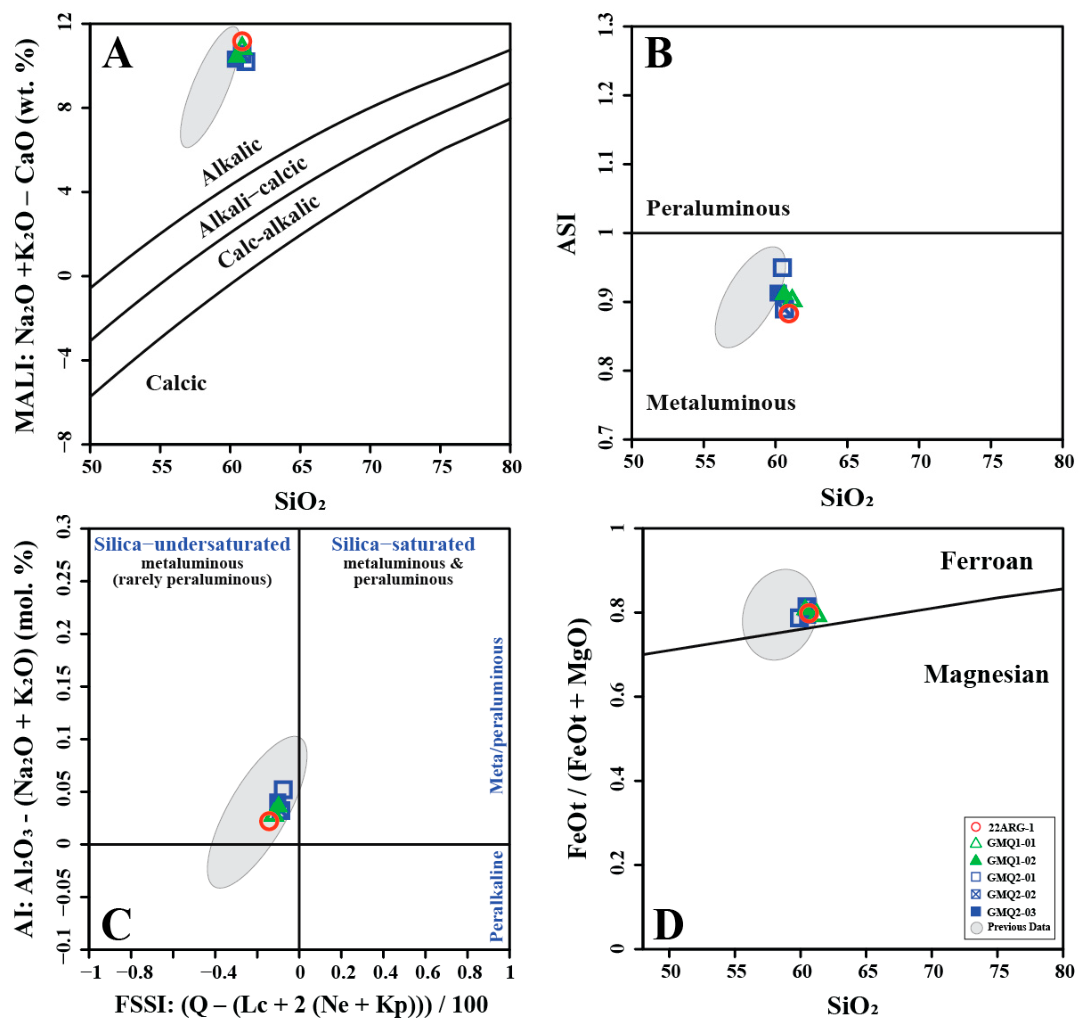
Table 1 shows the whole-rock major and trace element data for all six samples. The samples were plotted on magma classification diagrams based on Frost and Frost [28] (Figure 7) and show that the samples are classified as being ferroan, alkalic, metaluminous, and silica-undersaturated. Their low MgO content indicates a derivative magma.
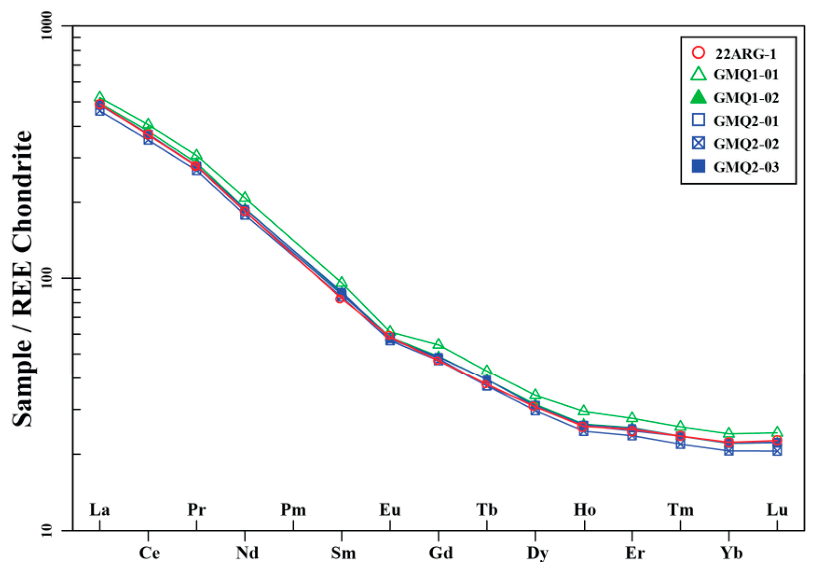
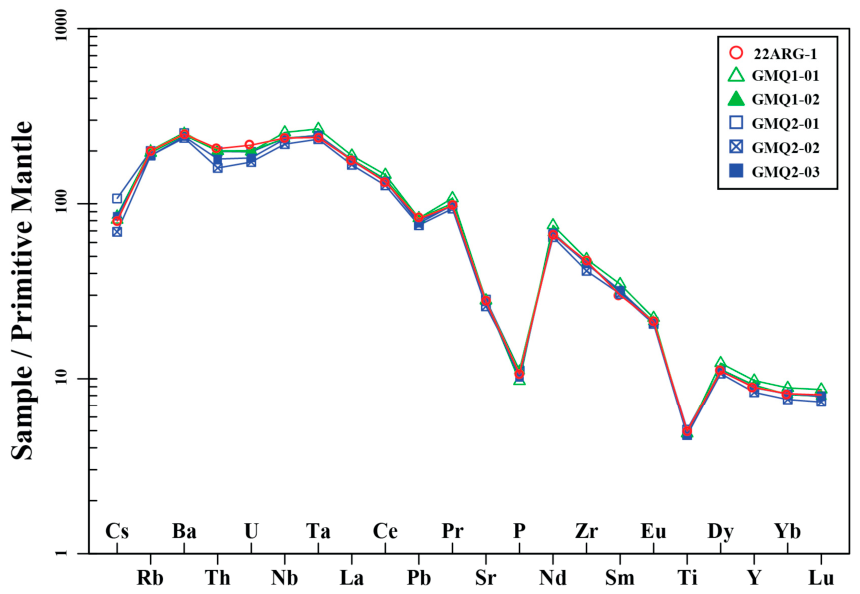
Whole-rock trace element data revealed that these samples are enriched in light rare-earth elements (LREEs) relative to heavy rare-earth elements (HREEs). Chondrite-normalized REE patterns (Figure 8) do not display any significant anomalies in Eu or Ce. Primitive mantle-normalized multi-element diagrams (Figure 9) display positive Nb and Ta anomalies and negative P and Ti anomalies. Negative P, Sr, and Ti anomalies in alkaline rocks indicate fractionations of apatite and Fe–Ti oxides, consistent with the reported mineral assemblage of apatite (rich in P and Sr) and titanite (rich in Ti) in these rocks. Their Nb/Ta ratio varies from 17.1 to 17.9, Zr/Hf ratio ranges from 46.1 to 48.5, and Th/U ratio varies from 3.56 to 3.70 (Table 1). These restricted Nb/Ta, Zr/Hf, and Th/U ratios are similar to the values for mantle-derived melts, such as ocean island basalts [29]. Their Nb/Ta ratio of 17.1–17.9 is similar to the Nb/Ta ratio of basanites to phonolites from Mount Erebus, Antarctica (17.2 ± 0.5) [30,31], and the Tubuai HIMU basalts (16.6 ± 0.5) but is higher than the ratio for continental crust (~12–13) and the bulk silicate earth (~14) [29].

3.3. Whole-Rock Sr-Nd-Pb-Hf Isotopes

Whole-rock measured Sr-Nd-Pb-Hf isotope ratios and their initial isotope ratios for all six nepheline syenite samples are listed in Table 1 and presented in Figure 10. The measured 87Sr/86Sr ratio ranged from 0.704969 to 0.705246. The calculated initial 87Sr/86Sr ratio ranged from 0.704289 to 0.704551. Whole-rock 206Pb/204Pb, 207Pb/204Pb, and 208Pb/204Pb ratios for all six nepheline syenite samples are listed in Table 1. 206Pb/204Pb ratios range between 19.469 and 19.503, 207Pb/204Pb ratios between 15.577 and 15.627, and 208Pb/204Pb ratios between 39.371 and 39.486. The measured Nd, Hf, ɛNd, and ɛHf ratios are also provided in Table 1. The nepheline syenite samples demonstrate a range of values from the analysis of Nd and Hf isotopic compositions, including 143Nd/144Nd between 0.512711 and 0.512719 and 176Hf/177Hf between 0.282823 and 0.282837. The samples yielded positive epsilon values for Nd with present-day ɛNd ranging between 1.4 and 1.6 and initial ɛNd(t) 2.7–2.8. The same was true for Hf with present-day ɛHf between 1.8 and 2.3 and initial ɛHf(t) 3.5–4.0. Our new Sr-Nd-Pb-Hf isotope data for Granite Mountain are consistent with the isotope data for the nepheline syenite sample (GM3) from a different locality of the Granite Mountain in reference [5]. Another nepheline syenite sample (GM2) in the literature has a high present-day 87Sr/86Sr ratio (0.71294) but a similar initial 87Sr/86Sr ratio and may be contaminated by upper crustal materials [5].

4. Discussion

4.1. Comparison of Zircon U-Pb Ages with Previous Ages

U/Pb dating of zircon is recognized as one of the most precise methods of age dating. This method allows for the measurement of two geochronometers, 238U/206Pb and 235U/207Pb, serving as an internal check for more confidence in the results [38]. Although zircon is ubiquitous in most felsic rocks, zircon crystals were not expected to be common in nepheline syenites as they are silica-undersaturated; however, the high zirconium contents (~500 ppm) of the nepheline syenites from Granite Mountain suggested the potential presence of zircon.
Previous radiometric age dating performed on the nepheline syenites from Granite Mountain yields cooling ages between 88 and 89 Ma. The zircons that were found in three of these samples of this study revealed ages of 89.78 ± 0.25 Ma for 22ARG-1; 91.12 ± 0.22 Ma for GMQ1-01; and 90.43 ± 0.48 Ma for GMQ2-02. These average zircon U-Pb ages (90.4 ± 0.6 Ma) are considered as the crystallization ages for the nepheline syenites. The mean cooling age is 89.5 ± 2 Ma for Granite Mountain nepheline syenite [1]. Although within uncertainty, the mean crystallization age is slightly older than the mean cooling age. The average crystallization age (90.4 ± 0.6 Ma) and the mean cooling age (89.5 ± 2 Ma) yield a cooling duration of 0.9 ± 2.1 Ma for the Granite Mountain syenites. This cooling duration (0.9 ± 2.1 Ma) has a large uncertainty and is derived from our new U/Pb age and the previous cooling age from different samples. Future 40Ar/39Ar cooling ages from our 3 U/Pb zircon samples (22ARG-1, GMQ1-01, and GMQ2-02) will yield more precise and accurate cooling duration.

4.2. Origin of Nepheline Syenites from Granite Mountain

The generation of syenite magmas may be derived from an enriched mantle [39], mixing of crustal and mantle-derived magmas [40], partial melting of crustal materials in a closed system [41], and high-pressure fractional crystallization of a basaltic magma produced in a subduction zone [42].
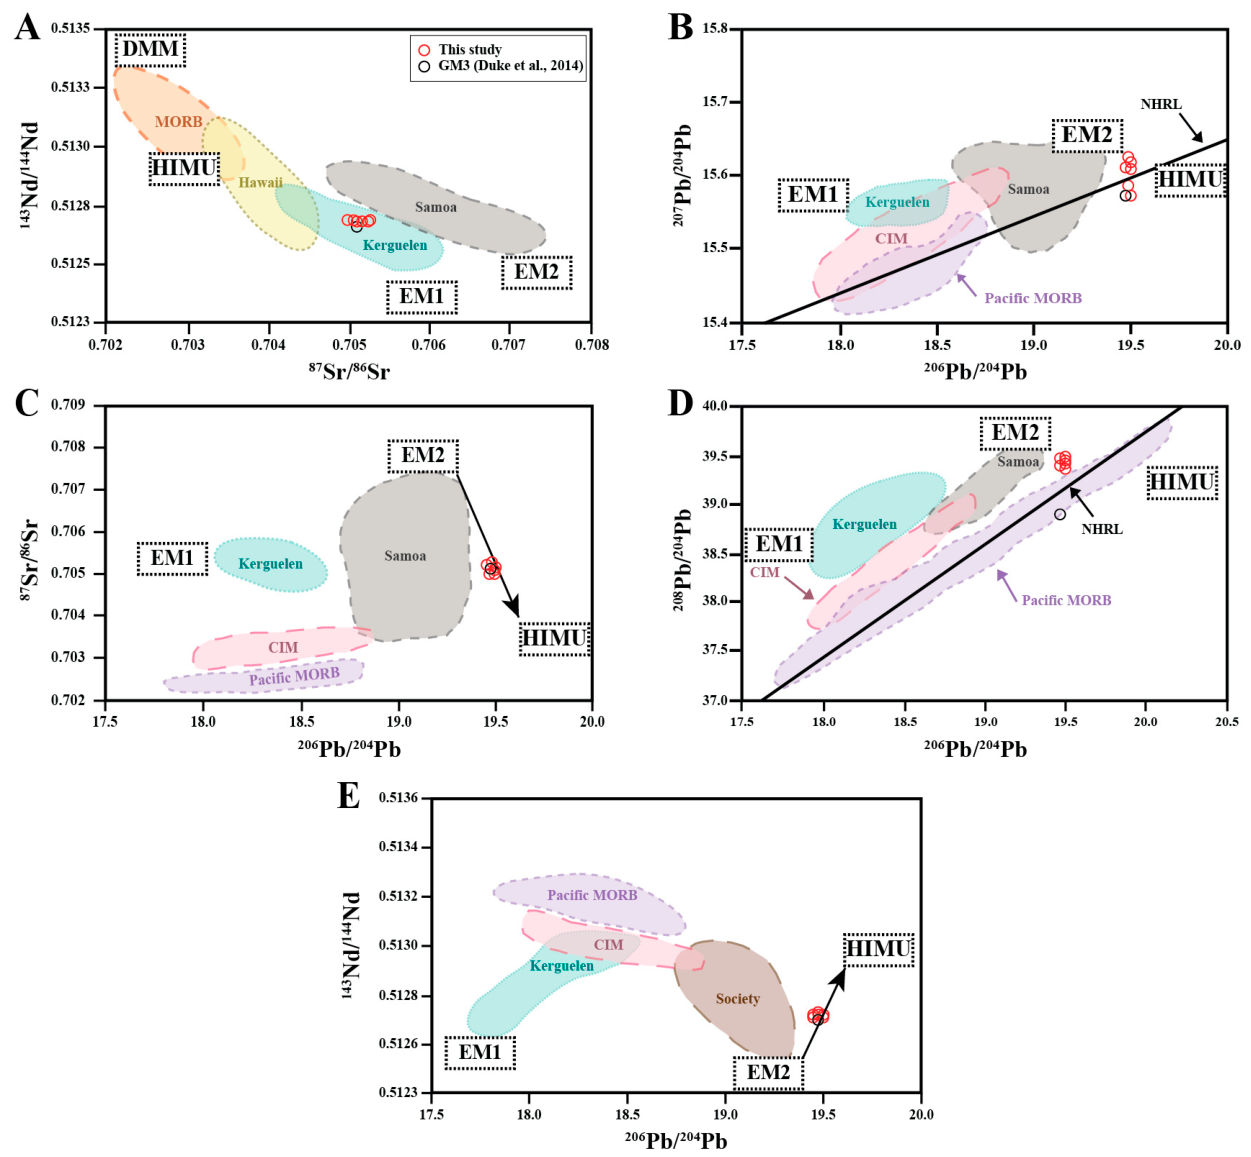
Geochemical and isotopic analysis revealed that the Granite Mountain nepheline syenites originate from a mantle-derived source with very minimal crustal contribution. Isotopic ratio plots compared to mantle derivative fields were used to establish the mantle source or mix of mantle sources of the nepheline syenite samples [20]. On all five plots (Figure 10), the samples were plotted between the enriched mantle 2 (EM2) and high 238U/204Pb (HIMU) fields [34].
Incompatible trace element ratios, Nb/U and Ce/Pb, are able to distinguish whether or not a sample has crustal influence as these ratios are uniformly high for mid-ocean ridge basalts (MORBs) and ocean island basalts (OIBs) (Nb/U: 47 ± 10; Ce/Pb: 25 ± 5), as well as the primitive mantle (Nb/U: 30; Ce/Pb: 9), and uniformly low for continental crust (Nb/U: 10; Ce/Pb: 4) [20,43]. The average Ce/Pb and Nb/U ratios measured were approximately 18 and 40, respectively, indicating that the samples were under little to no crustal influence. As magma evolves, 147Sm-143Nd and 176Lu-176Hf decay systems evolve. This is due to Sm and Lu being more compatible during melting, leaving Sm and Lu in the mantle and Nd and Hf in the crust. This changes the parent/daughter ratios, meaning that a depleted mantle source would have high positive ɛNd and ɛHf values, while a sample from a crustal source would have negative values [44,45]. Table 1 shows that the ɛNd and ɛHf values are positive, further indicating minimal crustal involvement. Additionally, the positive Nb and Ta anomalies observed in Figure 9 suggest minimal crustal involvement as the continental crust is depleted in Nb and Ta [46,47].
Comparing the Sr-Nd-Pb-Hf isotopes of the nepheline syenite samples to mantle end members leads to the determination of the mantle source. Since it is impossible to directly sample the mantle, mantle end members are used as a proxy. These mantle end members include depleted MORB mantle (DMM), enriched mantle 1 (EM1), EM2, HIMU, island arc volcanics (IAV), MORBs, and OIBs [34,48]. As seen in Figure 10, Granite Mountain nepheline syenites come from a mixed mantle source of mantle end members HIMU and EM2 as the samples are always plotted in between the end members. HIMU end members are characterized by their high radiogenic Pb isotopes and low 87Sr/86Sr ratios, while EM2 end members are considered to have high 87Sr/86Sr ratios with intermediate radiogenic Pb [49]. The samples from this study exhibited high 206Pb/204Pb ratios (19.5) and an 87Sr/86Sr ratio closer to mantle-derived source rocks (0.705239), further indicating a mixed mantle source. Although Nd-Sr isotope data can be explained either by the EM1 end member or by mixing EM2 and HIMU, the high 206Pb/204Pb ratios (19.5) argue against an EM1 source since this source is low for 206Pb/204Pb (17.5). Thus, combined Nd-Sr-Pb isotope systematics can be explained by a mixed EM2-HIMU source.
As seen in Figure 6, all the zircons show positive Ce anomalies, which is to be expected due to the suitability of Ce4+ to fit within the structure of zircon [50,51]. Rare-earth elements typically exhibit a 3+ oxidation state. But Ce may exist in magmas as a 3+ and 4+ cation. Ce4+ replaces Zr4+ in zircon lattices and is more compatible relative to Ce3+ with a zircon structure. The magnitude of a Ce positive anomaly in zircon is redox-sensitive. Oxidizing magmas increase Ce4+/Ce3+ ratios, allow more Ce4+ to substitute Zr4+ in zircon, and generate a more pronounced positive Ce anomaly in zircon [52,53,54].
The zircon phenocryst REE diagrams (Figure 6A–C) show a positive Eu anomaly which is atypical in zircon. Zircons commonly have negative Eu anomalies. Eu2+ is preferentially incorporated into plagioclase, and plagioclase fractionation depletes Eu from the magma before or during zircon crystallization [51,55,56,57]. The lack of negative Eu anomalies in the whole-rocks (Figure 8) and in zircon phenocrysts (Figure 6) indicate that significant plagioclase fractionation did not occur for the nepheline syenites. Magmatic differentiation at high pressure suppress plagioclase formation and prevent Eu depletion in the magma [58]. The positive Eu anomalies likely indicate an oxidized, deep (mantle) source for these nepheline syenites where significant plagioclase fractionation did not occur.
The lack of negative Eu anomalies in zircon phenocrysts from Granite Mountain nepheline syenite indicates their mantle affinity and the absence of significant plagioclase fractionation at 90–91 Ma. The positive Eu anomaly in zircon from Granite Mountain nepheline syenites might be attributed to earlier apatite crystallization. It was proposed that early crystallization of apatite can cause Eu enrichment in later crystallizing minerals [59].
By contrast, the zircon xenocrysts show negative Eu anomalies (Figure 6D), indicating the occurrence of significant plagioclase fractionation in shallow magma chambers [60] during the formation of these xenocrysts.

4.3. Tectonic Implications

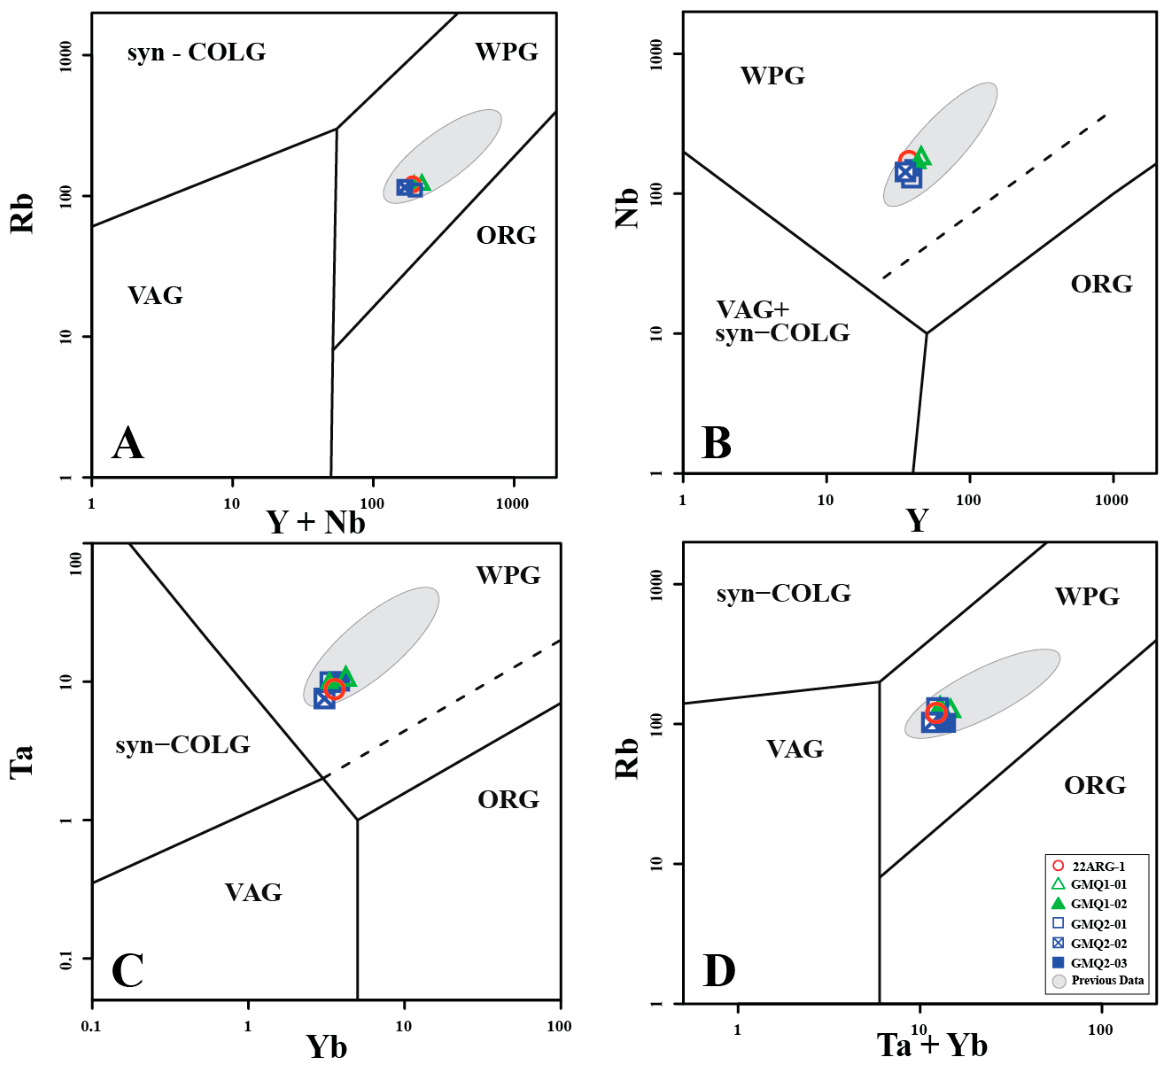
This study favors the idea that these samples came from a mantle plume-type tectonic setting based on the results of their geochemical and isotopic analysis. By plotting the samples within the tectonic discrimination diagrams [61], all six samples clearly plot within the ‘within plate granite’ (WPG) field (Figure 11), indicating an intraplate tectonic setting for these samples. This is further reinforced by the trace element diagram in Figure 9. Subduction zones are also established to show negative Ta and Nb anomalies [62]. However, Granite Mountain nepheline syenites showed a slight positive Nb anomaly when the samples were normalized to primitive mantle. OIBs are characterized by these positive Nb anomalies, or “Nb-kicks”, and are well known to form at mantle plume type settings [63]. This rules out the possibility of a subduction zone or arc type setting, narrowing down the tectonic setting to either a rifting or mantle plume type.
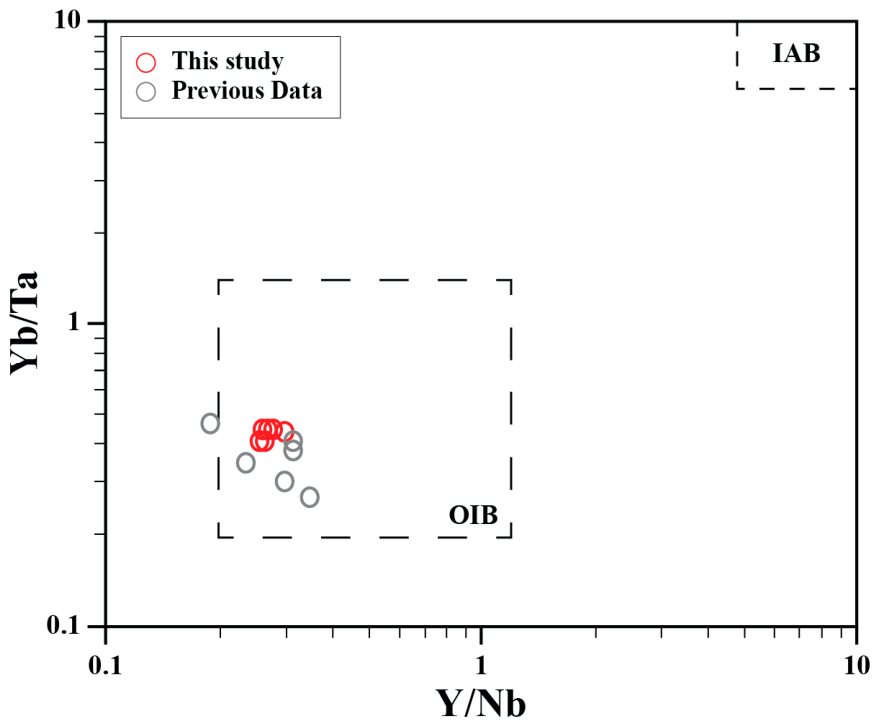
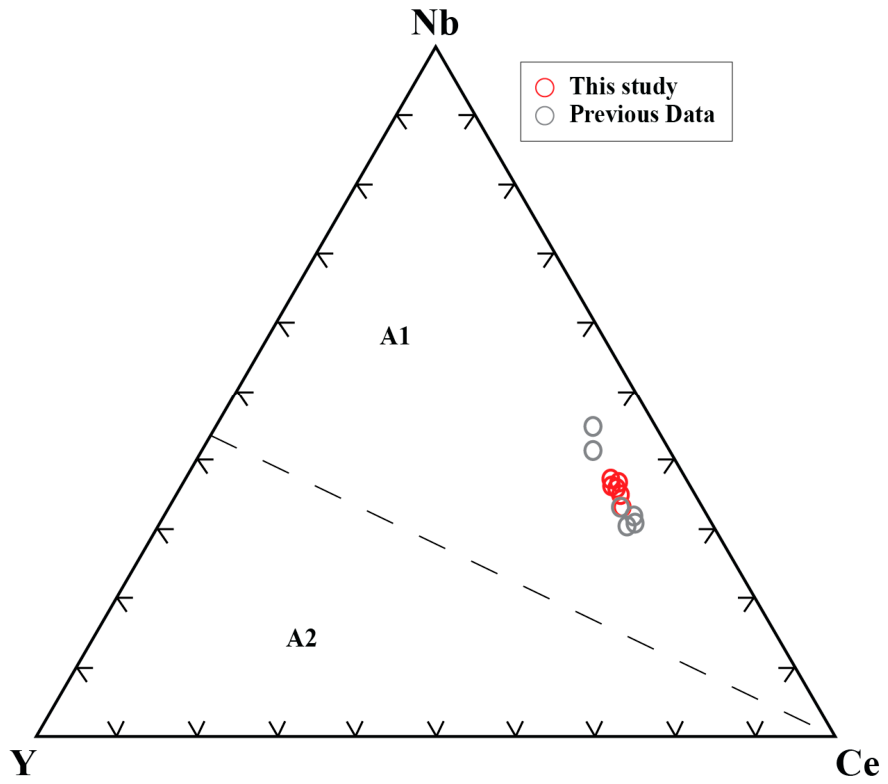
Figure 11 is more suitable for regular granitoids. Additional discrimination diagrams are needed for alkaline rocks such as these nepheline syenites. In Yb/Ta vs. Y/Nb plot [64], these samples plot within the OIB field (Figure 12), indicating a source for these nepheline syenites similar to that of OIBs. In Y-Ce-Nb ternary plot [64], these samples are plotted in the A1 field (Figure 13). The A1 group represents mantle differentiates of magmas produced in ocean island and rift-zone magmas [64].
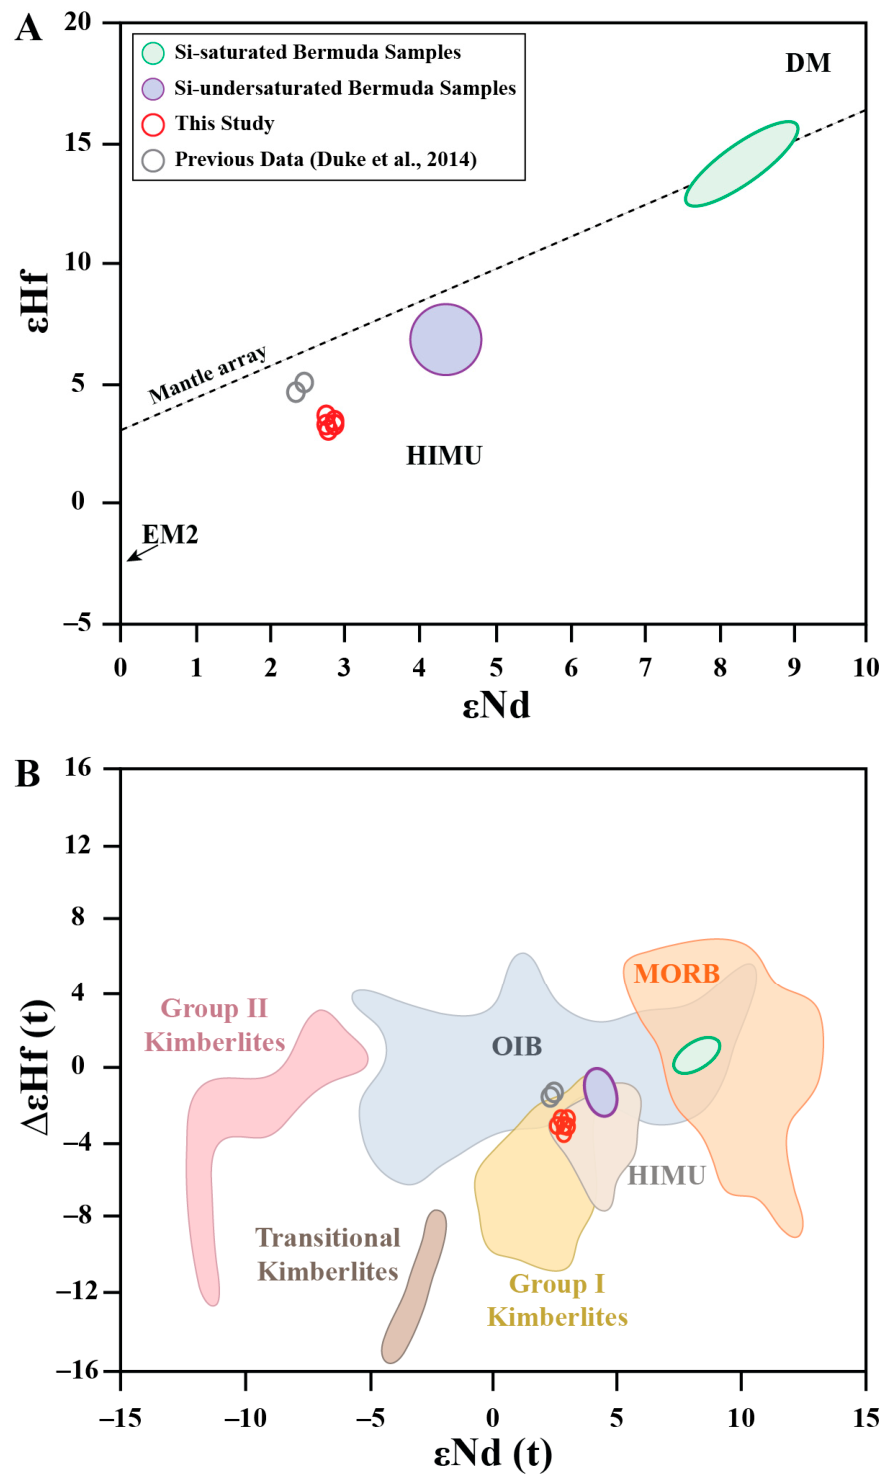
The Granite Mountain nepheline syenites record moderately positive ɛNd values, and differ from N-type MORB source with typical ɛNd values between 8 and 13 [65]. Notably, in the Hf-Nd isotope correlation plot (Figure 14A), the nepheline syenites plot between the EM2 mantle end member and the field for the 30-Ma Bermuda hotspot basalts in the Atlantic. They also plot in the HIMU field in the Hf-Nd isotope diagram (Figure 14B). The Bermuda hotspot basalts are characterized by high 206Pb/204Pb ratios with rare HIMU signatures [66]. The Sr-Pb and Nd-Pb isotopic data from these nepheline syenites (Figure 10) indicate a source that is a mixture of HIMU and EM2 mantle end members. The Nb/Ta ratio of Granite Mountain nepheline syenites ranging from 17.1 to 17.9 (Table 1) is similar to the mean value of 17.9 ± 1.3 for the Bermuda hotspot basalts [66]. The Zr/Hf ratio of Granite Mountain nepheline syenites varying from 46.1 to 48.5 (Table 1) is similar to the mean value of 45.5 ± 5.3 for the Bermuda hotspot basalts [66]. Together, these geochemical and HIMU isotopic signatures infer a mantle hotspot plume contribution for the nepheline syenites from Granite Mountain, although a rifting tectonic setting cannot be ruled out. The Bermuda hotspot plume [67] is likely a weak plume that often lacks the strength to generate a volcanic track on continental crust [6,68]. The very high 206Pb/204Pb ratios, the Hf-Nd isotope relationship, and Sr-Pb isotope and Nd-Pb isotope correlations from the Granite Mountain provide clues linking the Granite Mountain to Bermuda hotspot at 90–91 Ma.
Figure 12. Yb/Ta vs. Y/Nb plot for nepheline syenites from Arkansas [69]. These samples plot within ocean island basalt (OIB) field. Previous data source [1].
Minerals 16 00587 g012
Figure 13. Y-Ce-Nb ternary plot for the nepheline syenites from Arkansas [64]. The dashed line represents Y/Nb ratio of 1.2. Previous data source [1].
Minerals 16 00587 g013

5. Conclusions

  • Zircon crystals directly extracted from the nepheline syenite samples yielded U/Pb ages of 90.4 ± 0.6 Ma.
  • Chondrite-normalized REE diagrams for the 90.4-Ma zircon phenocrysts revealed positive Eu anomalies, indicating a dominant mantle source (rather than crustal source) for these samples.
  • The samples are characterized by moderately positive ɛHf and ɛNd, moderately radiogenic 87Sr/86Sr, high 206Pb/204Pb, enrichments in light rare-earth elements relative to heavy rare-earth elements, and positive Nb and Ta peaks when normalized to primitive mantle.
  • Nd-Sr-Pb-Hf isotopes show that the samples come from a mixture of an EM2 and HIMU magmatic sources.
  • Although a rifting environment cannot be ruled out, based on the HIMU signatures from Nd-Sr-Pb-Hf isotope data and trace element ratios, we prefer a mantle plume origin (likely the Bermuda hotspot) for generation of the nepheline syenites from Granite Mountain, Arkansas.

Supplementary Materials

The following supporting information can be downloaded at: https://www.mdpi.com/article/10.3390/min16060587/s1, Figure S1: Photomicrographs of six nepheline syenite samples from Arkansas Alkaline Province; Table S1: Zircon U-Pb ages and trace element contents.

Author Contributions

Conceptualization, H.Z.; methodology, H.Z., M.B.; formal analysis, M.B., H.Z.; investigation, H.Z., M.B.; resources, H.Z.; data curation, M.B., H.Z.; writing—original draft preparation, H.Z., M.B.; writing—review and editing, H.Z., M.B.; visualization, M.B., H.Z.; supervision, H.Z.; project administration, H.Z.; funding acquisition, H.Z., M.B. All authors have read and agreed to the published version of the manuscript.

Funding

This research was supported by Auburn University Isotope Geoscience Lab, Auburn University Geosciences Advisory Board, and Southeast Section of the Geological Society of America. Pilot sampling of Arkansas nepheline syenites in 2022 was supported by American Chemical Society Petroleum Research Fund (ACS-PRF) for a project (57500-UR2) studying detrital zircons in Cretaceous and Jurassic sandstones in Arkansas.

Data Availability Statement

The original contributions presented in this study are included in the article/Supplementary Material. Further inquiries can be directed to the corresponding author.

Acknowledgments

We are grateful to Heather Thompson from Granite Mountain Quarries for collecting the quarry samples and to Dongancan Yasar and David T. King. for internal reviews of a portion of this manuscript. Three anonymous reviewers provided very constructive reviews that significantly improved the quality of this paper.

Conflicts of Interest

The authors declare no conflicts of interest. The funders had no role in the design of the study; in the collection, analyses, or interpretation of data; in the writing of the manuscript; or in the decision to publish the results.

References

  1. Eby, N.; Charnley, N.; Tiella, G.; Burkhardt, L. The Arkansas Alkaline Province, Southeastern USA: A Synthesis of New and Existing Chemical and Petrologic Data and Petrogenetic Considerations. Minerals 2025, 15, 1133. [Google Scholar] [CrossRef] [Scilit]
  2. Zartman, R.E. Geochronology of some alkalic rock provinces in eastern and central United States. Ann. Rev. Earth Planet. Sci. 1977, 5, 257–286. [Google Scholar] [CrossRef] [Scilit]
  3. Eby, G.N.; Vasconcelos, P. Geochronology of the Arkansas Alkaline Province, Southeastern United States. J. Geol. 2009, 117, 615–626. [Google Scholar] [CrossRef] [Scilit]
  4. Walker, S.R.; Çemen, İ.; Wielicki, M.W.; Tew, B.H.; Stockli, D. Edge-Driven Convection-Based Models for Evolution of the Mississippi Embayment and Associated Alkaline Magmatism. In Extensional Tectonics; Geophysical Monograph Series 278; American Geophysical Union: Washington, DC, USA, 2025; pp. 199–228. [Google Scholar]
  5. Duke, G.I.; Carlson, R.W.; Frost, C.D.; Hearn, B.C.; Eby, G.N. Continent-scale linearity of kimberlite–carbonatite magmatism, mid-continent North America. Earth Planet. Sci. Lett. 2014, 403, 1–14. [Google Scholar] [CrossRef] [Scilit]
  6. Cox, R.T.; Van Arsdale, R.B. The Mississippi Embayment, North America: A first order continental structure generated by the Cretaceous superplume mantle event. J. Geodyn. 2002, 34, 163–176. [Google Scholar] [CrossRef] [Scilit]
  7. Morris, E.M. The Cretaceous Arkansas alkalic province: A summary of petrology and geochemistry. Geol. Soc. Am. 1987, 215, 217–233. [Google Scholar] [CrossRef] [Scilit]
  8. Zartman, R.E.; Brock, M.R.; Heyl, A.V.; Thomas, H.H. K-Ar and Rb-Sr ages of some alkalic intrusive rocks from central and eastern United States. Am. J. Sci. 1967, 265, 848–870. [Google Scholar] [CrossRef] [Scilit]
  9. Baksi, A.K. The timing of Late Cretaceous alkalic igneous activity in the Northern Gulf of Mexico Basin Southeastern USA. J. Geol. 1997, 105, 629–643. [Google Scholar] [CrossRef] [Scilit] [PubMed]
  10. Arne, D.C. Evidence from apatite fission-track analysis for regional Cretaceous cooling in the Ouachita Mountain Gold Belt and Arkoma Basin of Arkansas. AAPG Bull. 1992, 76, 392–402. [Google Scholar] [CrossRef] [Scilit]
  11. Baksi, A.K. Reevaluation of plate motion models based on hotspot tracks in the Atlantic and Indian Oceans. J. Geol. 1999, 107, 13–26. [Google Scholar] [CrossRef] [Scilit]
  12. Gordon, M.; Tracey, J.I.; Ellis, M.W. Geology of the Arkansas Bauxite Region; Professional paper 299; U.S. Geological Survey: Reston, VA, USA, 1958; 268p. [Google Scholar] [CrossRef] [Scilit]
  13. Hu, Z.; Li, X.H.; Luo, T.; Zhang, W.; Crowley, J.L.; Li, Q.-l.; Ling, X.; Yang, C.; Li, Y.; Feng, L.; et al. Tanz Zircon Megacrysts: A New Zircon Reference Material for the Microbeam Determination of U-Pb Age and Zr-O Isotopes. J. Anal. At. Spectrom. 2021, 36, 2715–2734. [Google Scholar] [CrossRef] [Scilit]
  14. Zong, K.; Klemd, R.; Yuan, Y.; He, Z.; Guo, J.; Shi, X.; Liu, Y.; Hu, Z.; Zhang, Z. The assembly of Rodinia: The correlation of early Neoproterozoic (ca. 900 Ma) high-grade metamorphism and continental arc formation in the southern Beishan Orogen, southern Central Asian Orogenic Belt (CAOB). Precambrian Res. 2017, 290, 32–48. [Google Scholar] [CrossRef] [Scilit]
  15. Liu, Y.S.; Gao, S.; Hu, Z.C.; Gao, C.G.; Zong, K.Q.; Wang, D.B. Continental and Oceanic Crust Recycling-induced Melt–Peridotite Interactions in the Trans-North China Orogen: U–Pb Dating, Hf Isotopes and Trace Elements in Zircons from Mantle Xenoliths. J. Petrol. 2010, 51, 537–571. [Google Scholar] [CrossRef] [Scilit]
  16. Liu, Y.S.; Hu, Z.C.; Gao, S.; Günther, D.; Xu, J.; Gao, C.G.; Chen, H.H. In situ analysis of major and trace elements of anhydrous minerals by LA-ICP-MS without applying an internal standard. Chem. Geol. 2008, 257, 34–43. [Google Scholar] [CrossRef] [Scilit]
  17. Ludwig, K.R. ISOPLOT 3.0: A Geochronological Toolkit for Microsoft Excel; Special Publication; Berkeley Geochronology Center: Berkeley, CA, USA, 2003. [Google Scholar]
  18. Zou, H.B. Li-Ta-rich topaz-lepidolite granite from Yichun (China) exhibits the highest 87Sr/86Sr ratios for Earth’s rocks: Ages and Petrogenesis. J. Asian Earth Sci. 2026, 301, 107005. [Google Scholar] [CrossRef] [Scilit]
  19. Özdamar, Ş.; Zou, H.B.; Billor, M.Z.; Hames, W.E. Petrogenesis of mafic microgranular enclaves (MMEs) in the oligocene-miocene granitoid plutons from northwest Anatolia, Turkey. Geochemistry 2021, 81, 125713. [Google Scholar] [CrossRef] [Scilit]
  20. Zou, H.B.; Zindler, A.; Xu, X.S.; Qi, Q. Major, trace element, and Nd-Sr-Pb isotope studies of Cenozoic basalts in SE China: Mantle sources, regional variations, and tectonic significance. Chem. Geol. 2000, 171, 33–47. [Google Scholar] [CrossRef] [Scilit]
  21. Yu, Z.S.; Robinson, P.; McGoldrick, P. An Evaluation of Methods for the Chemical Decomposition of Geological Materials for Trace Element Determination using ICP-MS. Geostand. Newsl. 2007, 25, 199–217. [Google Scholar] [CrossRef] [Scilit]
  22. Lawrence, R.L.; Cox, R.; Mapes, R.W.; Coleman, D.S. Hydrodynamic fractionation of zircon age populations. Geol. Soc. Am. Bull. 2010, 123, 295–305. [Google Scholar] [CrossRef] [Scilit]
  23. Taylor, J.R. An Introduction to Error Analysis; University Science Books: Sausalito, CA, USA, 1997; p. 327. [Google Scholar]
  24. Zou, H.B. Uncertainties in Geochemistry. In Treatise on Geochemistry, 3rd ed.; Weis, D., Anbar, A., Eds.; Elsevier: Amsterdam, The Netherlands, 2025; Volume 8, pp. 183–203. [Google Scholar]
  25. Zou, H.B.; King, D.T.J.; Benton, M.; Webb, Z. Provenance variations of Cretaceous sandstones from Arkansas and drainage reorganization in Southern USA: Evidence from detrital zircon ages. Geosciences 2025, 15, 133. [Google Scholar] [CrossRef] [Scilit]
  26. Wetherill, G.W. Discordant uranium-lead ages, I. Trans. Am. Geophys. Union 1956, 37, 320–326. [Google Scholar]
  27. Anders, E.; Grevesse, N. Aundances of the elements: Meteoritic and solar. Geochim. Cosmochim. Acta 1989, 53, 197–214. [Google Scholar] [CrossRef] [Scilit]
  28. Frost, B.R.; Frost, C.D. A Geochemical Classification for Feldspathic Igneous Rocks. J. Petrol. 2008, 49, 1955–1969. [Google Scholar] [CrossRef] [Scilit]
  29. Pfander, J.A.; Munker, C.; Stracke, A.; Mezger, K. Nb/Ta and Zr/Hf in ocean island basalts—Implications for crust–mantle differentiation and the fate of Niobium. Earth Planet. Sci. Lett. 2007, 254, 158–172. [Google Scholar] [CrossRef] [Scilit]
  30. Kyle, P.R.; Moore, J.A.; Thirlwall, M.F. Petrologic evolution of anorthoclase phonolite lavass at Mount Erebus, Ross island, Antarctica. J. Petrol. 1992, 33, 849–875. [Google Scholar] [CrossRef] [Scilit]
  31. Eby, G.N.; Woollley, A.R.; Din, V.; Platt, G. Geochemistry and petrogenesis of nepheline syenites: Kasungu-Chipala, Ilomba, and Ulindi nepheline syenite intrusions, North Nyasa Alkaline Province, Malawi. J. Petrol. 1998, 39, 1403–1424. [Google Scholar] [CrossRef]
  32. McDonough, W.F.; Sun, S.S. The composition of the Earth. Chem. Geol. 1995, 120, 223–253. [Google Scholar] [CrossRef] [Scilit]
  33. Hart, S.R. A large-scale isotope anomaly in the Southern Hemisphere mantle. Nature 1984, 309, 753–757. [Google Scholar] [CrossRef] [Scilit]
  34. Zindler, A.; Hart, S.R. Chemical geodynamics. Ann. Rev. Earth Planet. Sci. 1986, 14, 493–571. [Google Scholar] [CrossRef]
  35. Weis, D.; Frey, F.A.; Leyrit, H.; Gautier, I. Kerguelen Archipelago revisited: Geochemical and isotopic study of the Southeast Province lavas. Earth Planet. Sci. Lett. 1993, 118, 101–119. [Google Scholar] [CrossRef] [Scilit]
  36. Wright, E.; White, W.M. The origin of Samoa: New evidence from Sr, Nd, and Pb isotopes. Earth Planet. Sci. Lett. 1987, 81, 151–162. [Google Scholar] [CrossRef] [Scilit]
  37. Hart, S.R. Heterogeneous mantle domains: Signatures, genesis and mixing chronologies. Earth Planet. Sci. Lett. 1988, 90, 273–296. [Google Scholar] [CrossRef] [Scilit]
  38. Faure, G.; Mensing, T.M. Isotopes: Principles and Applications; Wiley: Hoboken, NJ, USA, 2005; p. 897. [Google Scholar]
  39. Kumar, K.V.; Frost, C.; Frost, B.; Chamberlain, K. The Chimakurti, Errakonda, and Uppalapadu plutons, Eastern Ghats Belt, India: An unusual association of tholeiitic and alkaline magmatism. Lithos 2007, 97, 30–57. [Google Scholar] [CrossRef] [Scilit]
  40. Mingram, B.; Trumbull, R.B.; Littman, S.; Gerstenberger, H. A petrogenetic study of anorogenic felsic magmatism in the Cretaceous Paresis ring complex, namibia: Evidence for mixing of crustal and mantle-derived components. Lithos 2000, 54, 1–22. [Google Scholar] [CrossRef] [Scilit]
  41. Tchameni, R.; Mezger, K.; Nsifa, N.E.; Pouclet, A. Crutal origin of Early Proterozoic syenites in the Congo Craton (Ntem Complex), South Cameroon. Lithos 2001, 57, 23–42. [Google Scholar] [CrossRef] [Scilit]
  42. He, Z.Y.; Xu, X.S.; Yu, Y.; Zou, H.B. Origin of the Late Cretaceous syenite from Yandangshan, SE China, constrained by zircon U-Pb and Hf isotopes and geochemical data. Int. Geol. Rev. 2009, 51, 556–582. [Google Scholar] [CrossRef] [Scilit]
  43. Hofmann, A.W.; Jochum, K.P.; Seufert, M.; White, W.M. Nb and Pb in oceanic basalts: New constraints on mantle evolution. Earth Planet. Sci. Lett. 1986, 79, 33–45. [Google Scholar] [CrossRef] [Scilit]
  44. Rollinson, H.; Pease, V. Using Geochemical Data to Understand Geological Processes; Cambridge University Press: Cambridge, England, 2021; p. 346. [Google Scholar]
  45. Jones, R.E.; van Keken, P.E.; Hauri, E.H.; Tucker, J.M.; Vervoort, J.; Ballentine, C.J. Origins of the terrestrial Hf-Nd mantle array: Evidence from a combined geodynamical-geochemical approach. Earth Planet. Sci. Lett. 2019, 518, 26–39. [Google Scholar] [CrossRef] [Scilit]
  46. Hu, Z.C.; Gao, S. Upper crustal abundances of trace elements: A revision and update. Chem. Geol. 2008, 253, 205–221. [Google Scholar] [CrossRef] [Scilit]
  47. Barth, M.G.; McDonough, W.F.; Rudnick, R.L. Tracking the budget of Nb and Ta in the continental crust. Chem. Geol. 2000, 165, 197–213. [Google Scholar] [CrossRef] [Scilit]
  48. Arevalo, R.; McDonough, W.F. Chemical variations and regional diversity observed in MORB. Chem. Geol. 2010, 271, 70–85. [Google Scholar] [CrossRef] [Scilit]
  49. Jackson, M.G.; Dasgupta, R. Compositions of HIMU, EM1, and EM2 from global trends between radiogenic isotopes and major elements in ocean island basalts. Earth Planet. Sci. Lett. 2008, 276, 175–186. [Google Scholar] [CrossRef] [Scilit]
  50. Hinton, R.W.; Upton, B.G.J. The chemistry of zircon: Variations within and between large crystals from syenite and alkali basalts xenoliths. Geochim. Cosmochim. Acta 1991, 55, 3287–3302. [Google Scholar] [CrossRef] [Scilit]
  51. Hoskin, P.W.O.; Schaltegger, U. The composition of zircon and igneous and metamorphic petrogenesis. Rev. Mineral. Geochem. 2003, 53, 27–62. [Google Scholar] [CrossRef] [Scilit]
  52. Trail, D.; Watson, E.B.; Tailby, N.D. Ce and Eu anomalies in zircon as proxies for the oxidation state of magmas. Geochim. Cosmochim. Acta 2012, 97, 70–87. [Google Scholar] [CrossRef] [Scilit]
  53. Li, W.; Cheng, Y.; Yang, Z. Geo-fO2: Integrated Software for Analysis of Magmatic Oxygen Fugacity. Geochem. Geophys. Geosystems 2019, 20, 2542–2555. [Google Scholar] [CrossRef] [Scilit]
  54. Zhong, S.H.; Seltmann, R.; Qu, H.Y.; Song, Y.X. Characterization of the zircon Ce anomaly for estimation of oxidation state of magmas: A revised Ce/Ce* method. Mineral. Petrol. 2019, 113, 755–763. [Google Scholar] [CrossRef] [Scilit]
  55. Hu, P.Y.; Zhai, Q.G.; Cawood, P.A.; Weinberg, R.F.; Zhao, G.C.; Zhou, R.J.; Tang, Y.; Liu, Y.M. Detrital zircon REE and tectonic settings. Lithos 2024, 480–481, 107661. [Google Scholar] [CrossRef] [Scilit]
  56. Holder, R.M.; Yakymchuk, C.; Viete, D.R. Accessory mineral Eu anomalies in suprasolidus rocks: Beyond feldspar. Geochem. Geophys. Geosystems 2020, 21. [Google Scholar] [CrossRef] [Scilit]
  57. Guo, Z.P.; Zou, H.B. Temperature and Hf-O isotope correlations of young erupted zircons from Tengchong (SE Tibet): Assimilation fractional crystallization during monotonic cooling. Geosci. Front. 2023, 14, 101497. [Google Scholar] [CrossRef] [Scilit]
  58. Green, T.H. Anatexis of mafic crust and high pressure crystallization of andesite. In Andesites: Orogenic Andesites and Related Rocks; Thorpe, R.S., Ed.; John Wiley & Sons: New York, NY, USA, 1982; pp. 465–487. [Google Scholar]
  59. Puchelt, H.; Emmermann, R. Bearing of rare earth patterns of apatites from igneous and metamorphic rocks. Earth Planet. Sci. Lett. 1976, 31, 279–286. [Google Scholar] [CrossRef] [Scilit]
  60. Tang, M.; Ji, W.Q.; Chu, X.; Wu, A.B.; Chen, C. Reconstructing crustal thickness evolution from europium anomalies in detrital zircons. Geology 2020, 49, 76–80. [Google Scholar] [CrossRef] [Scilit]
  61. Pearce, J.A.; Harris, N.B.W.; Tindle, A.G. Trace element discrimination diagram for the tectonic interpretation of granitic rocks. J. Petrol. 1984, 25, 956–983. [Google Scholar] [CrossRef] [Scilit]
  62. Baier, J.; Audetat, A.; Keppler, H. The origin of the negative niobium tantalum anomaly in subduction zone magmas. Earth Planet. Sci. Lett. 2008, 267, 290–300. [Google Scholar] [CrossRef] [Scilit]
  63. Yasar, I.D.; Miller, B.V.; Hames, W.E. Silurian ocean island basalt magmatism and Devonian–Carboniferous polymetamorphism: 100 million years in the Western Blue Ridge, USA. Geol. Soc. Am. Bull. 2024, 137, 810–824. [Google Scholar] [CrossRef] [Scilit]
  64. Eby, G.N. Chemical subdivision of the A-type granitoids: Petrogenetic and tectonic implications. Geology 1992, 20, 641–644. [Google Scholar] [CrossRef] [Scilit]
  65. Xia, L.Q.; Li, X.M. Basalt geochemistry as a diagnostic indicator of tectonic setting. Gondwana Res. 2019, 65, 43–67. [Google Scholar] [CrossRef] [Scilit]
  66. Mazza, S.E.; Gazel, E.; Bizimis, M.; Moucha, R.; Beguelin, P.; Johnson, E.A.; McAleer, R.J.; Sobolev, V. Sampling the volatile-rich transition zone beneath Bermuda. Nature 2019, 569, 398–402. [Google Scholar] [CrossRef] [Scilit]
  67. Detrick, R.S.; Von Herzen, R.P.; Parsons, B.; Sandwell, D.; Dougherty, M. Heat flow observations on the Bermuda Rise and thermal models of midplate swells. J. Geophys. Res. Solid Earth 2012, 91, 3701–3723. [Google Scholar] [CrossRef] [Scilit]
  68. Duncan, R.A. Age progressive volcanism in the New England Seamounts and the opening of the central Atlantic Ocean. J. Geophys. Res. Solid Earth 2012, 89, 9980–9990. [Google Scholar] [CrossRef] [Scilit]
  69. Eby, G.N. The A-type granitoids: A review of their occurrence and chemical characteristics and speculations on their petrogenesis. Lithos 1990, 26, 115–134. [Google Scholar] [CrossRef] [Scilit]
  70. Chauvel, C.; Lewin, E.; Carpentier, M.; Arndt, N.T.; Marini, J.C. Role of recycled oceanic basalt and sediment in generating the Hf-Nd mantle array. Nat. Geosci. 2008, 1, 64–67. [Google Scholar] [CrossRef] [Scilit]
  71. Nowell, G.M.; Pearson, D.G.; Bell, D.R.; Carlson, R.W.; Smith, C.B.; Kempton, P.D.; Nobel, S.R. Hf isotope systematics of kimberlites and their megacrysts: New constraints on their source regions. J. Petrol. 2004, 45, 1583–1612. [Google Scholar] [CrossRef] [Scilit]
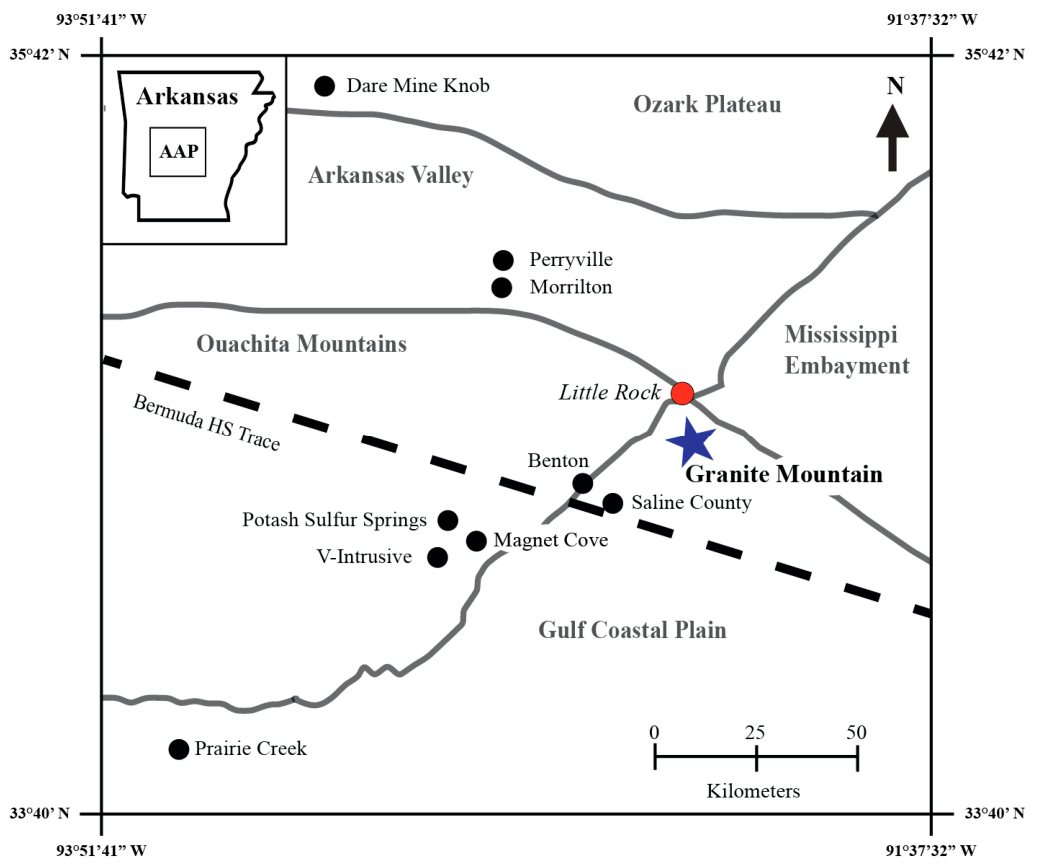
Figure 1. Overview of the Arkansas Alkaline Province in Arkansas modified after [3]. The black dots show the various intrusive bodies throughout the province, and the red dot is the location of Little Rock, Arkansas. The blue star near Little Rock shows the Granite Mountain intrusion, where this study’s samples are from.
Minerals 16 00587 g001
Figure 2. Geologic map of Granite Mountain modified after [12]. Blue square near Little Rock indicates the location of Granite Mountain in Arkansas. Black dots show the location of the samples collected from Granite Mountain.
Minerals 16 00587 g002
Figure 3. Photos of Granite Mountain quarries (left panel) and hand-cut samples (right panel). in = inch (2.54 cm).
Minerals 16 00587 g003
Figure 4. Cathodoluminescence (CL) images of characteristic zircon phenocrysts analyzed for U-Pb ages and trace element contents. Yellow circles outline spot location for LA-ICP-MS. Red text shows measured U/Pb age, and the black numbers indicate the zircon analysis number.
Minerals 16 00587 g004
Figure 6. Chondrite-normalized rare-earth element diagrams for zircon phenocryst from sample 22ARG-1 (A), zircon phenocrysts from GMQ1-01 (B), zircon phenocrysts from GMQ2-02 (C), and zircon xenocrysts from 22ARG-1 (D). Chondrite REE values [27].
Minerals 16 00587 g006
Figure 7. Magma classification diagrams based on Frost and Frost [28]. (A) Modified alkali-index (MALI) vs. SiO2 diagram showing all samples as alkalic. (B) Aluminum Saturation Index (ASI) vs. SiO2 diagram showing the samples as metaluminous. (C) Alkalinity Index (AI) vs. Feldspathoid Silica Saturation Index (FSSI) diagram showing the samples as silica-undersaturated and metaluminous. (D) Fe-index vs. SiO2 diagram showing the samples as ferroan. Previous data sources [1,5,7].
Minerals 16 00587 g007
Figure 8. Chondrite-normalized rare-earth element patterns of whole-rocks. Chondrite REE values [27].
Minerals 16 00587 g008
Figure 9. Primitive mantle-normalized multi-element diagram of whole rocks. Primitive mantle values [32].
Minerals 16 00587 g009
Figure 10. (A) 143Nd/144Nd vs. 87Sr/86Sr, (B) 207Pb/204Pb vs. 206Pb/204Pb, (C) 87Sr/86Sr vs. 206Pb/204Pb, (D) 208Pb/204Pb vs. 206Pb/204Pb, (E) 143Nd/144Nd vs. 206Pb/204Pb diagrams for nepheline syenites studied represented by red circles. CIM = Central Indian MORB, NHRL = Northern Hemisphere Reference Line [33]. Reference fields [20,34,35,36,37].
Minerals 16 00587 g010
Figure 11. Geotectonic discrimination diagram for samples. (A) Rb vs. (Y+Nb) plot; (B) Nb vs. Y plot; (C) Ta vs. Yb plot; (D) Rb vs. (Ta+Yb) plot. syn-COLG = syn-collisional granite; WPG = within plate granite; VAG = volcanic arc granite; ORG = ocean ridge granite [61]. The dashed line is the upper boundary for ORG from anomalous ridge segment. Previous data [1,5].
Minerals 16 00587 g011
Figure 14. Hf-Nd isotope plot for nepheline syenite from Arkansas. The field areas for Bermuda samples in (A,B) are from [66]. The dashed line in (A) is mantle array [70]. The field areas except for Bermuda samples in (B) are from [71]. Previous data [5].
Minerals 16 00587 g014
Table 1. Whole-rock major and trace element contents and Sr, Nd, Hf and Pb isotopic compositions.
Sample22ARG-1GMQ1-01GMQ1-02GMQ2-01GMQ2-02GMQ2-03
SiO261.0060.9060.2060.5060.5060.40
TiO21.000.970.981.020.950.95
Al2O318.9519.0018.8018.9518.6018.90
Fe2O33.533.283.623.523.583.41
MnO0.170.160.180.180.160.17
MgO0.840.800.840.910.840.83
CaO2.021.942.121.892.072.13
Na2O6.606.496.155.746.286.27
K2O6.316.316.266.546.126.11
P2O50.220.200.230.230.230.21
Loss0.460.690.911.590.980.94
Total101.35100.99100.53101.33100.56100.59
K2O + Na2O12.9112.8012.4112.2812.4012.38
Fe2O3/MgO4.204.104.313.874.264.11
La120.00118.00124.00117.50103.50115.50
Ce232225241220195217
Pr25.7024.4026.5024.6022.2024.00
Nd84.5080.4087.4081.3075.6080.20
Sm12.8512.7013.4012.4011.8512.10
Eu3.153.223.023.063.093.15
Gd8.808.368.948.598.048.79
Tb1.351.221.401.281.161.24
Dy6.887.077.757.036.137.04
Ho1.471.381.561.381.231.38
Er4.244.174.083.813.223.83
Tm0.560.540.600.520.460.53
Yb3.853.763.823.502.923.62
Lu0.540.500.570.550.440.54
Ba172017351720168518301765
Th14.8516.5015.8514.8511.2515.10
Nb154157156153.5114.5145
Y40.9039.5041.6039.6034.4038.40
Hf11.4011.6511.2511.008.1010.95
Ta8.909.209.008.606.608.30
U4.034.494.284.233.094.24
Pb12.2812.3512.3812.0211.3111.55
Rb123121.50126135.50111.50117
Cs1.862.011.964.111.312.29
Sr581577600581607623
Sc7.106.906.706.507.306.80
Zr526537542513393516
Nb/Ta17.317.117.317.917.417.5
Zr/Hf46.146.148.246.648.547.1
Th/U3.683.673.703.513.643.56
Ce/Pb18.8918.2119.4718.3017.2418.78
Nb/U38.2134.9736.4536.2937.0634.20
Ba/Th115.82105.15108.52113.47162.67116.89
Sr/Th39.1234.9737.8539.1253.9641.26
Sr/Y14.2114.6114.4214.6717.6516.22
87Sr/86Sr0.7050840.7051810.7051570.7052370.7049690.705246
2SE0.0000240.0000070.0000280.0000190.0000130.000020
87Sr/86Sr initial0.7043000.7044020.7043800.7043740.7042890.704551
143Nd/144Nd0.5127120.5127110.5127140.5127120.5127190.512717
2SE0.0000050.0000050.0000050.0000060.0000050.000005
εNd(0)1.41.41.51.41.61.5
εNd(t)2.82.72.82.72.82.8
176Hf/177Hf0.2828320.2828280.2828230.2828370.2828260.282828
2SE0.0000040.0000050.0000050.0000040.0000050.000005
εHf(0)2.12.01.82.31.92.0
εHf(t)3.83.63.54.03.63.6
206Pb/204Pb19.50319.46919.47619.49419.47719.496
207Pb/204Pb15.60815.61215.59015.57715.62715.619
208Pb/204Pb39.39939.45639.42539.37139.48639.431
Disclaimer/Publisher’s Note: The statements, opinions and data contained in all publications are solely those of the individual author(s) and contributor(s) and not of MDPI and/or the editor(s). MDPI and/or the editor(s) disclaim responsibility for any injury to people or property resulting from any ideas, methods, instructions or products referred to in the content.