Article

The Effects of Al2O3 and SiO2 on the Formation Process of Silico-Ferrite of Calcium and Aluminum (SFCA) by Solid-State Reactions

School of Metallurgical and Ecological Engineering, University of Science and Technology Beijing, Beijing 100083, China
*
Author to whom correspondence should be addressed.
Minerals 2019, 9(2), 101; https://doi.org/10.3390/min9020101
Submission received: 2 January 2019 / Revised: 30 January 2019 / Accepted: 31 January 2019 / Published: 10 February 2019
(This article belongs to the Special Issue Mineralogy of Iron Ore Sinters)

Abstract

:
The silico-ferrite of calcium and aluminum (SFCA) is a significant crystalline phase that bonds in high basicity sinter. Al2O3 and SiO2 play an important role in the formation of SFCA in the Fe2O3–CaO–SiO2–Al2O3 system, but the effect mechanism of Al2O3 and SiO2 on the formation of SFCA is unclear. To investigate this effect, sintering experiments were carried out with different temperatures and different times. It was found that the reaction of Al2O3 with CaFe2O4 (CF) as an initial product was easier to form during the calcium iron aluminum oxide (CFA) than that of SiO2 with CF to form SFC. This was due to the former directly forming to CFA while the latter initially formed Ca2SiO4 (C2S) and Ca2.5Fe15.5O25, and then SFC. It was also observed that when Al2O3 and SiO2 existed simultaneously, the Al2O3 initially reacted with CF to form CFA at 1100 °C, while the SiO2 participated in the formation of SFCA at 1150 °C without the formation of SFC. Moreover, it was understood that these were different effects in that the Al2O3 promoted the transformation from the orthorhombic crystal system to the triclinic crystal system, while the SiO2 dissolved into CFA to form the SFCA phase when Al2O3 existed.

1. Introduction

Silico-ferrites of calcium and alumina (SFCA) is a vital bonding phase in the high basicity sinter as a main material in blast furnace for iron-making, the formation process of SFCA has been studied by many researchers [1,2,3,4,5]. Inoue and Ikeda [6] first reported that the SFCA was a solid solution of calcium ferrite with CaSiO3–Ca(Fe, Al)6O10 which existed in the CaO–Fe2O3–Al2O3–SiO2 system. Patrick et al. [7] also reported that the chemical composition of SFCA was located on the plane of CaO · 3Fe2O3–CaO · 3Al2O3–4CaO · 3SiO2. Mumme et al. [8] studied the crystal structure of the SFCA by a method of structure refinement to report that it belongs to a triclinic crystal system with P1 space group. On the other hand, many scholars have also studied the precursor in the formation process of SFCA. In Fe2O3–CaO–SiO2 system, Hamilton et al. [9] reported a silico-ferrite of calcium (SFC) phase appeared as an alumina-free equivalent SFC. Furthermore, Ding et al. [10,11] studied the formation mechanism and the crystal structure of SFC in which Fe2O3, CaFe2O4 (CF) and Ca2SiO4 reacted to form the SFC that belongs to a triclinic crystal structure. In the Fe2O3–CaO–Al2O3 system, Lister et al. [12] reported a ternary phase in which CaO·3(Fe2O3, Al2O3) appeared in the ternary system. Furthermore, Mumme et al. [13] studied a detailed composition of Ca5.1Al9.3Fe3+18.7Fe2+0.9O48 and understood that it belongs to a triclinic crystal structure. Guo et al. [14] reported that the CF and hematite solid solution with the Al2O3 could react to form the CFA. The SFC phase, CFA phase, and SFCA phase had the same crystal structure and similar XRD patterns. This made it difficult to identify and track aluminum and silicon involved in the formation of SFCA. The SFC and the CFA were considered as a precursor of the SFCA formation [15], but it was unclear as to how to transform CF, SiO2 and Al2O3 to SFCA. For example, Scarlett et al. [16,17] reported that CF appeared as an original in the calcium ferrite phase before the Al2O3 and SiO2 participated in the formation of SFCA. Webster et al. [18] reported that C2F, Fe2O3 and Al2O3 reacted to form CFA and then SFCA. The possibility of SFC and CFA formation as precursors has an important effect on SFCA formation. Therefore, it is necessary to compare the formation process of SFC and CFA under the same conditions. In this work, the effect of SiO2 and Al2O3 on the SFCA formation process was investigated by XRD, scanning electron microscopy (SEM) and energy-dispersive spectroscopy (EDS). Rietveld quantitative methods were used to study the reaction rate of SiO2 and Al2O3 with CF. These results are helpful in understanding the important role of Al2O3 and SiO2 in the SFCA formation process.

2. Experimental Section

2.1. Sample Preparation

The materials used were analytical grade hematite (Fe2O3), calcium hydroxide (Ca(OH)2), silica (SiO2) and alumina (Al2O3). The materials were ground to a particle size of less than 50 μm in an agate mortar to enable full contact in the mixing process. The starting material composition of the sintering experiments are listed in Table 1. The CF was considered to be the initial bonding phase that appeared during the formation of SFCA [19,20,21]. In order to compare the effect of SiO2 and Al2O3 on the formation of the precursor, the sintering experiment of CF reacted with SiO2 and Al2O3 was carried out. The CF was prepared by an equal molar ratio of Ca(OH)2 and Fe2O3 at 1200 °C for 2 h [11]. The XRD confirmed it to be a pure phase, and then the sintered CF was crushed into particles with size less than 50 μm. The molar ratio of Al2O3 and SiO2 to CF was selected as 0.5 and 1 respectively. The mole ratio of Si4+ to Al3+ was 1, which was consistent with the ratio of Si4+ to Al3+ in SFCA for comparing the effect of SiO2 and Al2O3 on the precursor formation. The powdered sample was homogenized in an agate mortar with anhydrous ethanol for 30 min, and then pressed to 8 mm in diameter and 2 mm in thickness under a pressure of 5 MPa in a die. The samples were sintered for different periods of time (5 min, 15 min and 60 min) at 1100 °C and 1150 °C respectively in a resistance furnace.
The composition of SFCA varied in iron ore sinters [22]. The composition of SFCA contained 60–76 mass % Fe2O3, 3–10 mass % SiO2, 13–16 mass % CaO, 4–10 mass % Al2O3 and 0.7–1.5 mass % MgO in industrial sinters [23,24]. In order to remain consistent with the experiments of CF reactions with SiO2 and Al2O3, a molar ratio of 2:1 (SiO2 to Al2O3) was selected for comparing the competitive effect of Si4+ and Al3+ entered into the SFCA. The powdery sample was homogenized in an agate mortar with anhydrous ethanol for 30 min, and then pressed 8 mm in diameter and 2 mm in thickness under a pressure of 5 MPa in a die. Part of the pressed samples were put into a cylindrical Pt crucible, and sintered at different temperatures (800 °C, 900 °C, 1000 °C, 1100 °C, and 1200 °C) in a resistance furnace by a solid-state reaction. The sintering time was set at 120 min to ensure the reaction was complete as our previous research [25]. The remaining part of the samples were sintered in Pt crucibles at 1200 °C at different times (2 min, 4 min, 6 min, 8 min, 10 min, 12 min, 15 min, 30 min and 60 min) in the same furnace.
In order to study the composition of the phase at the temperature, all sintered samples were quenched in liquid nitrogen. The sintering experiments were conducted under constant air pressure.

2.2. Phase Determination (XRD, SEM and EDS)

A portion of the sintered sample was ground to less than 50 μm for XRD analysis. The X-ray powder diffraction data was collected on a Rigaku D/MAXRB X-ray diffractometer (Rigaku Corporation, Tokyo, Japan) with Cu radiation (λ = 0.15406 nm) at operating parameters of 40 kV × 300 mA, a step size of 0.02° and scan rate of 10°/min.
The remaining parts of the samples were embedded into a phenolic moulding powder by a metallographic inlaying machine, and ground with abrasive paper (600, 1000, 1200 and 1500 CW successively), before being polished for observation using SEM. A FEI Quanta 250 scanning electron microscope (FEI Quanta, Hillsboro, OR, USA) was used to observe the microstructure of the sintered sample. A XFlash 5030 EDS detector (Bruker Nano GmbH, Berlin, Germany) was used to determine the chemical composition of the phases.

3. Results and Discussion

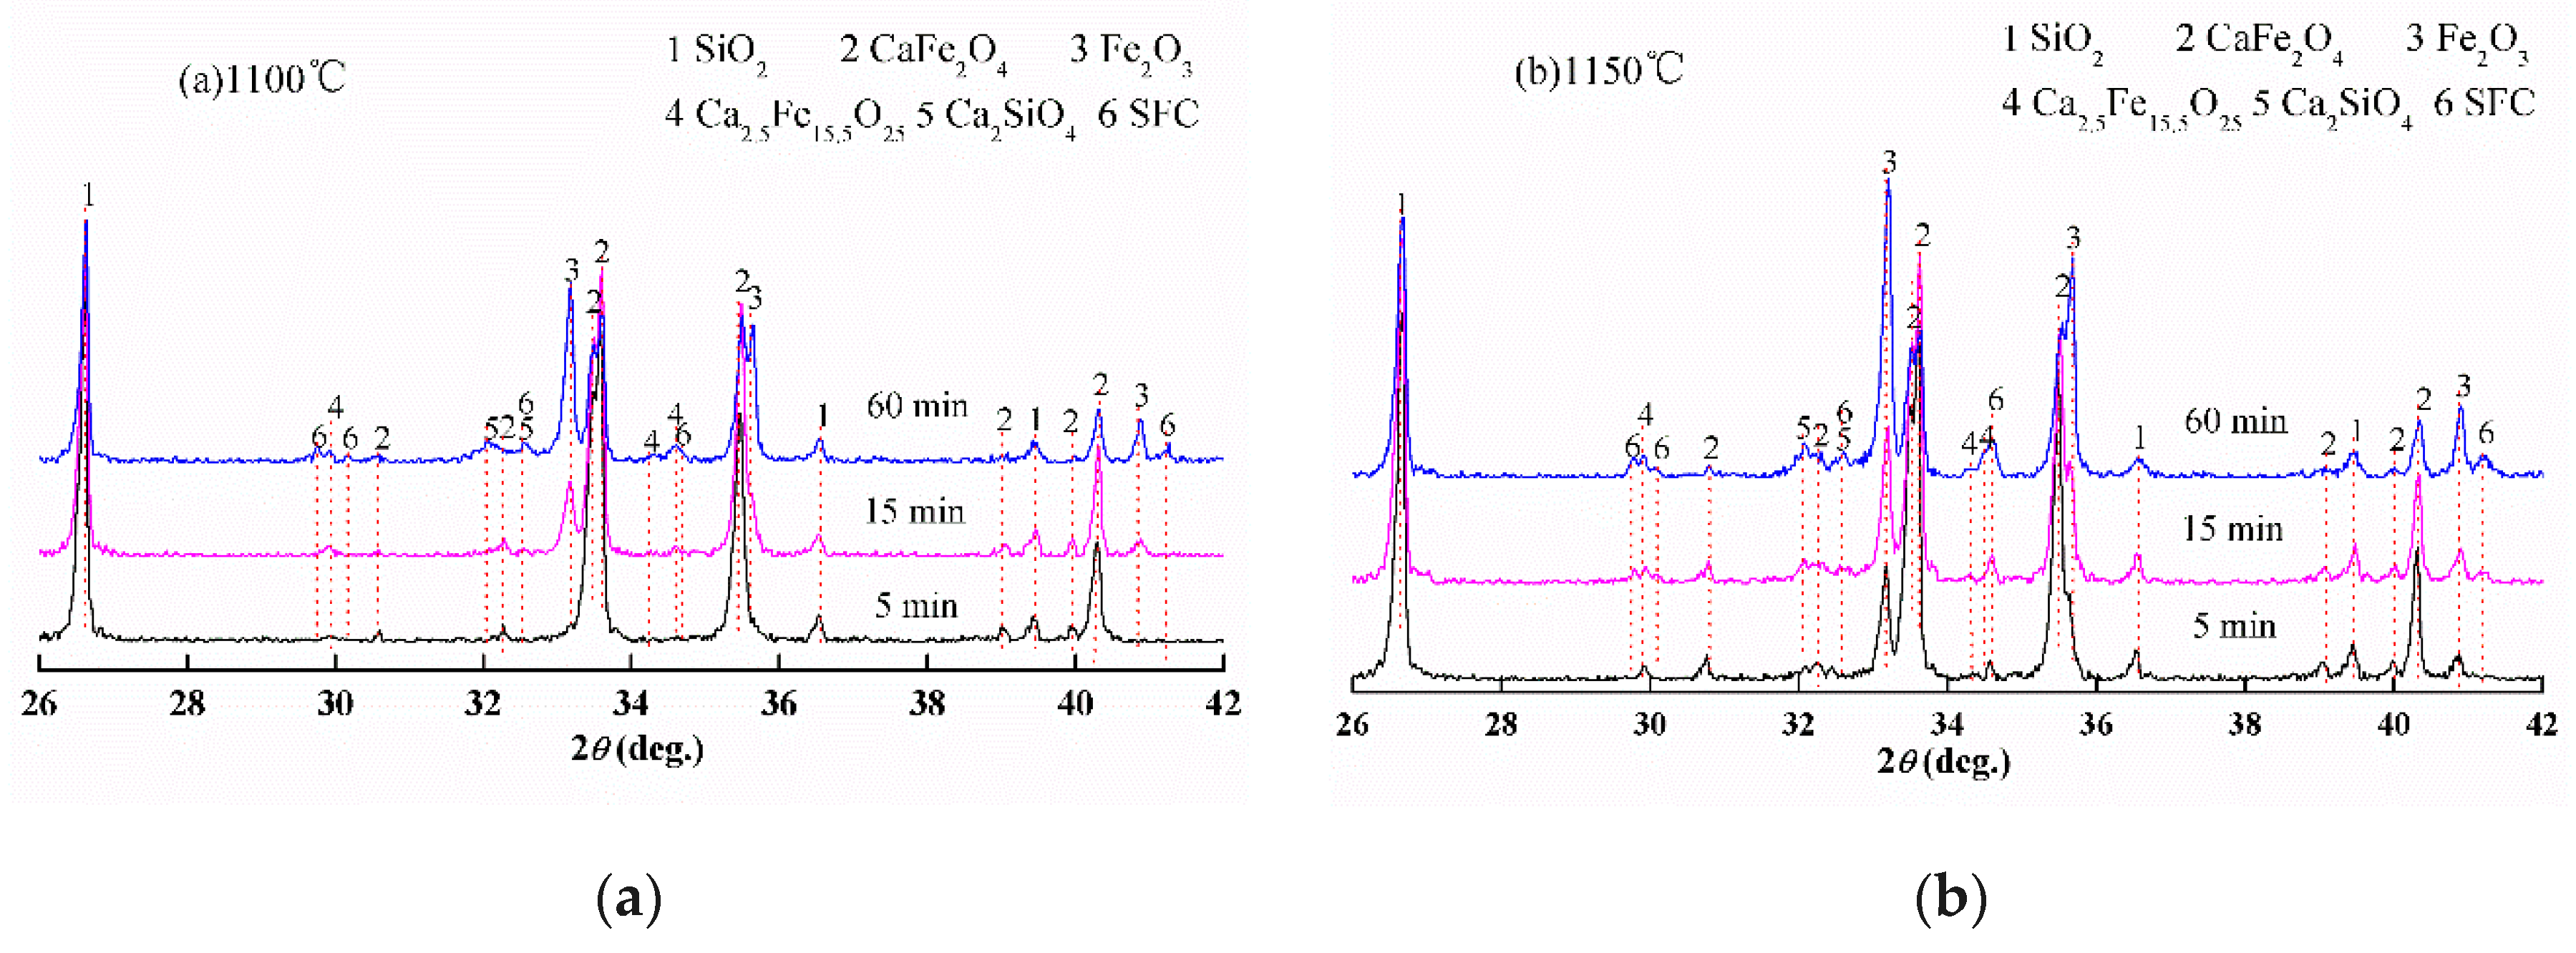
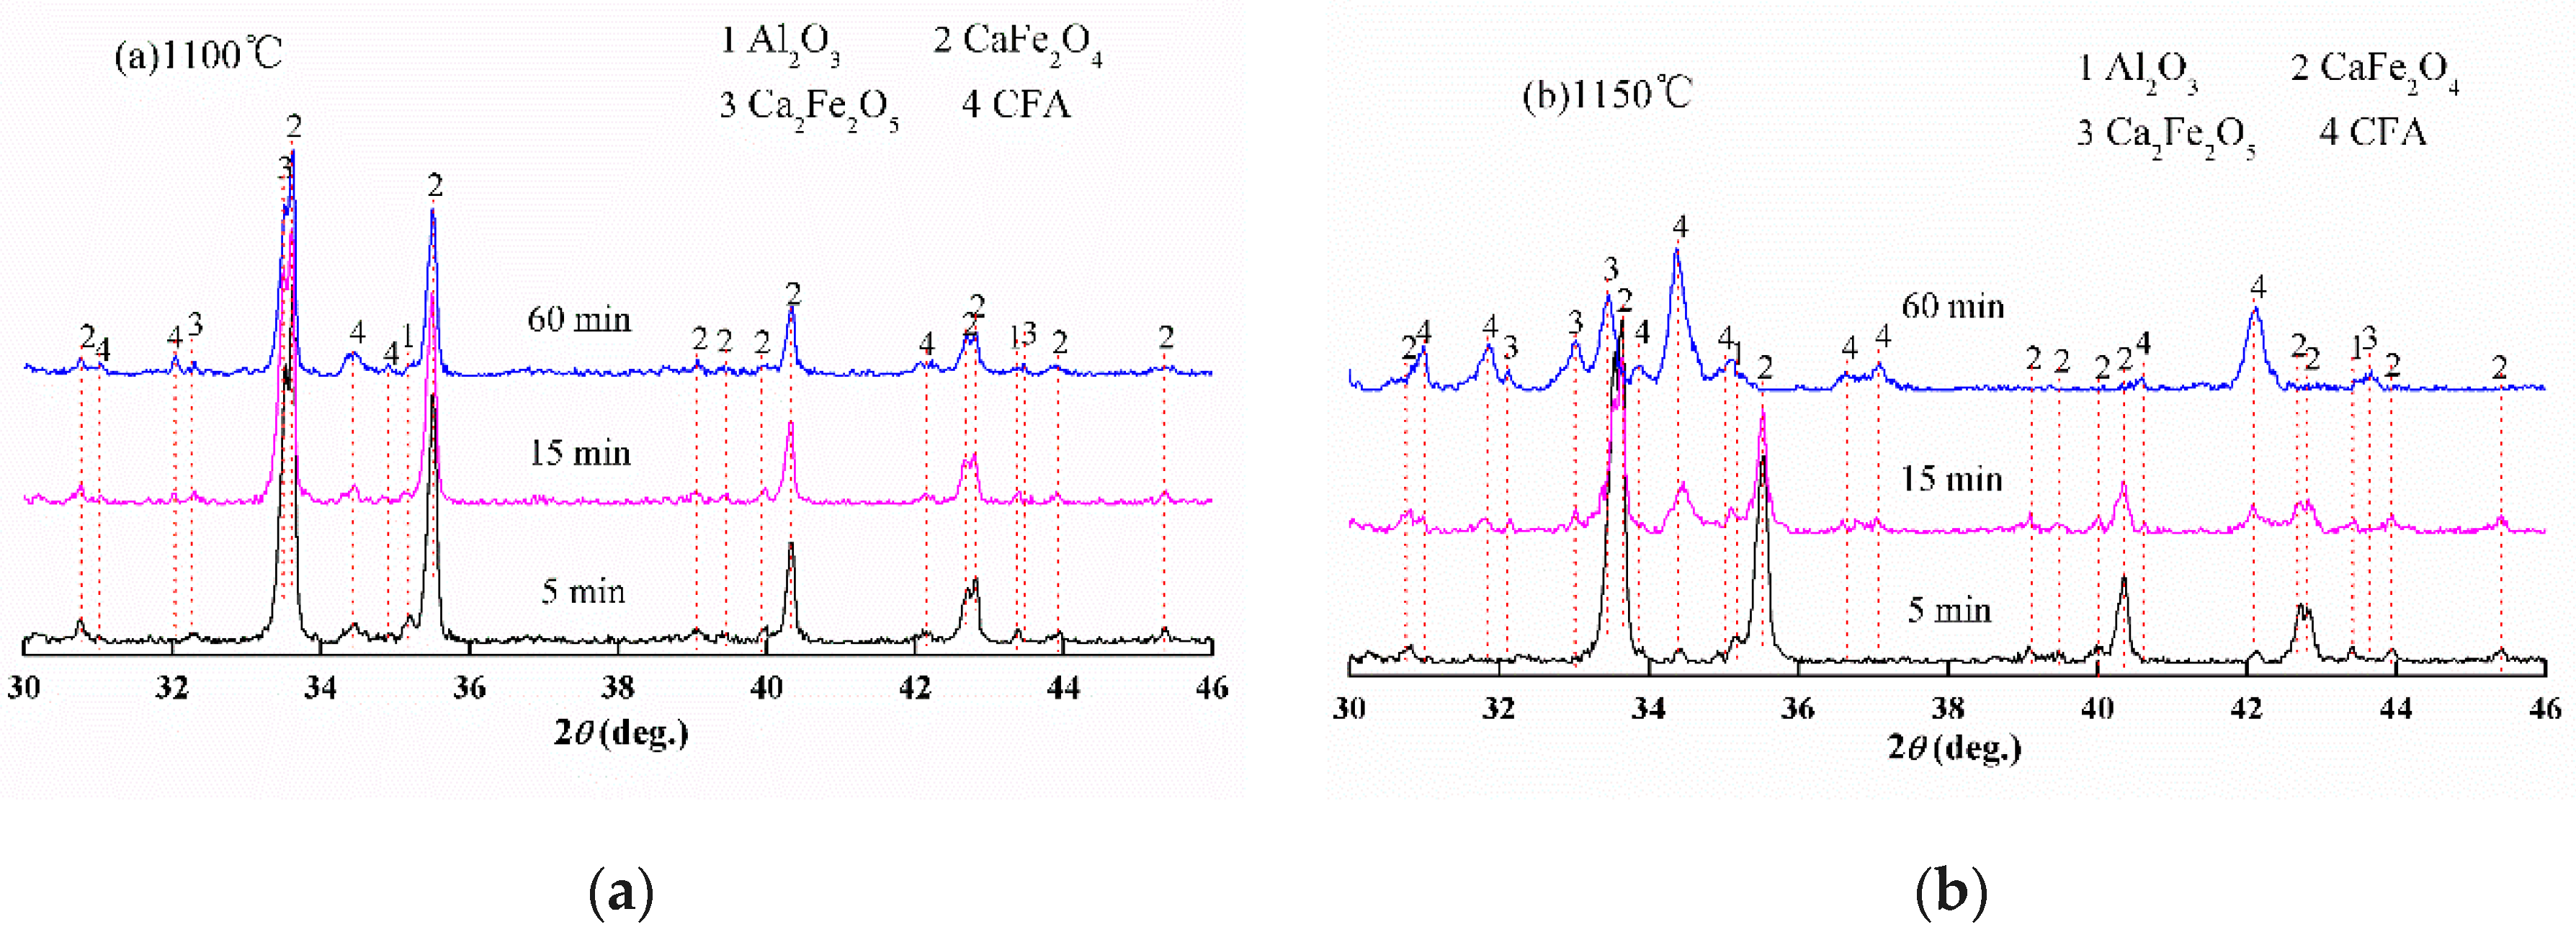
3.1. Reactions between CF and SiO2, CF and Al2O3

The XRD patterns of the reaction products between SiO2 and CF sintered at 1100 °C (a) and 1150 °C (b) for 5 min to 60 min are shown in Figure 1. The phases in each set of samples had been marked by different symbols. It can be seen that SiO2 and CF had not reacted for 5 min at 1100 °C in Figure 1a. The phases of Ca2SiO4 (C2S), Ca2.5Fe15.5O25 (CFF) and Fe2O3 appeared at 15 min. It indicated that the SiO2 reacted with CF to form C2S and Fe2O3, then Fe2O3 reacted with CF to form Ca2.5Fe15.5O25. The diffraction peak intensity of C2S and Fe2O3 increased with the time. It was difficult to find the diffraction peaks of SFC until the reaction time reached 60 min. The diffraction peak intensity of Fe2O3 and C2S increased with the reaction temperature which indicated that the reaction rate of SiO2 with CF was very fast. The diffraction peak intensity of SFC was not significant at the reaction temperature rising to 1150 °C. The generation rate of SFC was slow below 1150 °C. The XRD patterns of the reaction products between Al2O3 and CF sintered at 1100 °C (a) and 1150 °C (b) for 5 min to 60 min are shown in Figure 2. The diffraction peak of CFA and Ca2Fe2O5 (C2F) appeared as products at 1100 °C for 5 min as seen in Figure 2a. It indicated that Al2O3 can react directly with CF to form CFA and C2F, while SiO2 reacted with CF to form an intermediate C2S and Fe2O3. The appearance of the C2S layer inhibited the formation of SFC. Furthermore, the CFA phase appeared when the reaction temperature reached 1150 °C as shown in Figure 2b. The CF phase disappeared when the reaction time reached 60 min. Al2O3 reacted with CF to form CFA completely and the content of CFA reached its maximum.
To compare the generate rate of SFC and CFA under the same conditions, the Rietveld refinement method [26] was used to quantify the fractions of sintered products. The Rietveld refinement technique was an important method for the structure model to contact the actual structure through the GSAS [27] computer program. The pure phase of SFC and CFA were prepared according to Mumme’s research [8]. XRD patterns of SFC and CFA as shown in Figure 3, were used as crystal structure data for the Rietveld refinement. The crystal structure data of other mineral components were obtained from the Inorganic Crystal Structure Database (ICSD). The background was fitted with a sixth-order polynomial, and the peak shapes were described by pseudo-Voigt profiles.
The XRD data on the reaction of SiO2 and Al2O3 with CF at 1150 °C, respectively, were used for the refinement quantitative due to the lack of SFC formation at 1100 °C. The Rietveld refinement sample results of SiO2 and CF, Al2O3 and CF sintered at 1150 °C for different times are listed in Table 2. It can be seen that the measured pattern fitted well with the calculated pattern by the value of Rp and Rwp. The mass fraction of SFC increased from 2.7 to 9.8 within a timeframe of 5 min to 60 min, while the mass fraction of CFA increased from 7.5 to 57.7 within the same timeframe. The CF and SiO2 did not completely react while CF could not be detected after CF reacted with Al2O3 for 60 min. It indicated that Al2O3 reacted more easily with CF than SiO2 under the same experimental conditions. The generation rate of the CFA was faster than the SFC. Our past work [25] reported the effect of SiO2 on the formation process of SFC by solid-state reactions. Combined with previous research, the schematic diagram of the SiO2 reaction with CF and the Al2O3 reaction with CF is shown in Figure 4. The SiO2 and Al2O3 participated in the formation of calcium ferrites in different forms. The SiO2 and CF reacted to form Ca2SiO4 and Fe2O3 whilst Al2O3 and CF reacted to form the precursor CFA phase and C2F. That was due to the Ca2SiO4 (C2S) formed from the SiO2 and CF, and the C2S reacting with Fe2O3 or CF to form a small amount of SFC while the Al2O3 and CF formed directly to the CFA.

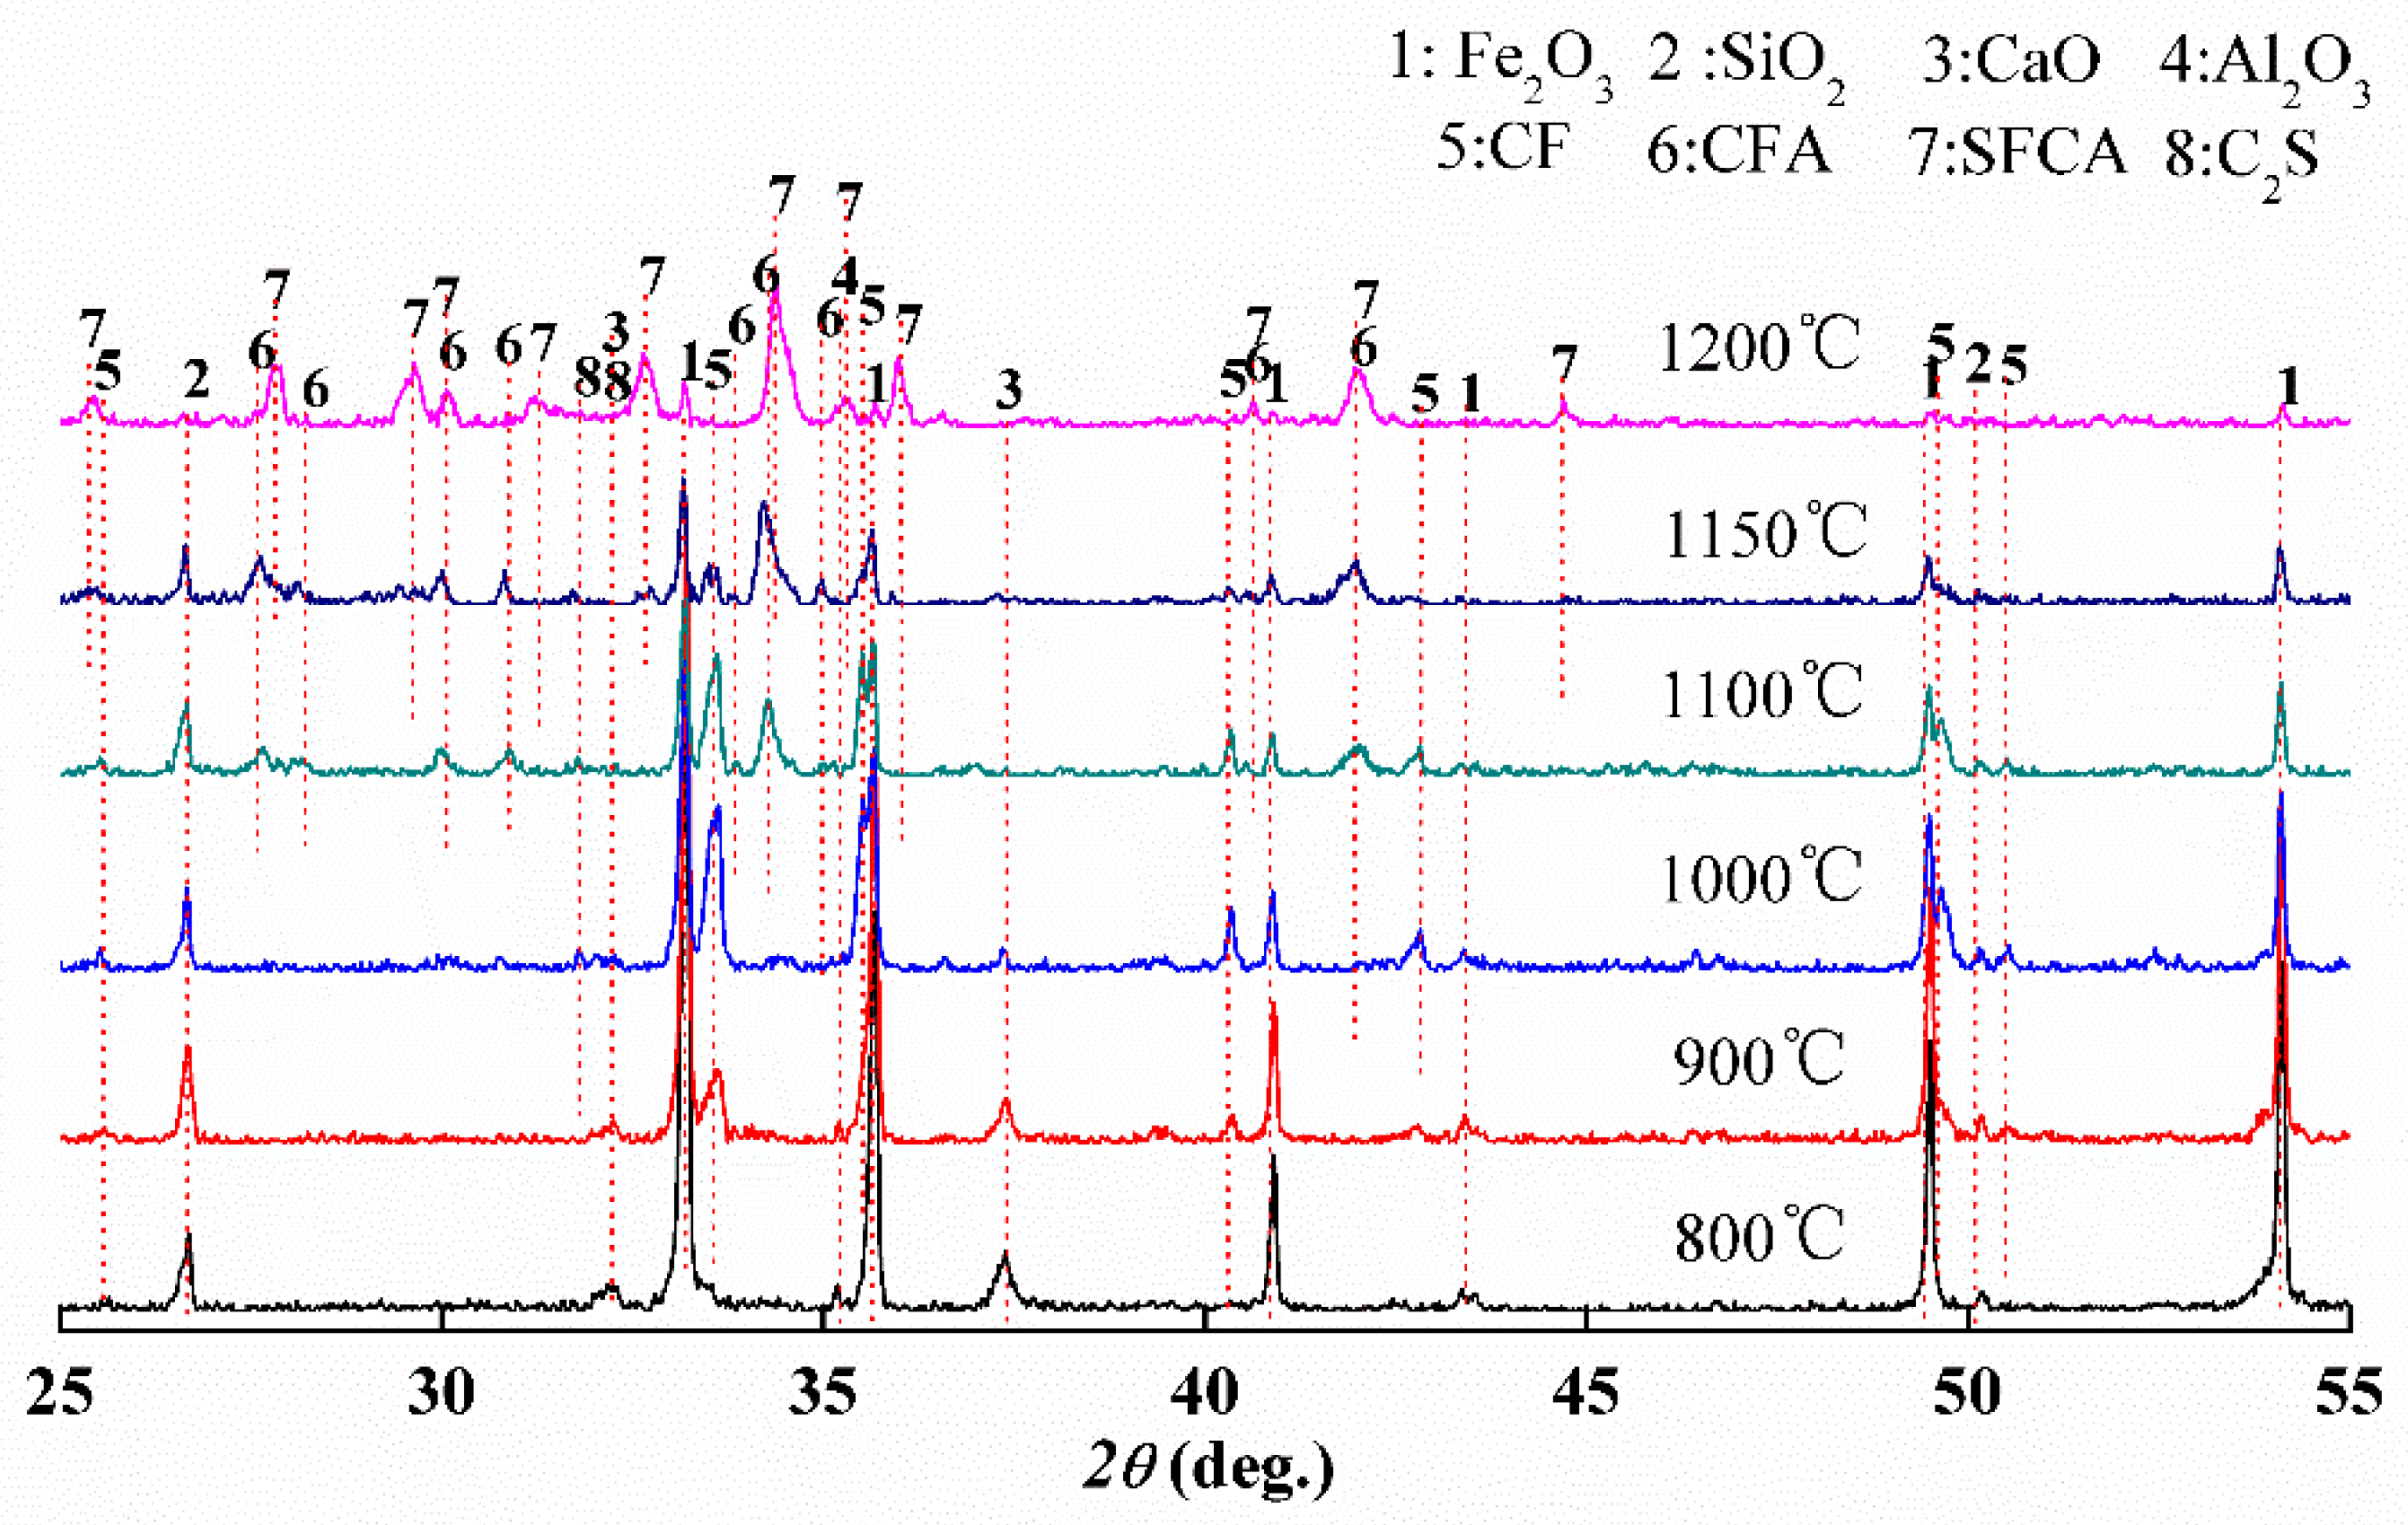
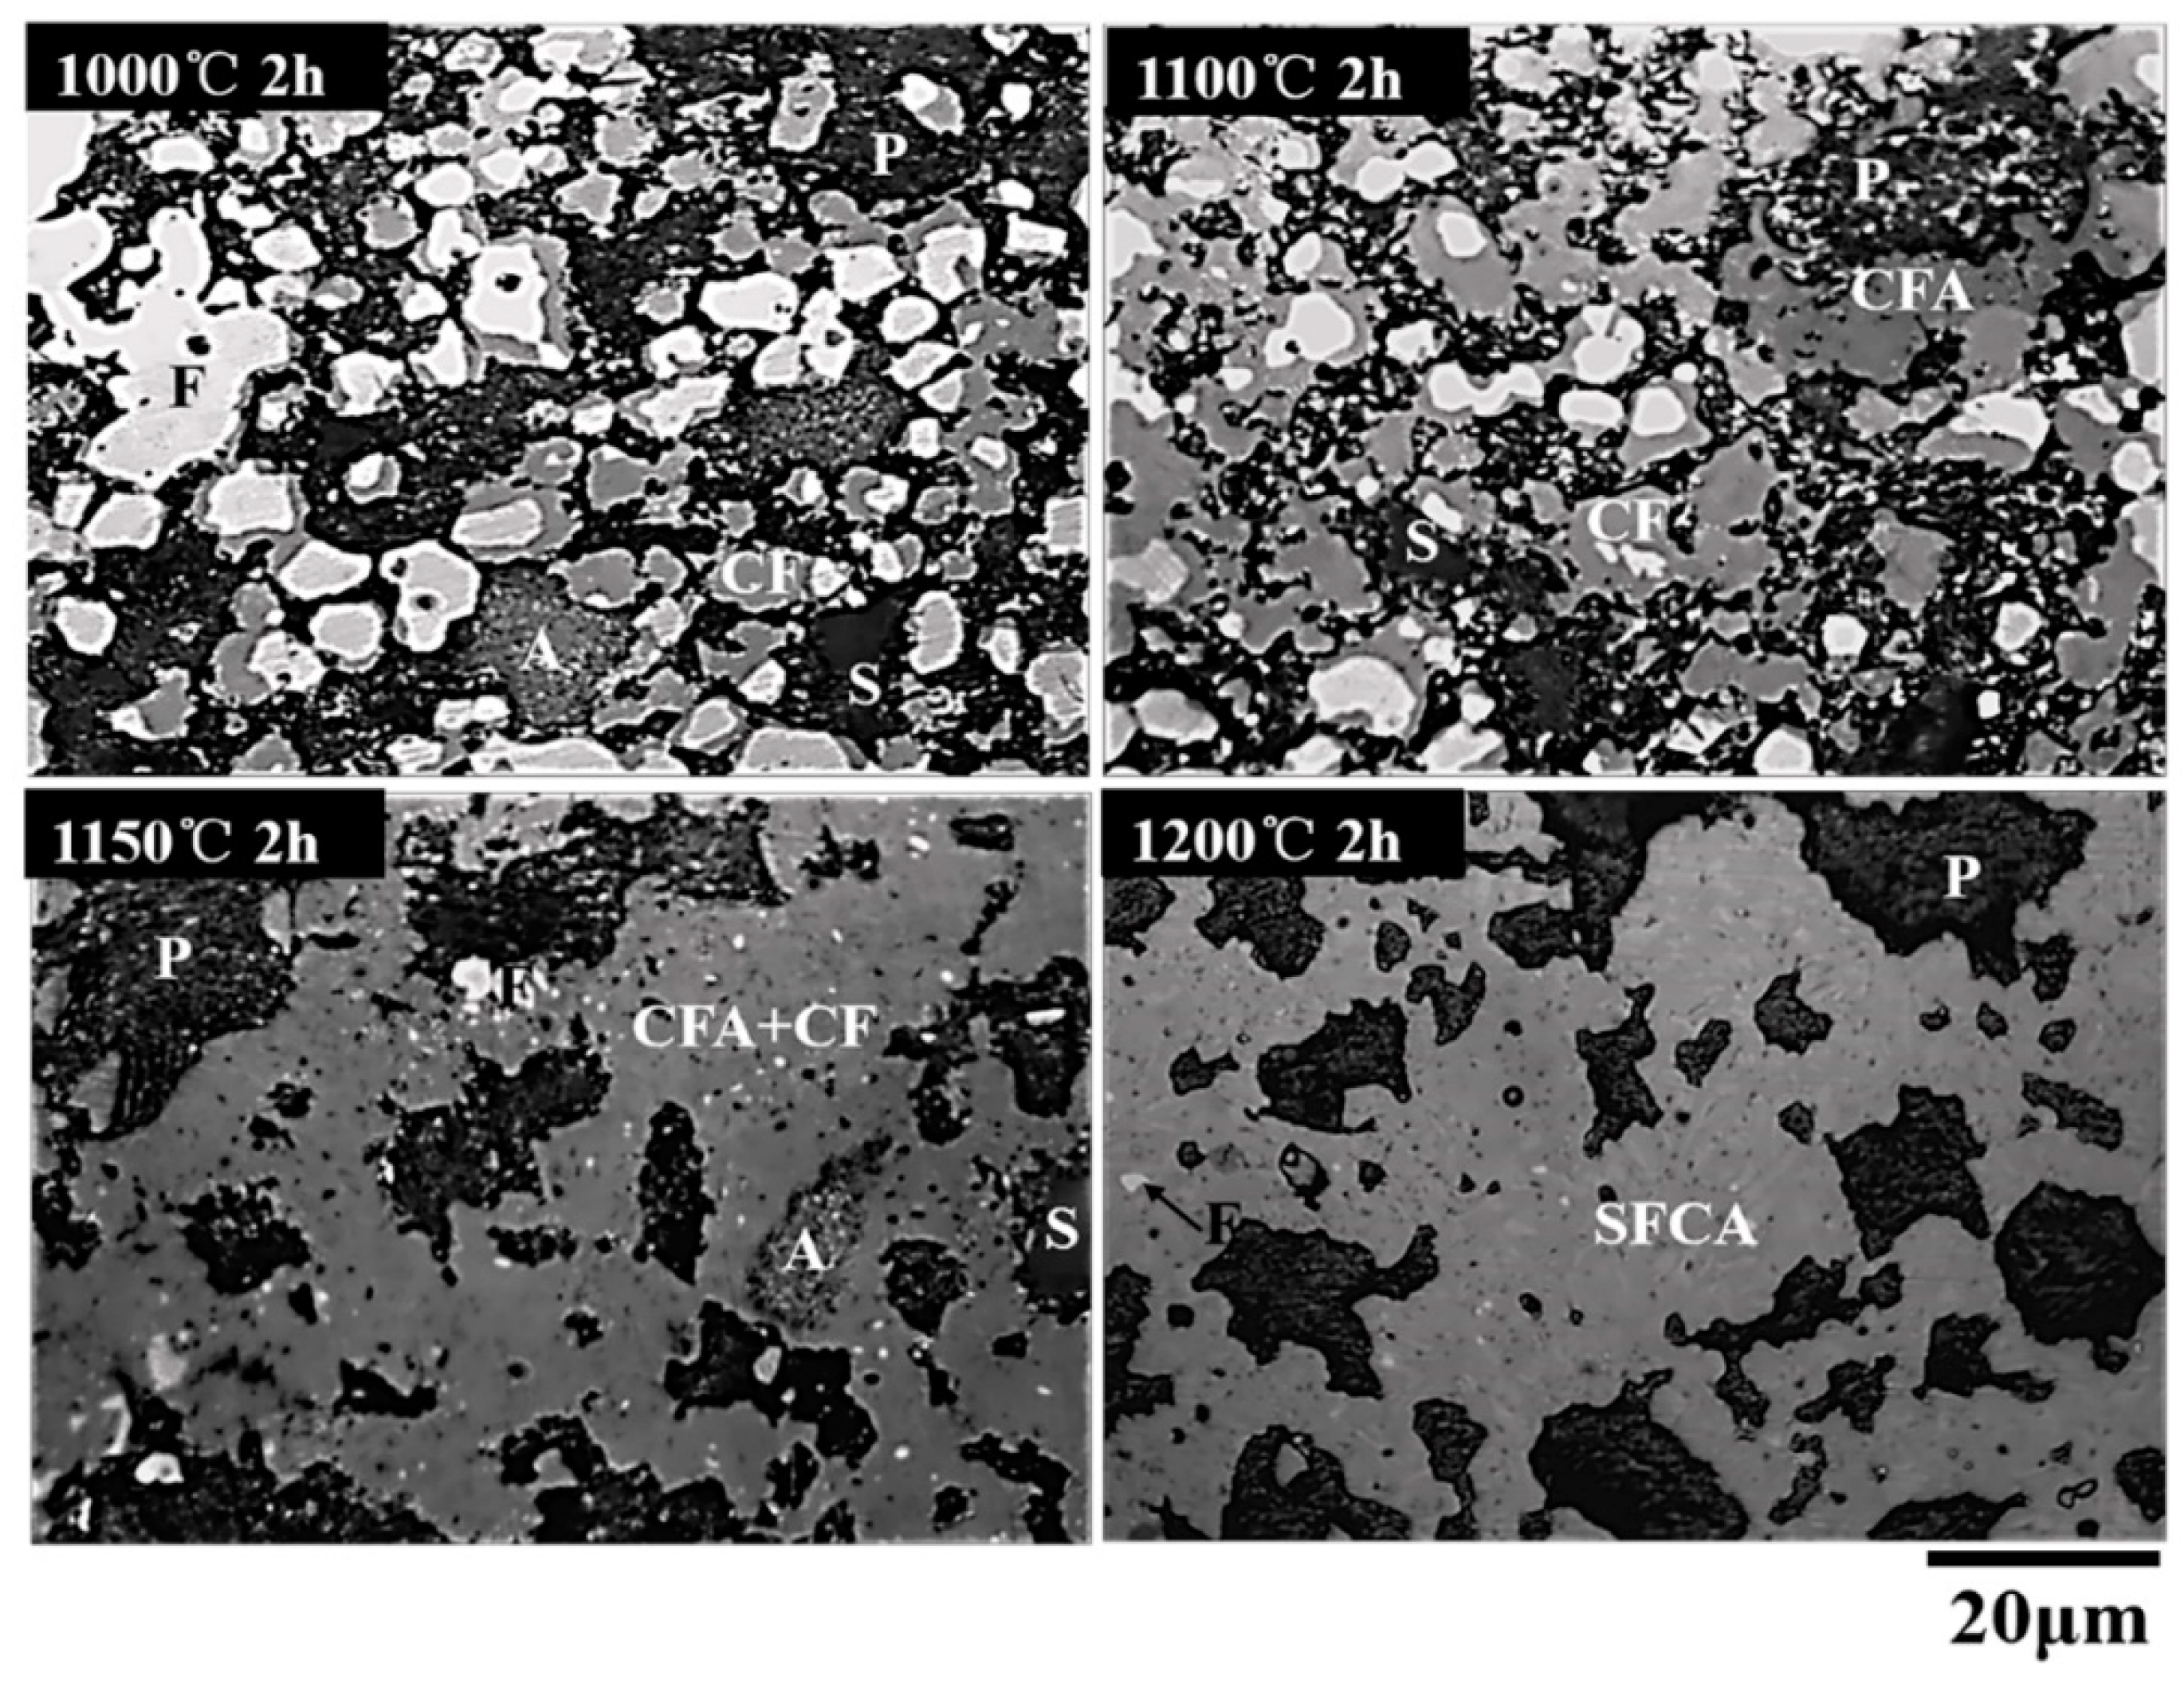
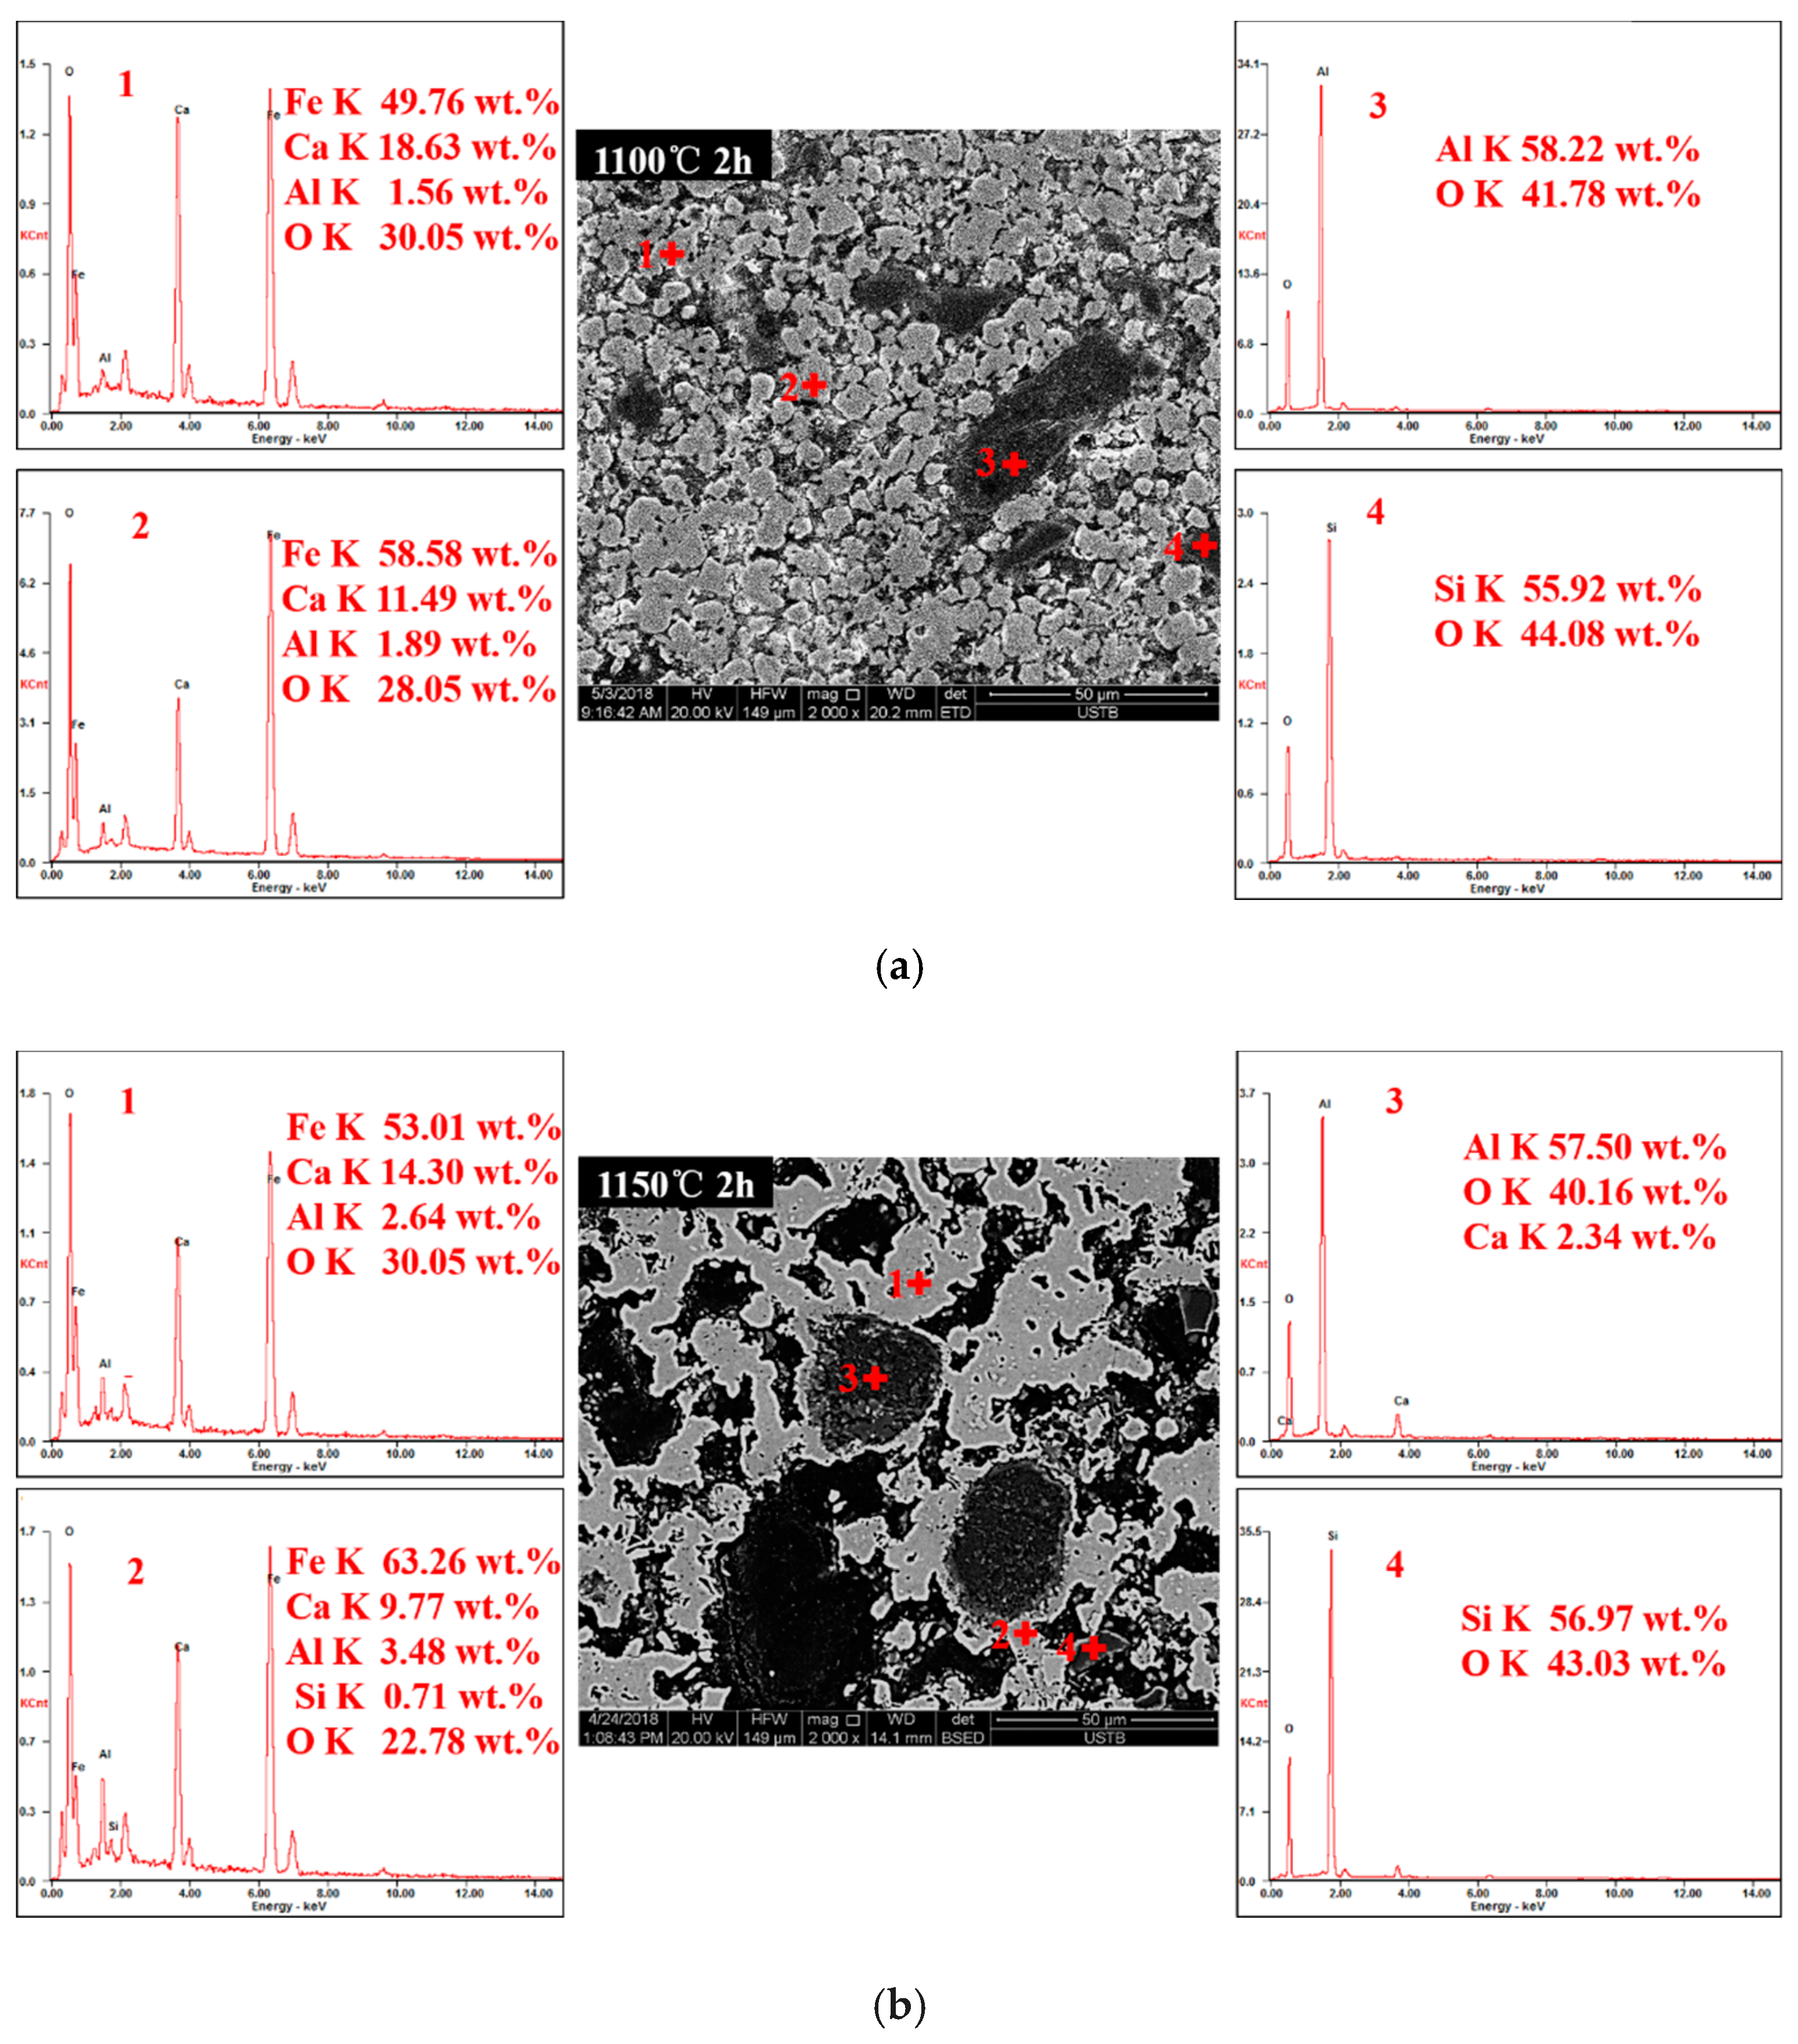
3.2. Phase Composition of Calcium Ferrites Formation with Temperature

The XRD patterns of sample C sintered at different temperatures for 2 h are shown in Figure 5. Different phases at each temperature are represented by numbers in the figure. It was difficult to observe the diffraction peak of C2F in the process of SFCA formation because the C2F transformed to CF at 2 h. Initially, the diffraction peak of CF appeared at 800 °C and then the diffraction approached the maximum at 1000 °C. Subsequently, the diffraction peak intensity of CF decreased while peak intensity of SiO2 remained unchanged. It indicated that the Al2O3 reacted with CF when the temperature was over 1000 °C. Additionally, SiO2 did not react with other phases when the temperature was below 1150 °C. The diffraction peaks of CFA transformed to SFCA as the diffraction peaks of SiO2 disappeared at 1200 °C. Therefore, it was deduced that the SiO2 participated in the formation of SFCA at 1150 °C. The microscopic photos of the quenched sample C, sintered at different temperatures are shown in Figure 6. Different mineral compositions could be distinguished by the reflectance of minerals. The CF was light grey, which was easy to distinguish from Fe2O3 at 1000 °C. As the temperature increased, dark grey CFA or SFCA began to appear.
The SEM images and EDS results of sample C sintered at 1100 °C (a) and 1150 °C (b) for 2 h are shown in Figure 7. It can be seen that the main phases (light gray area) were CaFe2O4 (a-1) and CFA (a-2) in Figure 7a. The aluminum entered into the calcium ferrites to form CFA, whilst the silicon was undetected in the calcium ferrites. The aluminum entered into the CFA in the form of Al3+ and replaced Fe3+ due to the same valence states and their similar ionic radius. The CFA (b-1) and SFCA (b-2) were observed when the temperature reached 1150 °C. It indicated that the silicon first entered into CFA at 1150 °C. Therefore, it was confirmed that the Al2O3 participated in the formation of SFCA at a lower temperature than the SiO2.

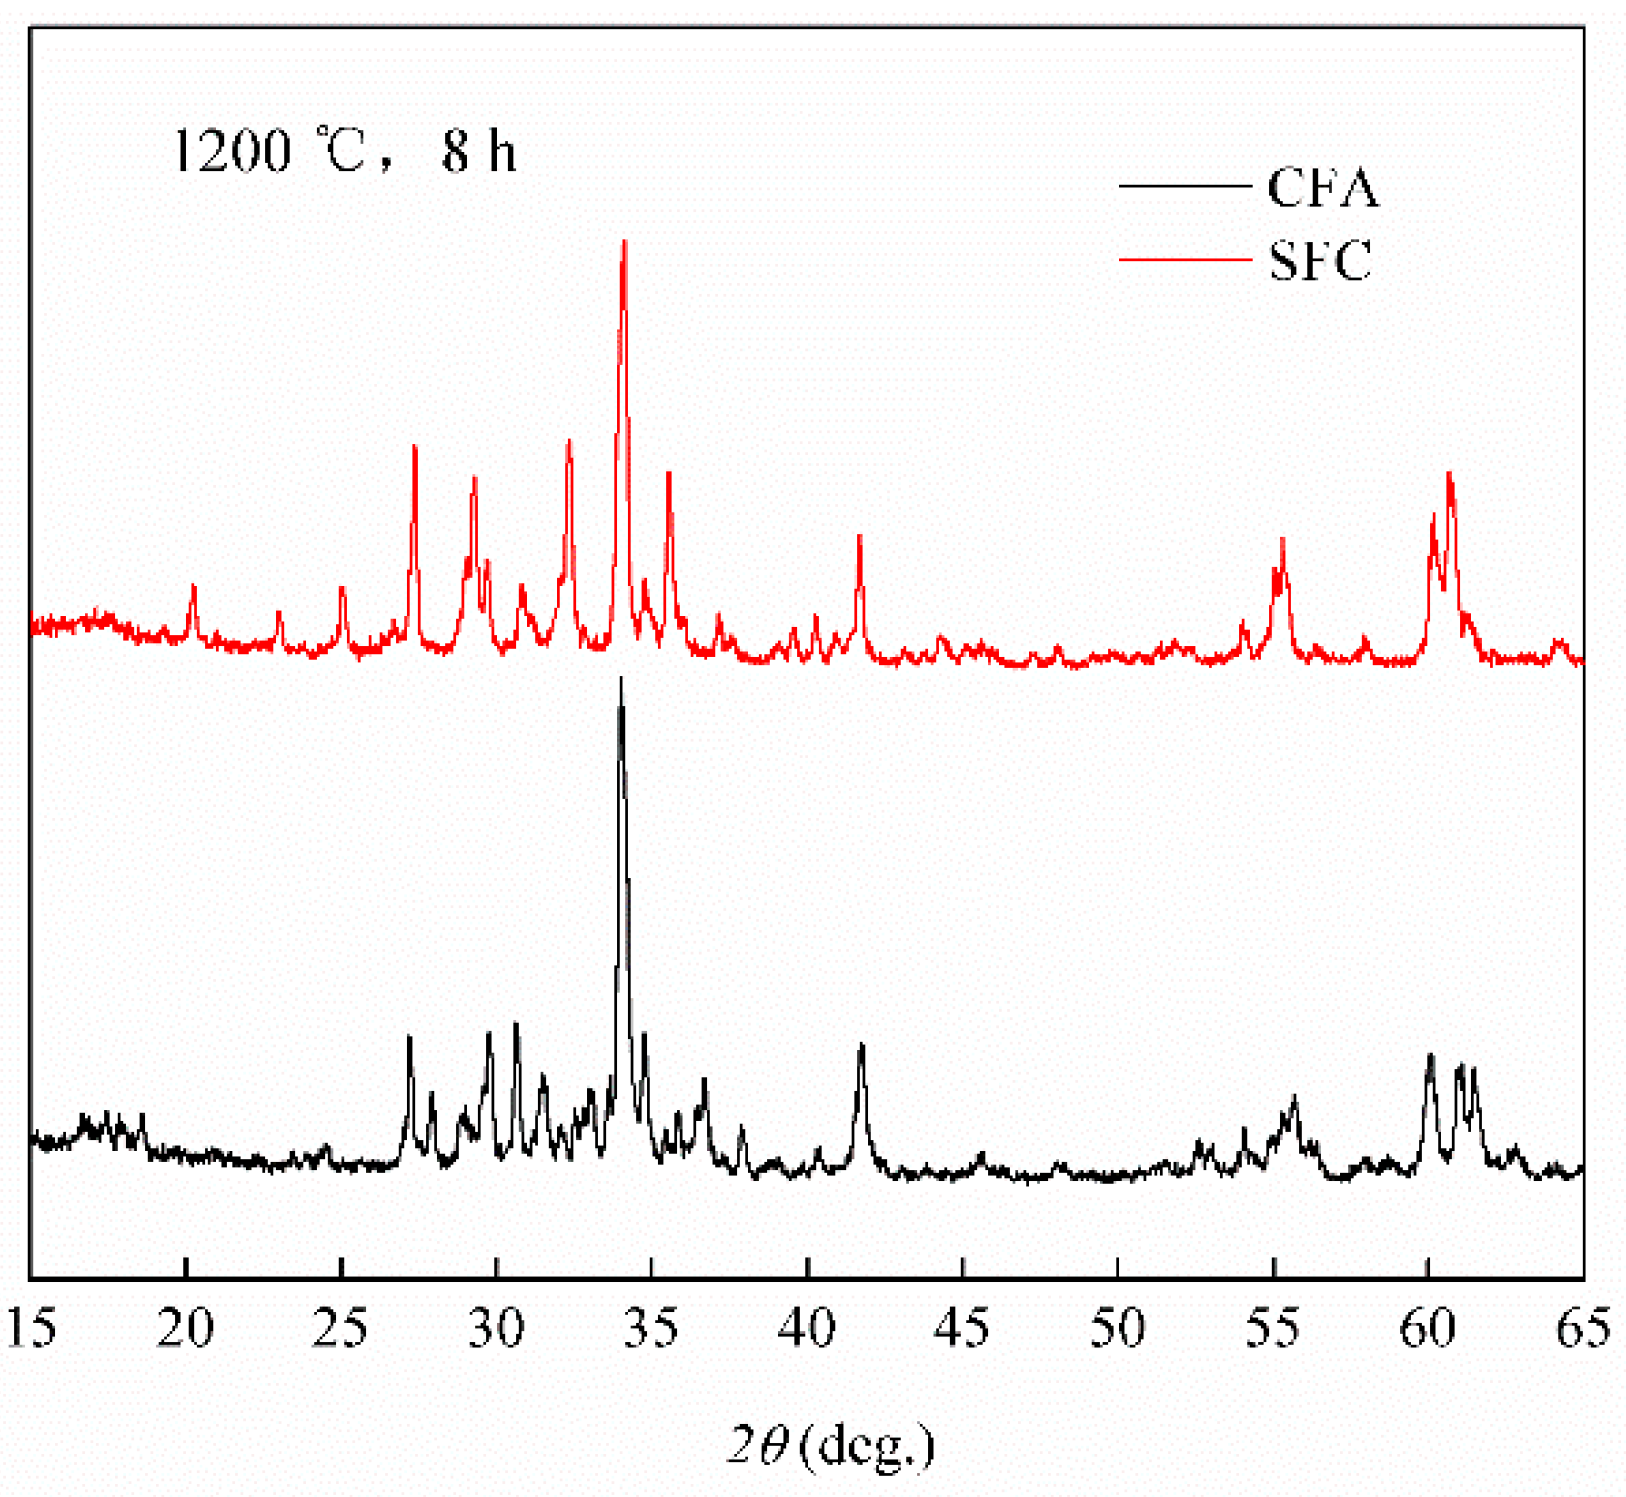
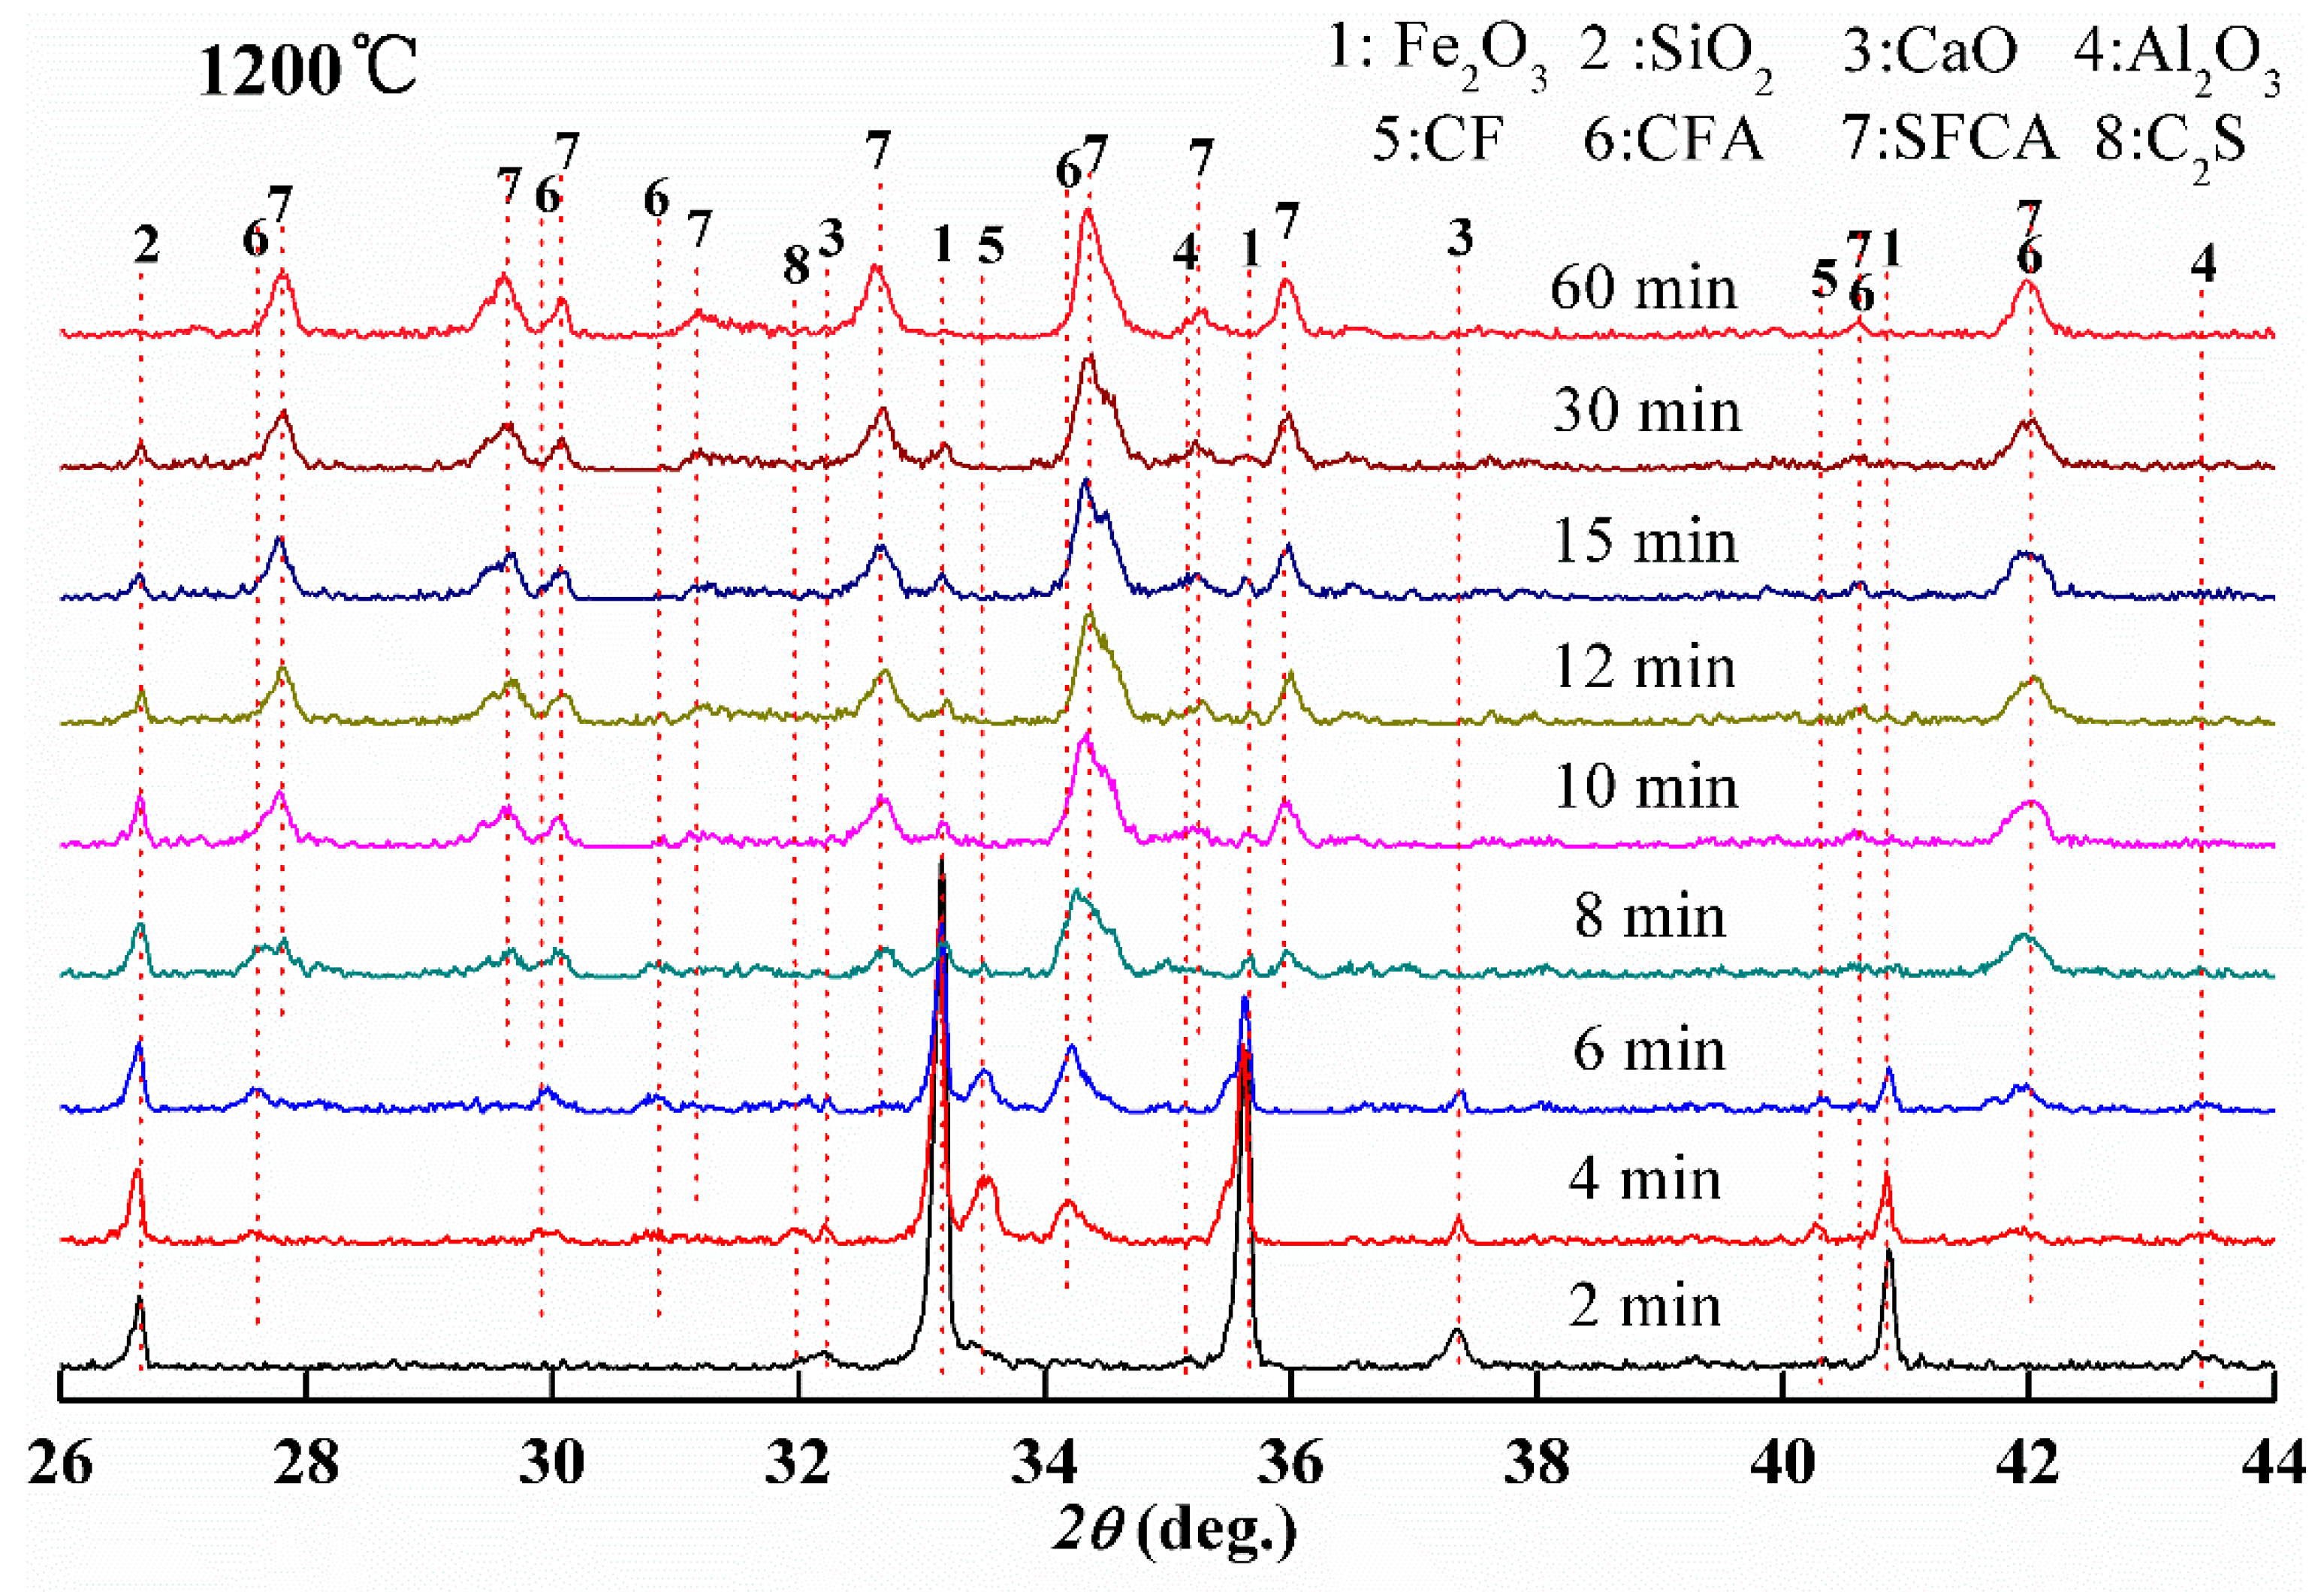
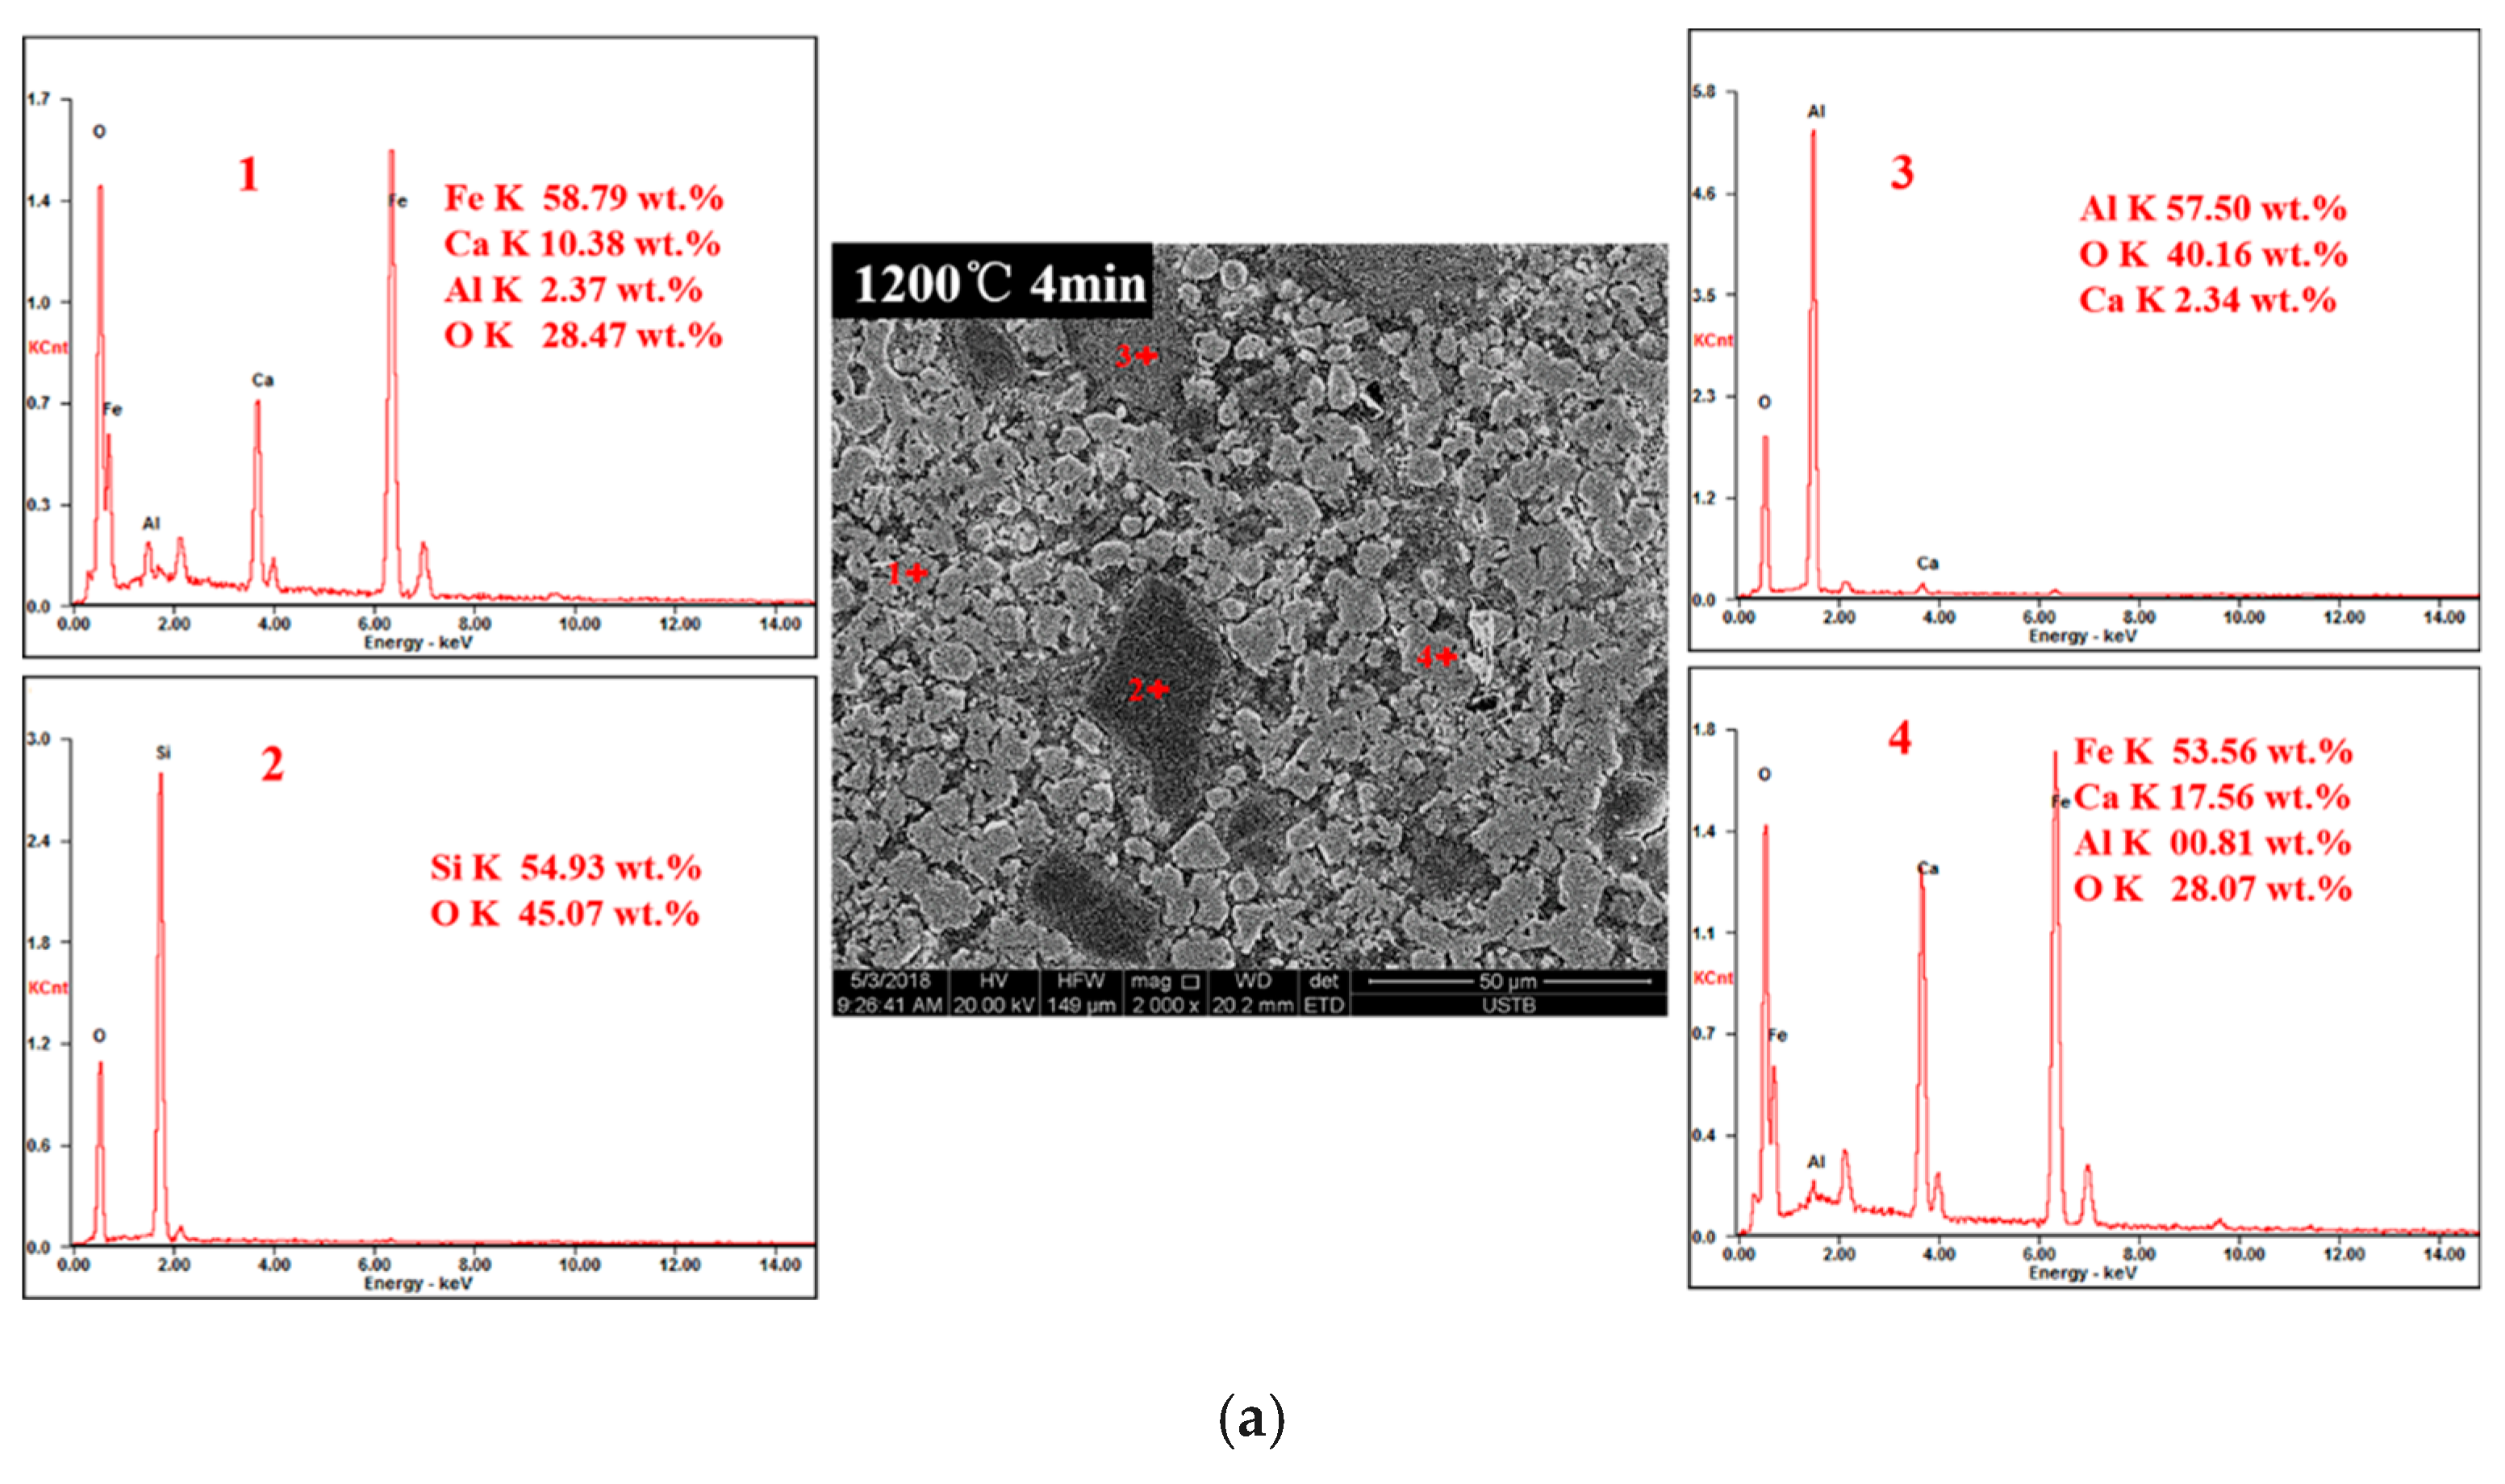
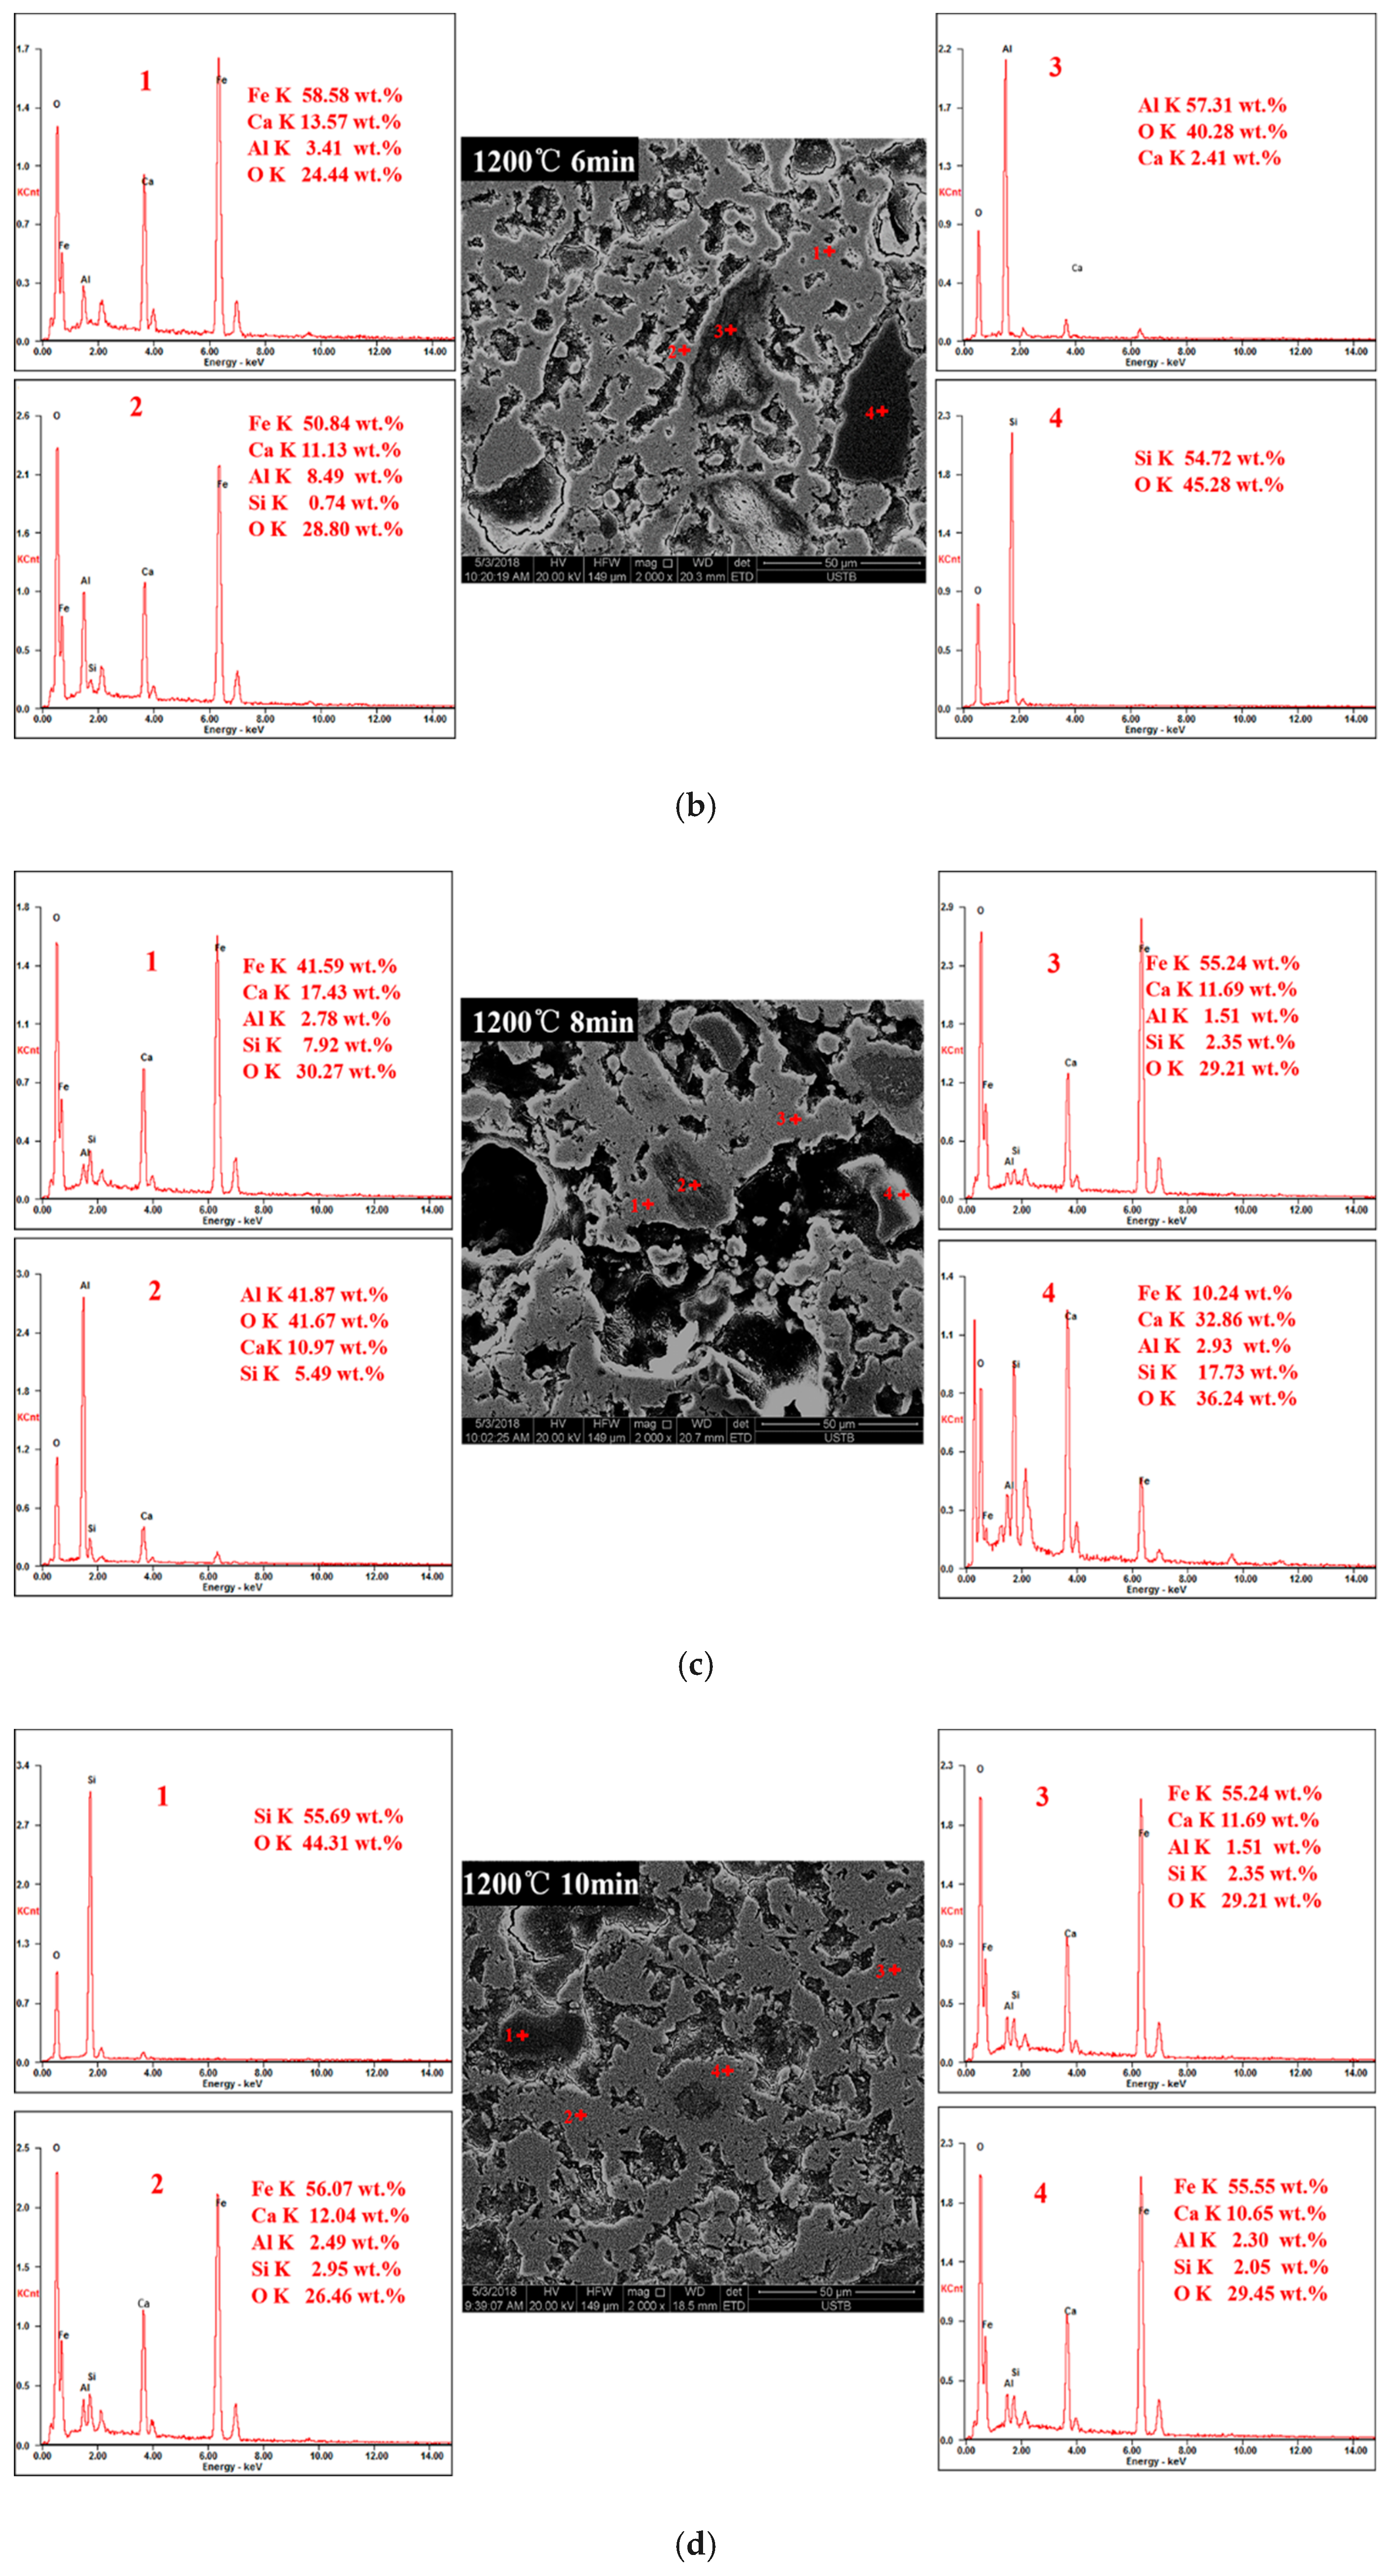
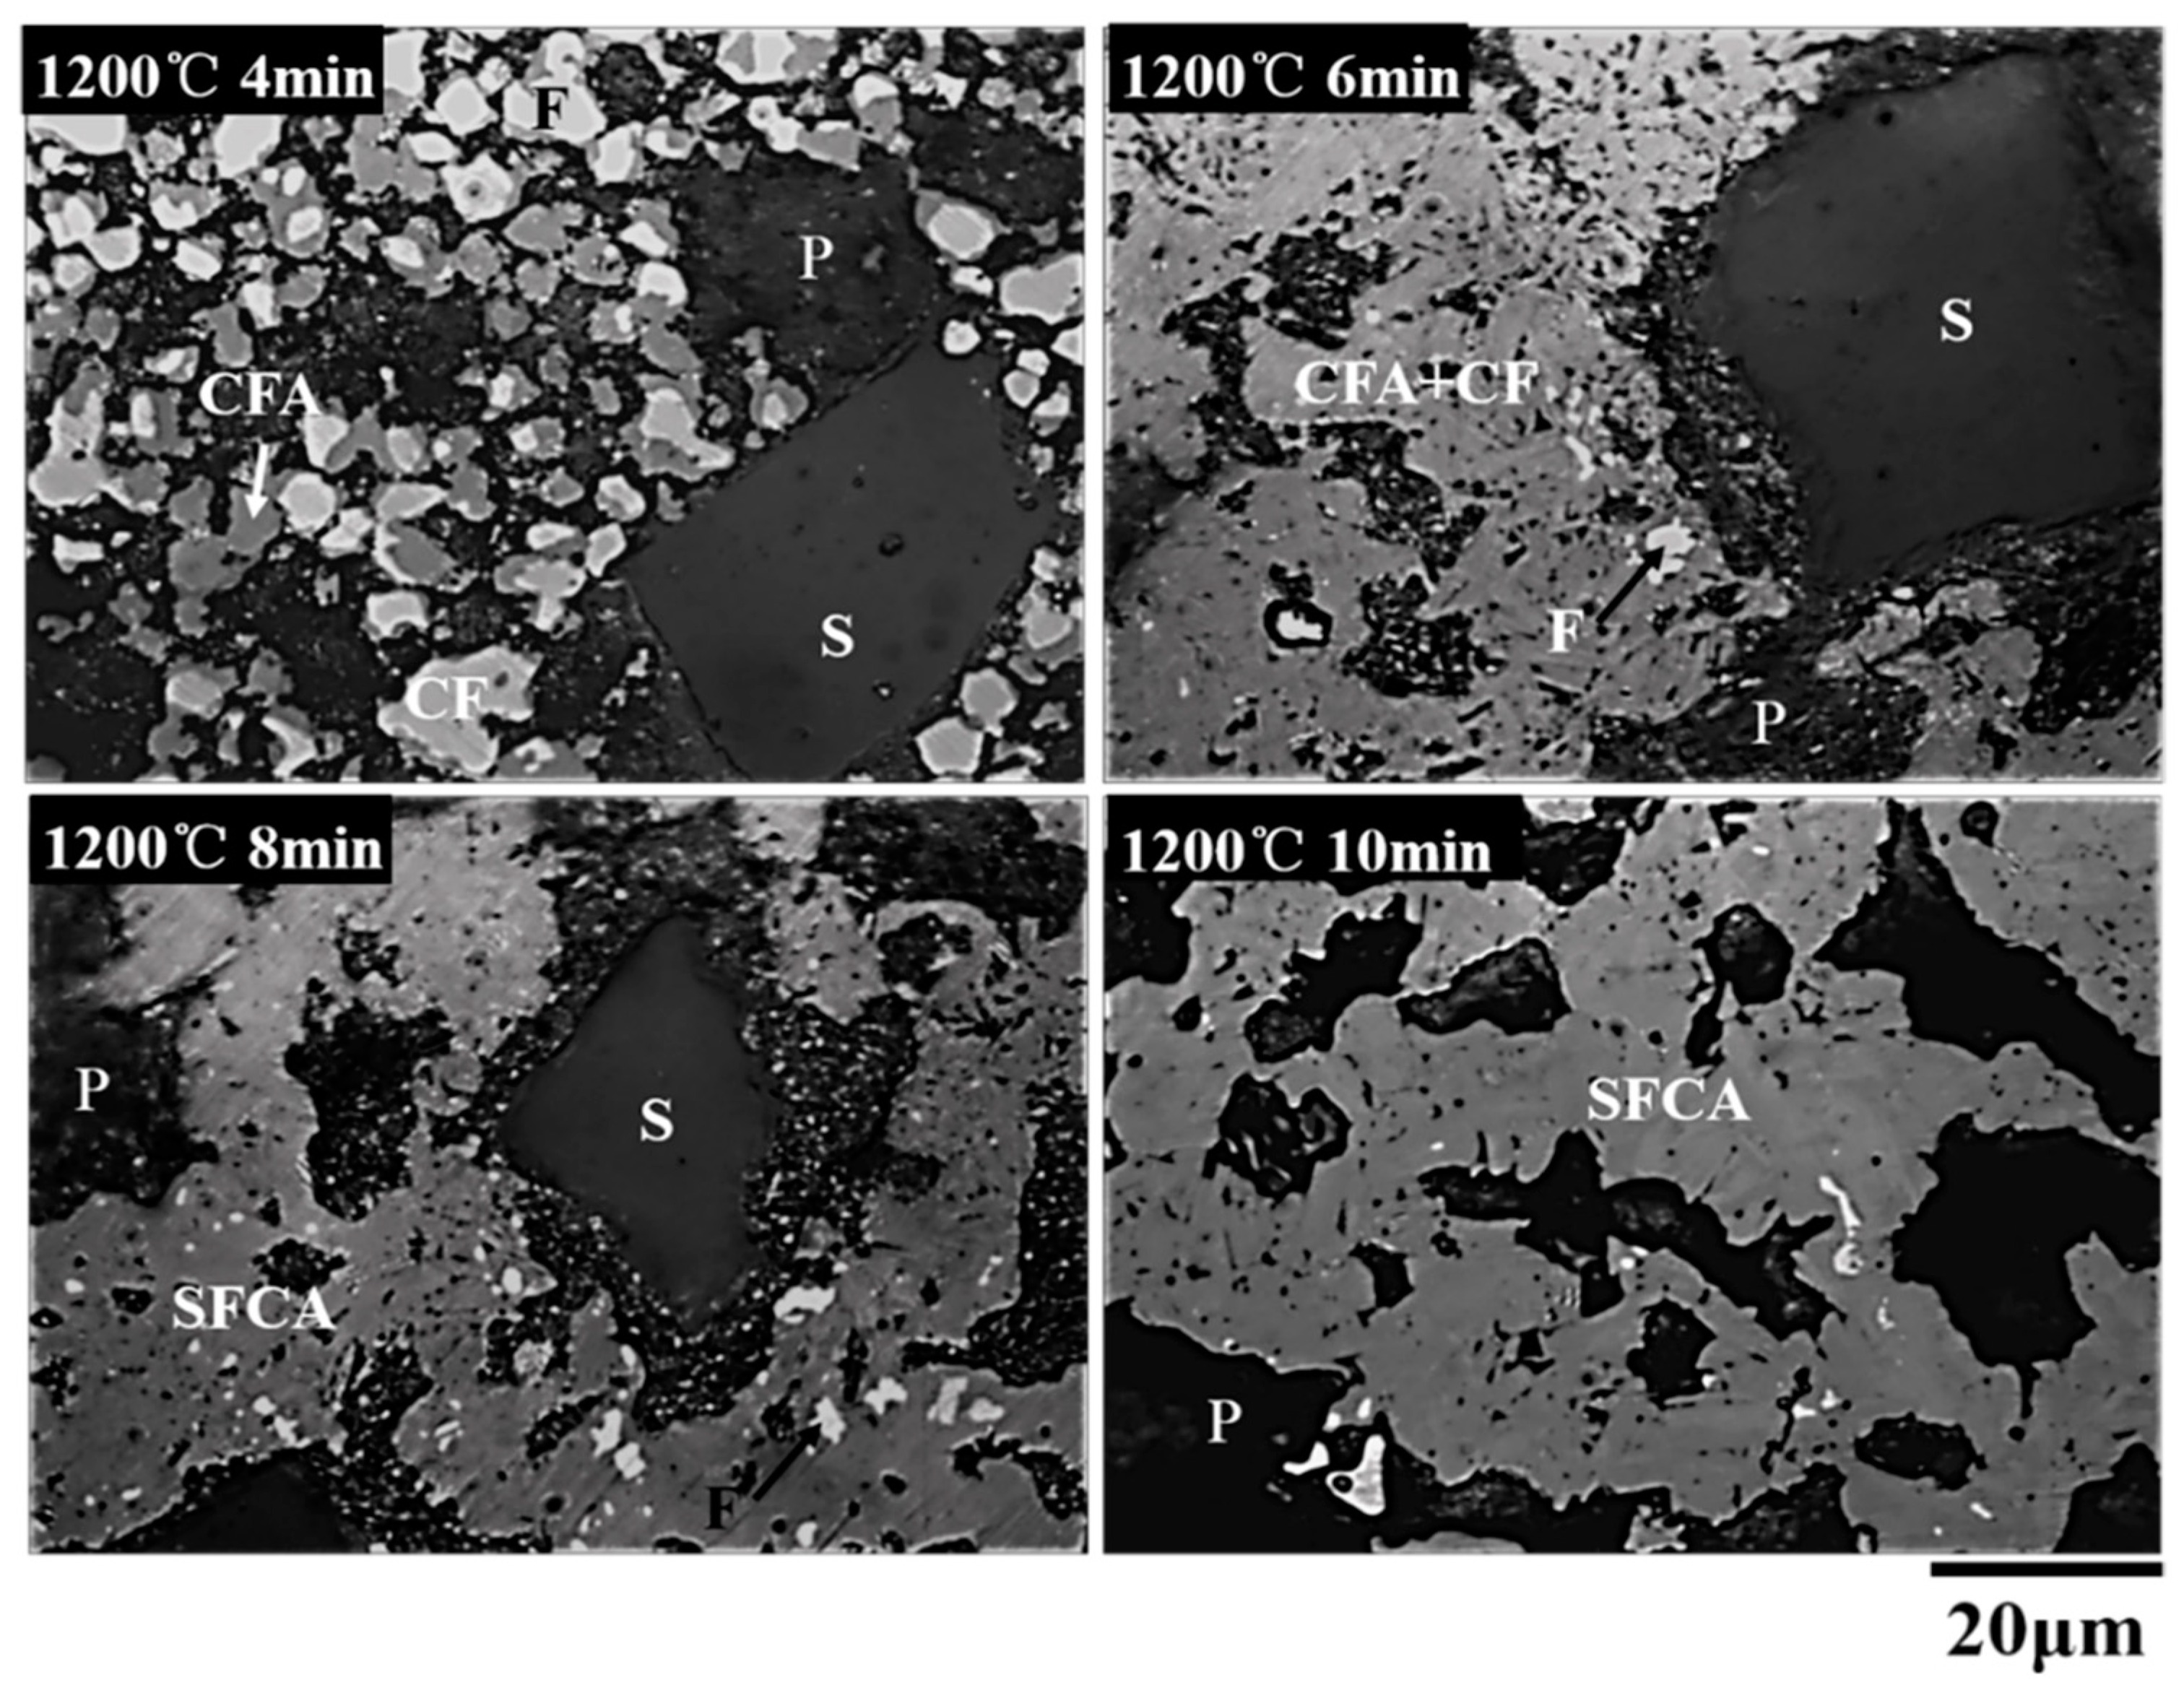
3.3. Order of Calcium Ferrite Formation with Time at 1200 °C

The XRD patterns of sample C sintered at 1200 °C at different times are shown in Figure 8. It can be seen the CF first appeared at 2 min, and the CFA phase appeared when the time reached 4 min, while the diffraction peak intensity of SiO2 was unchanged. The Al2O3 reacted with CF to form CFA as the reaction time increased. The diffraction peak intensity of SiO2 was unchanged until the appearance of SFCA at 8 min when Fe2O3 reacted almost completely with CaO to form CF. The CFA peak at 32.15° gradually transformed to a high angle as a small amount of Si4+ dissolved into CFA during the timeframe from 6 min to 10 min. The diffraction peak position of CFA was similar to that of SFCA due to their similar crystal structure. The diffraction peaks (34.25°) widened due to the superposition of the CFA and SFCA peaks. The diffraction peak position of 32.7°and 35.9° were clearly distinguished between CFA and SFCA. The SiO2 continuously dissolved into SFCA, resulting in that the diffraction peak position of SFCA also gradually transformed to a higher angle. The deflection of the diffraction peak was due to smaller size Si4+ (radius, 0.040 nm) substituted for Fe3+ (radius, 0.064 nm) or Al3+ (radius, 0.054 nm).
Under experimental conditions, the SFC, CFA and SFCA were considered thermodynamically stable. Ding [10] compared the Gibbs free energy of SiO2 and Fe2O3 reacting with CaO respectively. Ca2SiO4 had a greater negative value comparing with that of the formation reaction of CF. SiO2 would react with CaO to form Ca2SiO4 before the formation of SFCA. The formation of the Ca2SiO4 layer inhibited contact between SiO2 and CF, thus inhibiting the formation of SFC. However, Al2O3 reacted directly with CF to form CFA. Al3+ replaced Fe3+ into calcium ferrite due to their identical valence states and similar ionic radius. Subsequently, Si4+ diffused into CFA and dissolved into CFA to form SFCA.
The microscopic photos of sample C sintered at 1200 °C at different times are shown in Figure 9. SiO2 participated in the formation of SFCA after CF and CFA formed. It can be seen that the surface of SiO2 gradually decomposed, and SiO2 slowly reacted with the surrounding CFA or CF.
The SEM images and EDS results of sample C sintered at 1200 °C at different times are shown in Figure 10. The CFA phase was detected at 4 min in Figure 10a1. The aluminum content in CFA increased when reaction time reached 6 min as shown in Figure 10b1,b2. The SiO2 had a relatively complete profile and was not detected in calcium ferrites. The SiO2 did not react with the surrounding CF whilst Al2O3 gradually dissolved into CF to form CFA. The SiO2 participated in the formation of SFCA at 8 min, and the external profile of SiO2 gradually blurred. The SiO2 began to react with the surrounding CaO and CF to form Ca2SiO4. When the silicon entered into the CFA, it prompted the transformation from the CFA phase to the SFCA phase. At 10 min, Al2O3 was hard to be observed whilst the SiO2 still existed. The silicon content in SFCA increased more at 10 min than 8 min. It indicated that the Si4+ continuously entered into the SFCA crystal structure. The Al2O3 participated in the formation of SFCA earlier in the form of CFA in the Fe2O3–CaO–Al2O3–SiO2 system whilst SiO2 promoted the transformation of CFA to SFCA in the form of dissolving into SFCA after the formation of CFA. As mentioned in the previous section, Ca2SiO4 was used as a precursor for SiO2 to participate in the SFCA reaction, whilst Al2O3 reacted directly with CF to form CFA. The generation rate of the CFA was faster than SFC, resulting in CFA becoming the main precursor in the formation process of SFCA. The SFC had not been detected, indicating that silicon dissolved into CFA before the formation of SFC. The Al2O3 promoted the transformation from the orthogonal crystal structure to the triclinic crystal structure, which provided the structural basis for the silicon dissolving.

4. Conclusions

To investigate the competitive effects of Al2O3 and SiO2 on the formation process of silico-ferrite of calcium and aluminum (SFCA) by solid-state reactions, SiO2 and CF, Al2O3 and CF reactions were carried out at 1100 °C and 1150 °C in different timeframes. The quantitative method of Rietveld refinement was used to calculate the amount of SFC and CFA at 1150 °C. The experiments on the SFCA formation mechanism with different temperatures and different times were carried out in a resistance furnace. The results are summarized as follows:
(1)
Al2O3 reacted with CF to form CFA and C2F, while SiO2 initially reacted with CF to form Ca2SiO4 and Fe2O3 before SFC; the reaction rate of CFA formation is faster than that of SFC under the same conditions.
(2)
The CFA as a precursor participated in the SFCA formation at 1100 °C, while SiO2 participated in the SFCA formation until the temperature reached 1150 °C.
(3)
Al2O3 participated in the formation of SFCA in the form of CFA, while SiO2 dissolved into CFA and promoted the formation of SFCA.

Author Contributions

F.L. is a doctor candidate to do the formal analysis, investigation, data curation and writing—original draft preparation, and X.-M.G. is a supervisor to do the conceptualization, methodology, resources, supervision, project administration, funding acquisition and writing—review and editing for this study.

Funding

The authors would like to express their gratitude towards the National Natural Science Foundation of China for their financial support (No.U1460201, No. 51374017, No. 51774029).

Conflicts of Interest

The authors declare no conflict of interest.

References

  1. Frazer, F.W.; Westenberger, H.; Boss, K.H.; Thumm, W. The relationship between basicity and swelling on reduction of iron-ore pellets. Int. J. Miner. Process. 1975, 2, 353–365. [Google Scholar] [CrossRef]
  2. Hsieh, L.H.; Whiteman, J.A. Effect of oxygen potential on mineral formation in lime-fluxed iron ore sinter. ISIJ Int. 1989, 29, 625–634. [Google Scholar] [CrossRef]
  3. Patrick, T.R.C.; Lovel, R.R. Leaching dicalcium silicates from iron ore sinter to remove phosphorus and other contaminants. ISIJ Int. 2001, 41, 128–135. [Google Scholar] [CrossRef]
  4. Choudhary, M.K.; Bhattacharjee, D.; Bannerjee, P.S.; Lahiri, A.K. Effect of variation of alumina on development of phases during iron ore sintering. ISIJ Int. 2008, 48, 1804–1806. [Google Scholar] [CrossRef]
  5. Cores, A.; Babich, A.; Muñiz, M.; Ferreira, S.; Mochon, J. The influence of different iron ores mixtures composition on the quality of sinter. ISIJ Int. 2010, 50, 1089–1098. [Google Scholar] [CrossRef]
  6. Inoue, K.; Ikeda, T. The solid solution state and the crystal structure of calcium ferrite formed in lime-fluxed iron ores. Tetsu-To-Hagane 1982, 68, 2190–2199. [Google Scholar] [CrossRef]
  7. Patrick, T.R.C.; Pownceby, M.I. Stability of silico-ferrite of calcium and aluminum (SFCA) in air-solid solution limits between 1240 °C and 1390 °C and phase relationships within the Fe2O3–CaO–Al2O3–SiO2 (FCAS) system. Metall. Mater. Trans. B 2002, 33B, 79–89. [Google Scholar] [CrossRef]
  8. Mumme, W.G.; Gable, R.W. Crystal structures of monoclinic variants of two SFCA structure-types containing significant Fe2+: Crystal structure of monoclinic SFCA-II, Ca2.6 Fe3+8.0Fe2+3.4Al4O24; and proposed crystal structure of monoclinic SFCA-I, ideally, Ca 2Fe2+8Fe3+8Al4O28. Neues Jb. Miner. Abh. J. Min. Geochem. 2018, 195, 89–100. [Google Scholar] [CrossRef]
  9. Hamilton, J.D.G.; Hoskins, B.F.; Mumme, W.G.; Borbidge, W.E.; Montague, M.A. The crystal structure and crystal chemistry of Ca2.3Mg0.8Al1.5Si1.1Fe8.3O20 (SFCA): Solid solution limits and selected phase relationships of SFCA in the SiO2–Fe2O3–CaO(−Al2O3) system. Neues Jb. Miner. Abh. 1989, 161, 1–26. [Google Scholar]
  10. Ding, X.; Guo, X.M. The formation process of silico-ferrite of calcium (SFC) from binary calcium ferrite. Metall. Mater. Trans. B 2014, 45B, 1221–1231. [Google Scholar] [CrossRef]
  11. Ding, X.; Guo, X.M. Effect of SiO2 on the crystal structure stability of SFC at 1473 K (1200 C). Metall. Mater. Trans. B 2015, 46, 1146–1153. [Google Scholar] [CrossRef]
  12. Lister, D.H.; Glasser, F.P. Phase relations in the system CaO-Al2O3-iron oxide. Br. Ceram. Trans. J. 1967, 66, 293–305. [Google Scholar]
  13. Mumme, W.G. The crystal structure of SFCA-II, Ca5.1Al9.3Fe3+18.7Fe2+0.9O48 a new homologue of the aenigmatite structure-type, and structure refinement of SFCA-type, Ca2Al5Fe7O20. Implications for the nature of the “ternary-phase solid-solution” previously reported in the CaO–Al2O3–iron oxide system. Neues Jb. Miner. Abh. 2003, 178, 307–335. [Google Scholar]
  14. Guo, H.; Guo, X.M. Effect of Aluminum Dissolved in Hematite on Formation of Calcium Ferrites at 1473K. Metall. Mater. Trans. B 2018, 49, 1974–1984. [Google Scholar] [CrossRef]
  15. Sugiyama, K.; Monkawa, A.; Sugiyama, T. Crystal structure of the SFCAM phase Ca2(Ca, Fe, Mg, Al)6(Fe, Al, Si)6O20. ISIJ Int. 2005, 45, 560–568. [Google Scholar] [CrossRef]
  16. Scarlett, N.V.Y.; Madsen, I.C.; Pownceby, M.I.; Christensen, A.N. In situ X-ray diffraction analysis of iron ore sinter phases. J. Appl. Crystallogr. 2004, 37, 362–368. [Google Scholar] [CrossRef]
  17. Scarlett, N.V.Y.; Pownceby, M.I.; Madsen, I.C.; Christensen, A.N. Reaction sequences in the formation of silico-ferrites of calcium and aluminum in iron ore sinter. Metall. Mater. Trans. B 2004, 35B, 929–936. [Google Scholar] [CrossRef]
  18. Webster, N.A.S.; Pownceby, M.I.; Madsen, I.C.; Kimpton, J.A. Silico-ferrite of calcium and aluminum (SFCA) iron ore sinter bonding phases: New insights into their formation during heating and cooling. Metall. Mater. Trans. B 2012, 43B, 1344–1357. [Google Scholar] [CrossRef]
  19. Webster, N.A.S.; Pownceby, M.I.; Madsen, I.C.; Kimpton, J.A. Effect of oxygen partial pressure on the formation mechanisms of complex Ca-rich ferrites. ISIJ Int. 2013, 53, 774–781. [Google Scholar] [CrossRef]
  20. Webster, N.A.S.; Churchill, J.G.; Tufaile, F.; Pownceby, M.I.; Manuel, J.R.; Kimpton, J.A. Fundamentals of silico-ferrite of calcium and aluminium (SFCA) and SFCA-I iron ore sinter bonding phase formation: Effects of titanomagnetite-based ironsand and titanium addition. ISIJ Int. 2016, 56, 1715–1722. [Google Scholar] [CrossRef]
  21. Webster, N.A.S.; Pownceby, M.I.; Pattel, R. Fundamentals of silico-ferrite of calcium and aluminium (SFCA) and SFCA-I iron ore sinter bonding phase formation: Effects of mill scale addition. Powder Diffr. 2017, 32, S85–S89. [Google Scholar] [CrossRef]
  22. Liles, D.C.; Villiers, J.P.R.; Kahlenberg, V. Refinement of iron ore sinter phases: A silico-ferrite of calcium and aluminium (SFCA) and an Al-free SFC, and the effect on phase quantification by X-ray diffraction. Mineral. Petrol. 2016, 110, 141–147. [Google Scholar] [CrossRef]
  23. Hancart, J.; Leroy, V.; Bragard, A. A study of the phases present in blast furnace sinter. Some considerations on the mechanism of their formation. CNRM Metall. Rep. 1967, 14, 3–7. [Google Scholar]
  24. Ahsan, S.N.; Mukherjee, T.; Whiteman, J.A. Structure of fluxed sinter. Ironmak. Steelmak. 1983, 10, 54–64. [Google Scholar]
  25. Ding, X.; Guo, X.M. Study of SiO2 involved in the formation process of silico-ferrite of calcium (SFC) by solid-state reactions. Int. J. Min. Process. 2016, 149, 69–77. [Google Scholar] [CrossRef]
  26. Rietveld, H.M. A profile refinement method for nuclear and magnetic structures. J. Appl. Crystallogr. 1969, 2, 65–71. [Google Scholar] [CrossRef]
  27. Toby, B.H. EXPGUI, a graphical user interface for GSAS. J. Appl. Crystallogr. 2001, 34, 210–213. [Google Scholar] [CrossRef]
Figure 1. XRD patterns of the reaction products between SiO2 and CF sintered at 1100 °C (a) and 1150 °C (b) for 5 min, 15 min and 60 min respectively.
Minerals 09 00101 g001
Figure 2. XRD patterns of the reaction products between Al2O3 and CF sintered at 1100 °C (a) and 1150 °C (b) for 5 min, 15 min and 60 min respectively.
Minerals 09 00101 g002
Figure 3. XRD patterns of SFC and CFA sintered at 1200 °C for 8 h.
Minerals 09 00101 g003
Figure 4. Schematic diagram of solid-state reactions (a) SiO2 + CF; (b) Al2O3 + CF.
Minerals 09 00101 g004
Figure 5. XRD patterns of the sample C sintered at different temperature for 2 h by solid-state reactions.
Minerals 09 00101 g005
Figure 6. Microscopic photos of sample C sintered at different temperatures for 2 h. F: Fe2O3, S: SiO2, A: Al2O3, CF: CaFe2O4, CFA: calcium iron aluminum oxide, SFCA: silico-ferrite of calcium and aluminum, P = pore.
Minerals 09 00101 g006
Figure 7. The SEM and EDS results of the quenched sample C sintered at (a) 1100 °C and (b) 1150 °C for 2 h.
Minerals 09 00101 g007
Figure 8. XRD patterns of sample C sintered at 1200 °C at different times by solid-state reactions.
Minerals 09 00101 g008
Figure 9. Microscopic photos of the sample C sintered at 1200 °C for different time. F: Fe2O3, S: SiO2, CF: CaFe2O4, CFA: calcium iron aluminum oxide, SFCA: silico-ferrite of calcium and aluminum, P: pore.
Minerals 09 00101 g009
Figure 10. SEM and EDS results of sample C sintered at 1200 °C at different times (a) 4 min (b) 6 min (c) 8 min (d) 10 min.
Minerals 09 00101 g010aMinerals 09 00101 g010b
Table 1. Composition of the starting sample (mass percent).
SampleFe2O3SiO2CaOAl2O3CaFe2O4
A__23.44____76.56
B______20.6579.35
C70.346.6017.455.61__
Table 2. Phase fractions of the sintering samples CF + Al2O3 and CF + SiO2 determined by the Rietveld method.
SamplePhase Fractions (Mass Percent)Rp (%)Rwp (%)
CFAC2FAl2O3SFCCFFe2O3Ca2SiO4SiO2CFF
CF + SiO2
(5 min)
---2.763.06.83.322.61.610.313.5
CF + SiO2
(15 min)
---4.950.214.17.121.52.29.512.2
CF + SiO2
(60 min)
----9.834.725.18.618.92.99.712.9
CF + Al2O3
(5 min)
7.55.518.2-68.8----8.911.2
CF + Al2O3
(15 min)
20.918.414.6-46.1----8.612.3
CF + Al2O3
(60 min)
57.736.85.5-0----8.311.4

