Origin of Smectite in Salinized Soil of Junggar Basin in Xinjiang of China


Abstract
:1. Introduction
2. Materials and Method
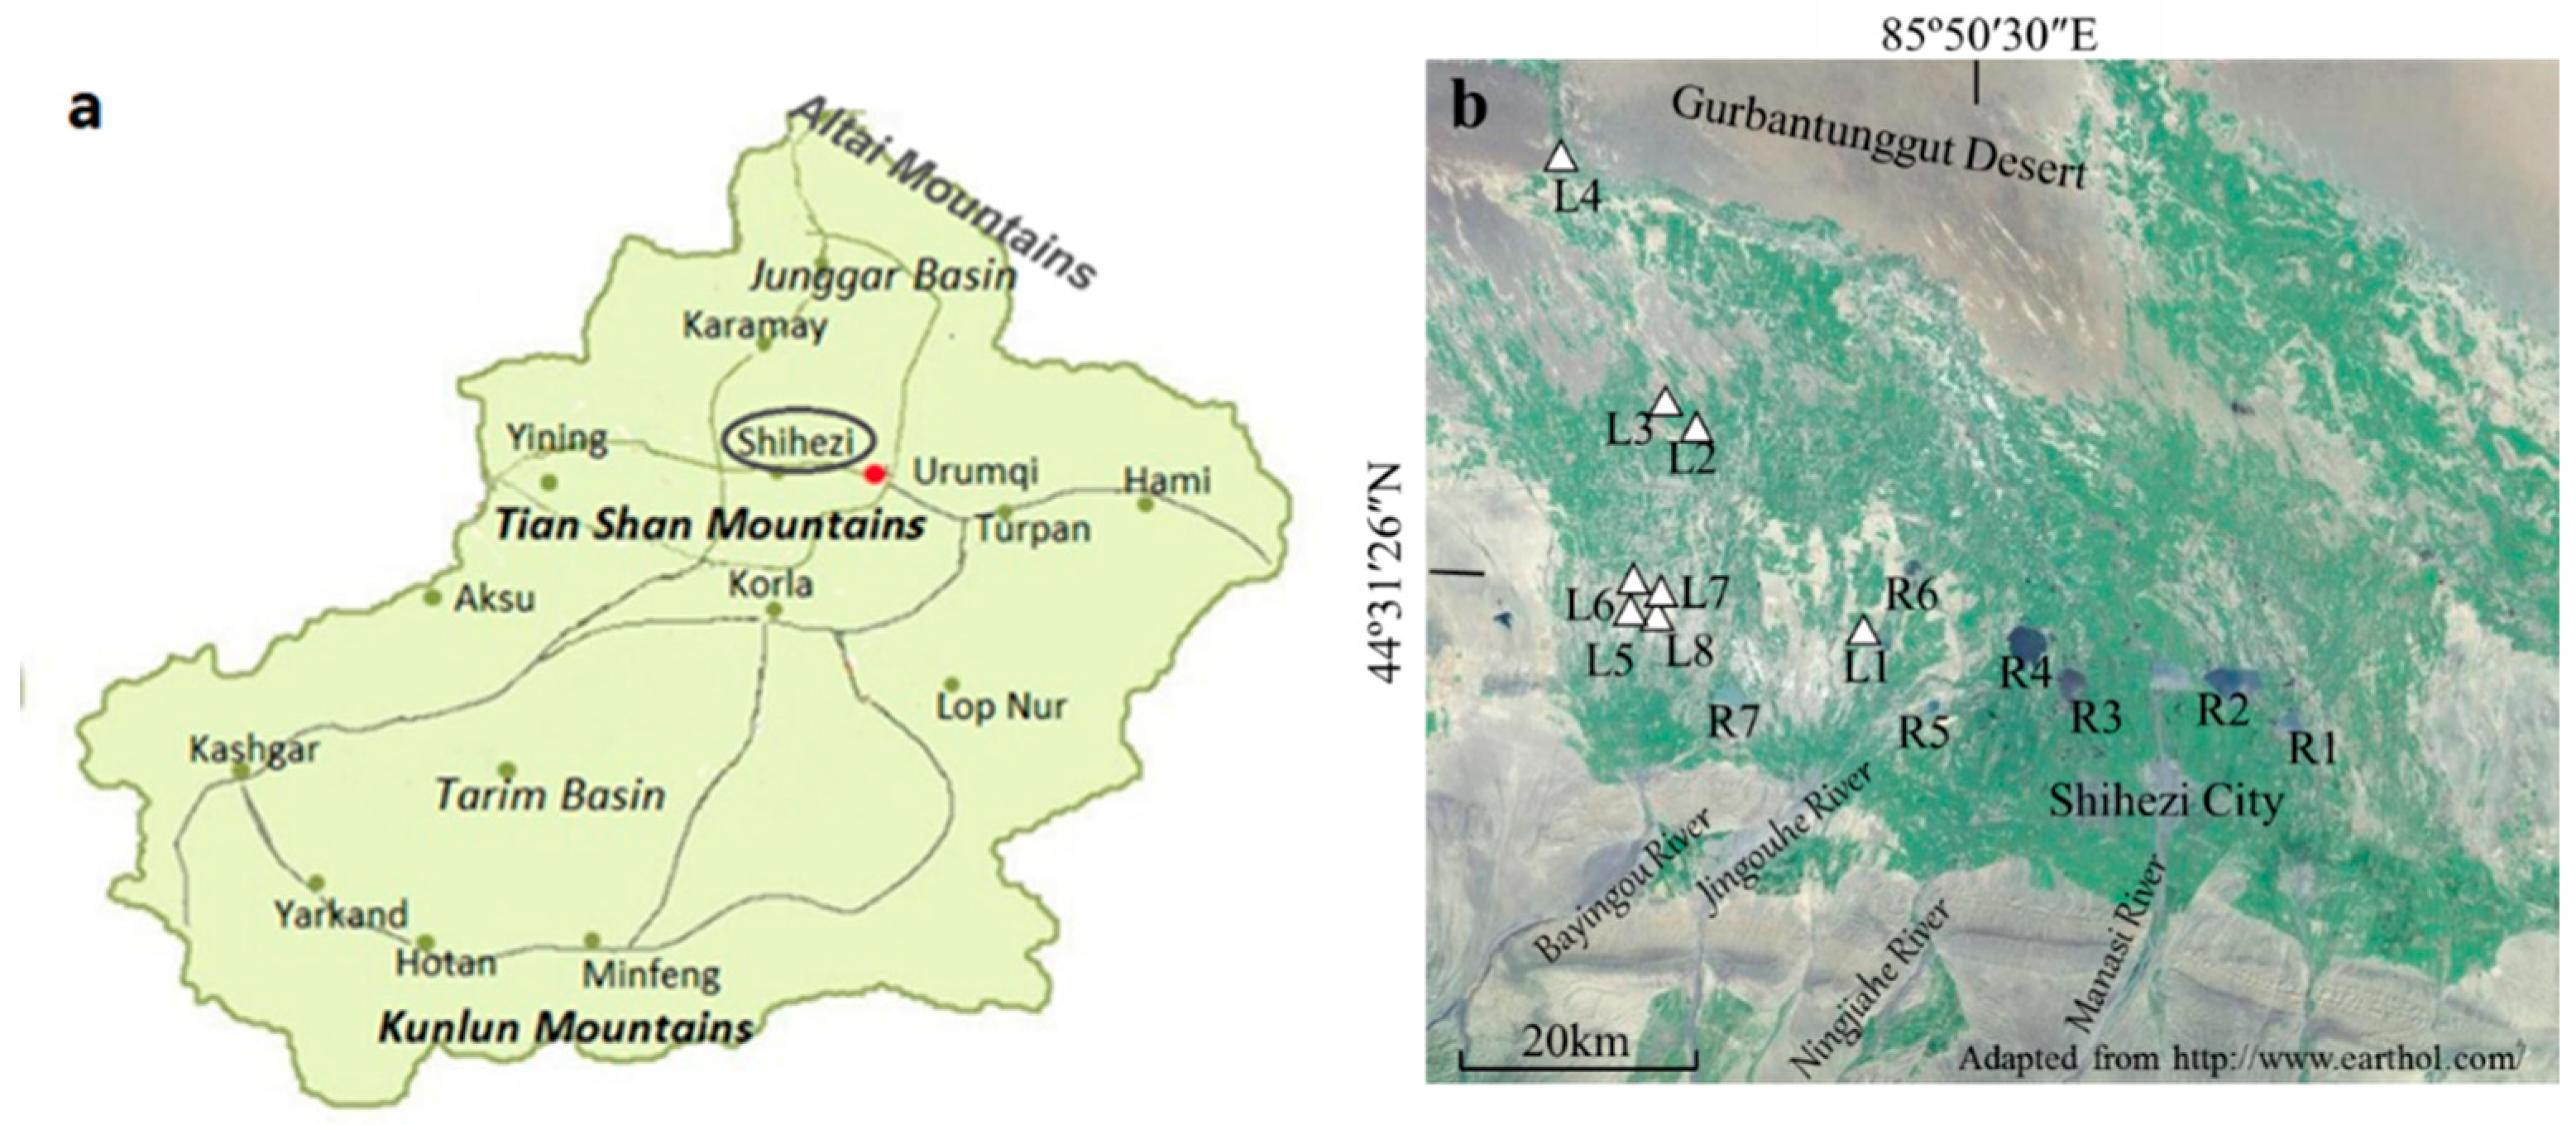
2.1. Study Area
2.2. Soil Sample Collection and Analysis of Physical and Chemical Properties
2.3. Extraction and Determination of Soil Clay Minerals
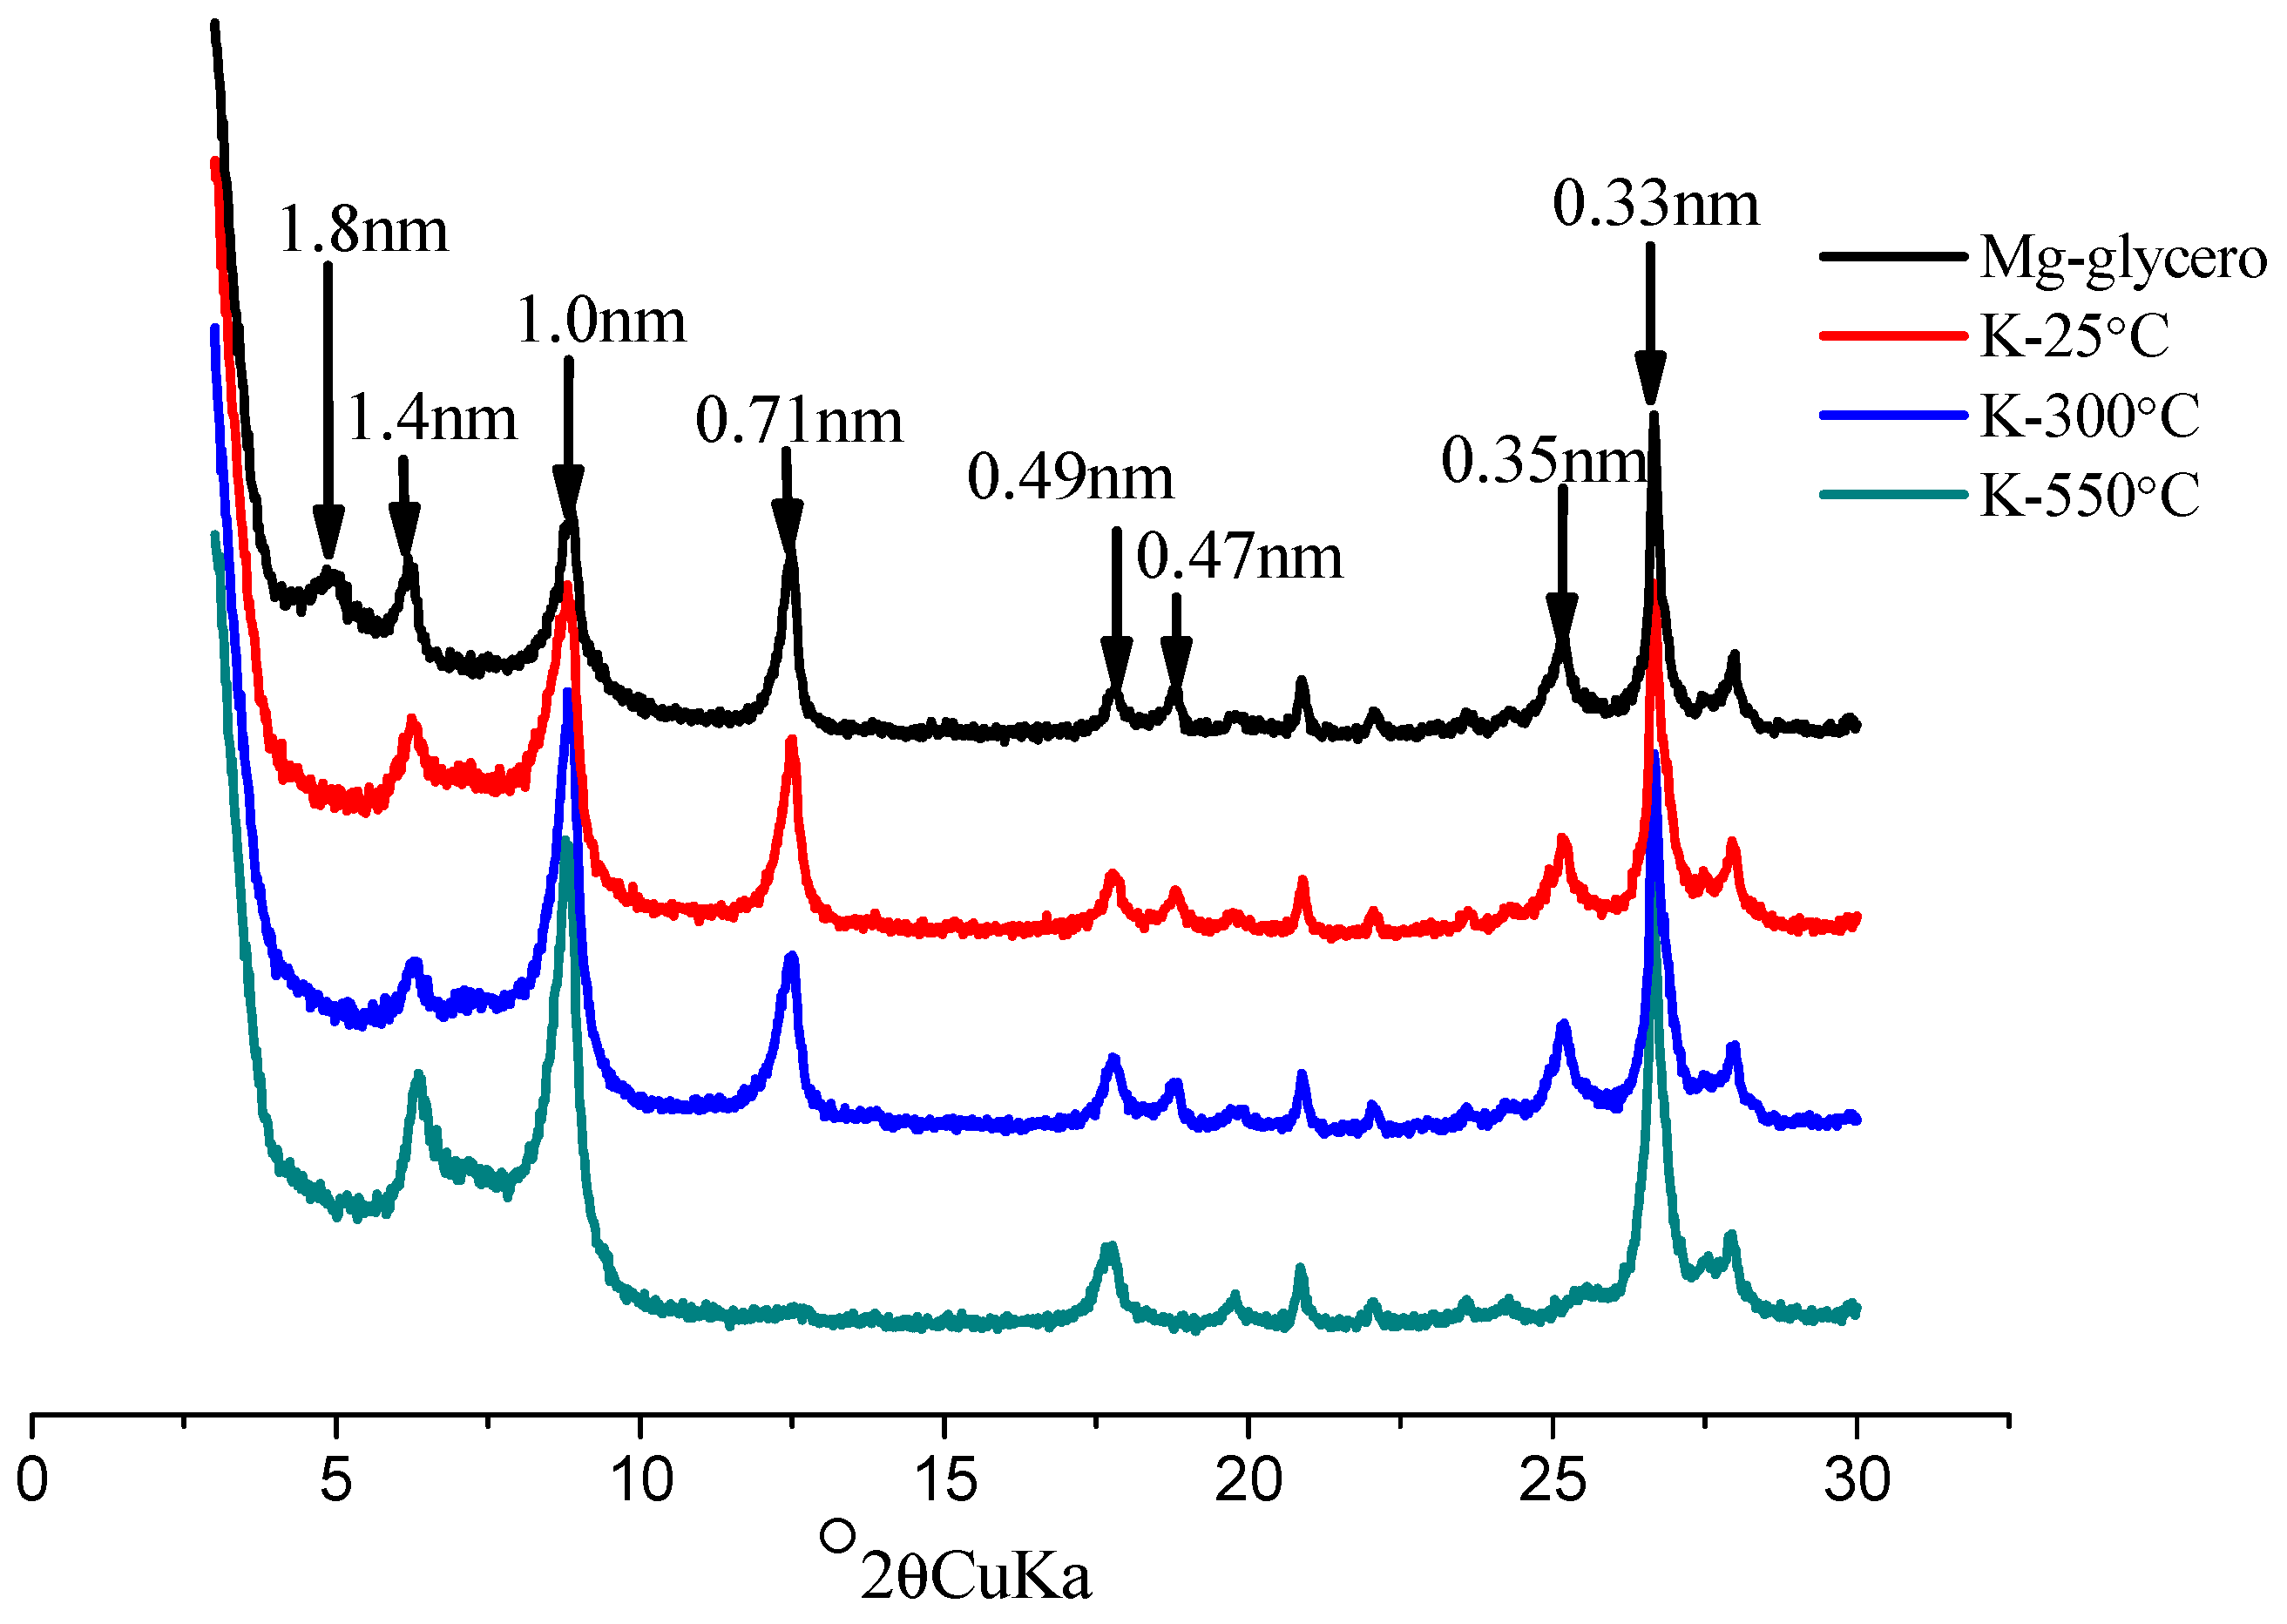
2.3.1. Mineralogical Determination by XRD
2.3.2. Mineralogical Determination by STEM/EDS
2.3.3. Chemical Determination by ICP-MS
2.3.4. Determination of δ13C and δ18O in Secondary Carbonate
2.3.5. Determination of δ13C in Organic Matter
3. Results and Analysis
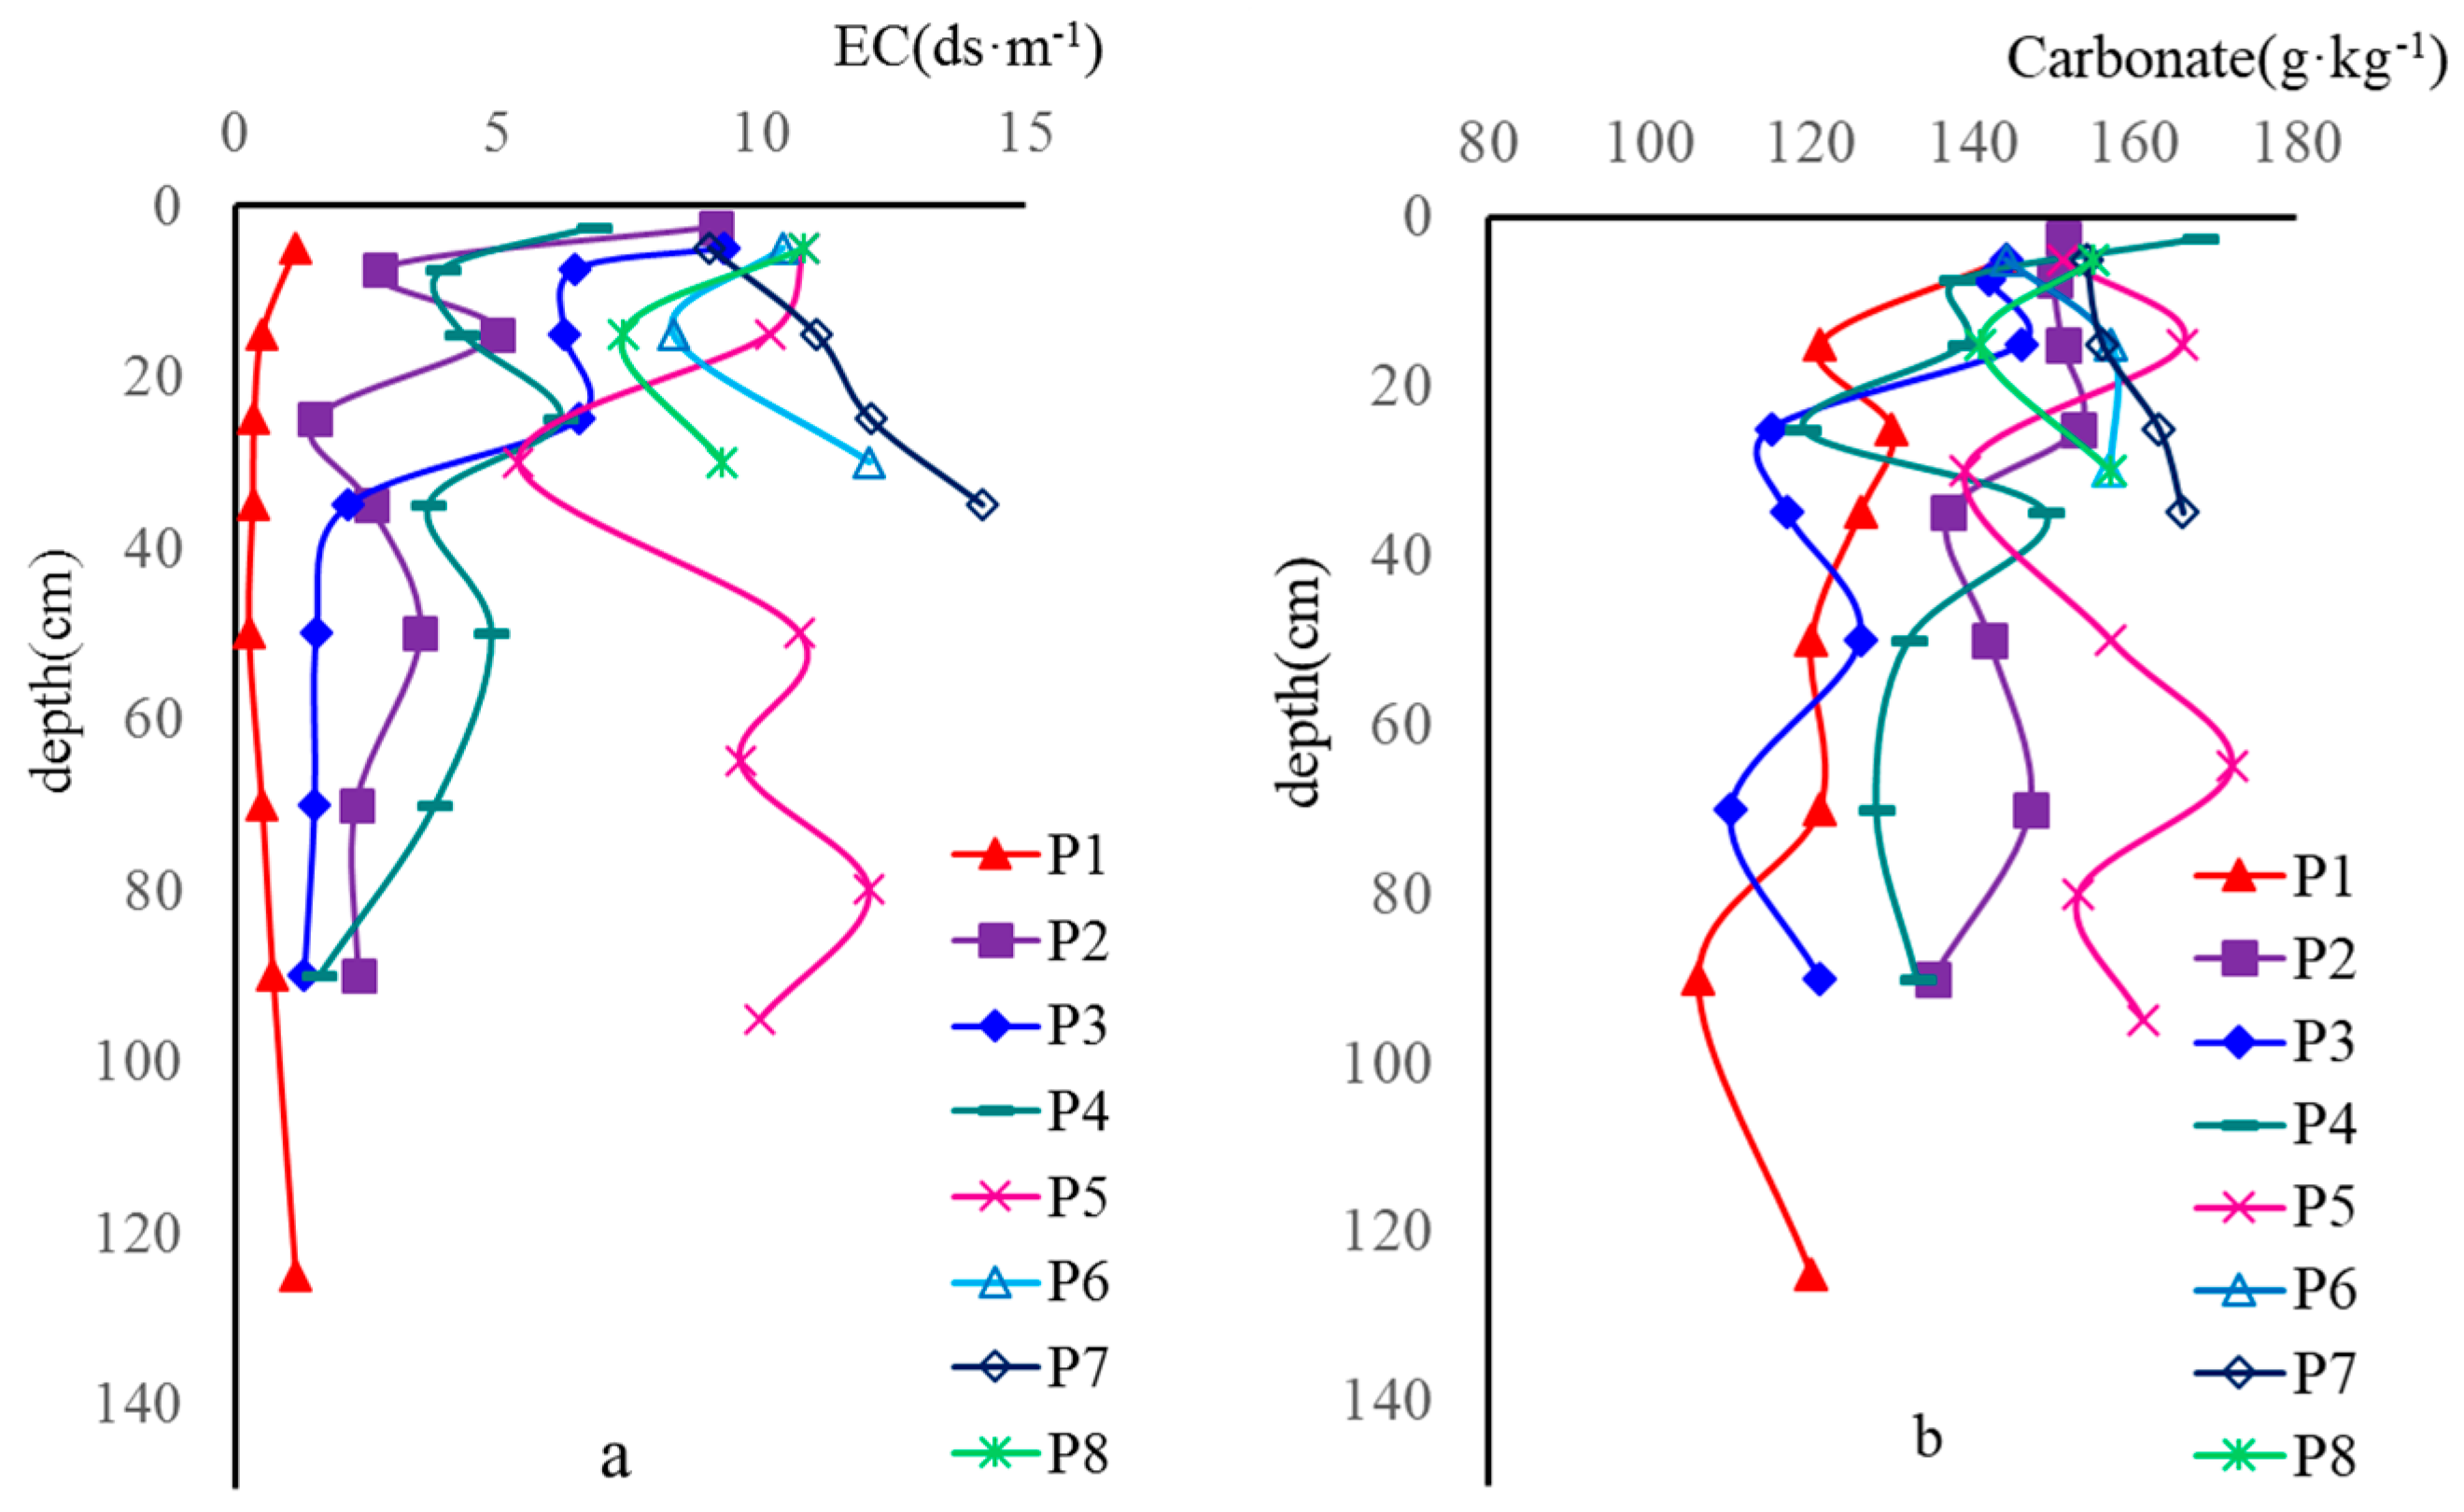
3.1. General Physicochemical Properties of Salinized Soil
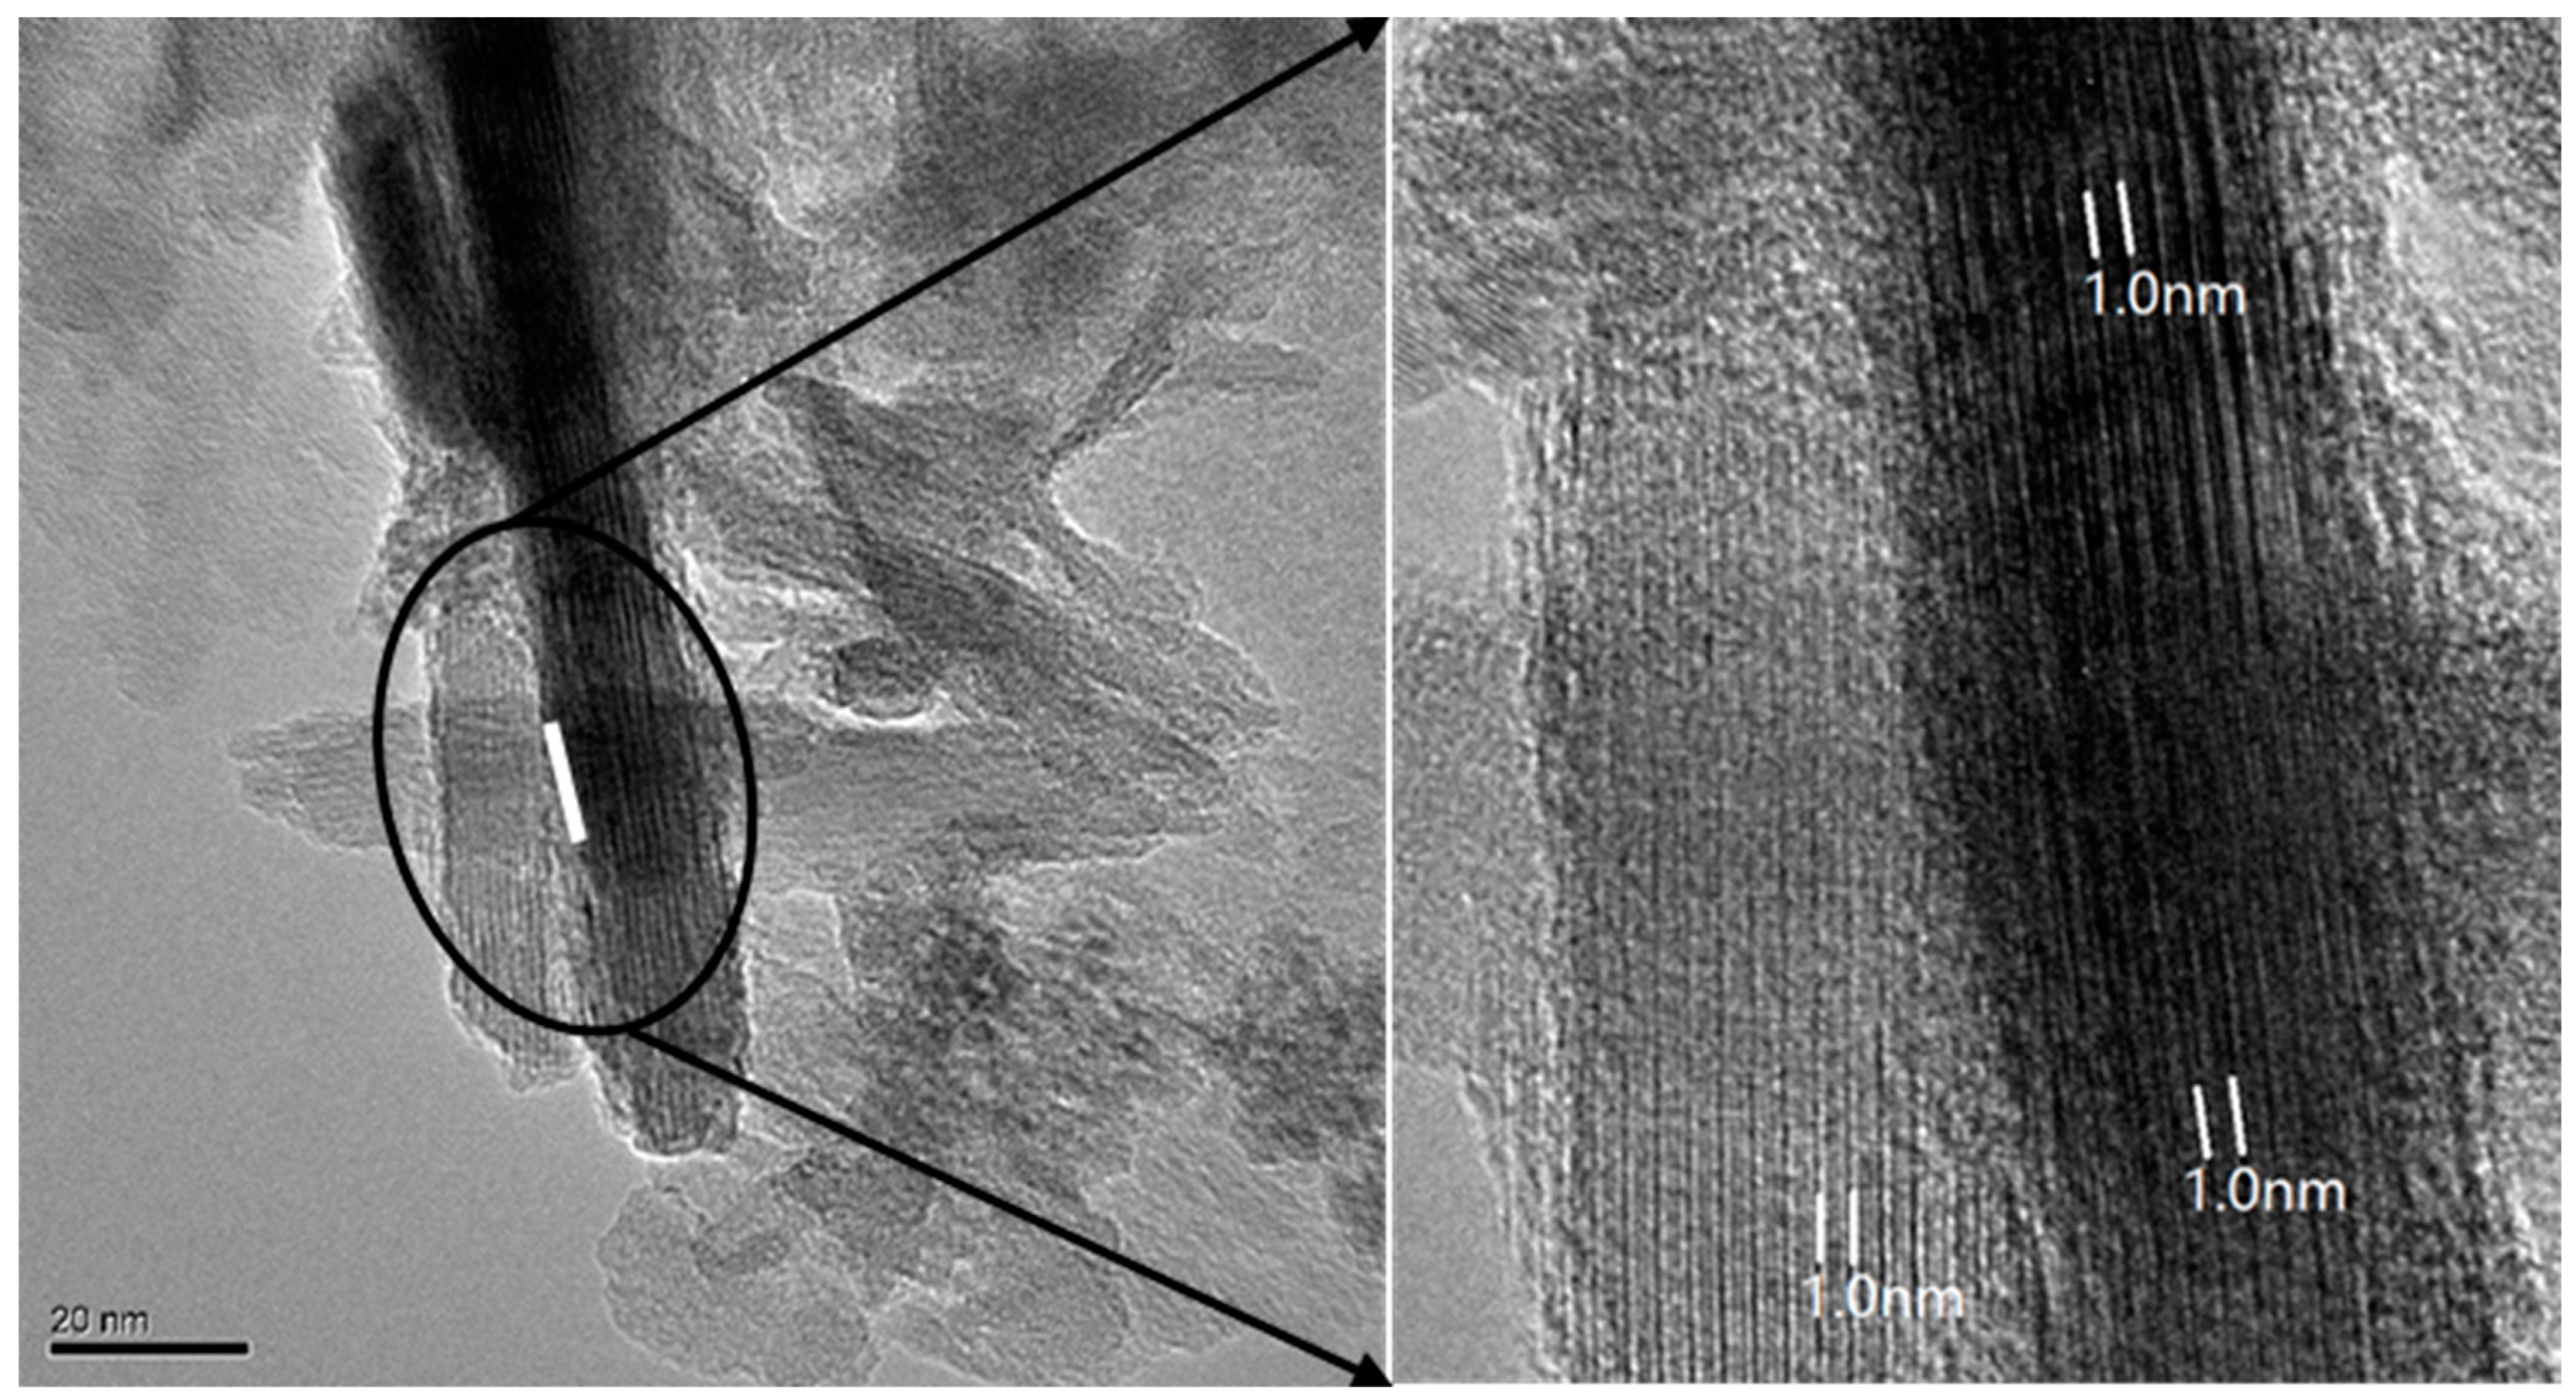
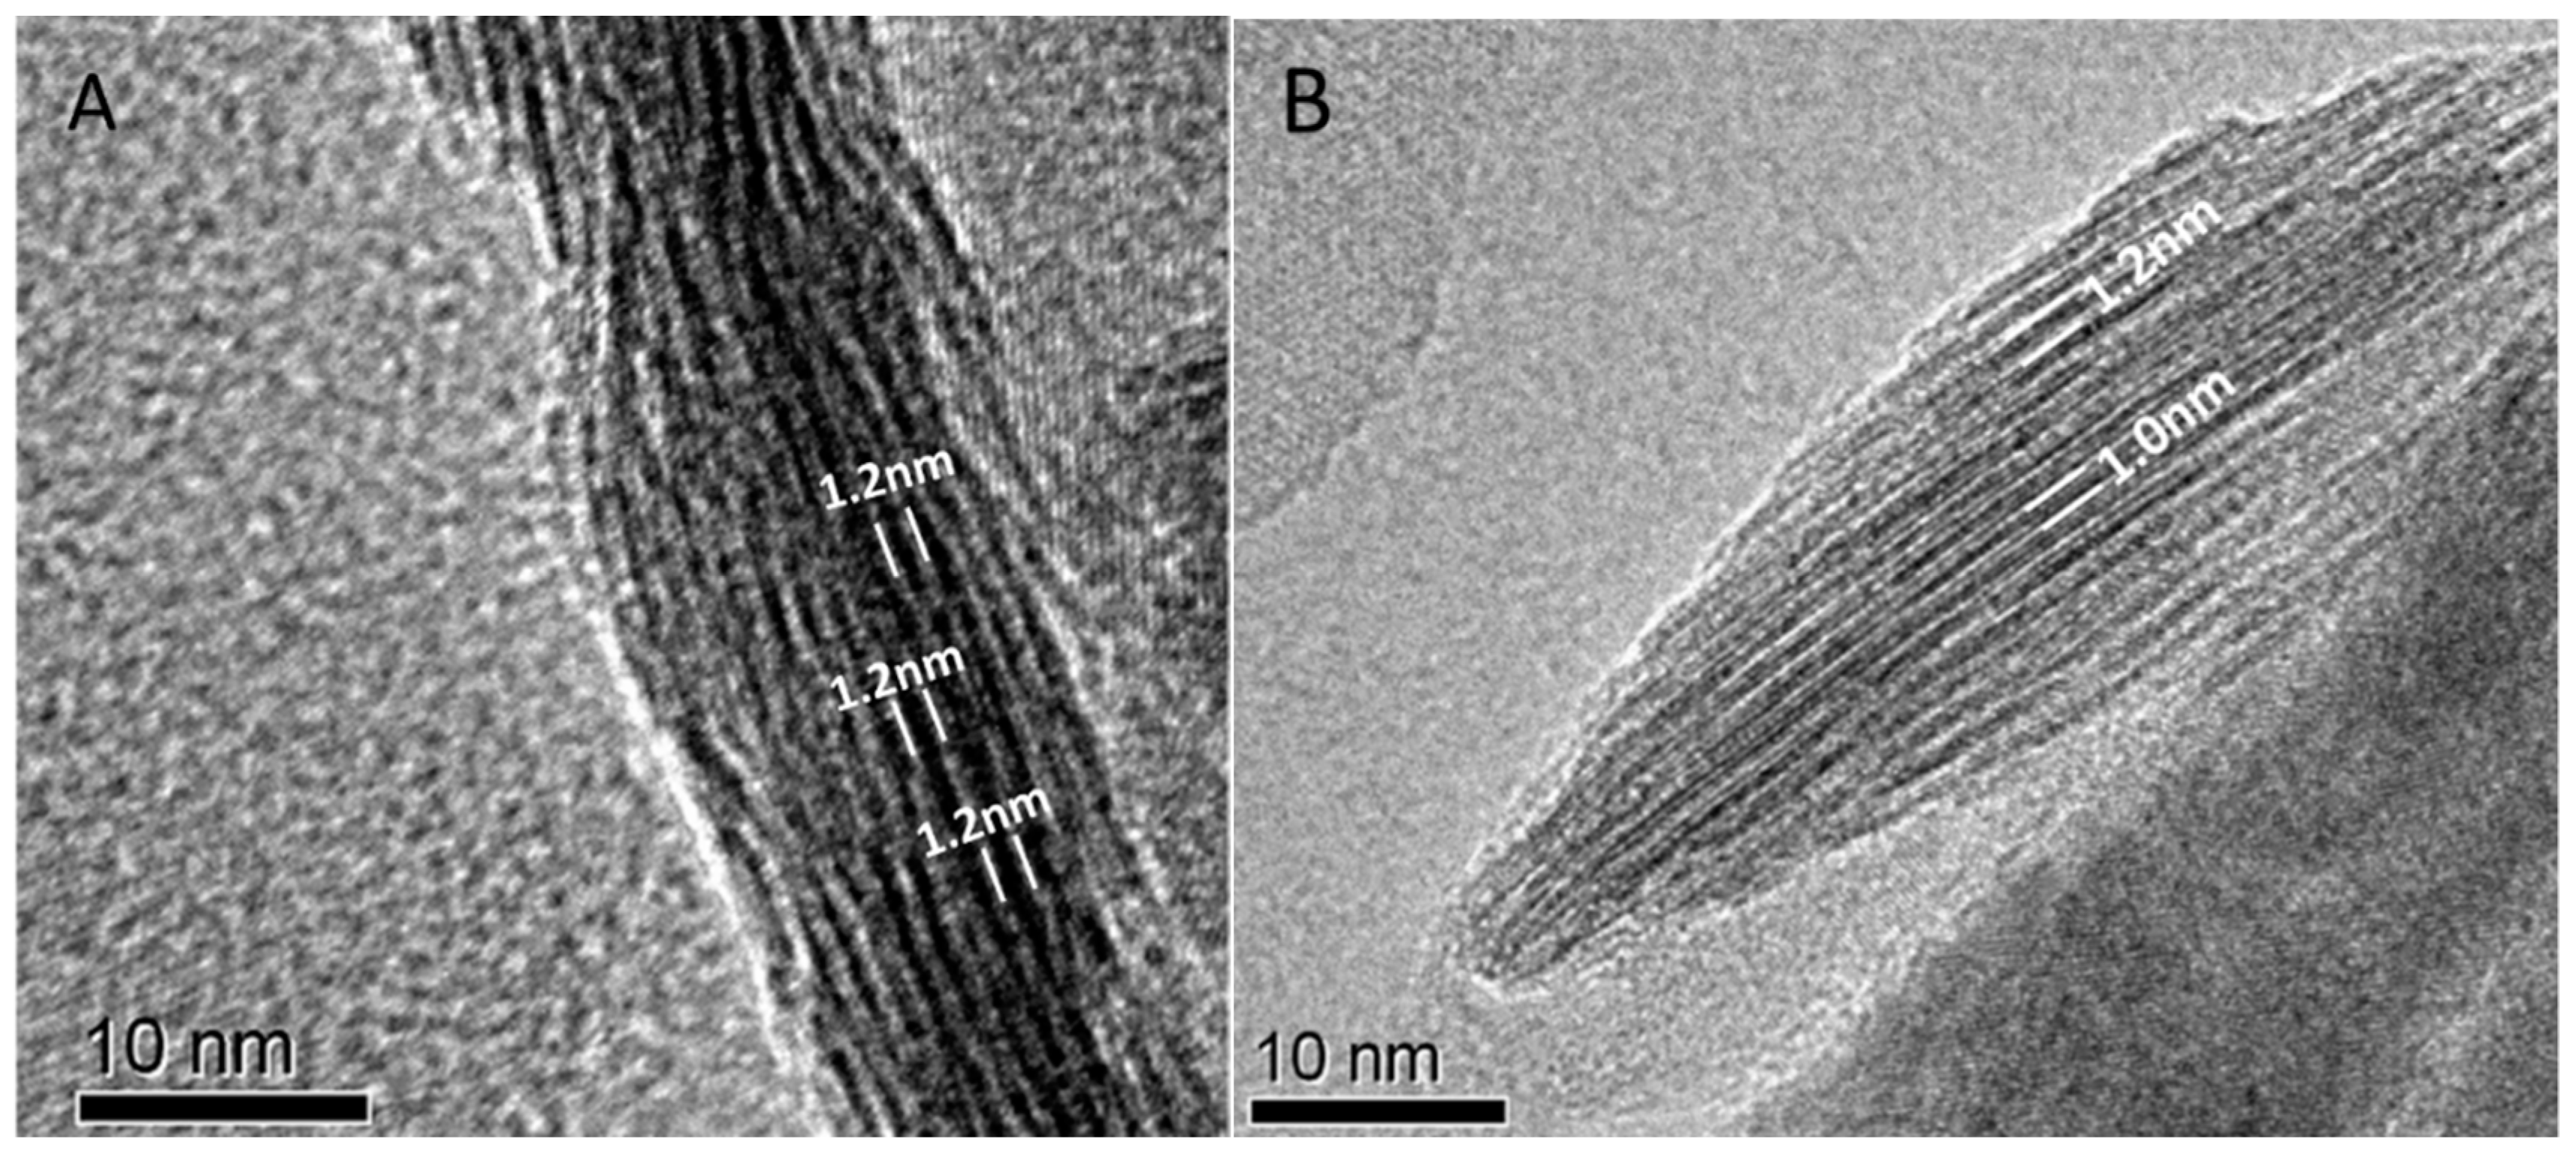
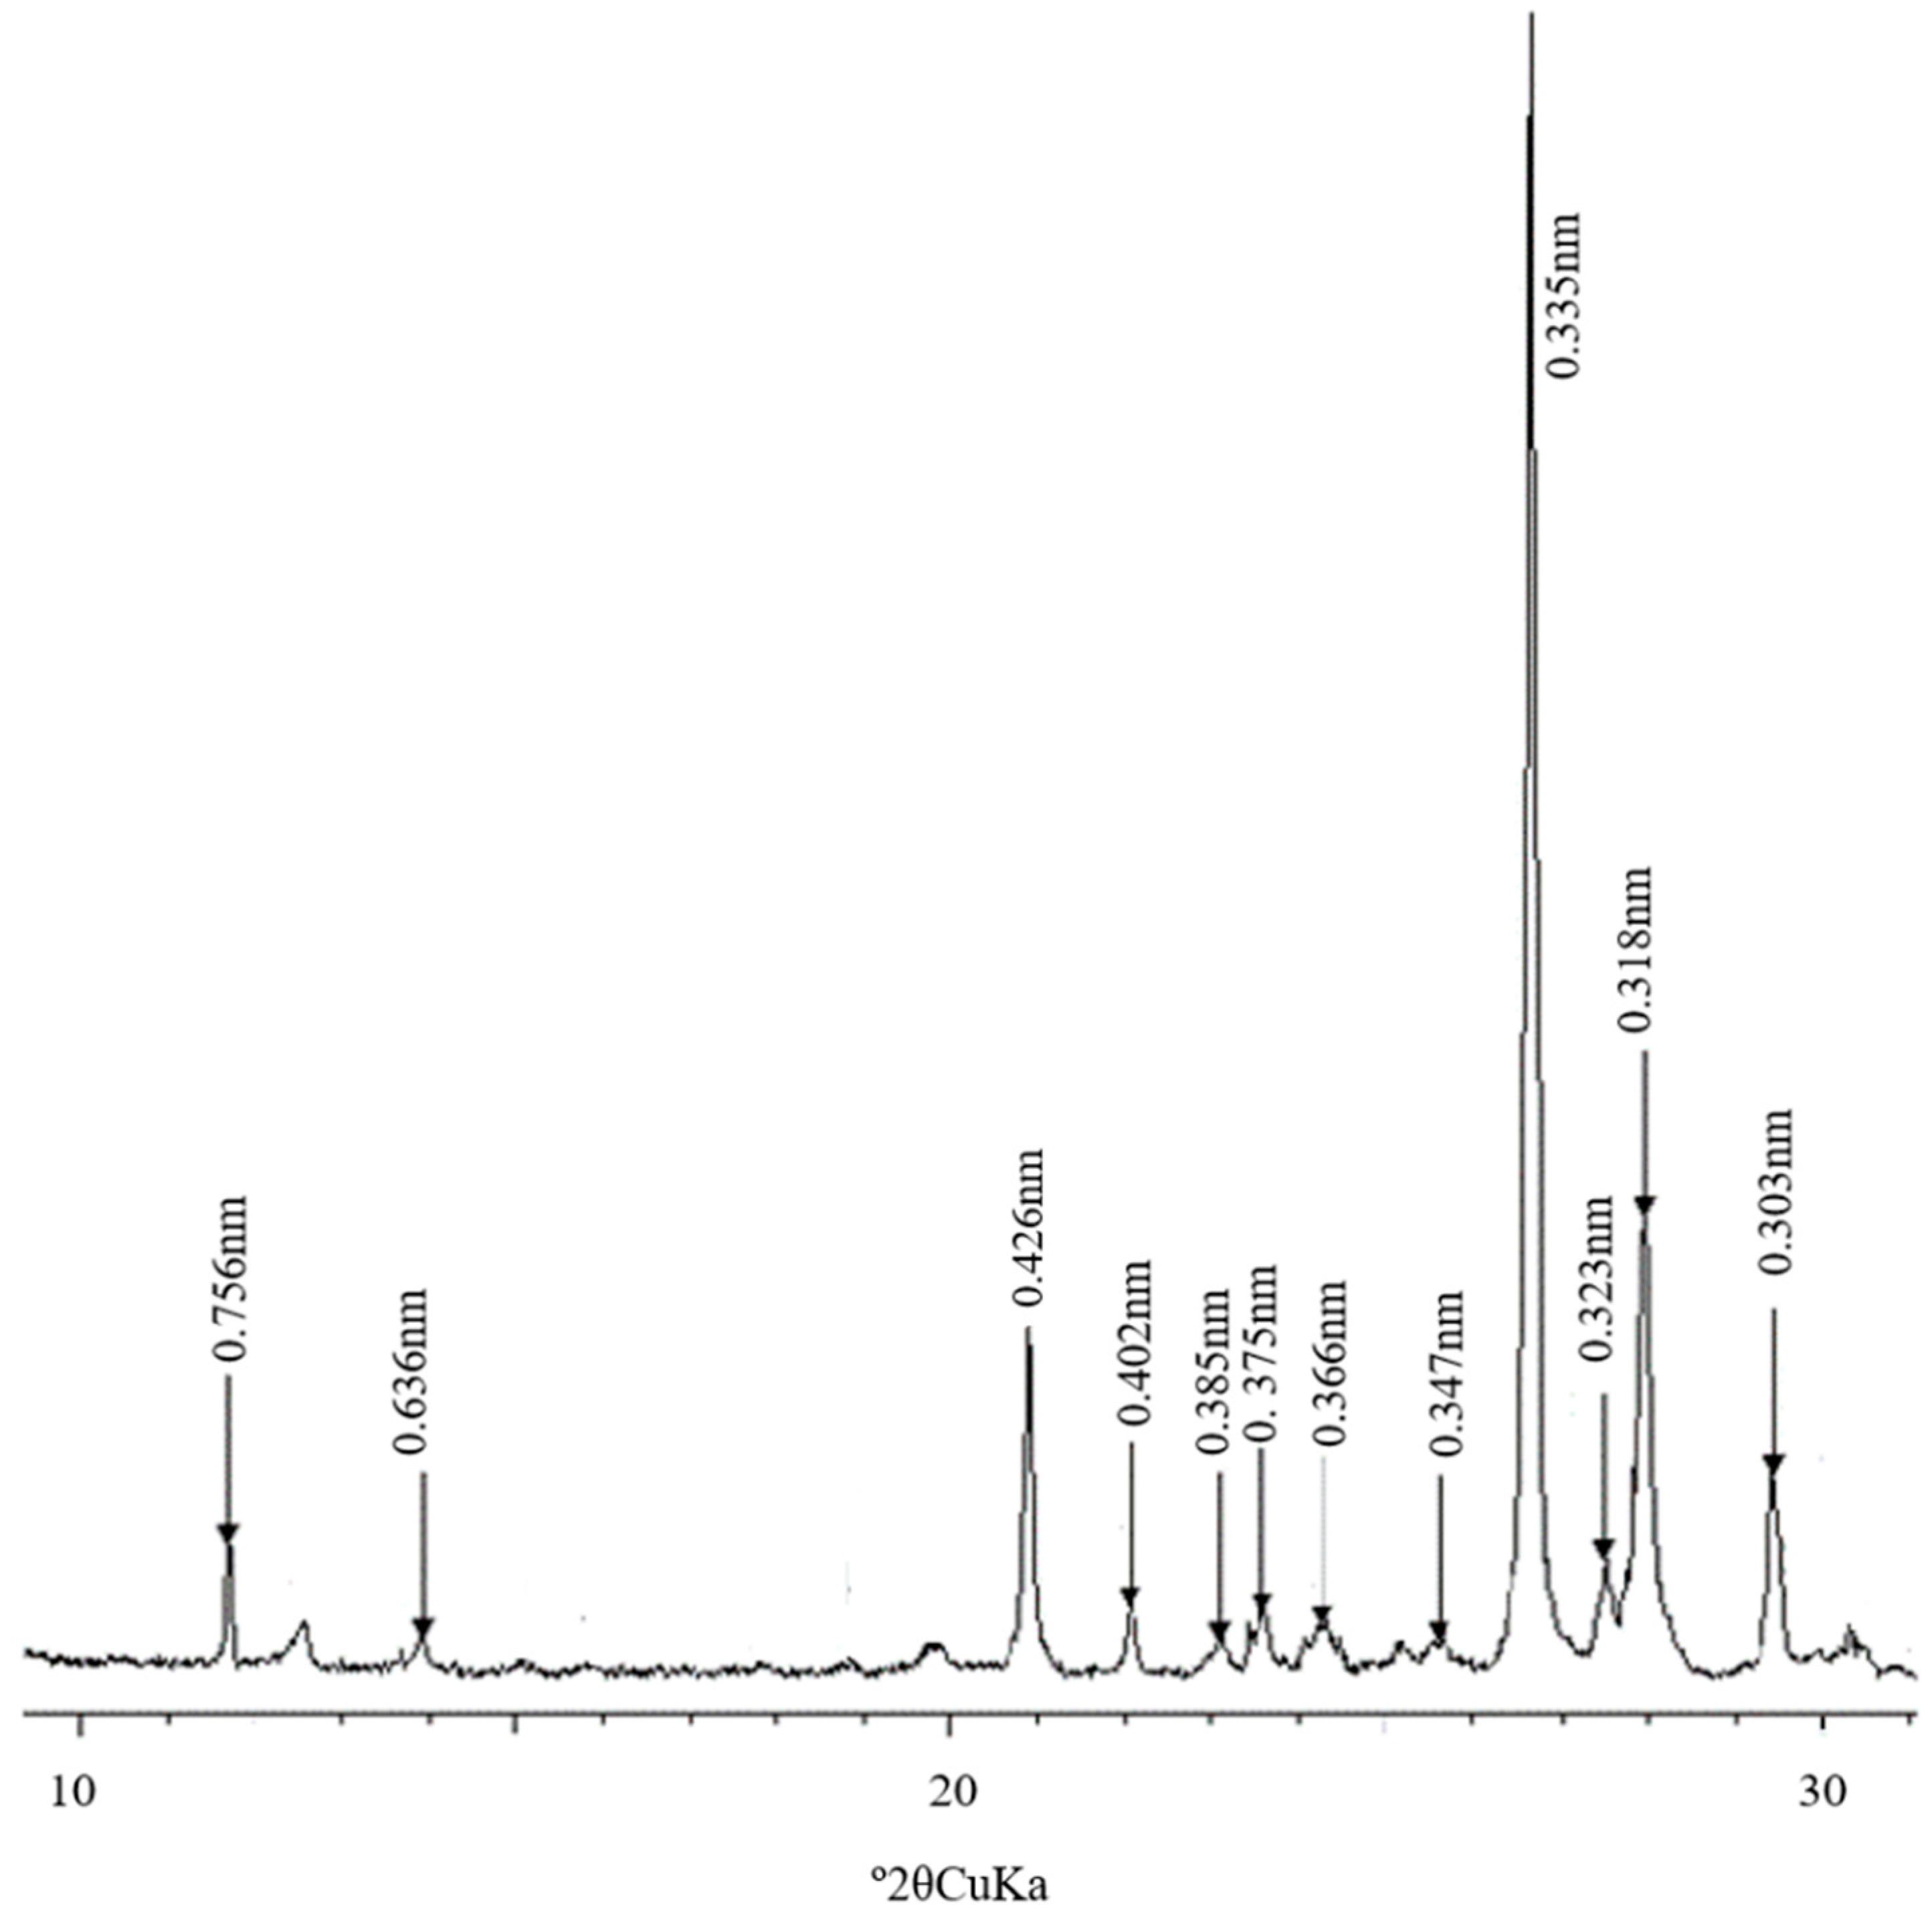
3.2. Composition and Morphological Characteristics of Clay Minerals from Salinized Soils in Junggar Basin
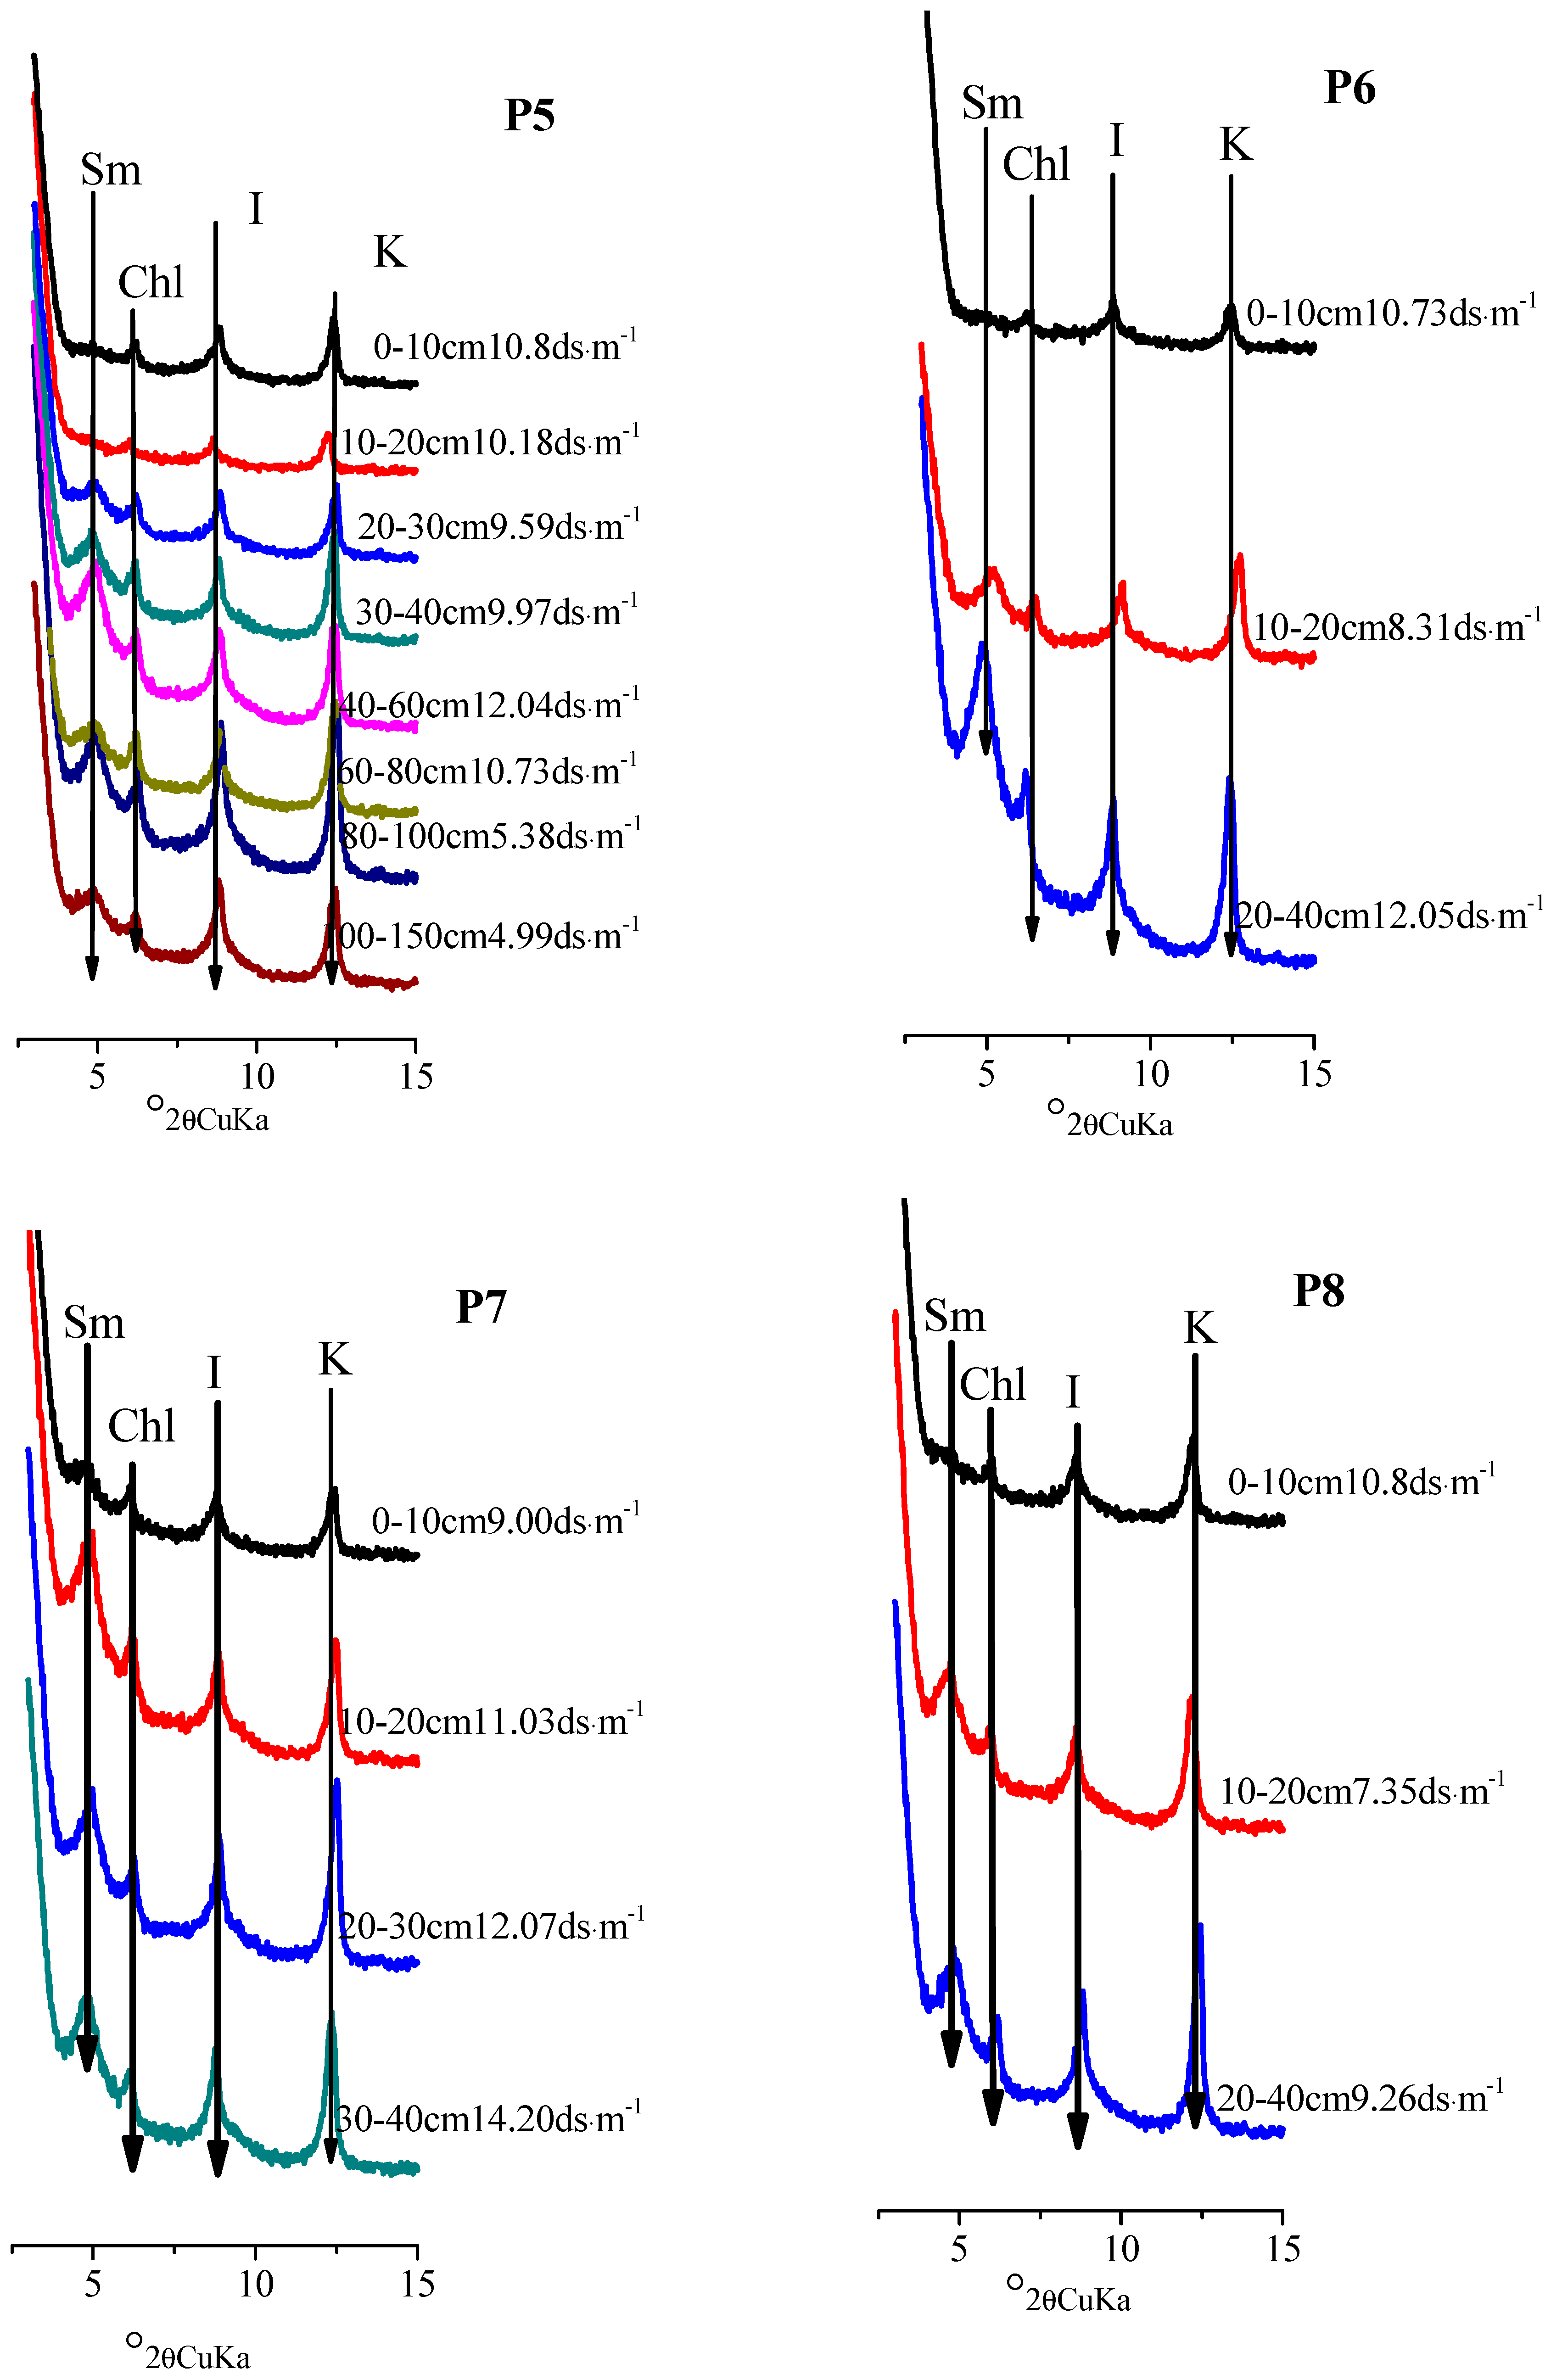
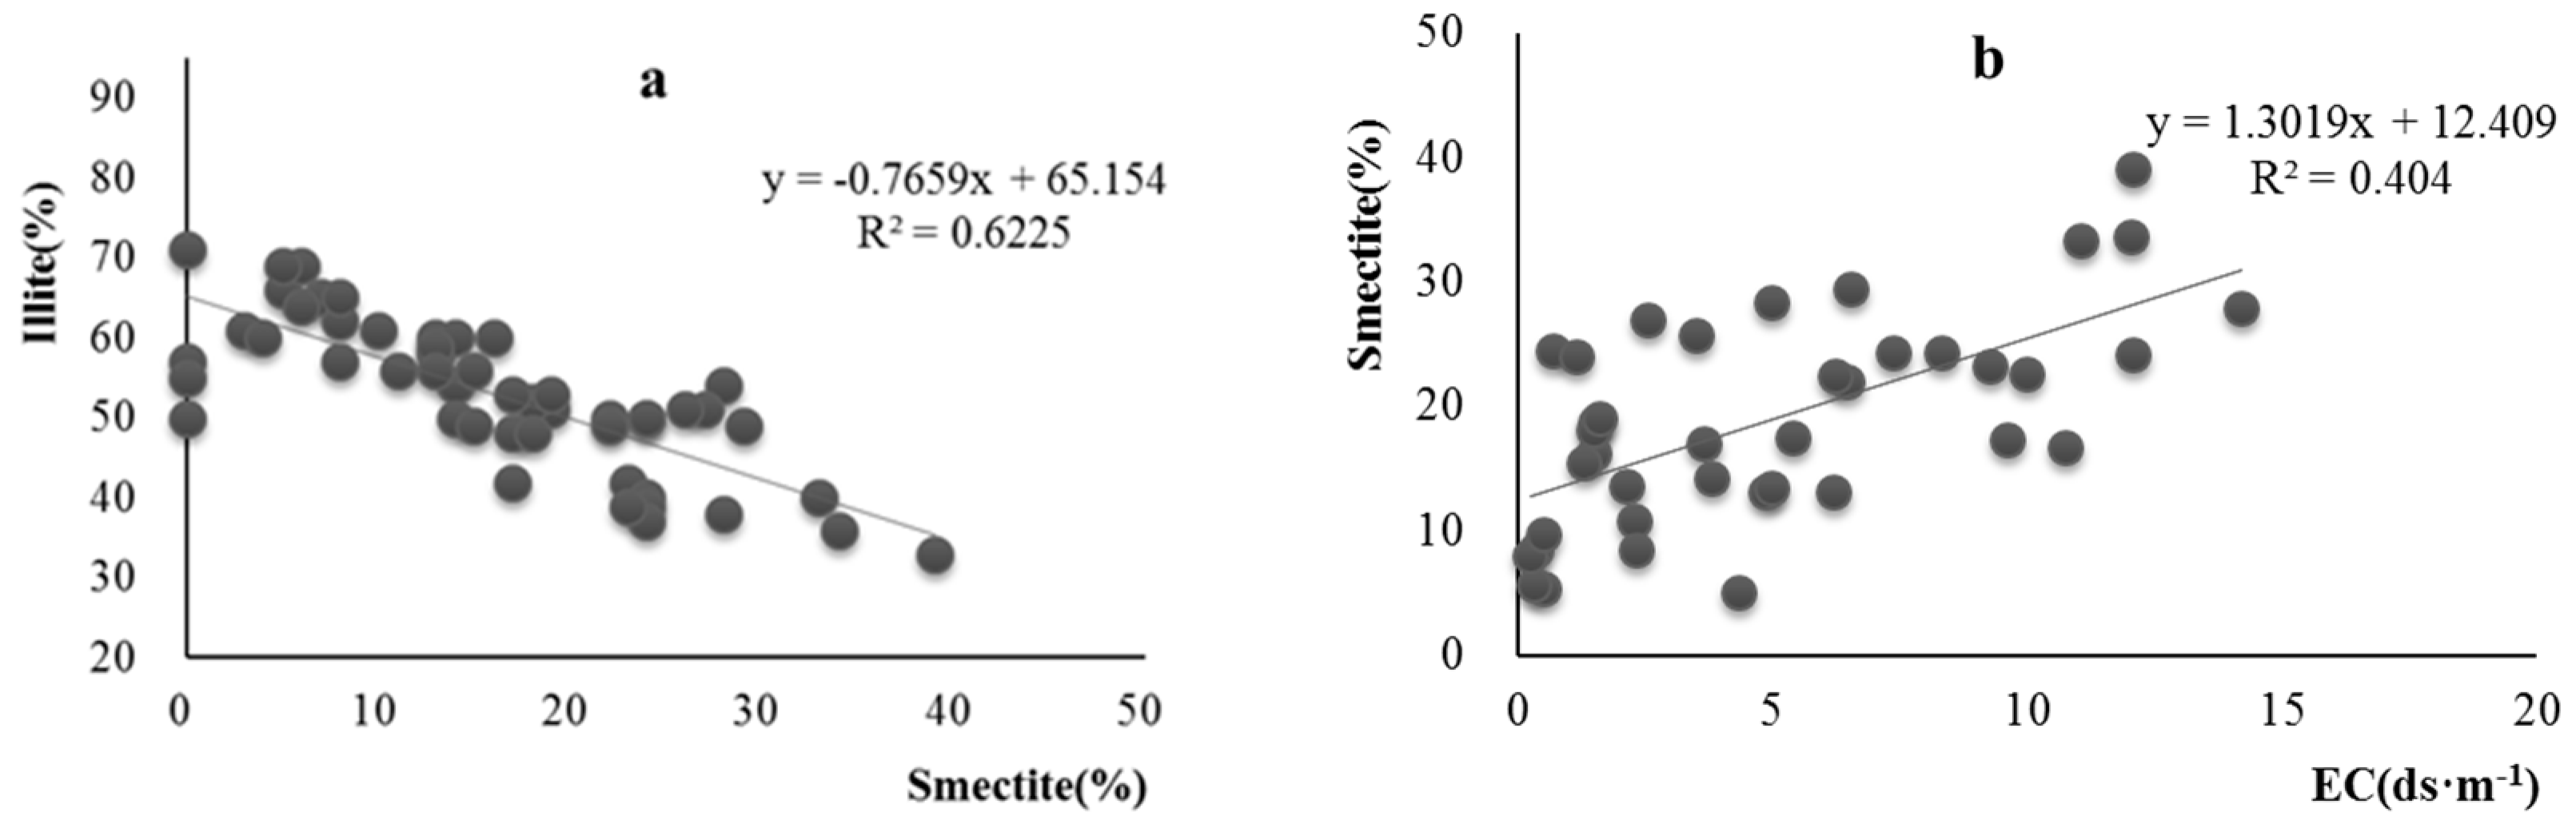
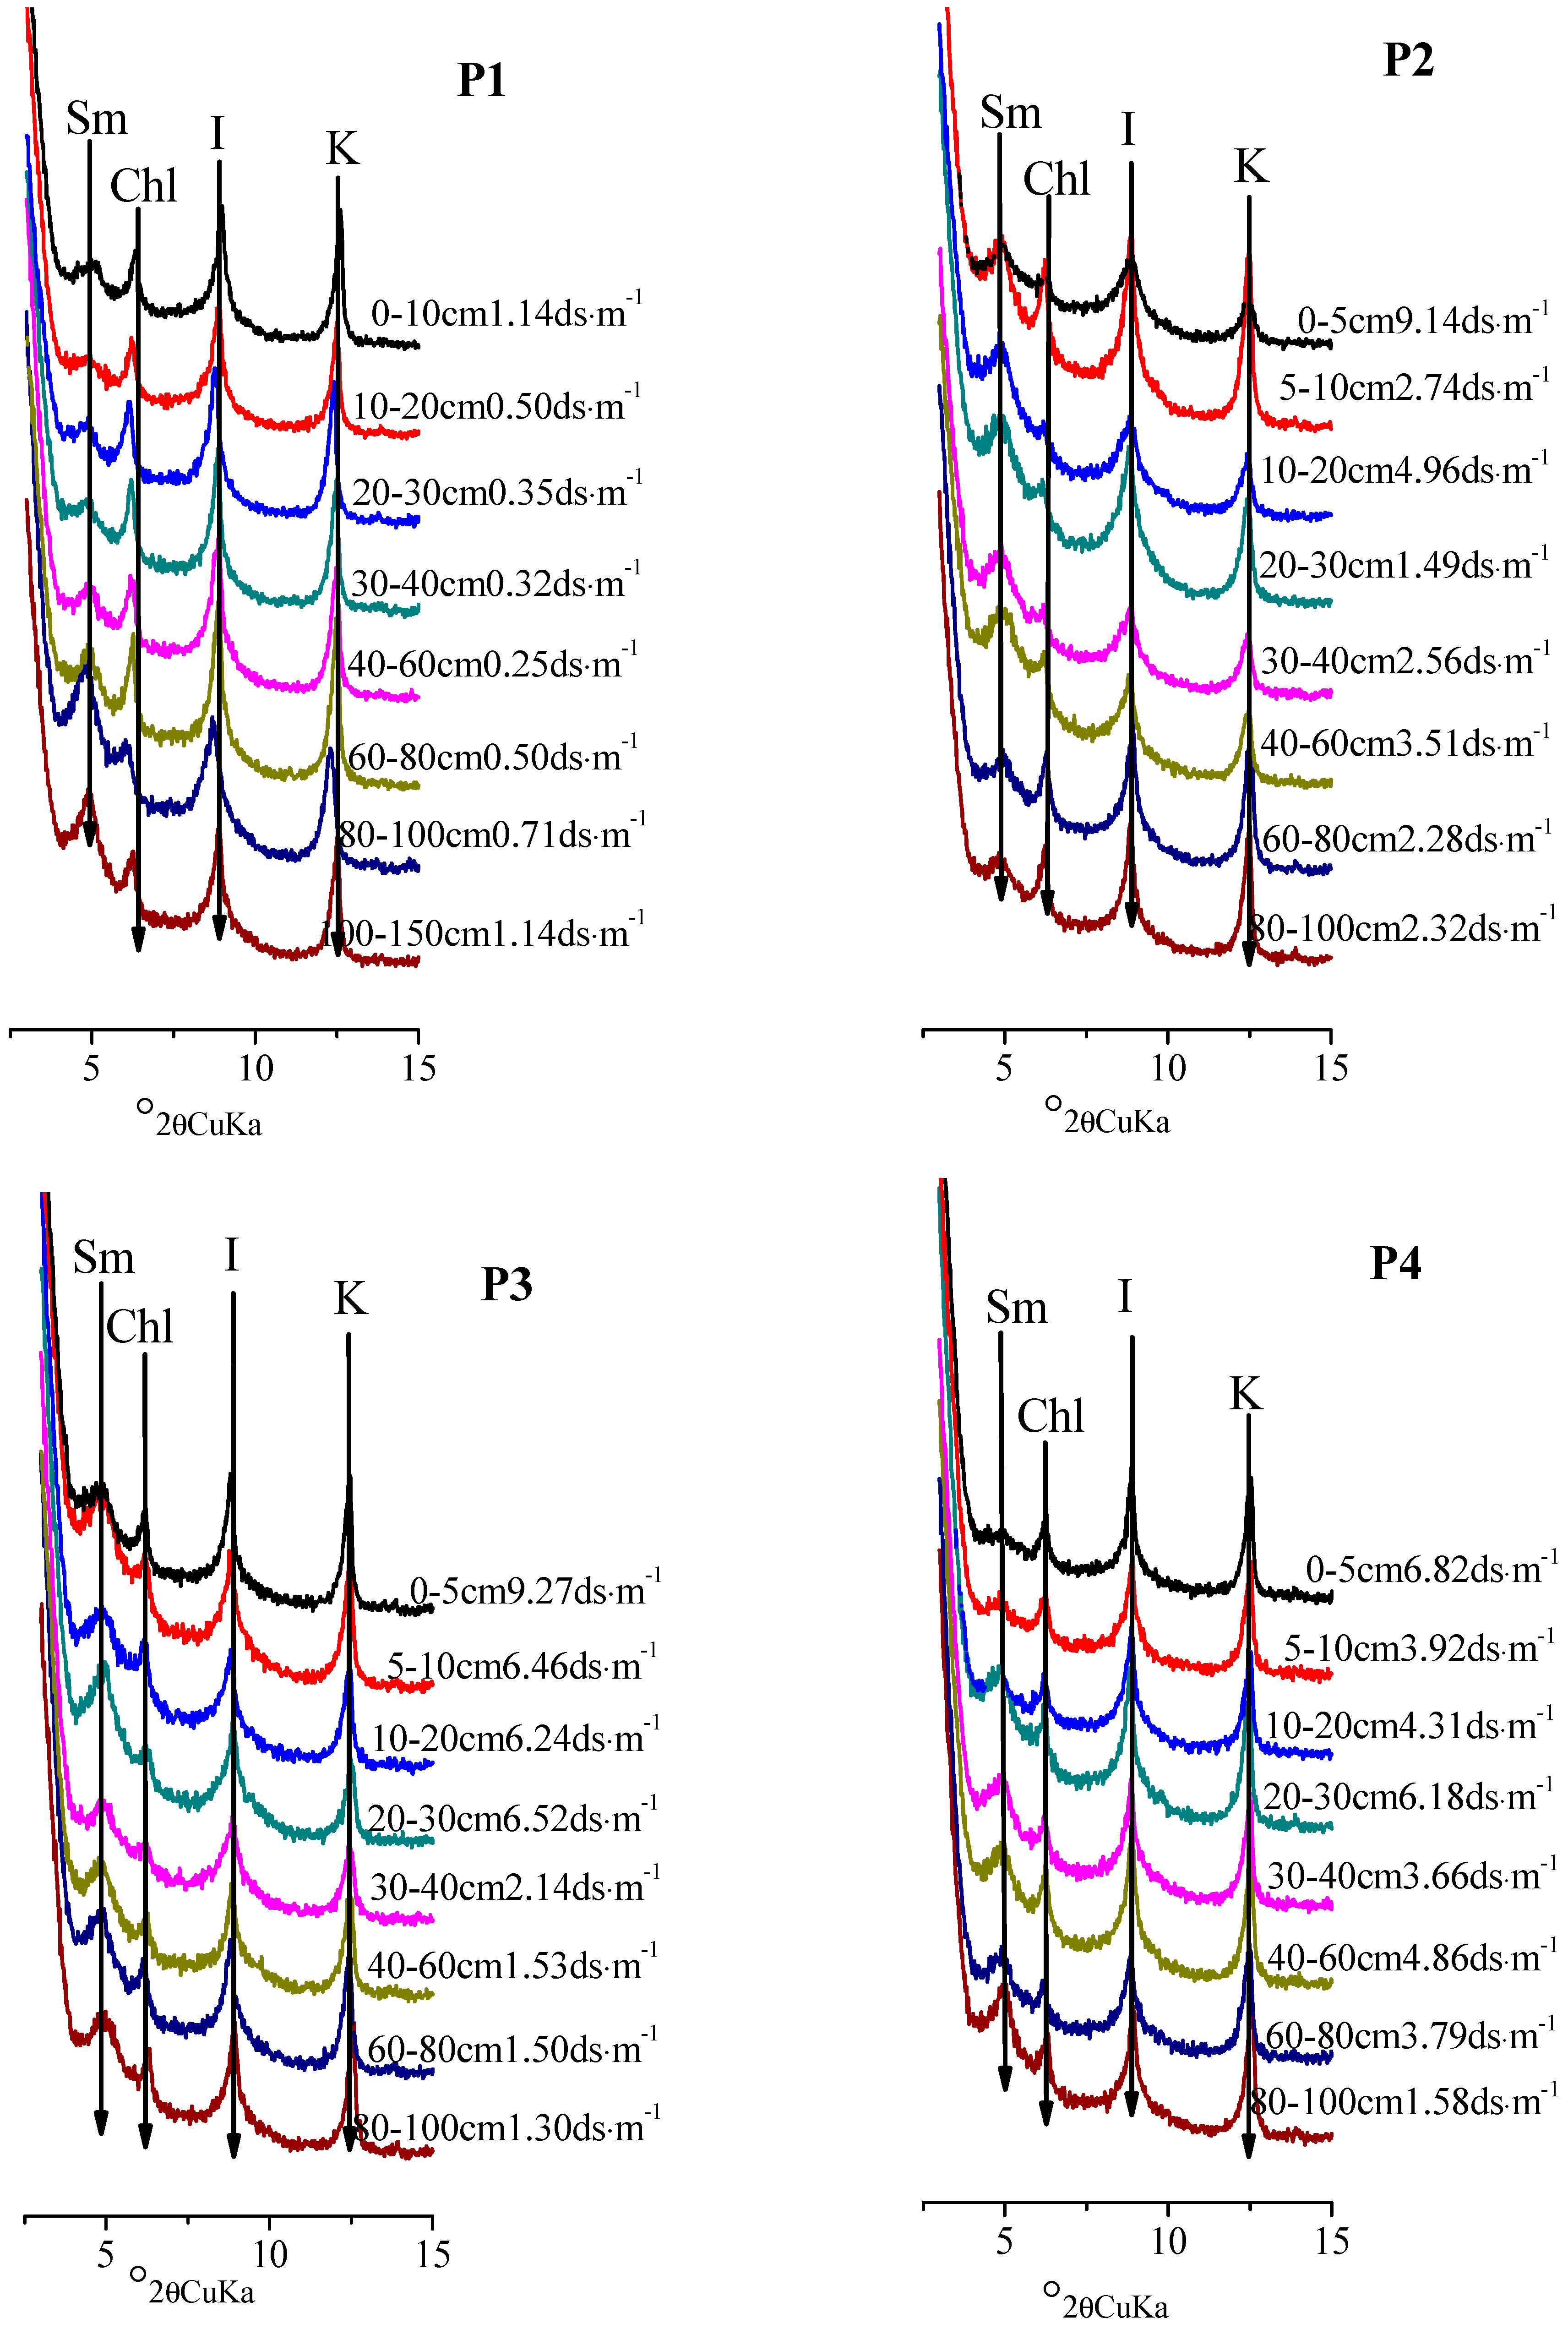
3.3. Distribution Characteristics of Smectite in Salinized Soil Profiles from Northern Xinjiang
3.4. Chemical Composition of Clay Minerals
3.5. The δ13C and δ18O Contents in Soil Secondary Carbonates and the δ13C Values of Soil Organic Matter
4. Discussions
5. Conclusions
Author Contributions
Acknowledgments
Conflicts of Interest
References
- Abtahi, A. Effect of a saline and alkaline ground water on soil genesis in semiarid southern Iran. Soil Sci. Soc. Am. J. 1977, 41, 583–588. [Google Scholar] [CrossRef]
- Mahjoory, R.A. The nature and genesis of some salt-affected soils in Iran. Soil Sci. Soc. Am. J. 1979, 43, 1019–1024. [Google Scholar] [CrossRef]
- Kapoor, B.S.; Singh, H.B.; Goswami, S.C.; Abrol, I.P. Weathering of micaceous minerals in some salt affected soils. J. Indian Soc. Soil Sci. 1981, 29, 486–492. [Google Scholar]
- Aoudjit, H.; Robert, M.; Elsass, F.; Curmi, P. Detailed study of smectite genesis in granitic saprolites by analytical electron microsopy. Clay Miner. 1995, 30, 135–147. [Google Scholar] [CrossRef]
- Wongpokhom, N.; Kheoruenromne, I.; Suddhiprakarn, A.; Gilkes, R.J. Micromorphological properties of salt affected soils in northeast Thailand. Geoderma 2008, 144, 158–170. [Google Scholar] [CrossRef]
- Furquim, S.A.C.; Graham, R.C.; Barbiero, L.; Queiroz Neto, J.P.; Vidal-Torrado, P. Soil mineral genesis and distribution in a saline lake landscape of the Pantanal wetland, Brazil. Geoderma 2010, 154, 518–528. [Google Scholar] [CrossRef]
- Furquim, S.A.C.; Barbiéro, L.; Graham, R.C. Neoformation of micas in soils surrounding an alkaline-saline lake of Pantanal wetland, Brazil. Geoderma 2010, 158, 331–342. [Google Scholar] [CrossRef]
- Abbaslou, H.; Abtahi, A. Origin and distribution of clay minerals in calcareous, gypsiferous, saline soils and sediments of Bakhtegan lake bank, southern Iran. Iran Agric. Res. 2007, 25, 71–86. [Google Scholar]
- Spiers, G.A.; Pawluk, S.; Dudas, M.J. Authigenic mineral formation by solodization. Can. J. Soil Sci. 1984, 64, 515–532. [Google Scholar] [CrossRef]
- Klages, M.G.; Southard, A.R. Weathering of montmorillonite during formation of a solodic soil and associated soils. Soil Sci. 1968, 106, 363–368. [Google Scholar] [CrossRef]
- Munn, L.C.; Boehm, M.M. Soil genesis in a Natrargid-Haplargid complex in northern Montana. Soil Sci. Soc. Am. J. 1983, 47, 1186–1192. [Google Scholar] [CrossRef]
- Tian, C.Y.; Zhou, H.F.; Liu, G.Q. The proposal on control of soil salinizing and agricultural sustaining development in 21′s century in Xinjiang. Arid Land Geogr. 2000, 23, 177–181. [Google Scholar]
- Wen, Z.W. Xinjiang Soil Geography; Science Press: Beijing, China, 1965. [Google Scholar]
- Lu, R.K. Soil Agricultural Chemical Analysis Method; China’s Agricultural Science and Technology Press: Beijing, China, 1999. [Google Scholar]
- Li, X.Y. Soil Chemistry and Experiment Instructor; China Agriculture Press: Beijing, China, 1997. [Google Scholar]
- Liu, Z.F.; Colin, C.; Huang, W.; Le, K.P.; Tong, S.Q.; Chen, Z.; Trentesaux, A. Climatic and tectonic controls on weathering in south China and the Indochina Peninsula: Clay mineralogical and geochemical investigations from the Pearl, Red, and Mekong drainage basins. Geochem. Geophys. Geosyst. 2007, 8, 1525–2027. [Google Scholar] [CrossRef]
- Wang, N.; Liu, W.G. Carbonate content and oxygen and carbon isotope composition of different grain size samples from the surface soil of arid land in northwest China. Arid Land Geogr. 2010, 33, 158–163. [Google Scholar]
- Sheng, X.F.; Chen, J.; Yang, J.D.; Ji, J.F. Carbon and oxygen isotopic composition of carbonate in different grain size fractions from losess-paleosol sequences, China. Geochemica 2002, 31, 105–112. [Google Scholar]
- Ahn, J.H.; Peacor, D.R. Illite/smectite from gulf coast shales: A reappraisal of transmission electron microscope images. Clay Clay Miner. 1989, 37, 542–546. [Google Scholar]
- Amouric, M.; Olives, J. Transformation mechanisms and interstratification in conversion of smectite to kaolinite: An HRTEM study. Clay Clay Miner. 1998, 46, 521–527. [Google Scholar] [CrossRef]
- Poage, M.A.; Chamberlain, C.P. Empirical relationships between elevation and the stable isotope composition of precipitation and surface waters: Considerations for studies of paleoelecation change. Am. J. Sci. 2001, 301, 1–15. [Google Scholar] [CrossRef]
- Liu, B.L.; Phillips, F.M.; Campbell, A.R. Stable carbon and oxygen isotopes of pedogenic carbonates, Ajo Mountains, southern Arizona: Implications for paleoenvironmental change. Palaeogeogr. Palaeoclimatol. Palaeoecol. 1996, 124, 233–246. [Google Scholar] [CrossRef]
- Wang, D.L.; Anderson, D.W. Stable carbon isotopes of carbonate pendants from Chernozemic soils of Saskatchewan, Canada. Geoderma 1998, 84, 309–322. [Google Scholar] [CrossRef]
- Yang, S.L.; Ding, Z.L.; Wang, X.; Tang, Z.H. Negative δ18O–δ13C relationship of pedogenic carbonate from northern China indicates a strong response of C3/C4 biomass to the seasonality of Asian monsoon precipitation. Palaeogeogr. Palaeoclimatol. Palaeoecol. 2012, 317–318, 32–40. [Google Scholar] [CrossRef]
- Peters, N.A.; Huntington, K.W.; Hoke, G.D. Hot or not? Impact of seasonally variable soil carbonate formation on paleotemperature and O-isotope records from clumped isotope thermometry. Earth Planet. Sci. Lett. 2013, 361, 208–218. [Google Scholar] [CrossRef]
- Levin, N.E.; Brown, F.H.; Behrensmeyer, A.K.; Bobe, R.; Cerling, T.E. Paleosol carbonates from the Omo group: Isotopic records of local and regional environmental change in east Africa. Palaeogeogr. Palaeoclimatol. Palaeoecol. 2011, 307, 75–89. [Google Scholar] [CrossRef]
- Shi, X.M.; Li, Y.L.; Yang, J.C. Climatic and tectonic analysis of Manas Lake changes. Sci. Geogr. Sin. 2008, 28, 266–271. [Google Scholar]
- Lin, R.F.; Wei, K.Q.; Cheng, Z.Y.; Wang, Z.X. A palaeoclimatic study on lacustrine cores from Manas Lake, Xinjiang, western China. Geochemica 1996, 25, 63–70. [Google Scholar]
- Sun, X.J.; Du, N.Q.; Weng, C.Y.; Lin, R.F. Paleovegetation and paleoenvironment of Manas Lake, Xinjiang, N. W. China during the last 14000 years. Quat. Sci. 1995, 3, 239–248. [Google Scholar]
- Singh, J.; Sawhney, J.S. Clay mineralogy of some salt-affected soils of south–west Punjab. J. Indian Soc. Soil Sci. 2006, 54, 461–464. [Google Scholar]
- Khormali, F.; Abtahi, A. Origin and distribution of clay minerals in calcareous arid and semi-arid soils of Fars Province, southern Iran. Clay Miner. 2003, 38, 511–527. [Google Scholar] [CrossRef]
- Zhang, L.Q.; Luo, X.R.; Liu, L.J.; He, D.F.; Xiang, B.L. Controls on clay mineral distribution in the Cenozoic sediments of the southern Junggar Basin, N.W. China. Chin. J. Geol. 2005, 40, 363–375. [Google Scholar]
- Proust, D.; Eymery, J.P.; Beaufort, D. Supergene vermiculitization of a mangnesan chlorite: Iron and magnesium removal processes. Clay Clay Miner. 1986, 34, 572–580. [Google Scholar] [CrossRef]
- Arshad, M.A.; Pawluk, S. Characteristics of some solonezic soils in the Glacial Lake Edmonton basin of Alberta II. Mineralogy. J. Soil Sci. 1966, 17, 48–55. [Google Scholar] [CrossRef]
- Omdi, F.E.; Daoudi, L.; Fagel, N. Origin and distribution of clay minerals of soils in semi-arid zones: Example of Ksob watershed (Western High Atlas, Morocco). Appl. Clay Sci. 2018, 163, 81–91. [Google Scholar] [CrossRef]
- Levy, G.J.; van der Watt, H.V. Effects of clay mineralogy and soil sodicity on soil infiltration rate. S. Afr. J. Plant Soil 1988, 52, 92–96. [Google Scholar] [CrossRef]
- Ransom, B.; Helgeson, H.C. Compositional and members and thermodynamic components of illite and dioctahedral aluminous smectite solid solutions. Clay Clay Miner. 1993, 41, 537–550. [Google Scholar] [CrossRef]
- Robert, M. The experimental transformation of mica toward smectite; relative importance of total charge and tetrahedral substitution. Clay Clay Miner. 1973, 21, 167–174. [Google Scholar] [CrossRef]
- Velde, B.; Church, T. Rapid clay transformations in Delaware salt marshes. Appl. Geochem. 1999, 14, 559–568. [Google Scholar] [CrossRef]
- Furquim, S.A.C.; Graham, R.C.; Barbiero, L. Mineralogy and genesis of smectites in an alkaline-saline environment of Pantanal wetland, Brazil. Clay Clay Miner. 2008, 56, 579–595. [Google Scholar] [CrossRef]
- Velde, B. Origin and Mineralogy of Clays: Clays and the Environment; Springer-Verlag: Heidelberg, Germany, 1995. [Google Scholar]


| Pedon | Elevation (m) | Parents Material | Characteristics of Soil Pedon | Agricultural Utilization |
|---|---|---|---|---|
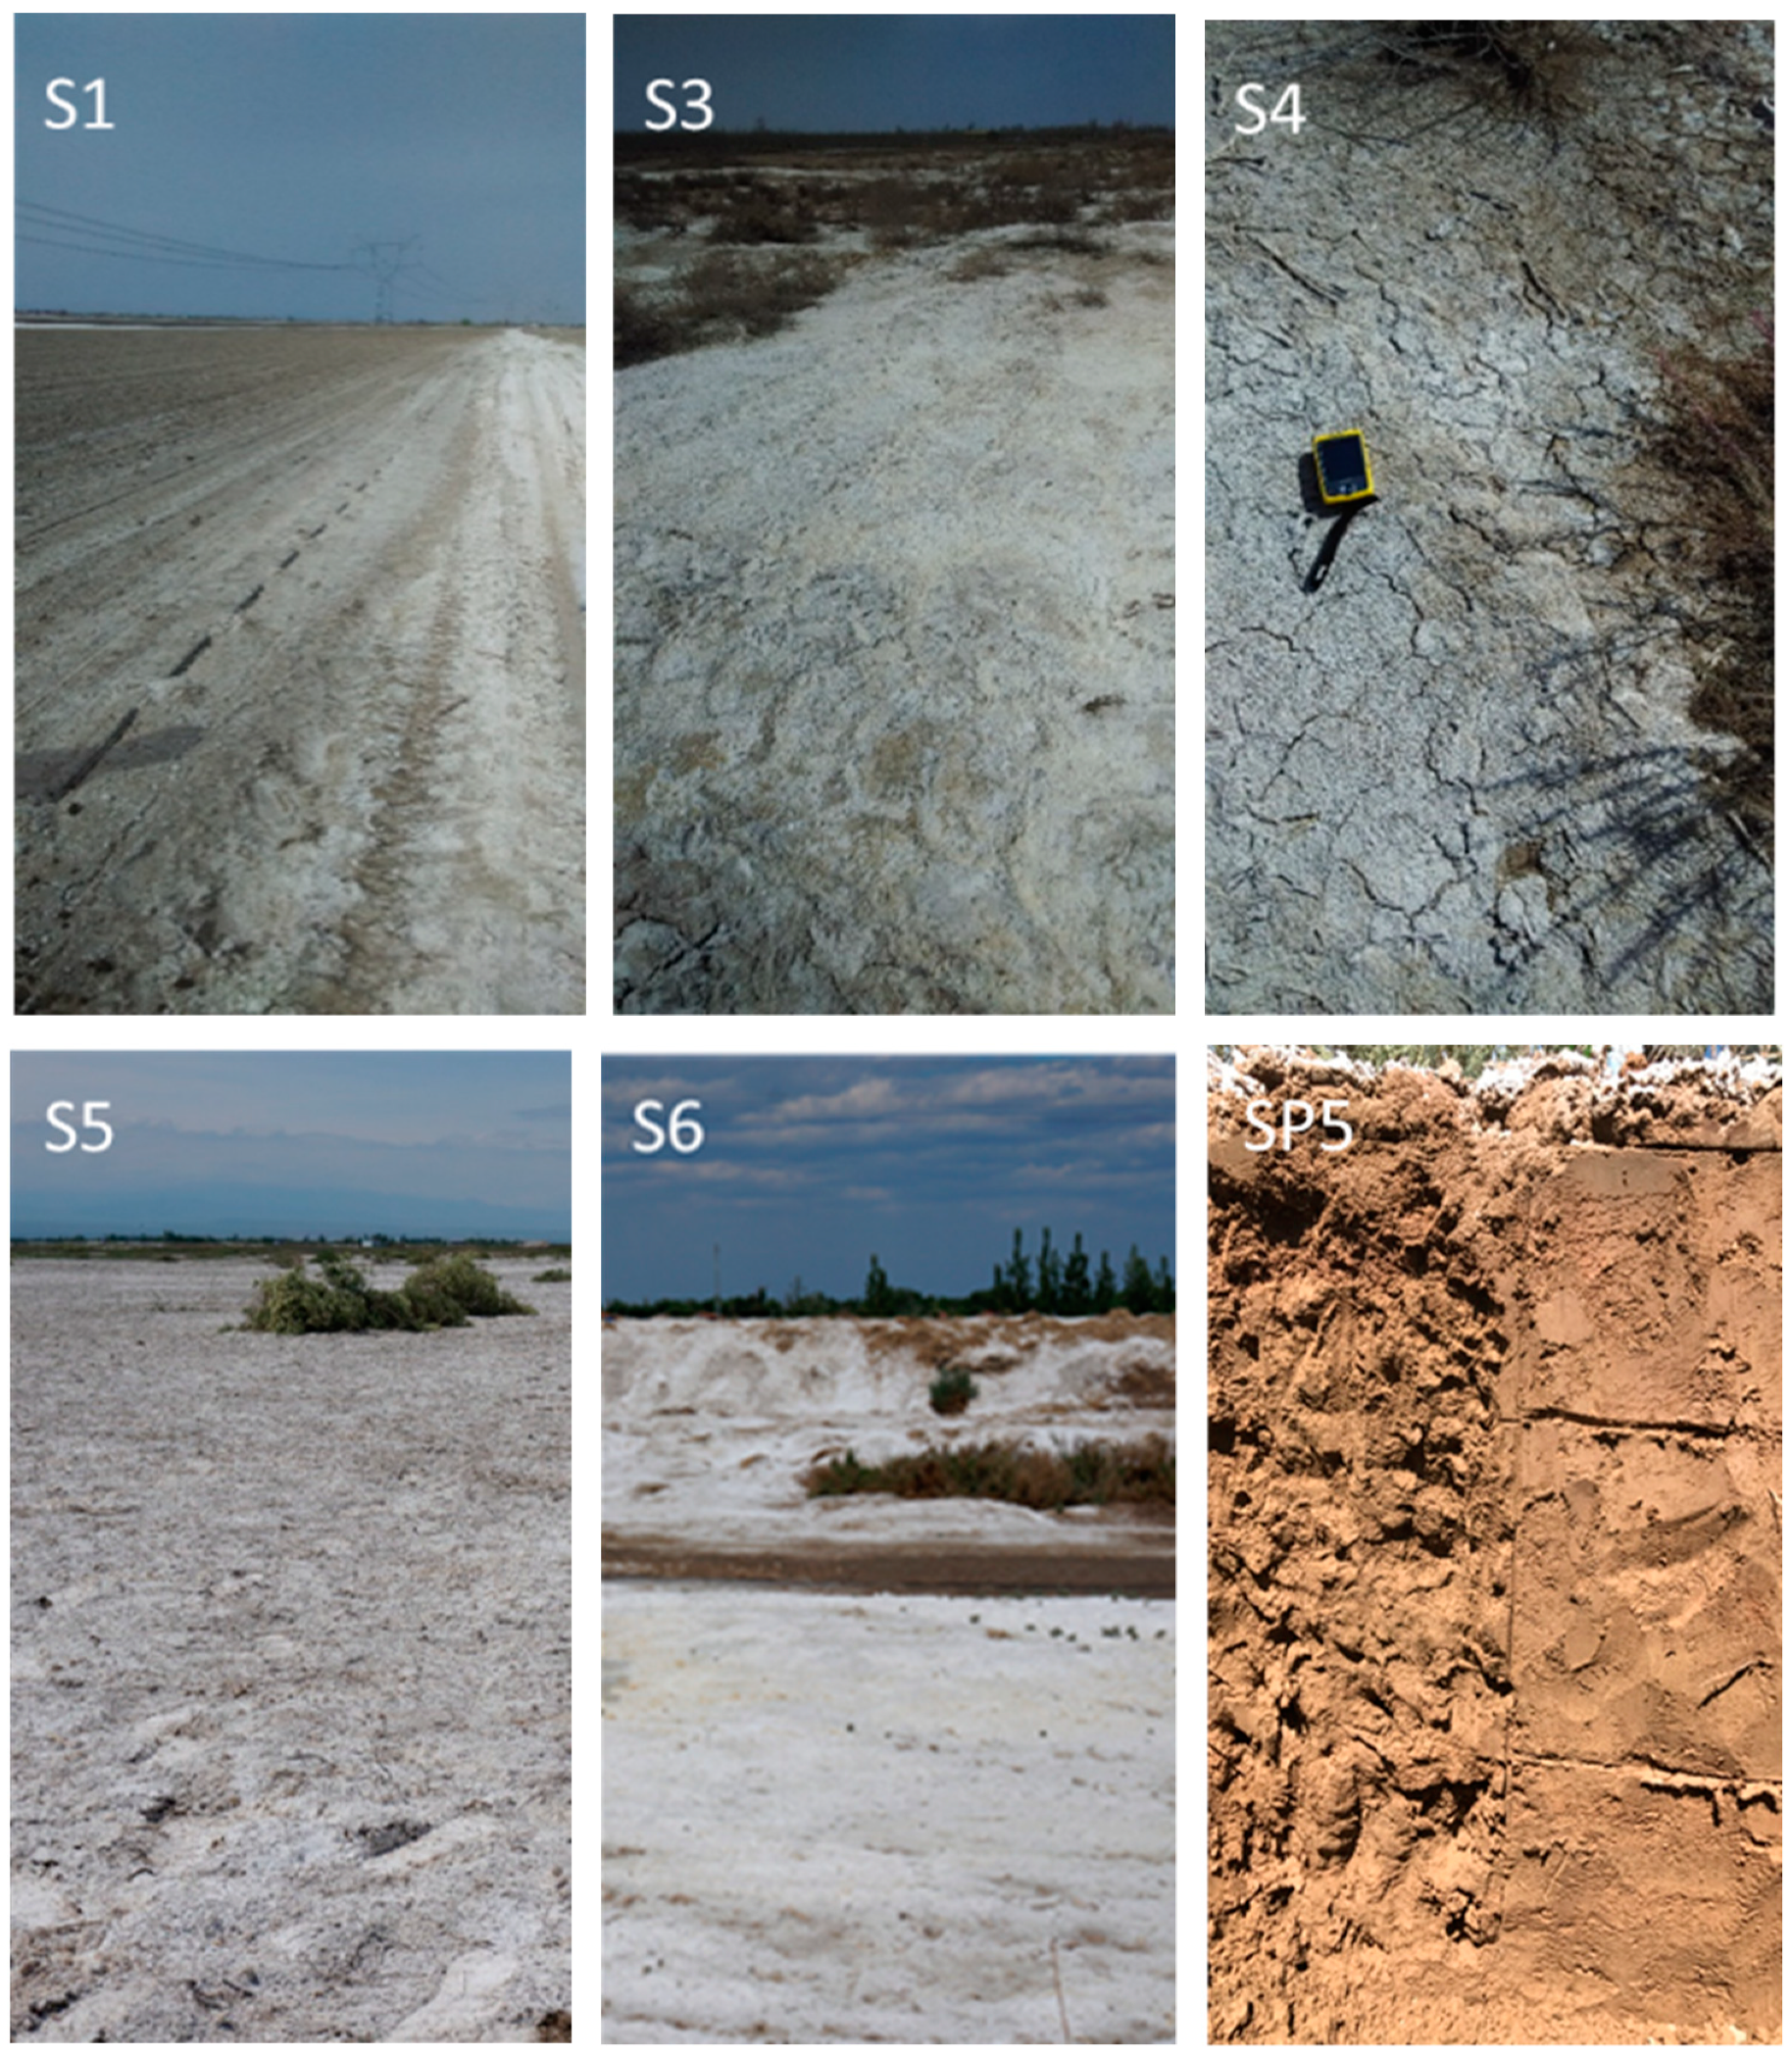
| P1 | 387 | Diluvium | There is a small amount of white sulphate crystals on the surface of the soil as shown in Figure 2, S1, where no salt crystals are present in the lower soil layer. | This area has been used for planting beets and equipped with drip irrigation. |
| P2 | 298 | Alluvium | The surface soil is hard white sulphate crust, where there are a small amount of salt crystals in the lower soil layers. | Uncultivated land with few natural vegetation. |
| P3 | 290 | Alluvium | The soil surface is white sulphate crust, mixed with a small amount of yellow carbonate as shown in Figure 2, S3. There are white salt crystals in the upper part of the soil, where there are no obvious salt crystals in the lower part. | Uncultivated land with only a small amount of Salsola collina Pall. growing. |
| P4 | 250 | Alluvium | There are white thin sulphate crystals in soil surface as shown in Figure 2, S4. | Uncultivated land with a small amount of Tamarix chinensis and Alhagi sparsifolia growing. |
| P5 | 346 | Diluvium | There is thick white loose sulphate crust on the surface of the soil, without yellow salt crystals as shown in Figure 2, S5. | Uncultivated land with a small amount of Karelinia caspica growing. |
| P6 | 345 | Diluvium | There is thick white sulphate crust on the surface of the soil, mixed with a small amount of yellow salt crystals as shown in Figure 2, S6. There are a lot of salt crystals in the soil. | Uncultivated land with a small amount of Karelinia caspica growing. |
| P7 | 348 | Diluvium | There is thick white loose sulphate crust. | Uncultivated land with a small amount of Karelinia caspica growing. |
| P8 | 341 | Diluvium | There is thick white loose sulphate crust. There is a lot of salt crystals in the soil. | Uncultivated land with a small amount of Karelinia caspica growing. |
| Pedon | Soil Layer (cm) | EC (ds·m−1) | Smectite | Illite | Kaolinite | Chlorite |
|---|---|---|---|---|---|---|
| P1 | 0–10 | 1.14 | 7 | 65 | 6 | 22 |
| 10–20 | 0.50 | 5 | 66 | 4 | 25 | |
| 20–30 | 0.35 | 8 | 62 | 4 | 26 | |
| 30–40 | 0.32 | 6 | 64 | 5 | 25 | |
| 40–60 | 0.25 | 8 | 65 | 3 | 24 | |
| 60–80 | 0.50 | 10 | 61 | 11 | 18 | |
| 80–100 | 0.71 | 24 | 50 | 2 | 24 | |
| 100–150 | 1.14 | 24 | 50 | 6 | 20 | |
| P2 | 0–5 | 9.14 | 6 | 69 | 6 | 19 |
| 5–10 | 2.74 | 13 | 60 | 8 | 19 | |
| 10–20 | 4.96 | 28 | 54 | 2 | 16 | |
| 20–30 | 1.49 | 16 | 60 | 3 | 21 | |
| 30–40 | 2.56 | 27 | 51 | 1 | 21 | |
| 40–60 | 3.51 | 26 | 51 | 3 | 20 | |
| 60–80 | 2.28 | 11 | 56 | 5 | 28 | |
| 80–100 | 2.32 | 8 | 57 | 8 | 27 | |
| P3 | 0–5 | 9.27 | 14 | 54 | 7 | 25 |
| 5–10 | 6.46 | 22 | 50 | 6 | 22 | |
| 10–20 | 6.24 | 22 | 49 | 5 | 24 | |
| 20–30 | 6.52 | 29 | 49 | 4 | 18 | |
| 30–40 | 2.14 | 14 | 60 | 6 | 20 | |
| 40–60 | 1.53 | 19 | 51 | 8 | 22 | |
| 60–80 | 1.50 | 18 | 52 | 9 | 21 | |
| 80–100 | 1.30 | 15 | 56 | 7 | 22 | |
| P4 | 0–5 | 6.82 | 3 | 61 | 6 | 30 |
| 5–10 | 3.92 | 4 | 60 | 11 | 25 | |
| 10–20 | 4.31 | 5 | 69 | 6 | 20 | |
| 20–30 | 6.18 | 13 | 58 | 9 | 20 | |
| 30–40 | 3.66 | 17 | 53 | 8 | 22 | |
| 40–60 | 4.86 | 13 | 59 | 5 | 23 | |
| 60–80 | 3.79 | 14 | 50 | 8 | 28 | |
| 80–100 | 1.58 | 19 | 53 | 6 | 22 | |
| P5 | 0–10 | 10.80 | 0 | 57 | 5 | 38 |
| 10–20 | 10.16 | 0 | 55 | 2 | 43 | |
| 20–30 | 9.59 | 17 | 48 | 7 | 28 | |
| 30–40 | 9.97 | 23 | 42 | 6 | 29 | |
| 40–60 | 12.04 | 34 | 36 | 5 | 25 | |
| 60–80 | 10.73 | 17 | 42 | 9 | 32 | |
| 80–100 | 5.38 | 18 | 48 | 7 | 27 | |
| 100–150 | 4.99 | 13 | 56 | 8 | 23 | |
| P6 | 0–10 | 10.40 | 0 | 71 | 4 | 25 |
| 10–20 | 8.31 | 24 | 40 | 6 | 30 | |
| 20–40 | 12.05 | 39 | 33 | 8 | 20 | |
| P7 | 0–10 | 9.00 | 15 | 49 | 9 | 27 |
| 10–20 | 11.03 | 33 | 40 | 8 | 19 | |
| 20–30 | 12.07 | 24 | 39 | 6 | 31 | |
| 30–40 | 14.20 | 28 | 38 | 7 | 27 | |
| P8 | 0–10 | 10.80 | 0 | 50 | 8 | 42 |
| 10–20 | 7.35 | 24 | 37 | 7 | 32 | |
| 20–40 | 9.26 | 23 | 39 | 6 | 32 |
| Pedons | Soil Layer | SiO2 | Fe2O3 | Al2O3 | MgO | CaO | Na2O | K2O | TiO2 | MnO | P2O5 |
|---|---|---|---|---|---|---|---|---|---|---|---|
| 1 | 0–10 | 51 | 8.62 | 35.08 | 0.74 | 0.27 | 1.11 | 2.00 | 0.73 | 0.08 | 0.09 |
| 10–20 | 55 | 8.70 | 31.14 | 0.73 | 0.27 | 1.08 | 2.02 | 0.71 | 0.08 | 0.11 | |
| 20–30 | 51 | 8.81 | 34.71 | 0.83 | 0.26 | 1.10 | 2.13 | 0.73 | 0.08 | 0.13 | |
| 30–40 | 44 | 8.51 | 42.30 | 0.97 | 0.28 | 1.10 | 2.23 | 0.73 | 0.08 | 0.10 | |
| 40–60 | 48 | 8.48 | 38.30 | 0.80 | 0.24 | 1.06 | 2.10 | 0.75 | 0.07 | 0.09 | |
| 60–80 | 65 | 9.44 | 21.02 | 0.21 | 0.30 | 1.08 | 1.54 | 0.75 | 0.09 | 0.10 | |
| 80–100 | 66 | 8.51 | 21.23 | 0.23 | 0.28 | 1.05 | 1.35 | 0.75 | 0.08 | 0.09 | |
| 100–150 | 66 | 8.55 | 21.50 | 0.24 | 0.24 | 1.00 | 1.33 | 0.74 | 0.07 | 0.10 | |
| 5 | 0–10 | 53 | 7.93 | 35.13 | 0.11 | 0.42 | 1.22 | 1.38 | 0.75 | 0.07 | 0.08 |
| 10–20 | 58 | 8.33 | 29.84 | 0.35 | 0.40 | 1.12 | 0.59 | 0.78 | 0.08 | 0.08 | |
| 20–30 | 70 | 7.97 | 18.68 | 0.10 | 0.23 | 0.96 | 0.89 | 0.68 | 0.06 | 0.11 | |
| 30–40 | 65 | 7.59 | 22.79 | 0.34 | 0.48 | 1.22 | 1.26 | 0.65 | 0.06 | 0.09 | |
| 40–60 | 69 | 7.97 | 19.38 | 0.26 | 0.34 | 1.06 | 1.24 | 0.72 | 0.07 | 0.08 | |
| 60–80 | 70 | 7.54 | 18.76 | 0.28 | 0.40 | 0.95 | 1.08 | 0.67 | 0.06 | 0.08 | |
| 80–100 | 70 | 7.84 | 18.45 | 0.21 | 0.46 | 1.09 | 1.07 | 0.71 | 0.07 | 0.08 | |
| 100–150 | 72 | 7.99 | 15.94 | 0.20 | 0.28 | 0.95 | 1.20 | 0.72 | 0.06 | 0.07 |
| Profile | Soil Layer | Organic Matter | CaCO3 | |
|---|---|---|---|---|
| δ13C (‰, VPDB) | δ18O (‰) | δ13C (‰, VPDB) | ||
| P5 | 0–10 | −17.6 | −9.44 | −1.53 |
| 10–20 | −20.3 | −9.54 | −1.76 | |
| 20–30 | −19.8 | −10.56 | −1.80 | |
| 30–40 | −20.6 | −10.31 | −3.13 | |
| 40–60 | −21.6 | −11.04 | −3.73 | |
| 60–80 | −21.4 | −10.32 | −3.19 | |
| 80–100 | −22.1 | −9.67 | −3.48 | |
| 100–150 | −21.2 | −10.17 | −5.00 | |
© 2019 by the authors. Licensee MDPI, Basel, Switzerland. This article is an open access article distributed under the terms and conditions of the Creative Commons Attribution (CC BY) license (http://creativecommons.org/licenses/by/4.0/).
Share and Cite
Xie, H.; He, S.; Huang, C.; Tan, W. Origin of Smectite in Salinized Soil of Junggar Basin in Xinjiang of China. Minerals 2019, 9, 100. https://doi.org/10.3390/min9020100
Xie H, He S, Huang C, Tan W. Origin of Smectite in Salinized Soil of Junggar Basin in Xinjiang of China. Minerals. 2019; 9(2):100. https://doi.org/10.3390/min9020100
Chicago/Turabian StyleXie, Haixia, Shuai He, Chuanqin Huang, and Wenfeng Tan. 2019. "Origin of Smectite in Salinized Soil of Junggar Basin in Xinjiang of China" Minerals 9, no. 2: 100. https://doi.org/10.3390/min9020100
APA StyleXie, H., He, S., Huang, C., & Tan, W. (2019). Origin of Smectite in Salinized Soil of Junggar Basin in Xinjiang of China. Minerals, 9(2), 100. https://doi.org/10.3390/min9020100