Abstract
The Detour Lake deposit is at a faulted contact between mafic volcanic and siliciclastic to volcaniclastic rocks, differing from other orogenic Au deposits in the dominantly greenschist facies Abitibi region, by possessing amphibolite facies assemblages. Consequently, typical indicator minerals for mineralization, like secondary biotite, may not be useful for locating ore zone, due to the challenge of distinguishing hydrothermal versus metamorphic and magmatic phases. Herein, geochemical and 40Ar/39Ar geochronological data are presented for biotite from mineralized and barren (distal) magmatic rocks to characterize potential geochemical and geochronological variations between biotite types. Petrological observations reveal four biotite types: (1) Biotite hosted in mineralized, sulphidized quartz-calcite veins, (2) halo biotite at the margins of the aforementioned veins; (3) host rock biotite defining the foliation within the mafic volcanic rocks of the deposit; and (4) biotite defining the foliation within the barren meta-plutonic host rocks. Chemical analysis reveals a lower Ti- and higher Mg-content of mineralized biotite types, indicative of secondary hydrothermal processes. 40Ar/39Ar ages for all biotite types (2600–2390 Ma) post-date the main syn-deformation mineralization event at Detour Lake (≤2700 Ma). These results suggest chemical variations within biotite are due to a post-mineralization hydrothermal event, thus biotite should be used cautiously as a vector for gold mineralization in amphibolite facies terranes.
1. Introduction
Previous studies of orogenic Au deposits in the Archean Superior Province, including the Canadian Malartic deposit [1,2] and the Mouska deposit [3], have highlighted the importance of biotite as indicator minerals for Au mineralization and for constraining the paragenesis of mineralization. At the Detour Lake deposit, northeastern Ontario, a late, post-metamorphic biotite-bearing hydrothermal alteration mineral assemblage related to auriferous veins and broader mineralized zones, with disseminated Au, was identified [4]. A previous study observed an extensive biotite-rich halo surrounding the main mineralized zone in the hanging wall of the Detour Lake deposit, resulting in mafic volcanic host rocks with a purple-maroon appearance [5]. On the basis of these field relationships, hydrothermal biotite was suggested to be an important visual indicator mineral for the exploration and production geology teams to target and delineate Au ore zones. However, mafic volcanic host rocks at the Detour Lake deposit are metamorphosed to lower amphibolite facies and comprise a biotite-bearing peak metamorphic mineral assemblage (actinolite–biotite–plagioclase–epidote–almandine ± calcite ± quartz ± ilmenite) [5], which obscures the relationship between secondary biotite and Au mineralization. Differentiating metamorphic and secondary hydrothermal biotite is particularly challenging within low-grade disseminated Au ore zones, which are typically devoid of large quartz veins and other visual Au indicators. In this study, we aim to add constraints on the paragenesis of the Detour Lake deposit by identifying and documenting different biotite generations within the mineralized mafic volcanic rocks of the Detour Lake Formation and barren felsic to mafic magmatic rocks distal (5–120 km) to the deposit by discerning between metamorphic, hydrothermal, and igneous biotite through a combination of petrographical, geochemical, and geochronological analyses.
2. Geological Setting
2.1. Abitibi Subprovince
The Abitibi Subprovince is located in the southernmost region within the Superior Province, which is a well-known region in Canada for its abundance in economic base- and precious-metal mineral deposits, including orogenic Au deposits (Figure 1). The subprovince consists predominantly of Neoarchean mafic to ultramafic volcanic and lesser felsic to intermediate volcanic rocks (2750–2676) Ma [5,6,7,8,9], which have been intruded by syn-volcanic tonalite and gabbrodiorite dikes and plutons. The volcanic rocks are unconformably overlain by younger sedimentary assemblages, such as the Porcupine (2690–2680 Ma) and Timiskaming (<2676 Ma) assemblages [6,9,10]. The unconformable contacts between the volcanic and sedimentary assemblages also correspond to east-west trending, variably dipping thrust faults that were reactivated as strike-slip faults during the later stages of orogenesis (2650–2600 Ma) [11]. Some of these faults, including the Porcupine-Destor and Cadillac-Larder Lake deformation zones, are known for hosting world-class Au deposits [12,13,14].
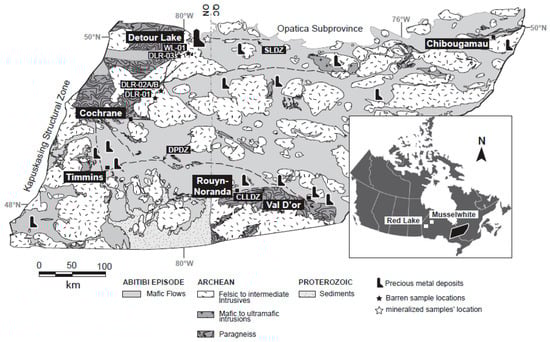
Figure 1.
Geological map of the Abitibi Subprovince of eastern Canada showing the location of the Detour Lake mine along an east-west trending high-strain deformation zone (SLDZ) north of the well-known Abitibi greenstone belt [15]. Barren sample locations are shown with black stars. Location of Red Lake and Musselwhite mining districts are also shown on inset map of Canada.
The Abitibi Subprovince has undergone several deformation events, resulting in its current structure: (1) Collision between the Abitibi Subprovince and northern Superior subprovinces pre-dating the deposition of the Porcupine Assemblage at ca. 2690 Ma [14] and locally forming a north-trending cleavage and folds with north-trending axial planes; (2) refolding of the sedimentary assemblages, pre-dating the deposition of Porcupine and Timiskaming Assemblages (ca. 2676 Ma), which is associated with deformation structures within the Au-bearing Porcupine-Destor deformation zone [7]; and (3) folding and faulting of the Timiskaming Assemblage, which represents an important control on the occurrence and geometry of Au deposits along the auriferous Porcupine-Destor and Cadillac-Larder Lake deformation zones [10,14,16]. The Abitibi Subprovince was subjected to lower-middle greenschist facies metamorphism at ca. 2677–2643 Ma [17,18].
2.2. Detour Lake Deposit
The Detour Lake deposit is a Neoarchean orogenic Au deposit, located in the northernmost region of the Abitibi Subprovince in Canada, along the subvertical, brittle-plastic, regional-scale deformation zone, referred to as the Sunday Lake Deformation Zone [5] (SLDZ; Figure 1). The SLDZ is also the unconformable contact between the mafic volcanic rock dominated Detour Lake Formation (<2725 Ma [5]), and the siliciclastic to volcaniclastic Caopatina Assemblage (ca. 2700 Ma [4,19,20]; Figure S1). The unconformity corresponds to the first of four major regional-scale deformation events (D1–D4 [5]; Figure S1). The second deformation event, D2, formed shallow, west-plunging folds with subvertical, east-west trending axial planes. This event also resulted in the development of a pervasive foliation fabric in the mafic volcanic host rocks, S2, which is axial planar to the D2 folds. The third deformation event, D3, produced open, north-northwest trending, shallowly plunging folds, which are associated with a crenulation fabric, S3. This fabric, however, is strongly localized and best developed within ultramafic flows adjacent to the SLDZ. The fourth and last major deformation event in the region, D4, is characterized by a series of southeast-striking faults that splay from the main SLDZ.
The S2 foliation fabric is defined by actinolite and biotite that make up part of the lower amphibolite facies metamorphic mineral assemblage (actinolite–biotite–plagioclase–epidote–almandine ± calcite ± quartz ± ilmenite [5]), suggesting peak metamorphic conditions were reached during D2. Using the fO2-controlled prograde metamorphic mineral assemblage of actinolite–biotite–plagioclase–epidote–almandine, peak metamorphic conditions were estimated to be ~550 °C at ~3.3 kbar [5]. The metamorphic conditions are consistent with the compositional range of plagioclase (An28-58) [4] and pressure-temperature conditions that exceeded the stability of prograde chlorite (510–540 °C [21]). Since the sedimentary rocks of the Caopatina Assemblage (ca. 2700 Ma; [4,19,20]) are metamorphosed and folded during D2, the timing of the main regional deformation fabric and metamorphism at Detour Lake is constrained to ≤2700 Ma. The inclusion of prograde metamorphic minerals in pre- to syn-D2 mineralized veins also suggests peak metamorphic conditions were reached during D2 [5].
Eight vein types were identified within the Detour Lake Deposit: Six pre- to syn-D2 and two post- D2 [22]. Pre- to syn-D2 vein types include: Pillow veins (V1); completely transposed and dismembered quartz veins (V2) of uncertain timing and affinity; laminated-sulphidized (pyrite-pyrrhotite-chalcopyrite-arsenopyrite) quartz veins (V3), folded quartz-calcite veins (V4), folded-sulphidized (pyrite-pyrrhotite-chalcopyrite) quartz-calcite-chlorite veins (V5), and calcite veinlets (V6). Post-D2 veins consist of planar calcite veinlets (V7), and carbonate breccia veins that locally possess sericitized and carbonatized alteration halos (V8). The most relevant Au-bearing vein set for this study is the pre- to syn-D2 folded-sulphidized (pyrite–pyrrhotite–chalcopyrite) quartz-calcite-chlorite vein set (V5; Figure 2; [22]), which make up the main ore body and locally contain coarse, visible Au. They are mostly composed of quartz and calcite with some chlorite, biotite, and sulphides (pyrite, pyrrhotite, chalcopyrite) and usually have a biotite alteration halo, whereas post-D2 veins possess a sericitized vein margin. Locally, the structures common to shear veins, include foliated wall rock selvages and dilational jogs between en echelon and isolated veinlets that can be interpreted with a pre- to syn-D2 timing for this vein type.
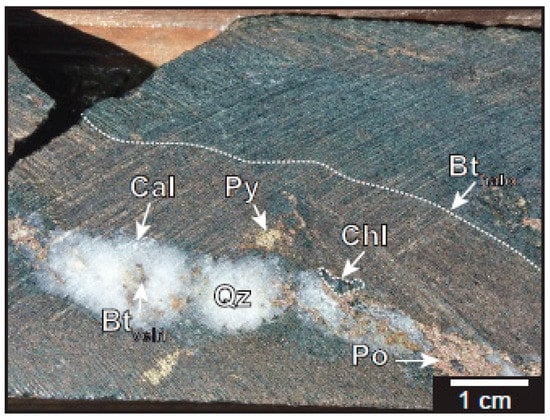
Figure 2.
Photograph of a representative drill core showing mineralized pre- to syn-D2 folded-sulfidized quartz-calcite-chlorite veins (V5). Bthalo: biotite alteration adjacent to vein; Btvein: biotite hosted within vein; Cal: calcite; Chl: chlorite; Po: pyrrhotite; Py: pyrite; Qz: quartz [22].
3. Analytical Methods
Biotite-bearing samples were collected from drill core intersecting the main Detour Lake ore body, exposures within the active open-pit mining operation, and roadside outcrops with increasing distance to the deposit (Figure 1; Figure S1). Due to extensive glacial overburden in the study region, access to exposed crystalline bedrock was limited for the barren samples. Sampling criteria consisted of host rocks, containing large (>100 μm) visible biotite crystals across a range of lithotypes in the mineralized hanging wall and footwall of the SLDZ, and barren felsic to mafic volcanic rocks away from the deposit. We attempted to sample rocks with large biotite crystals to minimize the effects of 39Ar recoil. Mineralized samples, include biotite that is ubiquitous in the host rock defining the main S2 foliation fabric, forming a halo around mineralized veins, and samples where the biotite is hosted within the mineralized pre- to syn-D2 vein sets. Barren samples consist of biotite defining the main foliation of felsic to intermediate plutonic rocks distal to the main ore body, which correspond to the syn-volcanic tonalite and gabbrodiorite dikes and plutons within the Abitibi Subprovince (Figure 1).
Petrographic observations were collected before conducting geochemical and geochronological analyses to identify potential biotite types, based on colour, morphology, and structural location (Figure 3). The sample names, rock types, structural positions, and modal mineralogy are reported in Table 1. Fourteen samples (nine mineralized, five barren) representative of all biotite types, based on petrographic observations were targeted for electron microprobe analyses (EMPA; Table 2, Figure 4), ten samples (seven mineralized, three barren) were selected for in situ chemical mapping (WDS; Figure 5 and Figure 6), and fifteen samples (ten mineralized, five barren) were analyzed for 40Ar/39Ar dating (Table S2, Figure 7).
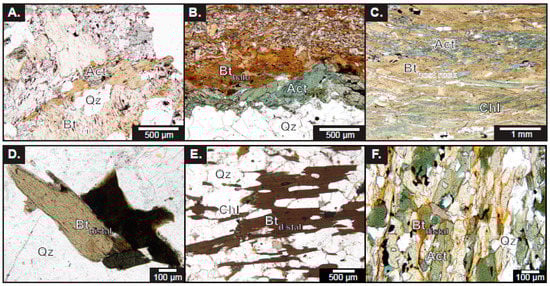
Figure 3.
Photomicrographs of the four biotite types of the Detour Lake deposit. (A) Very coarse-grained and fine-grained subhedral-euhedral vein biotite in a mineralized pre- to syn-D2 folded-sulfidized quartz-calcite-chlorite veins (V5; MV-02) intergrown with actinolite. (B) Medium-grained, euhedral halo biotite parallel to the pre- to syn-D2 vein margins (MV-02). Halo biotite are overprinted by actinolite. (C) Coarse-grained euhedral host rock biotite from a mineralized biotite schist sample (FW-10). Host rock biotite are overprinted by alternating bands of chlorite and actinolite. (D) Cluster of coarse-grained, euhedral barren biotite within the matrix of a barren subgreenschist facies meta-granite (DLR-03). (E) Coarse grained, subhedral-euhedral barren biotite defining the main foliation fabric of a barren greenschist facies biotite schist sample (DLR-02) and overgrowing chlorite. (F). Very fine grained, anhedral barren biotite aligned with the main foliation fabric in a barren amphibolite facies meta-volcanic sample (WL-01).

Table 1.
Mineralogy, structural position, and conducted analyses of each sample from Detour Lake deposit.
Table 2.
Representative electron microprobe (EMP) analyses of biotite at the Detour Lake deposit.
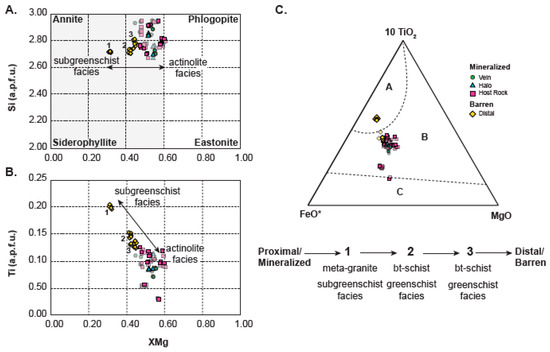
Figure 4.
(A) Si vs. XMg binary diagram showing the Mg-rich biotitic compositions of all four biotite populations with relatively elevated di-octahedral mica proportions. Note, barren biotite reveal slightly lower XMg compositions with one sample plotting at ~0.30 XMg (DLR-03). Biotite compositional field is shown in grey. (B) Ti vs. XMg binary diagram of all four biotite types revealing slightly higher Ti compositions in barren biotite with one sample possessing a relatively higher Ti content at 0.20 a.p.f.u. (DLR-03). C. TiO2–FeO*–MgO ternary diagram of the four biotite types divided in three domains: (A) primary magmatic biotite, (B) reequilibrated biotite, and (C) neoblastic biotite [23]. All biotite types plot within the reequilibrated biotite domain with the exception of one barren sample (DLR-03) plotting within the primary magmatic domain and one mineralized host rock sample (FW-03) plotting at the margins of the neoblastic domain. Note, the compositional variations within the barren biotite is not correlated with increasing distance from the deposit but rather with decreasing metamorphic grade. Lighter coloured markers represent compositions from the wider and more flexible range of acceptable EMPA data.
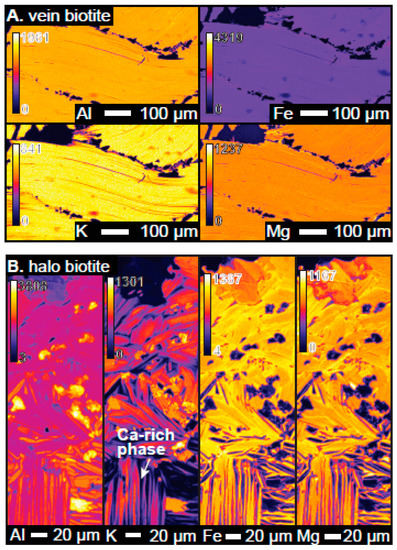
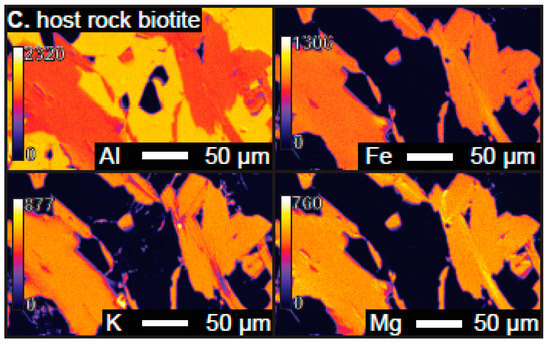
Figure 5.
WDS chemical oxide maps of the three mineralized biotite types with an amphibolite facies metamorphic grade: (A) vein biotite from a pre- to syn-D2 vein within an amphibolite facies meta-volcanic sample (MV-02); (B) halo biotite at the margins of a pre- to syn-D2 vein within an amphibolite facies meta-volcanic sample (MV-02); and (C) host rock biotite within an amphibolite facies biotite schist sample (FW-11). Warm colours are higher elemental concentrations; cool colours are lower elemental concentrations. Note, colour-scales show elemental counts and are individually adjusted for each map to best visualize chemical heterogeneities. Chemical maps from all mineralized biotite types reveal homogeneous compositions with slightly Fe-rich and K-poor cleavage planes, with the exception of halo biotite revealing bands of a Ca-Al rich and Fe-Mg-K poor mineral phase within the biotite crystals.
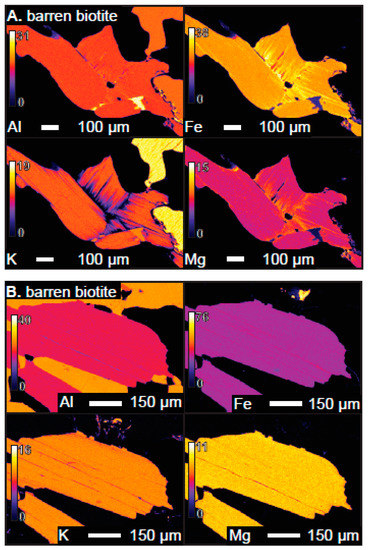
Figure 6.
WDS elemental chemical maps of the four biotite types with increasing metamorphic grade: (A,B) biotite from barren host rocks metamorphosed to subgreenschist and greenschist facies, respectively (DLR-03, DLR-02). Warm colours are higher elemental concentrations; cool colours are lower elemental concentrations. Note, colour-scales show wt% oxide concentrations and are individually adjusted for each map to best visualize chemical heterogeneities. Chemical maps from all barren biotite types reveal homogeneous compositions with slightly Fe-rich and K-poor cleavage planes.
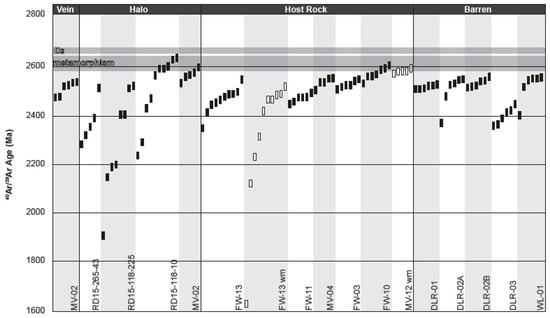
Figure 7.
Diagram showing single crystal 40Ar/39Ar ages from biotite (black bars) and muscovite (white bars) from fifteen samples (ten mineralized; five barren) representing the four mica types. The height of each bar represents the ±10 m.y. uncertainty of the apparent age that we applied to all samples as an average error. Note that all four biotite types yield similar ages that significantly postdate the timing of major deformation events, regional metamorphism and gold mineralization.
3.1. EMPA Geochemistry
Mineralized and barren samples were selected for geochemical analyses, in order to characterize geochemical differences between biotite types. Biotite samples were initially imaged with a JEOL 6610LV Scanning Electron Microscope (SEM; University of Ottawa, Ottawa, ON, Canada) to target the most representative biotite crystals for further geochemical analyses. Mineral chemical compositions were determined in fourteen samples using the JEOL JXA-8230 SuperProbe at the University of Ottawa. The analyses were conducted with an accelerating voltage of 20 kV and probe current of 20 nA to focus and concentrate the beam to a minimum of 1 μm. The following standards were used: SiKα, AlKα, and KKα, sanidine; CaKα, MgKα diopside; FeKα, hematite; MnKα, tephroite; TiKα, rutile; NaKα, albite; FKα, fluorite; ClKα, tugtupite. A total of 2–6 biotite grains per polished thin section were analyzed by probing 3–4 points per single mica grain, in order to explore possible chemical variations within the grains and between biotite types. Cation site distribution was calculated with established protocols [24,25]. In order to discard contaminated analyses, we retained EMP analyses with an oxide sum between 92 and 96 wt %, and containing <3 Si cations and between 0.9–1.0 K + Na cations per structural formulae on the basis of 11 O. Due to the limited number of least-altered analyses (n: 42), we have also kept EMP analyses with a total oxide sum up to 99 wt % for comparison. Analytical results are reported in Table 2, Table S1 and presented in Figure 4, Figure S2.
In addition to EMP analyses, X-ray chemical maps of biotite types from ten samples, which best represented the various biotite types identified through petrography, have been produced to assess any spatial chemical variation within individual biotite crystals. Mapping was conducted using both the wavelength dispersive spectrometer (WDS) and the energy dispersive spectrometer (EDS) of the JEOL JXA-8230 SuperProbe at the University of Ottawa. An accelerating voltage of 20 kV and a beam current of 20–40 nA were combined with a spot size of 1 μm to produce maps ranging from 100 × 150 to 400 × 400 pixels with a 1 μm pixel size and 150–200 ms dwell time on each pixel. Analyzed elements, include Fe, Mg, Mn, Na, Ca, Si, O, P, S, C, Cl, Ti, K, and Al. Chemical maps were converted to wt% oxide maps by calculating a full ZAF correction for each pixel. The backgrounds for each element were calculated using the Mean Atomic Number technique (MAN [26,27]). The maps for Al, K, Fe, and Mg of each biotite type are presented in Figure 5 and Figure 6.
3.2. 40Ar/39Ar Geochronology
After collecting petrographic and geochemical data on the biotite types, 40Ar/39Ar analyses were carried out to explore the timing of biotite crystallization and cooling. Mica mineral separates were prepared from mineralized and barren samples (Table 1). Separating vein biotite was challenging because of the thickness of the veinlets available in drill cores and possible contamination from biotite within the surrounding host rock. As a result, only one sample of pure vein biotite was included in the current study. All 40Ar/39Ar analytical work was performed at the University of Manitoba (Winnipeg, MB, Canada) using a multi-collector Thermo Fisher Scientific ARGUS VI mass spectrometer, linked to a stainless steel Thermo Fisher Scientific extraction/purification line and Photon Machines (55 W) Fusions 10.6 CO2 laser. Argon isotopes (from mass 40 to 37) were measured using Faraday detectors with low noise 1 × 10¹² Ω resistors and mass 36 was measured using a compact discrete dynode detector. The sensitivity for Ar measurements is ~6.3 × 10¹⁷ moles/fA as determined from measured aliquots of Fish Canyon Sanidine [28,29]. The standards and unknowns were placed in 2 mm deep wells in 18 mm diameter aluminium disks, with standards placed strategically so that the lateral neutron flux gradients across the disk could be evaluated. Planar regressions were fit to the standard data, and the 40Ar/39Ar neutron fluence parameter, J, interpolated for the unknowns. Uncertainties in J are estimated at 0.1–0.2% (1σ), based on the Monte Carlo error analysis of the planar regressions [30]. All specimens were irradiated in the cadmium-lined, in-core CLICIT facility of the Oregon State University TRIGA reactor. The duration of irradiation was 70 h with HB3GR amphibole (1073.6 Ma [31]) as the flux monitor. Irradiated samples were placed in a Cu sample tray, with a KBr cover slip, in a stainless steel high vacuum extraction line and baked with an infrared lamp for 24 h. Single crystals were fused using the laser, and reactive gases were removed, after ~3 min, by three GP-50 SAES getters (two at room temperature and one at 450 °C) prior to being admitted to an ARGUS VI mass spectrometer by expansion. Five Ar isotopes were measured simultaneously over a period of 6 min. Measured isotope abundances were corrected for extraction-line blanks averaging ~2 fA for mass 40 and ~0.009 fA for mass 36. Detector intercalibration (IC), between the different faraday cups, was monitored (in Qtegra) every four days by peak hopping 40Ar. Calculated values are ICH1: 1.0000, ICAX: 1.0745, ICL1: 1.0637, and ICL2: 1.0534, with an error of ~0.2%. The intercalibration factor between H1 and the CDD was measured using 53 air aliquots interspersed with the unknowns resulting in ICCDD: 1.0083 ± 0.0019 per amu. We used conventional decay constants (λ(40Kβ-): 4.962 × 10⁻¹⁰/yr; λ (40Ke) + λ’(40Ke): 0.581 × 10⁻¹⁰/yr)30 and a value of 295.5 was used for the atmospheric 40Ar/36Ar ratio [32] for the purposes of routine measurement of mass spectrometer discrimination using air aliquots, and correction for atmospheric argon in the 40Ar/39Ar age calculation. Corrections are made for neutron-induced 40Ar from potassium, 39Ar and 36Ar from calcium, and 36Ar from chlorine [33,34,35]. Data collection was performed using the Pychron software [36], whereas data reduction, error propagation, age calculation, and plotting were performed using MassSpec software (version 8.091 [37]). Overall, multiple single-grain fusion analysis of 5–10 biotite or muscovite grains per sample were conducted. Analytical results are reported in Table S2 and presented in Figure 7 and Figure 8.
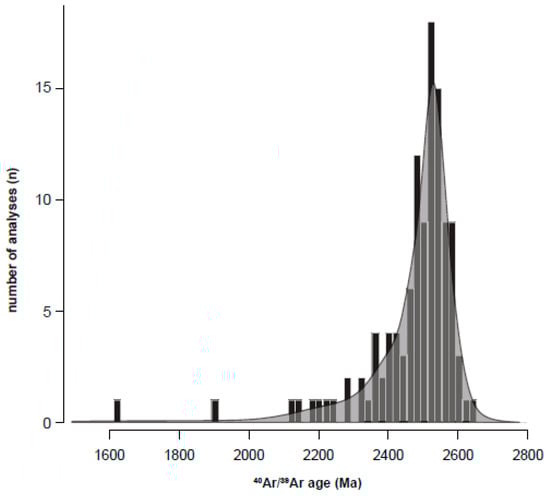
Figure 8.
Histogram and density distribution diagram of 40Ar/39Ar fusion analyses (n: 113) showing an Neoarchean to late Paleoproterozoic age population at ca. 2600–2390 Ma, and a peak of biotite ages at ca. 2550 Ma.
4. Results
4.1. Petrography
Four biotite types were identified from petrologic and petrographic observations, including three from mineralized samples proximal to the deposit (vein, halo and host rock biotite) and one from barren samples distal to the ore body. Vein biotite (Figure 3A) consist of randomly oriented vein-hosted biotite crystals from pre- to syn-D2 sulphidized (Py, Cpy, Po) Qz-Cal-Chl veins (V5) and were observed in two samples (MV-02, FW-13). Halo biotite (Figure 3B) consist of biotite sub-paralleling the margins of the V5 veins within the same samples and additional drill core samples RD15-265-43, RD15-118-225, RD15-118-10.2). Vein and halo biotite-bearing samples consist of moderately- to strongly-foliated mafic volcanic rocks from the hanging wall and footwall of the SLDZ, that have undergone varying degrees of metamorphism, ranging between greenschist to amphibolite facies. Vein biotite include fine- to coarse-grained (0.2–2.0 mm), subhedral to euhedral crystals that are oblique or subparallel to the vein orientation. These biotite are intergrown with actinolite porphyroblasts and are overprinted by chlorite (Figure 3A). Halo biotite are fine to medium-grained (0.2–0.3 mm) euhedral crystals that are parallel to the vein margins surrounding a primary actinolite halo and are overprinted by actinolite porphyroblasts (Figure 3B). Host rock biotite (Figure 3C) consist of biotite grains within the matrix of the rock sample (MV-02, FW-13, FW-11, MV-04, FW-03, FW-10, MV-13, RD15-429-27, RD15-429-92), defining the main foliation fabric. The host rock biotite-bearing samples also consist of weakly- to strongly-foliated mafic volcanic rocks, from the hanging wall and footwall of the SLDZ, with varying degrees of metamorphism ranging from upper greenschist facies to lower amphibolite facies. Host rock biotite are very fine- to coarse-grained (0.1–1.0 mm), anhedral to euhedral crystals that define the main foliation fabric. In some samples, both fine-grained and coarse-grained biotite occur with the finer grains overprinting pre- to syn-S2 actinolite crystals, and the coarser grains overprinted by actinolite, chlorite, and muscovite. Such overprinting relationships suggest multiple generations of biotite. Host rock biotite also occurs as dispersed 0.2–0.3 mm clusters that are subparallel to the main foliation fabric. In addition to biotite, host rock muscovite were also analyzed from a biotite schist and a mafic volcanic sample (FW-13, MV-12, respectively). Muscovite occurs as very fine-grained (<0.1 mm), subhedral to euhedral crystals, defining the S2 foliation (Figure S3A), suggesting a syn-metamorphic timing. Finer-grained muscovite crystals are also intergrown with host rock biotite, whereas coarser-grained generations overprint the S2-defining biotite and muscovite (FW-13; Figure S3B).
Barren samples consist of biotite grains hosted in the rock matrix, which define the main foliation within rocks sampled 25 to 125 km away from the deposit (DLR-01, DLR-02A, DLR-02B, DLR-03, WL-01). These samples consist of massive- to strongly-foliated felsic to intermediate plutonic rocks, which have undergone subgreenschist to greenschist facies metamorphism, based on their biotite-chlorite-plagioclase-quartz-muscovite prograde mineral assemblage. One barren sample differs from the other samples as it is a mafic volcanic rock metamorphosed to amphibolite facies (WL-01). This sample is the most proximal to the main ore body. Biotite from barren samples can be further subdivided into three populations: (1) Biotite from subgreenschist facies, (2) greenschist facies, and (3) amphibolite facies host rocks. Barren biotite, from subgreenschist facies host rock (Figure 3D), are very fine- to medium-grained (0.1–0.5 mm), anhedral to euhedral crystals, randomly oriented within the matrix, and occur as 0.5–1.0 mm clusters that overprint chlorite. Barren biotite from greenschist facies host rock (Figure 3E) are very fine- to coarse-grained (0.1–1.0 mm) euhedral grains that define the S2 foliation fabric and overprint chlorite (Figure 3E). Barren biotite from amphibolite facies host rock (Figure 3F) are very fine-grained (0.1–0.2 mm) anhedral to subhedral crystals. These biotite are parallel to the main foliation fabric and are intergrown with actinolite.
To summarize, there are at least four types of biotite: (1) Vein biotite in pre- to syn-D2 vein sets (V5) ranging from fine- to coarse-grained, subhedral to euhedral crystals (Figure 3A); (2) halo biotite, which are medium-grained euhedral crystals that parallel the pre- to syn-D2 vein margins (Figure 3B); (3) host rock biotite, ranging from very fine-grained to coarse-grained, anhedral to euhedral crystals (Figure 3C); and (4) barren biotite ranging from very fine- to coarse-grained, anhedral to euhedral crystals, that slightly differ with increasing metamorphic grade (Figure 3D–F). Biotite from all four types define the S2 structure where present. Biotite from all three mineralized types (vein, halo, host rock) are either, intergrown with and/or are overprinted by chlorite, actinolite, and muscovite. Whereas, barren biotite overprint chlorite and are intergrown with actinolite. In all cases, the overprinting relationships suggest a pre- to syn-deformational and broadly syn-metamorphic timing for biotite growth. The similar relative timing of these four biotite types makes it difficult to distinguish between the metamorphic and/or hydrothermal biotite. Based on the structural location of halo biotite, adjacent to pre to syn-D2 veins, it is logical to assume a hydrothermal source, possibly related to the mineralizing event. However, the intergrown and overprinting relationships of the biotite, with chlorite and actinolite, suggests that they were subsequently metamorphosed. For this reason, we further analyzed the geochemistry of these samples targeting all four of the identified biotite types.
4.2. Mineral Geochemistry
The combined EMPA data of all four biotite types reveal similar chemical compositions with very minor variations in Mg, Fe, Ti, and K content. All biotite types have more than 2.70 atoms per formula unit of Si, with an average ranging between 2.75 and 2.81. When plotted onto a Si versus XMg binary diagram, the mineral chemistry data from all four biotite types fall within the Mg-rich end of the biotite compositional field, with relatively high di-octahedral mica proportions (Figure 4A). Both mineralized and barren types possess a XMg ranging between 0.40 and 0.60, with barren biotite revealing slightly lower XMg values and one barren sample (DLR-03), revealing XMg values as low as 0.31. A Ti versus XMg binary diagram also shows similar chemical compositions between the four biotite types, revealing a range of 0.03 and 0.15 Ti cations per formula unit, with barren biotite possessing slightly higher Ti proportions (Figure 4B). Biotite from one barren sample (DLR-03) reveal relatively high Ti-contents of up to 0.20 cations per formula unit (Figure 4B). The chemical variations (decreasing XMg, increasing Ti) within the barren biotite population, however, does not appear to be correlated to the increasing distance from the deposit, but rather with decreasing metamorphic grade (Figure 4A,B). Variations in Ti-content are also evident in a TiO2–FeO*–MgO ternary diagram (Figure 4C), which is a visualization tool developed to discriminate between primary magmatic biotite from hydrothermally altered and/or neoblastic biotite [23]. Major elements FeO* (FeO + MnO) and MgO represent the two end members of biotite from annite (Fe2+) to phlogopite (Mg), which can also be expressed by XFeO* = FeO*/(FeO* + MgO). The XFeO* of biotite varies from XFeO* ≈ 0 in mafic rocks to XFeO∗ ≈ 1 in felsic rocks [38]. The TiO2 end-member of the ternary diagram is known to decrease in hydrothermally altered biotite [39,40], thus allowing us to discern between biotite types. The ternary diagram is divided into three domains (Figure 4C) [23]: (A) Primary magmatic biotite, (B) re-equilibrated biotite, and (C) neoblastic biotite. The three mineralized biotite types from Detour Lake yield XFeO* values of 0.50–0.70, indicative of intermediate host rocks, and barren biotite yield XFeO* values of 0.70-0.80, consistent of more felsic host rocks. One barren (distal) sample (DLR-03) falls within the primary magmatic biotite domain (A), whereas the remaining samples from all biotite types plot within the re-equilibrated biotite domain (B), with the exception of one mineralized host rock biotite sample (FW-03), which plots at the margin of the neoblastic domain (C) (Figure 4C). The trend towards Ti-depleted compositions, at a constant XMg in hydrothermally-altered and neoblastic biotite, reflects its progressive transformation that is due, in part, to temperature dependent Ti-substitution reactions [41] and the reacting fluid buffered by the whole-rock composition [23].
The results from the WDS geochemical maps (Figure 5 and Figure 6) also demonstrate broad compositional overlap between biotite types. Vein-hosted biotite (MV-02, FW-13; Figure 5A) reveal chemically homogeneous crystals with very minor K depletion and Mg enrichment along cleavage planes. Chemical maps of the halo biotite (Figure 5B) reveal chemical zonation in the form of 2–5 μm Fe–Mg rich and K-poor rims. The halo biotite in sample MV-02 also reveals the intergrowth of the biotite with a Ca–Al rich and Fe–Mg–K poor mineral phase. The host rock biotite chemical maps (FW-11, MV-13, MV-02, FW-03; Figure 5C) show very little intra-grain chemical variation with the exception of very localized, narrow (2–5 μm) K-poor and Mg-rich bands, most likely representing chlorite intergrowths. Chemical maps of barren biotite (Figure 6A,B) are also very similar to mineralized biotite, revealing mostly homogeneous composition with slight K depletion and Mg enrichment at cleavage planes and rims. Overall, biotite types (mineralized versus barren) reveal minor intra- and inter-grain variations, and are indistinguishable based on their major, and minor, elements compositions alone.
4.3. 40Ar/39Ar Geochronology
We use multiple single-grain total fusion 40Ar/39Ar dating as a quick and efficient means to assess the range of bulk grain ages in samples from the Detour Lake deposit. This approach allows us to determine the age range within a single sample and at larger spatial scale, by taking multiple biotite grains from mineralized and barren sample. The results of mica 40Ar/39Ar dating are plotted on Figure 7 and Figure 8 and are provided in Table S2, with isotope measurements and ages reported at 1σ uncertainty. Up to ten single mica grains, from each of the ten mineralized and five barren samples, were dated. The dated vein-hosted samples possess biotite that grew within pre- to syn-D2 sulphidized (pyrite, chalcopyrite, pyrrhotite) quarz–calcite–chlorite veins, whereas halo-hosted samples contain biotite at the margins of these veins that parallels the S2 foliation fabric. As for mineralized host rock and barren samples, biotite and muscovite occurred as growths along the foliation plane of the rock (Figure 3). Mineralized and barren samples yield similar ages with a notable dispersion between the samples (ranging from 2635 ± 8 Ma to 1623 ± 4 Ma) and between single mica grains within a single sample (with variation from 894 m.y. to 19 m.y.). The total number of 40Ar/39Ar fusion analyses performed is 113 with a dominant Neoarchean to late Paleoproterozoic age population at ca. 2600–2390 Ma (n: 94), and a mode at ca. 2550 Ma (Figure 7 and Figure 8). Thirteen mineralized and barren samples yielded relatively consistent age populations (vein: MV-02; halo: MV-02; host-rock: FW-13, FW-13 Ms, FW-11, MV-04, FW-03, FW-10, MV-12 Ms; barren: DLR-01, DLR-02A, DLR-02B, WL-01). These samples exhibit the oldest dates, ranging from 2606 ± 3 Ma to 2313 ± 5 Ma (n: 80). A slightly younger distribution exists in barren biotite sample DLR-03 with single grain ages varying from 2446 ± 3 Ma to 2358 ± 2 Ma (n: 6). Halo biotite gave highly dispersed ages from 2634 ± 8 Ma to 1912 Ma ± 1 Ma (n: 28), and notably this biotite type shows a higher degree of compositional chemical variability relative to the three other types found at the Detour Lake deposit (Figure 4 and Figure 5B).
5. Discussion
5.1. Chemical Variations in Biotite
For the purpose of this study, we analyzed chemical compositions in an attempt to identify different biotite populations near, and within, the Detour Lake deposit, and to assist in interpreting the new 40Ar/39Ar geochronology. This information combined with the microstructural position of the dated mineral phase is fundamental for the proper interpretation of geochronology data [42,43,44,45]. It is important to note that, apart from minor differences in grain size and structural position, mineralized and barren biotite types share similar textural relationships with the metamorphic mineral assemblage and deformation fabrics. However, there are two noteworthy chemical variations revealed in our mineral chemistry data: (1) A slight decrease of Mg in barren biotite (XMg distal Bt: 0.41, σ: 0.05) relative to the mineralized types (XMg vein Bt: 0.55, σ: 0.01; XMg halo Bt: 0.52, σ: 0.01; XMg host rock Bt: 0.54, σ: 0.04; Table 2, Figure 4A); and (2) a slight increase of Ti-content in barren (Tidistal Bt: 0.15, σ: 0.03 a.p.f.u.) biotite relative to the mineralized type (Tivein Bt: 0.08, σ: 0.01 a.p.f.u.; Tihalo Bt: 0.09, σ: 0.00 a.p.f.u.; Tihost rock Bt: 0.10, σ: 0.03 a.p.f.u.; Table 2, Figure 4B,C).
Previous studies on biotite from other Au deposits have also reported variations in Mg-content. A study of the Canadian Malartic deposit documented higher XMg values in the alteration zone proximal to the deposit, relative to the distal alteration zones [2], which is consistent with our data from Detour Lake. However, the XMg values of the biotite within the mineralized zone at the Canadian Malartic fall within the phlogopite compositional field (0.72 < XMg < 0.92 [2]). Whereas, XMg values of the mineralized biotite types at Detour Lake lie within the biotite compositional field, which is more consistent with the biotite from the distal alteration zone at Canadian Malartic (0.52 < XMg < 0.72) [2]. In contrast, a study of the Mouska deposit [3] noted Mg-loss in the altered rocks, and has been explained by the consumption of ferromagnesian minerals during alteration. However, Mg-loss is not observed in the mineralized biotite at Detour Lake; instead, we observe a subtle Mg-loss in the barren biotite type, which further complicates the reliable use of biotite chemistry as a vector to Au ore at this deposit. Comparatively, lower Mg contents in biotite from mineralized rocks, relative to biotite from barren rock, was reported from the Afu Younger Granite complex of central Nigeria [46]. These chemical variations in the biotite were attributed to primary magmatic or subsolidus processes that result in the re-equilibration of earlier formed mineral compositions [46]. This model predicts that an initially low fO2 reduces the activity of MgO, which causes the late crystallization of magnetite. In this case, late-forming biotite would be Mg-poor relative to early-forming biotite. In contrast, we do not observe these trends and consequently, the model may only be extended to deposit types, where the hydrothermal ore forming fluids are magmatically derived. As previously mentioned, the slight decrease in Mg content in barren biotite, relative to mineralized biotite at Detour Lake, shows no correlation between Mg content and the increasing distance from the deposit. Instead, the variations in Mg appear to be correlated to the grade of metamorphism of each rock. However, that is not the only variation between mineralized and barren biotite samples. As illustrated in Figure 1, the mineralized samples are hosted within mafic volcanic rocks, whereas barren samples are hosted within more felsic plutonic rocks. Based on the model from the Afu Younger Granite complex [46], the Mg variation in mineralized and barren biotite at the Detour Lake deposit could potentially be attributed to the fO2 of their magmatic source, rather than hydrothermal alteration. To pursue this model, we first need to determine whether biotite at Detour Lake are primary magmatic, re-equilibrated, and/or represent new growth (neoblastic) during hydrothermal activity.
Primary magmatic biotite can be distinguished from re-equilibrated or neoblastic biotite by comparing their Ti content [23] and their XMg values [47]. Based on previous studies, the relatively lower Ti content, and slightly higher XMg of re-equilibrated and neoblastic biotite, are the major distinguishing factors from primary magmatic biotite [23,47]. By examining the Ti content, the mineral chemistry data suggested that biotite from one barren samples (DLR-03) is primary magmatic in origin, whereas, other barren samples and all of the mineralized samples are either partially re-equilibrated, or neoblastites by a hydrothermal fluid. Hydrothermally altered biotite also correspond to the biotite with a slightly higher Mg content (XMg: 0.52–0.54; Figure 4), suggesting hydrothermally altered and/or neoformed biotite.
The relatively homogeneous XFeO* value for each biotite type indicates a partial to complete re-equilibration of biotite by, or within, a fluid, which is buffered by the host rock composition [23]. Based on these observations, we suggest that all of the mineralized, and a few barren, biotite samples, near or within the Detour Lake deposit, consist of hydrothermally re-equilibrated (i.e., geochemically altered), and some neoblastic, biotite. Only one barren sample (DLR-03) contains primary magmatic biotite. Based on the location of these samples, there does not appear to be any spatial correlation with the ore body, nor are there any petrographic indicators that these biotite are less altered than the other samples. Since there is only one sample plotting within the primary magmatic field for biotite (Figure 4C), and there is only one recorded metamorphic event at Detour Lake (2670–2640 Ma) [18], we expect that most biotite occur as part of the peak metamorphic assemblage and/or coeval hydrothermal alteration. Thus, the lower XMg in the barren (distal) samples relative to the mineralized samples can most likely be attributed to the composition of their host rocks.
To summarize, we will document one main population of hydrothermally altered biotite within, and near, the Detour Lake deposit and one small subset of primary magmatic biotite within barren samples distal from the deposit. The differences in biotite composition comprise a decrease in Ti content, and an increase in Mg from the magmatic to hydrothermal biotite, respectively.
5.2. Post-Mineralization Hydrothermal Activity
Through the 40Ar/39Ar method, we have dated more than 100 single crystals of mica. These dates can be interpreted as the timing of crystallization, cooling through the ~300 °C isotherm, and/or recrystallization, which may or may not be above the nominal ~300°C closure temperature [48] for these mineral systems. Few studies have applied 40Ar/39Ar geochronology to constrain the timing of hydrothermal alterations, veining, and metallic ore deposition in the Abitibi region, and many of the anomalously young ages have since been called into question with updated geochronological methods and an improved understanding of field relationships [49]. The robust independent constraints of the geological history of the region, and detailed microstructural and geochemical characterization of the dated mineral phase, is required for proper interpretation. Based on the new geochemical data discussed above, our new 40Ar/39Ar dates likely do not resolve distinct phases of biotite cooling or deformation, but instead document something different. With the exception of two analyses from one halo-hosted sample, single crystal biotite ages post-date the main deformation events at the deposit (D1: ca. 2696–2690 Ma; D2: ca. 2676–2670 Ma dated via U-Pb geochronology) and the timing of regional metamorphism, (ca. 2670–2640 Ma [5,18] dated via 40Ar/39Ar geochronology), which have previously been invoked for the Au mineralization at Detour Lake. For this reason, we suggest that new biotite ages may have dated younger, or possibly a series of younger, hydrothermal events (ca. 2550 Ma) that are unrelated to Au mineralization.
The few available 40Ar/39Ar studies, conducted in the Superior Province, are broadly consistent with the prominent peak of biotite ages at ca. 2550 Ma reported herein. A previous study collected 40Ar/39Ar data from white micas and amphiboles in an attempt to resolve the thermal history in the southern Abitibi and Pontiac subprovinces to the south of Detour Lake [18]. The authors reported five distinct age populations: >2594 Ma, 2578 ± 10 Ma, 2543 ± 8 Ma, 2421 ± 15 Ma and 2414 ± 9 Ma, which they have interpreted to date discrete, post-metamorphic hydrothermal events along crustal-scale deformation zones (i.e., Cadillac-Larder Lake and Porcupine-Destor deformation zones). It was suggested that these hydrothermal events were associated with widespread mid-crustal melting and monzogranitic intrusions, which have thermally reset minerals in zones of higher permeability in the subprovince [18]. New biotite ages, from Detour Lake overlap within analytical uncertainty with several of these postulated events, but were sampled hundreds of kilometers north of the Porcupine-Destor deformation zone (Figure 1).
Similar ages of ca. 2700–2450 Ma have also been reported at other greenstone belts [50], Kapuskasing Structural Zone [51] and within the western Superior Province, including the North Caribou and Red Lake greenstone belts (NCGB, RLGB). Monazite total-Pb ages of ca. 2440 Ma [52] and biotite 40Ar/39Ar plateau ages of 2587–2474 Ma [53] have been recorded at the Musselwhite Au deposit (NCGB), which post-dates the timing of mineralization at this location. More specifically, the 2490–2440 Ma ages were attributed to tectonic strain accommodated by displacement along crustal-scale deformation zones. Biotite, sericite, and fuchsite from the East Bay Au trend (RLGB) yielded 40Ar/39Ar ages of ca. 2497–2467 Ma [54], which also post-dates the age of Au mineralization reported from Red Lake (ca. 2700 [55]). Other studies from the Red Lake district show steadily rising 40Ar/39Ar age spectra from the lower temperature steps between 2000 to 2600 Ma [56]. The age dispersion in the Red Lake district was attributed to a protracted fluid history associated with Au mineralization [54]. Hornblende 40Ar/39Ar ages (ca. 2640–2560 Ma) from older greenstone belts in the northern Superior (e.g., Minto Block) also significantly post-date metamorphism and cratonization [57]. Although, each of these deposit- and regional-scale studies invoke fluid advection through various districts in the Superior Province at ca. 2500–2450 Ma, none provide a craton-scale tectonic model that explains the post-metamorphic and deformational 40Ar/39Ar resetting across the entire Superior Province.
In a review of Lithoprobe results from the Abitibi Subprovince, such post-metamorphic and post-deformation ages from ca. 2550 Ma to 2200 Ma were interpreted to be a consequence of tectonic pumping of fluids along Archean structures, that have been reactivated during the accretion of a 200 km thick mantle lithosphere to Archean crust [58]. These fluids could be hypersaline CaCl2 brines [59] penetrating the Archean basement where they were driven by heat, generated during the emplacement of the province-wide Irsuaq (2.51 Ga), Matachewan (2.47 Ma [60]), and Hearst (2.45 Ma [60]) dike swarms. In particular, the Matachewan and Hearst dike swarms are part of the oldest recognized large igneous province (LIP), a worldwide magmatic event ca. 2450 Ma, which produced ~50,000 km3 of basaltic magma over an area of >250,000 km2 [61]. Although, the age of Au mineralization at the Detour Lake deposit has previously been constrained to a pre- to syn-D2 timing with a maximum age of ca. 2700 Ma [5,22] and has not been remobilized since, the Detour Lake biotite ages broadly coincide with the timing of the widespread Neaoarchean to Paleoproterozoic LIP activity.
The widespread emplacement of Paleoproterozoic mafic dike swarms may be the common factor between these studies. However, although it is tempting to correlate numerical dates to the ages of known, large-scale tectonic events, we also must consider the potential caveats of the 40Ar/39Ar systematics, specifically 40Ar diffusion. Long-term (Myr to Gyr) residence of rocks at ambient midcrustal temperatures, slightly above the ~300 °C closure temperature of biotite, may lead to efficient Ar diffusion or partial Ar retention [62]. Numerical modelling of K-feldspar 40Ar/39Ar data from the Neoarchean rocks of the western Superior Province [63] indicates the craton was at temperatures >325 °C pre-2400 Ma and slowly cooled ~100 °C (325–225 °C) over 1 Gyr (2400–1400 Ma; cooling rate of ~0.1 °C/Ma). This suggests that the rocks exposed on the surface today possibly leaked Ar, resulting in a younger, potentially geologically meaningless, date. Nonetheless, the widespread extent of identical, yet geologically “meaningless” 40Ar/39Ar dates, would be a considerable coincidence and, although the dates do not reflect ore deposition, we instead invoke a deep-seated geodynamical explanation. 40Ar/39Ar ages are also consistent with U-Pb ages of hydrothermal and metamorphic minerals (e.g., rutile, titanite [57,64,65]) elsewhere in the Superior Province, strengthening the link between young apparent biotite ages and circulating hydrothermal fluids along reactivated structures [66]. We attribute the prominent mode of ca. 2550 Ma Detour Lake mica ages to the emplacement of the Matachewan dikes as part of a broader, worldwide magmatic event, which possibly represents a substantial change in heat flux at the core-mantle boundary that preceded the breakup of a Late Archean supercontinent [60,67]. Younger biotite ages (≤2550 Ma) likely point to repeated reactivation of the Neoarchean auriferous structures during the Proterozoic.
6. Conclusions
Our petrographic observations suggest four distinct types of pre to syn-D2 biotite (1–3 mineralized; 4 barren): (1) vein biotite in pre- to syn-D2 vein sets ranging from fine- to coarse-grained, subhedral to euhedral crystals; (2) medium-grained euhedral halo biotite that parallel the pre- to syn-D2 vein margins; (3) host rock biotite ranging from very fine-grained to coarse-grained, anhedral to euhedral crystals; and (4) very fine to coarse-grained, anhedral to euhedral biotite, defining the foliation within the barren meta-plutonic host rocks distal to the deposit. All biotite types are generally chemically homogeneous with slightly Fe-rich and K-poor cleavage planes. Chemical variations, comprised of Mg decrease, and Ti increase, in barren biotite relative to mineralized biotite types, suggesting that biotite at Detour Lake are hydrothermally re-equilibrated or neo-formed, rather than the primary magmatic biotite. The re-equilibrated composition of biotite obscures its use as geochemical vector to Au ore at the Detour Lake deposit, in contrast with some other orogenic Au deposits in the Abitibi Subprovince. All four biotite types also yield similar dispersed 40Ar/39Ar ages in the range of 2690–2120 Ma. A pronounced population of biotite 40Ar/39Ar ages at ca. 2550 Ma most likely reflects resetting during regional-scale Matachewan and Hearst dike swarms in the Abitibi Subprovince rather than Au mineralization. Variably younger biotite ages, however, point to fluid focusing and reactivation of auriferous structures during, and after, dike emplacement. The repeated focusing of fluids during late reactivation of auriferous structures is also suggested in the southern Abitibi, coupled with new data presented herein at Detour Lake, points to the large-scale circulation of hydrothermal fluids after cratonization of the Superior Province, during the Proterozoic, which had little impact on Neoarchean Au deposit genesis. The same conclusions may also be relevant to other lower- to middle-amphibolite facies orogenic Au deposits around the world.
Supplementary Materials
The following are available online at https://www.mdpi.com/2075-163X/9/10/596/s1, Table S1. Raw EMP analysis data of biotite at the Detour Lake deposit; Table S2. 40Ar/39Ar data of biotite and muscovite from the Detour Lake deposit, Canada. Figure S1. Geological map of the Detour Lake deposit showing the outline of the modern open pit mine and historic Campbell pit located along the E-W trending SLDZ, dividing the mafic volcanic rock of the Detour Lake Formation and the sedimentary rocks of the Caopatina Assemblage (modified from Dubosq et al. 2018 and Tolhurst 2014). Location of sampled drill holes are represented by black dots. RD15-118-10.2, RD15-118-255.2 were sampled from drill hole DG-07-118 at depths of 10.2 m and 255.2 m; RD15-265-43.0 from DG-07-265 at a depth of 43.0 m; and RD15-429-47 and RD15-429-92 from DG-08-429 at depths of 27.0 m and 92.0 m. All other mineralized samples originate from blasted ore blocks within the open pit, thus no sample locations are provided; Figure S2. Diagrams showing the biotite composition (atoms per formula unit) of the barren samples with increasing distance from the main ore body. Biotite compositions are scattered and appear independent of relative distance from the deposit; Figure S3. Photomicrographs of muscovite at the Detour Lake deposit. A. Muscovite occurs as very fine-grained (<0.1 mm), sub-hedral to euhedral crystals defining the S2 foliation inter-grown with host rock biotite (FW-13). B. Coarser-grained muscovite generation overprinting the S2-defining biotite and muscovite (FW-13).
Author Contributions
Conceptualization, R.D., D.A.S., and C.J.M.L.; formal analysis, R.D. and A.C.; investigation, R.D., D.A.S., A.C., and C.J.M.L.; writing—original draft preparation, R.D.; writing—review and editing, R.D., D.A.S., and C.J.M.L.
Funding
This research was funded by Detour Gold Corp. and a Natural Sciences and Engineering Research Council of Canada Discovery grant (to D.A.S.). C.J.M.L. acknowledges support from the Targeted Geoscience Initiative (TGI)-5 program from Natural Resources Canada.
Acknowledgments
Detour Gold Corp is thanked for their cooperation and assistance throughout our project, and Jessica Najera, David Diekrup and Glenn Poirier are thanked for help with SEM and EPMA analyses. Discussions with Patrick Mercier-Langevin and Benjamin Huet were also greatly appreciated. We thank Matthew Heizler, John Hanchar, and two anonymous reviewers for their constructive comments.
Conflicts of Interest
The authors declare no conflict of interest.
References
- De Souza, S.; Dubé, B.; McNicoll, V.J.; Dupuis, C.; Mercier-Langevin, P.; Creaser, R.A.; Kjarsgaard, I. Targeted Geoscience Initiative 4: Contributions to the Understanding of Precambrian Lode Gold Deposits and Implications for Exploration; Open File Report 7852; Geological Survey of Canada: Ottawa, ON, Canada, 2015; pp. 115–123. [Google Scholar]
- Gaillard, N.; William-Jones, A.E.; Clark, J.R.; Lypaczewski, P.; Salvi, S.; Perrouty, S.; Piette-Lauzière, N.; Guilmette, C.; Linnen, R.L. Mica Composition as a Vector for Gold Mineralization: Deciphering Hydrothermal and Metamorphic Effects in the Malartic District, Quebec. Ore Geol. Rev. 2018, 95, 789–820. [Google Scholar] [CrossRef]
- Belkabir, A.; Hubert, C.; Hoy, L.D. Gold emplacement and hydrothermal alteration in metabasix rocks at the Mouska mine, Bousquet district, Abitibi, Québec, Canada. Can. Mineral. 2004, 42, 1079–1096. [Google Scholar] [CrossRef]
- Marmont, S. The Geological Setting of the Detour Lake Gold Mine, Ontario, Canada. In Proceedings of the Gold ’86, an International Symposium on the Geology of Gold, Toronto, ON, Canada, 28 September–1 October 1986; pp. 3–22. [Google Scholar]
- Oliver, J.; Ayer, J.A.; Dubé, B.; Aubertin, R.; Burson, M.; Panneton, G.; Friedman, R.; Hamilton, M.A. Structure, Stratigraphy, U-Pb Geochronology and Alteration Characteristics of Gold Mineralization at the Detour Lake Deposit, Ontario, Canada. Explor. Min. Geol. 2011, 20, 1–30. [Google Scholar]
- Ayer, J.; Amelin, Y.; Corfu, F.; Kamo, S.; Ketchum, J.; Kwok, K.; Trowell, N. Evolution of the Southern Abitibi Greenstone Belt Based on U–Pb Geochronology: Autochthonous Volcanic Construction Followed by Plutonism, Regional Deformation and Sedimentation. Precambrian Res. 2002, 115, 63–95. [Google Scholar] [CrossRef]
- Ayer, J.A.; Thurston, P.C.; Bateman, R.; Dubé, B.; Gibson, H.L.; Hamilton, M.A.; Hathway, B.; Hocker, S.M.; Houle, M.G.; Hudak, G.; et al. Overview of Results from the Greenstone Architecture Project: Discover Abitibi Initiative; Open File Report 6154: 146; Ontario Geological Survey: Sudbury, ON, Canada, 2005. [Google Scholar]
- Ayer, J.A.; Goutier, J.; Thurston, P.C.; Dubé, B.; Kamber, B.S. Tectonic and Metallogenic Evolution of the Abitibi and Wawa Sub-Provinces; Open File Report 6260: 3.1–3.6; Ontario Geological Survey: Sudbury, ON, Canada, 2010. [Google Scholar]
- Goutier, J.; Melançon, M. Compilation Géologique de La Sous-Province de l’Abitibi (Version Préliminaire); Ressources Naturelles et Faune: Québec, QC, Canada, 2007. [Google Scholar]
- Daigneault, R.; Mueller, W.U. Abitibi Greenstone Belt Plate Tectonics: A History of a Chronic Arc Development, Accretion and Collision. In The Precambrian Earth: Tempos and Events; Eriksson, K.A., Altermann, W., Nelson, D.R., Mueller, W.U., Catuneanu, O., Strand, K., Eds.; Elsevier: Amsterdam, The Netherlands, 2004; pp. 88–103. [Google Scholar]
- Bleeker, W. Lode Gold Deposits in Ancient Deformed and Metamorphosed Terranes: The Role of Extension in the Formation of Timiskaming Basins and Large Gold Deposits, Abitibi Greenstone Belt—A Discussion; Open File Report 6280: 47.1–47.12; Ontario Geological Survey: Sudbury, ON, Canada, 2012. [Google Scholar]
- Goutier, J. Géologie de La Région de Destor (SNRC 32D/07); Open File Report RG96-13: 37; Ministère des Ressources Naturelles du Québec: Québec, QC, Canada, 1997. [Google Scholar]
- Benn, K.; Peschler, A.P. A Detachment Fold Model for Fault Zones in the Late Archean Abitibi Greenstone Belt. Tectonophysics 2005, 400, 85–104. [Google Scholar] [CrossRef]
- Bateman, R.; Ayer, J.; Dube, B. The Timmins-Porcupine Gold Camp, Ontario: Anatomy of an Archean Greenstone Belt and Ontogeny of Gold Mineralization. Econ. Geol. 2008, 103, 1285–1308. [Google Scholar] [CrossRef]
- Thurston, P.C.; Ayer, J.A.; Goutier, J.; Hamilton, M.A. Depositional Gaps in Abitibi Greenstone Belt Stratigraphy: A Key to Exploration for Syngenetic Mineralization. Econ. Geol. 2008, 103, 1097–1134. [Google Scholar] [CrossRef]
- Daigneault, R.; Mueller, W.U.; Chown, E.H. Oblique Archean Subduction: Accretion and Exhumation of an Oceanic Arc during Dextral Transpression, Southern Volcanic Zone, Abitibi Subprovince Canada. Precambrian Res. 2002, 115, 261–290. [Google Scholar] [CrossRef]
- Thompson, P.H. Metamorphism and Its Relationships to Gold Deposits in the Timmins-Kirkland Lake Area, Western Abitibi Greenstone Belt, Ontario; Discover Abitibi, Metamorphic Subproject Report 1; Open File Report 6120:37.1-37.8; Ontario Geological Survey: Sudbury, ON, Canada, 2003. [Google Scholar]
- Powell, W.G.; Hodgson, C.J.; Hanes, J.A.; Carmichael, D.M.; Mcbride, S.; Farrar, E. 40Ar/ 39Ar Geochronological Evidence for Multiple Postmetamorphic Hydrothermal Events Focused along Faults in the Southern Abitibi Greenstone Belt. Can. J. Earth Sci. 1995, 32, 768–786. [Google Scholar] [CrossRef]
- Johns, G.W. Geology of the Burntbush-Detour Lakes Area, District of Cochrane, Ontario; Open File Report 199: 82; Ontario Geological Survey: Sudbury, ON, Canada, 1982. [Google Scholar]
- Marmont, S. Geology of the Lower Detour Lake-Hopper-Sunday Lakes Area, Northeastern Ontario; Miscellaneous Paper 137; Ontario Geological Survey: Sudbury, ON, Canada, 1987; pp. 175–180. [Google Scholar]
- Bouchard, M. Predicting Stable Metamorphic Assemblages in P-T Space Using Phase Equilibria Modelling and Characterization of Mafic Metavolcanic Rocks South of Detour Lake Mine, Ontario, Canada. Bachelor’s Thesis, Laurentian University, Sudbury, ON, Canada, 2015. [Google Scholar]
- Dubosq, R.; Lawley, C.J.M.; Rogowitz, A.; Schneider, D.A.; Jackson, S. Pyrite Deformation and Connections to Gold Mobility: Insight from Micro-Structural Analysis and Trace Element Mapping. Lithos 2018, 310–311, 86–104. [Google Scholar] [CrossRef]
- Nachit, H.; Ibhi, A.; Abia, E.H.; Ben Ohoud, M. Discrimination between Primary Magmatic Biotites, Reequilibrated Biotites and Neoformed Biotites. C. R. Géosci. 2005, 337, 1415–1420. [Google Scholar] [CrossRef]
- Vidal, O.; Parra, T.; Trotet, F. A Thermodynamic Model for Fe-Mg Aluminous Chlorite Using Data from Phase Equilibrium Experiments and Natural Pelitic Assemblages in the 100 to 600 °C, 1 to 25 Kb Range.(Iron, Magnesium). Am. J. Sci. 2001, 301, 557. [Google Scholar] [CrossRef]
- Parra, T.; Vidal, O.; Agard, P. A Thermodynamic Model for Fe–Mg Dioctahedral K White Micas Using Data from Phase-Equilibrium Experiments and Natural Pelitic Assemblages. Contrib. Mineral. Petrol. 2002, 143, 706–732. [Google Scholar] [CrossRef]
- Donovan, J.J.; Tingle, T.N. An Improved Mean Atomic Number Background Correction for Quantitative Microanalysis. Microsc. Microanal. 1996, 2, 1–7. [Google Scholar] [CrossRef]
- Donovan, J.J.; Singer, J.W.; Armstrong, J.T. A New EPMA Method for Fast Trace Element Analysis in Simple Matrices. Am. Mineral. 2016, 101, 1839–1853. [Google Scholar] [CrossRef]
- Dazé, A.; Lee, J.K.W.; Villeneuve, M. An Intercalibration Study of the Fish Canyon Sanidine and Biotite 40Ar/ 39Ar Standards and Some Comments on the Age of the Fish Canyon Tuff. Chem. Geol. 2003, 199, 111–127. [Google Scholar] [CrossRef]
- Kuiper, K.F.; Deino, A.; Hilgen, F.J.; Krijgsman, W.; Renne, P.R.; Wijbrans, J.R. Synchronizing Rock Clocks of Earth History. Science 2008, 320, 500–504. [Google Scholar] [CrossRef]
- Best, M.G.; Christiansen, E.H.; Deino, A.L.; Grommé, C.S.; Tingey, D.G. Correlation and Emplacement of a Large, Zoned, Discontinuously Exposed Ash Flow Sheet: The 40Ar/39Ar Chronology, Paleomagnetism, and Petrology of the Pahranagat Formation, Nevada. J. Geophys. Res. Solid Earth 1995, 100, 24593–24609. [Google Scholar] [CrossRef]
- Jourdan, F.; Verati, C.; Féraud, G. Intercalibration of the Hb3gr 40Ar/39Ar Dating Standard. Chem. Geol. 2006, 231, 177–189. [Google Scholar] [CrossRef]
- Steiger, R.H.; Jäger, E. Subcommission on Geochronology: Convention on the Use of Decay Constants in Geo- and Cosmochronology. Earth Planet. Sci. Lett. 1977, 36, 359–362. [Google Scholar] [CrossRef]
- Roddick, J.C. High Precision Intercalibration of 40Ar/39Ar Standards. Geochim. Cosmochim. Acta 1983, 47, 887–898. [Google Scholar] [CrossRef]
- Renne, P.R.; Swisher, C.C.; Deino, A.L.; Karner, D.B.; Owens, T.L.; DePaolo, D.J. Intercalibration of Standards, Absolute Ages and Uncertainties in 40Ar/39Ar Dating. Chem. Geol. 1998, 145, 117–152. [Google Scholar] [CrossRef]
- Renne, P.R.; Norman, E.B. Determination of the Half-Life of 37 Ar by Mass Spectrometry. Phys. Rev. C 2001, 63, 047302. [Google Scholar] [CrossRef]
- Ross, J. Pychron Documentation; New Mexico Institute of Mining and Technology: Socorro, NM, USA, 2017. [Google Scholar]
- Deino, A.L. Geochronology. In A Companion to Paleoanthropology; Begun, D.R., Ed.; Wiley: Hoboken, NJ, USA, 2013; pp. 244–264. [Google Scholar]
- Abrecht, J.; Hewitt, D.A. Experimental Evidence on the Substitution of Tin in Biotite. Am. Mineral. 1988, 73, 1275–1284. [Google Scholar]
- Johan, Z.; Le Bel, L.; McMillan, W.J. Evolution Géologique et Pétrologique Des Complexes Granitiques Fertiles. Pétrologie Des Dykes et Des Phases Porphyriques. Mém. BRGM 1980, 99, 71–83. [Google Scholar]
- Johan, Z.; Le Bel, L. Paragenèses d’altération. Conséquences Sur Les Paramètres Physico-Chimiques Relatifs Aux Fluides Hydrothermaux. Mém. BRGM 1980, 99, 95–119. [Google Scholar]
- Robert, J.-L. Titanium Solubility in Synthetic Phlogopite Solid Solutions. Chem. Geol. 1976, 17, 213–227. [Google Scholar] [CrossRef]
- Schneider, J.; Bosch, D.; Monié, P. Individualization of Textural and Reactional Microdomains in Eclogites from the Bergen Arcs (Norway): Consequences for Rb/Sr and Ar/Ar Radiochronometer Behavior during Polymetamorphism. Geochem. Geophys. Geosystems 2008, 9. [Google Scholar] [CrossRef]
- Sanchez, G.; Rolland, Y.; Schneider, J.; Corsini, M.; Oliot, E.; Goncalves, P.; Verati, C.; Lardeaux, J.-M.; Marquer, D. Dating Low-Temperature Deformation by 40Ar/ 39Ar on White Mica, Insights from the Argentera-Mercantour Massif (SW Alps). Lithos 2011, 125, 521–536. [Google Scholar] [CrossRef]
- Uunk, B.; Brouwer, F.; Ter Voorde, M.; Wijbrans, J. Understanding Phengite Argon Closure Using Single Grain Fusion Age Distributions in the Cycladic Blueschist Unit on Syros, Greece. Earth Planet. Sci. Lett. 2018, 484, 192–203. [Google Scholar] [CrossRef]
- Coleman, M.; Dubosq, R.; Schneider, D.A.; Grasemann, B.; Soukis, K. Along-strike Consistency of an Extensional Detachment System, West Cyclades, Greece. Terra Nova 2019, 31, 220–233. [Google Scholar] [CrossRef]
- Imeokparia, E.G. Chemical Variations in Biotites—An Exploration Tool to Distinguish between Mineralized and Barren Rocks in the Nigerian Tin Bearing Province. J. Afr. Earth Sci. 1984, 2, 327–331. [Google Scholar] [CrossRef]
- Zacharias, J. Compositional Trends in Magmatic and Hydrothermal Silicates of the Petráčkova Hora Intrusive Complex, Bohemian Massif - Link between the Magmatic Processes and Intrusion-Related Gold Mineralization. J. Geosci. 2008, 53, 105–117. [Google Scholar] [CrossRef]
- McDougall, I.; Harrison, T.M. Geochronology and Thermochronology by the 40Ar/39Ar Method; Oxford University Press: Oxford, UK, 1999. [Google Scholar]
- Kerrich, R.; Cassidy, K.F. Temporal Relationships of Lode Gold Mineralization to Accretion, Magmatism, Metamorphism and Deformation—Archean to Present: A Review. Ore Geol. Rev. 1994, 9, 263–310. [Google Scholar] [CrossRef]
- Feng, R. Tectonic Jusxtaposition of the Archean Abitibi Greenstone Belt and Pontiac Subprovince: Evidence from Geobarometry, Geochemistry, and Ar-Ar Geochronology of Metasedimentary Rocks and Granitoids. Ph.D. Thesis, Department of Geological Sciences, University of Saskatchewan, Saskatoon, SK, Canada, 1992. [Google Scholar]
- Manson, M.L.; Halls, H.C. Proterozoic Reactivation of the Southern Superior Province and Its Role in the Evolution of the Midcontinent Rift. Can. J. Earth Sci. 1997, 34, 562–575. [Google Scholar] [CrossRef]
- Kalbfleisch, N. Crustal-Scale Shear Zones Recording 400 m.y. of Tectonic Activity in the North Caribou Greenstone Belt, Western Superior Province of Canada. Master’s Thesis, Department of Earth and Environmental Sciences, University of Ottawa, Ottawa, ON, Canada, 2012. Unpublished. [Google Scholar]
- Biczok, J.; Hollings, P.; Klipfel, P.; Heaman, L.; Maas, R.; Hamilton, M.; Kamo, S.; Friedman, R. Geochronology of the North Caribou Greenstone Belt, Superior Province Canada: Implications for Tectonic History and Gold Mineralization at the Musselwhite Mine. Precambrian Res. 2012, 192, 209–230. [Google Scholar] [CrossRef]
- Gallagher, S.; Camacho, A.; Fayek, M.; Epp, M.; Spell, T.; Armstrong, R. Geology, Geochemistry, and Geochronology of the East Bay Gold Trend, Red Lake, Ontario, Canada. Miner. Depos. 2018, 53, 127–141. [Google Scholar] [CrossRef]
- Corfu, F.; Andrews, A.J. Geochronological Constraints on the Timing of Magmatism, Deformation, and Gold Mineralization in the Red Lake Greenstone Belt, Northwestern Ontario. Can. J. Earth Sci. 1987, 24, 1302–1320. [Google Scholar] [CrossRef]
- McMaster, D. A Preliminary 40Ar/39Ar Study of the Thermal History and Age of Gold in the Red Lake Greenstone Belt. Master’s Thesis, Department of Physics, University of Toronto, Toronto, ON, Canada, 1987. [Google Scholar]
- Percival, J.A.; Skulski, T. Tectonothermal evolution of the Northern Minto Block, Superior Province, Québec, Canada. Can. Mineral. 2000, 38, 345–378. [Google Scholar] [CrossRef]
- Kerrich, R.; Ludden, J. The Role of Fluids during Formation and Evolution of the Southern Superior Province Lithosphere: An Overview. Can. J. Earth Sci. 2000, 37, 135–164. [Google Scholar] [CrossRef]
- Frape, S.K.; Fritz, P. The Chemistry and Isotopic Composition of Saline Groundwaters from the Sudbury Basin, Ontario. Can. J. Earth Sci. 1982, 19, 645–661. [Google Scholar] [CrossRef]
- Heaman, L.M. Global Mafic Magmatism at 2.45 Ga: Remnants of an Ancient Large Igneous Province? Geology 1997, 25, 299. [Google Scholar] [CrossRef]
- Halls, H.C.; Bates, M.P. The Evolution of the 2.45 Ga Matachewan Dyke Swarm, Canada. In Mafic Dykes and Emplacement Mechanisms; Parker, A.J., Rickwood, P.C., Tucker, D.H., Eds.; Balkema: Leiden, The Netherlands, 1990; pp. 237–250. [Google Scholar]
- Skipton, D.R.; Warren, C.J.; Hanke, F. Numerical Models of P–T, Time and Grain-Size Controls on Ar Diffusion in Biotite: An Aide to Interpreting 40Ar/39Ar Ages. Chem. Geol. 2018, 496, 14–24. [Google Scholar] [CrossRef]
- Mcdannell, K.T.; Zeitler, P.K.; Schneider, D.A. Instability of the Southern Canadian Shield during the Late Proterozoic. Earth Planet. Sci. Lett. 2018, 490, 100–109. [Google Scholar] [CrossRef]
- Claoué-Long, J.C.; King, R.W.; Kerrich, R. Reply to Comment by F. Corfu and D.W. Davis on “Archaean Hydrothermal Zircon in the Abitibi Greenstone Belt: Constraints on the Timing of Gold Mineralisation”. Earth Planet. Sci. Lett. 1992, 109, 601–609. [Google Scholar]
- Jemielita, R.A.; Davis, D.W.; Krogh, T.E. U-Pb Evidence for Abitibi Gold Mineralization Postdating Greenstone Magmatism and Metamorphism. Nature 1990, 346, 831. [Google Scholar] [CrossRef]
- Kerrich, R.; Kyser, T.K. 100 Ma Timing Paradox of Archean Gold, Abitibi Greenstone Belt (Canada): New Evidence from U-Pb and Pb-Pb Evaporation Ages of Hydrothermal Zircons. Geology 1994, 22, 1131. [Google Scholar] [CrossRef]
- Maurice, C.; David, J.; O’neil, J.; Francis, D. Age and Tectonic Implications of Paleoproterozoic Mafic Dyke Swarms for the Origin of 2.2 Ga Enriched Lithosphere beneath the Ungava Peninsula, Canada. Precambrian Res. 2009, 174, 163–180. [Google Scholar] [CrossRef]
© 2019 by the authors. Licensee MDPI, Basel, Switzerland. This article is an open access article distributed under the terms and conditions of the Creative Commons Attribution (CC BY) license (http://creativecommons.org/licenses/by/4.0/).