Article

Further Characterization of the RW-1 Monazite: A New Working Reference Material for Oxygen and Neodymium Isotopic Microanalysis

1
State Key Laboratory of Lithospheric Evolution, Institute of Geology and Geophysics, Chinese Academy of Sciences, Beijing 100029, China
2
College of Earth and Planetary Sciences, University of Chinese Academy of Sciences, Beijing 100049, China
3
Innovation Academy for Earth Science, Chinese Academy of Sciences, Beijing 100029, China
4
Institute of Earth Sciences, University of Lausanne, Bâtiment Géopolis, 1015 Lausanne, Switzerland
*
Author to whom correspondence should be addressed.
Minerals 2019, 9(10), 583; https://doi.org/10.3390/min9100583
Submission received: 23 August 2019 / Revised: 23 September 2019 / Accepted: 23 September 2019 / Published: 26 September 2019
(This article belongs to the Special Issue Accessory Minerals in Silicic Igneous Rocks)

Abstract

:
The oxygen (O) and neodymium (Nd) isotopic composition of monazite provides an ideal tracer of metamorphism and hydrothermal activity. Calibration of the matrix effect and monitoring of the external precision of monazite O–Nd isotopes with microbeam techniques, such as secondary ion mass spectrometry (SIMS) and laser ablation-multicollector-inductively coupled plasma-mass spectrometry (LA-MC-ICPMS), require well-characterized natural monazite standards for precise microbeam measurements. However, the limited number of standards available is impeding the application of monazite O–Nd isotopes. Here, we report on the RW-1 monazite as a potential new working reference material for microbeam analysis of O–Nd isotopes. Microbeam measurements by electron probe microanalysis (EPMA), SIMS, and LA-MC-ICPMS at 10–24 µm scales have confirmed that it is homogeneous in both elemental and O–Nd isotopic compositions. SIMS measurements yield δ18O values consistent, within errors, with those obtained by laser fluorination techniques. Precise analyses of Nd isotope by thermal ionization mass spectrometry (TIMS) are consistent with mean results of LA-MC-ICPMS analyses. We recommend δ18O = 6.30‰ ± 0.16‰ (2SD) and 143Nd/144Nd = 0.512282 ± 0.000011 (2SD) as being the reference values for the RW-1 monazite.

1. Introduction

Monazite is a light rare earth element (LREE)-bearing phosphate mineral and has an extremely variable composition, e.g., monazite-(Ce), monazite-(La), monazite-(Nd), and monazite-(Sm) [1]. It is a ubiquitous accessory mineral in peraluminous granite, pegmatite, metapelite, metapsammite, carbonatite, and hydrothermal veins [1]. It also occurs as a detrital mineral in many clastic sedimentary rocks. Monazite is sensitive to relatively low-grade metamorphism (down to greenschist facies) [2] and hydrothermal fluids [3]. Due to its high U and Th contents, low initial nonradiogenic Pb content, and apparent resistance to metamictization, monazite has been widely acknowledged as a good geochronometer (e.g., [1,4,5]). More importantly, monazite is the major carrier of rare earth elements (REEs) and, therefore, is considered the best proxy for use in the estimation of Nd isotopic compositions of large continental areas [6]. Furthermore, the oxygen isotopic composition of monazite is considered an essential monitor of fluid infiltration during metamorphism [7]. The elemental composition of monazite is also used to calculate the temperatures of metamorphism where it coexists with xenotime and garnet [8,9]. Therefore, the combination of monazite U–Th–Pb ages and O–Nd isotopic and elemental compositions may provide a comprehensive view of many geological processes and continental evolution [10].
Current secondary ion mass spectrometry (SIMS) and laser ablation-multicollector-inductively coupled plasma-mass spectrometry (LA-MC-ICPMS) techniques provide rapid data output in monazite U–Th–Pb age determinations and O–Nd isotopic microanalyses, with higher spatial resolution and less sample destruction than traditional bulk dissolution analytical techniques (e.g., [7,11,12]). However, such microbeam techniques require matrix-matched reference materials to correct for matrix effects and to evaluate the external precision. So far, many monazite U–Th–Pb age standards have been developed (Table 1), while monazite standards for O–Nd isotopic microanalysis are limited. Breecker and Sharp [13] found that instrumental mass fractionation (IMF) in the SIMS analysis of the monazite oxygen isotope is significantly correlated with the Th content. More recently, Rubatto et al. [14] and Didier et al. [15] refined in situ monazite analytical procedures and attempted to correct IMF with a set of reference materials of different Th and YREEPO4 contents (XREEY). Monazite composition varies greatly due to the substitution of huttonite (ThSiO4) and cheralite [CaTh(PO4)2] [1]. The Th content of these monazite-group minerals varies from a few hundred ppm up to 45 wt.% [16]. Therefore, the availability of compositionally diverse standards covering the range of natural monazite compositions is fundamental for precise oxygen isotopic analysis by SIMS.
An ideal monazite standard would be homogeneous for U–Th–Pb ages and O–Nd isotopic and elemental compositions, as well as being easily available to the scientific community. To date, ten monazite reference materials have been reported for the O isotope, and nine for the Nd isotope (e.g., [12,13,14,15,17,18,19,20,21,22,23,24,25], Table 1). Among them, six are heterogeneous in elemental compositions (eBay, USGS-44069, Itambe, UNIL-Mnz2, M1, and M4), two are heterogeneous in O isotopic compositions (eBay and 554), and Manangoutry monazite is of limited quantity. Only one reference material, Moacyr, is ideal for U–Th–Pb and O–Nd isotopic microanalysis, therefore, new monazite standards are urgently required. This study reports a comprehensive analysis of the elemental and O–Nd isotopic compositions of the RW-1 monazite, which has been reported as a reference material for U–Th–Pb microbeam dating [17]. We investigate its crystal structure using Raman Spectroscopy for the first time and assess its compositional homogeneity using electron probe microanalysis (EPMA), including X-ray mapping, cathodoluminescent (CL) imaging, and laser ablation-inductively coupled plasma-mass spectrometry (LA-ICPMS). We assess its homogeneity of O–Nd isotopic compositions using SIMS and LA-ICPMS at a scale of ~20 µm, and precisely determine isotopic compositions using laser fluorination isotope ratio mass spectrometry (LF-IRMS) and thermal ionization mass spectrometry (TIMS). Results indicate that the RW-1 monazite may be a new high-Th (i.e., enriched in Th content) monazite reference material for microbeam O–Nd isotopic analyses.

2. Sample Descriptions

The RW-1 monazite was collected from a pegmatite dike located in the Landsverk 1 quarry in the Evje-Iveland district, Southern Norway [17]. It is a yellowish-brown crystal with a weight of 44 g, provided by the Evje og Hornnes Geomuseum Fennefoss, Norway. It is transparent under a binocular microscope and homogeneous in terms of its gray-scale intensity in back-scattered electron (BSE) images [17]. It has been recently developed as a reference material for U–Th–Pb microbeam dating with a recommended reference 207Pb/235U age of 904.15 ± 0.26 Ma [17].
The RW-1 crystal was crushed into fragments of around 50–200 µm diameter. Monazite fragments were randomly selected by handpicking under a binocular microscope and cast in a standard epoxy mount with a diameter of 2.5 cm along with Diamantina, UNIL-Mnz1, USGS-44069, Itambe, and Manangoutry monazite standards. The mount was polished to expose fragment interiors. Monazite grains were documented with transmitted and reflected light photomicrographs and analyzed by Raman spectrometry. Cathodoluminescence (CL) images revealed internal structures and mineral inclusions. In addition, the fragments were investigated by X-ray mapping to understand the elemental (Si, Th, Ce, and Y) distributions.

3. Analytical Methods

All spectroscopic and image studies and compositional and isotopic analyses were performed at the Institute of Geology and Geophysics, Chinese Academy of Sciences (IGG-CAS), Beijing, China (except LF-IRMS; see Section 3.4).

3.1. Spectroscopic and Image Investigations

Raman spectra were acquired with a Horiba–Jobin Yvon LabRam HR 800 Raman spectroscopy system using a 633 nm He–Ne laser for excitation, with a spectral resolution of up to 0.65 cm−1. CL images were obtained using a Nova NanoSEM 450 field emission scanning electron microscope (FE-SEM) equipped with a Gatan Mono CL4 detector, with an accelerating voltage of 10 kV and working distance of 13.5 mm. X-ray mapping used a CAMECA SXFiveFE EPMA and Bruker energy-dispersive X-ray spectrometer (EDS) operating in BSE mode with an accelerating voltage of 10 kV, primary beam current of 100 nA, 0.4 × 0.4 µm step size, and dwell time of 30 ms per step (with 3 h acquisition per map).

3.2. Major and Trace Element Compositions

The major element composition of RW-1 fragments, including P, La, Ce, Pr, Nd, Sm, Gd, Dy, Y, Si, Ca, Th, U, and Pb, was determined using a CAMECA SXFiveFE EPMA equipped with thallium acid phthalate (TAP), and large LiF and polyethylene terephthalate (PET) diffraction crystals, with an accelerating voltage of 10 kV, beam current of 200 nA, defocused beam diameter of 10 µm, 20–30 s counting time per element (120 s for Pb), and a total acquisition time of ~6 min. Standards were a natural apatite [Ca5PO4(F, Cl, OH)] for P and Ca; a natural wollastonite (CaSiO3) for Si; a natural crocoite (PbCrO4) for Pb; two Si–Al–Ca glasses containing 5 wt.% Th and U; and nine Si–Al–Ca glasses containing ~10 wt.% of each REE.
Concentrations of middle (MREEs) and heavy REEs (HREEs), including Eu, Tb, Ho, Er, Tm, Yb, and Lu, were determined for 23 monazite fragments using an Agilent 7500a quadrupole-inductively coupled plasma-mass spectrometry (Q-ICPMS) system (Agilent Technologies, Santa Clara, CA, USA) coupled to a 193 nm ArF excimer laser system (Geolas HD, Lambda Physik, Göttingen, Germany). Procedures were similar to those described by Wu et al. [26] with isotopes measured in peak hopping mode with a laser beam diameter of 24 µm, pulse repetition rate of 3 Hz, beam flux of 5 J/cm2, acquisition times of ~20 s for background and 40 s for sample data, and a He–Ar carrier gas. Trace element concentrations were calibrated against National Institute of Standards and Technology (NIST) Standard Reference Material (SRM) 610 as an external reference material. The average Ce content (determined by EPMA) was used as an internal standard to correct for differences in ablation yields between monazite and glass reference materials. US Geological Survey (USGS) BCR-2G glass was analyzed for further quality control purposes using the internal standard Ce. Concentrations were calculated using the GLITTER 4.0 program [27]. For most trace elements with concentrations of >0.5 ppm, the accuracy was better than 10% relative standard deviation (2RSD), with a precision (2RSD) of 20%.

3.3. SIMS Oxygen Isotopic Analysis

The RW-1 oxygen isotopic composition (δ18O) was determined using a Cameca IMS-1280 SIMS system following analytical procedures similar to those described by Li et al. [28] and Tang et al. [29]. The Gaussian-focused Cs+ ion beam was accelerated at 10 kV, with an intensity of 1.3–2.0 nA and raster size of 10 µm. A normal incidence electron-flood gun was used to compensate for sample charging and to maintain the voltage stability. Negative secondary ions were extracted with a −10 kV potential. 16O and 18O ions were detected simultaneously by two Faraday cups (multicollection mode). The nuclear magnetic resonance (NMR) controller was used to stabilize the magnetic field. The entrance slit was set at ~125 µm, the field aperture was 6000 µm, the energy slit was 40 eV, and the exit slit was ~300 µm. The signal intensity of 16O was ~1.6 × 10⁹ cps, and the primary beam size was typically 10 × 15 µm. Each spot analysis involved presputtering, beam centering, and signal collection, with a total analytical time per spot of ~3 min, including 2 min for presputtering and centering of the secondary beam, and 1 min for collection of 16 cycles of 16O and 18O signals. Measured 18O/16O ratios were normalized to Vienna Standard Mean Ocean Water compositions (V-SMOW; 18O/16O = 0.0020052), and results are given in the δ notation. The internal precision of a single analysis was generally 0.2–0.3‰ (2SE).

3.4. LF-IRMS Oxygen Isotopic Analysis

RW-1 oxygen isotopic compositions were also determined by LF-IRMS at the Stable Isotope Laboratory of the University of Lausanne, Switzerland using procedures similar to those described by Didier et al. [15]. Transparent and inclusion-free monazite fragments were selected and crushed into powders and 1–2 mg of powder was loaded into pits in a Pt sample holder. After a two-step prefluorination of 10–12 h and 10 min, O2 was extracted by a CO2 laser in an F2-atmosphere (100 mbar). The gas mixture was purified and analyzed in a dual inlet gas-source mass spectrometer (Finnigan MAT 253). The NBS-28 quartz standard was alternately analyzed with RW-1 samples, as an external reference material. Seven repeated measurements on NBS-28 quartz yielded a δ18O value of 9.55‰ ± 0.11‰ (2SD) that is identical, within errors, to the recommended value of 9.64‰ ± 0.12‰ (2SD) [30].

3.5. Sm–Nd Isotopic Composition

RW-1 Sm–Nd isotopic compositions were determined using a Neptune plus MC-ICPMS coupled to a 193 nm ArF excimer laser ablation system following procedures similar to those described by Liu et al. [12] and Yang et al. [31]. Individual fragments were analyzed in static mode with ablation pits 16 μm in diameter, a pulse repetition rate of 2 Hz, and a laser beam flux of 5 J/cm2 with a He carrier gas. N2 was mixed with the Ar to enhance the signal intensity and to reduce the production of NdO+. Each spot analysis was carried out in one block over 200 cycles, with an integration time of 0.262 s per cycle and a total time per spot of ~60 s. Because the Sm content of monazite is relatively high (~3 wt.%), a 147Sm/149Sm ratio of 1.08680 [32] and 144Sm/149Sm ratio of 0.22332 [33] was applied in correcting the isobaric interference of 144Sm on 144Nd. Measured 143Nd/144Nd ratios were normalized to 146Nd/144Nd = 0.7219 using the exponential law. A total of 214 analyses of Sm–Nd isotopes were carried out in two sessions. The Namaqualand monazite standard yielded a 143Nd/144Nd ratio of 0.511874 ± 0.000040 (2SD; n = 34), consistent, within errors, with the recommended value of 0.511894 ± 0.000025 (2SD) [12]. The Iveland monazite standard yielded a 143Nd/144Nd ratio of 0.512927 ± 0.000030 (2SD; n = 34), also consistent, within errors, with the recommended value of 0.512963 ± 0.000093 (2SD) [12].

3.6. TIMS Nd Isotopic Analysis

Monazite fragments (1–2 mg) were handpicked under a binocular microscope for Sm–Nd TIMS isotopic analysis. The fragments were cleaned ultrasonically three times for 10 min with Milli-Q > 18.2 MΩ water, dried, and split into several aliquots, which were digested in a PFA Teflon screw-top vial in 6 M HCl at 160 °C for 24 h. Chemical separation involved conventional two-stage ion exchange purification techniques [34] with REEs being separated from matrix elements by cation exchange (Bio-Rad AG50W-X12; 200–400 mesh resin) and Nd being purified with Ln Spec (Eichrom Technologies, Lisle, IL, USA) resin. Nd isotopic ratios were determined using a Triton Plus TIMS instrument (Thermo Fisher, Waltham, MA, USA) in static mode with Faraday cups [34]. The Nd procedural blank was <50 pg, requiring no correction of isotopic ratios. Measured 143Nd/144Nd ratios were normalized to 146Nd/144Nd = 0.7219 using the exponential law. The standard solution JNdi-1 [35] was used to evaluate instrumental bias during data collection. The JNdi-1 standard yielded a 143Nd/144Nd ratio of 0.512107 ± 0.000006 (n = 3; 2SD). Seven measurements of RW-1 Nd isotopic compositions were carried out by TIMS. Raw data were corrected to the JNdi-1 standard according to the reference 143Nd/144Nd value of 0.512115 ± 0.000007 (2SD) [35].

4. Results and Discussion

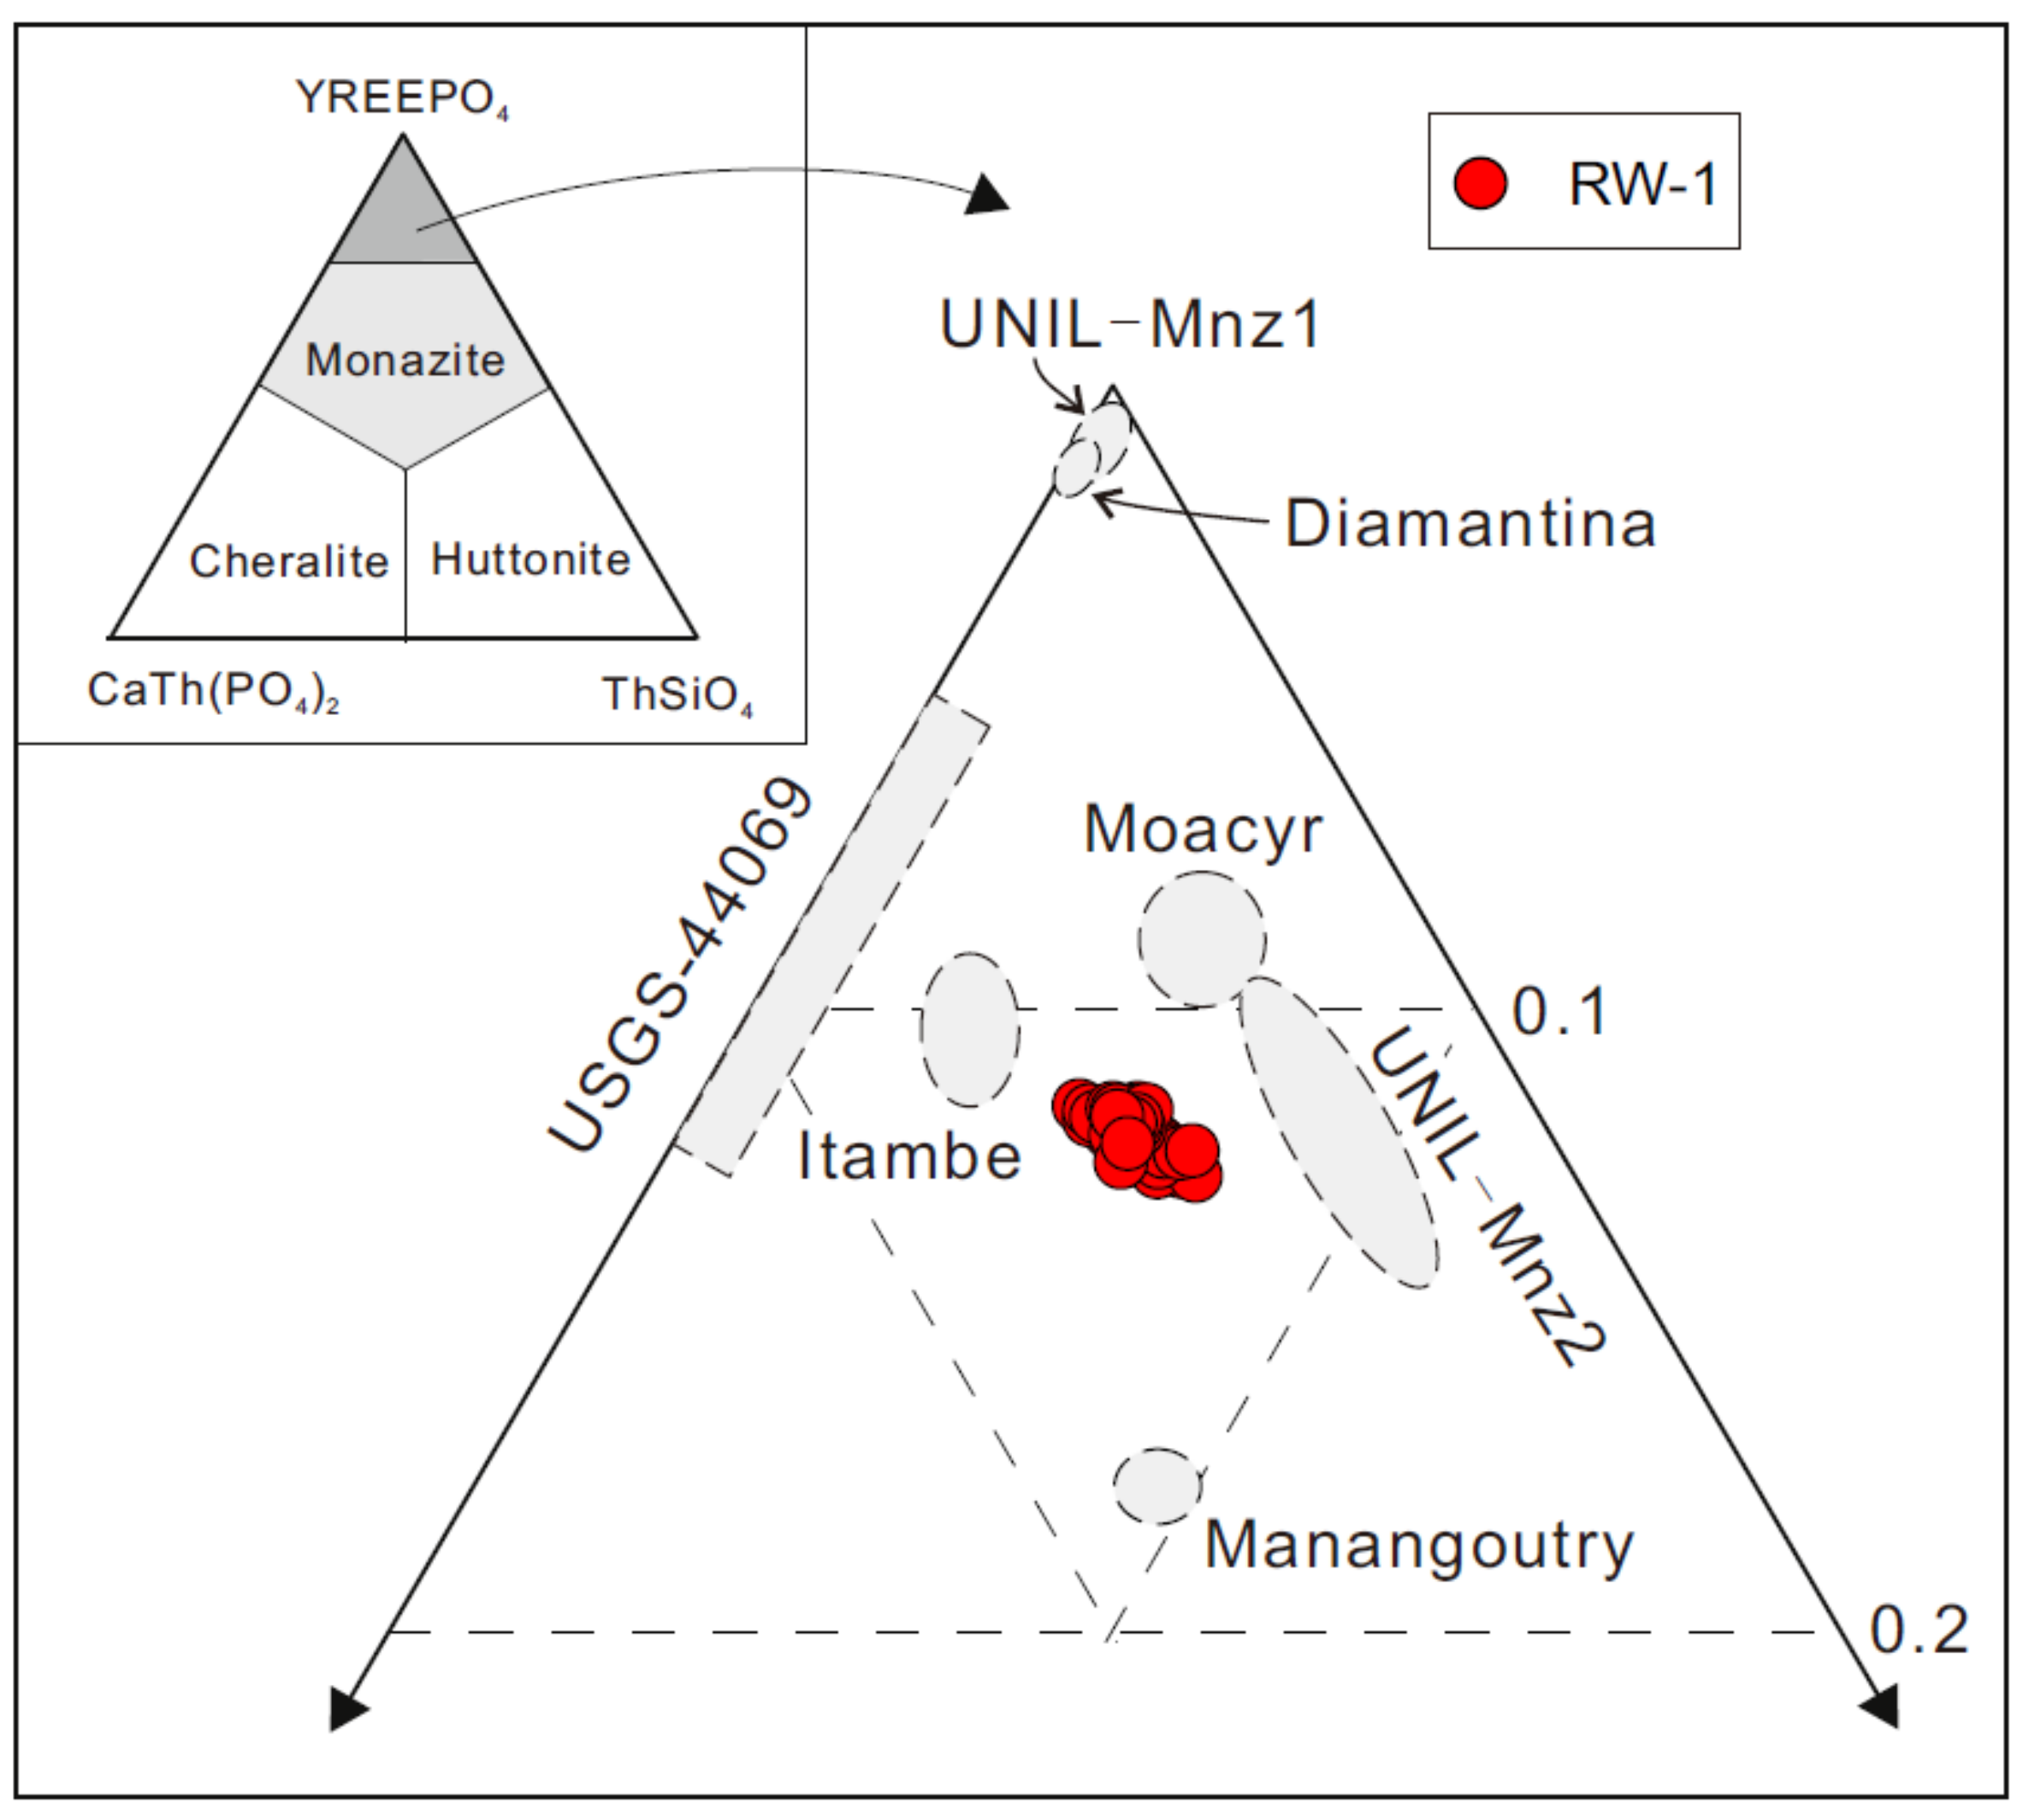
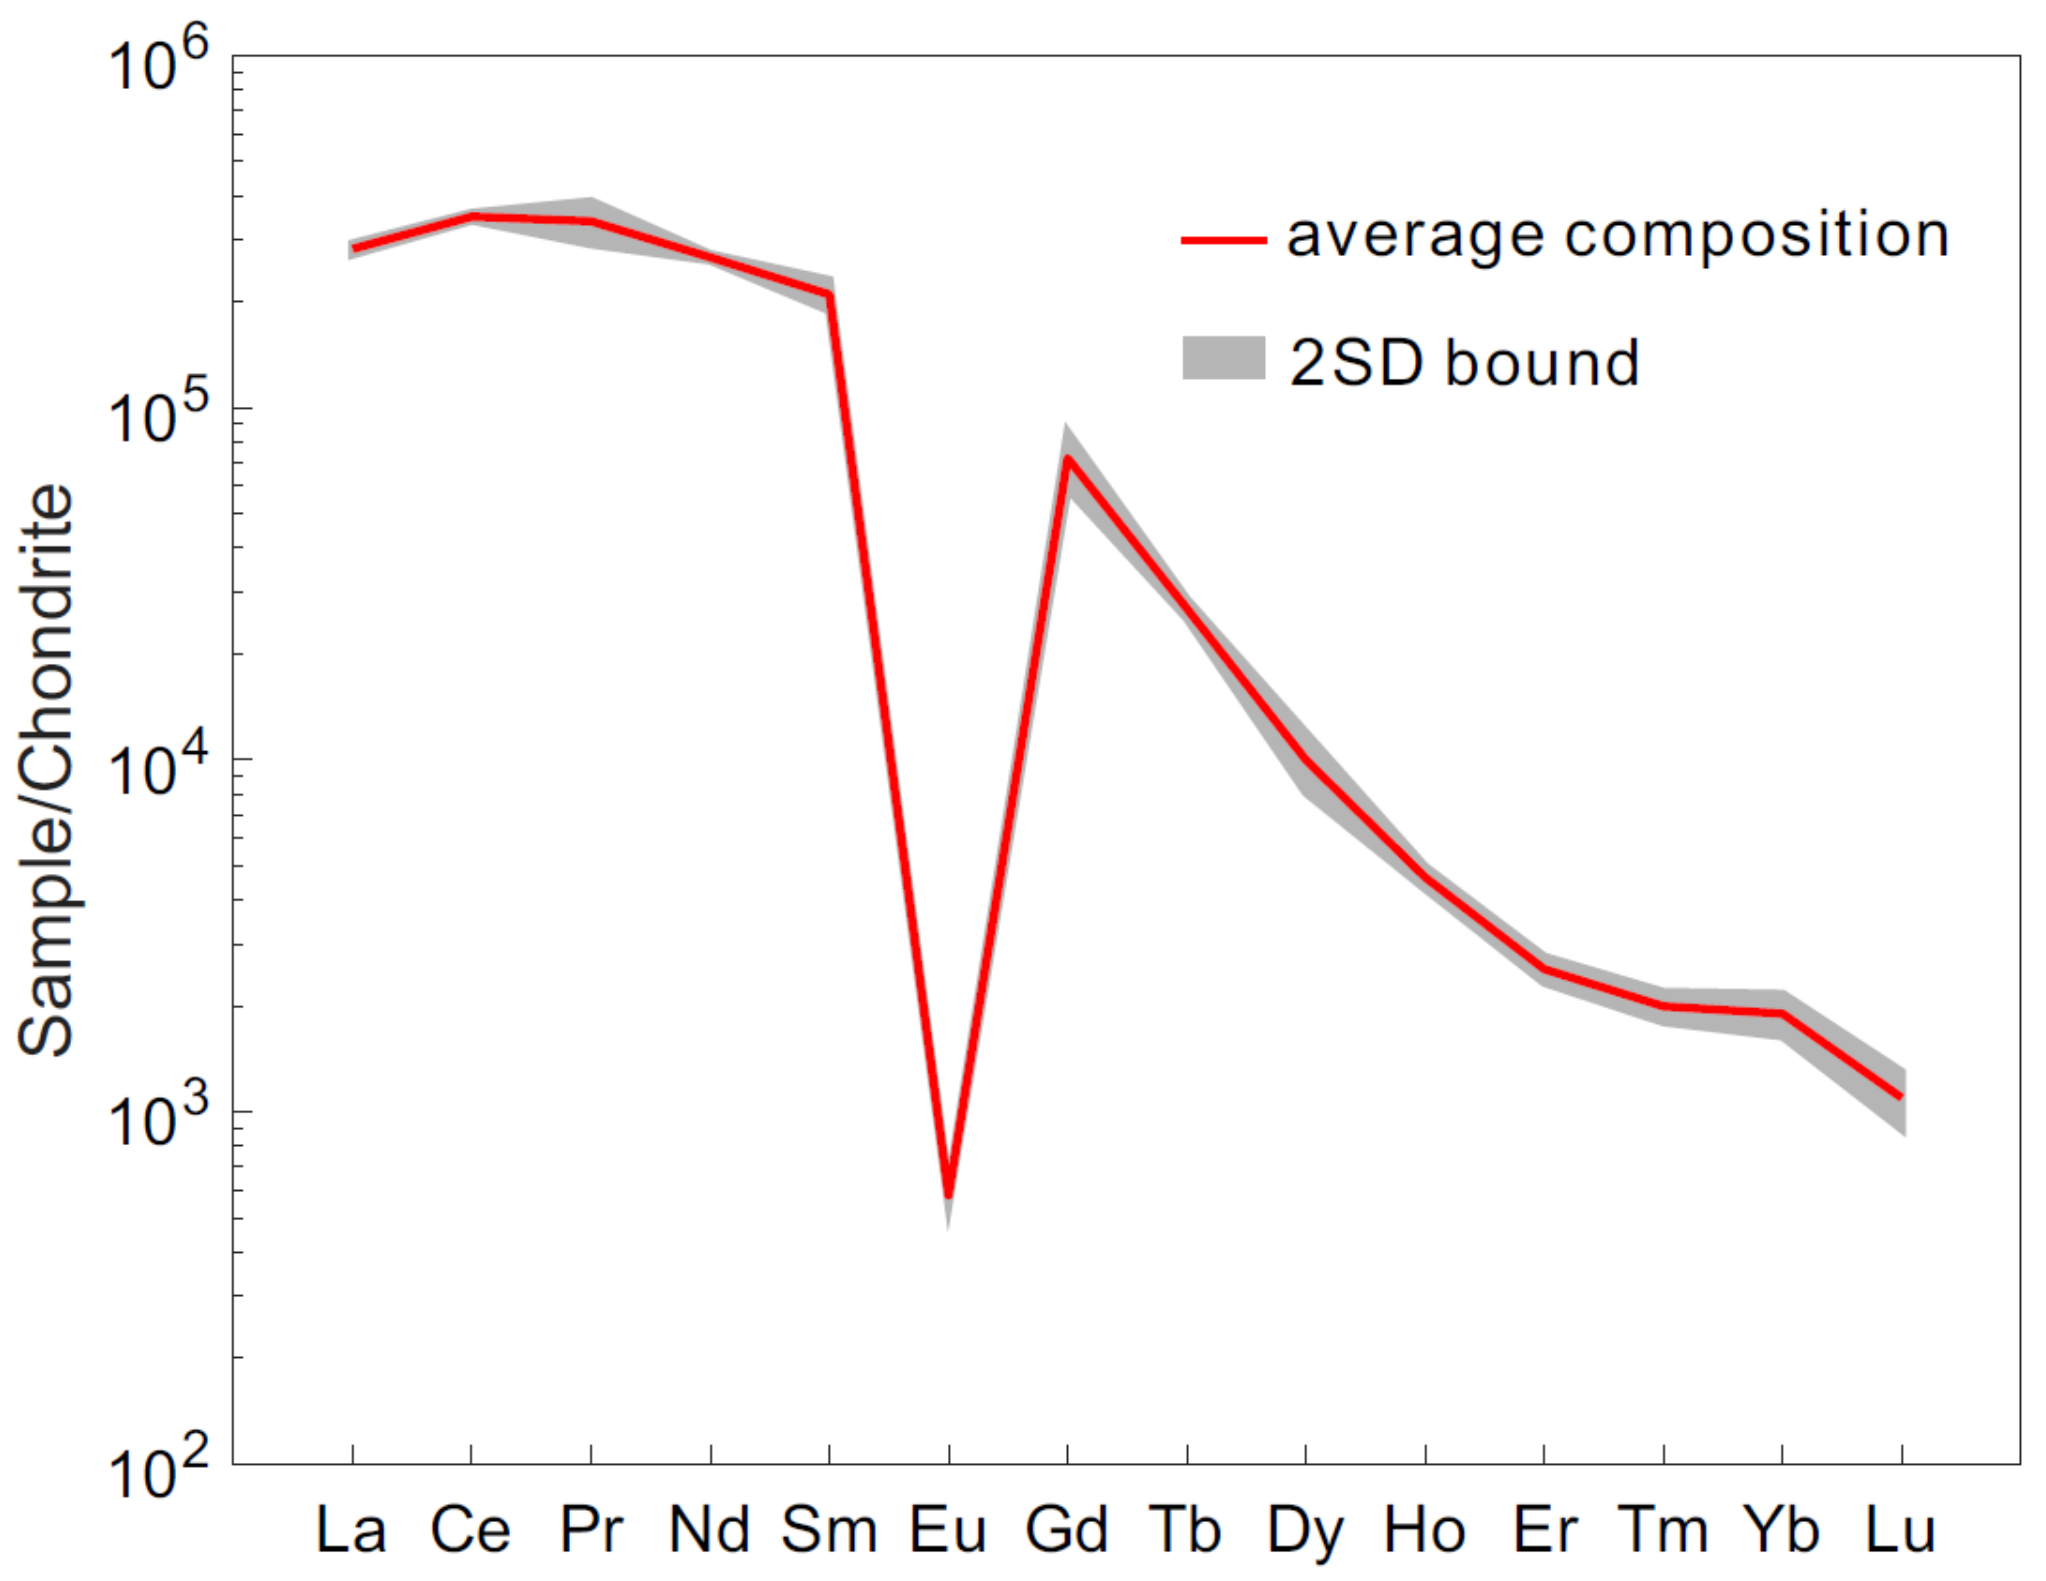
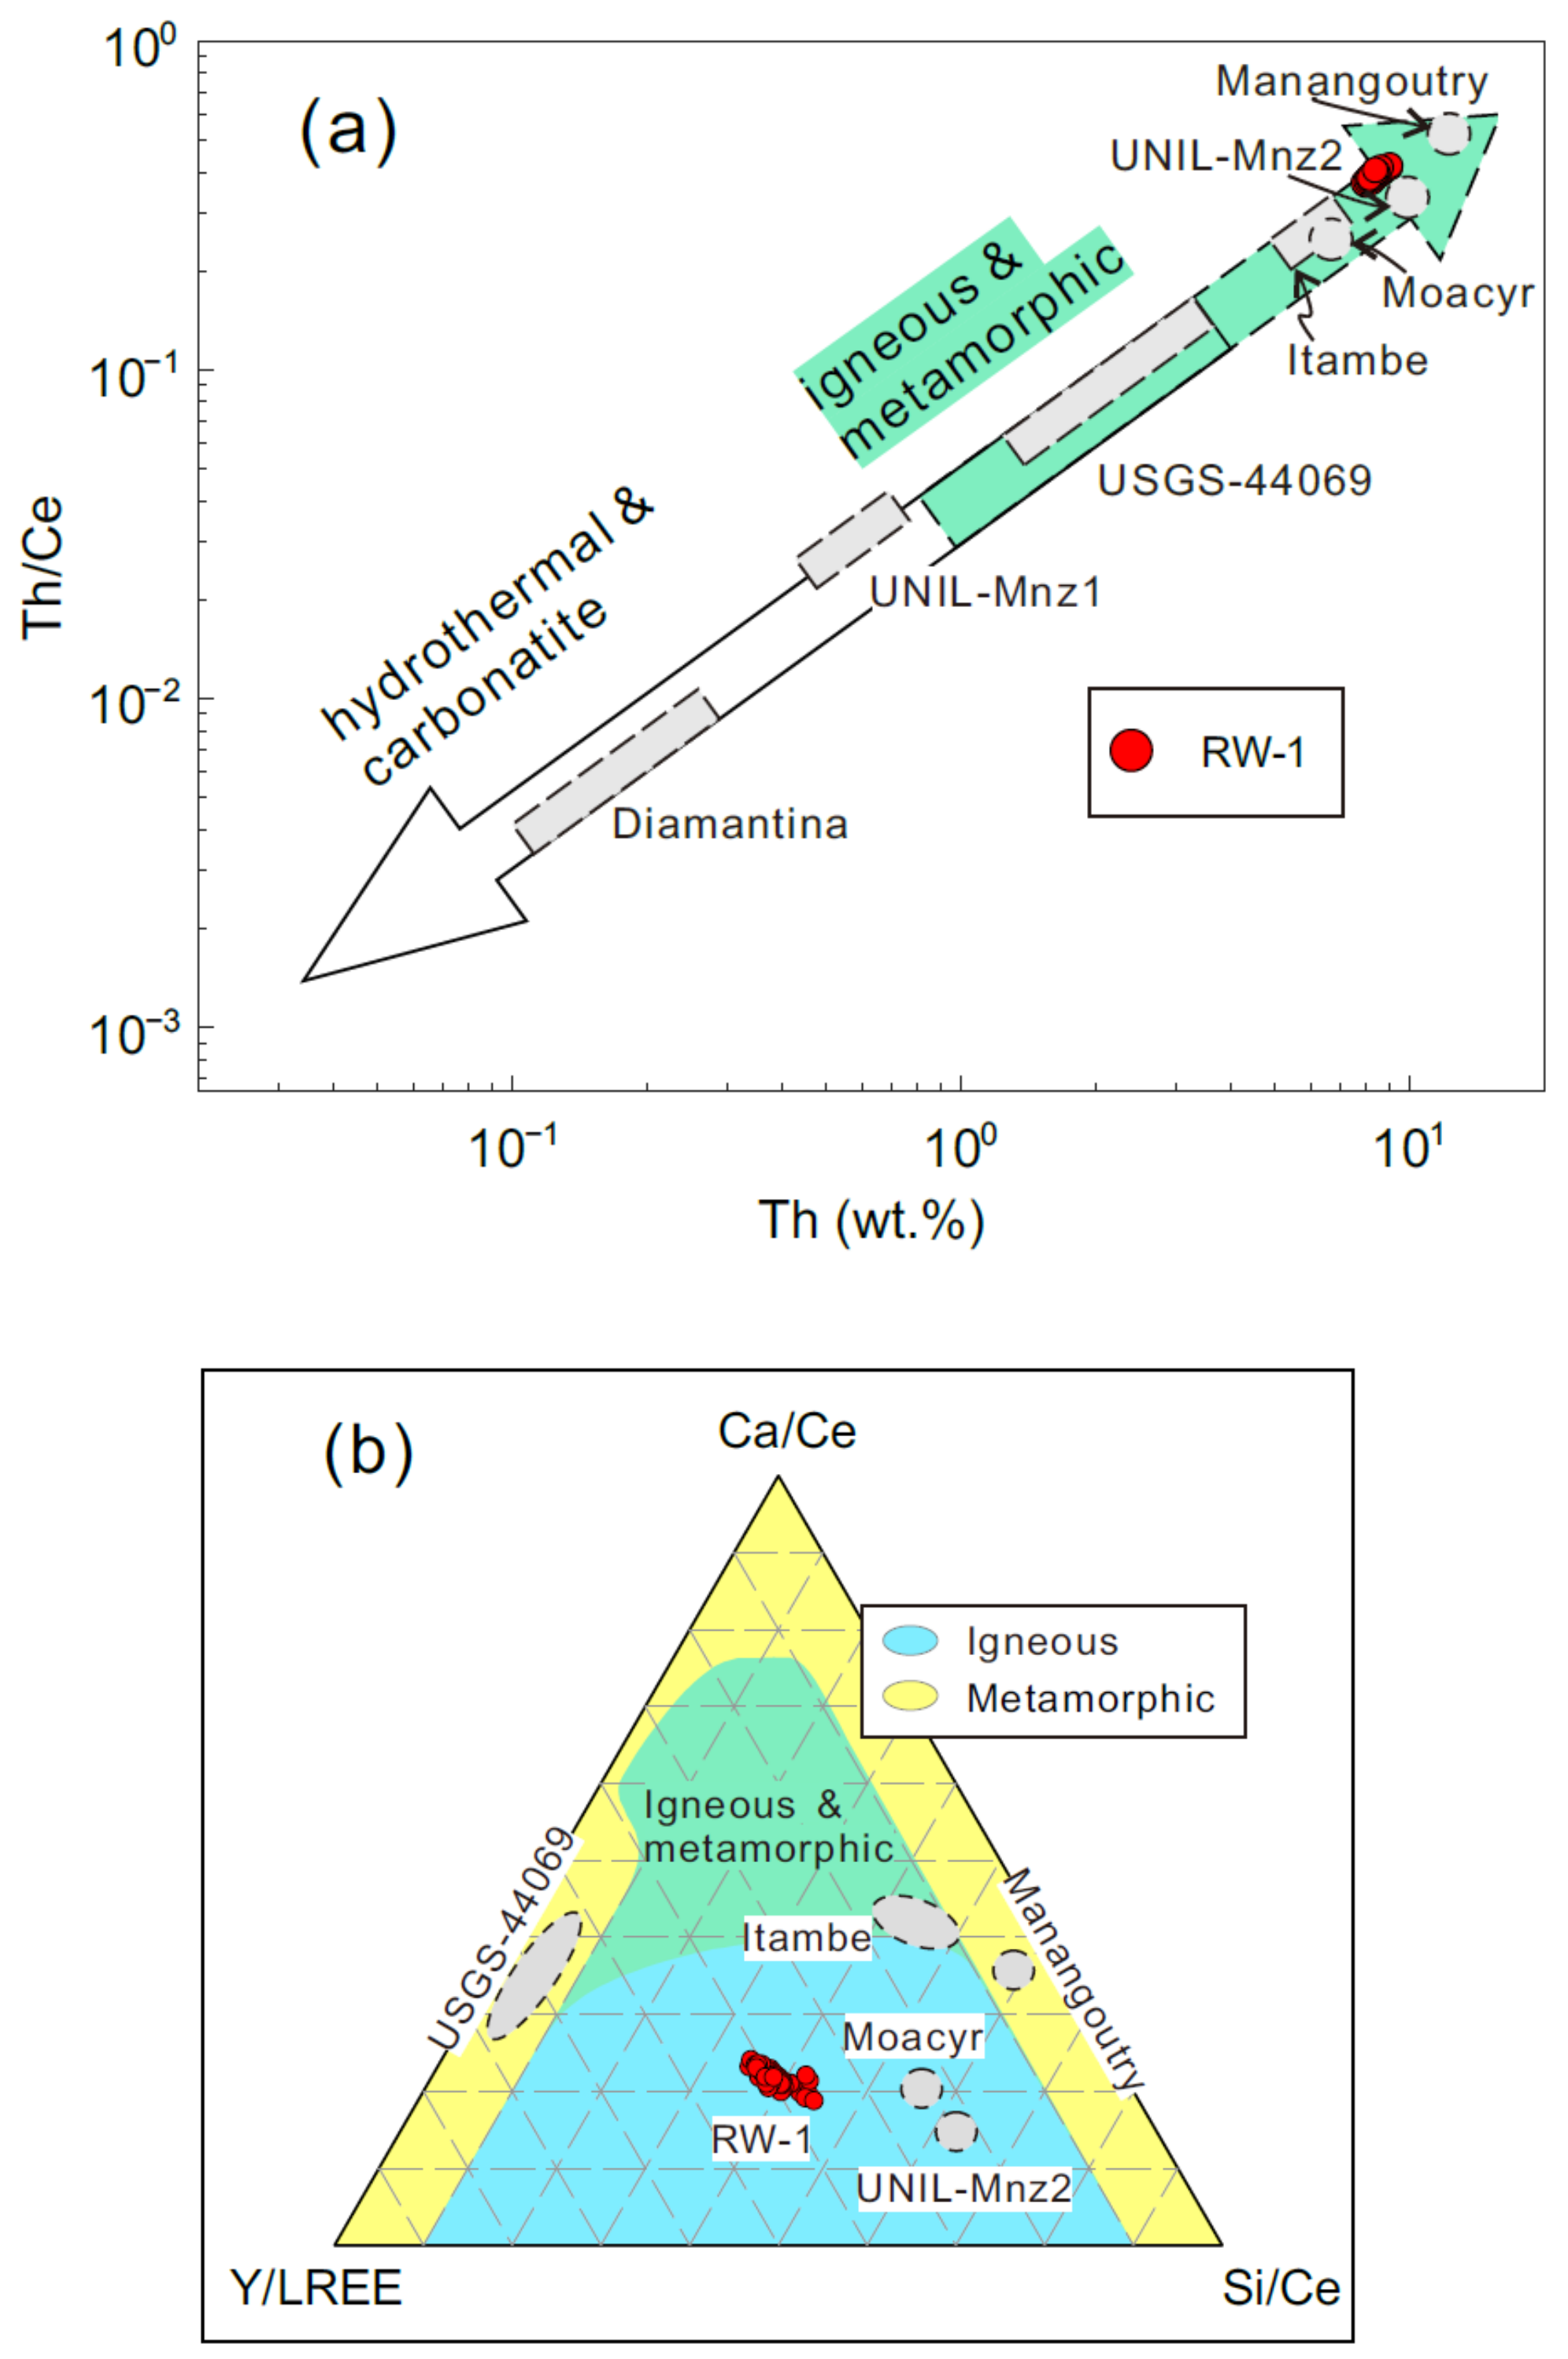
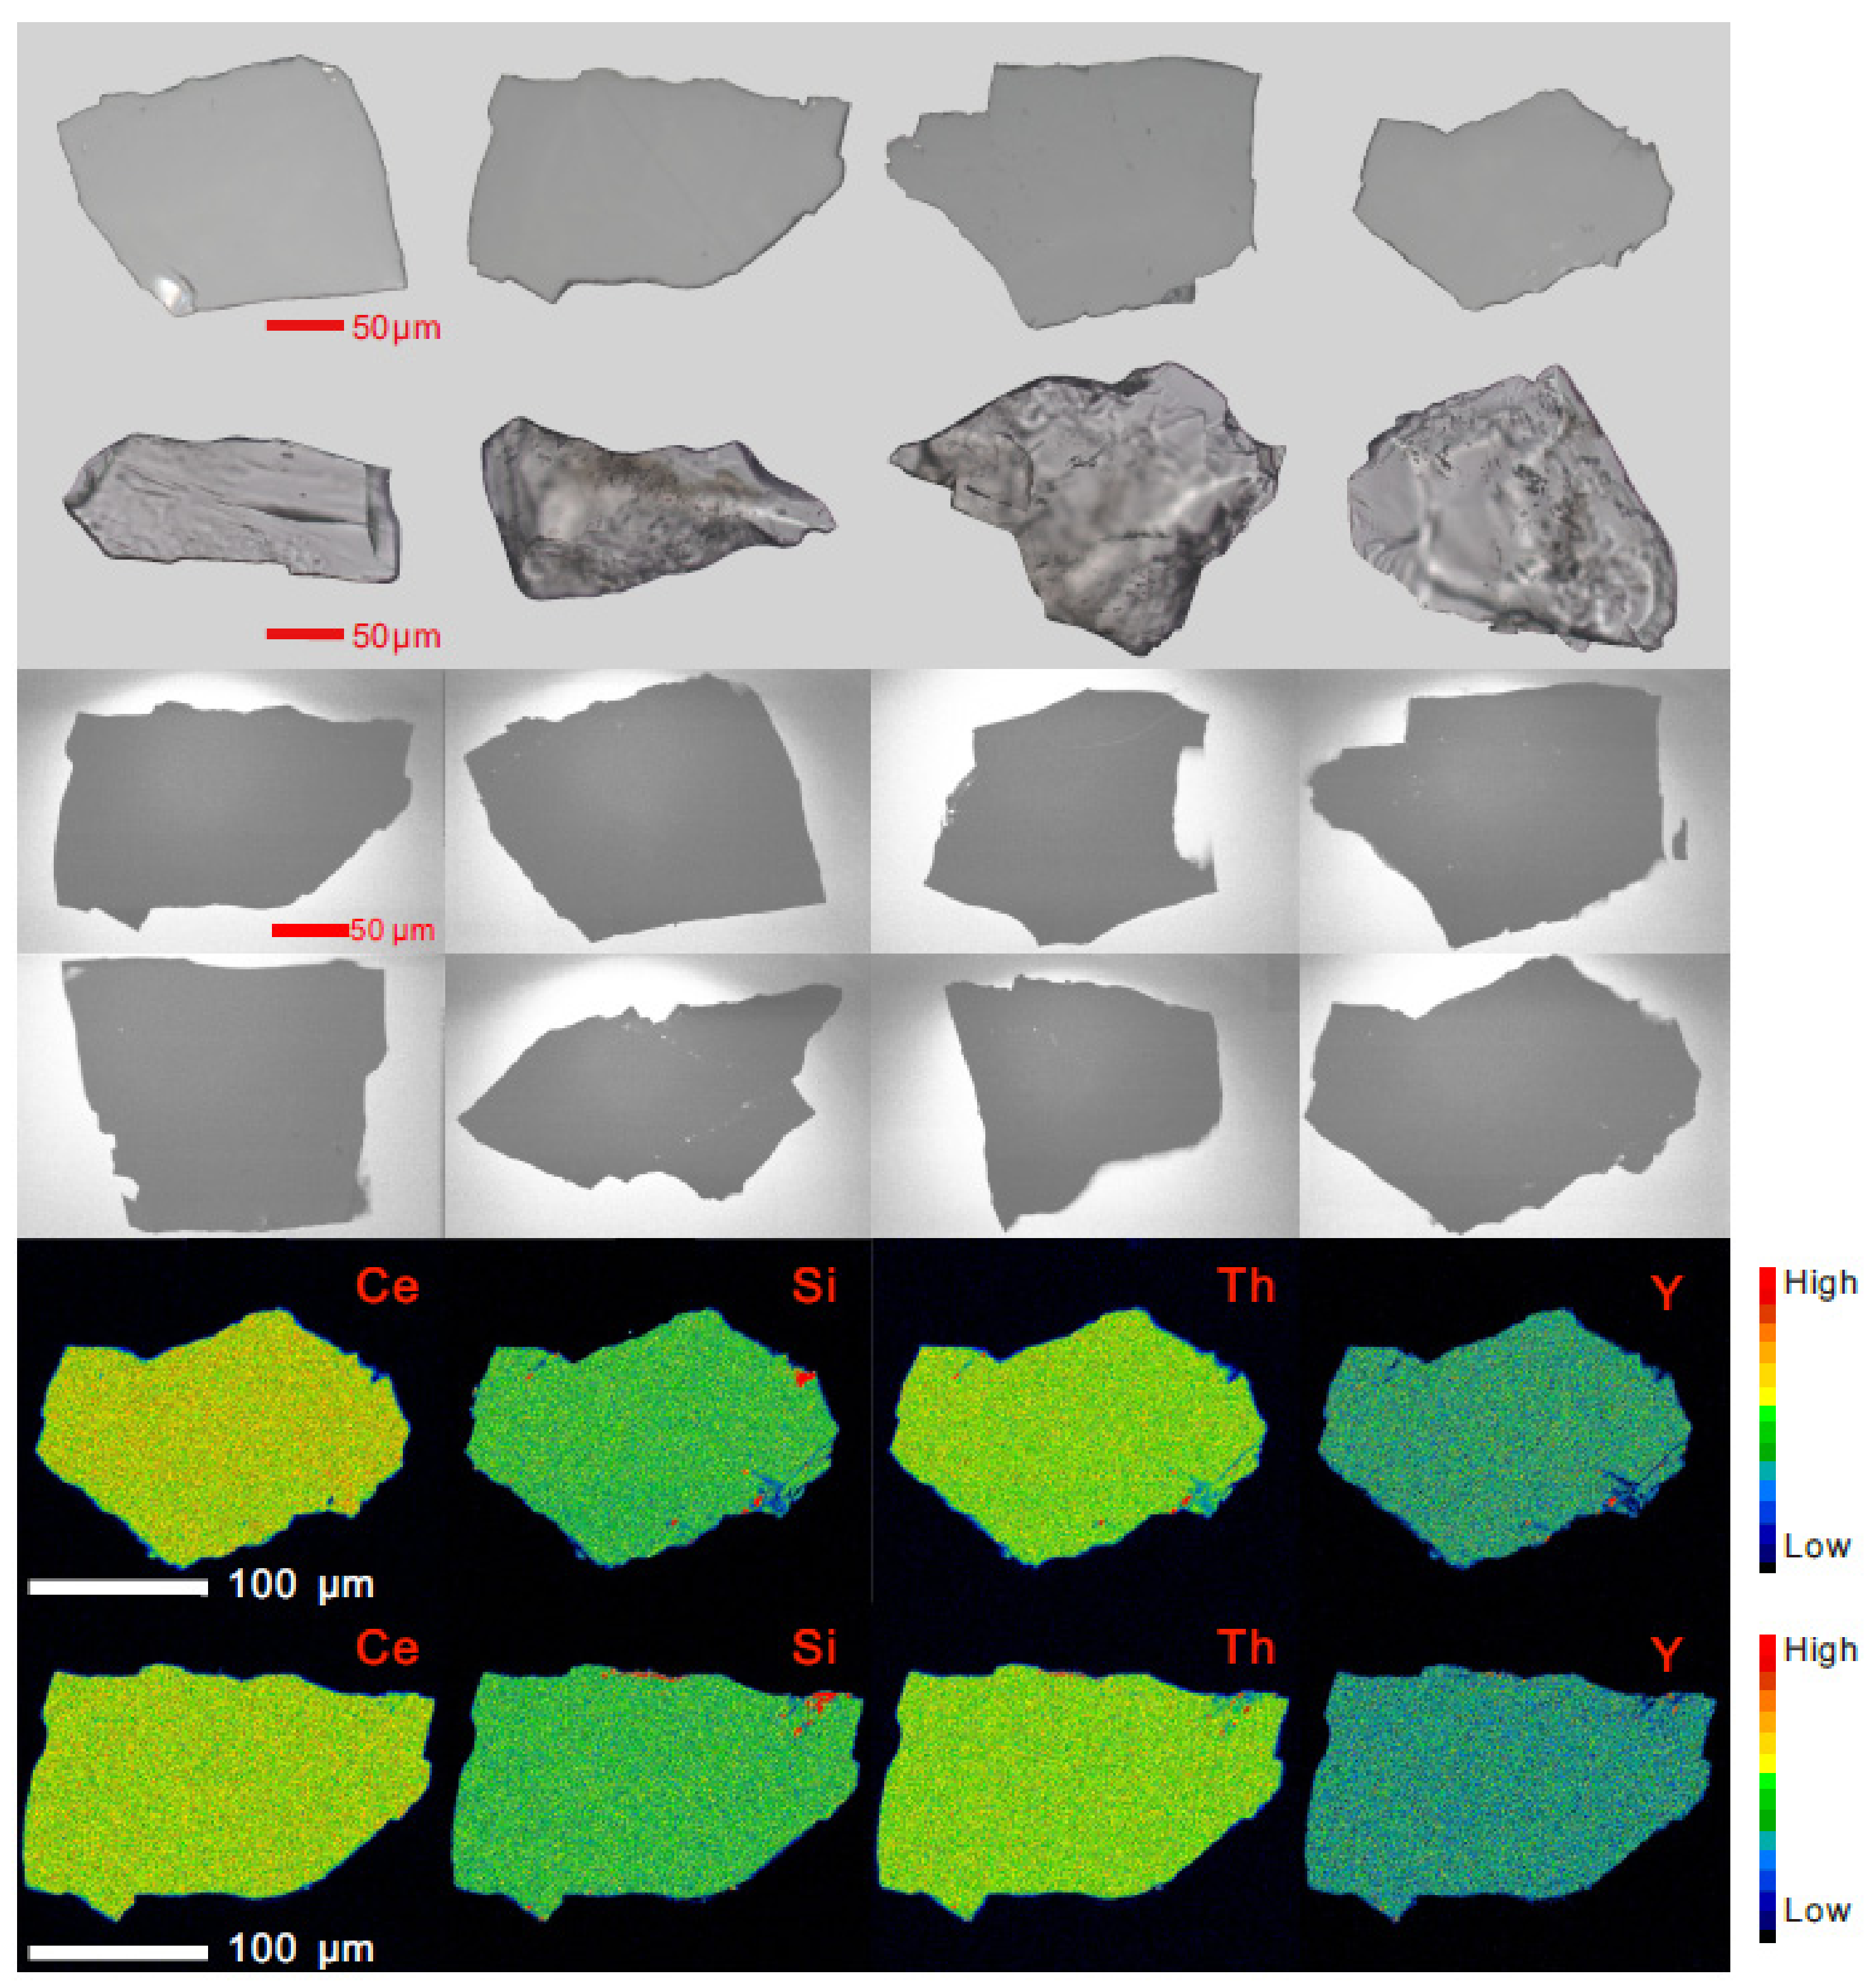
4.1. RW-1 Mineralogical Features and Elemental Compositions

RW-1 fragments are transparent, but occasionally opaque with some fractures and inclusions under transmitted and reflected light (Appendix A, Figure A1). It has four main Raman bands at approximately 470, 620, 970, and 1050 cm−1 (Figure 1), typical of internal modes of the noninteracting PO4 units within the monazite system [36,37]. The RW-1 Raman shift was consistent with those of UNIL-Mnz1, USGS-44069, and Manangoutry monazite standards (Figure 1). The Itambe monazite has an ambiguous peak at ~1050 cm−1, while low-Th monazites such as UNIL-Mnz1 and Diamantina tend to have an additional peak at ~990 cm−1 and a more conspicuous Raman band at ~470 cm−1 relative to the high-Th monazites, such as Itambe and Manangoutry. RW-1 displayed no visible zoning and no conspicuous inclusions in CL images (Appendix A, Figure A1). The high-resolution X-ray map indicates that RW-1 is homogeneous without discernible Si, Th, Ce, or Y compositional zonation (Appendix A, Figure A1).
The inter-shard variation of major oxide compositions was investigated by EPMA in three sessions (1, 2, and 3, Table S1), involving individual analyses of 23, 21, and 36 fragments, respectively (Sessions 1 and 3 did not include UO2 and PbO, respectively). Overall, all EPMA analyses of RW-1 fragments indicated high ThO2 (9.48 ± 0.50 wt.%; 2SD) and low UO2 (0.23 ± 0.05 wt.%; 2SD) contents, and high Th/U ratios (41.4 ± 9.2; 2SD). The most abundant REE is Ce2O3 (25.05 ± 0.60 wt.%; 2SD), followed by Nd2O3 (14.26 ± 0.28 wt.%; 2SD) and La2O3 (7.85 ± 0.28 wt.%; 2SD) (Table 2). Y2O3 contents are in the range of 2.16–2.55 wt.%. Overall, inter-shard variation of major elements was limited to 2–5% 2RSD for high-concentration (>4 wt.%) elements, such as Ce, P, Nd, Th, and La, and 7–22% 2RSD for low-concentration (<4 wt.%) elements, including Pr, Sm, Y, Gd, Si, Ca, Pb, Dy, and U. In the ThSiO4–YREEPO4–CaTh(PO4)2 ternary diagram (Figure 2), the RW-1 monazite displays a reasonably homogeneous composition, plotted near high-Th UNIL-Mnz2 monazite. The structural formulae based on four oxygens [8] have an average end-member composition of 6.3% huttonite (ThSiO4), 5.7% cheralite (CaTh(PO4)2), and 88.0% monazite (YREEPO4) (Table S1).
Variations in MREE and HREE contents of RW-1, including Eu, Tb, Ho, Er, Tm, Yb, and Lu, were also investigated by LA-Q-ICPMS. Twenty-three analyses revealed average Eu and Lu contents of 33 ± 2 ppm (2SD) and 27 ± 5 ppm (2SD), respectively (Table 2). The relative standard deviations of trace element contents were generally <20% (2RSD). RW-1 chondrite-normalized REE patterns exhibited light REE (LREE) enrichment with [La/Dy]N ~28 (Figure 3; subscript N denotes chondrite normalized value [38]). The small fractionation in MREEs and HREEs ([Gd/Lu]N ~66), large negative [Eu/Eu*]N anomaly (~0.005, [Eu/Eu*]N = [Eu]N/([Sm]N × [Gd]N)0.5), and low [Th/U]N ratio (~10) are considered typical characteristics of monazite in garnet-absent metamorphic or igneous rocks [39]. Compared with monazite of different origins (see integrated data in Table S2), RW-1 appears compositionally similar to the Moacyr and UNIL-Mnz2 monazite in Th-Th/Ce and Si/Ce-Ca/Ce-Y/LREE diagrams (Figure 4). The monazite from hydrothermal rocks or carbonatite is characteristically low in Th content (<1 wt.%) and Th/Ce ratio (<0.04) (Figure 4a), such as the UNIL-Mnz1 and Diamantina monazite (Table 1). The igneous monazite has large ranges, focused in the center of the Si/Ce-Ca/Ce-Y/LREE diagram (Figure 4b), like the RW-1, Itambe, Moacyr, and UNIL-Mnz2 monazite, while the metamorphic monazite is scattered to the low “Si/Ce” and low “Y/LREE” fields, like the USGS-44069 and Manangoutry monazite (Table 1).

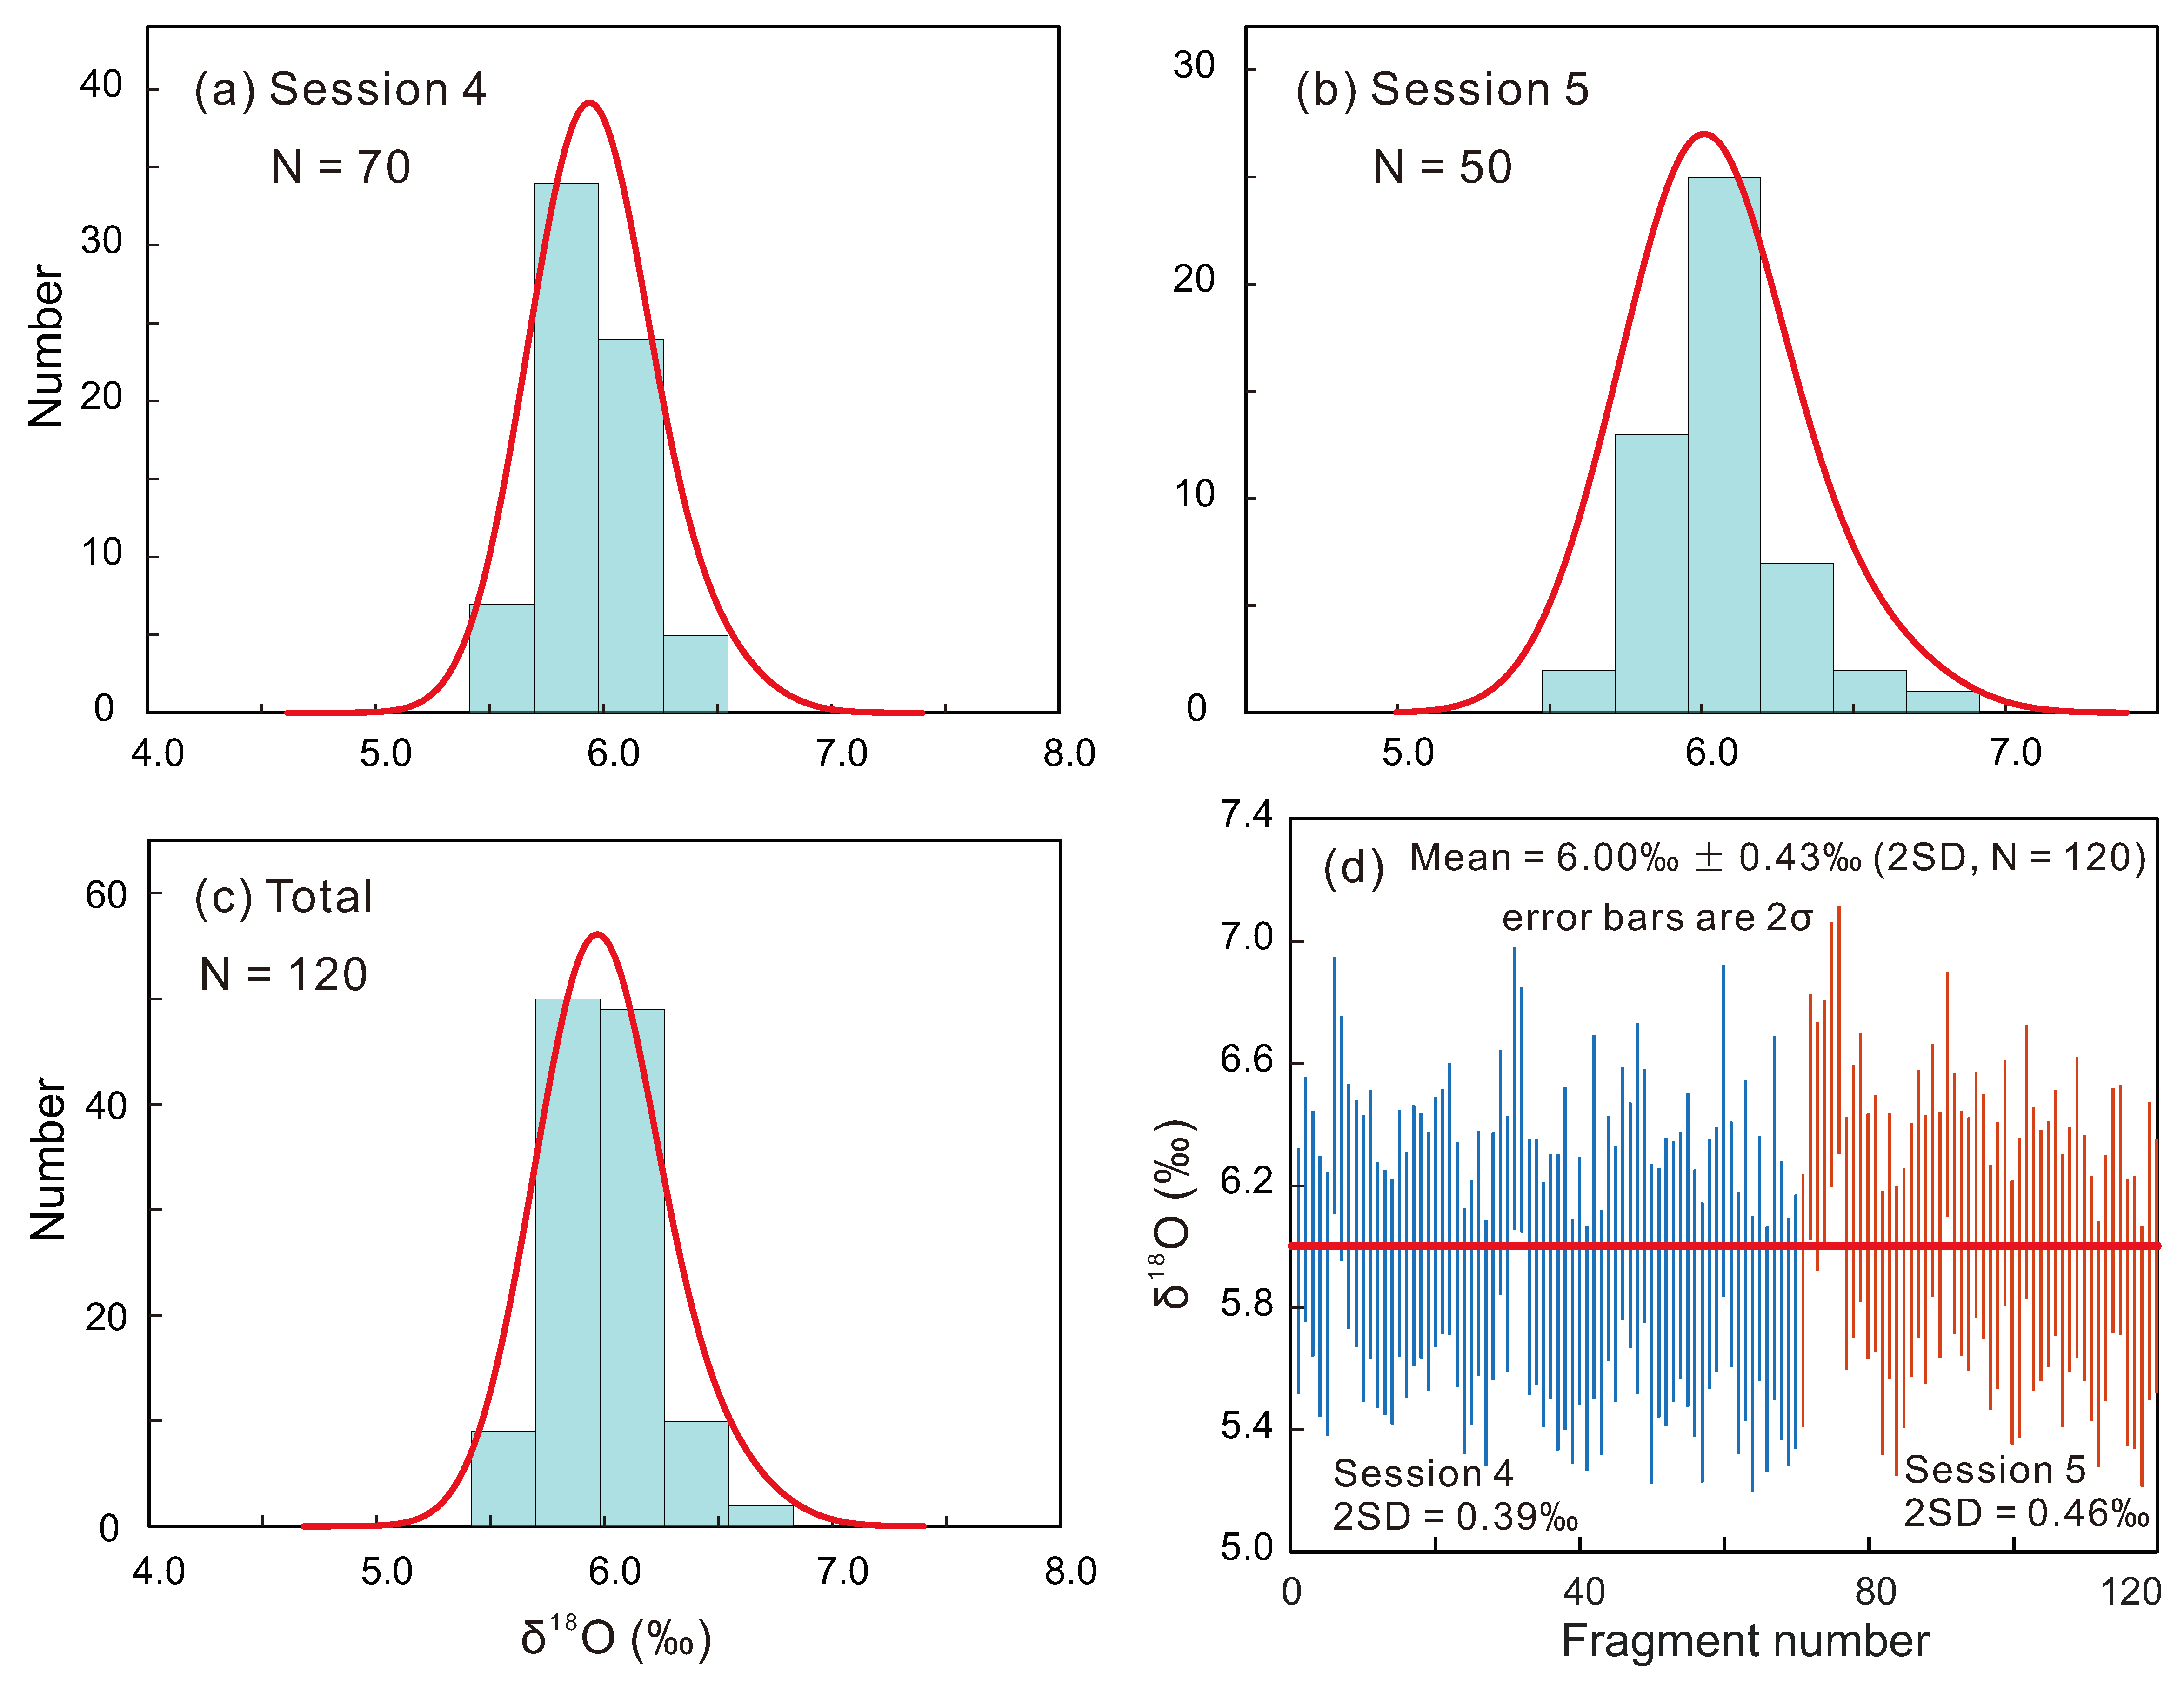
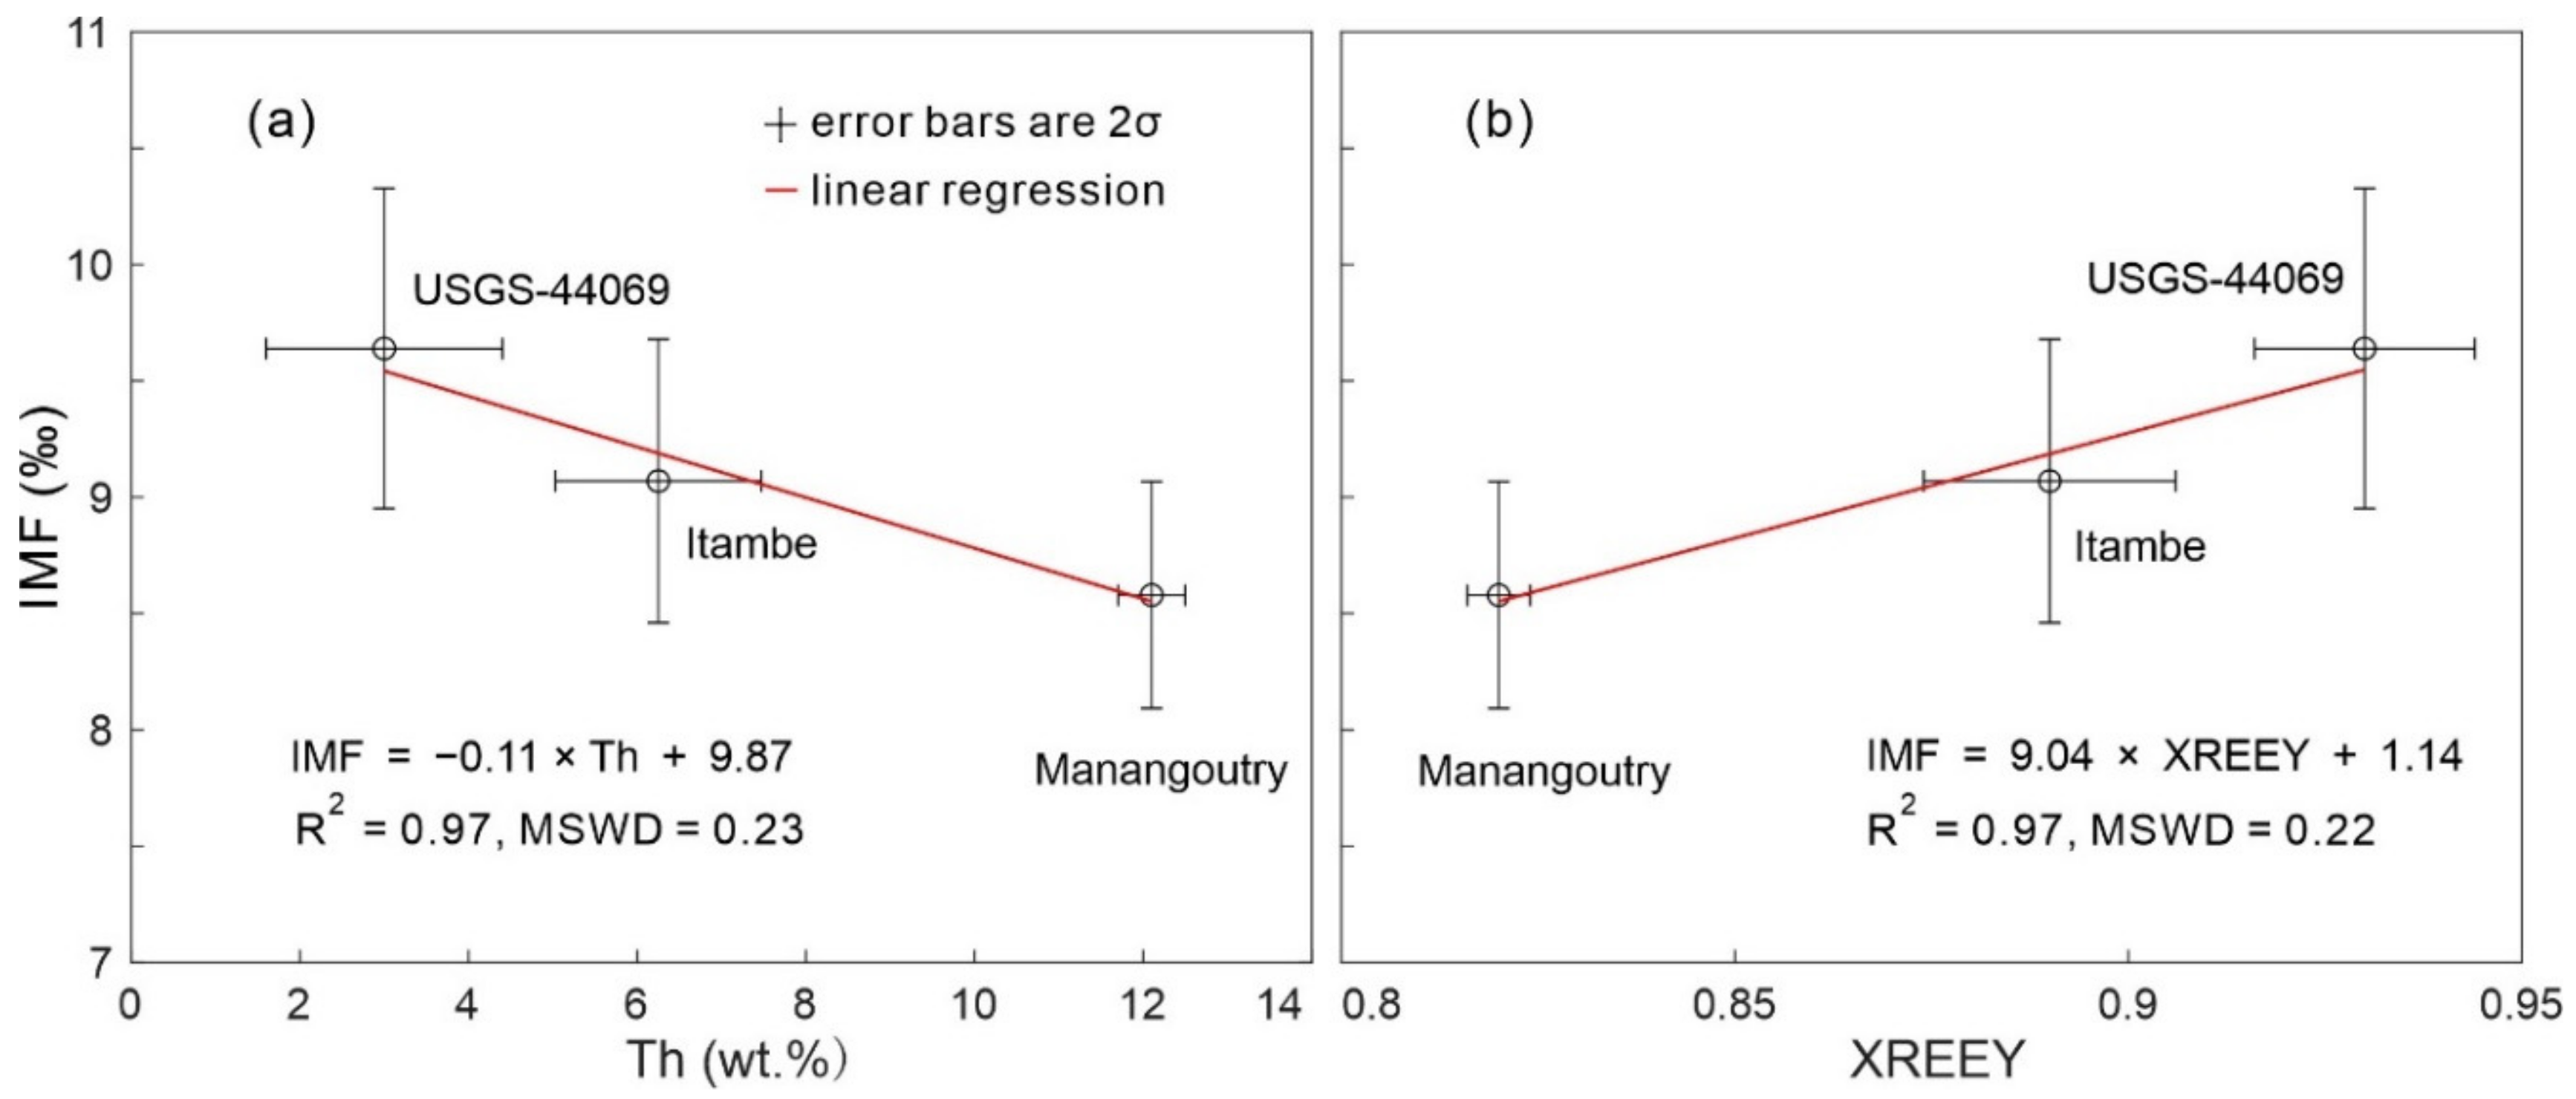
4.2. Oxygen Isotopic Compositions

SIMS oxygen isotopic analyses were investigated for 303 RW-1 fragments in 3 sessions to assess the homogeneity of RW-1 oxygen isotopic compositions at a scale of ~20 µm, with Sessions 1, 2, and 3 involving 125, 74, and 104 fragments, respectively (Appendix A, Figure A2). δ18O values (with the average measured δ18O value normalized to the LF-IRMS value, below) from each session yielded Gaussian distributions (Figure 5) with 2SDs of 0.39‰, 0.40‰, and 0.37‰ for Sessions 1, 2, and 3, respectively (Appendix A, Figure A2). Overall, the 303 measured δ18O values formed a Gaussian distribution (Figure 5) with a 2SD of 0.38‰, indicating homogeneity in oxygen isotopic composition.
A further 70 and 50 RW-1 fragments were analyzed in Sessions 4 and 5, respectively, together with the USGS-44069, Itambe, and Manangoutry monazite to monitor the external precision and to correct for IMF. The 2SD values of RW-1, USGS-44069, Itambe, and Manangoutry were 0.39–0.46‰, 0.40–0.70‰, 0.40–0.59‰, and 0.40–0.52‰, respectively. The goodness of fit for IMF-Th was nearly the same as that of IMF-XREEY using the York linear regression equation [40] (Appendix A, Figure A3). After IMF-correction using IMF-Th curve fitting, RW-1 δ18O values exhibited a Gaussian distribution with average (± 2SD) values of 5.97‰ ± 0.39‰ and 6.05‰ ± 0.46‰ for Sessions 4 and 5, respectively (Figure 6). Overall, the 120 measured δ18O values formed a Gaussian distribution with a mean of 6.00‰ ± 0.43‰ (2SD; Figure 6). After IMF-correction using IMF-XREEY curve fitting, the 120 measured δ18O values yielded a mean of 5.86‰ ± 0.43‰ (2SD; Table S3) that is also identical, within errors, to the aforementioned result of IMF-Th curve fitting.
RW-1 oxygen isotopic compositions were also determined in four analyses by LF-IRMS, with an oxygen yield of 90–97% (Table 3). The measured δ18O values ranged from 6.20‰ to 6.37‰, with a mean value of 6.30‰ ± 0.16‰ (2SD), which is consistent, within errors, with the above SIMS results. Therefore, we recommend a δ18O value of 6.30‰ ± 0.16‰ (2SD) as the best estimate for the RW-1 monazite.

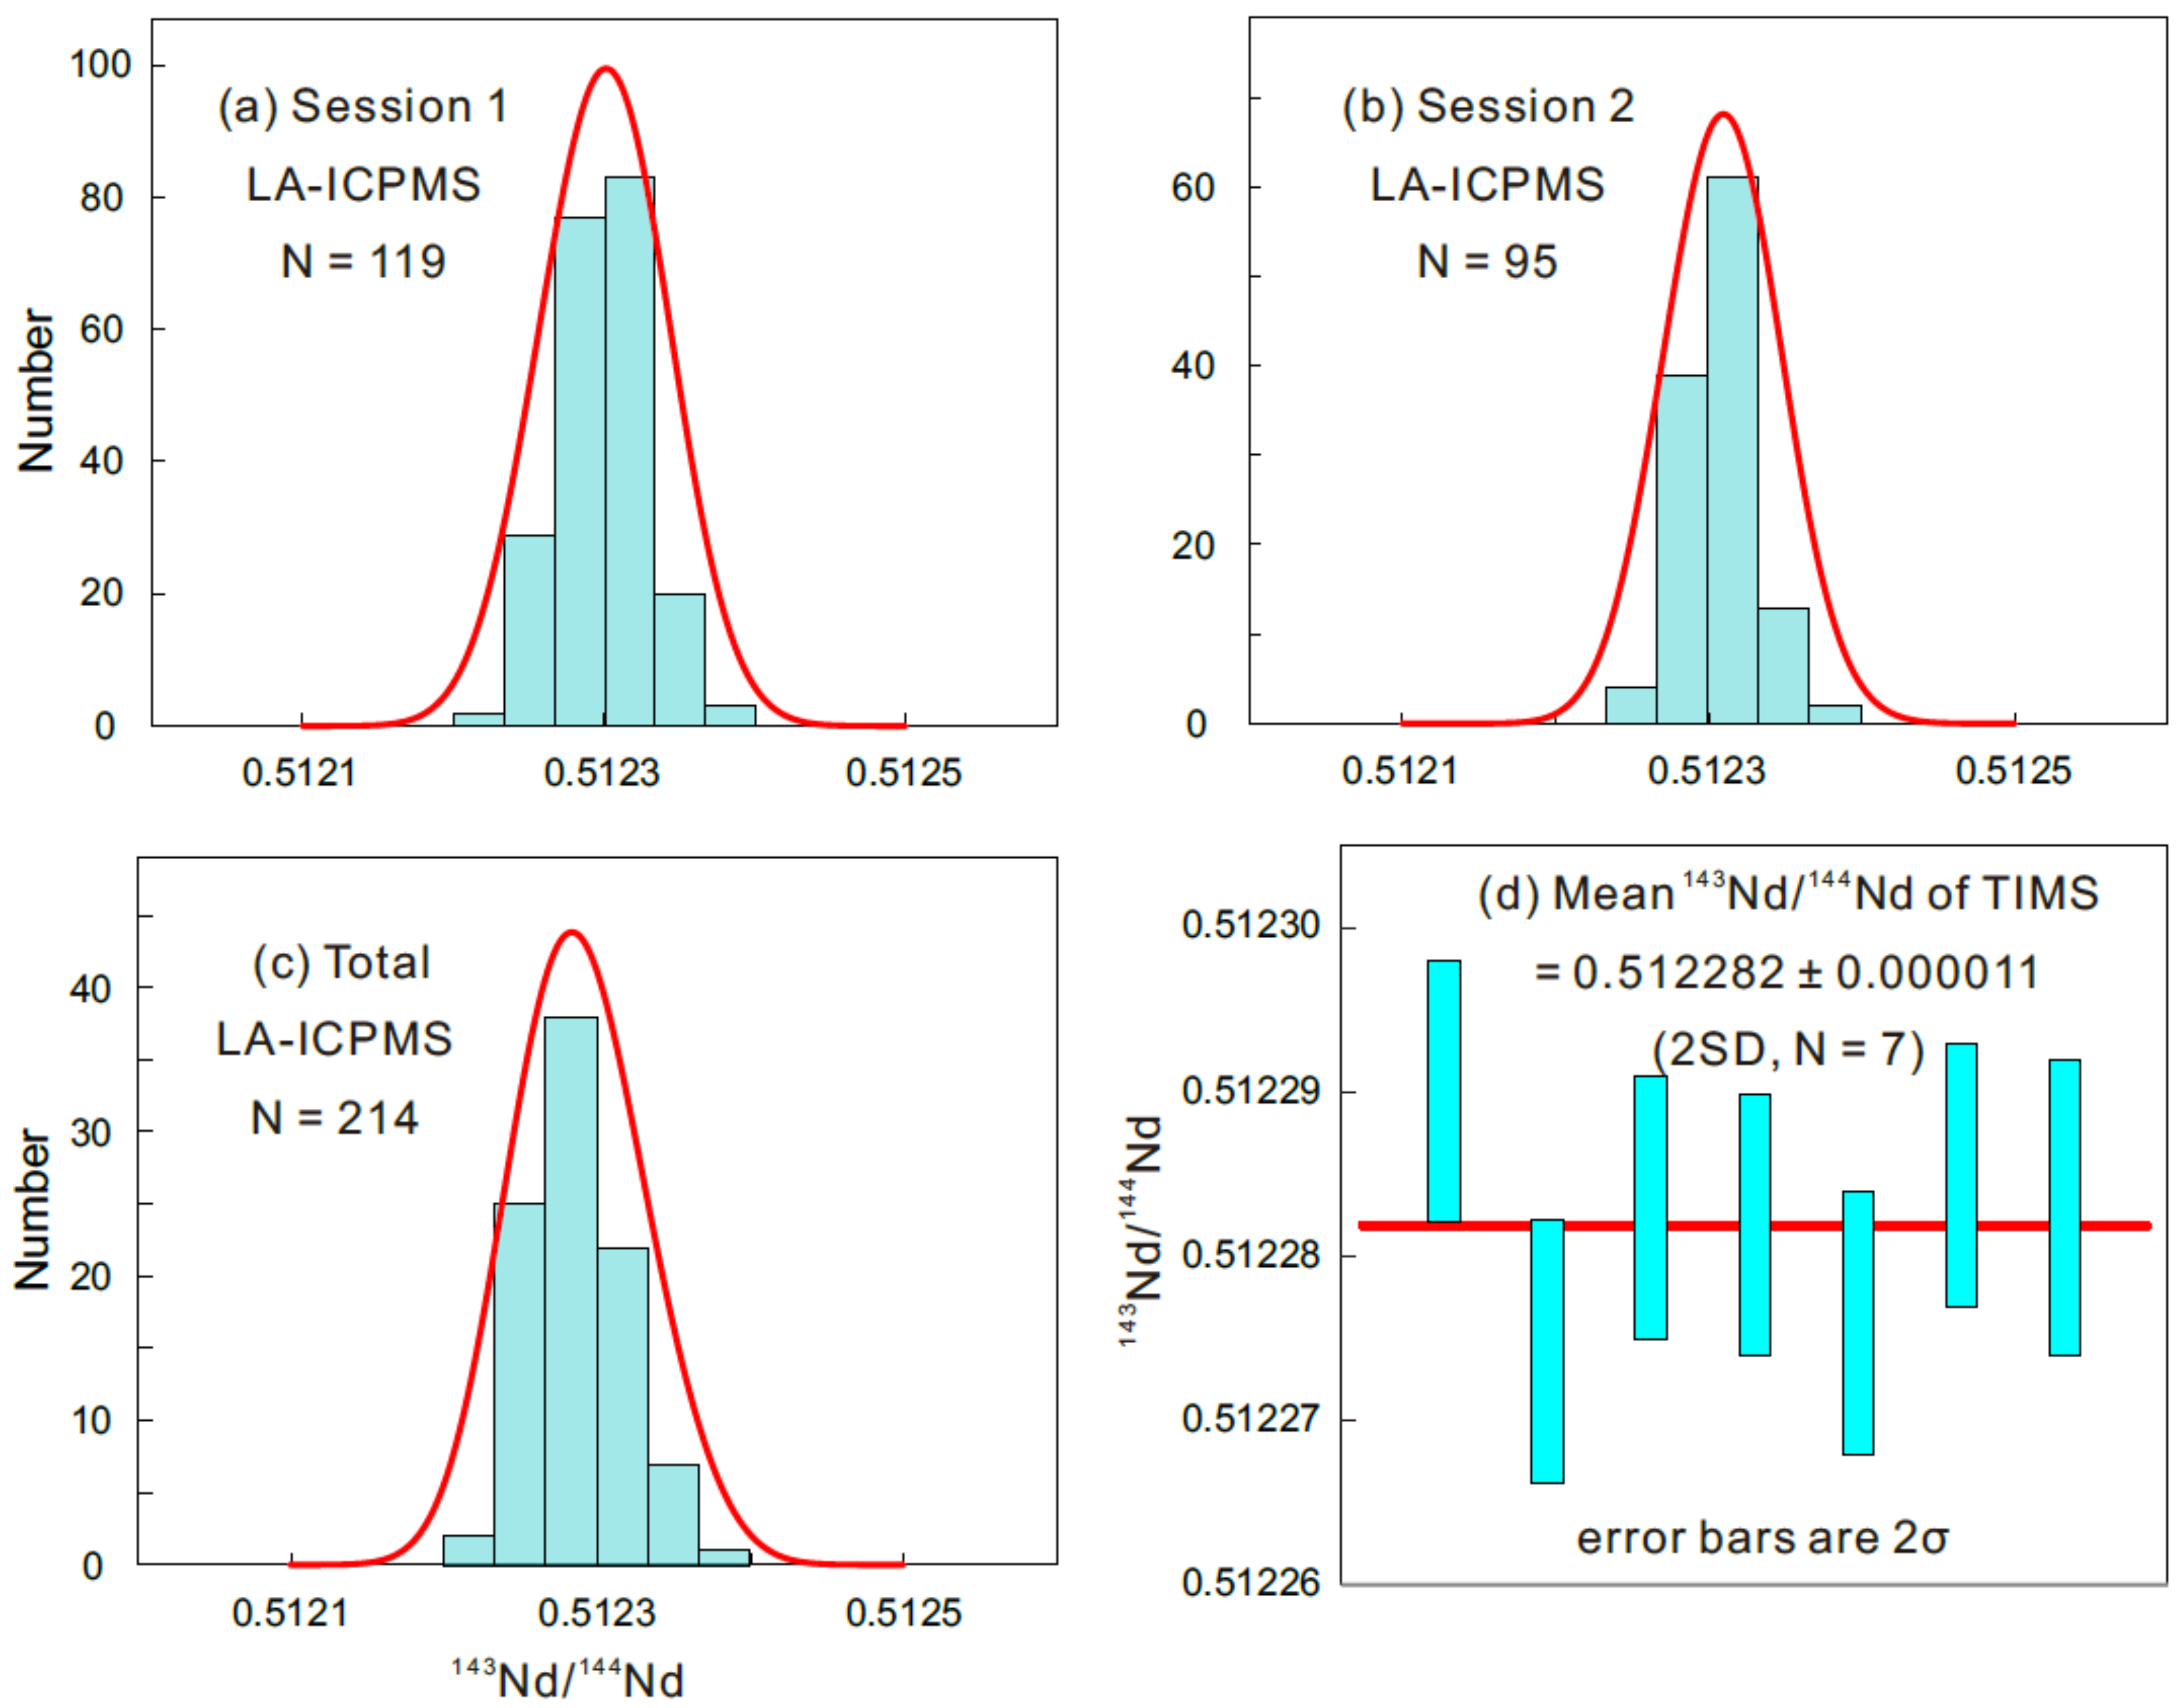
4.3. Nd Isotopic Compositions

A total of 214 Sm–Nd isotopic analyses of monazite RW-1 were conducted by LA-MC-ICPMS in two sessions (119 in Session 1 and 95 in Session 2) to determine the homogeneity of Nd isotopic compositions (Table S4). The measured 143Nd/144Nd ratio in Session 1 ranged from 0.512249 ± 0.000024 (2SE) to 0.512375 ± 0.000032 (2SE), forming a Gaussian distribution with a mean of 0.512309 ± 0.000048 (2SD; Figure 7a). The measured 143Nd/144Nd ratio in Session 2 ranged from 0.512223 ± 0.000022 (2SE) to 0.512367 ± 0.000034 (2SE), forming a Gaussian distribution with a mean of 0.512288 ± 0.000064 (2SD; Figure 7b). The 214 values form a Gaussian distribution, suggesting that the RW-1 monazite is homogeneous in terms of the Nd isotopic composition, with an overall mean of 0.512300 ± 0.000060 (2SD; Figure 7c). Furthermore, the 214 measurements yielded a mean 147Sm/144Nd ratio of 0.1627 ± 0.0098 (2SD) and an initial εNd value of −2.7 ± 0.6 (2SD; Table S4), calculated using its TIMS age of 904.15 ± 0.26 Ma (2SD) [17].
Seven TIMS Nd isotopic analyses yielded 143Nd/144Nd ratios of 0.512274 ± 0.000008 to 0.512290 ± 0.000008 (Table S4), with a mean of 0.512282 ± 0.000011 (2SD; Figure 7d), identical, within errors, to that yielded by LA-MC-ICPMS analysis. Therefore, we recommend a 143Nd/144Nd ratio of 0.512282 ± 0.000011 (2SD) as the best estimate for RW-1.

5. Conclusions

Numerous EPMA, SIMS, and LA-MC-ICPMS analyses confirm that the RW-1 monazite is homogeneous in both elemental and O–Nd isotopic compositions at a scale of ~20 µm. Mean O and Nd isotopic compositions determined, respectively, by SIMS and LA-MC-ICPMS are identical within errors to those determined, respectively, by LF-IRMS and TIMS: δ18O = 6.30‰ ± 0.16‰ (2SD) and 143Nd/144Nd = 0.512282 ± 0.000011 (2SD). Therefore, we consider that RW-1 can be used as a new working reference material for in situ compositional and O–Nd isotopic determinations with samples of relatively high Th content, or as an external standard in assessing analytical accuracy. Along with the Moacyr and Manangoutry monazite, RW-1 is one of three monazite reference materials that have been well characterized, with homogeneous elemental and O–Nd isotopic compositions and known U–Th–Pb ages. The limitation of RW-1 is that it contains some visible fractures and inclusions, therefore, microbeam analysis of RW-1 should be guided by CL or BSE images to avoid these minor imperfections. It is available on request from the corresponding author of this paper.

Supplementary Materials

The following are available online at https://www.mdpi.com/2075-163X/9/10/583/s1, Table S1: EPMA and LA-ICPMS results of analyses of the RW-1 monazite. Table S2: Integrated elemental compositions of monazite with different origins. Table S3: SIMS oxygen isotopic data for RW-1. Table S4: LA-MC-ICPMS and TIMS Sm–Nd isotopic data for RW-1.

Author Contributions

Conceptualization, L.-G.W. and X.-H.L.; methodology, X.-X.L., Y.-H.Y., C.-F.L., Y.-L.L., Q.M., Q.-L.L., and B.P.; original draft preparation, L.-G.W.; review and editing, L.-G.W., X.-H.L., and B.P.

Funding

This work was financially supported by the National Key R&D Program of China (2016YFE0203000), the National Natural Science Foundation of China (Grant 41673018), and the Institute of Geology and Geophysics, Chinese Academy of Sciences (IGGCAS-201901).

Acknowledgments

We thank Daniela Rubatto, Amélie Didier, and Guilherme Gonçalves for providing monazite reference materials. We are grateful for the three anonymous reviewers who helped to improve the content and presentation. We thank Pradip Kumar Singh who checked for syntax and typos.

Conflicts of Interest

The authors declare no conflict of interest. The funders had no role in the design of the study; in the collection, analyses, or interpretation of data; in the writing of the manuscript, or in the decision to publish the results.

Appendix A

Figure A1. Reflected, transmitted, cathodoluminescent (CL), and X-ray images of the RW-1 monazite.
Minerals 09 00583 g0a1
Figure A2. Reproducibility of RW-1 SIMS δ18O values with the average value normalized to the LF-IRMS value.
Minerals 09 00583 g0a2
Figure A3. Example of (a) IMF-Th and (b) IMF-YREEPO4 (XREEY) curve fitting for IMF-correction.
Minerals 09 00583 g0a3

References

  1. Williams, M.L.; Jercinovic, M.J.; Hetherington, C.J. Microprobe monazite geochronology: Understanding geologic processes by integrating composition and chronology. Annu. Rev. Earth Planet. Sci. 2007, 35, 137–175. [Google Scholar] [CrossRef]
  2. Franz, G.; Andrehs, G.; Rhede, D. Crystal chemistry of monazite and xenotime from Saxothuringian–Moldanubian metapelites, NE Bavaria, Germany. Eur. J. Mineral. 1996, 8, 1097–1118. [Google Scholar] [CrossRef]
  3. Catlos, E.J.; Miller, N.R. Speculations linking monazite compositions to origin: Llallagua Tin ore deposit (Bolivia). Resources 2017, 6, 36. [Google Scholar] [CrossRef]
  4. Meldrum, A.; Boatner, L.A.; Weber, W.J.; Ewing, R.C. Radiation damage in zircon and monazite. Geochim. Cosmochim. Acta 1998, 62, 2509–2520. [Google Scholar] [CrossRef]
  5. Parrish, R.R. U–Pb dating of monazite and its application to geological problems. Can. J. Earth Sci. 1990, 27, 1431–1450. [Google Scholar] [CrossRef]
  6. Perumalsamy, C.; Bhadra, S.; Balakrishnan, S. Decoding evolutionary history of provenance from beach placer monazites: A case study from Kanyakumari coast, southwest India. Chem. Geol. 2016, 427, 83–97. [Google Scholar] [CrossRef]
  7. Ayers, J.C.; Loflin, M.; Miller, C.F.; Barton, M.D.; Coath, C.D. In situ oxygen isotope analysis of monazite as a monitor of fluid infiltration during contact metamorphism: Birch Creek Pluton aureole, White Mountains, eastern California. Geology 2006, 34, 653–656. [Google Scholar] [CrossRef]
  8. Pyle, J.M.; Spear, F.S.; Rudnick, R.L.; McDonough, W.F. Monazite–xenotime–garnet equilibrium in metapelites and a new monazite–garnet thermometer. J. Petrol. 2001, 42, 2083–2107. [Google Scholar] [CrossRef]
  9. Gratz, R.; Heinrich, W. Monazite–xenotime thermobarometry; experimental calibration of the miscibility gap in the binary system CePO4–YPO4. Am. Mineral. 1997, 82, 772–780. [Google Scholar] [CrossRef]
  10. Gauthiez-Putallaz, L.; Rubatto, D.; Hermann, J. Dating prograde fluid pulses during subduction by in situ U–Pb and oxygen isotope analysis. Contrib. Mineral. Petrol. 2016, 171, 15. [Google Scholar] [CrossRef]
  11. Li, Q.; Li, X.; Lan, Z.; Guo, C.; Yang, Y.; Liu, Y.; Tang, G. Monazite and xenotime U–Th–Pb geochronology by ion microprobe: Dating highly fractionated granites at Xihuashan tungsten mine, SE China. Contrib. Mineral. Petrol. 2013, 166, 65–80. [Google Scholar] [CrossRef]
  12. Liu, Z.-C.; Wu, F.-Y.; Yang, Y.-H.; Yang, J.-H.; Wilde, S.A. Neodymium isotopic compositions of the standard monazites used in U–Th–Pb geochronology. Chem. Geol. 2012, 334, 221–239. [Google Scholar] [CrossRef]
  13. Breecker, D.O.; Sharp, Z.D. A monazite oxygen isotope thermometer. Am. Mineral. 2007, 92, 1561–1572. [Google Scholar] [CrossRef]
  14. Rubatto, D.; Putlitz, B.; Gauthiez-Putallaz, L.; Crépisson, C.; Buick, I.S.; Zheng, Y.F. Measurement of in-situ oxygen isotope ratios in monazite by SHRIMP ion microprobe: Standards, protocols and implications. Chem. Geol. 2014, 380, 84–96. [Google Scholar] [CrossRef]
  15. Didier, A.; Putlitz, B.; Baumgartner, L.P.; Bouvier, A.-S.; Vennemann, T.W. Evaluation of potential monazite reference materials for oxygen isotope analyses by SIMS and laser assisted fluorination. Chem. Geol. 2017, 450, 199–209. [Google Scholar] [CrossRef] [Green Version]
  16. Förster, H.-J. The chemical composition of REE-Y-Th-U-rich accessory minerals in peraluminous granites of the Erzgebirge–Fichtelgebirge region, Germany, Part I: The monazite-(Ce)–brabantite solid solution series. Am. Mineral. 1998, 83, 259–272. [Google Scholar] [CrossRef]
  17. Ling, X.-X.; Huyskens, M.H.; Li, Q.-L.; Yin, Q.-Z.; Werner, R.; Liu, Y.; Tang, G.-Q.; Yang, Y.-N.; Li, X.-H. Monazite RW-1: A homogeneous natural reference material for SIMS U–Pb and Th–Pb isotopic analysis. Mineral. Petrol. 2017, 111, 163–172. [Google Scholar] [CrossRef]
  18. Cherniak, D.J.; Zhang, X.Y.; Nakamura, M.; Watson, E.B. Oxygen diffusion in monazite. Earth Planet. Sci. Lett. 2004, 226, 161–174. [Google Scholar] [CrossRef]
  19. Gonçalves, G.; Lana, C.; Scholz, R.; Buick, I.; Gerdes, A.; Kamo, S.L.; Corfu, F.; Rubatto, D.; Wiedenbeck, M.; Nalini, H.A.; et al. The Diamantina monazite: A new low-Th reference material for microanalysis. Geostand. Geoanal. Res. 2017, 42, 25–47. [Google Scholar] [CrossRef]
  20. Aleinikoff, J.N.; Schenck, W.S.; Plank, M.O.; Srogi, L.; Fanning, C.M.; Kamo, S.L.; Bosbyshell, H. Deciphering igneous and metamorphic events in high-grade rocks of the Wilmington Complex, Delaware: Morphology, cathodoluminescence and backscattered electron zoning, and SHRIMP U-Pb geochronology of zircon and monazite. Geol. Soc. Am. Bull. 2006, 118, 39–64. [Google Scholar] [CrossRef]
  21. Harrison, M.T.; Grove, M.; McKeegan, K.D.; Coath, C.D.; Lovera, O.M.; Fort, P.L. Origin and episodic emplacement of the Manaslu Intrusive Complex, central Himalaya. J. Petrol. 1999, 40, 3–19. [Google Scholar] [CrossRef]
  22. Gasquet, D.; Bertrand, J.-M.; Paquette, J.-L.; Lehmann, J.; Ratzov, G.; De Ascencão Guedes, R.; Tiepolo, M.; Boullier, A.-M.; Scaillet, S.; Nomade, S. Miocene to Messinian deformation and hydrothermal activity in a pre-Alpine basement massif of the French western Alps: New U–Th–Pb and argon ages from the Lauzière massif. Bull. Soc. Geol. Fr. 2010, 181, 227–241. [Google Scholar] [CrossRef]
  23. Paquette, J.L.; Tiepolo, M. High resolution (5 μm) U–Th–Pb isotope dating of monazite with excimer laser ablation (ELA)-ICPMS. Chem. Geol. 2007, 240, 222–237. [Google Scholar] [CrossRef]
  24. Knoper, M.; Armstrong, R.; Andreoli, M.; Ashwal, L. The Steenkampskraal monazite vein: A subhorizontal stretching shear zone indicating extensional collapse of Namaqualand at 1033 Ma? J. Afr. Earth Sci. 2000, 31, 38. [Google Scholar]
  25. Ayers, J.C.; Miller, C.F.; Loflin, M.; Barton, M.D.; Coath, C. Dating fluid infiltration using monazite. In Proceedings of the Eleventh International Symposium on Water–Rock Interaction, Saratoga Springs, NY, USA, 27 June 2004; pp. 247–251. [Google Scholar]
  26. Wu, S.; Karius, V.; Schmidt, B.C.; Simon, K.; Wörner, G. Comparison of ultrafine powder pellet and flux-free fusion glass for bulk analysis of granitoids by laser ablation–inductively coupled plasma–mass spectrometry. Geostand. Geoanal. Res. 2018, 42, 575–591. [Google Scholar] [CrossRef]
  27. Griffin, W.L. GLITTER: Data reduction software for laser ablation ICP-MS. In Laser Ablation ICP–MS in the Earth Sciences: Current Practices and Outstanding Issues; Mineralogical Association of Canada: Toronto, QC, Canada, 2008; pp. 308–311. [Google Scholar]
  28. Li, X.-H.; Li, W.-X.; Li, Q.-L.; Wang, X.-C.; Liu, Y.; Yang, Y.-H. Petrogenesis and tectonic significance of the ∼850 Ma Gangbian alkaline complex in South China: Evidence from in situ zircon U–Pb dating, Hf–O isotopes and whole-rock geochemistry. Lithos 2010, 114, 1–15. [Google Scholar] [CrossRef]
  29. Tang, G.-Q.; Li, X.-H.; Li, Q.-L.; Liu, Y.; Ling, X.-X.; Yin, Q.-Z. Deciphering the physical mechanism of the topography effect for oxygen isotope measurements using a Cameca IMS-1280 SIMS. J. Anal. At. Spectrom. 2015, 30, 950–956. [Google Scholar] [CrossRef]
  30. Coplen, T.B.; Kendall, C.; Hopple, J. Comparison of stable isotope reference samples. Nature 1983, 302, 236–238. [Google Scholar] [CrossRef]
  31. Yang, Y.; Sun, J.; Xie, L.; Fan, H.; Wu, F. In situ Nd isotopic measurement of natural geological materials by LA-MC-ICPMS. Chin. Sci. Bull. 2008, 53, 1062–1070. [Google Scholar] [CrossRef] [Green Version]
  32. Dubois, J.C.; Retali, G.; Cesario, J. Isotopic analysis of rare earth elements by total vaporization of samples in thermal ionization mass spectrometry. Int. J. Mass Spectrom. 1992, 120, 163–177. [Google Scholar] [CrossRef]
  33. Isnard, H.; Brennetot, R.; Caussignac, C.; Caussignac, N.; Chartier, F. Investigations for determination of Gd and Sm isotopic compositions in spent nuclear fuels samples by MC–ICPMS. Int. J. Mass Spectrom. 2005, 246, 66–73. [Google Scholar] [CrossRef]
  34. Li, C.-F.; Chen, F.; Li, X.-H. Precise isotopic measurements of sub-nanogram Nd of standard reference material by thermal ionization mass spectrometry using the NdO+ technique. Int. J. Mass Spectrom. 2007, 266, 34–41. [Google Scholar] [CrossRef]
  35. Tanaka, T.; Togashi, S.; Kamioka, H.; Amakawa, H.; Kagami, H.; Hamamoto, T.; Yuhara, M.; Orihashi, Y.; Yoneda, S.; Shimizu, H.; et al. JNdi-1: A neodymium isotopic reference in consistency with LaJolla neodymium. Chem. Geol. 2000, 168, 279–281. [Google Scholar] [CrossRef]
  36. Silva, E.N.; Ayala, A.P.; Guedes, I.; Paschoal, C.W.A.; Moreira, R.L.; Loong, C.K.; Boatner, L.A. Vibrational spectra of monazite-type rare-earth orthophosphates. Opt. Mater. 2006, 29, 224–230. [Google Scholar] [CrossRef]
  37. Huittinen, N.; Arinicheva, Y.; Kowalski, P.M.; Vinograd, V.L.; Neumeier, S.; Bosbach, D. Probing structural homogeneity of La1−xGdxPO4 monazite-type solid solutions by combined spectroscopic and computational studies. J. Nucl. Mater. 2017, 486, 148–157. [Google Scholar] [CrossRef]
  38. McDonough, W.F.; Sun, S.S. The composition of the Earth. Chem. Geol. 1995, 120, 223–253. [Google Scholar] [CrossRef]
  39. Itano, K.; Iizuka, T.; Chang, Q.; Kimura, J.I.; Maruyama, S. U–Pb chronology and geochemistry of detrital monazites from major African rivers: Constraints on the timing and nature of the Pan-African Orogeny. Precambrian Res. 2016, 282, 139–156. [Google Scholar] [CrossRef]
  40. York, D.; Evensen, N.M.; Martínez, M.L.; Delgado, J.D.B. Unified equations for the slope, intercept, and standard errors of the best straight line. Am. J. Phys. 2004, 72, 367–375. [Google Scholar] [CrossRef]
Figure 1. Raman spectra of monazite reference materials. The main monazite Raman bands are found at ~470, ~620, ~970, and ~1050 cm−1, and the lattice vibrations are found at <430 cm−1 [36,37]. The UNIL-Mnz1 and Diamantina monazite standards have an additional band at ~990 cm−1. The Itambe monazite has an ambiguous band at ~1050 cm−1.
Minerals 09 00583 g001
Figure 2. Ternary diagram of monazite end-members: cheralite, huttonite, and monazite. End-members are calculated according to Pyle et al. [8]. The Diamantina, UNIL-Mnz1, USGS-44069, Itambe, Moacyr, UNIL-Mnz2, and Manangoutry data are from Rubatto et al. [14], Didier et al. [15], and Gonçalves et al. [19].
Minerals 09 00583 g002
Figure 3. Chondrite-normalized [38] rare earth element (REE) patterns of the RW-1 monazite. The major elements are determined by electron probe microanalysis (EPMA) and trace elements by laser ablation-inductively coupled plasma-mass spectrometry (LA-ICPMS).
Minerals 09 00583 g003
Figure 4. (a,b) Discrimination of monazite with different origins including igneous, metamorphic, hydrothermal, and carbonatite monazite. The integrated data are from the literature (Table S2). The Diamantina, UNIL-Mnz1, USGS-44069, Itambe, Moacyr, UNIL-Mnz2, and Manangoutry data are from Rubatto et al. [14], Didier et al. [15], and Gonçalves et al. [19].
Minerals 09 00583 g004
Figure 5. (ad) Frequency distributions of RW-1 secondary ion mass spectrometry (SIMS) δ18O values with the average measured δ18O value normalized to the laser fluorination isotope ratio mass spectrometry (LF-IRMS) value.
Minerals 09 00583 g005
Figure 6. (ac) Frequency distributions of RW-1 SIMS δ18O values with instrumental mass fractionation (IMF) corrected. (d) Reproducibility of RW-1 SIMS δ18O values after IMF-correction in two sessions.
Minerals 09 00583 g006
Figure 7. (ac) Frequency distributions of RW-1 143Nd/144Nd ratios determined by LA-ICPMS. (d) Range of 143Nd/144Nd values determined by thermal ionization mass spectrometry (TIMS).
Minerals 09 00583 g007
Table 1. Compilation of previously investigated monazite reference materials.
NameTh Content (wt.%)2SD aδ18OV-SMOW (‰) b2SDReference Age (Ma)2SD143Nd/144Nd2SDHost Lithology (Location)QuantityReferences
RW-18.30.46.300.16904.20.30.5122820.000011pegmatite (Norway)limitedthis study, [17]
eBay0.02–0.34
(heterogeneous)
-9.34
(heterogeneous)
0.62----unknown (Hiddenite, North Carolina)limited[7,13,18]
9.52-
Diamantina0.20.1--495.30.50.5114270.000023hydrothermal quartz vein (Brazil)unlimited[19]
UNIL1-Mnz10.60.38.450.38----carbonatite (Namibia)limited[15]
USGS-440692.1–5.5
(heterogeneous)
-7.670.52424.90.40.5121750.000040metapsamittic layer (USA)unlimited[12,14,15,20]
5543.3-7.54
(heterogeneous)
0.2445.31.40.5120750.000041granite (Santa Catalina, Mountains, Arizona)unlimited[7,12,21]
Itambe6.3
(heterogeneous)
1.20.460.42~509–514---pegmatite (Brazil)limited[14]
Moacyr6.50.41.450.10506.40.70.5124210.000011pegmatite (Brazil)unlimited[15,22]
UNIL-Mnz29.4
(heterogeneous)
19.510.54----pegmatite (Madagascar)limited[15]
Manangoutry12.10.210.190.1655520.5110440.000022charnockite (Madagascar)limited[12,15,23]
Namaqualand8.30.2--~1033-0.5118940.000025monazite vein (South Africa)unlimited[12,24]
Brazil6.1-1.430.16----unknownlimited[7,25]
Brazil c13.30.57.890.28----unknownlimited[13]
M17.9–14.3
(heterogeneous)
---~535-0.5117160.000052unknownlimited[12]
M46.4–8.5
(heterogeneous)
---~525-0.5117610.000020unknownlimited[12]
a SD = standard deviation. b V-SMOW = Vienna Standard Mean Ocean Water; δ18O value is determined by laser or conventional fluorination. c A different crystal from Ayers et al. [7].
Table 2. Elemental compositions of the RW-1 monazite.
MethodsEPMA, wt.% *
SiO2CaOP2O5Y2O3ThO2UO2PbOLa2O3Ce2O3Pr2O3Nd2O3
Average1.810.6628.032.399.480.230.397.8525.053.6814.26
2SD0.200.060.760.170.500.050.030.280.600.510.28
2RSD (%)10.778.512.737.215.3222.398.623.532.4113.921.98
MethodsEPMA, wt.%LA, ppm, N = 23
Sm2O3Gd2O3Dy2O3TotalEuTbHoErTmYbLu
Average3.601.650.2899.12339722544074930627
2SD0.350.300.051.3825818345425
2RSD (%)9.8518.0919.141.395678101418
* Every oxide underwent 80 analyses except UO2 (57 analyses) and PbO (44 analyses).
Table 3. Results of LF-IRMS determinations of RW-1 δ18O values.
MonaziteDateWeight (mg)δ18OVSMOW (‰)Yield (%)
RW-12017/11/82.046.3490
2017/11/82.036.2092
2018/1/251.756.3797
2018/1/251.876.2893
Average 6.30
2SD 0.16

