Article

Characterization of Mine Waste and Acid Mine Drainage Prediction by Simple Testing Methods in Terms of the Effects of Sulfate-Sulfur and Carbonate Minerals

1
Geological Survey of Japan, National Institute of Advanced Industrial Science and Technology, Higashi 1-1-1, Ibaraki, Tsukuba 305-8567, Japan
2
Department of Earth Resources Engineering, Kyushu University, Motooka 744, Nishi-ku, Fukuoka 819-0395, Japan
3
Department of Mining Engineering, Institut Teknologi Bandung, Jl. Ganesha 10, Bandung 40132, Indonesia
*
Author to whom correspondence should be addressed.
Minerals 2018, 8(9), 403; https://doi.org/10.3390/min8090403
Submission received: 13 July 2018 / Revised: 4 September 2018 / Accepted: 10 September 2018 / Published: 13 September 2018
(This article belongs to the Special Issue Acid Mine Drainage Recovery)

Abstract

:
Characterization of mine waste rocks and prediction of acid mine drainage (AMD) play an important role in preventing AMD. Although high-tech analytical methods have been highlighted for mineral characterization and quantification, simple testing methods are still practical ways to perform in a field laboratory in mines. Thus, this study applied some simple testing methods to the characterization of mine wastes and AMD prediction in addition to a leaching test and the sequential extraction test with HCl, HF, and HNO3, which have not been applied for these purposes, focusing on the form of sulfur and the neutralization effects of carbonates. The results of the Acid Buffering Characteristic Curve test supported the changing trend of the pH attributing carbonates only during the first 10 leaching cycles in the leaching test. The change in the Net Acid Generating (NAG) pH in the sequential NAG test reflected the solubility of sulfur in the rocks, providing information on the form of sulfur in the rocks and the acid-producing potential over time. Consequently, the sequential NAG test and sequential extraction with the acids in combination with the current standards tests (Acid Base Accounting and NAG tests) provided important information for preventing AMD.

1. Introduction

Acid mine drainage (AMD), i.e., polluted acidic water, is formed from exposure of sulfide minerals from waste rocks that are excavated during mining operations to oxygen and water. Several previous studies reported that AMD is a serious, global environmental issue that occurs during and/or after mining activity [1,2]. Several options currently exist to treat AMD consequences, such as pH control via neutralization and wetland treatment [3,4]. However, these treatment processes are often expensive in terms of both capital and operating costs [5]. AMD preventive measures (e.g., sulfide mineral isolation and source rock desulfurization prior to backfilling [6,7]) play a more important role than post-treatment of acidic water because prevention reduces operating costs involved in the treatment activities as well as the amount of treated wastewater. Therefore, preventive action is an important option when dealing with AMD issues in addition to treatment after mining activities, which leads to resource development with smaller AMD impacts and more environmentally friendly mining.
Cover systems, as a preventive method widely used in industry for AMD treatment, involve the use of a cover layer that prevents water from interacting with sulfide minerals. A cover system is an example of an isolation method, i.e., the use of an impermeable sheet to create a water shield with cement [8,9]. In this system, mining waste rocks, classified as non-source rocks for AMD, are commonly used as cover materials due to their low cost and easy use at mine sites compared to the abovementioned materials [10,11,12]. A cover layer comprising non-source rocks inhibits the supply of oxygen to sulfide minerals throughout the waste dump [13]. Waste rocks are classified as AMD source or non-source rocks on the basis of their potential to produce acid and their neutralizing capacity, analyzed via an acid–base accounting (ABA) test, in order to obtain the net acid producing potential (NAPP) and the net acid generating (NAG) pH. Source rocks are commonly known as potentially acid forming and non-source rocks are known as non-acid forming [14,15]. These simple tests are used by industry and frequently conducted in field laboratories at mining sites.
However, current standards used to classify waste rocks as AMD source or non-source rocks have several drawbacks. For example, the current standard tests (i.e., the ABA and NAG tests) do not account for the effects of sulfur and iron carbonate mineralogy [16,17,18,19,20]. Stewart et al. [17] observed that acid consumption via iron carbonate in samples prevents the Fe2+ oxidation process in solution during the ANC test, which results in misinterpretations of ANC results. Furthermore, Dold stated that the NAG test does not account for the Fe(III) hydroxide and Fe(III) hydroxide sulfate groups (e.g., the jarosite–alunite group, schwertmannite) as well as sulfates [18].
To overcome these problems, mineral characterization and quantification methods have been developed as precise analytical techniques to predict AMD occurrence. The use of quantitative mineralogical methods (e.g., quantitative evaluation of minerals by scanning electron microscopy and mineral liberation analysis) for predicting AMD occurrence are expected to produce reliable results [18,21]. Although these high-tech analytical methods have gained popularity in recent years, combined with problems posed by simple geochemical tests (e.g., ABA and NAG tests) [16,17,18,19,20], simpler testing methods are still widely used and are more practical in field mining laboratories with limited resources [22]. Improvement in these simple testing techniques must consider the effects of non-sulfide sulfur and carbonate minerals that cause the misinterpretation of AMD predictions and rock types [18]. To overcome this problem, several methods have been developed: the chromium reducible sulfur test [23,24], a leaching method with a hot NH4-oxalate leachate [25], sequential NAG tests [14,17], a modified NP test [26], and the acid buffering characteristic curve (ABCC) test [14,17]. However, an alternative and/or additional simple method is still being discussed worldwide in terms of a practical method performed in a field in mines.
The present study attempts to apply some simple testing methods to the characterization of mine wastes and AMD prediction in addition to a leaching test and the sequential extraction test with HCl, HF, and HNO3, which has not been applied for the purposes. To elucidate the effects of the form of sulfur and the neutralization obtained by carbonate minerals on the formation of AMD over time, the simple tests are performed in combination with the current standards test (ABA and NAG tests). Furthermore, on the basis of the results, the application of the simple testing methods to the classification of waste rocks for cover systems preventing AMD is reviewed in the context of sustainable mining.

2. Experimental Methods

Six types of waste rocks were collected from three open-cast coal mines in Indonesia in addition to a crystalline pyrite sample obtained in Japan. The waste rocks were collected in the pits from each layer prior to excavation, packed into plastic bags to prevent oxidation, and then transported to the field laboratory. The samples were labeled as A, B, C, D, E, F, and G. Sample E was a crystalline pyrite collected in Japan. Sample A and B, C and D, and F and G were taken in three mines, respectively. Sample A, B, C, D, and F were categorized as argillaceous rock, and sample G as sandy silt according to the geological data in the study area. The samples were pulverized to a 75 µm grain size for geochemical analysis and 1.0–2.0 mm for leaching tests. The pulverized samples were used for the ABA test, as well as to measure the acid potential (AP) and ANC and to perform the NAG, the paste pH [14], sequential acid extraction [27], the Bernard calcimeter [28,29], the acid buffering characteristic curve (ABCC) [14,17], the sequence NAG [14,17], the X-ray photoelectron spectroscopy (XPS) analyses, and the leaching tests. Sequential acid extraction [27] and the sequential NAG test [14,17] were performed to understand the effects of the sulfur structure on AMD occurrence over time due to varying mineral dissolution rates. Previous studies have shown that sequential extraction is a simple technique to improve AMD prediction precision [18,30,31]. In this study, mineral extraction was performed with HCl, HF, and HNO3 according to the methods described in [27], where sulfides in abandoned mine tailings were extracted. We expected sulfide and sulfate separation to occur through the application of this extraction process to waste rocks found at active mining sites in order to predict AMD occurrence based on the samples used in this study. Sequential NAG tests consider the net effects of the presence of non-acid forming S and neutralizing species not measured by the ANC test [17]. In addition, the Bernard calcimeter [28,29] and ABCC tests [14,17] were used to examine the effects of neutralization on changes in water quality during the leaching tests. The ABCC test, developed in 1995, involves sample titration with an acid while continuously monitoring the pH. The ABCC test results can complement the ANC test results by providing an indication of the relative ANC reactivity during short time frames [17]. Furthermore, X-ray diffraction (XRD) and XPS analyses were conducted to observe different mineral form compositions in the seven samples. The pH, electrical conductivity (EC), and electric potential of the normal hydrogen electrode (Eh) throughout the analyses and leaching tests were measured using WM-32EP (DKK-Toa, Tokyo, Japan), GST-2729C DKK-Toa, Tokyo, Japan), and PST-2739C (DKK-Toa, Tokyo, Japan) with a 3.3 mol/L Ag/AgCl electrode, as well as CT-27112B (DKK-Toa, Tokyo, Japan). GST-2729C was calibrated with standard C6H4(COOK)(COOH) and KH2PO4 + Na2HPO4 buffer solutions with pH value of 4.01 and 6.86, respectively. The measured oxidation reduction potential (ORP) was converted to Eh based on the reference showing single electrode potentials in a solution at 20 °C [32].

2.1. Geochemical Characteristics

The ABA, NAG, and paste pH tests were conducted based on the regulations described in the Australian Mineral Industries Research Association Ltd. (AMIRA) standard in addition to XRD and X-ray fluorescence (XRF) analyses [14]. The total sulfur content in each sample was quantified via XRF analysis. XRD analyses were performed after the samples were dried at 80 °C for 24 h in an oven equipped with a wide-angle goniometer, RINT 2100 XRD (Rigaku, Tokyo, Japan), operated under the following conditions: continuous scanning with 2Theta/Theta, Cu Kα radiation, 0.050° step scanning, a scan speed of 2.000°/min, and a scan range of 2.000°–65.000°. During the XPS analysis, X-ray photoelectron spectra were collected for samples A and D based on the results of the sequential acid extractions over a binding energy range of 0 to 1400 eV. XPS analyses used a Kratos AXIS-165 (Shimadzu, Tokyo, Japan) operating in the Al Kα X-ray radiation mode. Spectral sets were processed using the Casa XPS software (Ver. 2.3.12). Background corrections were made using the Shirley method for S 2p and peak shapes were defined using a Gaussian–Lorentzian function [33]. The C–C bond has a well-defined position at EB (binding energy) [C 1s] = 284.6 eV and was used as a reference peak to correct for the charging effects. The XP-spectra were collected under the same conditions as those used for samples A and D.

2.2. Sequential Acid Extraction

Sequential acid extractions were performed according to the methods described by Sasaki et al. [27]. A total of 2.50 g of pulverized, dried sample (<75 µm) was dissolved with 20 mL of 1 mol/L HCl, 60 mL of 10 mol/L HF, and 10 mL of concentrated HNO3. The shaking time of the mixture in the HNO3 extraction stage was changed from 2 h, previously used [27], to 6 h to completely dissolve the sulfide minerals [34]. Sulfur concentration in the extracted solutions was measured using an ICP–OES (VISTA-MPX ICP-OES, Seiko Instruments, Chiba, Japan). The proportion of each sulfur form was calculated based on the amount of sulfur that was extracted (mg/g) from the rock samples. According to previous studies, HCl extracts readily soluble minerals, HF extracts silicate minerals, and HNO3 extracts the refractory minerals such as sulfide minerals [27]. We assumed that the amount of sulfur produced in the HCl extraction stage indicated the amount of sulfate based on the sulfate dissolution process with HCl [35]. In this study, the amount produced in the HNO3 extraction stage was assumed to be the amount of sulfides. We did not measure the amount of sulfur extracted with HF because the amount of sulfur does not significantly change the water quality according to the XRD analysis results.

2.3. ABCC Test

The ABCC test was conducted to understand rocks’ capacity to neutralize various species similar to the ANC test [14,17]. In this test, the samples were titrated with HCl while continuously monitoring the pH. Incremental HCl concentrations were determined according to the AMIRA procedure [14]. Even though the neutralizing capacity is not accurately quantified in the ANC test, due to Fe carbonate (e.g., siderite) dissolution effects [17], it can be quantified by accounting for the effects of siderite during the ABCC test using sequential titration [14]. In this test, we calculated the amount of H2SO4 to be added based on the volume of HCl already added and the equation proposed in the AMIRA procedure [14]. A neutralization curve was drawn by plotting kg H2SO4/ton on the X-axis and pH on the Y-axis.

2.4. Sequential NAG Test

In the NAG test, the sulfide content is commonly determined using H2O2 extractions. However, sulfides do not completely dissolve during the NAG test extraction process due to elevated sulfur concentrations. This results in misinterpretations of the NAG pH [17]. In the sequential NAG test, sulfides dissolve completely with H2O2 in several extraction stages [14]. The experimental procedure is identical to the NAG test to the point at which 15% H2O2 is added to 2.5 g pulverized dried sample (<75 µm) during a 2 h period to accelerate the reaction [14]. After 2 h, the beaker is placed on a hot plate at 150–200 °C and gently heated until effervescence stops. After returning to room temperature, the sample’s pH is measured as the NAG pH. The residue is reused after filtering procedures by adding 15% H2O2 until no further reaction is visually observed.

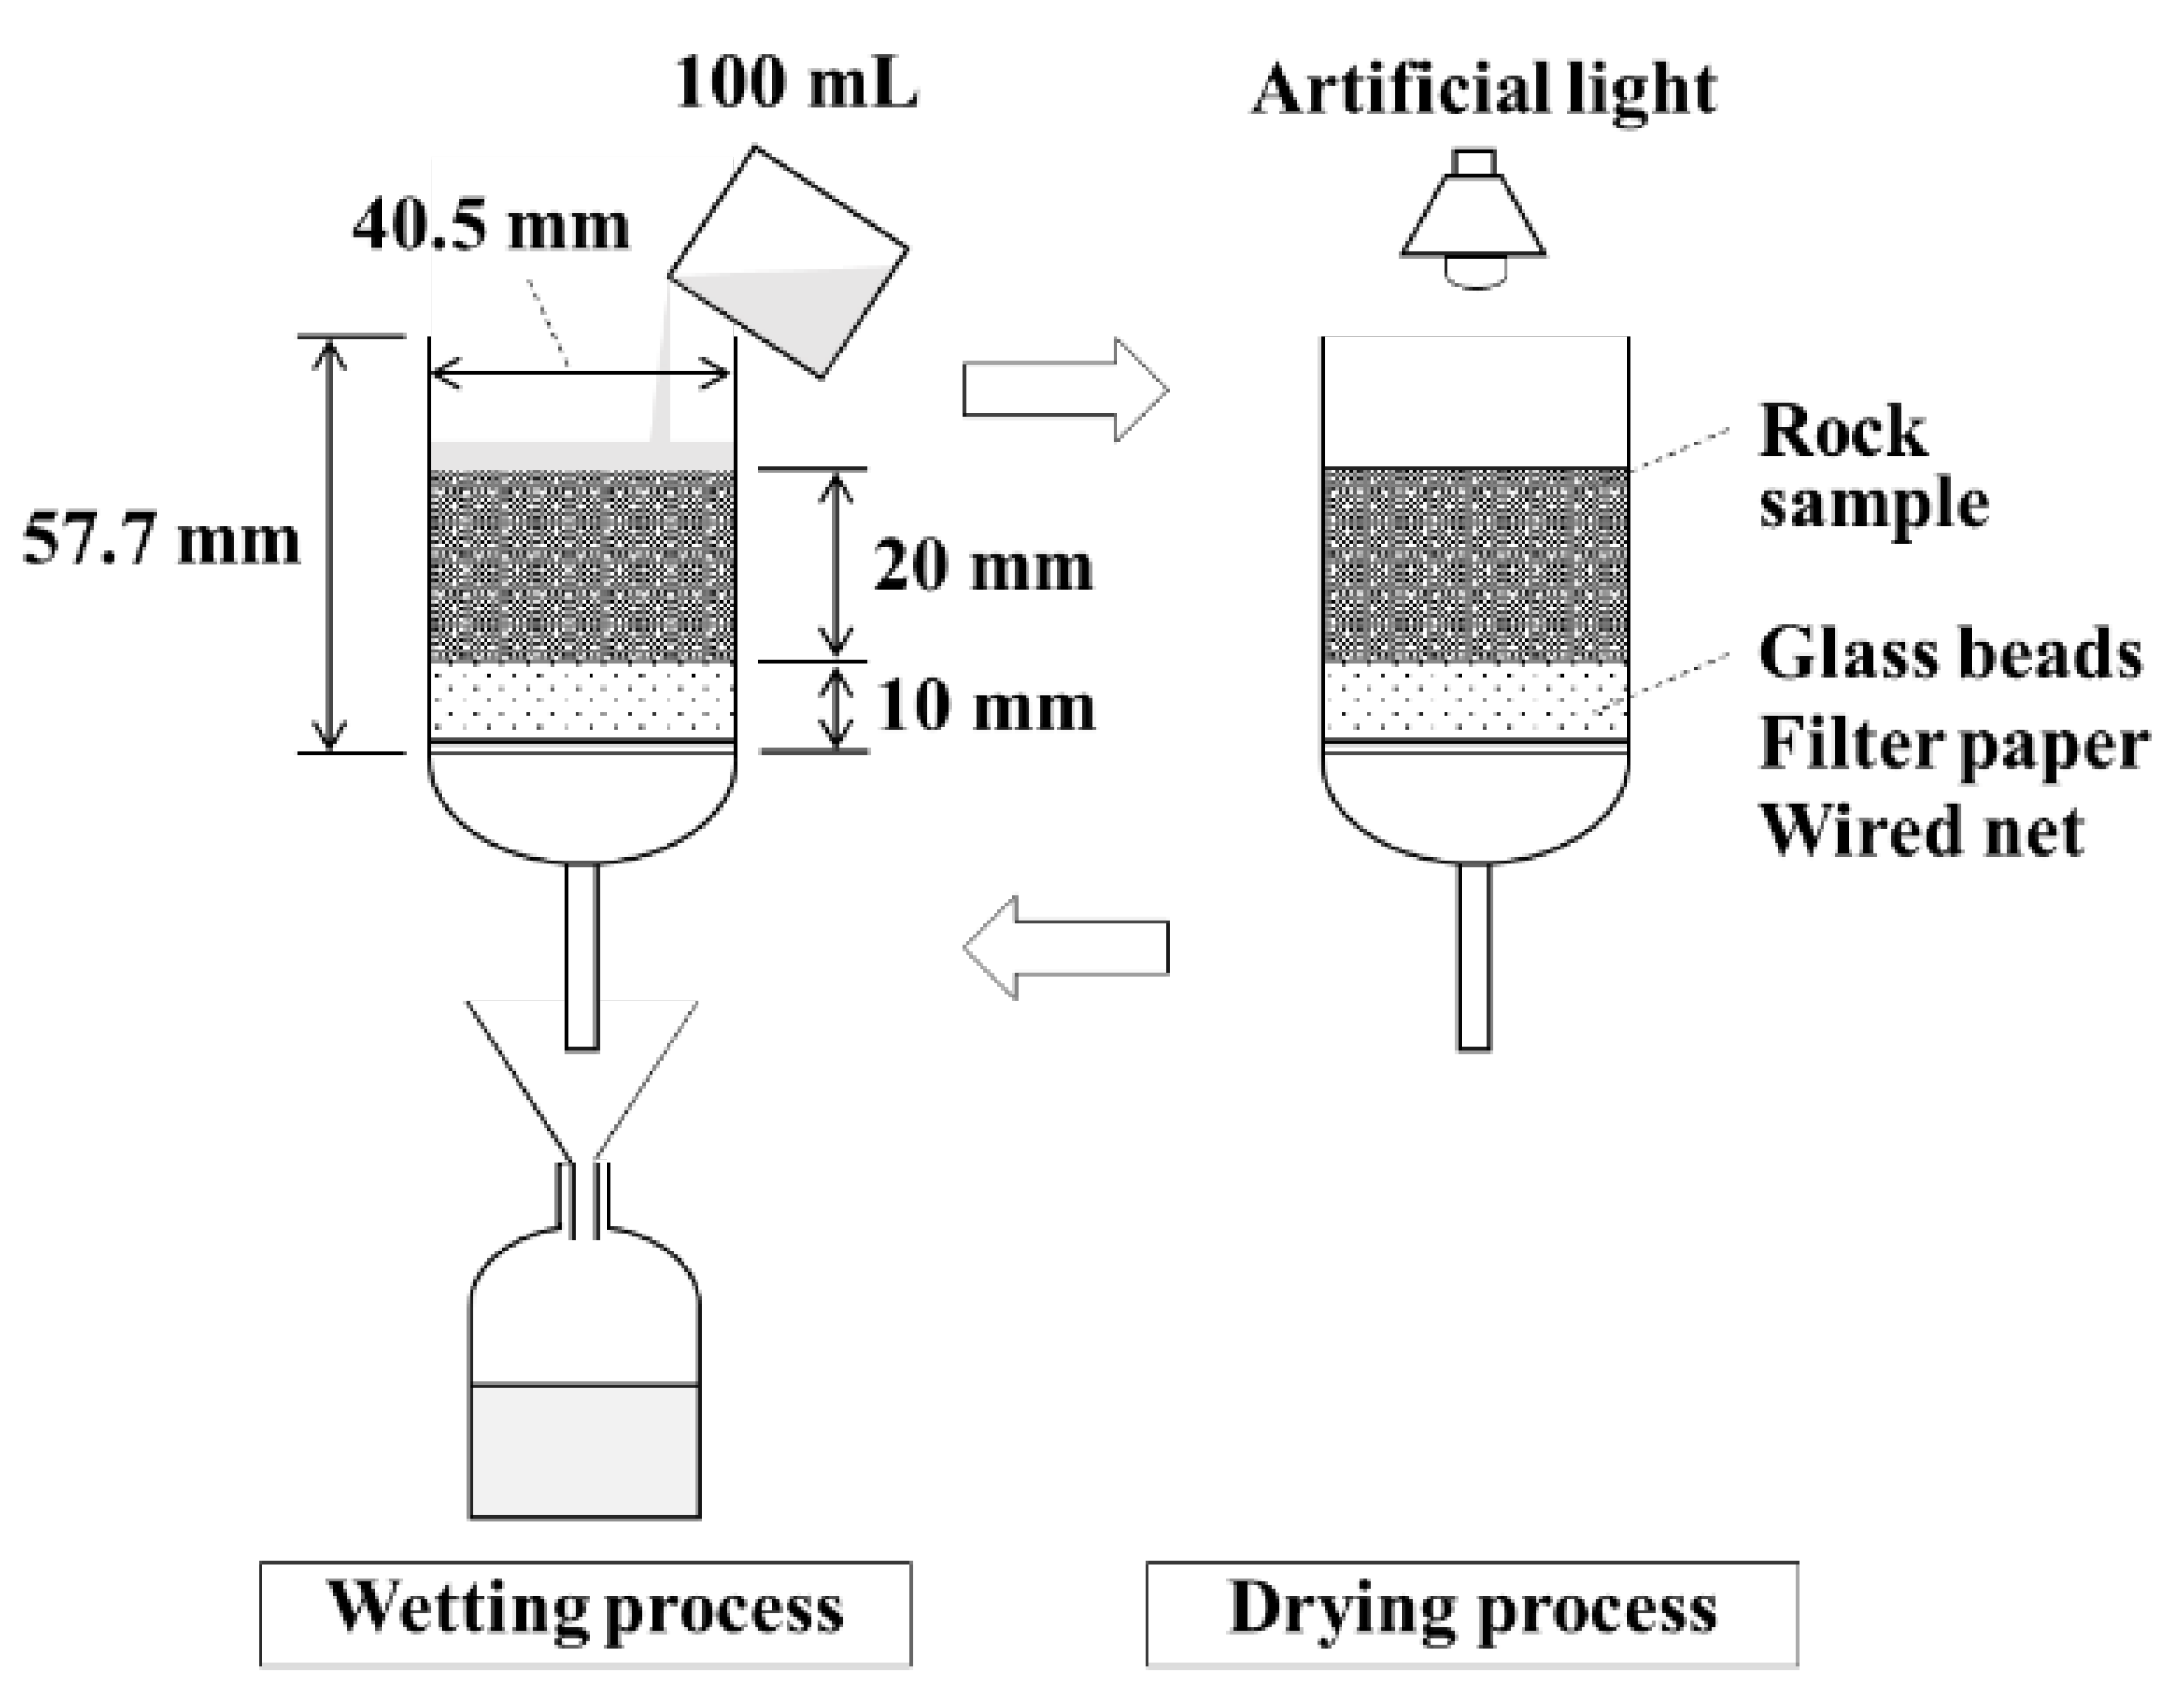
2.5. Column Leaching Test

Figure 1 shows a schematic view of the leaching test. A column, with an inner diameter of 40.5 mm and a height of 57 mm, was filled with 1.0–2.0 mm grain size pulverized samples (A–G) to a height of 20 mm. At the bottom of each column, to a height of 10.0 mm, 1.0 mm of glass beads, a filter paper, and a wired net were placed to prevent the samples from leaking. Column porosity was set at approximately 60% based on the calculations using the sample density and the height to which each column was filled. A total of 100 mL of deionized water (pH 6.71, EC < 1 µS/cm) was gently poured into the column. The column was allowed to saturate for one minute by closing the cock on the tube at the bottom of the column, followed by leaching by opening the cock. After measuring the pH, EC, and Eh of the leachate, the leachate was subjected to ion-chromatography (ICS-90, Dionex, Sunnyvale, CA, USA) coupled with an auto-sampler (AS50, Dionex, Sunnyvale, CA, USA) and a suppressor (CSRS 300, 4 mm and ASRS 300, 4 mm, Dionex, Sunnyvale, CA, USA) to measure SO42 and Ca2+ concentrations after the addition of 100 µL of HNO3. The samples in the column were dried using an artificial light for 6 h after leaching. The drying process continued until the point at which the column’s weight, with the sample, was identical to the weight prior to leaching. We repeated this wetting and drying cycle 40 times by assuming that these conditions were similar to the rainwater supply to rocks and drying conditions in the field. In addition, the total amount of water that was poured over the column was converted into the amount of annual Indonesian rainfall based on the column’s cross section, the amount of water that was poured, and the annual Indonesian rainfall calculated using Equations (1)–(4) below [36]. According to these calculations, the total amount of water that we poured over a period of 40 cycles corresponds to the amount of annual rainfall observed in this region.
A = R2 × 3.14 = (2.025)2 × 3.14 = 12.88 (cm2)
VA = V × A = 3037 × 0.1 × 12.88 = 3912 (cm3)
Vtotal = 100 × 40 = 4000 (cm3)
Y = Vtotal/VA = 1.02 (year)
where A is the sectional area of the column (cm2), R is the internal diameter (cm), VA is the volume of the water in the column calculated based on regional, annual rainfall (cm3), V is the annual rainfall (mm), Vtotal is the total volume of water poured during the leaching test, and Y is the ratio of the total amount of water poured into the column to that required to be equivalent to the total Indonesian annual rainfall.

3. Results and Discussion

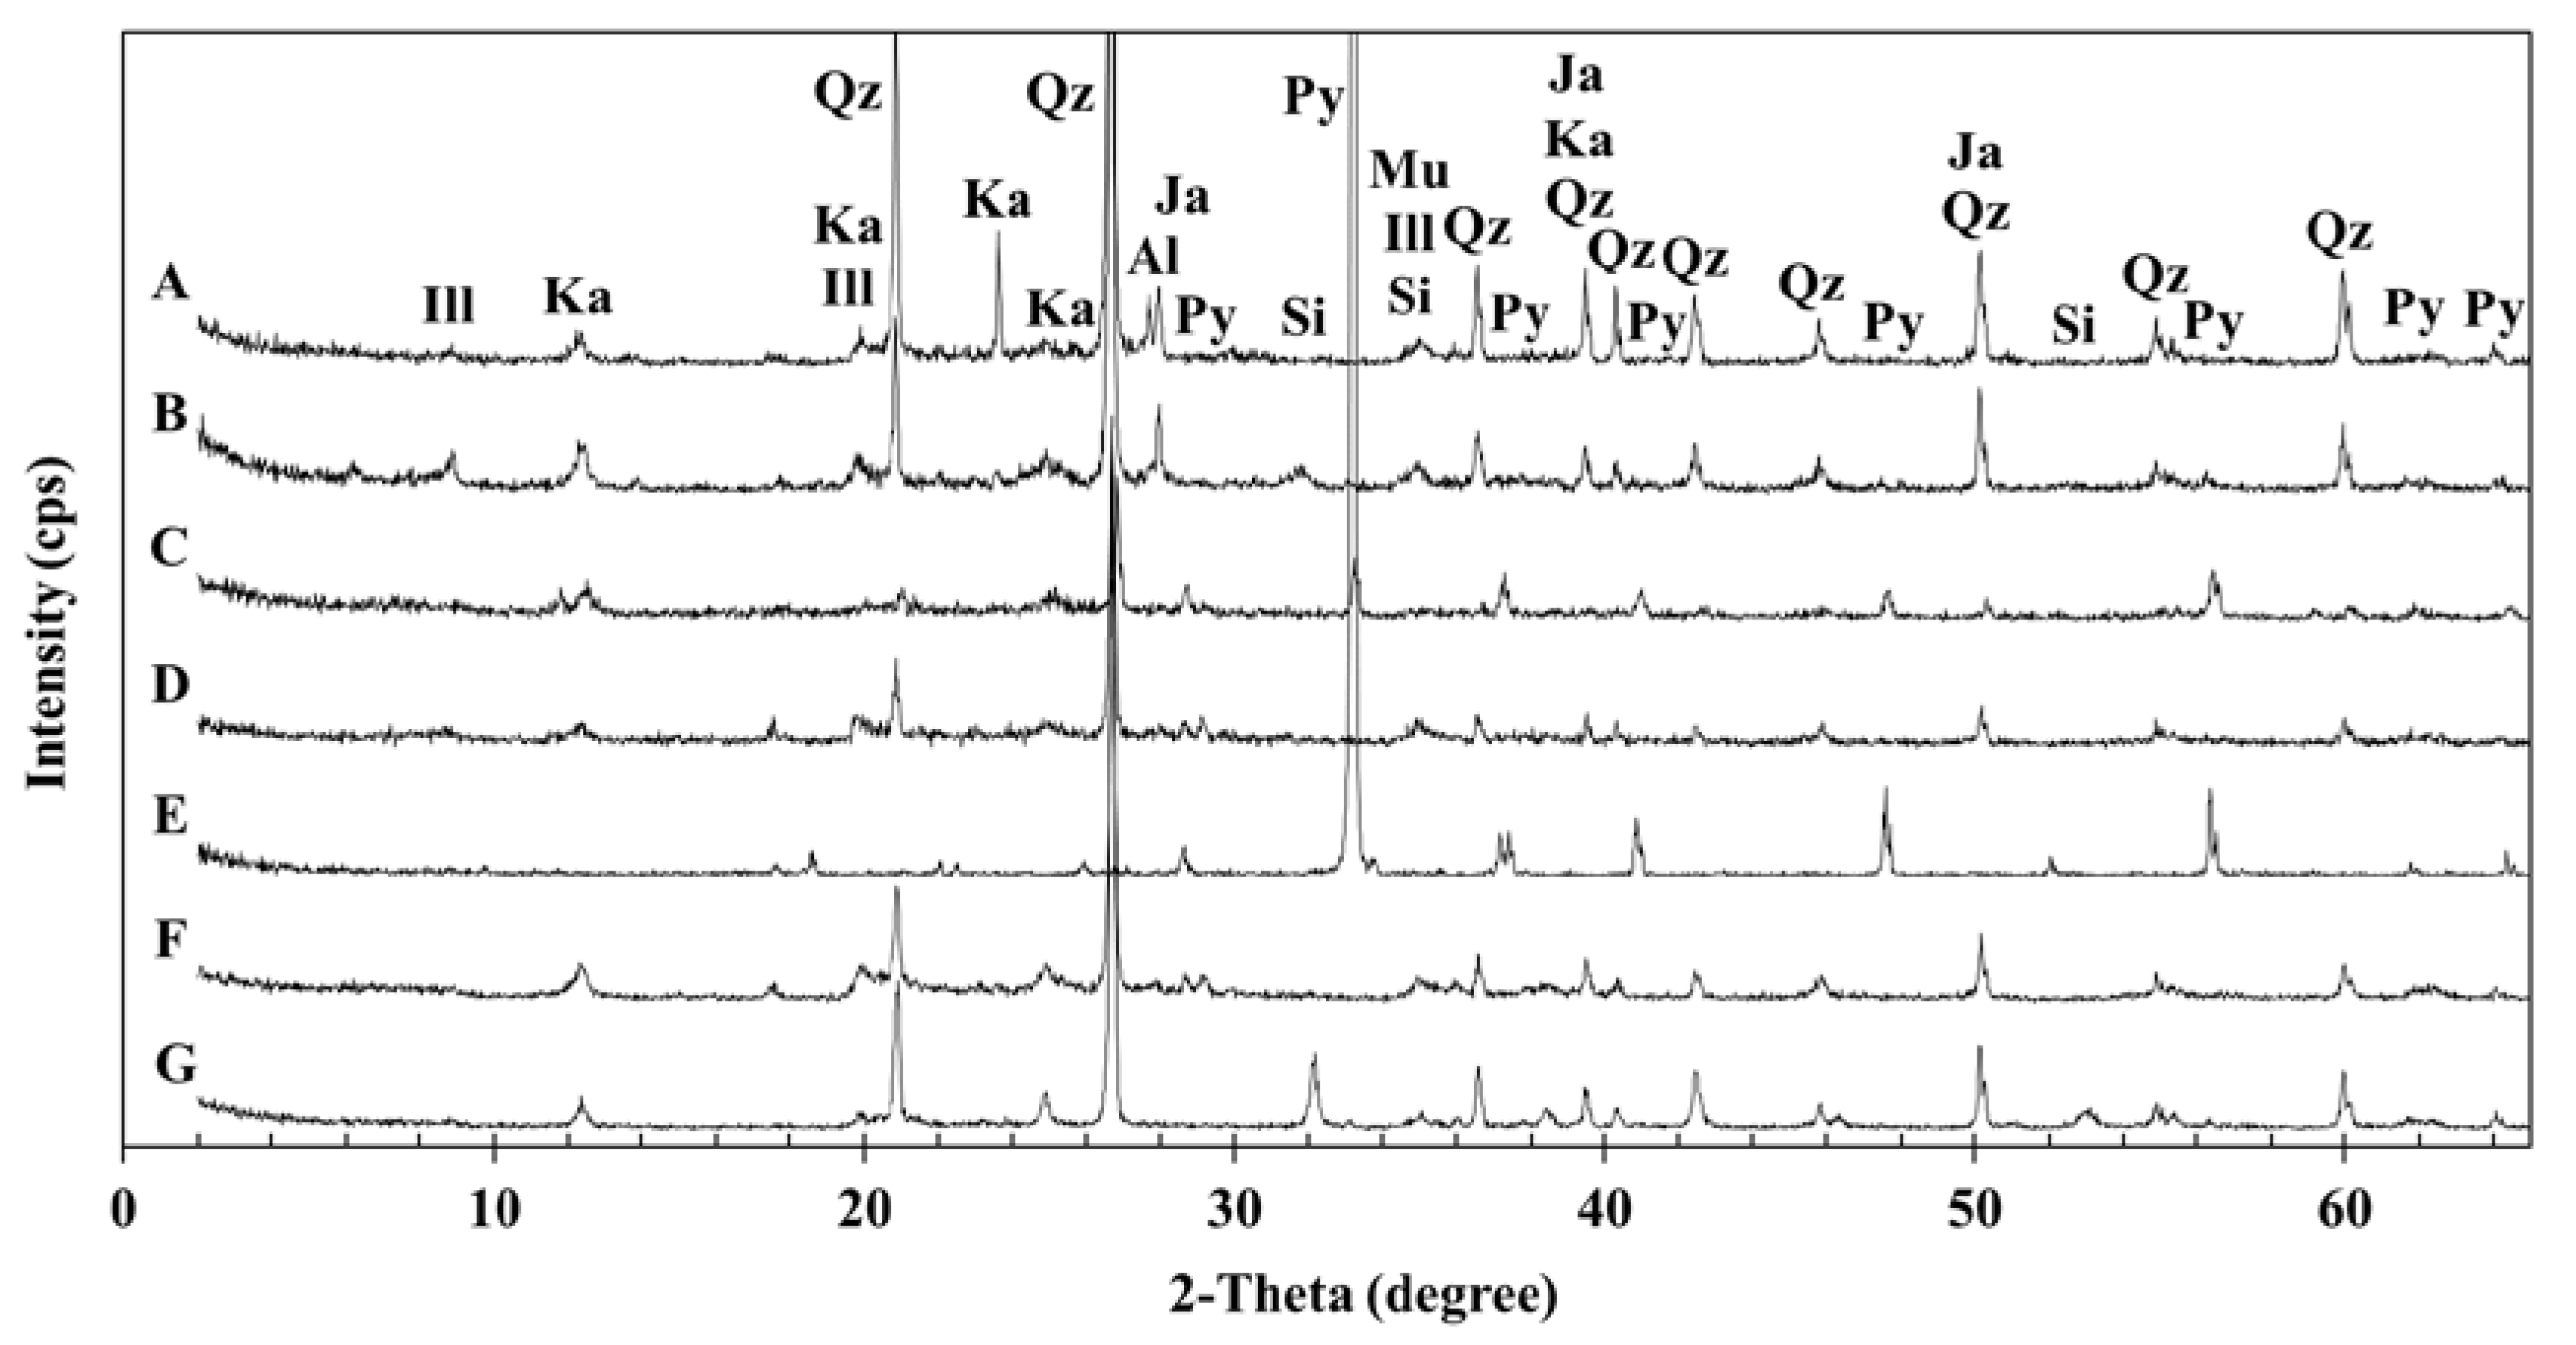
3.1. Geochemical Characteristics

Figure 2 shows the sample XRD patterns, and Table 1 summarizes the results of the ABA, NAG, paste pH, and Bernard calcimeter tests. Quartz and kaolinite (Al4Si4O10(OH)8) peaks were obtained for all samples. Samples C and E show clear pyrite (FeS2) peaks, which are not observed in the other samples. Illite [(K,H3O)(Al,Mg,Fe)2(Si,Al)4O10[(OH)2,(H2O)], muscovite (KAl2AlSi3O10(OH)2), albite (NaAlSi3O8), and siderite (FeCO3) are also observed in the samples, and samples B and G showed clear siderite peaks. Jarosite (KFe3+3(OH)6(SO4)2) is only observed in samples D and F. In Table 1, samples C and E are characterized by high NAPP values (383.9 and 776.6 kg H2SO4/ton, respectively), which are supported by clear pyrite peaks in Figure 2. Although we do not observe pyrite, except for samples C and E, all samples have positive NAPP values which causes AMD formation. All samples are classified as AMD source rocks according to the classification scheme described in Miller et al. [14,37]. Clear siderite peaks in samples B and G support the presence of elevated ANC values (20.3 and 9.2 kg H2SO4/ton, respectively). In addition, the elevated carbonate content in sample B is consistent with the presence of a siderite peak (Figure 2). Although previous studies have reported that siderite acts as both a neutralizer and an acid producer under certain conditions [18], based on the experimental conditions used in this study, we expect siderite to act as a neutralizer according to the acidic conditions associated with AMD formation (pH 1–5).
There is a large difference between the paste and NAG pH for samples B, F, and G. This difference results from the neutralization effects of carbonate dissolution, as indicated by the high ANC values (20.3, 3.7, and 9.2 kg H2SO4/ton, respectively). Carbonate minerals are characterized by higher values of solubility relative to sulfide minerals. Therefore, nearly all carbonate minerals dissolve in the first water flush without completely dissolving the sulfide minerals during the paste pH test. This results in an increase in the paste pH. On the other hand, in the NAG pH test, decreases in the NAG pH, associated with sulfide mineral dissolution using H2O2, surpass the carbonate buffer effects. In addition, although sample B exhibits the highest values for both ANC and carbonate (%) via the Bernard calcimeter test (20.3 kg H2SO4/ton and 1.58%), positive ANC values for samples E, F, and G are not correlated with the carbonate content (%). The Bernard calcimeter test analyzes the total carbonate in samples via CO2 volumetric analysis, which is liberated via the addition of HCl to the samples [28,29]. While the Bernard calcimeter test is a simple and inexpensive method, the errors of less than 5% in the test results should be taken into account [38].
Therefore, the mineral form, within a rock, contributes significantly to pH changes, and the effect on changes in water quality over time are not identifiable solely using the ABA and NAG tests.

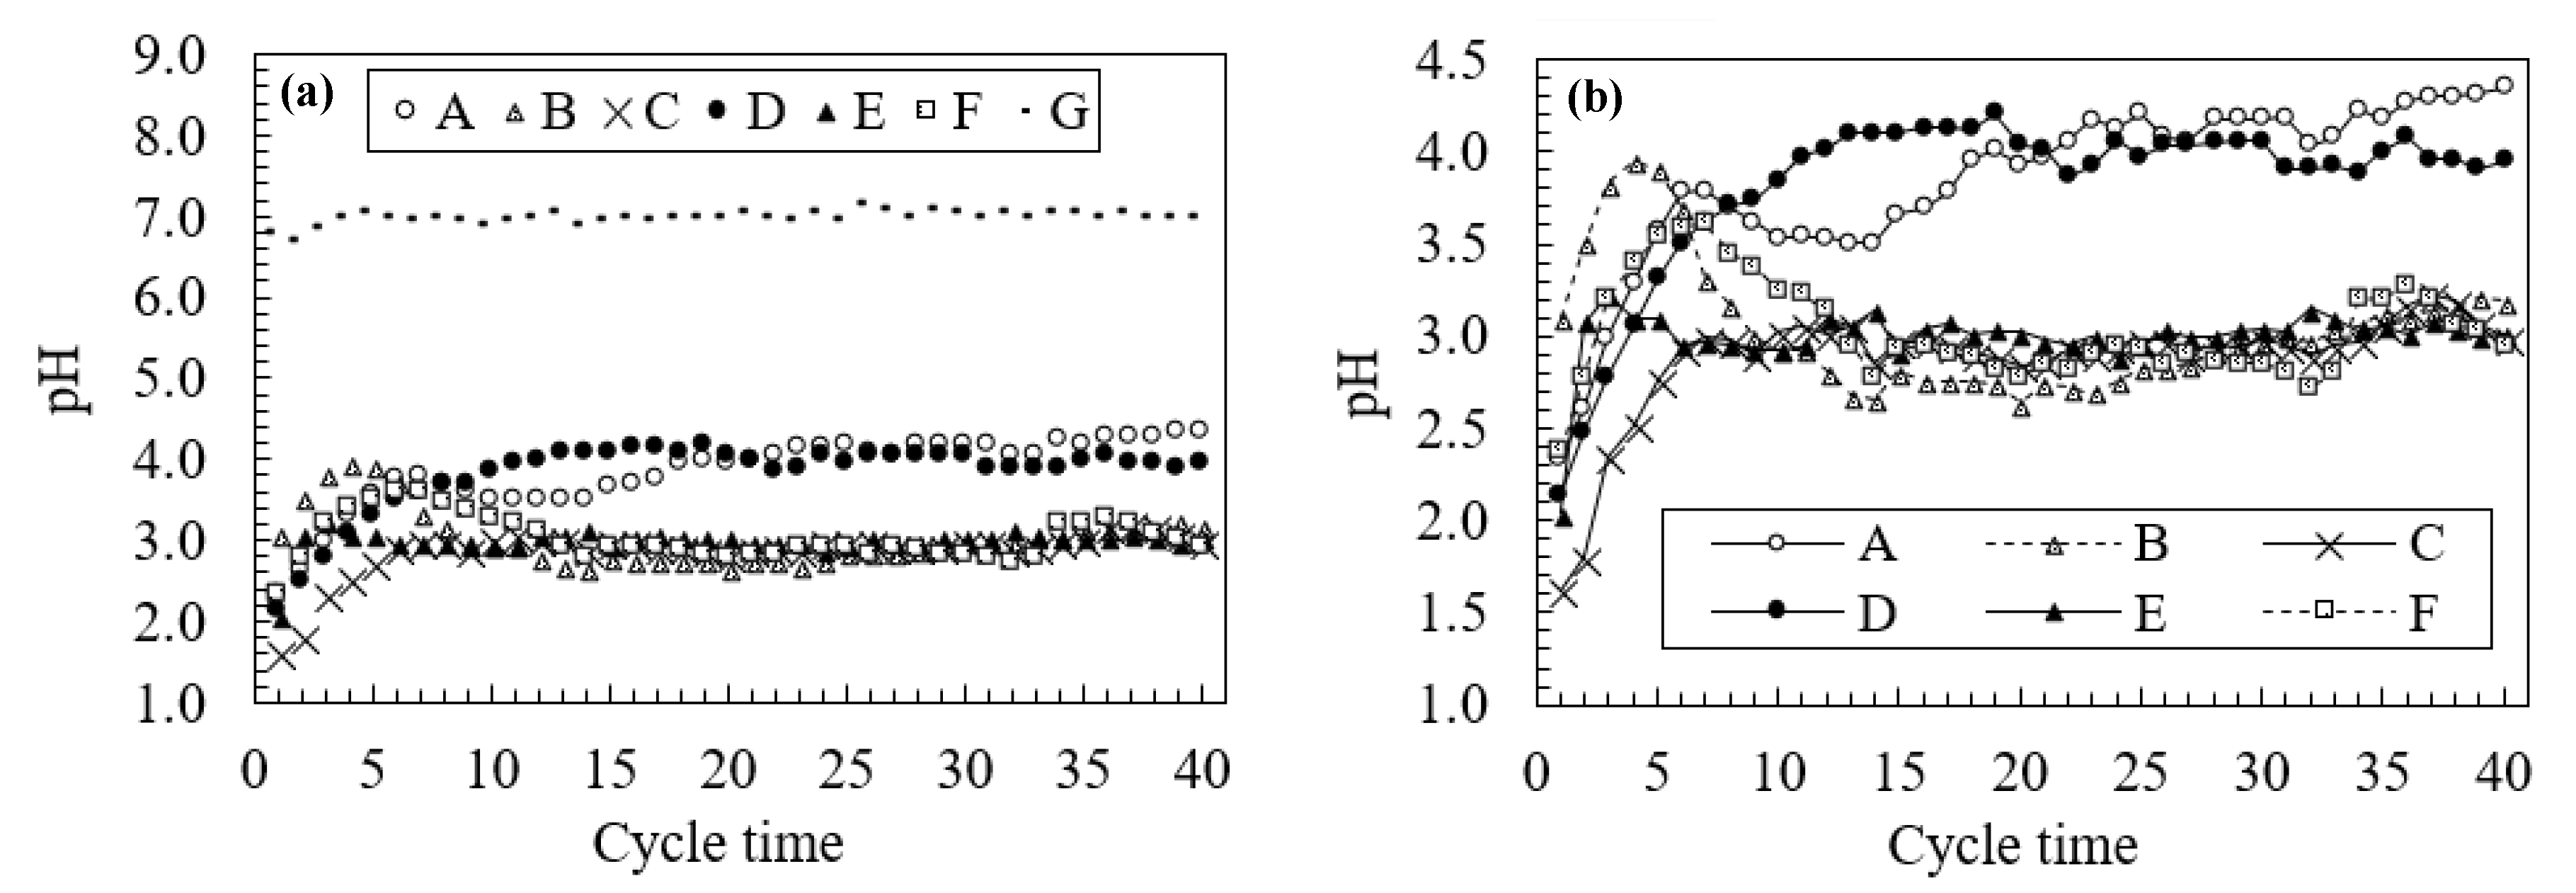
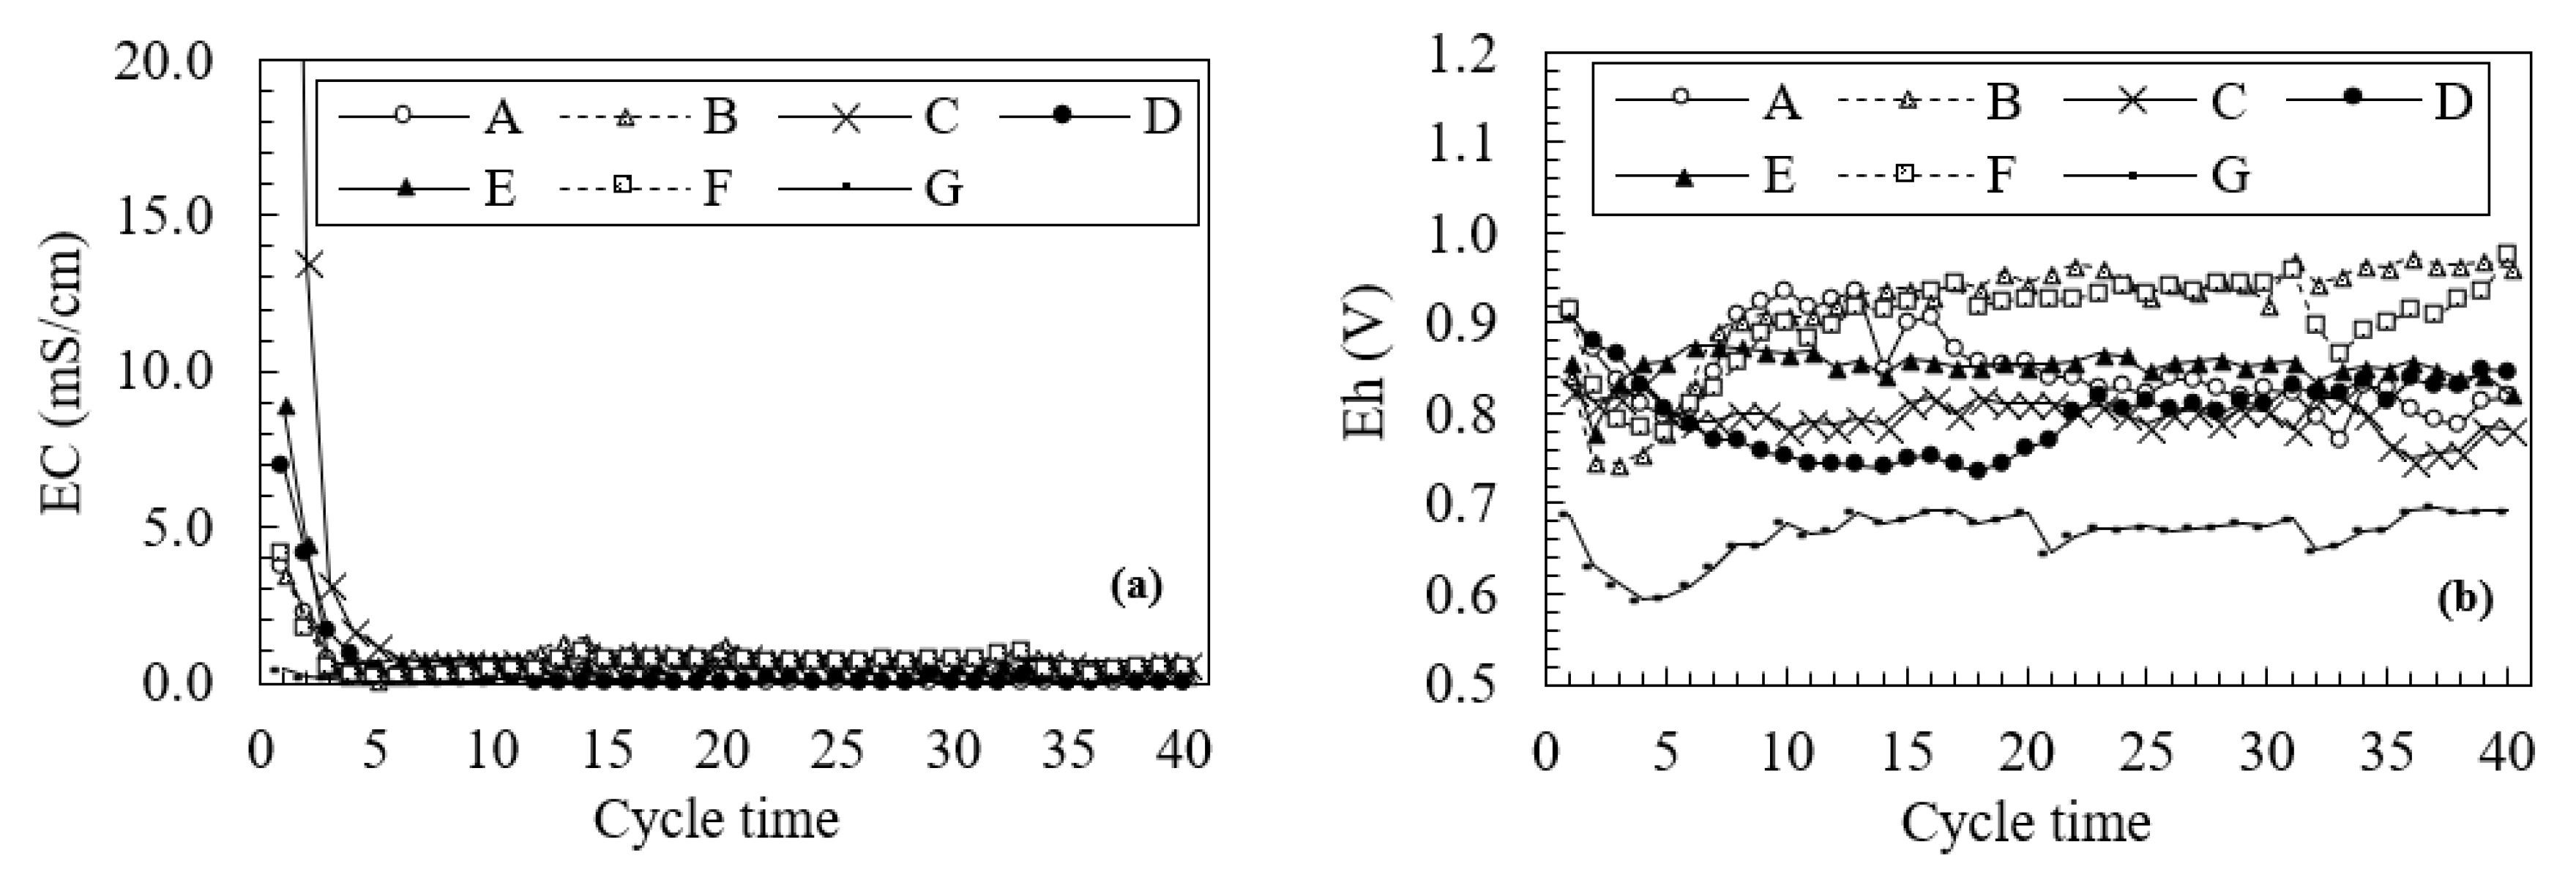
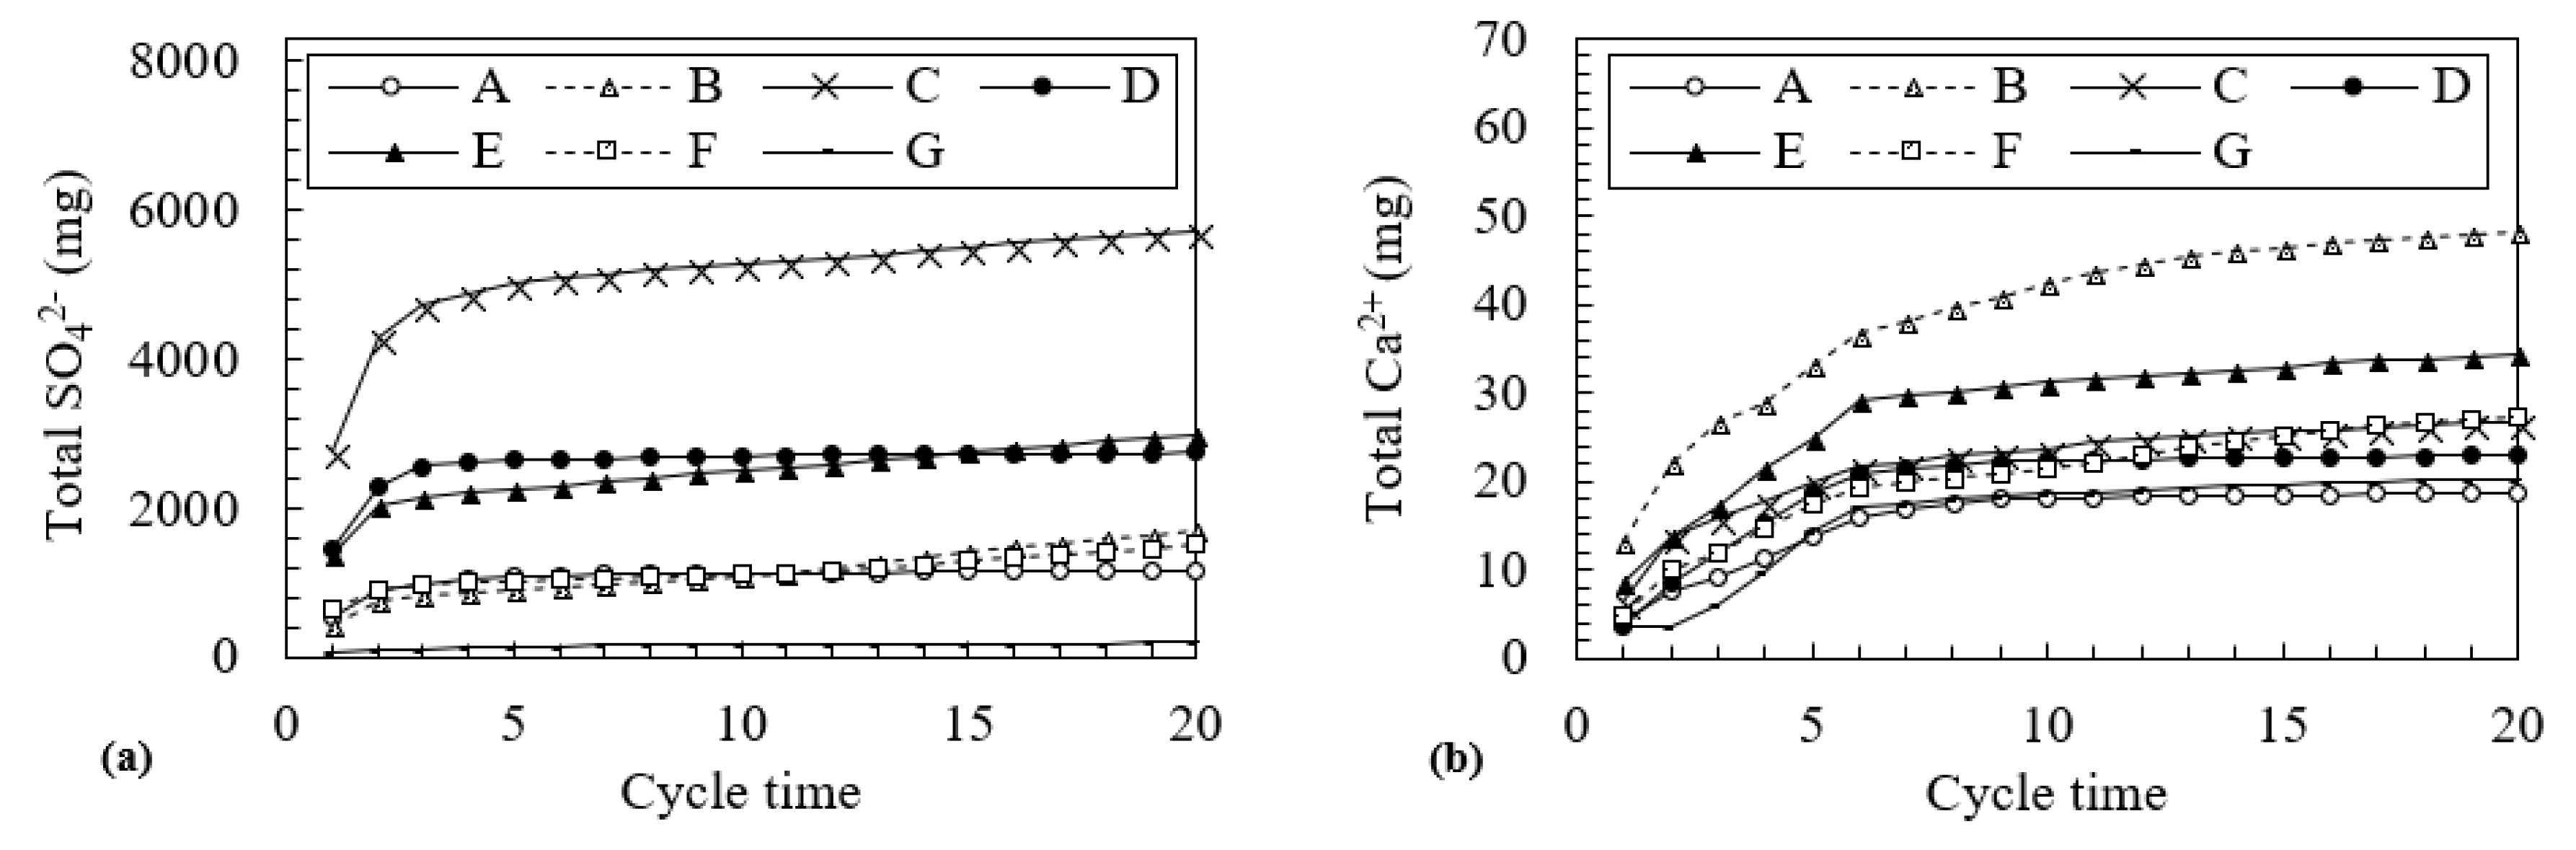
3.2. Changes in Water Quality During the Leaching Test

Figure 3 plots the changes in the pH during the leaching tests, and Figure 4 shows the change in EC and Eh for 40 leaching cycles. Changes in pH are divided into three patterns: a change at a high pH in sample G (approximately pH 7.4), a gradual increase in samples A and D, and a change at a low pH in samples B, C, E, and F (approximately pH 3.0). Comparing the results in Table 1 with changes in pH during the leaching test, we observe that the change at a high pH in sample G correlates with decreased AP, elevated ANC, and a pH of 6.16 for the paste pH. However, samples A and B are characterized by a lower pH than sample G even though their AP values are lower than that of sample G. AP values for samples A and B are 27.4 and 23.5 kg H2SO4/ton, respectively, and that for sample G is 28.7 kg H2SO4/ton. This difference is due to the neutralization effects indicated by their respective ANC values. Furthermore, samples A and B exhibit an opposite trend in pH changes relative to their NAPP values. Although samples C, E, and F, with NAPP values of more than 100 kg H2SO4/ton, yield a steady change at a pH of 3 as well as high EC values (more than 7.0 mS/cm) during early leaching stages, as shown in Figure 3 and Figure 4, sample D shows changes similar to sample A despite a NAPP value of more than 100 kg H2SO4/ton. Based on these results, changes in pH associated with AMD occurrence over time are difficult to estimate based solely on pH values from the NAPP and NAG tests, which are used in current schemes to classify waste rocks. With regard to cover materials, for the scenario with an absence of non-source rocks in the mining area, samples A and D, whose acidity is expected to decrease in a relatively short period with a gradual increase in pH, are preferable cover system rocks due to their low potential to produce acid.

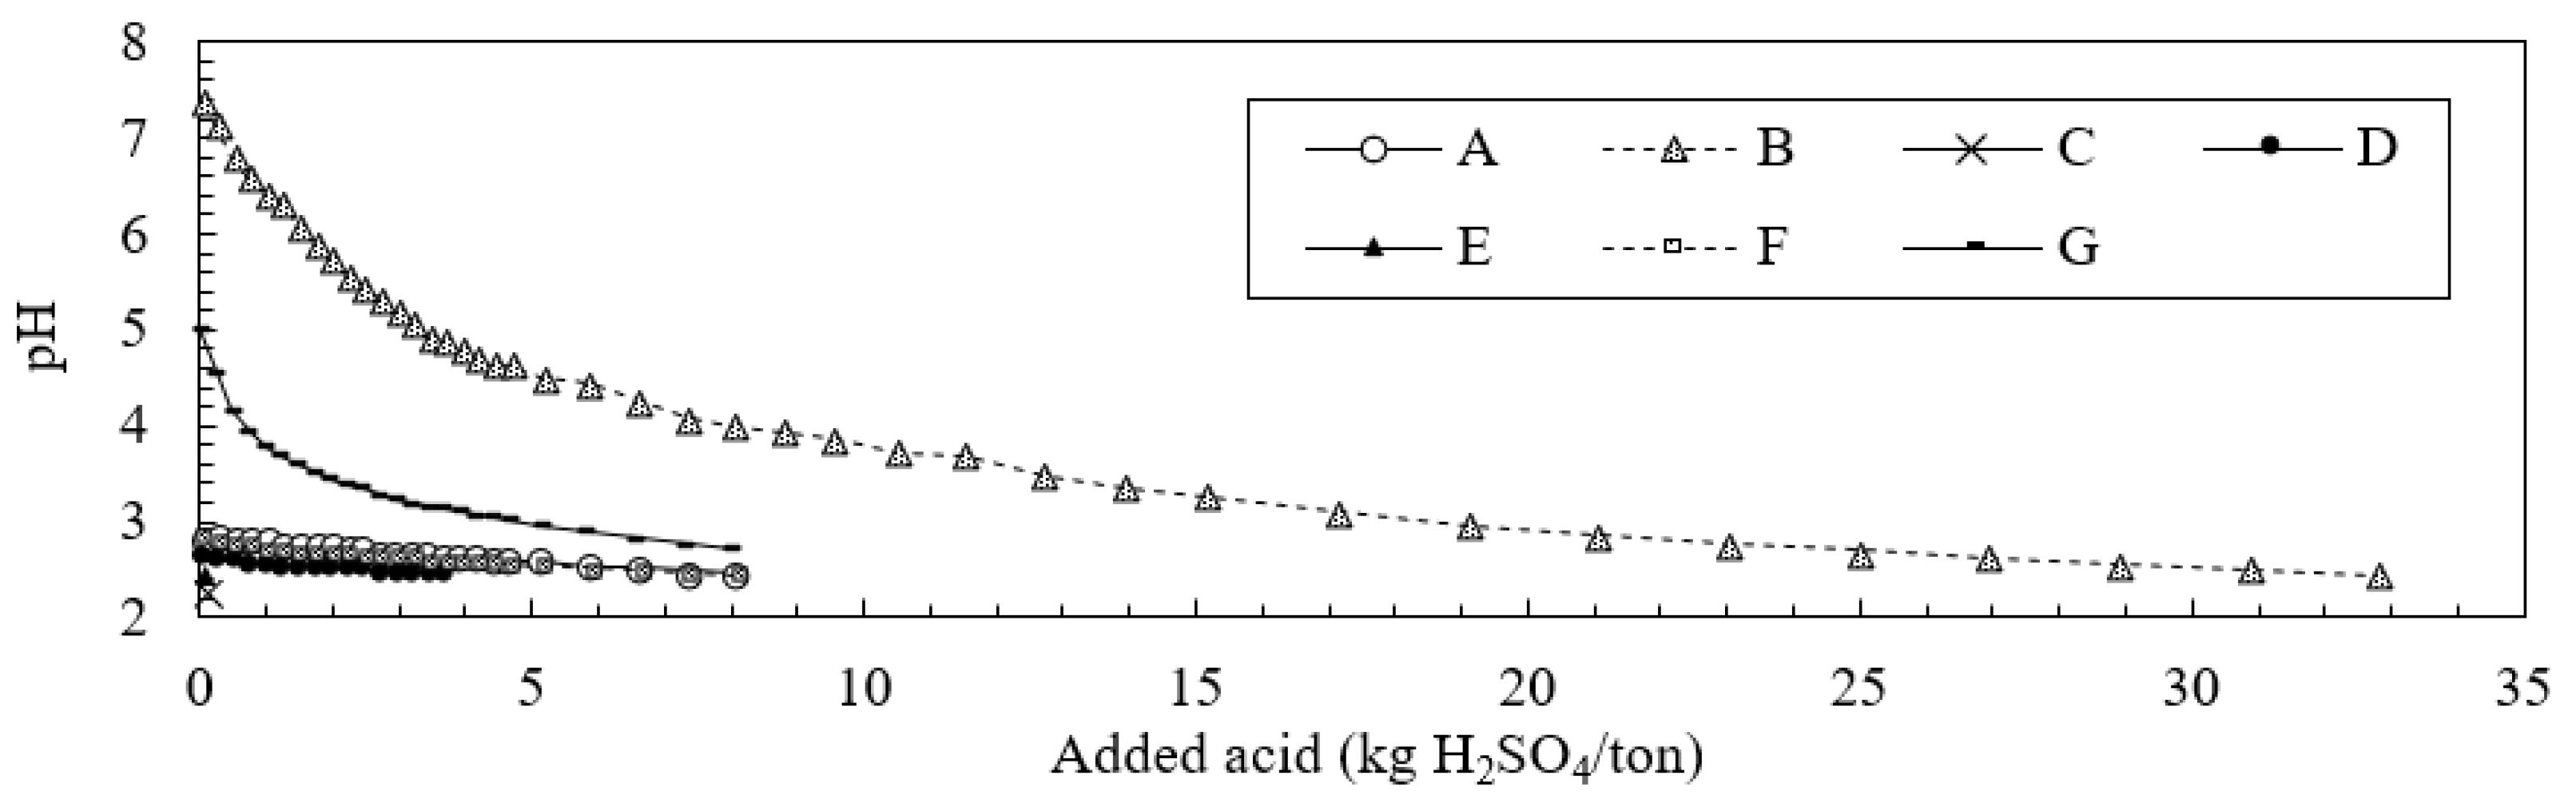
3.3. Neutralization Effects

Figure 3 shows a small peak in samples B and F over the first 10 cycles of leaching. This results from the neutralization effects caused by carbonate dissolution, as indicated by high ANC values. Meanwhile, sample E also has a positive ANC value, whose pH changes at low pH (less than pH 3.0) due to a high AP value (779.1 kg H2SO4/ton), which exceeds the neutralizing capacity effects. The appearance of a small peak in samples B and F is consistent with a decrease in Eh during the first 10 leaching cycles in Figure 4, which suggests the presence of a neutralization effect. The Eh value for sample E, with a positive ANC value, also decreases slightly at the beginning of leaching but increases immediately afterward due to its high potential to produce acid. Moreover, high ANC values in samples B and F only affect the pH for the first 10 leaching cycles, shown by the appearance of a small peak, which suggests that estimating long-term pH changes is difficult when using only the ANC value.
Figure 5 shows the change in pH with the addition of HCl during the ABCC test. Significant neutralization effects are observed in sample B, which exhibits a small peak in Figure 3, as well as sample G, which is characterized by a steady change in pH (near pH = 7). Both observed neutralization effects are caused by siderite dissolution [18]. Although neutralization effects in sample B appear as a small peak during the first 10 leaching cycles (Figure 3), a steady change near pH = 3 is observed due to a higher value of AP than ANC. However, sample G exhibits a steady change in the pH (near pH = 7) despite a higher value of AP compared to ANC. Based on the paste pH for sample G, this value is the highest among all samples (pH 6.16). Thus, the ABCC test results should be combined with the paste pH test results to predict AMD. Although sample F shows a small peak (Figure 3), we do not clearly observe a neutralization effect during the ABCC test. The effects of high AP values exceed any occurrence of neutralization effects in sample F during the ABCC test, which leads to a steady change near a pH of 3. In the ANC and Bernard calcimeter tests, the solution is titrated to quantify the rock neutralizing capacity after sample dissolution with the required concentration and amount of acids, which yields undissolved minerals during the tests. In addition, since the fizz rate in the fizz test (included in the ANC test) is determined via visual observation, the test results depend on the experience and skill of the observers. Conversely, during the ABCC test, we obtain the generation of acid production and neutralization over time via titration with HCl in several stages until the pH reaches 2.5. The concentration and amount of HCl added during titration are accounted for when calculating the values plotted in Figure 5. Therefore, the ABCC test, with less human error, is more reliable when evaluating the rock neutralization effects compared to the ANC and Bernard calcimeter tests. The appearance of a small peak during the first 10 leaching cycles indicates that it is difficult to evaluate long-term pH changes that result from the AMD occurrence when relying solely on the ABCC test. The results of the ABCC test are useful to evaluate pH changes that occur only for a short period during the leaching tests conducted in this study (i.e., approximately 3 months in the field area based on these calculations).
Figure 6 shows the changes in the total amount of SO42 and Ca2+ over 20 leaching cycles. The change in gradient from a steep to gentle slope at 3–5 leaching cycles in all samples represents the decrease in the amount of released SO42 and Ca2+ with each progressive leaching cycle. This indicates that minerals related to SO42 and Ca2+, in particular, dissolve during the early leaching stages. Sample B exhibits the highest concentration of Ca2+ and the lowest concentration of SO42 (Figure 6), resulting in a small peak during the early leaching stages (Figure 3). This is consistent with its high ANC value (Table 1). However, samples C and E, which have no small peaks in Figure 3, are characterized by high Ca2+ concentrations compared to sample F. This suggests that an increase in pH is not simply associated with Ca2+ dissolution. Since samples C and E have high SO42 concentrations and high NAPP values, small peaks do not occur (Figure 3) due to significant acid produced by the sample. Furthermore, sample F displays a small peak in Figure 3 and generates high Ca2+ concentrations and low SO42 concentrations compared to samples B, E, and C (Figure 6). Sample G, which is characterized by a steady change in pH (pH = 7; Figure 3), also has the lowest SO42 concentration (Figure 6). Consequently, mineral dissolution related to the release of SO42 and Ca2+ influences changes in water quality associated with AMD. However, since ABCC test results are consistent with the change in pH for only 10 leaching cycles, shown by the appearance of a small peak such as in sample B, estimating changes in water quality associated with AMD over time requires another parameter.

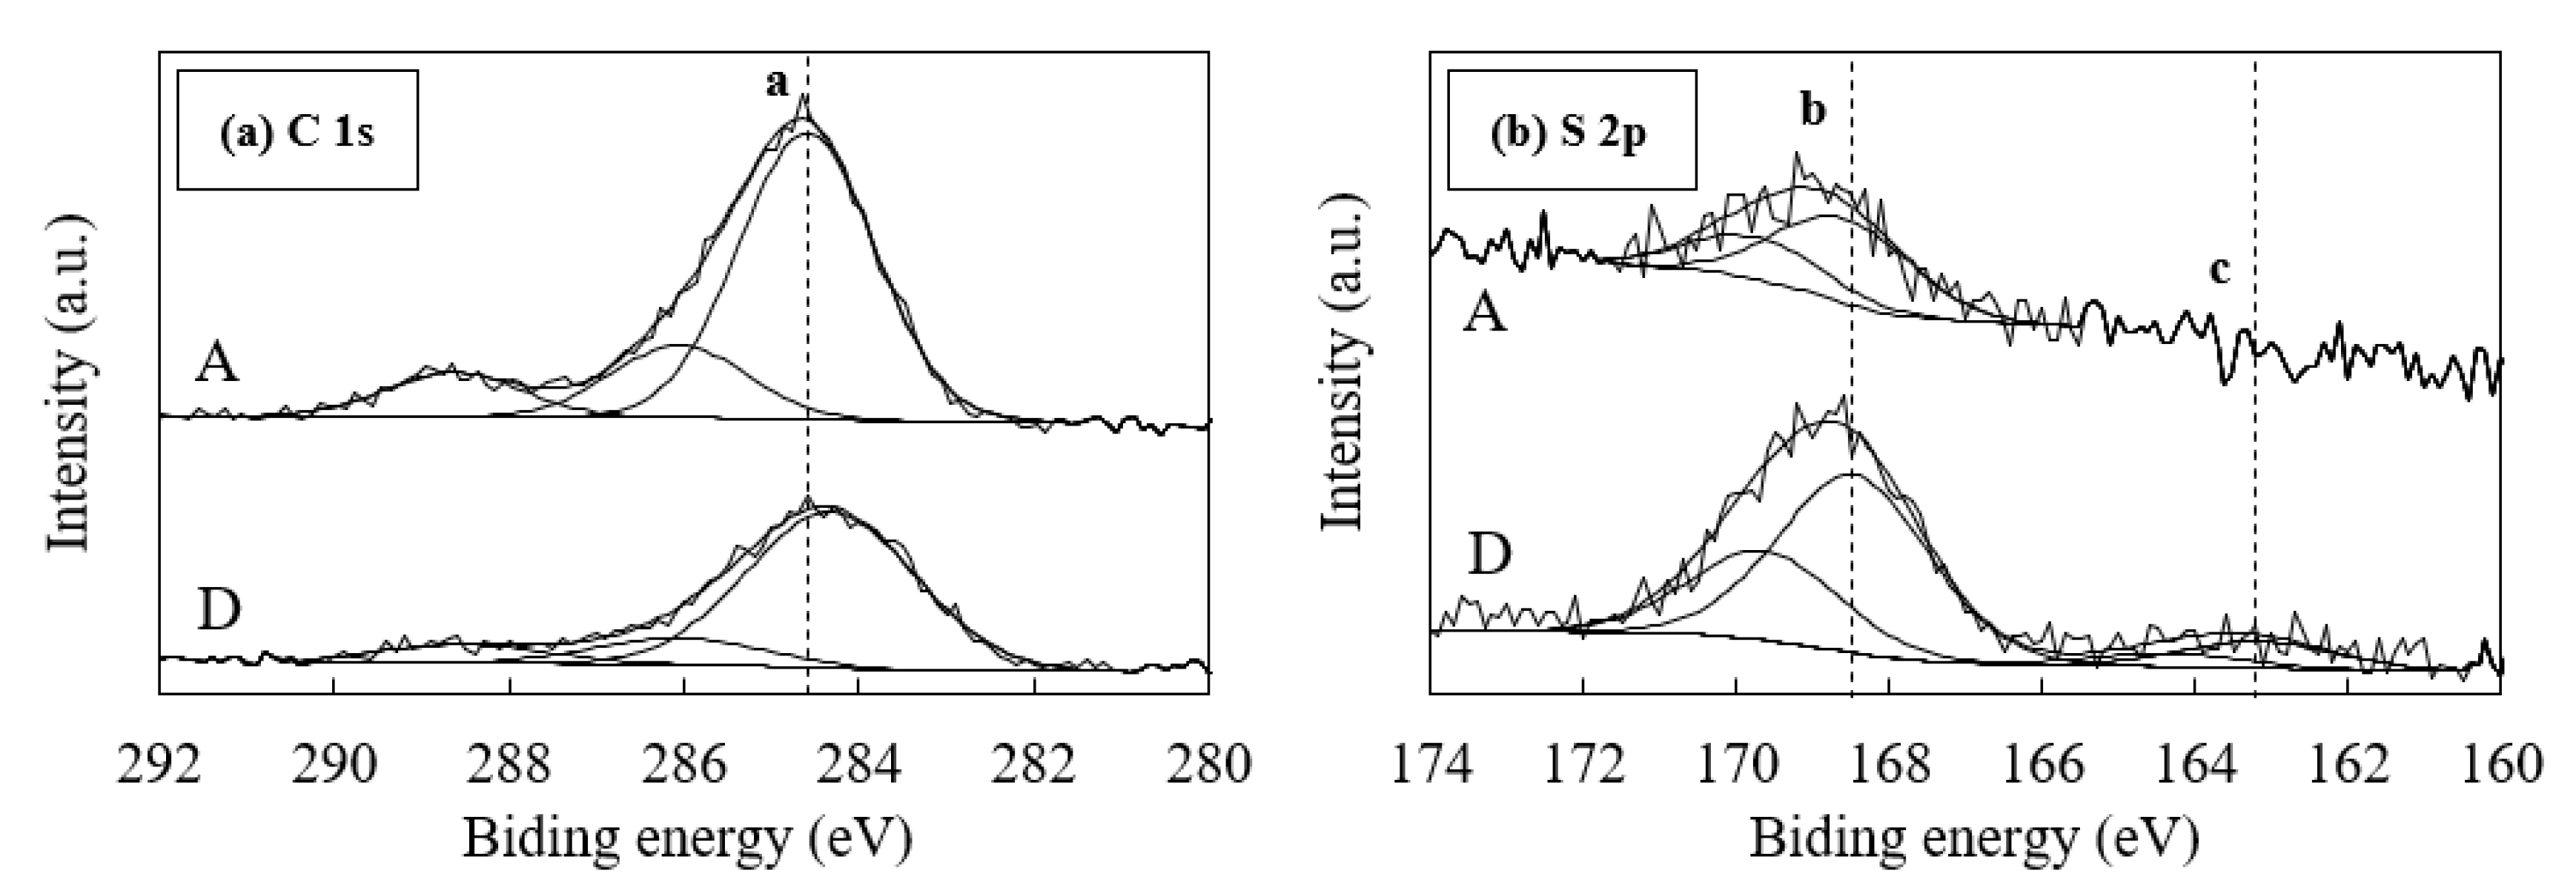
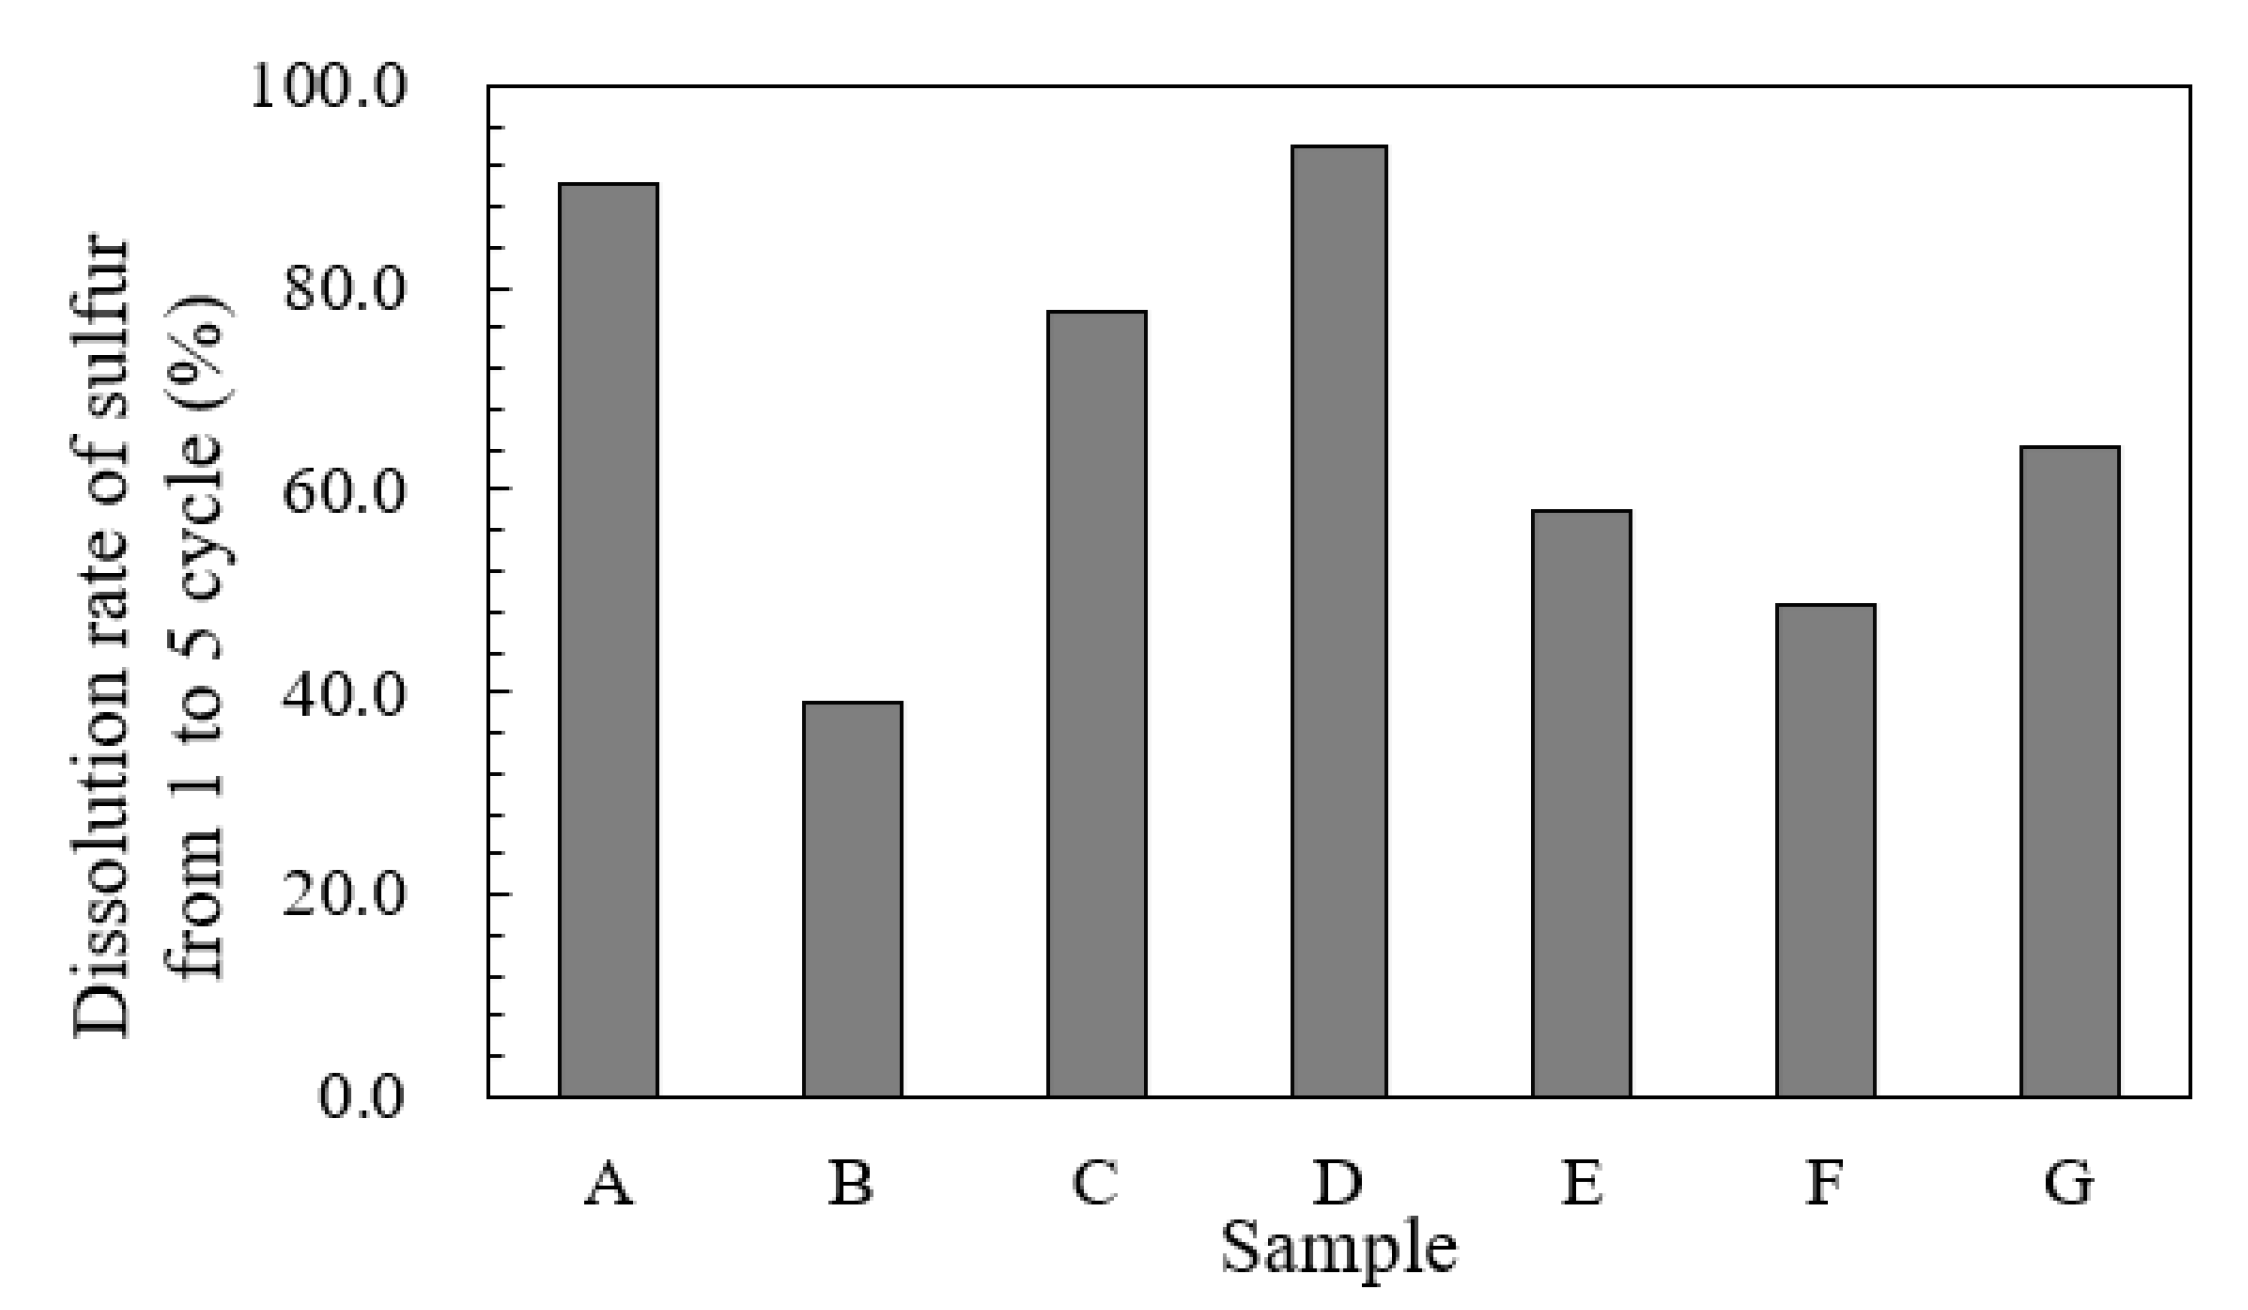
3.4. Effects of the Form of Sulfur

Figure 7 shows the proportion of sulfide and sulfate in all samples, calculated based on sequential acid extraction results. We calculate the ratio of the amount of sulfur in the HCl and HNO3 extraction stages to the total amount of sulfur. The samples are categorized into two groups, samples A and D, in which more than 90% of the sulfur is sulfate, and samples B, C, E, F, and G, in which more than 50% of the sulfur is sulfide. For samples D and F, the sulfate content is derived from jarosite (Figure 2). Since clear jarosite peaks are not observed in samples A and G due to low sulfur content (0.89% and 0.93%, respectively), compared to samples D and F (4.99% and 5.67%, respectively), the sulfate content in samples A and G is also derived from jarosite. Sulfate dissolution in samples A and D during the early leaching stages due to high sample solubility may have led to gradual increases in the pH (Figure 3). Since there is a difference of more than 100 kg H2SO4/ton for the NAPP values between samples A and D, the sulfur form appears to be a more valuable factor to track changes in pH than, for example, the NAPP and NAG pH. Although sample B shows a small peak in pH during the first 10 leaching cycles, the high sulfide proportion (more than 90% of the sulfur) causes pH changes near a pH of 2.5–3.0 after 10 leaching cycles. Conversely, significant neutralization effects and a higher proportion of sulfate in sample G compared with sample B lead to changes at high pH in the leaching test (approximately pH 7.4), although sample B has similar NAPP values. Changes in water quality should be estimated from the proportion of different sulfur forms combined with the NAPP value, calculated from the absolute value of the sulfur content. However, although a good relation exists between sequential extraction and leaching test results obtained in this study, extraction with HCl may dissolve acid-soluble sulfide or Fe(III) hydroxide sulfate minerals [18], thereby requiring further experimentation with this testing method.
Although nearly all sulfur in samples A and D is sulfate, these samples do not exhibit a clear sulfate peak during the XRD analysis (Figure 2). Therefore, the S 2p XP-spectra for samples A and D are collected during XPS analysis. The binding energy is corrected using EB [C 1SA] from hydrocarbon = 284.6 eV, as shown in Figure 8. According to previous studies, the binding energies of S 2p3/2 for iron sulfides and/or elemental sulfur are 163–164 eV, and that of sulfate is 168–171 eV [39,40,41]. The sulfate values obtained for samples A and D (Figure 8) are in good agreement with the binding energies reported in previous studies. Furthermore, XPS analysis reveal the presence of sulfide in sample D in addition to the sulfate content observed based on sequential acid extraction results. This indicates that the sulfur in sample D consists of a large amount of sulfate along with a small amount of sulfide. No iron sulfides and/or elemental sulfur peaks are observed in sample A due to its small sulfur concentration compared to that in sample D (Table 1).
Figure 9 plots the sulfur dissolution rate over five leaching cycles during the leaching test, calculated based on the ratio of the amount of dissolved sulfur in the first five cycles to the total amount of dissolved sulfur throughout the test. Sulfur dissolution primarily occurs during the early leaching stages for samples A and D. The amount of dissolved sulfur in the first five leaching cycles accounts for more than 90% of the total dissolved sulfur during the leaching test due to the high sulfate proportion in samples A and D (more than 90% of the sulfur). This is consistent with the observation of a high sulfate proportion in samples A and D, as shown in Figure 7 and Figure 8. The sulfur dissolution rate in Figure 9 does not correlate with the NAPP value, calculated using the sulfur content, but roughly correlates with the sulfate proportion in rocks (Figure 7). Non-sulfide sulfur (i.e., the sulfate sulfur content) is calculated as the acid potential in the NAPP in samples A and D in Table 1. Although the NAPP values are higher in sample A than sample B, the paste and NAG pH are lower in sample B than sample A due to the occurrence of sulfate dissolution in the paste pH and NAG tests. This also causes discrepancies among the NAPP, paste pH, and NAG pH values in samples A and B in addition to neutralization effects in sample B, as discussed in Section 3.2.
Table 2 summarizes the changes in the NAG pH during the sequential NAG test. Although it is difficult to understand AMD formation over time resulting from rock sulfur form based solely on NAG pH (listed in Table 1), the results in Table 2 imply that there is low acid production potential in samples A and G, indicated by a NAG pH of more than 4.50 after five stages of the dissolution process. This is also supported by changes in pH shown in Figure 3 and XPS analyses that show the existence of sulfates (Figure 8). However, the NAG pH of sample D does not exceed 4.50 even after seven stages due to the existence of sulfides (Figure 8). The heterogeneous sulfide distribution in sample D is also similar to pH changes in sample A (Figure 3). These results suggest that the effects of the sulfur form and the heterogeneous sulfur distribution in the rocks are criteria for the evaluation of rock acid production, which is taken into account by categorizing waste rocks based on their NAG pH using the sequential NAG test in conjunction with the NAPP and NAG pH tests. Changes in NAG pH in the sequential NAG test reflect the rock sulfur solubility, which provides information on the form of sulfur contained within the rocks and their acid-producing potential. Therefore, changes in NAG pH during the sequential NAG test are useful when estimating changes in water quality over time. A more precise classification of cover materials (non-source), low-potential source rocks, and AMD source rocks is achievable using the sequential NAG test in combination with the NAPP and NAG pH tests, which take into account the effects that the form of sulfur has on AMD.

4. Conclusions

This study applied several simple testing methods to the characterization of mine waste rocks and AMD prediction with a focus on the form of sulfur, the neutralization effects of carbonates, and the AMD formation over time. Changes in pH associated with AMD occurrence over time are difficult to estimate based solely on the NAPP and NAG pH tests, which are currently used to classify waste rocks. ABCC test results are useful for evaluating changes in pH only during short periods, such as in this study, which corresponds to approximately three months in the research area. The results also indicated that the form of sulfur is crucial for evaluating AMD occurrence over time. Changes in NAG pH during sequential NAG tests reflect sulfur solubility within the rocks, which provides information on the form of sulfur that occurs in the rocks as well as their acid-producing potential. Therefore, changes in NAG pH are useful when estimating changes in water quality over time. A more precise classification of cover materials (non-source), low-potential source rocks, and AMD source rocks is achievable using the sequential NAG test and sequential extraction with HCl, HF, and HNO3 in combination with simple, currently used tests (i.e., the ABA and NAG tests), which take into account effects associated with the form of sulfur and how it affects AMD. In addition, further experimentation with this method combination should be performed in other field sites to validate it, which will contribute to establishing a more precise, simple, and inexpensive method that is feasible in field laboratories at mining sites. This can also lead to a reduction in the cost and labor required to predict AMD, its prevention, and treatment methods, as well as a reduction in the impacts that AMD has on the environment, thus resulting in more sustainable mining practices.

Author Contributions

S.M. designed and performed the experiments and analyzed the data with H.I. On the basis of the data, S.M. wrote the paper. H.S., T.S., and G.J.K. made helpful suggestions for data analysis and supported parts of the experiments. G.J.K. kindly helped conduct a field investigation in Indonesian mines.

Funding

This work was partly supported by JSPS KAKENHI Grant Number JP17H07401.

Acknowledgments

We are grateful to the mine and researchers at Kyushu University for supporting part of the analysis.

Conflicts of Interest

The authors declare no conflict of interest.

References

  1. Matsumoto, S.; Shimada, H.; Sasaoka, T. The key factor of acid mine drainage (AMD) in the history of the contribution of mining industry to the prosperity of the United States and South Africa: A review. Nat. Resour. 2016, 7, 445–460. [Google Scholar] [CrossRef]
  2. Qureshi, A.; Maurice, C.; Öhlander, B. Potential of coal mine waste rock for generating acid mine drainage. J. Geochem. Explor. 2016, 160, 44–54. [Google Scholar] [CrossRef]
  3. Maree, J.P.; Mujuru, M.; Bologo, V.; Daniels, N.; Mpholoane, D. Neutralisation treatment of AMD at affordable cost. Water SA 2013, 39, 245–250. [Google Scholar] [CrossRef]
  4. Trumm, D. Selection of active and passive treatment systems for AMD–flow charts for New Zealand conditions. N. Z. J. Geol. Geophys. 2010, 53, 195–210. [Google Scholar] [CrossRef]
  5. Sheoran, A.S. Management of acidic mine waste water by constructed wetland treatment systems: A bench scale study. Eur. J. Sustain. Dev. 2017, 6, 245–255. [Google Scholar] [CrossRef]
  6. Fernández-Rubio, R.; Fernández-Lorca, S.; Esteban Arlegui, J. Preventive techniques for controlling acid water in underground mines by flooding. Int. J. Mine Water 1987, 6, 39–52. [Google Scholar] [CrossRef]
  7. Benzaazoua, M.; Bussiere, B.; Kongolo, M.; McLaughlin, J.; Marion, P. Environmental desulphurization of four Canadian mine tailings using froth flotation. Int. J. Miner. Process. 2000, 60, 57–74. [Google Scholar] [CrossRef]
  8. Skousen, J.G.; Sexstone, A.; Ziemkiewicz, P.F. Acid mine drainage control and treatment. In Reclamation of Drastically Disturbed Lands Agronomy. No. 41; Barnhisel, R.I., Darmody, R.G., Daniels, W.L., Eds.; American Society of Agronomy and American Society for Surface Mining and Reclamation: Madison, WI, USA, 2000; pp. 131–168. [Google Scholar]
  9. Pozo-Antonio, S.; Puente-Luna, I.; Lagüela-López, S.; Veiga-Ríos, M. Techniques to correct and prevent acid mine drainage: A review. Dyna 2014, 81, 73–80. [Google Scholar] [CrossRef]
  10. Matsumoto, S.; Shimada, H.; Sasaoka, T.; Kusuma, G.J.; Gautama, R.S. Construction of dry cover system for prevention of acid mine drainage at mine waste dump in open cast coal mines, Indonesia. J. Environ. Prot. 2016, 7, 160–169. [Google Scholar] [CrossRef]
  11. Margarete, K.; William, N.W.; Sören, B. Acid rock drainage or not-oxidative vs. reductive biofilms—A microbial question. Minerals 2018, 8, 199. [Google Scholar] [CrossRef]
  12. Mine Environment Neutral Drainage Program (MEND), Construction and Instrumentation of a Multi-layer Cover Les Terrains Aurifères. MEND Report 2.22.4a. 1999. Available online: http://mend-nedem.org/wp-content/uploads/2013/01/2.22.4a-E.pdf (accessed on 26 June 2018).
  13. Pope, J.; Weber, P.; Olds, W. Control of acid mine drainage by managing oxygen ingress into waste rock dumps at bituminous coal mines in New Zealand. In Proceedings of the IMWA2016 Annual Conference, Freiberg, Germany, 11–15 July 2016; pp. 368–376. [Google Scholar]
  14. AMIRA International. ARD Test Handbook: Prediction & Kinetic Control of Acid Mine Drainage, AMIRA P387A; Ian Wark Research Institute and Environmental Geochemistry International Ltd.: Melbourne, Australia, 2002. [Google Scholar]
  15. Matsumoto, S.; Ishimatsu, H.; Shimada, H.; Sasaoka, T.; Matsui, K.; Kusuma, G.J. Prevention of acid mine drainage (AMD) by using sulfur-bearing rocks for a cover layer in a dry cover system in view of the form of sulfur. J. Pol. Miner. Eng. Soc. 2015, 36, 29–35. [Google Scholar]
  16. Vithana, C.L.; Sullivan, L.A.; Bush, R.T.; Burton, E.D. Acidity fractions in acid sulfate soils and sediments: Contributions of schwertmannite and jarosite. Soil Res. 2013, 51, 203–214. [Google Scholar] [CrossRef]
  17. Stewart, W.A.; Miller, S.D.; Smart, R. Advances in Acid Rock Drainage (ARD) Characterisation of Mine Wastes. In Proceedings of the 7th International Conference on Acid Rock Drainage (ICARD), St. Louis, MO, USA, 26–30 March 2006; pp. 2098–2119. [Google Scholar]
  18. Dold, B. Acid rock drainage prediction: A critical review. J. Geochem. Explor. 2017, 172, 120–132. [Google Scholar] [CrossRef]
  19. Pope, J.; Weber, P.; Mackenzie, A.; Newman, N.; Rait, R. Correlation of acid base accounting characteristics with the geology of commonly mined coal measures, West Coast and Southland, New Zealand. N. Z. J. Geol. Geophys. 2010, 53, 153–166. [Google Scholar] [CrossRef]
  20. Skousen, J.G.; Renton, J.; Brown, H.; Evans, P.; Leavitt, B.; Brady, K.; Cohen, L.; Ziemkiewicz, P. Neutralization potential of overburden samples containing siderite. J. Environ. Qual. 1997, 26, 673–681. [Google Scholar] [CrossRef]
  21. Gottlieb, P.; Wilkie, G.J.; Sutherland, D.N.; Ho-Tun, E.; Suthers, S.; Perera, K.; Jenkins, B.; Spencer, S.; Butcher, A.; Rayner, J. Using quantitative electron microscopy for process mineralogy applications. JOM 2000, 52, 24–25. [Google Scholar] [CrossRef]
  22. Charles, J.C.; Barnes, A.; Declerq, J.; Warrender, R.; Brough, C.; Bowell, R.J. Difficulties of interpretation of NAG test results on net neutralizing mine wastes: Initial observations of elevated pH conditions and theory of CO2 disequilibrium. In Proceedings of the IMWA2015 Annual Conference, Santiago, Chile, 21–24 April 2015; pp. 1–10. [Google Scholar]
  23. Schumann, R.; Stewart, W.; Miller, S.; Kawashima, N.; Li, J.; Smart, R. Acid-base accounting assessment of mine wastes using the chromium reducible sulfur method. Sci. Total Environ. 2012, 424, 289–296. [Google Scholar] [CrossRef] [PubMed]
  24. Qian, G.; Schumann, R.C.; Li, J.; Short, M.D.; Fan, R.; Li, Y.; Kawashima, N.; Zhou, Y.; Smart, R.S.C.; Gerson, A.R. Strategies for reduced acid and metalliferous drainage by pyrite surface passivation. Minerals 2017, 7, 42. [Google Scholar] [CrossRef]
  25. Dold, B.; Fontboté, L. Element cycling and secondary mineralogy in porphyry copper tailings as a function of climate, primary mineralogy, and mineral processing. J. Geochem. Explor. 2001, 74, 3–55. [Google Scholar] [CrossRef]
  26. White, W.W., III; Lapakko, K.A.; Cox, R.L. Static-test methods most commonly used to predict acid mine drainage: Practical guidelines for use and interpretation. In The Environmental Geochemistry of Ore Deposits. Part A: Processes, Techniques, and Health Issues; Reviews in Economic Geology; Plumlee, G.S., Logsdon, M.J., Eds.; Society of Economic Geologists: Littleton, CO, USA, 1999; pp. 325–338. [Google Scholar]
  27. Sasaki, K.; Haga, T.; Hirajima, T.; Kurosawa, K.; Tsunekawa, M. Distribution and transition of heavy metals in mine tailing dumps. Mater. Trans. 2002, 43, 2778–2783. [Google Scholar] [CrossRef]
  28. Milliman, J.D.; Muller, G.; Forstner, F. Recent Sedimentary Carbonates: Part 1 Marine Carbonates; Springer-Verlag GmbH & Co., KG: Berlin/Heidelberg, Germany, 2012. [Google Scholar]
  29. Muller, G.; Gatsner, M. Chemical analysis. Neues Jahrbuch für Mineralogie Monatshefte 1971, 10, 466–469. [Google Scholar]
  30. Dold, B. Speciation of the most soluble phases in a sequential extraction procedure adapted for geochemical studies of copper sulfide mine waste. J. Geochem. Explor. 2003, 80, 55–68. [Google Scholar] [CrossRef]
  31. Dold, B.; Weibel, L. Biogeometallurgical pre-mining characterization of ore deposits: An approach to increase sustainability in the mining process. Environ. Sci. Pollut. Res. 2013, 20, 7777–7786. [Google Scholar] [CrossRef] [PubMed]
  32. DDK-TOA Corporation 2001–2018. Available online: https://www.toadkk.co.jp/english/product/useful/useful10.html (accessed on 30 August 2018).
  33. Shirley, D.A. High resolution X-ray photoelectron spectrum of the valence bands of gold. Phys. Rev. B 1972, 5, 4709–4714. [Google Scholar] [CrossRef]
  34. Matsumoto, S.; Shimada, H.; Sasaoka, T. Interaction between physical and chemical weathering of argillaceous rocks and the effects on the occurrence of acid mine drainage (AMD). Geosci. J. 2017, 21, 1–10. [Google Scholar] [CrossRef]
  35. Lawrence, R.W.; Poling, G.W.; Ritcey, G.M.; Marchant, P.B. Assessment of Predictive Methods for the Determination of AMD Potential in Mine Tailings and Waste Rock, Tailings and Effluent Management; Pergamon Press: Elmsford, NY, USA, 1989; pp. 317–331. [Google Scholar]
  36. Climate-Data. ORG Climate: Pasar Tanjung Enim. Available online: http://en.climate-data.org/location/570291/ (accessed on 26 June 2018).
  37. Miller, S.; Robertson, A.; Donahue, T. Advances in acid drainage prediction using the net acid generation (NAG) test. In Proceedings of the 4th International Conference on Acid Rock Drainage, Vancouver, BC, Canada, 31 May–6 June 1997; pp. 533–549. [Google Scholar]
  38. Lamas, F.; Irigaray, C.; Oteo, C.; Chacon, J. Selection of the most appropriate method to determine the carbonate content for engineering purposes with particular regard to marls. Eng. Geol. 2005, 81, 32–41. [Google Scholar] [CrossRef]
  39. Liu, Y.; Che, D.; Xu, T. X-ray photoelectron spectroscopy determination of the forms of sulfur in coal and its chars. J. Xian Jiaotong Univ. 2004, 38, 101–104. [Google Scholar]
  40. Frost, D.C.; Leeder, W.R.; Tapping, R.L. X-ray photoelectron spectroscopic investigation of coal. Fuel 1974, 53, 206–211. [Google Scholar] [CrossRef]
  41. Kelemen, S.R.; George, G.N.; Gorbaty, M.L. Direct determination and quantification of sulfur forms in heavy petroleum and coals. part I: The X-ray photoelectron spectroscopy (XPS) approach. Fuel Chem. Div. Am. Chem. Soc. 1989, 34, 729–737. [Google Scholar]
Figure 1. Schematic of the leaching test.
Minerals 08 00403 g001
Figure 2. Sample X-ray diffraction (XRD) patterns. Ill: Illite, Ka: Kaolinite, Qz: Quartz, Ja: Jarosite, Py: Pyrite, Al: Albite, Si: Siderite, and Mu: Muscovite.
Minerals 08 00403 g002
Figure 3. (a) Changes in pH over the 40 leaching cycles during the leaching test; (b) changes in pH without sample G.
Minerals 08 00403 g003
Figure 4. Changes in (a) electrical conductivity (EC) and (b) electric potential of the normal hydrogen electrode (Eh) over the 40 leaching cycles during the leaching test.
Minerals 08 00403 g004
Figure 5. Changes in pH with the addition of HCl during the acid buffering characteristic curve (ABCC) test.
Minerals 08 00403 g005
Figure 6. Integrated concentrations of dissolved (a) SO42 and (b) Ca2+ over 20 leaching cycles.
Minerals 08 00403 g006
Figure 7. Proportion of sulfide and sulfate in all samples calculated based on sequential acid extraction results: calculated via the ratio of the amount of sulfur in the HCl and HNO3 extraction stages to total sulfur.
Minerals 08 00403 g007
Figure 8. X-ray photoelectron (XP)-spectra of (a) C 1s and (b) S 2p for samples A and D. The binding energy is corrected using EB [C 1sA] from hydrocarbon = 284.6 eV. Peak a of C 1s corresponds to 284.6 eV, peak b of S 2p3/2 corresponds to 168.5 eV, and peak c of S 2p3/2 corresponds to 163.2 eV.
Minerals 08 00403 g008
Figure 9. Proportion of the total amount of dissolved sulfur for the first five leaching cycles in the leaching test. The proportion is calculated based on the ratio of the total dissolved sulfur during the first five leaching cycles to the amount over 40 leaching cycles.
Minerals 08 00403 g009
Table 1. Summary of the sulfur content, and results of the acid–base accounting (ABA), net acid generating (NAG), paste pH, and Bernard calcimeter tests. AP: acid potential, ANC: acid neutralizing capacity, NAPP: net acid producing potential, NAG pH: net acid generating pH.
SampleSulfur (%)AP (kg H2SO4/ton)ANC (kg H2SO4/ton)NAPP (kg H2SO4/ton)Paste pHNAG pHCarbonate (%)
A0.8927.40.027.43.102.800.50
B0.7723.520.33.22.822.281.58
C12.55383.90.0383.91.211.040.23
D4.99152.80.0152.81.741.470.30
E25.46779.12.5776.61.241.080.38
F5.67173.53.7169.84.802.900.24
G0.9328.79.219.66.164.370.29
Table 2. Changes in NAG pH during the sequential NAG test.
Sample/Stage1234567
A2.653.494.204.354.65--
B2.282.813.343.814.124.224.31
C2.012.642.943.383.714.004.07
D2.142.772.792.883.283.773.95
E1.661.871.812.012.302.833.21
F2.412.843.053.664.024.224.12
G2.813.393.864.214.53--

