Article

Authigenic Clay Minerals from Interface Reactions of Concrete-Clay Engineered Barriers: A New Perspective on Mg-Clays Formation in Alkaline Environments

1
Department of Geology and Geochemistry, Faculty of Sciences, Autonomous University of Madrid, Cantoblanco, 28049 Madrid, Spain
2
Environmental Applied Geology Unit. CIEMAT. Av. Complutense 40, 28040 Madrid, Spain
*
Author to whom correspondence should be addressed.
Minerals 2018, 8(9), 362; https://doi.org/10.3390/min8090362
Submission received: 15 July 2018 / Revised: 1 August 2018 / Accepted: 17 August 2018 / Published: 21 August 2018
(This article belongs to the Special Issue Authigenic Clay Minerals: Mineralogy, Geochemistry and Applications)

Abstract

:
Artificial and singular geochemical environments are created around the engineered barrier systems (EBS) designed to isolate high level nuclear wastes in deep geological repositories. A concrete-bentonite interface takes place within the EBS and it builds a significant chemical gradient (pH), approximately from pH 8 (bentonite) to pH 12 (low alkali concrete), in a few millimetre thickness. This disequilibrium triggers dissolution and precipitation reactions and form a thin altered region. In this area, poorly ordered authigenic clay minerals, mainly hydrated magnesium silicates, are formed adjacent to hydrated calcium silicates and calcite precipitates adhered to the interface with concrete. This paper presents the development of this authigenic mineral layer comparing 6–18 months to 13 years interfaces. Scanning Electron Microscopy with Energy Dispersive X-ray spectroscopy (SEM-EDX) morphological and chemical characterization with the aid of ternary plots, X-ray diffraction (XRD) and infrared (IR) data show the young to old interface evolution from single brucite layers to stevensite-saponite silicates composition. Geochemical calculations indicate that this layer acts as a pH~11 buffer useful to minimize bentonite alteration and to favour the retention of amphoteric metal ions.

1. Introduction

Deep geological repositories (DGR) are actually the available solution for the long-term storage of high-level radioactive waste (HLRW) [1]. The waste will be isolated from the biosphere by a system of engineered and natural barriers. The engineered barrier system (EBS) usually consist of a cylindrical metal canister containing the waste, surrounded by a compacted bentonite clay barrier. The host rock, where access galleries are excavated, will need concrete for mechanical support of the walls in clay rock formations or concrete plugs in crystalline rock formations. Concrete is also necessary to seal the excavation accesses and to maintain the swelling pressure of the hydrated bentonite backfill inside the galleries. DGR would gain confidence according to complementary multi-scale analysis and characterization carried out after the dismantling of short-term laboratory tests (months-years) and long-term (10–30 years) in-situ simulated experiments.
In terms of water chemistry one of the major chemical gradients in the EBS system is placed at the concrete interfaces. FEBEX bentonite porewater is moderately saline (~0.3 M NaCl; pH~8 type (Na-Mg-Ca-Cl-SO4-HCO3) [2], whereas the pH of ordinary Portland cement (OPC)-type concrete porewater is 13–12, depending on the alkali (Na, K-OH) content. The pH varies from 12.6 to ~11.0 when portlandite (Ca(OH)2) and high Ca/Si (1.6–1.2) calcium silicates hydrates (C-S-H) suffer congruent and incongruent dissolution, respectively, to form low Ca/Si (1.0–0.5) C-S-H minerals [3]. Calcite also precipitates, as far as soluble inorganic carbon species are always present in the bentonite porewater or in the rock groundwater environments [4,5]. Then, the pH gradient produces an alkaline front with the capacity to partially alter the mineralogy of both, the bentonite [6,7] and the concrete [8,9].
The formation of a Mg enriched zone within the concrete-clay interface, characterized by the formation of Mg-silicates hydrates (M-S-H), is known as Mg-perturbation. It has been recognized elsewhere when clay rocks or compacted bentonite are held in contact with solid cementitious materials [8,10,11,12,13,14]. Usually, the source of Mg comes from the bentonite exchange complex or through the dissolution of Mg minerals in the concrete (i.e., brucite) or in the clay rocks (dolomite, serpentine, chlorite). The nature of these M-S-H neogenic phases reveals similar structural properties to that of 2:1 and 1:1 magnesium sheet silicates [15,16]. Their precise crystal-chemical nature is very difficult to characterize because they are poorly ordered and mixed with the present assemblage of phyllosilicates. Nevertheless, what we know from their synthesis in the laboratory is that they are very limited to form solid solutions with C-S-H phases and precipitates as separate phases, containing very small amounts of Ca [17,18,19].
A feasible approach to understand the nature of the Mg-perturbation and to extract information on the long-term evolution of the above mentioned EBS interfaces is to analyse natural analogues. In fact, alkaline-lakes authigenic environments have been used to validate the mineral evolution linked to alkaline alteration, presumed to take place in concrete-clay environments [20].
Precipitation of hydrated magnesium silicates, mainly Mg (and Fe(II)) trioctahedral smectites, sepiolite and palygorskite, is recognized as key geochemical tracer in very different surface environments, all located in arid to semiarid evaporative continental basins [21,22,23,24] or in special environments localized in altered basic volcanic rocks, either in the Earth or in Mars [25,26]. Relative high ratios Si/Mg clays, such as palygorskite and sepiolite, form in low salinity near neutral pH conditions, whereas smectites (intermediate Mg/Si kerolite-stevensite to saponite) may form in moderate saline high pH (>9) local environments [27], being stevensite (smectite with octahedral vacancies) or saponite (if soluble Al is available) favoured at higher pH (>9.5) [27,28,29]. The highest salinities and moderate pH will favour, beyond the chemical divide (predominance of sulphate and chloride-rich brines), the formation of talc, chlorite and serpentine minerals [30].
The FEBEX project was a remarkable experiment performed in the underground research laboratory (URL), located at the Grimsel test site in Switzerland. It was based on the Spanish reference concept for disposal of HLRW in crystalline rock [31]. Two cylindrical heaters were maintained at a constant temperature of 100 °C at their surface, facing an annulus of compacted bentonite that filled the gap towards the granitic wall. A concrete plug was applied to seal the drift end. The operational stage started in 1997. In 2002, after five years of operation, one of the heaters was switched off and dismantled, along with the surrounding bentonite. A concrete plug was made by a shotcrete technology to seal the remaining part of the experiment. The experiment was definitively dismantled in 2015. The 13 years (2002–2015) concrete-bentonite interface is one of the focus of this study. It is a small piece of a global and exhaustive characterization work (FEBEX-DP and part of CEBAMA UE project) attempting to describe the microstructural and geochemical perturbation produced in the reaction of concrete and bentonite. Complementary within these studies, small short-term laboratory tests, including bentonite-cement mortar reactive surface interfaces, have been carried out in order to compare the geochemical evolution at different time scales [32].
The present paper will address the production, in both short-term laboratory tests and in situ real simulation scenario, of authigenic poorly crystalline phases, magnesium silicates hydrates (M-S-H). The main purpose is to improve the identification of their chemical compositions and to validate their meaning by using a thermochemical analysis support. The aim of the study is to relate their formation to the evolution of the interface reactivity of the concrete-bentonite system from micro to macro experiments. The texture and morphology of the Mg-enriched regions and the crystal-chemical trends are used to ascertain what could be the direction of the Mg-perturbation progress over space and time-scales. The properties and safety role of the formation of these phases, related to the DGR is also envisaged.

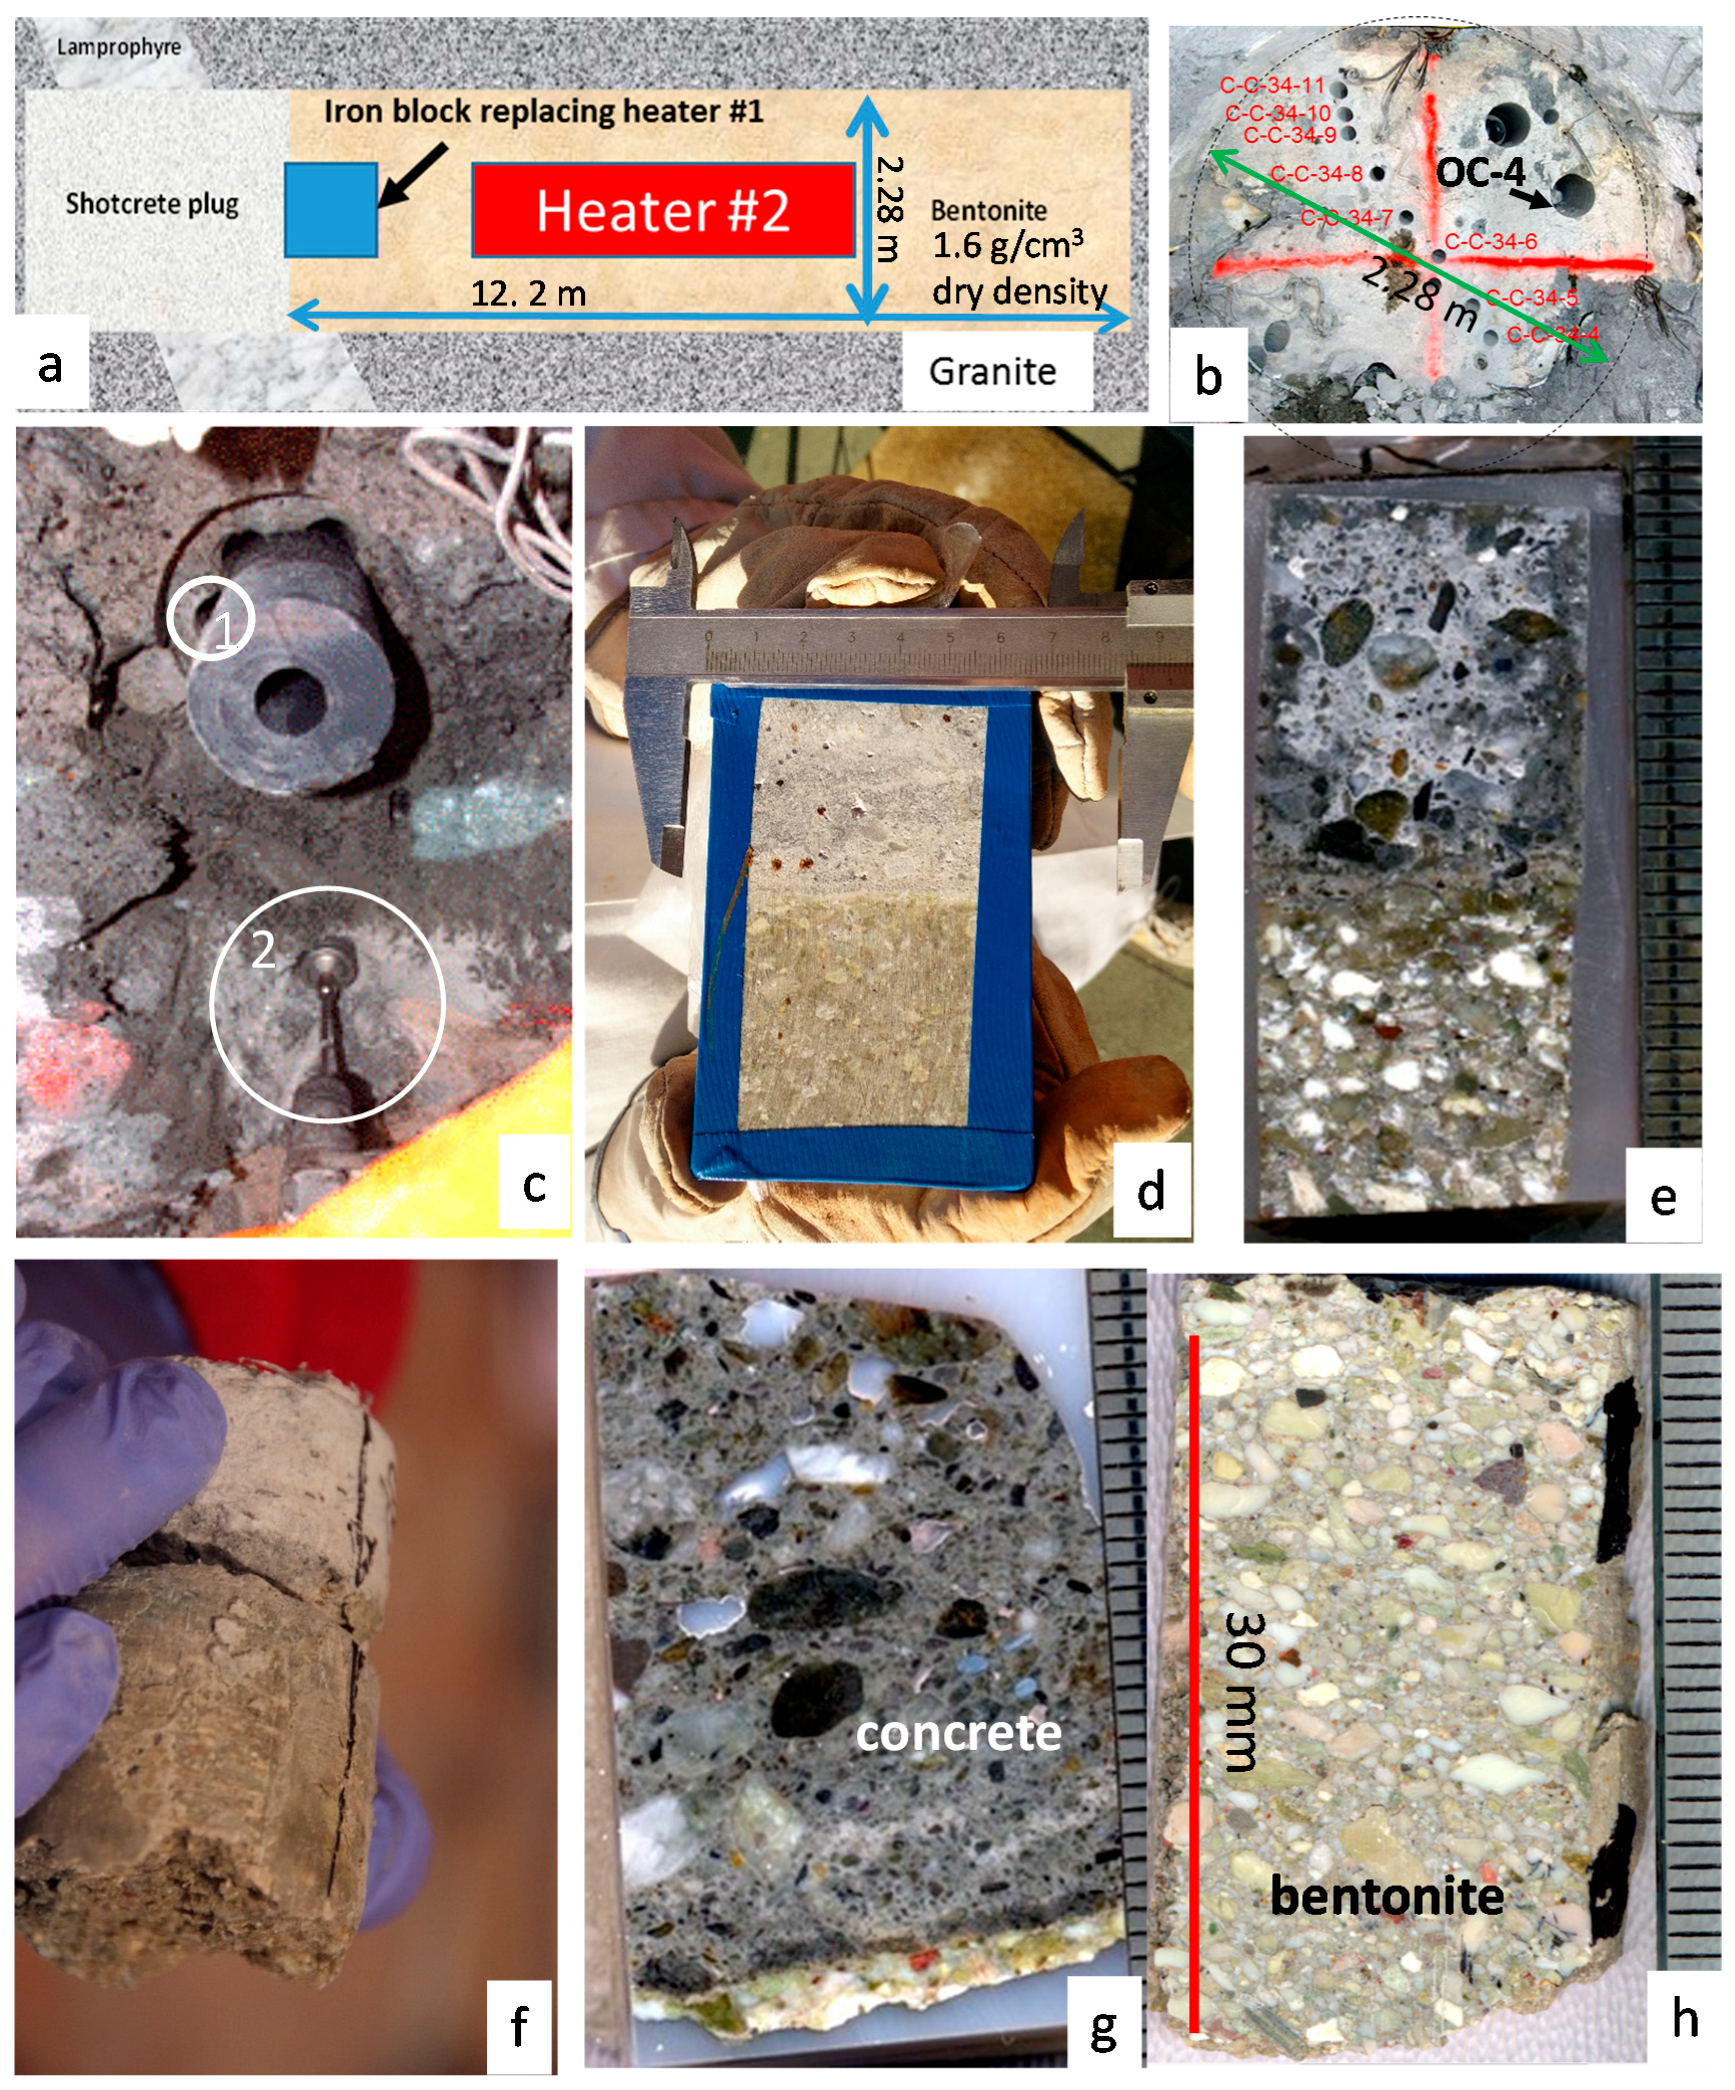
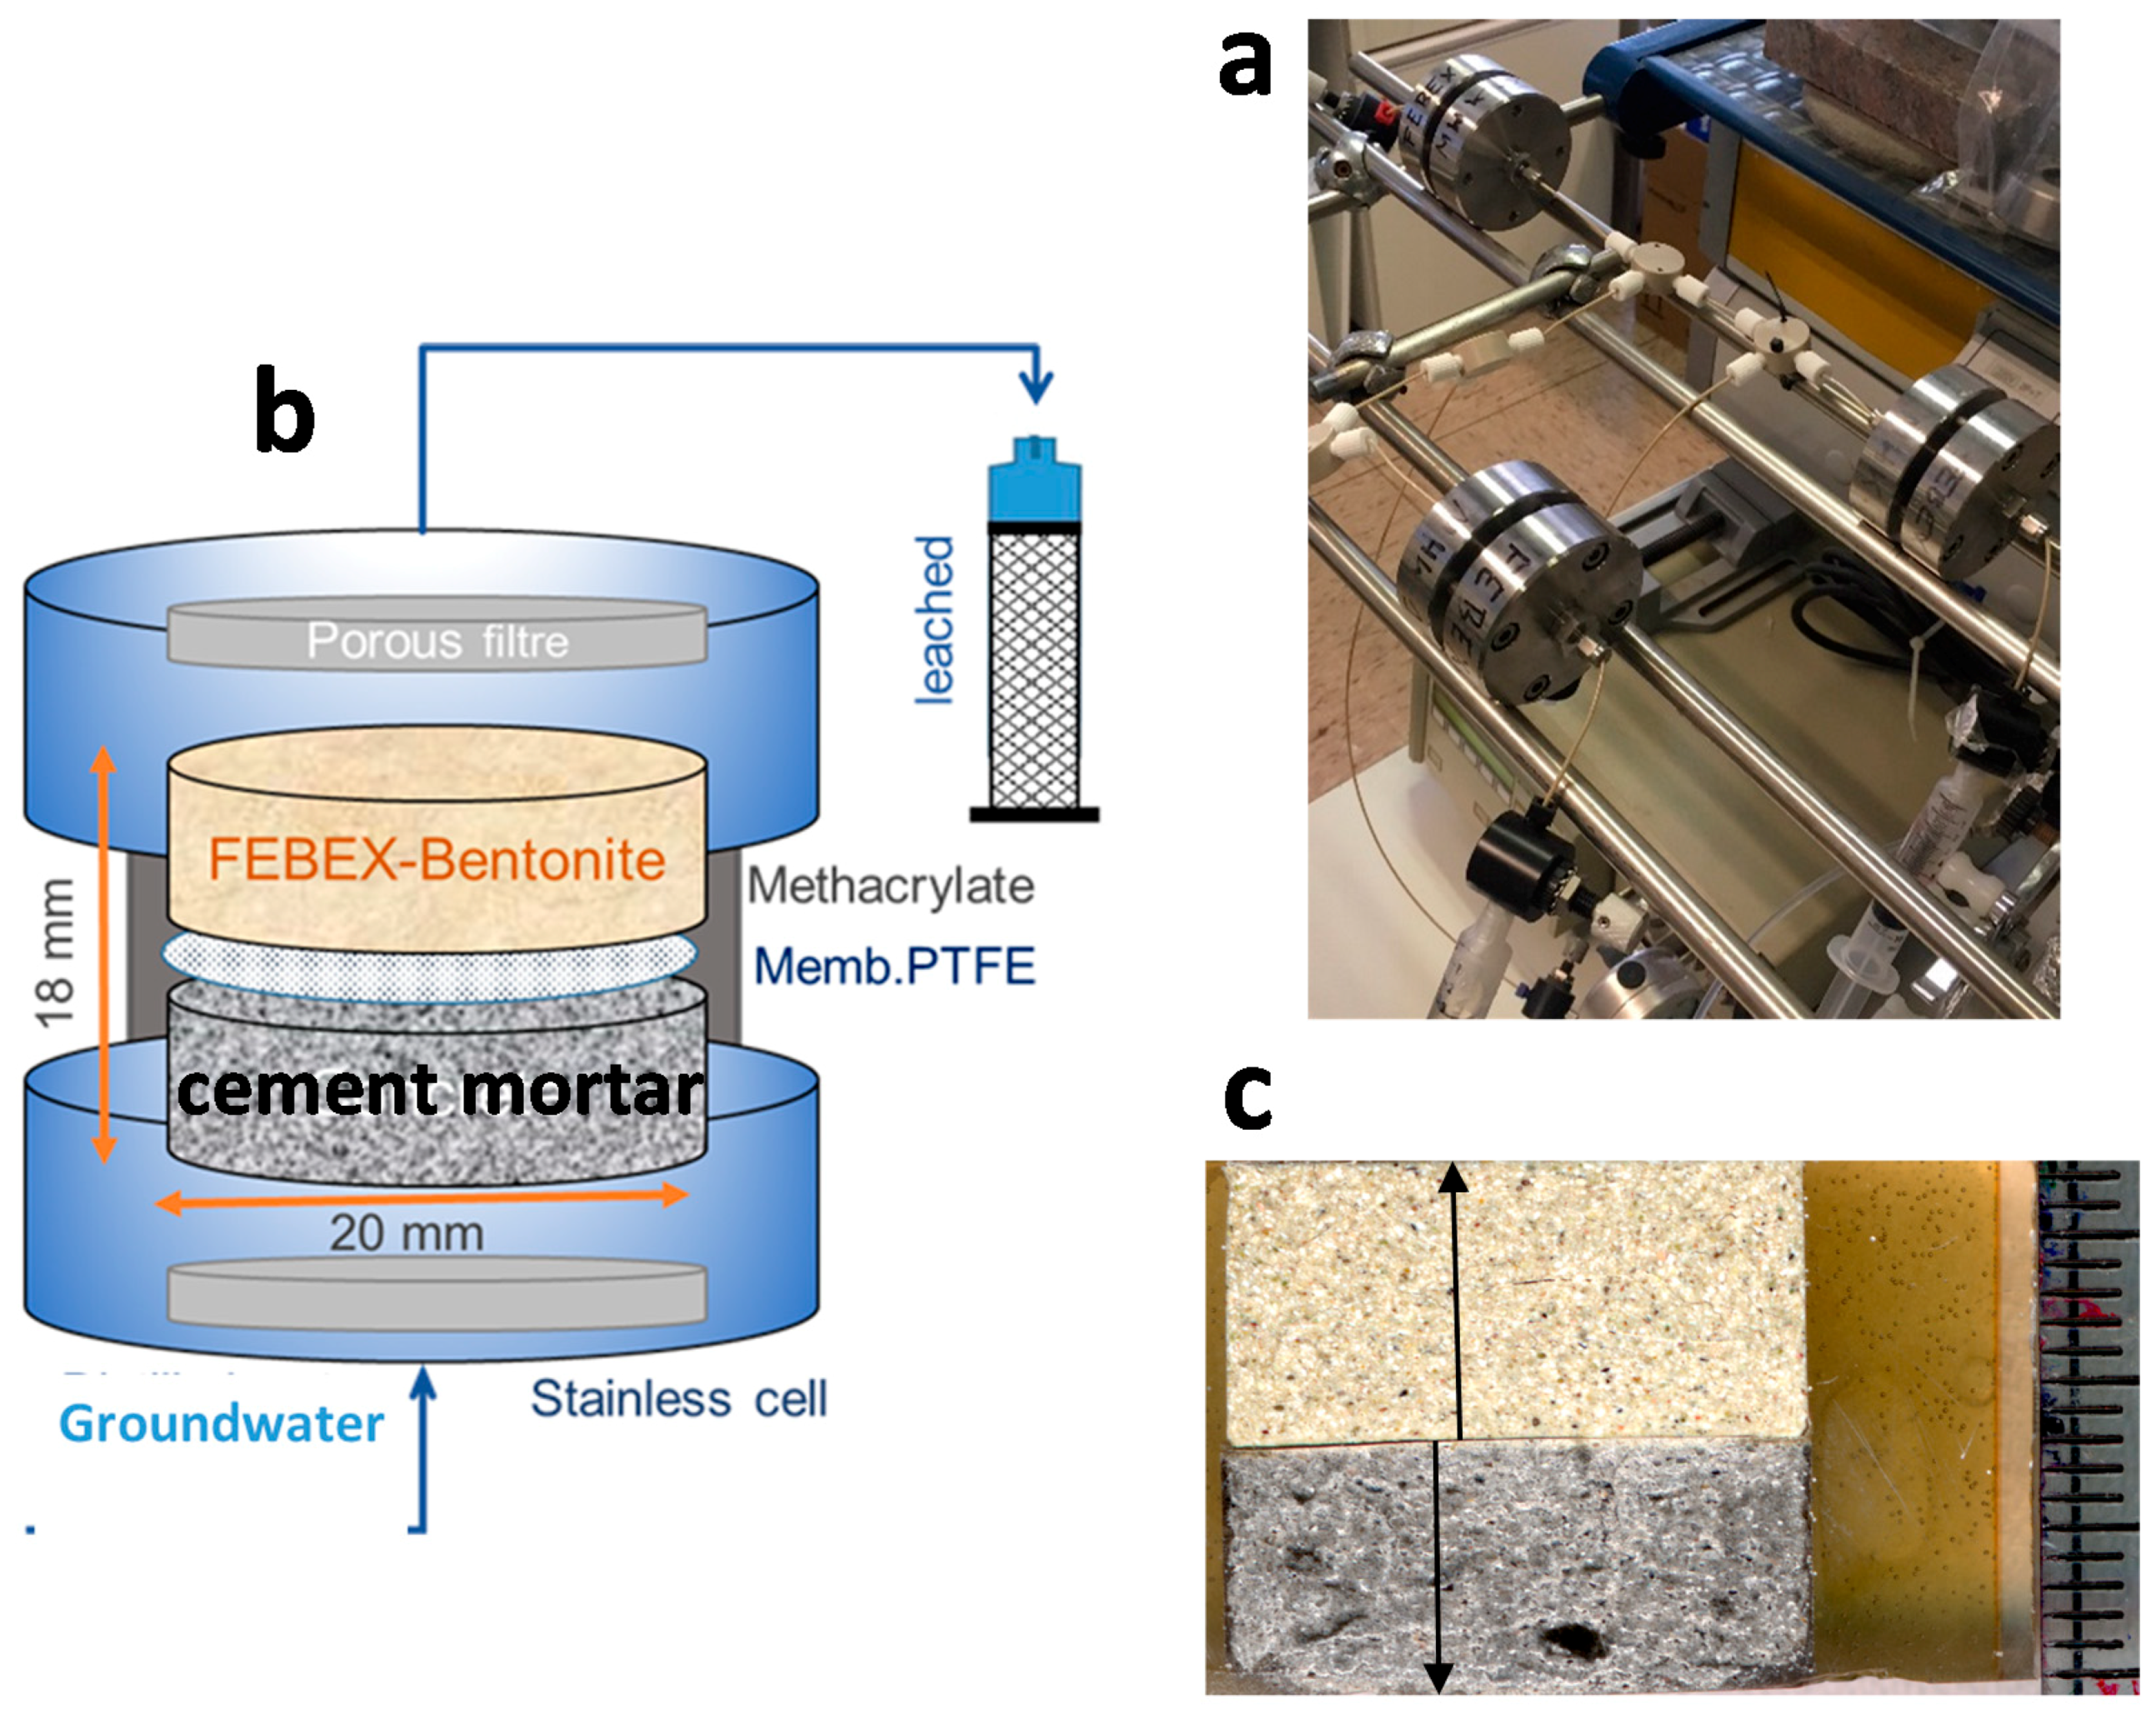
2. Materials and Methods

Two testing scenarios have been studied. In situ concrete-bentonite interfaces, taken during the dismantling of the FEBEX tunnel at the Grimsel Test Site (GTS), represents a 13 years aged interface at 30–28 °C [30,33] within a 50 m3 experiment (10 m3 of concrete plug and 40 m3 of heated bentonite) hosted in a granitic rock (Figure 1a). The second scenario consists of groundwater infiltration experiments through cylindrical cement mortars (2 cm in diameter and 1 cm length, CEM-II-A-L cement paste; 1 cement + 3 quartz sand, 0.7 water/cement ratio) in contact with compacted bentonite (2 cm in diameter and 0.8 cm length column) at ambient temperature (20 ± 3 °C), during 6 and 18 months (Figure 2a–c). The experiment represents a micro scenario at the interface scale in 5.5 cm3 (3 cm3 of cement mortar and 2.5 cm3 of bentonite). Bentonite dry density was near 1.6 g/cm3 in all of the studied interfaces. Details on experiments setups have been described previously [13,32]. Cement material/bentonite volume ratio increased from macro to micro scenarios. Thus, small scale lab tests represent more specifically the interface location apart from large scale geochemical interactions.
Block samples containing interfaces were prepared to preserve the contacts and textural characteristics of the materials. Three types of interface blocks were obtained for the in-situ experiment. First, unaltered bentonite/concrete contacts were obtained by a special overcoring technique [9]. Small diameter drillings (3 cm diameter and up to 3–4 m length; 1 in Figure 1c) were practiced around the desired core section and filled with a polymer for induration. Then the core drilling was able to capture the undisturbed contact (Figure 1b,d, OC-4 sample). Other bentonite/concrete contacts were obtained in situ during the demolition of the concrete plug (Figure 1b), when the bentonite front was visible (sample 35-3, detail of polished section in Figure 1g), or using a manual core tool through the concrete 5 cm after the bentonite contact, Figure 1c (lower part); samples 34-10 (Figure 1f, as extracted) and 34-12 (Figure 1h, bentonite cut polished section).
The lab experiments were designed to obtain the whole probe at the end of the experiment by cutting directly the methacrylate sleeve containing the sample (Figure 2b). The blocks were divided in subsamples using a cutting machine model Well® 2000 with a diamond wire saw. The number of subsamples and their size was determined by the quantity needed to carry out the post-mortem analyses. In this paper, we consider the longitudinal sections prepared for obtaining SEM-EDX chemical profiles and the material scrapped or directly observed in fresh surfaces taken form the first mm of bentonite in the cement contact. As far as in both scenarios Mg-perturbation is developed towards the compacter bentonite material, the paper is focused to study in detail the bentonite interface. The samples of preserved interfaces selected to perform chemical profiles were freeze dried in liquid nitrogen, dried in vacuum with P2O5 dehydrated atmosphere until 10−4 Pa and polished up to a 2500 grit sheet sandpaper.
The FEBEX bentonite was extracted from the Cortijo de Archidona deposit (Almería, Spain). The montmorillonite content of the FEBEX bentonite is above 90 wt % (92 ± 3%) and contains variable quantities of quartz (2 ± 1 wt %), plagioclase (3 ± 1 wt %), K-feldspar (traces), calcite (1 ± 0.5 wt %) and cristobalite-trydimite (2 ± 1 wt %) [34].
The composition of the shotcreted concrete plug was: CEM II-A-L 32.5R paste (430 kg/m3), water (170 kg/m3), nanosilica (30 kg/m3), aggregates 0–8 mm 1700 kg/m3, steel fibres (50 kg/m3), polypropylene fibres (800 g/m3) and superplasticizer, curing and accelerator compounds (<10% in cement weight). The first layer of the shotcrete (up to 2 cm thickness) rebounded, so additives were slightly re-adjusted [35]. Bulk mineralogy consists of quartz (40–30 wt %), calcite (30–20 wt %), plagioclase (albite, 15–10 wt %), orthoclase (10–5 wt %), etringite (10–5 wt %) and portlandite, biotite, muscovite and clinochlore (<5 wt %). The mineralogy is complex and it is not possible to ascertain the initial content of anhydrous cement phases or C-S-H. The CEM-II mortar, prepared for the laboratory experiment, was a commercially available CEM-II-A-L (Portland-Valderrivas Company, Madrid, Spain), composed of 10–15 wt % calcite and CEM-I paste (mainly tri-calcium silicate). The 1 + 3 cement paste + quartz sand mortar was mixed with distilled water (0.7 water/cement ratio) and cured during 28 days in a 100% relative humidity chamber.
Water composition changes in the small short-term laboratory tests are not discussed in this paper because the extremely low hydraulic conductivity (K < 1 × 10⁻¹³ m/s) permitted only to obtain less than 10 cm3 for chemical analysis. Measured pH was 8.5 and SiO2,aq < 10 mg/L characterized the available data but these data are not informative of the interface pore solutions since they are characteristic of the initial bentonite porewater. Then, for both laboratory and in situ interface experiments, porewater analysis has not been considered in the present study.
Scanning Electron Microscopy equipped with electron dispersive X-ray spectrometry (SEM-EDX) was used to identify mineral phases and morphology of neogenic crystal aggregates and to acquire chemical profiles to determine the spatial evolution of chemical perturbations. The equipment was a Hitachi S-3000N scanning electron microscope (Hitachi Ltd., Tokyo, Japan) coupled to an INCAx-sight Oxford Instruments™ energy dispersive X-ray analyser (Oxford Instruments, Oxon, UK). Elemental composition was typically measured in 10 µm length fields for the first 100 µm thickness, 100 µm length fields up to 1–2 mm and 500 µm length fields for larger distances. The EDX quantification was performed by means of internal standard semi-quantitative analyses. Semi-quantitative EDX elemental composition analysis was determined in rectangular or polygonal areas and then they represent millimetre width slices rather than punctual analysis. To evaluate the quality of these results, EDX spectra of a heterogeneous 300 × 200 µm2 area, typical of the analysis performed on the linear transect in the bentonite, were acquired using several integration times, from 10 to 80 s, at 5 s intervals. The percentage of deviation was calculated as 100 times the ratio of the standard deviation to the determined % chemical element value. For major elements (Al, Si), instrumental % deviations, obtained by taking their average value in the 30–50 s interval, were less than 10%, related to their concentration being lower for silicon (<1%) and higher for Al (9%). The % deviation from measured values, however, was less than 6% for the average measurement value. For elements that have contents within 1–5% (Mg, Ca, K, Fe), the percentage of deviation from the average of the measured values was typically 10–15%. Forty seconds was considered enough time to not compromise the analysis quality and to avoid excessively time-consuming data acquisition [32].
The chemical data are presented as chemical profiles or ternary plots in atomic proportions (% moles of element) in order to compare directly relative stoichiometric ratios needed to build crystal-chemical compositional representations. EDX C% is obtained with high uncertainty and we have calculated chemical data excluding C and O in order to work with the main cationic composition. As far as no measurements of porosity were acquired, data have to be taken as a relative increase or decrease of a specific element within the examined region. At least in the bentonite side studied, no microscopic evidence of changing porosity regarding compacted bentonite outside the interface was observed.
The bentonite interface material was characterized by random powder X-ray diffraction (XRD) of <0.5 mm scrapped material and also, in the case of the lab experiments surface, by means of grazing incidence X-ray diffraction (GI-XRD). XRD patterns were recorded in a θ/2θ X’Pert PANalytical instrument with an X’Celerator (Malvern Panalytical Ltd., Malvern, UK) in an angular range (°2θ) of 3–70°. This method allowed measurements equivalent to 0.016° angular steps for 100 s at each step. The voltage and intensity of the operated X-ray Cu tube were 45 kV and 40 mA, respectively. To perform the GI-XRD analyses, patterns were recorded on the exposed surface either with a 0.5° 2 θ fixed angle or performing a θ/2θ scan, both using 0.04° and 2 s of angular step and time step increases, respectively. Complementary, Fourier transform infrared spectrometry (FTIR) spectra of the interface samples were obtained using a Nicolet 6700 FTIR spectrometer (Thermo Fisher Scientific, Waltham, MA, USA) in transmission mode with a deuterated tri-glycine sulphate (DTGS) KBr detector and recording over the middle-IR region spectral range (4000–400 cm−1) with a resolution of 2 cm−1 in an atmosphere continuously purged from water and atmospheric CO2. For these analyses, 2 mg of bentonite was grinded in a Retsch RM200 mortar grinder with a pestle of agate and mixed with 100 mg of KBr.
PHREEQCi Interactive version 3.4.0 12927, developed after [36], was used to calculate solutions equilibration of mineral phases in alkaline environments from pH 8.5 to 12. geochemical database Thermoddem© [37] version 1.10 was used because it contains actualized data for C-A-S-H and M-S-H minerals.

3. Results

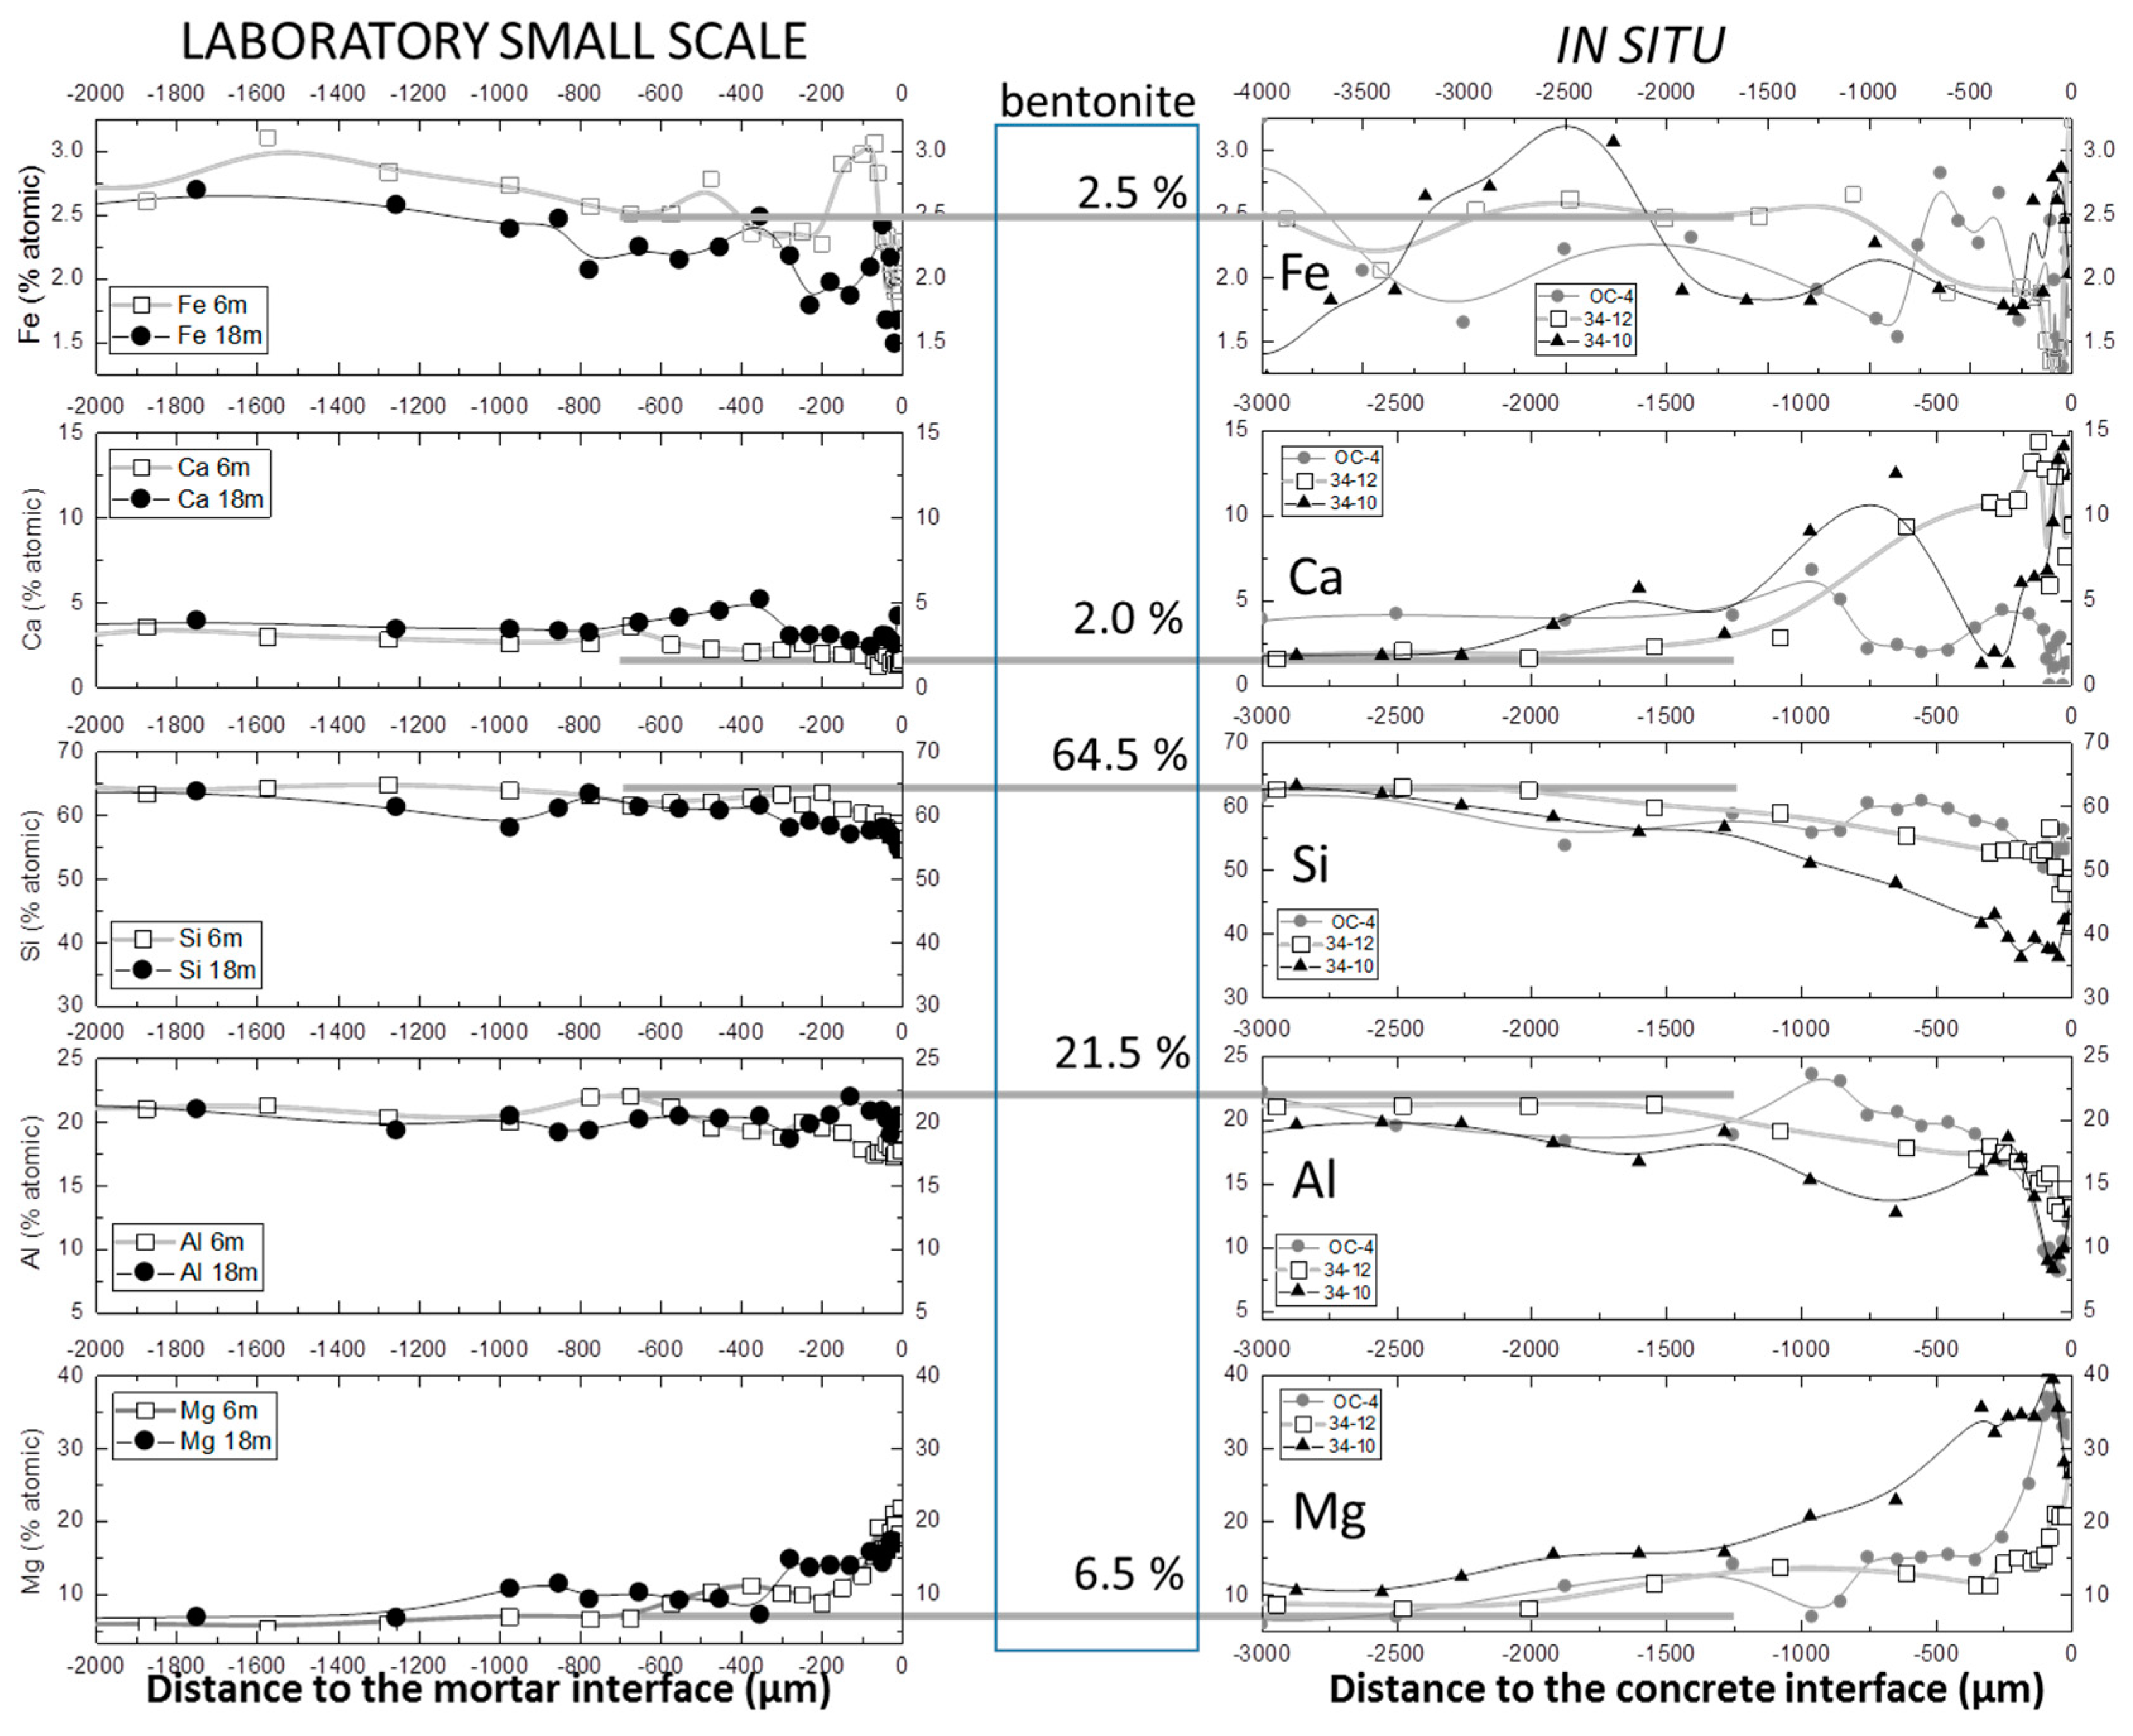
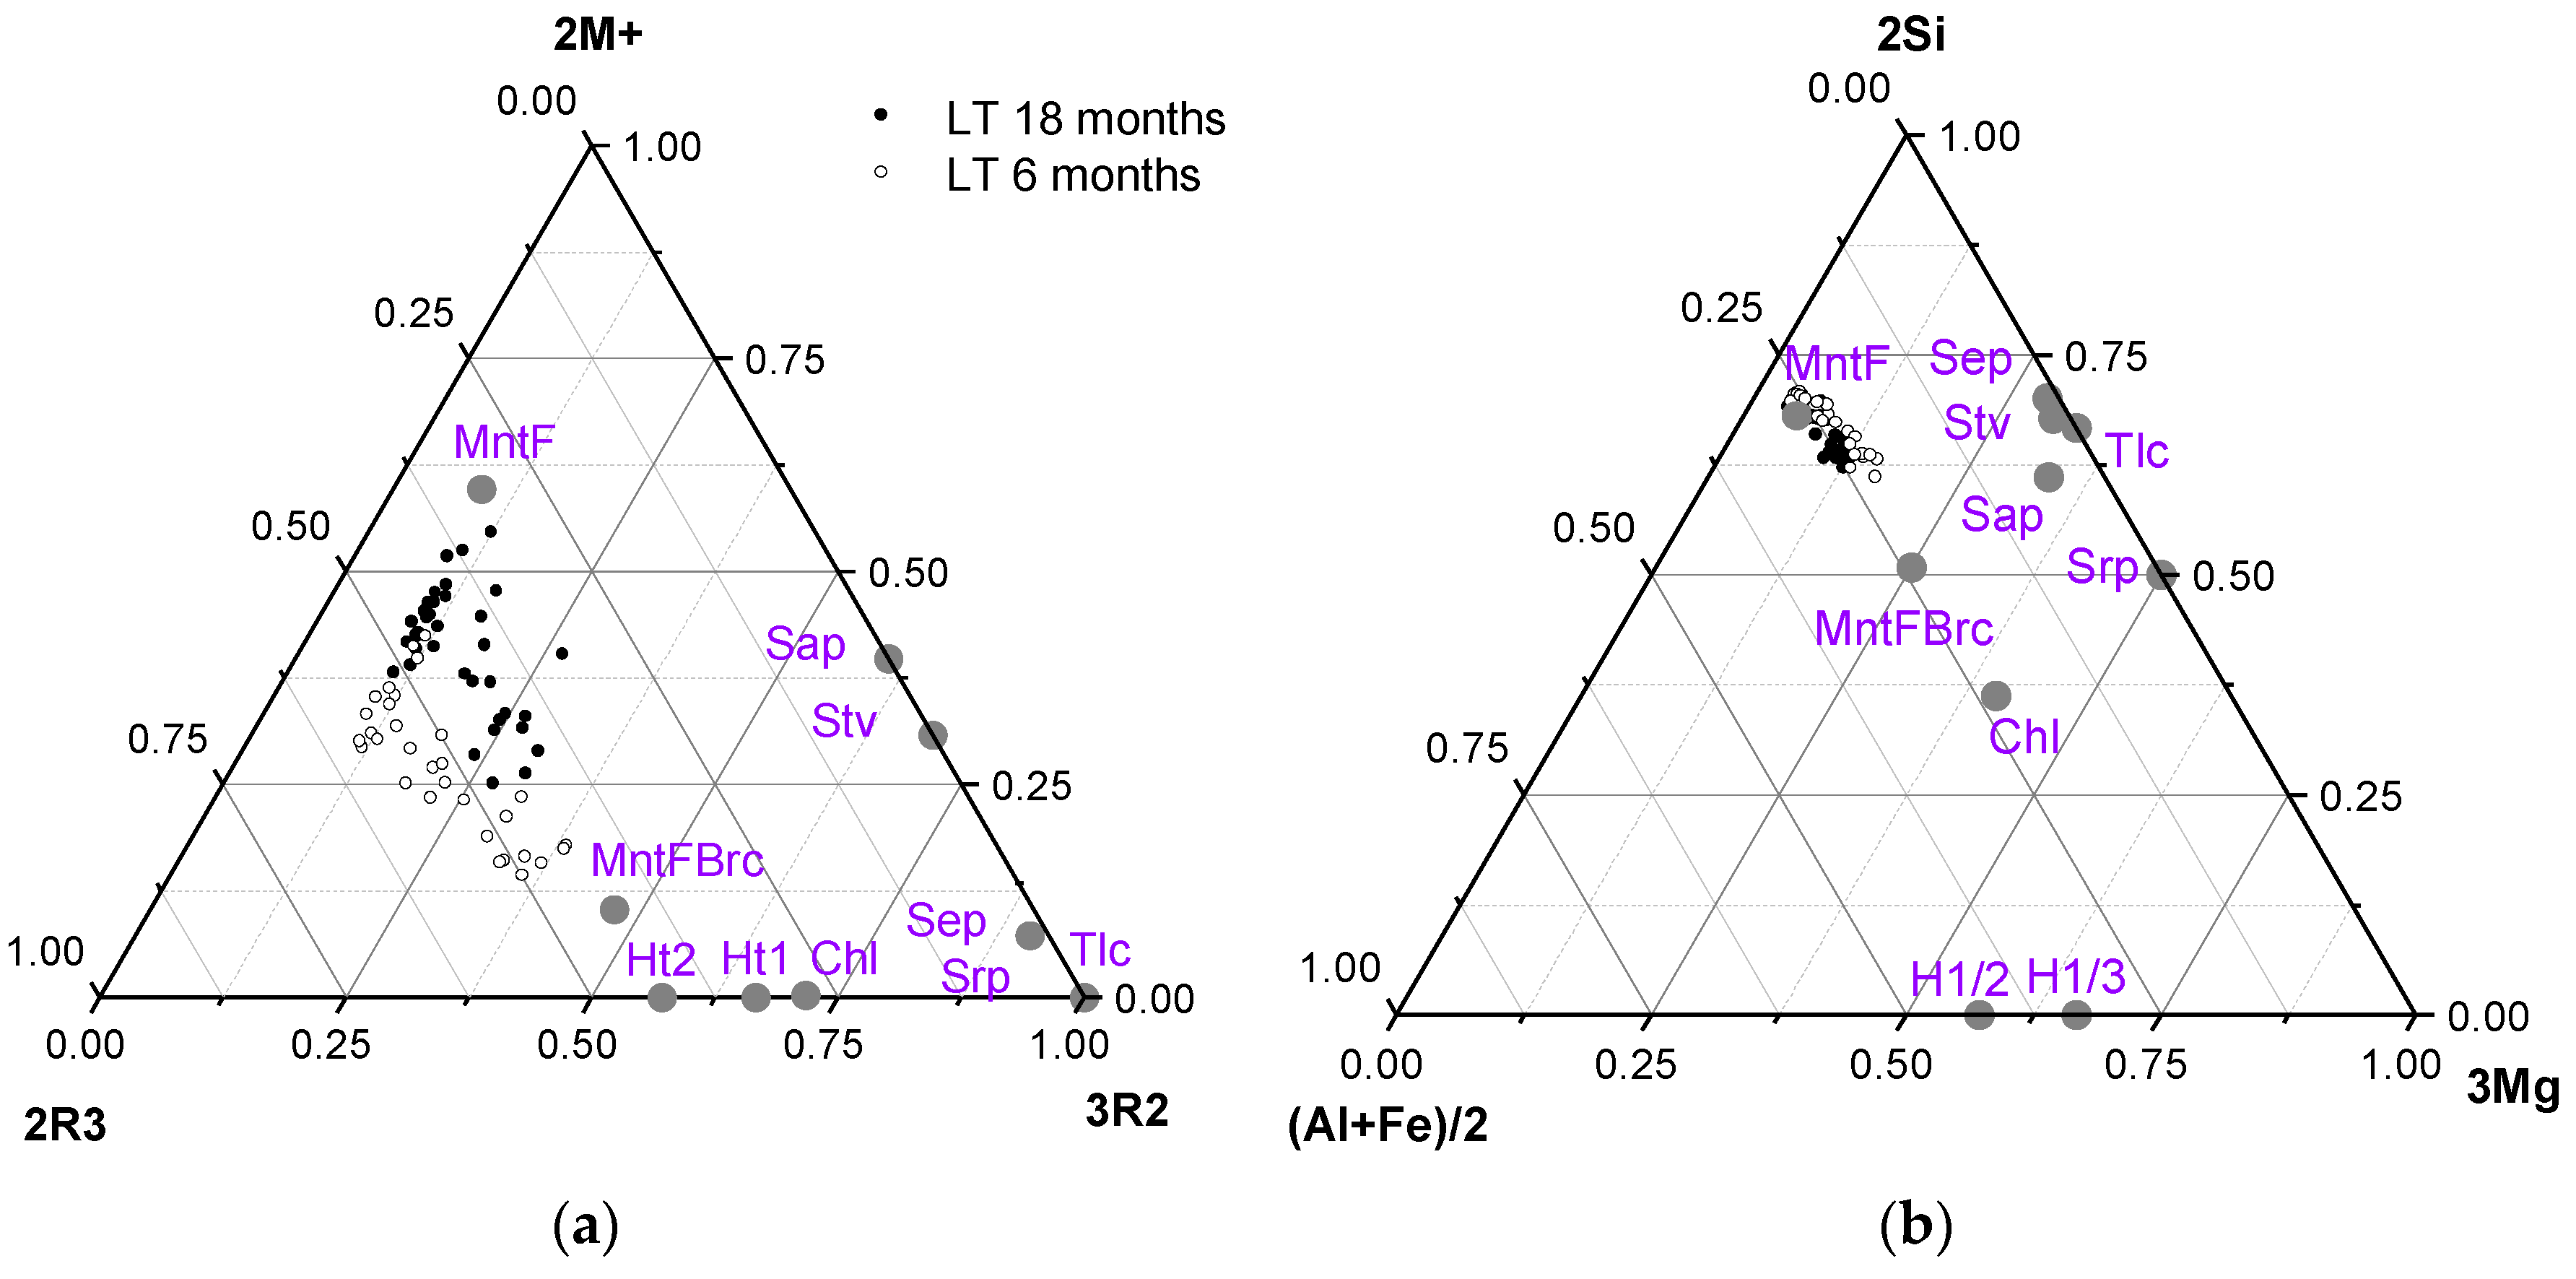
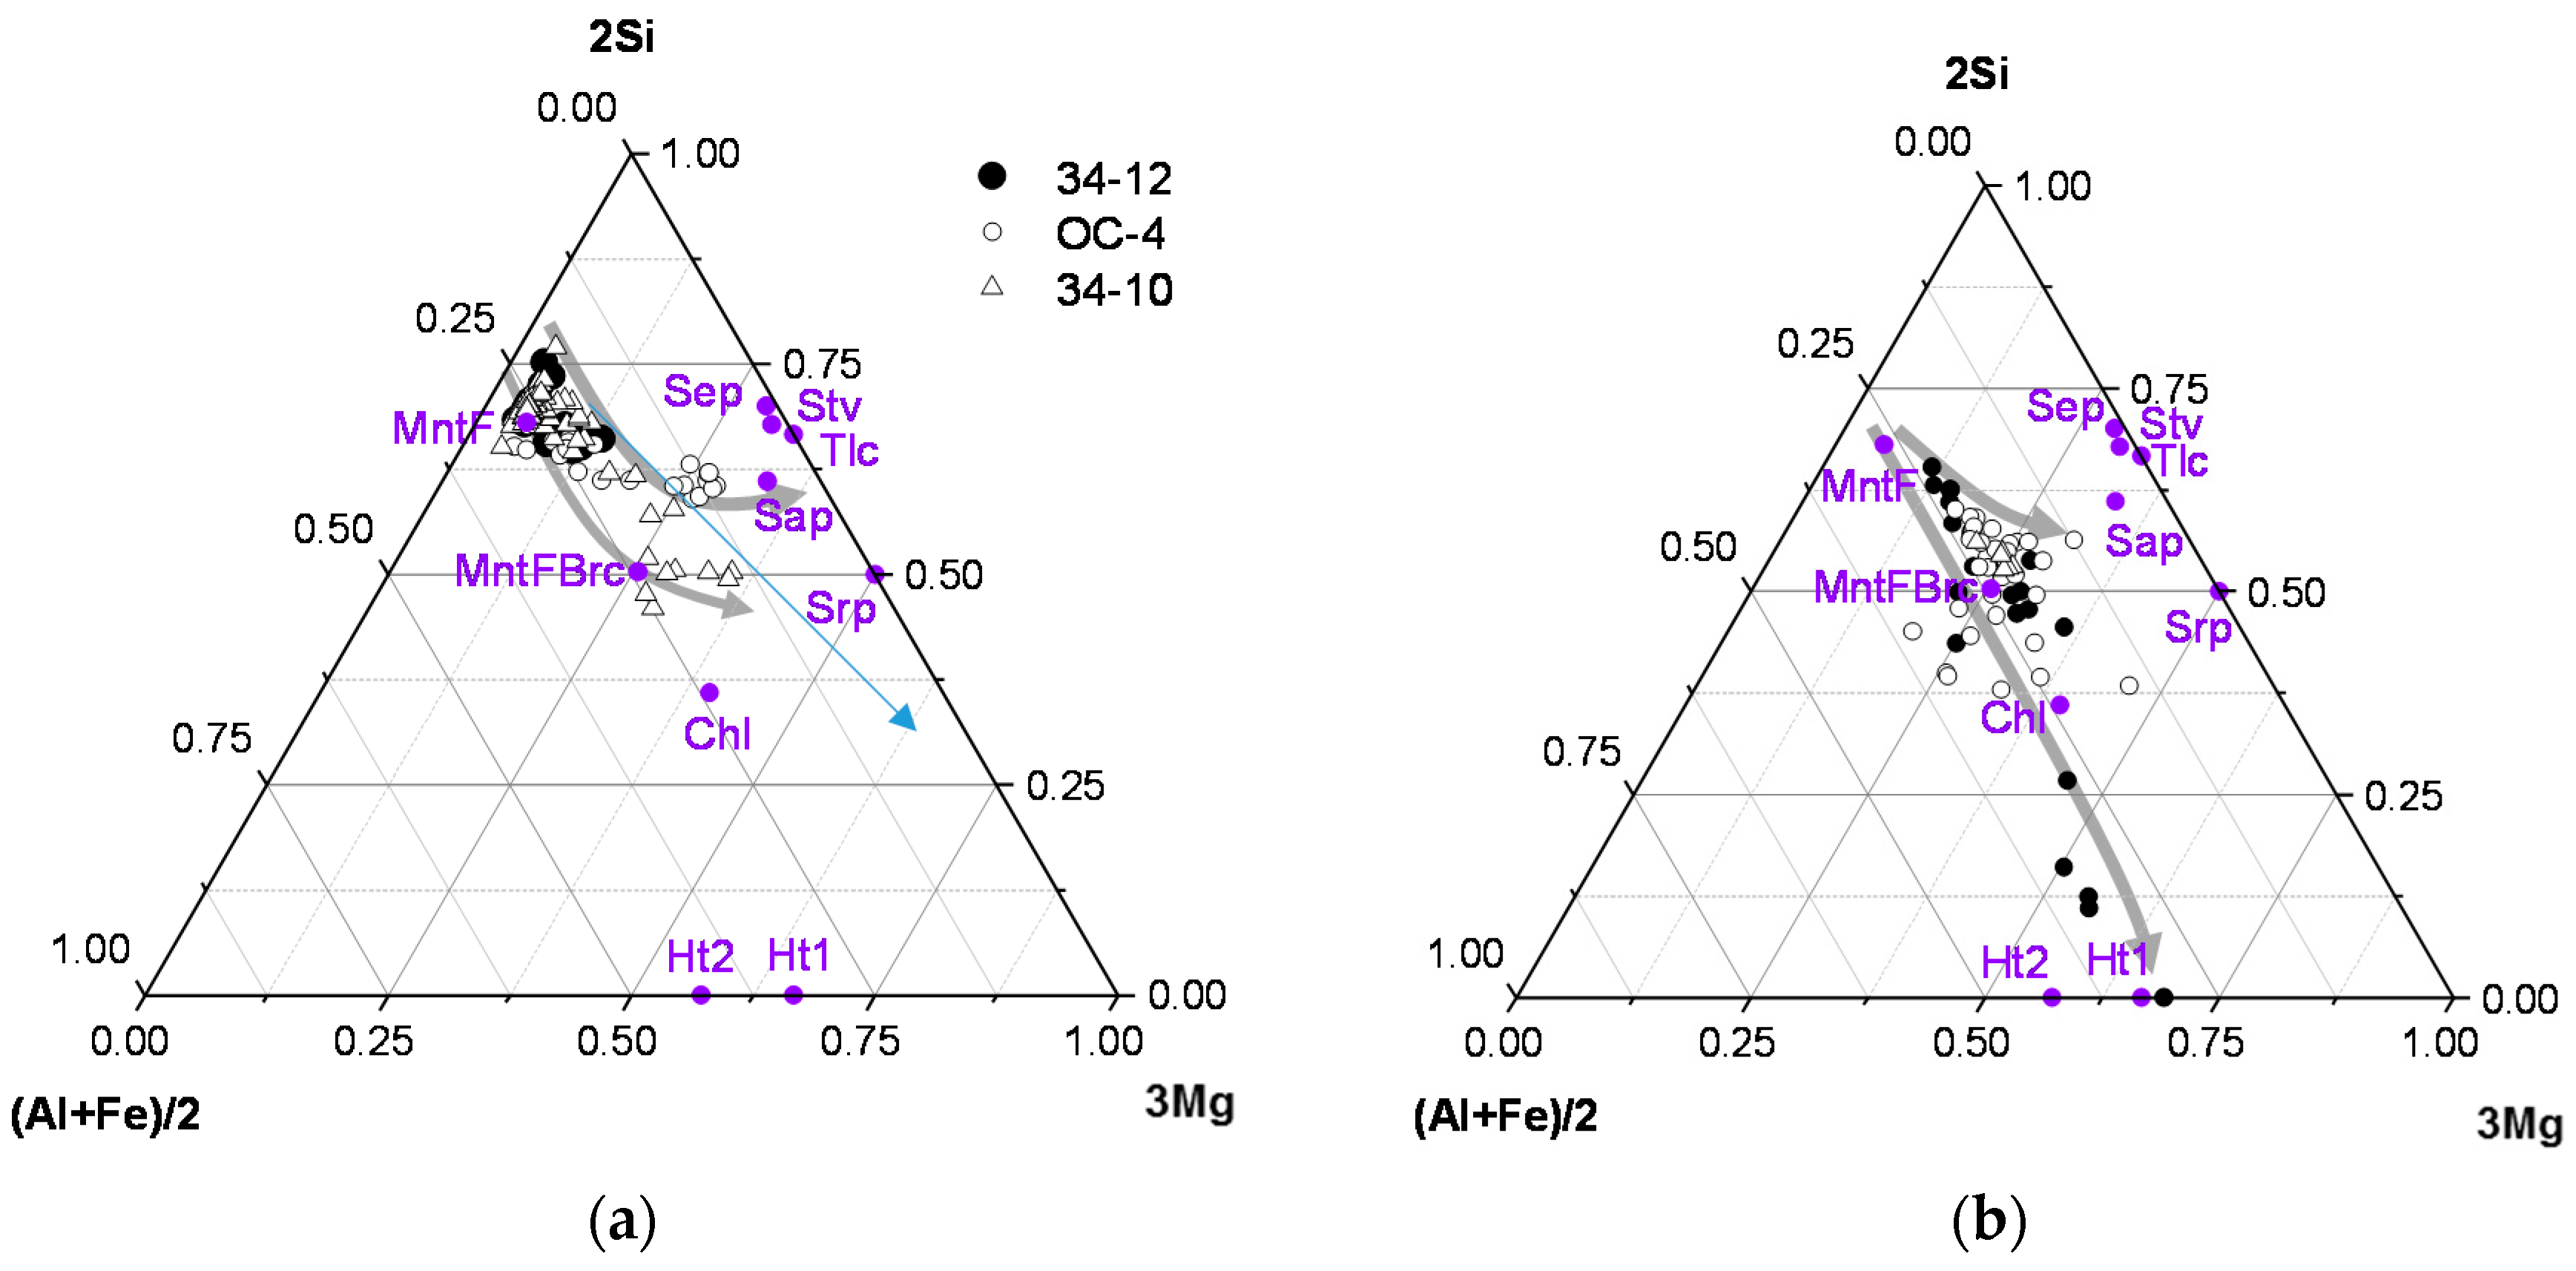
3.1. SEM-EDX Chemical Profiles

Chemical profiles (% atomic proportions) have been measured in the compacted bentonite as a function of the distance to the concrete interface, both for the laboratory (lab) small scale experiments (Figure 3 left) and the long term in situ experiments (Figure 3 right). The lab experiments show a time-evolution (6 to 18 months) in a 500 µm bentonite thickness where Ca enrichment (2% to 5%), Si depletion (65% to 55%) and a Mg enrichment (7% to 15%) are produced. Al and Fe seem to be depleted but with more erratic trends.
Three chemical profiles are represented for different samples in the in-situ experiment. The magnitude of the Mg perturbation is more pronounced regarding the lab tests if we compare the plots in the same concentration scales (Figure 3 right). It affects mainly 2 mm of bentonite thickness with different intensities where Mg relative atomic % increases from 6.5% (reference bentonite) to 20–40% in a 200 µm bentonite thickness measured from the concrete interface. The observed deviation of results comparing the three profiles is due to the irregular interface that characterizes the real in situ case. On the other hand, Al at long term seems to be clearly depleted and Ca, either reach a minimum or a maximum regarding the more or less developed Mg-rich band, respectively. Also in the in-situ case Fe showed an uneven distribution.

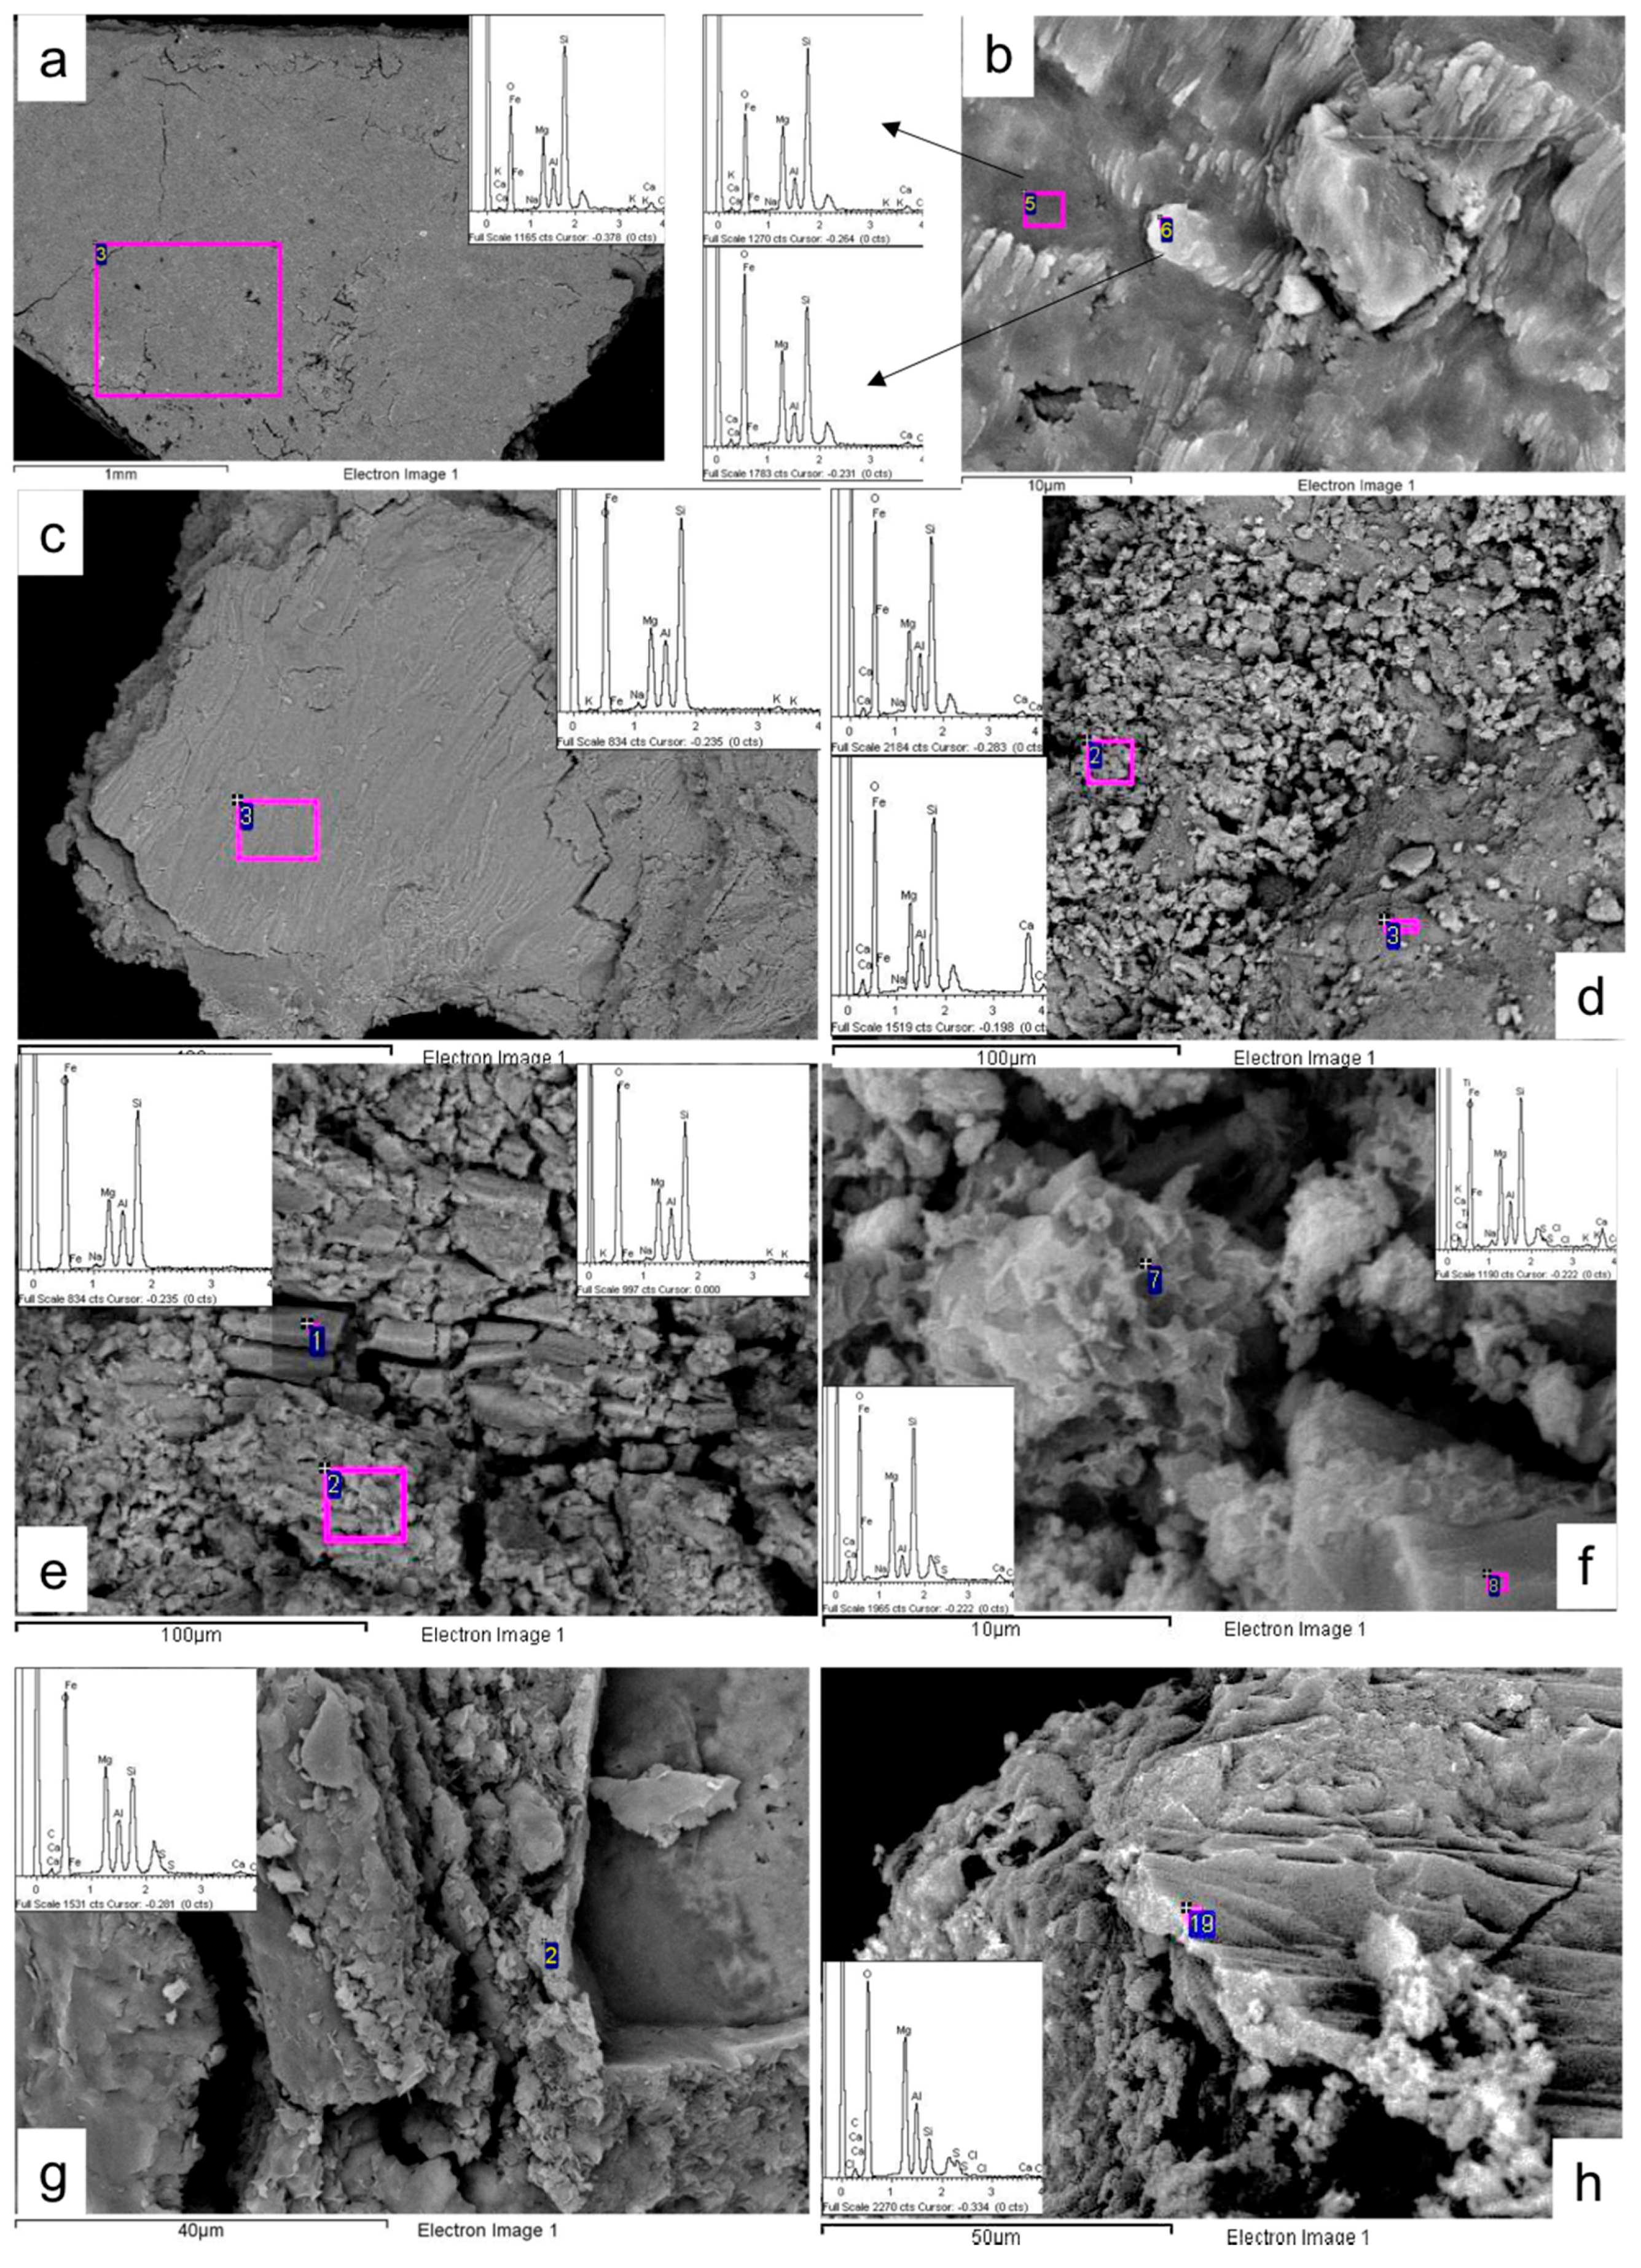
3.2. Textural Arrangements, Morphology and Chemistry

The cement concrete interfaces have been opened to have a fresh surface allowing the direct observation of mineral phases (poly-crystalline aggregates with subhedral morphologies) or undifferentiated mixtures. It is possible to detect the Mg rich phases that characterize an authigenic clay front developed in the bentonite by means of the induced alkaline alteration. In the small-scale laboratory experiments, an inert Teflon membrane was located to separate the interface and be able to study a pristine clay affected interface. In these flat texturized membranes (Figure 4b), there were no appreciable differentiated crystal aggregates morphologies, although high Mg proportions over Al and Si can be found at the very interfaces (Figure 4a,b).
The chemistry of the neogenic mineral phases can be approached by means of the use of ternary plots combining atomic proportions that can be related to single pure phases in order to capture pure phases mixture trends. Although the study is based on semi-quantitative analyses, the reference bentonite (stabilized values far from the concrete interface) represents well the initial unaltered bentonite (Si/(Al + Fe) = 2.5; Mg/Si = 0.1; Ca/Si = 0.3) within <10% relative error [38].
Chemical profiles in Figure 3 (left, lab experiments) have been transformed to ternary plots in Figure 5. Chemical coordinates show a relative constancy in the di-octahedral cations population (either 2R3 ([39] or (Al + Fe(III))/2 poles) and shift linearly to the tri-octahedral poles in the direction of a brucite-montmorillonite mixture. The shift of the 2M+-2R3-3R2 diagram to 2M+ pole, containing cation counterions, at 18 months is due to the time-dependent calcium increase in the compacted bentonite by means of cation exchange. Conversely in the 2Si-2(Al, Fe(III))-3Mg diagram the linear dependence is clear and apparently is not time dependent.
The chemical profiles of in situ bentonite interfaces were also converted to build ternary plots. In these samples, when one tries to open the interface, it usually happens that a clay film of ~1 mm thickness remained tightly adhered to the concrete. These films are harder than compacted bentonite and exhibit shinny lamellar surfaces with the naked eye. Figure 4c shows the aspect of one of these layers by SEM extracted from one hand-picked sample (35-3). Sometimes these surfaces appear with Ca-rich granular aggregates coming from the concrete interface material (Figure 4d). Both cases show Mg enrichment when analysed on clean surfaces. The Mg enrichment is often localized in layered structures where massive-tabular (Figure 4e) or honeycomb flake aggregates (Figure 4f) are analysed. The most pronounced relative Mg to Al concentrations correspond to flakes and contour cements (Figure 4g) located in coatings of quartz or rock grains that have been lost when the interface is opened. It is possible also to find fragments of dense crusts with high Mg concentrations relative to Al and Si (Figure 4h).
Chemical profiles in Figure 3 (in situ experiments) have been transformed to ternary plots in Figure 6. In these cases, 2M+-2R3-3R2 diagrams cannot be properly used because calcite precipitates coexist with the Mg-rich phases at the contact zones of bentonite with concrete. Then, the amount of Ca to be attributed to the 2M+ coordinate is too high and gives a distorted graphical interpretation of results. The 2Si-2(Al, Fe(III))-3Mg diagrams, representing the chemical profiles, show two directions in the chemical evolution of Mg-perturbation: the formation of brucite/montmorillonite mixtures and the formation of 2:1 sheet silicates with saponitic compositions (Figure 6a). Taking into account that the chemical profiles represent the composition of average mixtures, there are plotted all the punctual analyses performed in Mg-rich phases at the bentonite side in contact with the concrete interface (Figure 6b). Then, a quasi-linear trend from montmorillonite, brucite mixture, chlorite and hydrotalcite (3/1 Mg/Al), evolving at nearly constant di-octahedral cations proportions, can be traced.

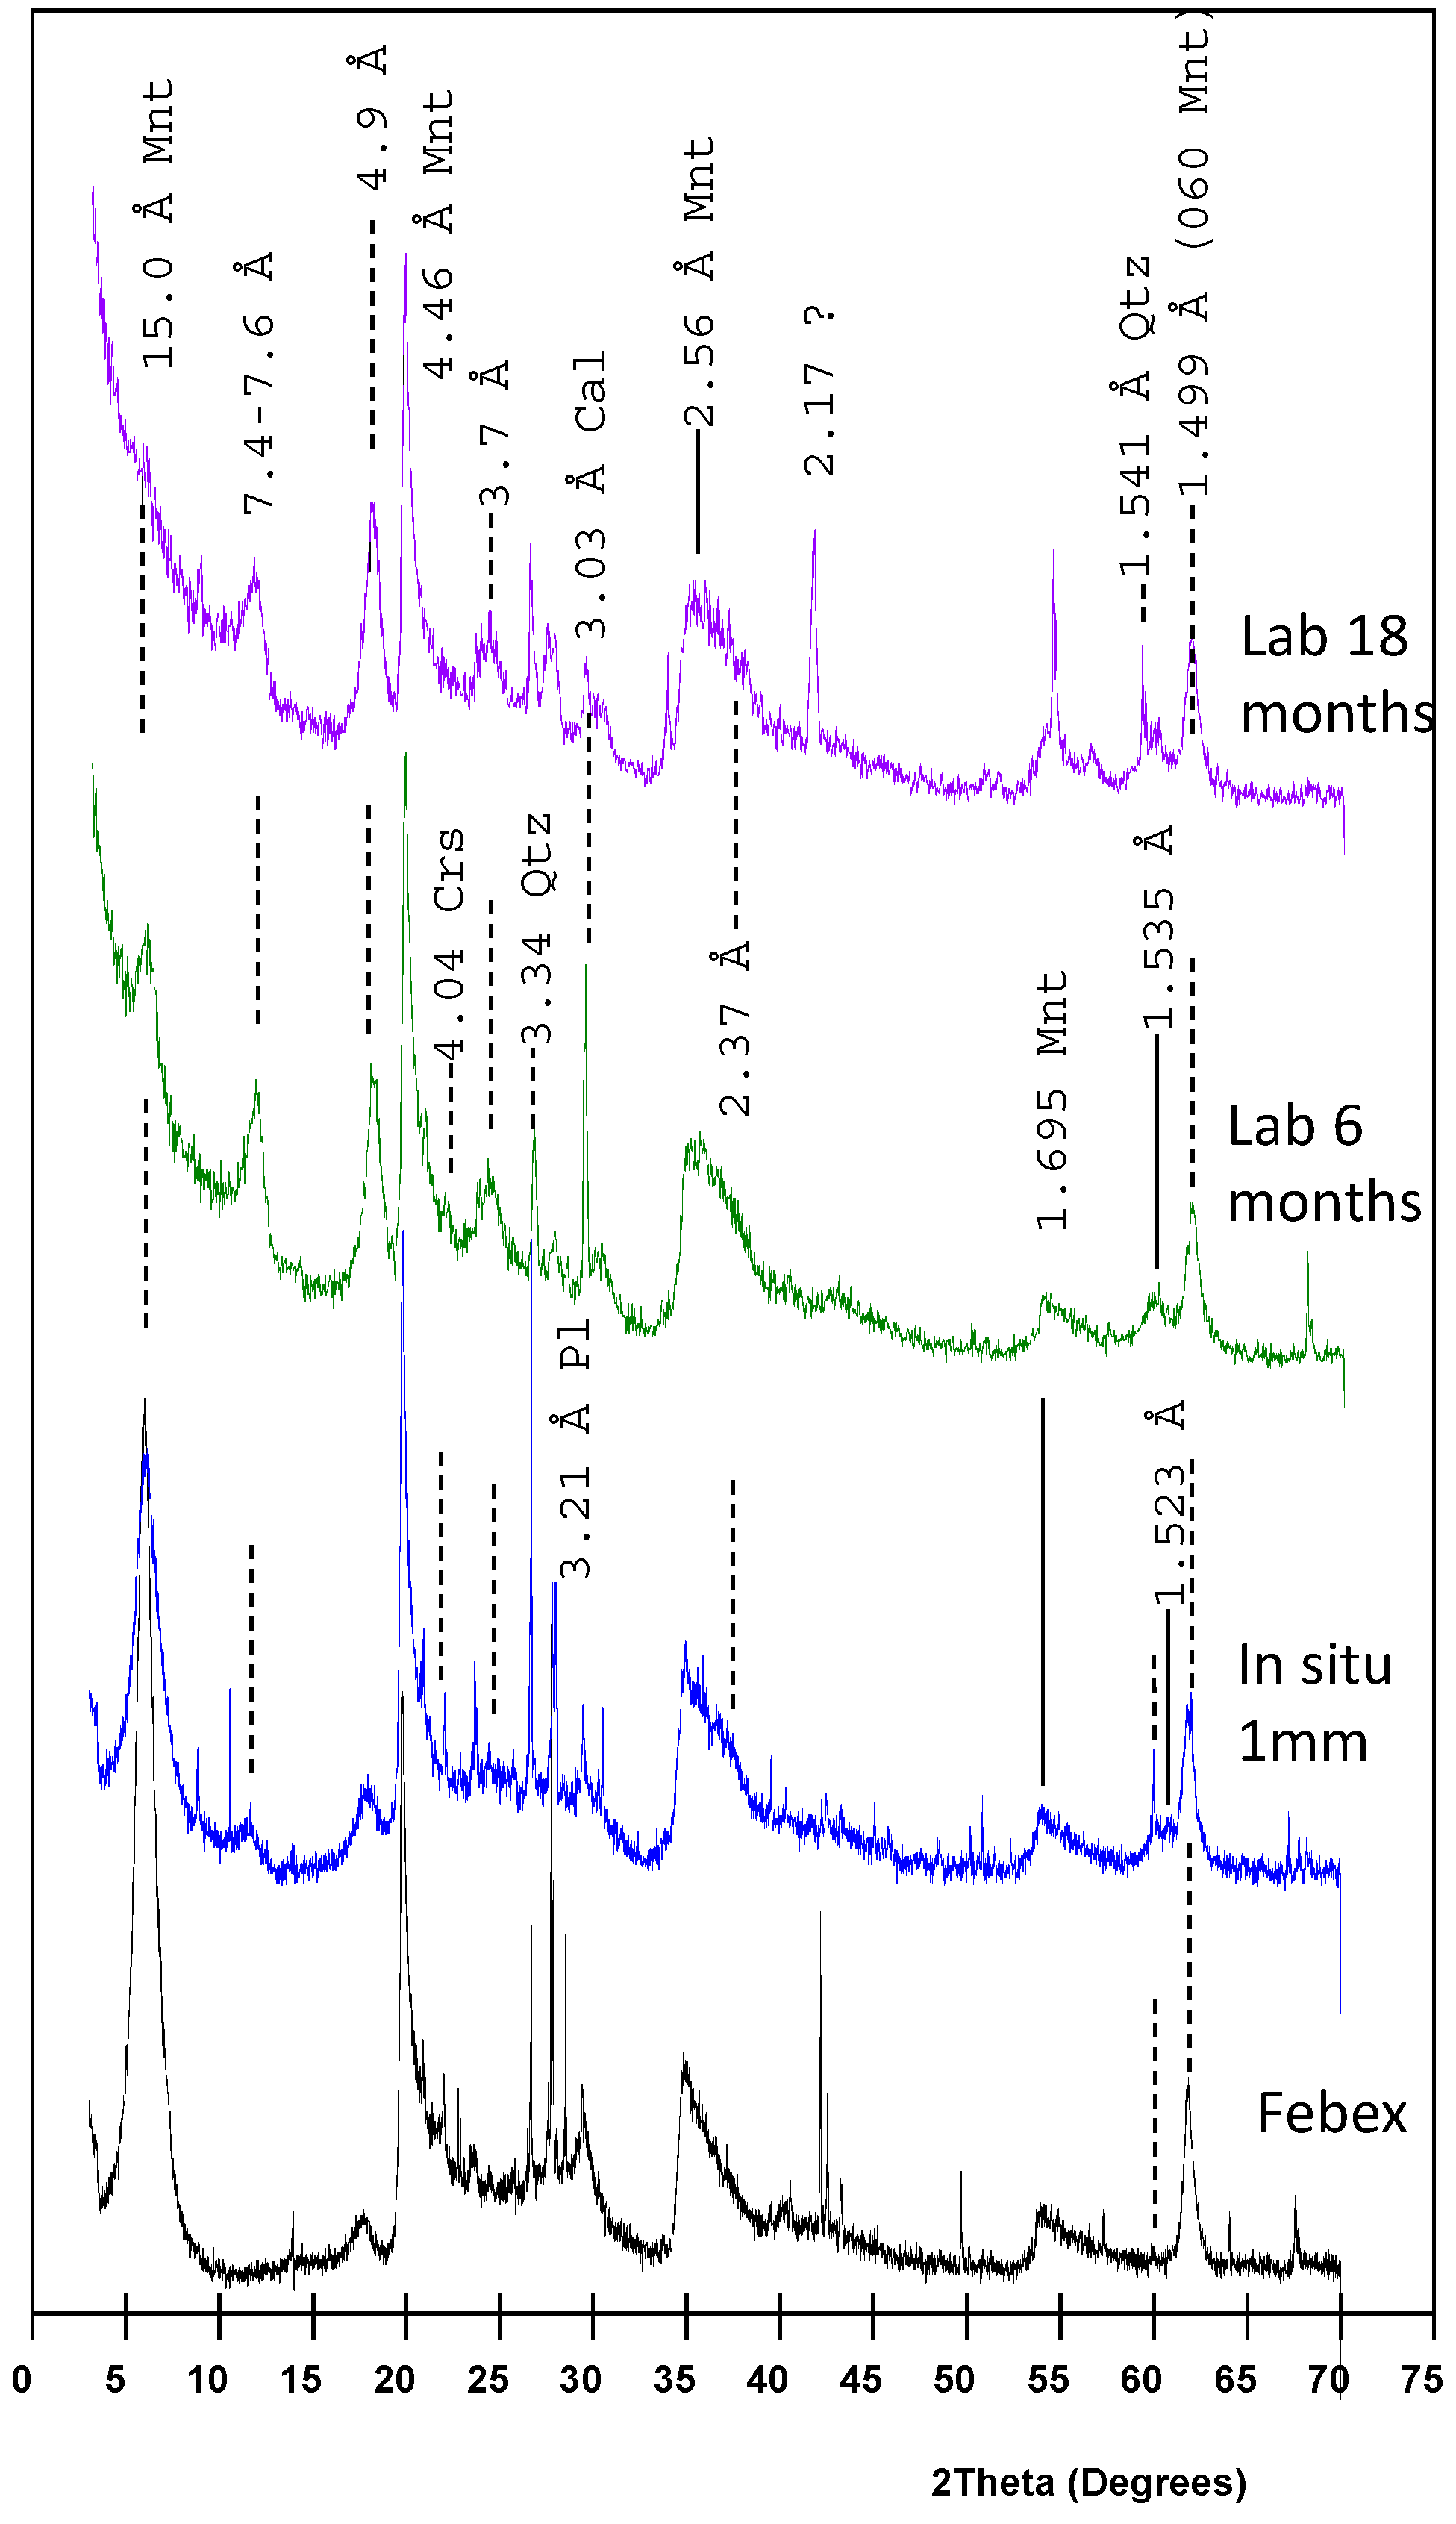
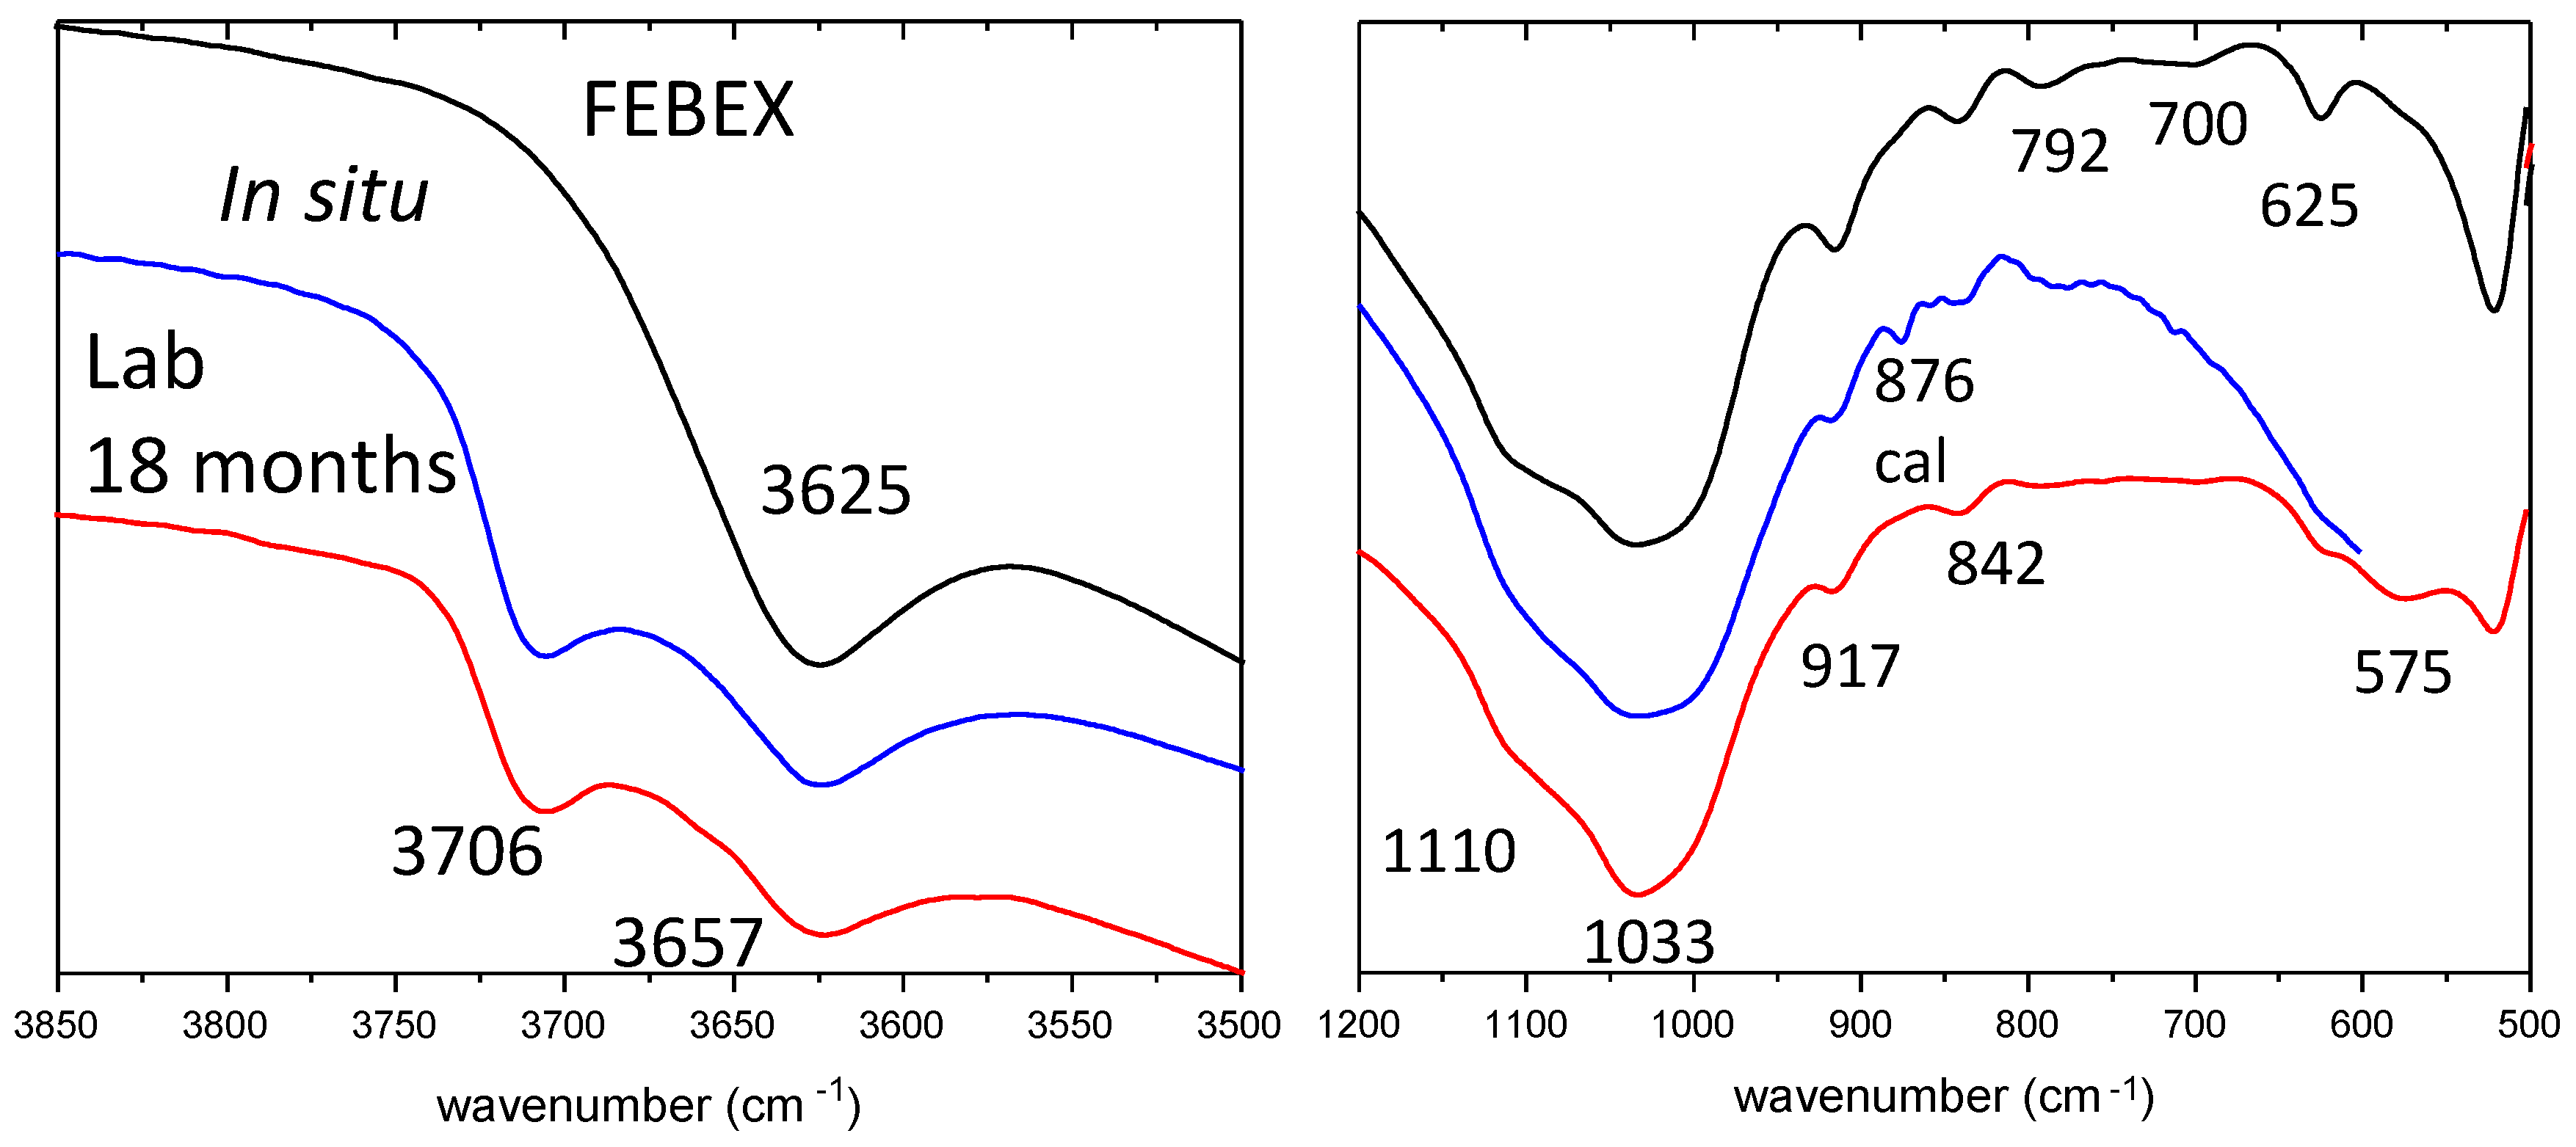
3.3. XRD and FTIR Data

All the XRD patterns registered show the (0 kl) reflections of montmorillonite present with comparable intensities regarding the unaltered FEBEX bentonite (Figure 7). The main perturbation of the patterns consists in a wide reflection at 7.4–7.6 Å combined with 3.7, 2.37 and 1.53–1.52 Å. These bands are more intense in the patterns registered directly on the bentonite surface at the interface in the laboratory experiments with a GIXRD configuration. In fact, the basal reflection of montmorillonite disappears after 18 months. The 7.5, 3.7 and 2.4 Å reflections are consistent with different orders of a basal reflection at 7.5 Å, 1:1-type sheet silicate or a superstructure of a 15 Å chlorite-like mineral [40]. The reflection 1.53–1.52 Å indicates a tri-octahedral sheet silicate formation. The enhanced intensity of a 4.9 Å reflection is not fully understood as far as it could be a non-basal reflection or an effect of interstratification.
FTIR data show also the presence of montmorillonite (Figure 8), with a dominant stretching band at 3625 cm−1, then prevailing the octahedral substitution. Both, in situ and laboratory samples exhibit a 3706 cm−1 band, which is at a higher wavenumber than the Mg–OH stretching bands assigned either to brucite (3698 cm−1), chrysotile (3690 cm−1), or saponite and clinochlore (3678 cm−1). The 3706 cm−1 band is also present in saponite and phlogopite (Mg tri-octahedral 2:1 minerals) but the 3678 cm−1, in the case of the possible presence of saponite, may be overlapped. It exists a weak band at 3657 cm−1 in the lab sample, characteristic of Al substitution for Si (i.e., beidellite) but the presence of both beidellite and saponite is not conclusive. The 917 and 842 cm−1 bands are characteristic of the OH–bending region of montmorillonite (δ(AlMgOH). The 798–777 cm−1 bands indicate presence of quartz, which is not present in the laboratory sample. The 1110, 1033 and 625 cm−1 bands correspond to Si–O–Si stretching vibrations and coupled Al–O and Si–O vibrations, characteristic of montmorillonites. The presence of a 575 cm−1 band is typical of altered samples and can be assigned to presence of brucite [41]. The FTIR interpretation has been made in agreement with Madejova et al. [42].

3.4. Thermochemical Approach

According to the chemical trends described for authigenic minerals formed in the bentonite near the contact to a concrete material, they are dominated by the precipitation of a brucite-montmorillonite complex, the tendency to form 2:1 saponite-type sheet silicates and the possibility of the formation of certain amounts of hydrotalcite minerals in grain interfaces. Although the presence of Ca-phases is completely separated from Mg-phases in this system, calcite can be present together with C-A-S-H minerals in the concrete wall due to the dissolution of portlandite and high Ca/Si C-S-H in the concrete matrix. Ettringite (Ca-Al sulphate) and other phases formed with different anions are not considered in this exercise.
In order to check the dissolution-precipitation reactions in this alkaline perturbation of FEBEX bentonite, Ca(OH)2 (portlandite) has been considered as the source of alkalinity in equilibrium with calcite (contained in CEM-II paste). Portlandite has been used to attain several fixed pH equilibrium conditions by means of its reaction with high charge Mg-montmorillonite (8 mol/L), quartz (2 mol/L) and calcite (1 mol/L), an assemblage that approaches the bentonite composition. For simplicity, the montmorillonite has been tied to a cation exchanger (X) containing 4 mol/L of MgX2 taking into account that an important source of Mg cations is coming to the reaction medium through the exchangeable complex of the montmorillonite. The phases considered in the exercise have been summarized in Table 2.
The geochemical reaction calculated is driven by the dissolution of quartz and montmorillonite and the precipitation of saponite (Figure 9a,b). Calcite added in equilibrium to the system did not experiment any mass change to fulfil the equilibrium conditions. Quartz is dissolved due to its limited content and the undersaturation state. It is consumed from pH 8 to 9 and hydrotalcite can form in this environment, partly competing with the formation of saponite. The precipitation of these minerals imposes a low silica, aluminium and magnesium soluble species activity and brucite, M-S-H and sepiolite remained always undersaturated when pH rises up to 11~11.5. With the progressive addition of Ca(OH)2, C-A-S-H reaches supersaturation and the system evolves to an invariant point resulting in the impossibility to fix higher pHs using this assemblage.

4. Discussion

4.1. Geochemical Perturbation

The presence of a cementitious material based on OPC concrete, as the CEM-II present in our study of concrete or mortar mixtures, is considered as a high pH source (>12) compared to other nanosilica or alumina cement products [4]. The geochemical perturbation produced in the contact with clay materials is characterized by (1) the carbonation of concrete and concrete-clay interface [43] favoured by the dissolution of calcium hydroxide in the hydrated cement paste and the decalcification of the initially high Ca/Si C-S-H. Tobermorite-type C-A-S-H forms and compete with calcite precipitation; and (2) the cation exchange in montomorillonite (bentonite clay), that is characterized by the decrease of Mg and the increase of Ca concentrations both in pore waters and in the exchangeable cations population [13]. Mg is exchanged and transferred to the alkaline medium where it is precipitated as brucite or M-S-H phases depending on the availability of silica, released during montmorillonite or amorphous silica dissolution. Mg-silicates have been found at the clay-concrete (OPA) interface. In this case, the M-S-H phases are located in the concrete matrix and not in the clay side [8,14]. In addition to these processes, Al-Ca sulphates, chlorides and mono-hemi-carbonates [44] can precipitate in the concrete face due to the accommodation of Al (i.e., by montmorillonite dissolution) and soluble salts diffusion through the bentonite [11,45]. The process (2) have shown to be evolved with time in the short-term lab experiments and have been relatively extended in the long-term bentonite interface. Carbonation was not significant in the bentonite material, focused in this study, at the concrete interface. In contrast, significant Ca precipitated phases (calcite, ettringite, C-A-S-H) have been found within the concrete matrix at the bentonite interface [13].
Ternary plots combining atomic proportions has been related to mixtures of pure phases in order to capture crystal-chemical trends. Both lab or part of the in situ bulk chemical profiles measured in bentonite agrees with the existence of intercalated brucite-montmorillonite mineral [40,46]. The chemical trends show generally the maintenance of the montmorillonite along the interface thickness as far as the di-octahedral cations remained in relative constant proportions. This is in agreement with all the XRD patterns registered in which (0 kl) reflections of montmorillonite and with the presence of the brucite-montmorillonite complex mixed with other Mg-tri-octahedral silicate minerals.
The bentonite interface in the in-situ samples exhibit significant heterogeneity of chemical compositions. The reality of Mg concentration can be described as a heterogeneous distribution of Mg-clays with a common feature, the virtual absence of very low presence of calcium in the localized precipitates [18]. Calcium is normally located in separated phases including calcite or ettringite from the concrete wall [13]. This is in close agreement with the lack of evidence of continuous solid solution formation of C-S-H or M-S-H related minerals [13,18,19].
The punctual analyses taken in bentonite interface from in situ experiment, evidenced the wide spectrum of Mg phases that can precipitate due to the alkaline perturbation and how they became mixed with the predominant montmorillonite component. In consequence, the Mg-perturbation in the bentonite case differs from a non-expandable (less ion exchange potential) case and it is significantly influenced by the presence of an ion exchanger, a fact predicted by Soler [47]. On the other hand, the presence of hydrotalcite-type compositions and the secondary tendency to form saponitic compositions implies the existence of a sufficient high pH condition to allow the aluminium mobility and, hence, the dissolution of part of the montmorillonite mineral. The possibility of formation of saponitic minerals have been found also in low pH concrete matrices in contact with Opalinus Clay at the Mont Terri URL [14]. Our FTIR data showed similarities with this study and outline some bands indicative of Al-Si substitutions, which in one hand support the presence of saponite and also the dissolution of montmorillonite due to the above-mentioned mobility of aluminium soluble species. The mobility of silica was also revealed by means of the lack of quartz FTIR signals in the in-situ bentonite interface samples, representative of a precise location for bentonite alkaline alteration.
The thermochemical calculations are consistent with the silica (quartz, cristobalite) dissolution in bentonite and with the very limited thickness of alteration. It is calculated that at pH 11 for the equilibrium montmorillonite-C-A-S-H at the interface it is needed the dissolution of <10 wt % of the initial montmorillonite content in order to satisfy equilibrium conditions. This limit imposed by C-S-H/montmorillonite equilibrium was shown by Fernández et al. [48] in their thermochemical interpretation of Ca(OH)2–montmorillonite reactions. In fact, this limit can have favourable consequences as it enables the precipitation or retention of amphoteric metal ions that can be solubilized at higher pHs as it is the case of Al and radionuclides as U(VI), Tc(IV), Np(V) [49]. In addition, the control of CO2 will limit also the formation of soluble carbonate complexes at pH > 9 with several radionuclides.

4.2. The Nature of Alkaline Alteration: Connections with Natural Authigenesis in Alkaline Lakes.

In natural alkaline environments lacustrine deposits, carbonates are frequently located at the base or at the top layers of magnesian clay concentrations and sometimes interbedded [24,50]. Calcite has been reported to be supersaturated when surface streams or groundwaters mix in the lakes water cycling and is easily precipitated [21,51]. Then calcite appears as surface sediments cement, forming fillings or it is displayed as aureole margins around the lake sediments core [20]. In fact, magnesian clays use to share mineral assemblage with dolomite or magnesite rather than calcite [23,52,53,54]. As a consequence, when pH is increased in the system it evolves at low pCO2 conditions and calcite remained precipitated. We have tested (not shown in results) that any CO2 allowed to enter in the system is immediately consumed in calcite precipitation.
Natural alkaline-lake systems are characterized by Ca poor (calcite precipitation), bicarbonate-rich aqueous compositions with the predominance of Na, Mg and K soluble cations [55]. Mg carbonates do not precipitate and remain in solution due to a metastability state (dolomite problem). Then, the formation of magnesian smectites (in actual environments) under high pH conditions is produced during evaporation of sodium-carbonate-bicarbonate brines. The process is very close to the concrete-bentonite alkaline alteration. It is obvious that the difference is the source for alkalinity in the artificial case driven by Ca(OH)2. It is necessary to mention that pristine porewaters in OPC cements can reach hyperalkaline conditions (pH ≈ 13.5) due to the K-Na(OH) solutions [4] but their amount and availability is not very significant to the real global system understanding [10].

5. Conclusions

Mg (and Fe) rich smectites have been proposed elsewhere as authigenic mineral indicators for alkaline lacustrine environments or basic rocks alteration and diagenesis. In this paper, it has been studied the consequences of a rapid alkaline alteration induced by the contact of concrete and bentonite. An initial disequilibrium condition drives to the consumption of CO2 with the formation of calcite at the concrete interface and the precipitation of Mg and Mg-Al hydroxides intimately mixed with montmorillonite. The time evolution of this interface, discussed with data from 6 months to 13 years, indicates the possibility of formation of saponitic minerals, in agreement with the processes observed in alkaline lakes sediments early diagenetic environments.
Geochemical calculations indicate that the mineral layer composed of authigenic Mg-Clay formed in the EBS artificial concrete/bentonite interface is a pH~11 buffer. This is useful to gain confidence to minimize bentonite alteration in the nuclear waste repository geological system. It is also worth to mention the favourable conditions of the authigenic layer for retention of amphoteric metal ions or to limit the potential of CO32− to form relatively soluble complexes with several radionuclides.

Author Contributions

Writing-Original Draft Preparation, conceptualization, J.C. Formal Analysis, Investigation, A.I.R. Formal Analysis, Validation, R.F. Methodology, Formal Analysis, D.G.-S. Data Curation, Methodology, M.A., A.O. Validation, E.T. Supervision, M.J.T.

Funding

This work has been in part financially supported by the Full-Scale Engineered Barrier Experiment Dismantling Project (FEBEX-DP) consortium (http://www.grimsel.com/gts-phase-vi/febex-dp/febex-dp-introduction) for dismantling and overcoring sampling. The research leading to these results has received funding from the European Union’s Horizon 2020 Research and Training Programme of the European Atomic Energy Community (EURATOM) (H2020-NFRP-2014/2015) under grant agreement No. 662147 (CEBAMA).

Acknowledgments

To E. Rodríguez Cañas (KIKE), for his very good skills and aid in electron microscopy data adquisition in SIdI-UAM university service.

Conflicts of Interest

The authors declare no conflict of interest. The funders had no role in the design of the study; in the collection, analyses, or interpretation of data; in the writing of the manuscript and in the decision to publish the results.

References

  1. U.S. DOE. Evaluation of options for permanent geologic disposal of spent nuclear fuel and high-level radioactive waste in support of a comprehensive national nuclear fuel cycle strategy. In Prepared for U.S. Department of Energy Used Fuel Disposition Campaign by Sandia National Laboratories; U.S. DOE: Washington, DC, USA, 2014; Volume I, p. 155. [Google Scholar]
  2. Fernández, A.M.; Baeyens, B.; Bradbury, M.; Rivas, P. Analysis of the porewater chemical composition of a spanish compacted bentonite used in an engineered barrier. Phys. Chem. Earth Parts A/B/C 2004, 29, 105–118. [Google Scholar] [CrossRef]
  3. Bullard, J.W.; Jennings, H.M.; Livingston, R.A.; Nonat, A.; Scherer, G.W.; Schweitzer, J.S.; Scrivener, K.L.; Thomas, J.J. Mechanisms of cement hydration. Cem. Concr. Res. 2011, 41, 1208–1223. [Google Scholar] [CrossRef]
  4. International Atomic Energy Agency (IAEA). The Behaviours of Cementitious Materials in Long Term Storage and Disposal of Radioactive Waste; IAEA: Vienna, Austria, 2013; p. 61. [Google Scholar]
  5. Glasser, F.P.; Matschei, T. Interactions between portland cement and carbon dioxide. In Proceedings of the International Congress on the Chemistry of Cement-Cd-Rom Edition, Montréal, QC, Canada, 8–13 July 2007; p. TH3-13.4. [Google Scholar]
  6. Dauzeres, A.; Le Bescop, P.; Sardini, P.; Cau Dit Coumes, C. Physico-chemical investigation of clayey/cement-based materials interaction in the context of geological waste disposal: Experimental approach and results. Cem. Concr. Res. 2010, 40, 1327–1340. [Google Scholar] [CrossRef]
  7. Gaucher, E.C.; Blanc, P. Cement/clay interactions—A review: Experiments, natural analogues, and modeling. Waste Manag. 2006, 26, 776–788. [Google Scholar] [CrossRef] [PubMed]
  8. Dauzeres, A.; Achiedo, G.; Nied, D.; Bernard, E.; Alahrache, S.; Lothenbach, B. Magnesium perturbation in low-ph concretes placed in clayey environment—Solid characterizations and modeling. Cem. Concr. Res. 2016, 79, 137–150. [Google Scholar] [CrossRef]
  9. Jenni, A.; Mäder, U.; Lerouge, C.; Gaboreau, S.; Schwyn, B. In situ interaction between different concretes and opalinus clay. Phys. Chem. Earth Parts A/B/C 2014, 70–71, 71–83. [Google Scholar] [CrossRef]
  10. Bildstein, O.; Claret, F. Stability of clay barriers under chemical perturbations. In Natural and Engineered Clay Barriers; Tournasat, C., Steefel, C.I., Bourg, I.C., Bergaya, F., Eds.; Elsevier: Amsterdam, The Netherlands, 2015; Volume 6, pp. 155–226. [Google Scholar]
  11. Dauzères, A.; Le Bescop, P.; Cau-Dit-Coumes, C.; Brunet, F.; Bourbon, X.; Timonen, J.; Voutilainen, M.; Chomat, L.; Sardini, P. On the physico-chemical evolution of low-pH and CEM I cement pastes interacting with Callovo-Oxfordian pore water under its in situ CO2 partial pressure. Cem. Concr. Res. 2014, 58, 76–88. [Google Scholar] [CrossRef]
  12. Fernández, R.; González-Santamaría, D.; Angulo, M.; Torres, E.; Ruiz, A.I.; Turrero, M.J.; Cuevas, J. Geochemical conditions for the formation of Mg silicates phases in bentonite and implications for radioactive waste disposal. Appl. Geochem. 2018, 93, 1–9. [Google Scholar] [CrossRef]
  13. Fernández, R.; Torres, E.; Ruiz, A.I.; Cuevas, J.; Alonso, M.C.; García Calvo, J.L.; Rodríguez, E.; Turrero, M.J. Interaction processes at the concrete-bentonite interface after 13 years of febex-plug operation. Part II: Bentonite contact. Phys. Chem. Earth Parts A/B/C 2017, 99, 49–63. [Google Scholar] [CrossRef]
  14. Lerouge, C.; Gaboreau, S.; Grangeon, S.; Claret, F.; Warmont, F.; Jenni, A.; Cloet, V.; Mäder, U. In situ interactions between opalinus clay and low alkali concrete. Phys. Chem. Earth Parts A/B/C 2017, 99, 3–21. [Google Scholar] [CrossRef]
  15. Nied, D.; Enemark-Rasmussen, K.; L’Hopital, E.; Skibsted, J.; Lothenbach, B. Properties of magnesium silicate hydrates (M-S-H). Cem. Concr. Res. 2016, 79, 323–332. [Google Scholar] [CrossRef]
  16. Roosz, C.; Grangeon, S.; Blanc, P.; Montouillout, V.; Lothenbach, B.; Henocq, P.; Giffaut, E.; Vieillard, P.; Gaboreau, S. Crystal structure of magnesium silicate hydrates (M-S-H): The relation with 2:1 Mg–Si phyllosilicates. Cem. Concr. Res. 2015, 73, 228–237. [Google Scholar] [CrossRef]
  17. Bernard, E.; Dauzères, A.; Lothenbach, B. Magnesium and calcium silicate hydrates, part II: Mg-exchange at the interface “low-pH” cement and magnesium environment studied in a C-S-H and M-S-H model system. Appl. Geochem. 2018, 89, 210–218. [Google Scholar] [CrossRef]
  18. Bernard, E.; Lothenbach, B.; Cau-Dit-Coumes, C.; Chlique, C.; Dauzères, A.; Pochard, I. Magnesium and calcium silicate hydrates, part I: Investigation of the possible magnesium incorporation in calcium silicate hydrate (C-S-H) and of the calcium in magnesium silicate hydrate (M-S-H). Appl. Geochem. 2018, 89, 229–242. [Google Scholar] [CrossRef]
  19. Lothenbach, B.; Nied, D.; L’Hôpital, E.; Achiedo, G.; Dauzères, A. Magnesium and calcium silicate hydrates. Cem. Concr. Res. 2015, 77, 60–68. [Google Scholar] [CrossRef]
  20. Savage, D.; Benbow, S.; Watson, C.; Takase, H.; Ono, K.; Oda, C.; Honda, A. Natural systems evidence for the alteration of clay under alkaline conditions: An example from searles lake, california. Appl. Clay Sci. 2010, 47, 72–81. [Google Scholar] [CrossRef]
  21. Deocampo, D.M. Authigenic clay minerals in lacustrine mudstones. In Paying Attention to Mudrocks: Priceless! Larsen, D., Egenhoff, S.O., Fishman, N.S., Eds.; Geological Society of America Special Paper; The Geological Society of America: Boulder, CO, USA, 2015; Volume 515, pp. 49–64. [Google Scholar]
  22. Khoury, H.N.; Eberl, D.D.; Jones, B.F. Origin of magnesium clays from the amargosa desert, Nevada. Clays Clay Min. 1982, 30, 327–336. [Google Scholar] [CrossRef]
  23. Meunier, A. Clays in sedimentary environments. In Clays; Meunier, A., Ed.; Springer: New York, NY, USA, 2005; pp. 295–325. [Google Scholar]
  24. Pozo, M.; Casas, J. Origin of kerolite and associated Mg clays in palustrine-lacustrine environments. The esquivias deposit (neogene Madrid basin, Spain). Clay Min. 1999, 34, 395–418. [Google Scholar] [CrossRef]
  25. Bristow, T.F.; Milliken, R.E. Terrestrial perspective on authigenic clay mineral production in ancient martian lakes. Clays Clay Miner. 2011, 59, 339–358. [Google Scholar] [CrossRef]
  26. Shimbashi, M.; Sato, T.; Yamakawa, M.; Fujii, N.; Otake, T. Formation of Fe- and Mg-rich smectite under hyperalkaline conditions at Narra in Palawan, The Philippines. Minerals 2018, 8, 155. [Google Scholar] [CrossRef]
  27. Jones, B.F.; Galán, E. Sepiolite and palygorskite. In Hydrous Phyllosilicates (Exclusive of Micas); Bayley, S.W., Ed.; Geochemical Society; Mineralogical Society of America: Washington, DC, USA, 1988; Volume 19, pp. 631–674. [Google Scholar]
  28. Eberl, D.D.; Jones, B.F.; Khoury, H.N. Mixed-layer kerolite/stevensite from the Amargosa desert, Nevada. Clays Clay Miner. 1982, 30, 321–326. [Google Scholar] [CrossRef]
  29. Tosca, N.J.; Masterson, A.L. Chemical controls on incipient Mg-silicate crystallization at 25 °C: Implications for early and late diagenesis. Clay Miner. 2018, 49, 165–194. [Google Scholar] [CrossRef] [Green Version]
  30. Weaver, C.E. Clays, Muds, and Shales; Elsevier: Amsterdam, The Netherlands, 1989; p. 820. [Google Scholar]
  31. Huertas, F.; de la Cruz, B.; Fuentes-Cantillana, J.-L.; Alonso, E.; Linares, J.; Samper, J.; Elorza, F.J.; Svemar, C.; Salo, J.-P.; Muurinen, A.; et al. Full-Scale Engineered Barriers Experiment for a Deep Geological Repository for High-Level Waste in Crystalline Host Rock—Phase II Febex II; The European Commission: Brussels, Belgium, 2005; p. 52. [Google Scholar]
  32. González-Santamaría, D.; Angulo, M.; Ruiz, A.I.; Fernández, R.; Ortega, A.; Cuevas, J. Low-pH cement mortar-bentonite perturbations in a small-scale pilot laboratory experiment. Clay Miner. 2018, 1–32. [Google Scholar] [CrossRef]
  33. Villar, M.V.; Martín, P.L.; Bárcena, I.; García-Siñeriz, J.L.; Gómez-Espina, R.; Lloret, A. Long-term experimental evidences of saturation of compacted bentonite under repository conditions. Eng. Geol. 2012, 149–150, 57–69. [Google Scholar] [CrossRef]
  34. Ramírez, S.; Cuevas, J.; Petit, S.; Righi, D.; Meunier, A. Smectite reactivity in alkaline solutions. Geol. Carphatica 2002, 53, 87–92. [Google Scholar]
  35. Bárcena, I.; Fuentes-Cantillana, J.L.; García-Siñeriz, J.-L. Dismantling of Heater no 1 at the Febex “In Situ” Test: Description of Operations; IAEA: Vienna, Austria, 2003; p. 124. [Google Scholar]
  36. Parkhurst, D.L.; Appelo, C.A.J. User’s Guide to Phreeqc (Version 2)—A Computer Program for Speciation, Batch-Reaction, One-Dimensional Transport, and Inverse Geochemical Calculations; USGS: Reston, VA, USA, 1999; p. 310.
  37. Blanc, P.; Lassin, A.; Piantone, P.; Azaroual, M.; Jacquemet, N.; Fabbri, A.; Gaucher, E.C. Thermoddem: A geochemical database focused on low temperature water/rock interactions and waste materials. Appl. Geochem. 2012, 27, 2107–2116. [Google Scholar] [CrossRef]
  38. Fernández, R.; Ruiz, A.I.; Cuevas, J. The role of smectite composition on the hyperalkaline alteration of bentonite. Appl. Clay Sci. 2014, 95, 83–94. [Google Scholar] [CrossRef]
  39. Velde, B. Clay Minerals—A Physico-Chemical Explanation of theIr Occurrence; Elsevier: Amsterdam, The Netherlands, 1985; Volume 40, p. 443. [Google Scholar]
  40. Fernández, R.; Vigil de la Villa, R.; Ruiz, A.I.; García, R.; Cuevas, J. Precipitation of chlorite-like structures during opc porewater diffusion through compacted bentonite at 90 °C. Appl. Clay Sci. 2013, 83–84, 357–367. [Google Scholar] [CrossRef]
  41. Frost, R.L.; Kloprogge, J.T. Infrared emission spectroscopic study of brucite. Spectrochim. Acta Part A 1999, 55, 2195–2205. [Google Scholar] [CrossRef]
  42. Madejova, J.; Gates, W.P.; Petit, S. Ir spectra of clay minerals. In Infrared and Raman Spectroscopies of Clay Minerals; Gates, W.P., Kloprogge, J.T., Madejova, J., Bergaya, F., Eds.; Elsevier: Amsterdam, The Netherlands, 2017; Volume 8, pp. 107–149. [Google Scholar]
  43. Gaboreau, S.; Lerouge, C.; Dewonck, S.; Linard, Y.; Bourbon, X.; Fialips, C.I.; Mazurier, A.; Pret, D.; Borschneck, D.; Montouillout, V.; et al. In-situ interaction of cement paste and shotcrete with claystones in a deep disposal context. Am. J. Sci. 2012, 312, 314–356. [Google Scholar] [CrossRef]
  44. Zajac, M.; Rossberg, A.; Le Saout, G.; Lothenbach, B. Influence of limestone and anhydrite on the hydration of portland cements. Cem. Concr. Compos. 2014, 46, 99–108. [Google Scholar] [CrossRef]
  45. Alonso, M.C.; García Calvo, J.L.; Cuevas, J.; Turrero, M.J.; Fernández, R.; Torres, E.; Ruiz, A.I. Interaction processes at the concrete-bentonite interface after 13 years of febex-plug operation. Part I: Concrete alteration. Phys. Chem. Earth Parts A/B/C 2017, 99, 38–48. [Google Scholar] [CrossRef]
  46. Brindley, G.W.; Kao, C.-C. Formation, compositions, and properties of hydroxy-Al- and hydroxy-Mg-montmorillonite. Clays Clay Miner. 1980, 28, 435–443. [Google Scholar] [CrossRef]
  47. Soler, J.M. Reactive transport modeling of concrete-clay interaction during 15 years at the Tournemire underground rock laboratory. Eur. J. Min. 2013, 25, 639–654. [Google Scholar] [CrossRef]
  48. Fernández, R.; Rodríguez, M.; Villa, R.V.d.l.; Cuevas, J. Geochemical constraints on the stability of zeolites and C–S–H in the high pH reaction of bentonite. Geochim. Cosmochim. Acta 2010, 74, 890–906. [Google Scholar] [CrossRef]
  49. Siegel, M.D.; Bryan, C. Geochemistry of radioactive environmental contamination. In Environmemtal Gechemistry; Sherwood Lollar, B., Ed.; Elsevier: Amsterdam, The Netherlands, 2005; Volume 9, pp. 205–262. [Google Scholar]
  50. Hay, R.L.; Hughes, R.E.; Kyser, T.K.; Glass, H.D.; Liu, J. Magnesium-rich clays of the Meerschaum mines in the Amboseli basin, Tanzania and Kenya. Clays Clay Miner. 1995, 43, 455–466. [Google Scholar] [CrossRef]
  51. Deocampo, D.M.; Jones, B.F. Geochemistry of saline lakes. In Surface and Groundwater, Weathering and Soils, 2nd ed.; Drever, J.I., Ed.; Elsevier: Amsterdam, The Netherlands, 2014; Volume 7, pp. 437–469. [Google Scholar]
  52. Birsoy, R. Formation of sepiolite-palygorskite and related minerals from solution. Clays Clay Min. 2002, 50, 736–745. [Google Scholar] [CrossRef]
  53. Calvo, J.P.; Jones, B.J.; Bustillo, M.A.; Fort, R.; Alonso-Zarza, A.M.; Kendall, C. Sedimentology and geochemistry of carbonates from lacustrine secuences in the Madrid basin, central Spain. Chem. Geol. 1995, 123, 173–191. [Google Scholar] [CrossRef]
  54. Leguey, S.; Ruiz de León, D.; Ruiz, A.I.; Cuevas, J. The role of biomineralization in the origin of sepiolita and dolomite. Am. J. Sci. 2010, 310, 165–193. [Google Scholar] [CrossRef]
  55. Larsen, D. Revisiting silicate authigenesis in the pliocene–pleistocene lake Tecopa beds, southeastern California: Depositional and hydrological controls. Geosphere 2008, 4, 612–639. [Google Scholar] [CrossRef]
Figure 1. Aspects of in situ taken FEBEX bentonite/concrete samples. (a): schematic drawing of the FEBEX experiment gallery after the dismantling of heater #1 in 2002; (b): section with several drill core samplings: wide cylindrical holes correspond to special overcoring practiced for preserved bentonite-concrete interface sections. (c): cylindrical borehole of an overcoring section (upper part; 1: remaining forms of small drillings performed before the overcoring operation) and 2: manual drilling tool (lower part); (d): cut of a preserved section from the overcoring sample OC-4; (e): LR-White resin cured OC-4 interface section; (f): aspect of an in situ manual tool drilled bentonite-concrete interface (34-10 sample); (g): polished cut of the 35-3 in situ hand-picked sample; (h): 34-12 sample: bentonite section. The upper part is the bentonite-concrete contact.
Minerals 08 00362 g001
Figure 2. Small scale infiltration experiments through a composite mortar bentonite column. (a): external aspect of the experimental set-up; (b): scheme of the confining cell and detail of the materials assemblage; (c): detail of a polished longitudinal cut practiced to perform elemental chemical profiles across the bentonite-mortar interface. Arrows indicate the example of EDX analysed transects. In this paper, just the bentonite transect is considered.
Minerals 08 00362 g002
Figure 3. EDX major elements chemical profiles in the bentonite approaching the cement mortar or concrete interfaces. Percentages are expressed in % of elements (atoms), excluding C and O and normalized to the sum of the remaining elements. Distance is considered from the concrete interface (µm).
Minerals 08 00362 g003
Figure 4. SEM-EDX pictures of singular zones and aggregates morphology within bentonite interface in contact with mortar (lab) or concrete (in situ) (Mg-perturbed zones: Mg > Al in EDX spectra). (a): flat surface in bentonite facing CEM-II mortar in small scale laboratory experiments (chemical profiles and analysis in Figure 3 show that in unperturbed bentonite Al >> Mg). (b): detail of bentonite texture at the very interface induced by the imprint of the Teflon membrane. (c): flat oriented plate surface characterizing the in situ FEBEX experiment in the bentonite in contact with concrete (sample 35-3). (d): compacted bentonite surface with granular relicts of the concrete side (sample 34-10). (e): massive and tabular aggregates that characterize the bentonite interface material (sample 34-12). (f): Flaky honeycomb clay aggregates. (g): layered Mg-rich clay coatings (34-10). (h): dense crust located in the bentonite contact with the concrete interface.
Minerals 08 00362 g004
Figure 5. Laboratory small scale experiments: chemical profile trends on the bentonite in ternary plots using atomic proportions. (a): 2M+-2R3-3R2: (M+: charge of exchangeable cations); (2R3 = R3(Al + Fe cations-M+)/2); (3R2 = Mg/3). (b): 2Si-2Al, Fe(III)-3Mg: (2Si: Si/2); (2Al, Fe(III): (Al + Fe)/2); (3Mg: Mg/3). MntF: Montmorillonite FEBEX; MntFBrc: Monmorillonite FEBEX intercalated with an Al charged brucitic layer; Srp: serpentine; Stv: stevensite; Tlc: talc; Sep: sepiolite; Chl: Chlorite; Ht1: hydrotalcite 1/3 Al/Mg; Ht2: hydrotalcite 1/2 Al/Mg. Compositions are specified in Table 1.
Minerals 08 00362 g005
Figure 6. In situ Febex-dp experiment chemical trends represented in ternary plots using atomic proportions. 2Si-2Al, Fe(III)-3Mg: (2Si: Si/2); (2Al, Fe(III): (Al + Fe)/2); (3Mg: Mg/3). MntF: Montmorillonite FEBEX; MntFBrc: Monmorillonite Febex intercalated with an Al charged brucitic layer; Srp: serpentine; Stv: stevensite; Tlc: talc; Sep: sepiolite; Chl: Chlorite; Ht1: hydrotalcite 1/3 Al/Mg; Ht2: hydrotalcite 1/2 Al/Mg. Single phase compositions are the same as in Figure 5. (a): Diagram constructed with elemental composition taken from chemical profiles in Figure 3 (right). (b): Diagram constructed with elemental compositions taken from punctual analysis of singular locations similar to those in Figure 4c–h.
Minerals 08 00362 g006
Figure 7. X-ray diffraction (XRD) powder diffraction patterns for in situ (35-3 sample: 1 mm thickness of bentonite at the concrete-bentonite interface) and small-scale laboratory experiments. Lab 6 and 18 months are θ/2θ scans performed directly on the bentonite interface flat surface with a grazing incidence X-ray equipment. FEBEX is the unaltered original bentonite. Mnt: montmorillonite; Crs: cristobalite; Qtz: quartz; Pl: Plagioclase; Cal: calcite; (060) Miller index for the characteristic diagnostic reflection for di or tri-octahedral sheet silicates.
Minerals 08 00362 g007
Figure 8. Fourier transform infrared (FTIR) spectra in the Mid-infrared region for the studied samples. cal: calcite.
Minerals 08 00362 g008
Figure 9. Mineral-dissolution equilibria for a Mg-montmorillonite (tied to a MgX2 exchanger; MgX2 + Ca2+ = CaX2 + Mg2+; log K = 0.8)/quartz/calcite mixture (FEBEX bentonite) at different pH fixed with the dissolution of portlandite (Ca(OH)2). Graphical representations were calculated using PHREEQCi geochemical code. (a): Equilibrium state of the dissolution-precipitation mineral assemblage expressed through saturation Index (SI = log (IAP/Ks); IAP: ion activity product; Ks: solubility constant. (b): Amount of minerals precipitated or dissolved to attain chemical equilibrium of the simulated alkaline dissolution environment of montmorillonite. Initial solutions were equilibrated with the mineral assemblage at pH 8, without the introduction of additional soluble ions (i.e., sodium, potassium, chlorides or sulphates).
Minerals 08 00362 g009
Table 1. Theoretical atomic composition of the single mineral phases used to plot the poles represented in the ternary diagram.
Mineral CationMntF FEBEXMntF BrcSrpStvSapTlcSepChlHt1Ht2
M+0.50.100.20.3500.033000
Al + Fe(3+)1.551.900.10.3500.066211
Mg(2+)0.453.032.7332.466532
Si(4+) 13.953.95243.6544.0300
1 basis of 4 Si in tetrahedral sheet; note: MntF: Montmorillonite FEBEX; MntFBrc: Monmorillonite FEBEX intercalated with charged brucitic layer (0.35 mol Al3+ substitution); Srp: serpentine; Stv: stevensite; Tlc: talc; Sep: sepiolite; Chl: Chlorite; Ht1: hydrotalcite 1/3 Al/Mg; Ht2: hydrotalcite 1/2 Al/Mg.
Table 2. Mineral phases and reactants considered in the calculations of mineral solution equilibria.
Equilibrium Phases (Thermoddem) 1Initial Amount (mol/L)Formula
Brucite0Mg(OH)2
C0.8SH (Ca/Si 0.8 C-S-H)0Ca1.6 Si2O6.1698H1.1396:1.6122H2O
Calcite1CaCO3
Hydrotalcite0Mg4Al2O7:10H2O
Montmorillonite, (High charge Mg Mnt)8Mg0.3Mg0.6Al1.4Si4O10(OH)2
Quartz(alpha)2SiO2
Saponite (Mg-saponite)0Mg0.17Mg3Al0.34Si3.66 O10(OH)2
C0.8A0.025SH0Ca1.6Al0.04Si2O6.2343H1.1486:1.63H2O
MSH06; (Mg/Si 0.6 M-S-H) 2:1 sheet0Mg0.82SiO2.385(OH)0.87
MSH12; (Mg/Si 1.2 M-S-H) ≈ 1:1 sheet0Mg1.07SiO2.075(OH)1.99
Sepiolite0Mg4Si6O15(OH)2:6H2O
MgX2 24
pH_FIX 310Ca(OH)2
1 [35]. 2 A cation exchanger was user defined to allow Ca/Mg exchange. 3 A reactant variable was defined to fix the pH of the equilibrium using the dissolution of Ca(OH)2.

