You are currently viewing a new version of our website. To view the old version click .
Minerals
  • Article
  • Open Access

9 July 2018

Geochemistry and Biomarker Analysis of the Bentonites from Esquivias (Toledo, Spain)

,
,
,
,
and
1
Department of Geology, University of Salamanca, 37008 Salamanca, Spain
2
Instituto de Geociencias (IGEO) (Complutense University of Madrid—Consejo Superior de Investigaciones Científicas), 28040 Madrid, Spain
3
Laboratory of Biomolecular Stratigraphy, Polytechnic University of Madrid, 28003 Madrid, Spain
4
Department of Mineralogy and Petrology, Complutense University of Madrid, 28040 Madrid, Spain
This article belongs to the Special Issue Authigenic Clay Minerals: Mineralogy, Geochemistry and Applications

Abstract

The Tajo Basin is one of the richest in Mg-clays known around the world. Mg-bentonites, kwon as pink clays and green clays, alter in the Intermediate Unit of the Miocene sediments. In this work, a new approach to the genesis of these bentonites is performed by studying for the first time the biomarkers present in these clays in relation to the mineralogy and geochemistry, as well as using discriminatory criteria between green and pink clays. Samples were collected at a quarry of Mg-bentonites, in the proximities of Esquivias (Toledo, Spain). Mineralogical characterization and semi-quantification (X-ray diffraction (XRD)) allowed a well-defined classification according to the mineralogical content of the samples to be established, differentiating four associations. Geochemical analyses are clearly linked to the mineralogy and provide criteria to differentiate the genesis of the materials studied. In this regard, green clays are interpreted as having a more detrital character than pink clays, which present a more authigenic character. Biomarkers (n-alkanes and n-alkanoic acids) were studied, not showing a clear link with the mineralogy as in the case of the geochemistry, but providing interesting information about the origin and degradation of the organic matter. Pink clays have higher contents in biomarkers than green clays, providing a discriminative criterion.

1. Introduction

The Tajo Basin is an intracratonic basin located in central Spain, formed as a result of the Alpine deformation. During the Miocene, the basin was mainly filled by alluvial fan, lacustrine and palustrine deposits distributed in a concentric pattern, whose origin was the weathering of the rocks from the surrounding mountain ranges (Cordillera Ibérica, Sierra de Altomira, Sistema Central and Montes de Toledo). The detrital facies are located at the margins of the basin, grading into mudflat and evaporitic facies at the central part. Its nature, characteristics and distribution have been described by several authors [1,2,3,4].
This basin is particulary interesting because it is one of the richest in Mg-clays, mainly sepiolite and Mg-smectite, which need high magnesium and silica contents to be formed, and the lack of potential source rocks with high Mg content to explain their formation [5]. These clays, which are intensively mined because of their high economic value, develop at the Intermediate Unit of the Miocene of the basin [6,7,8,9]. Sepiolite deposits are related to arkosic facies, sometimes with some content of palygorskite [10,11], while smectites are more concentrated in mudflat facies, more precisely in the “Green Clays Unit” [4,12,13,14,15,16,17], comprising both green and pink clayey levels. Green levels consist mainly of saponites of high purity, while pink levels are described as stevensitic [18,19] or kerolitic-stevensitic [20,21]. Their origins differ, being the green clays formed in a lacustrine environment while the pink ones correspond to palustrine environments [22]. Several geochemical studies have been performed on these clayey materials, both regarding the smectites [22,23,24] and the sepiolite–palygorskite deposits [25,26,27], establishing different correlations between certain elements and the probable origin of the clays in this. On the other hand, no biogeochemical analyses from these deposits have been found, although they are thought to reveal important information referring to the paleoenvironments in which they were formed.
The aim of this work is to study both green and pink clays, among other lithologies, of a locality in the proximities of Esquivias (Toledo, Spain). Both types of clays were characterized according to mineralogical, geochemical and biomarker analyses. These analyses were also aimed at deepening the knowledge of the different genesis of the clayey levels.

2. Materials and Methods

2.1. Sampling

28 samples were collected (ESB1–ESB28) in stratigraphic order in an exposure of a quarry in the proximities of the locality of Esquivias (Toledo, Spain) (Figure 1), corresponding to the Intermediate Unit of the Miocene of the Madrid Basin. Materials were classified as four simple lithologies, according to the non-sedimentological analysis, as green clays, pink clays, carbonates and micaceous sands, and the thickness of the sequence accounts a total of 10 m (Figure 2). Three samples were collected along the same pink clay bed (RESB3, RESB6, and RESB11) to observe lateral variations of the mineralogy.
Figure 1. Geographical localization [28]. Universal Transverse Mercator (UTM) coordinates: 30T 434,662.31 m E 4,437,322.5 m N.
Figure 2. Schematic stratigraphic column of the succession along with the location of the samples, mineral content (%) and major element composition in weight percentage.

2.2. Analythical Methods

Mineralogical characterization of the samples was carried out by X-ray diffraction (XRD) using a SIEMENS D-500 diffractometer with Cu Kα radiation and a graphite monochromator, at a scanning speed of 0.05° 2θ/1 s. The XRD studies were carried out on powdered samples (scanned from 2° to 65° 2θ) and on oriented air-dried samples, after solvation with ethylene glycol and after heating at 550 °C (scanned from 2° to 45° 2θ). Semi-quantification was performed through the reflective powers method [29].
Geochemical analyses of major and trace elements were performed at Activation Laboratories Ltd. (ACTLABS). For these analyses, 2 g of powdered sample were digested with aqua regia, along with appropriate international reference materials for the metals of interest, and diluted to 250 mL volumetrically. Major elements, along with Sc, Be, V, Sr, Zr and Ba, were analyzed by lithium metaborate/tetraborate fusion—inductively coupled plasma (ICP) and trace elements were analyzed by ICP-mass spectrometry (ICP-MS). The content in FeO was measured by titration and the content in F was measured by lithium metaborate/tetraborate fusion—ion selective electrode.
Biomarkers were studied in order to obtain the origin and the degree of degradation of the organic matter at the Laboratory of Biomolecular Stratigraphy of the Madrid School of Mines and Energy. Dried samples were ground and biomarkers extracted using accelerated solvent extraction (Dionex ASE 200). Free lipids were extracted with dichloromethane/methanol (2:1) at 1500 psi (10.34 MPa) and 175 °C. The heating phase was 8 min and the static extraction time 5 min. The extract was concentrated using rotary evaporation. Prior to analysis using gas chromatography–mass spectrometry (GC–MS), samples were methylated with trimethylsilyldiazomethane. Samples were injected into an HP 6890 gas chromatograph equipped with a selective mass detector (HP 5973) and an ATM-5 column (25 m × 0.25 mm; 0.20 µm). Helium was the carrier gas and we used decafluorobiphenyl an internal standard. The oven temperature was programmed from 60 to 300 °C (held 20 min) with a heating rate of 6 °C/min, and the injector was maintained at 275 °C. The identification and quantification of the n-alkanes was determined by the fragmentation ion m/z = 57, while the n-alkanoic acids were determined by the ion m/z = 74.
For the statistical analysis of data, we used SPSS and PAST [30] software.

3. Results and Discussion

3.1. Mineralogy

The XRD characterization allowed us to obtain the mineral composition of the samples: calcite (Cal), plagioclase (Pl), potassium feldspar (Kfs) and quartz (Qz), along with phyllosilicates such as chlorite (Chl), illite (Ilt), kaolinite (Kln) and smectite (Sme). The smectites found were identified as trioctahedral according to the d-spacing value of the 060 reflection at the bentonitic levels, located at the bottom of the column. The values of this reflection acquire both a di- and a trioctahedral character to the top of the column, due to the coexistence of dioctahedral illite and trioctahedral smectite, although we cannot discard the presence of dioctahedral inherited smectite.
Through the semi-quantification, we obtained the percentages these minerals represent in the mineral assemblage (Table 1) (Figure 2). According to the contents in the main minerals, we established 4 different mineralogical associations. Although all the aforementioned minerals were considered, though in different proportions, feldspars, kaolinite and chlorite were always minor components while the relative contents of smectite, illite, quartz and calcite played the main role in the establishment of the associations:
Table 1. Semi-quantification of the mineral content of the samples from X-ray diffraction (XRD). Calcite (Cal), chlorite (Chl), illite (Ilt), kaolinite (Kln), plagioclase (Pl), potassium feldspar (Kfs), smectite (Sme) and quartz (Qz).
  • Bentonitic samples: >45% smectite (ESB1, ESB2, ESB3, ESB4, ESB5, ESB6, ESB8, RESB3, RESB6, RESB11)
  • Illitic samples: >35% illite and illite > smectite (ESB10, ESB11, ESB12, ESB14, ESB17, ESB21, ESB22, ESB26, ESB27)
  • Sandy samples: >50% quartz + k-feldspar + plagioclase (ESB15, ESB16, ESB18, ESB23, ESB24, ESB28)
  • Carbonatic samples: >30% calcite (ESB7, ESB9, ESB13, ESB19, ESB20, ESB25)
All these associations corresponded either to detrital/inherited levels (sandy and illitic) or to probable authigenic levels (bentonitic and carbonatic), corresponding to different natures of the source area, such as periods of a higher energy (detrital input) or low energy. The bentonitic association includes both green and pink clays.

3.2. Geochemistry

We analyzed both major, including F (Table 2), and trace elements through ICP-MS. The trace elements considered were the high field strength elements (HFSE), transition trace elements (TTE), large-ion litophile elements (LILE) and rare earth elements (REE), as well as other trace elements such as Be, Ga, Ge, As, Y, Mo, Ag, In, Sn, Sb, W and Bi (Table 3), of 31 representative samples distributed vertically and horizontally. These analyses allowed the interpretation of the origin of the detrital materials through different means, such as the content in heavy non-soluble elements or different relations such as Th/U.
Table 2. Weight percentage (wt %) of major elements.
Table 3. Trace element content (µg/g).
Regarding major elements, we observed that the composition matches with the mineralogy (Figure 2). Sandy samples are characterized by a higher concentration of SiO2 while carbonatic samples have the highest content of CaO and MnO. Illitic samples present the highest content in Al2O3 and TiO2, and also tend to have a higher concentration of Fe2O3 and FeO (Table 2), although these last two majors also show high concentrations in some bentonitic and sandy samples respectively, playing an important role in their color due to hematite pigment formation [31,32]. Bentonitic samples show higher contents in MgO and F over all the other groups, matching the common references of F being related to authigenic processes [24,25]. Regarding the differences of major elements between pink and green clays, we can observe significant higher percentages of MgO and F in pink clays over green clays and of FeO, Fe2O3, Al2O3, K2O, TiO2 and P2O5 in green clays over pink clays (Table 2), allowing the discrimination between the two types of bentonites.
HFSE show higher concentrations in both sandy and illitic samples (Table 3), indicating a correlation with the detrital minerals. Sandy samples in general have higher concentrations of Zr, Hf and Th, while illitic samples have higher concentrations of Nb, Ta and U. The concentration of these elements in these samples is explained by their relative immobility and their association with heavy and more resistant minerals [33,34], in good agreement with the detrital origin proposed. Considering only the bentonitic samples, we find differences in the concentrations of Nb, Tl and Th between green and pink clays, being higher in the former than in the latter, indicating a more detrital character. Therefore, pink clays show a more authigenic character.
Th and U are commonly fractioned during external processes [35], being the Th/U ratios high in weathered profiles due to the relative high solubility of U in oxidizing conditions in comparison with relative immobility of Th. Under reducing conditions, U is insoluble and therefore the Th/U ratio shows lower values. We observe remarkable differences between the different types of samples (Figure 3), this ratio being higher than 1 in sandy and illitic samples, although this last group presents two samples with a value slightly lower than 1. The illitic association is a mixture of detrital quartz, illite, feldspar and neoformed smectite, therefore explaining its intermediate character between sandy and bentonitic samples. Bentonitic and carbonatic samples both present values below 1, except two bentonitic samples. Focusing on the differences between pink and green clays, we can observe a clear discrimination, having green clays values comprised between 0.6 and 1.15, while the values of this ratio for pink clays range between 0.2 and 0.55. As previously stated, lower values of the Th/U ratio are linked to reducing conditions and higher values to oxidizing conditions, therefore the interpretation of this ratio for bentonitic samples matches previous studies which indicate that pink clays were formed in reductive palustrine environments and green clays in oxidizing lacustrine environments [22].
Figure 3. Th/U ratio of the different mineral associations.
From the TTE, Ni cannot be taken into consideration, because all samples present values at or under the limit of detection. Samples from the illitic association show higher concentrations in all of these elements (Table 2), suggesting a correlation with elements belonging to this group, with the exception of V, which shows a wide variability within all the groups. We can observe within bentonitic samples that green clays present higher concentrations of Sc and Zn than pink clays.
LILE show a wider distribution than all the previous elements mentioned before (Table 3). Pb shows a high variability within each of the mineralogical associations, thus not being directly associated with any of them. Carbonatic samples present the highest amount of Sr, which can go up to 1622 µg/g as in sample ESB13. Illitic samples have higher concentrations of Cs and sandy samples present higher concentrations of Ba, while Rb is equally concentrated in these two groups of samples. These elements show remarkable differences in the concentrations of bentonitic samples, except Sr and Pb, being more concentrated in green than pink clays.
All the REE present higher concentrations at sandy and illitic samples, due to their low solubility and their preferential accumulation in the terrigenous fraction of the sediments [36]. As expected, green clays present higher concentrations of REE than pink clays. After chondrite normalization [37] (Figure 4), we can observe that all the samples show a relative enrichment in light REE (LREE) and a relative depletion in heavy REE (HREE), regardless of their mineral association. These relative enrichments and depletions are probably originated by a fractioning of the REE. We can also observe that there is always a negative Eu anomaly and that, in some bentonitic and illitic samples, there is a negative Ce anomaly, indicating a granitic rock source. Some carbonatic samples present positive Ce anomaly, linked to alkaline, carbonate-rich, aerobic lake waters [38].
Figure 4. Chondrite normalized rare earth element (REE) patterns.
The other trace elements show different associations, in one part because many of them show values below their detection limit (Mo, In, Ag and Bi) and in another due to the lack of correlatable characteristics. Be, Ga, Sn, W and Bi are present in higher concentrations in illitic samples (Table 3). Ge presents the highest concentrations in illitic and sandy samples. Y and Ag show their highest values in sandy samples, although illitic samples also show similar values. Mo shows a wide variation in its concentration, but it is more abundant at illitic and carbonatic samples. Sb also shows a wide variation, but in this case its content does not show remarkable contents in any of the mineral associations established. The lowest concentrations of As are found in the bentonitic samples, more precisely in pink clays, while in the remaining samples it appeared with similar concentrations values. Finally, In shows similar values within all the mineralogical associations, due to the fact that half the samples present contents in this element below de detection limits. The concentrations of these trace elements show notable differences between green and pink clays, except in the case of Be, Mo and Sb where some values overlap, and in the case of Ag, which does not allow any kind of differentiation of these two types of bentonitic samples, because they are all at or below the detection limit, except sample ESB8.
The results of the geochemical analyses match the predictable tendency for both major and trace elements. We are able to distinguish elements associated with a detrital origin more concentrated in illitic and sandy samples as well as elements of neoformation linked to bentonitic and carbonatic samples. We can also observe these differences within the bentonitic samples, being able to determine a higher detrital character of green clays with respect to pink clays. Bearing this in mind, we proceeded to perform a statistical treatment of the data.
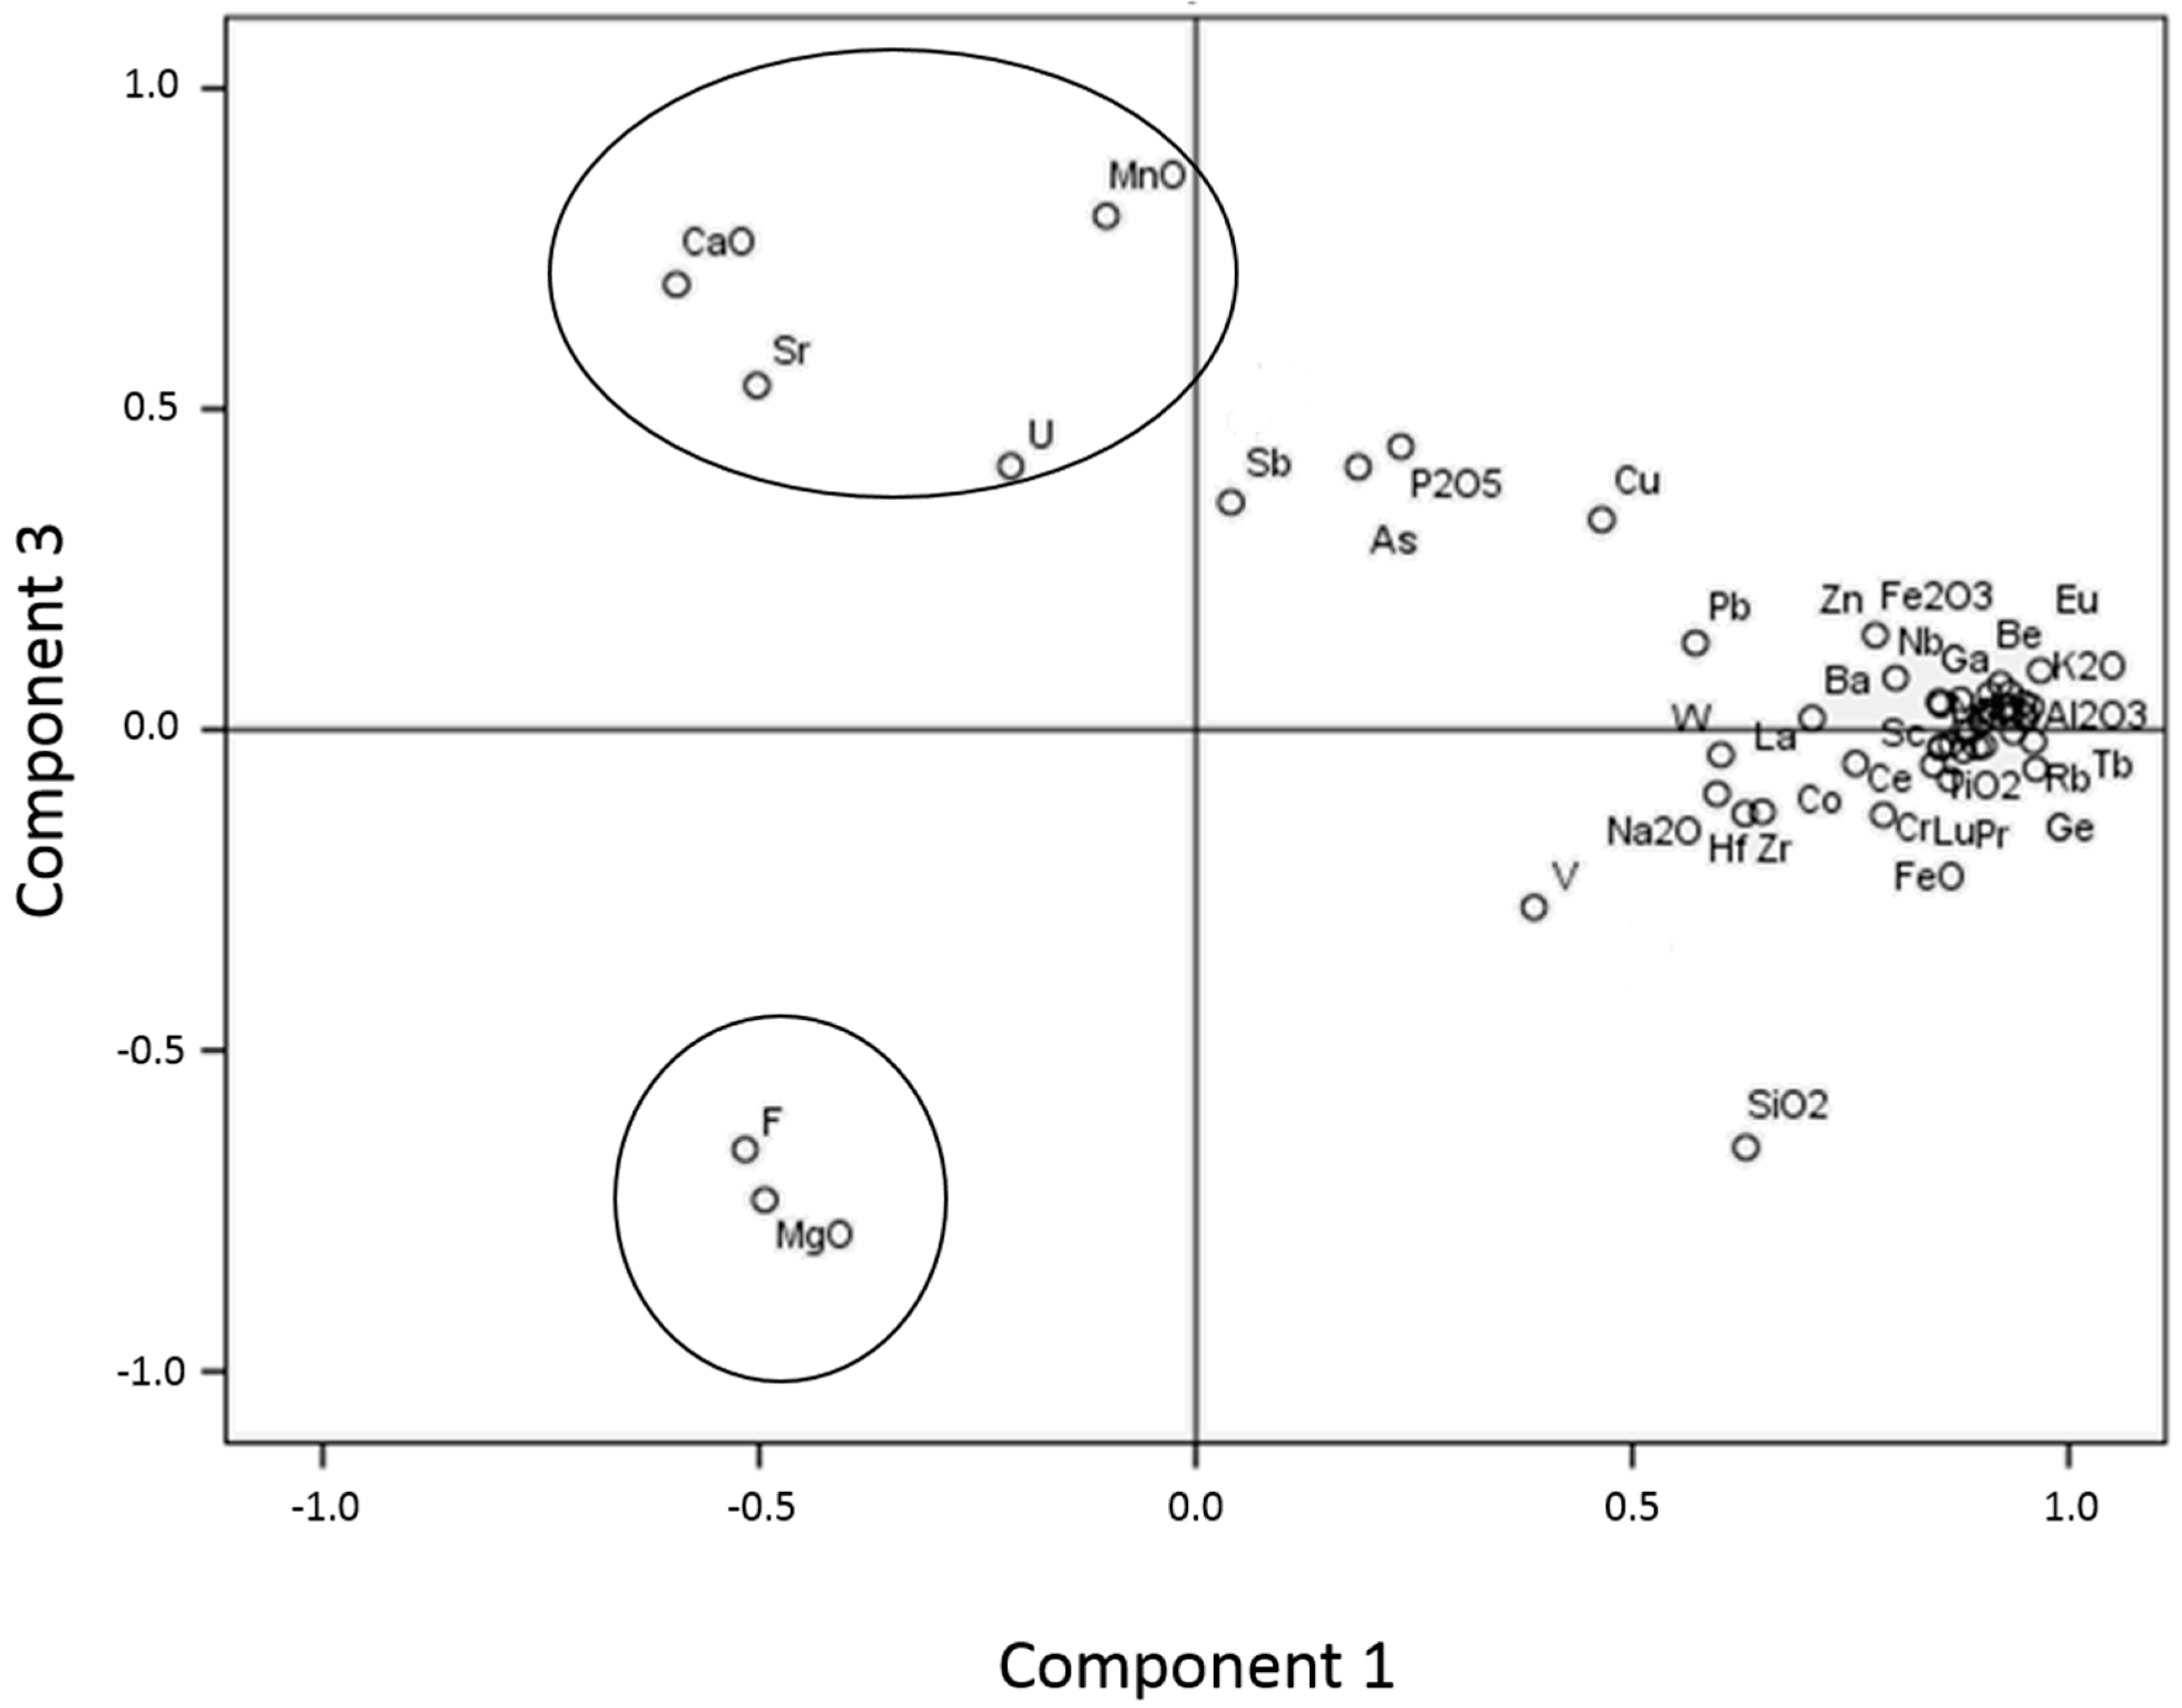
A principal component analysis (PCA) was performed (Figure 5) considering in the X axis the principal component 1 and in the Y axis the principal component 3. This statistical procedure helps analyze large size data sets with a large number of interrelated variables, reducing its dimensions while retaining as much as possible of the variation present in the data set [39]. It is important to remark that several elements which are below the detection limit within several samples (Mo, In, Ag and Bi) have not been considered for this type of analysis. The components used in the PCA were chosen after carefully examining a bivariate correlation matrix, which determines the empirical relationship between the different variables, and considering the comparison between them the most reliable. The resulting groups obtained through this method were easily assigned to the mineral associations established when considering the bivariate correlation matrix previously mentioned. F and MgO show significant correlation coefficients with each other as well as with smectite, being the only elements analyzed, along with V and W, which show this tendency (Table 4). CaO, MnO and Sr show significant correlation coefficients with each other as well as with calcite, in contrast to the rest of the elements analyzed (Table 5). U, which falls within this group, only shows a significant correlation with MnO. Considering the PCA as well as the bivariate correlation matrixes, we can state that only elements which show significant correlation coefficients with each other and with a certain mineral should be considered linked to that precise mineral. Therefore, MgO and F are attributed to the bentonitic samples and CaO, MnO and Sr to carbonatic samples. The rest of the elements, which fall within a range which is hardly differentiable at some points, are attributed to the illitic and sandy samples. While the groups linked to bentonitic and carbonatic samples are interpreted as being linked to neoformation processes, the other group is considered to have a detrital origin. This matches the associations of HFSE, Y and Ti being related to heavy and immobile minerals, such as monazite and zircon, present as accessory minerals in small quantities within sandy samples [33,34,40,41,42], and Rb and Ba to potassium feldspar [43].
Figure 5. Principal component analysis (PCA) of the geochemical data.
Table 4. Bivariate correlation matrix of F, MgO, Ag, In, V, W and smectite.
Table 5. Bivariate correlation matrix of MnO, CaO, Sr, U and calcite.
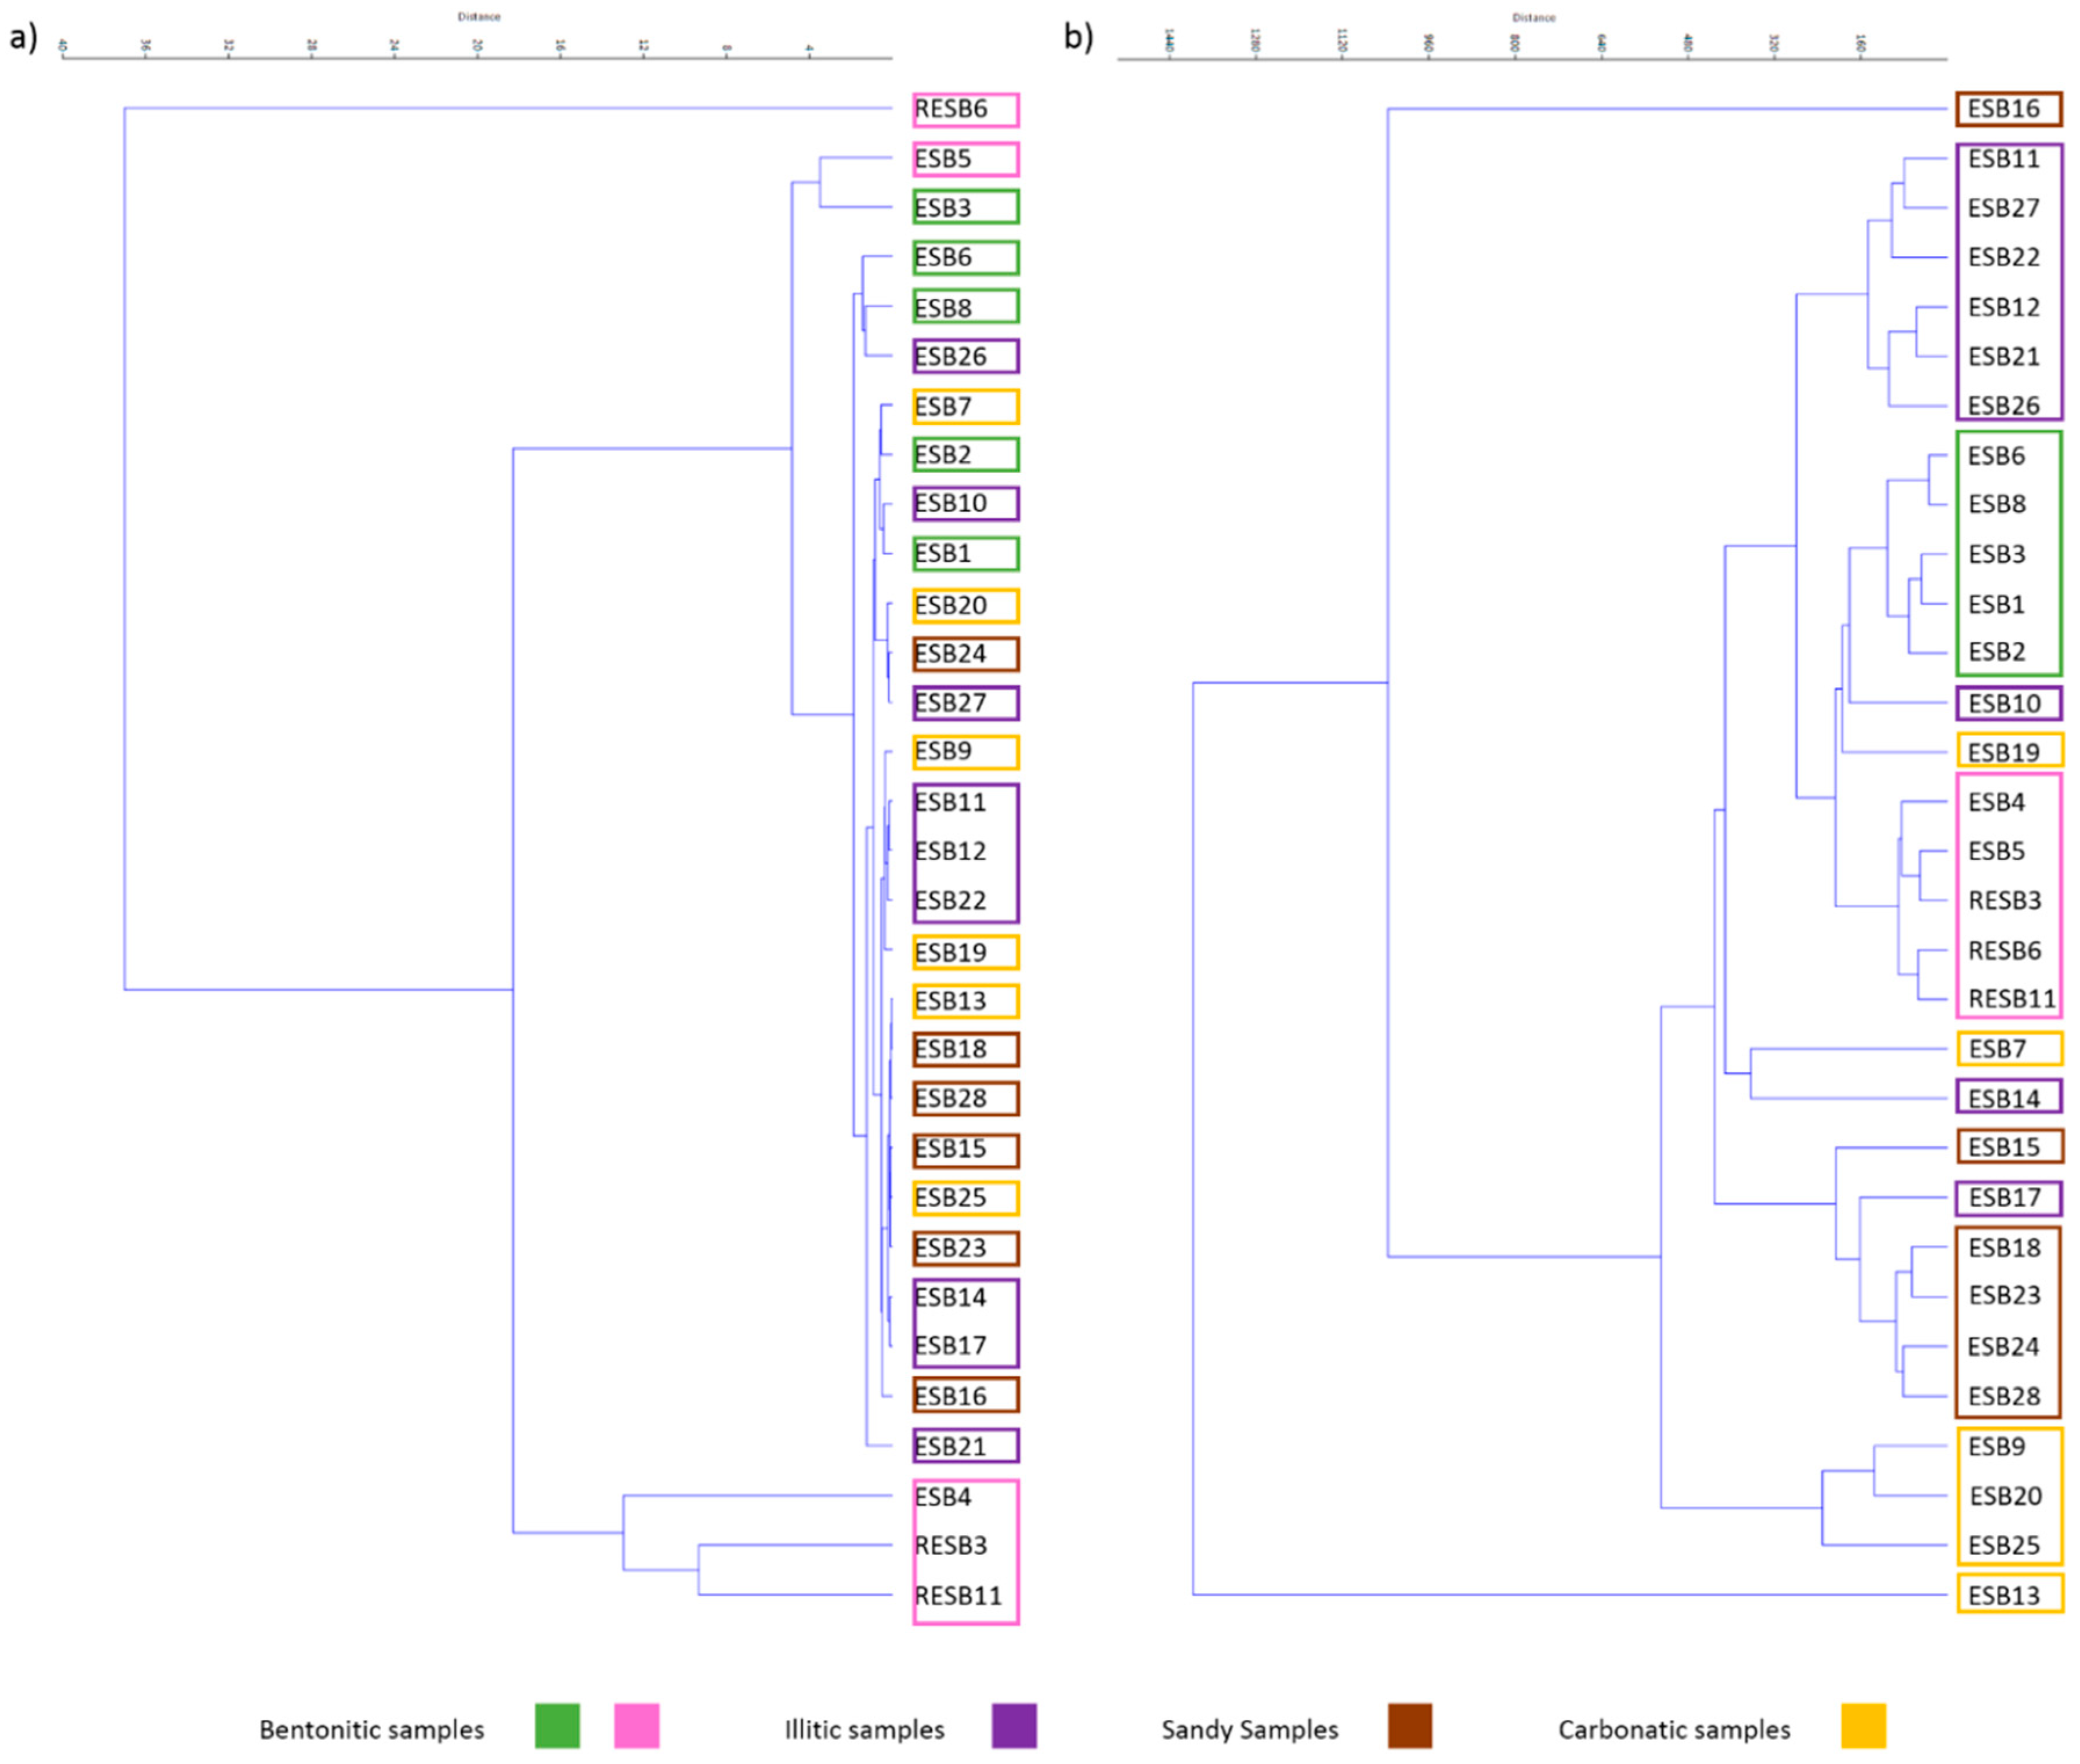
Multivariate clustering was performed with all the geochemical data (Figure 6), obtaining pretty good grouping of the different mineral associations established according to the XRD data. There are some samples that do not group, which is probably due to its composition being close to the mineralogical limits marking the different groups. As the main purpose of this paper is to obtain discrimination criteria between the two types of bentonitic samples (green and pink clays), we also performed multivariate clusters. Green and pink clays (Figure 7) cannot be separated when we consider the mineralogy, major elements, HFSE and TTE, but when the clustering is performed considering LILE, REE and the other trace elements analyzed, we observe a good grouping of these samples. It is important to remark that, when performing the cluster considering the other trace elements we have not considered the elements that have a high percentage of samples below the detection limit (Ag, In, Mo and Bi).
Figure 6. Multivariate cluster of the geochemical data.
Figure 7. Multivariate clusters of the different elements analyzed for green (continuous line) and pink (discontinuous line) clays.
All these mineralogical associations established correspond either to detrital/inherited levels (sandy and illitic) or to probable authigenic levels (bentonitic and carbonatic), corresponding to different sedimentary environments, such as periods of a higher energy (detrital input) or low energy. The bentonitic association includes both green and pink clays.

3.3. Biogeochemistry

We analyzed n-alkanes (Table 6) and n-alakanoic acids (Table 7) in all the samples from the sampled section through gas chromatography–mass spectrometry (GC–MS). The biomarkers indicated low mature organic matter as expected, i.e., clays studied here were not buried substantially and diagenetic processes were not significant. Therefore, the information provided by the biomarkers here is centered in the origin and the degree of degradation of the organic matter. In the case of n-alkanes, the chain lengths analyzed went from 15 to 36 carbon atoms while the n-alkanoic acids had chain lengths from 12 to 33 carbon atoms.
Table 6. n-alkanes content (µg/g) of the samples analyzed.
Table 7. n-alkanoic acids content (µg/g) of the samples analyzed.
Several indexes were employed in the study of the n-alkanes, such as the carbon preference index (CPI) [44], predominant chain length (PCL), average chain length (ACL) [45], Paq [46] and the terrigenous/aquatic ratio for hydrocarbons (TARHC) [47]. The proxies employed for n-alkanoic acids were the PCL and the terrigenous/aquatic acid ratio for fatty acids (TARFA) [48,49].
Regarding the n-alkanes, we observe an odd-over-even predominance of carbon number, indicating immature samples. This observation coincides with the interpretation of the carbon preference index (CPI; [44]), calculated as ½[(ΣCi + Ci+2 + ... + Ci+8)/(ΣCi−1 + Ci+1 + ... + Ci+7) + (ΣCi + Ci+2 + ... + Ci+8)/(ΣCi+1 + Ci+3 + ... + Ci+9)], with i = 25, which is commonly used to discriminate between mature and immature organic matter in sediments, because it indicates the predominance of odd-over even numbered 
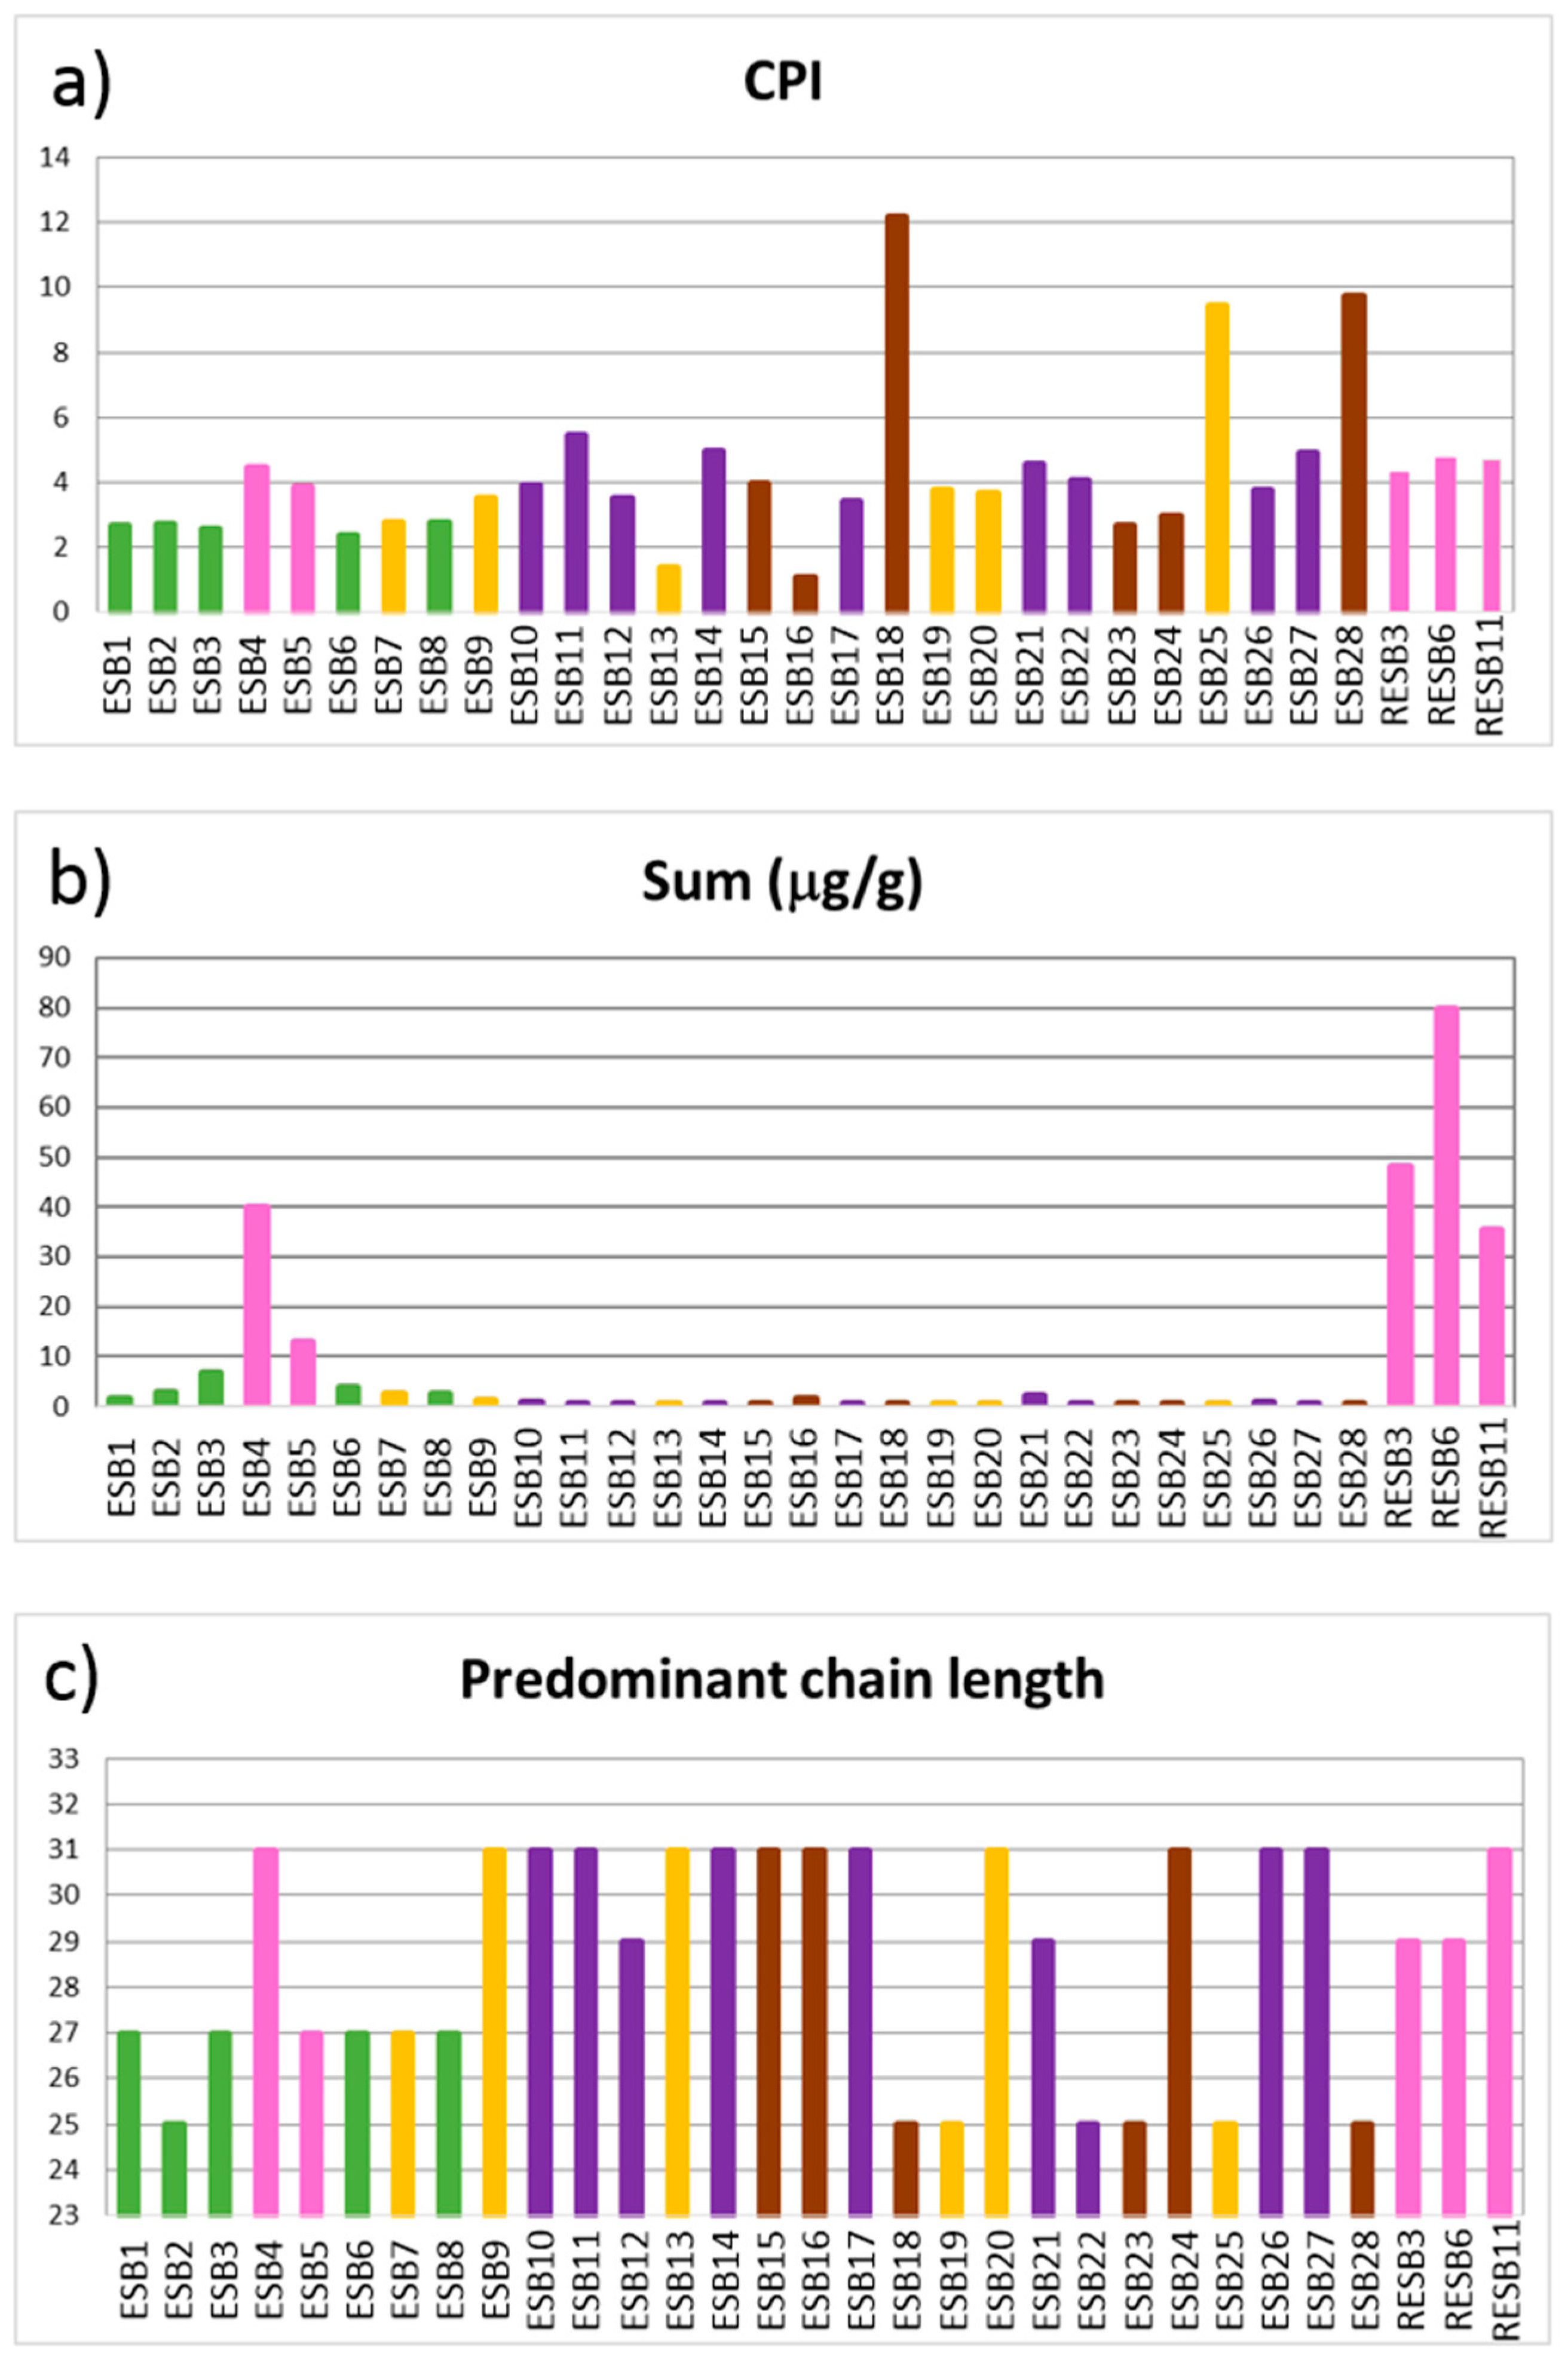
n-alkanes of a certain chain length. The CPI ratio shows values superior to 2, except in samples ESB13 and ESB16 (Figure 8a), that present values close to 1. Samples with CPI values > 2 are interpreted as not having suffered an important maturity of the organic matter, while when the CPI value is close to 1, microbial degradation or diagenetic processes are responsible for this [50]. This interpretation matches with the macroscopial aspect of sample ESB13, which is a non-lithified vein clearly formed due to post-sedimentary processes, being composed by calcite in its totality.
Figure 8. Projection of the proxies from the n-alkanes. (a) Carbon preference index (CPI); (b) Sum of the concentration of all the n-alkanes; (c) Predominant chain length (PCL). (Green): green clays; (Pink): pink clays; (Purple): illitic samples; (Brown): sandy samples; (Yellow): carbonatic samples.
The predominant n-alkane chain varies between C25, C27, C29 or C31. (Figure 8c) indicating a major input from aquatic macrophytes and terrestrial plants as the C25 homologue is predominant in the former [46], and C27, C29 or C31 are abundant in the latter [45,51,52,53,
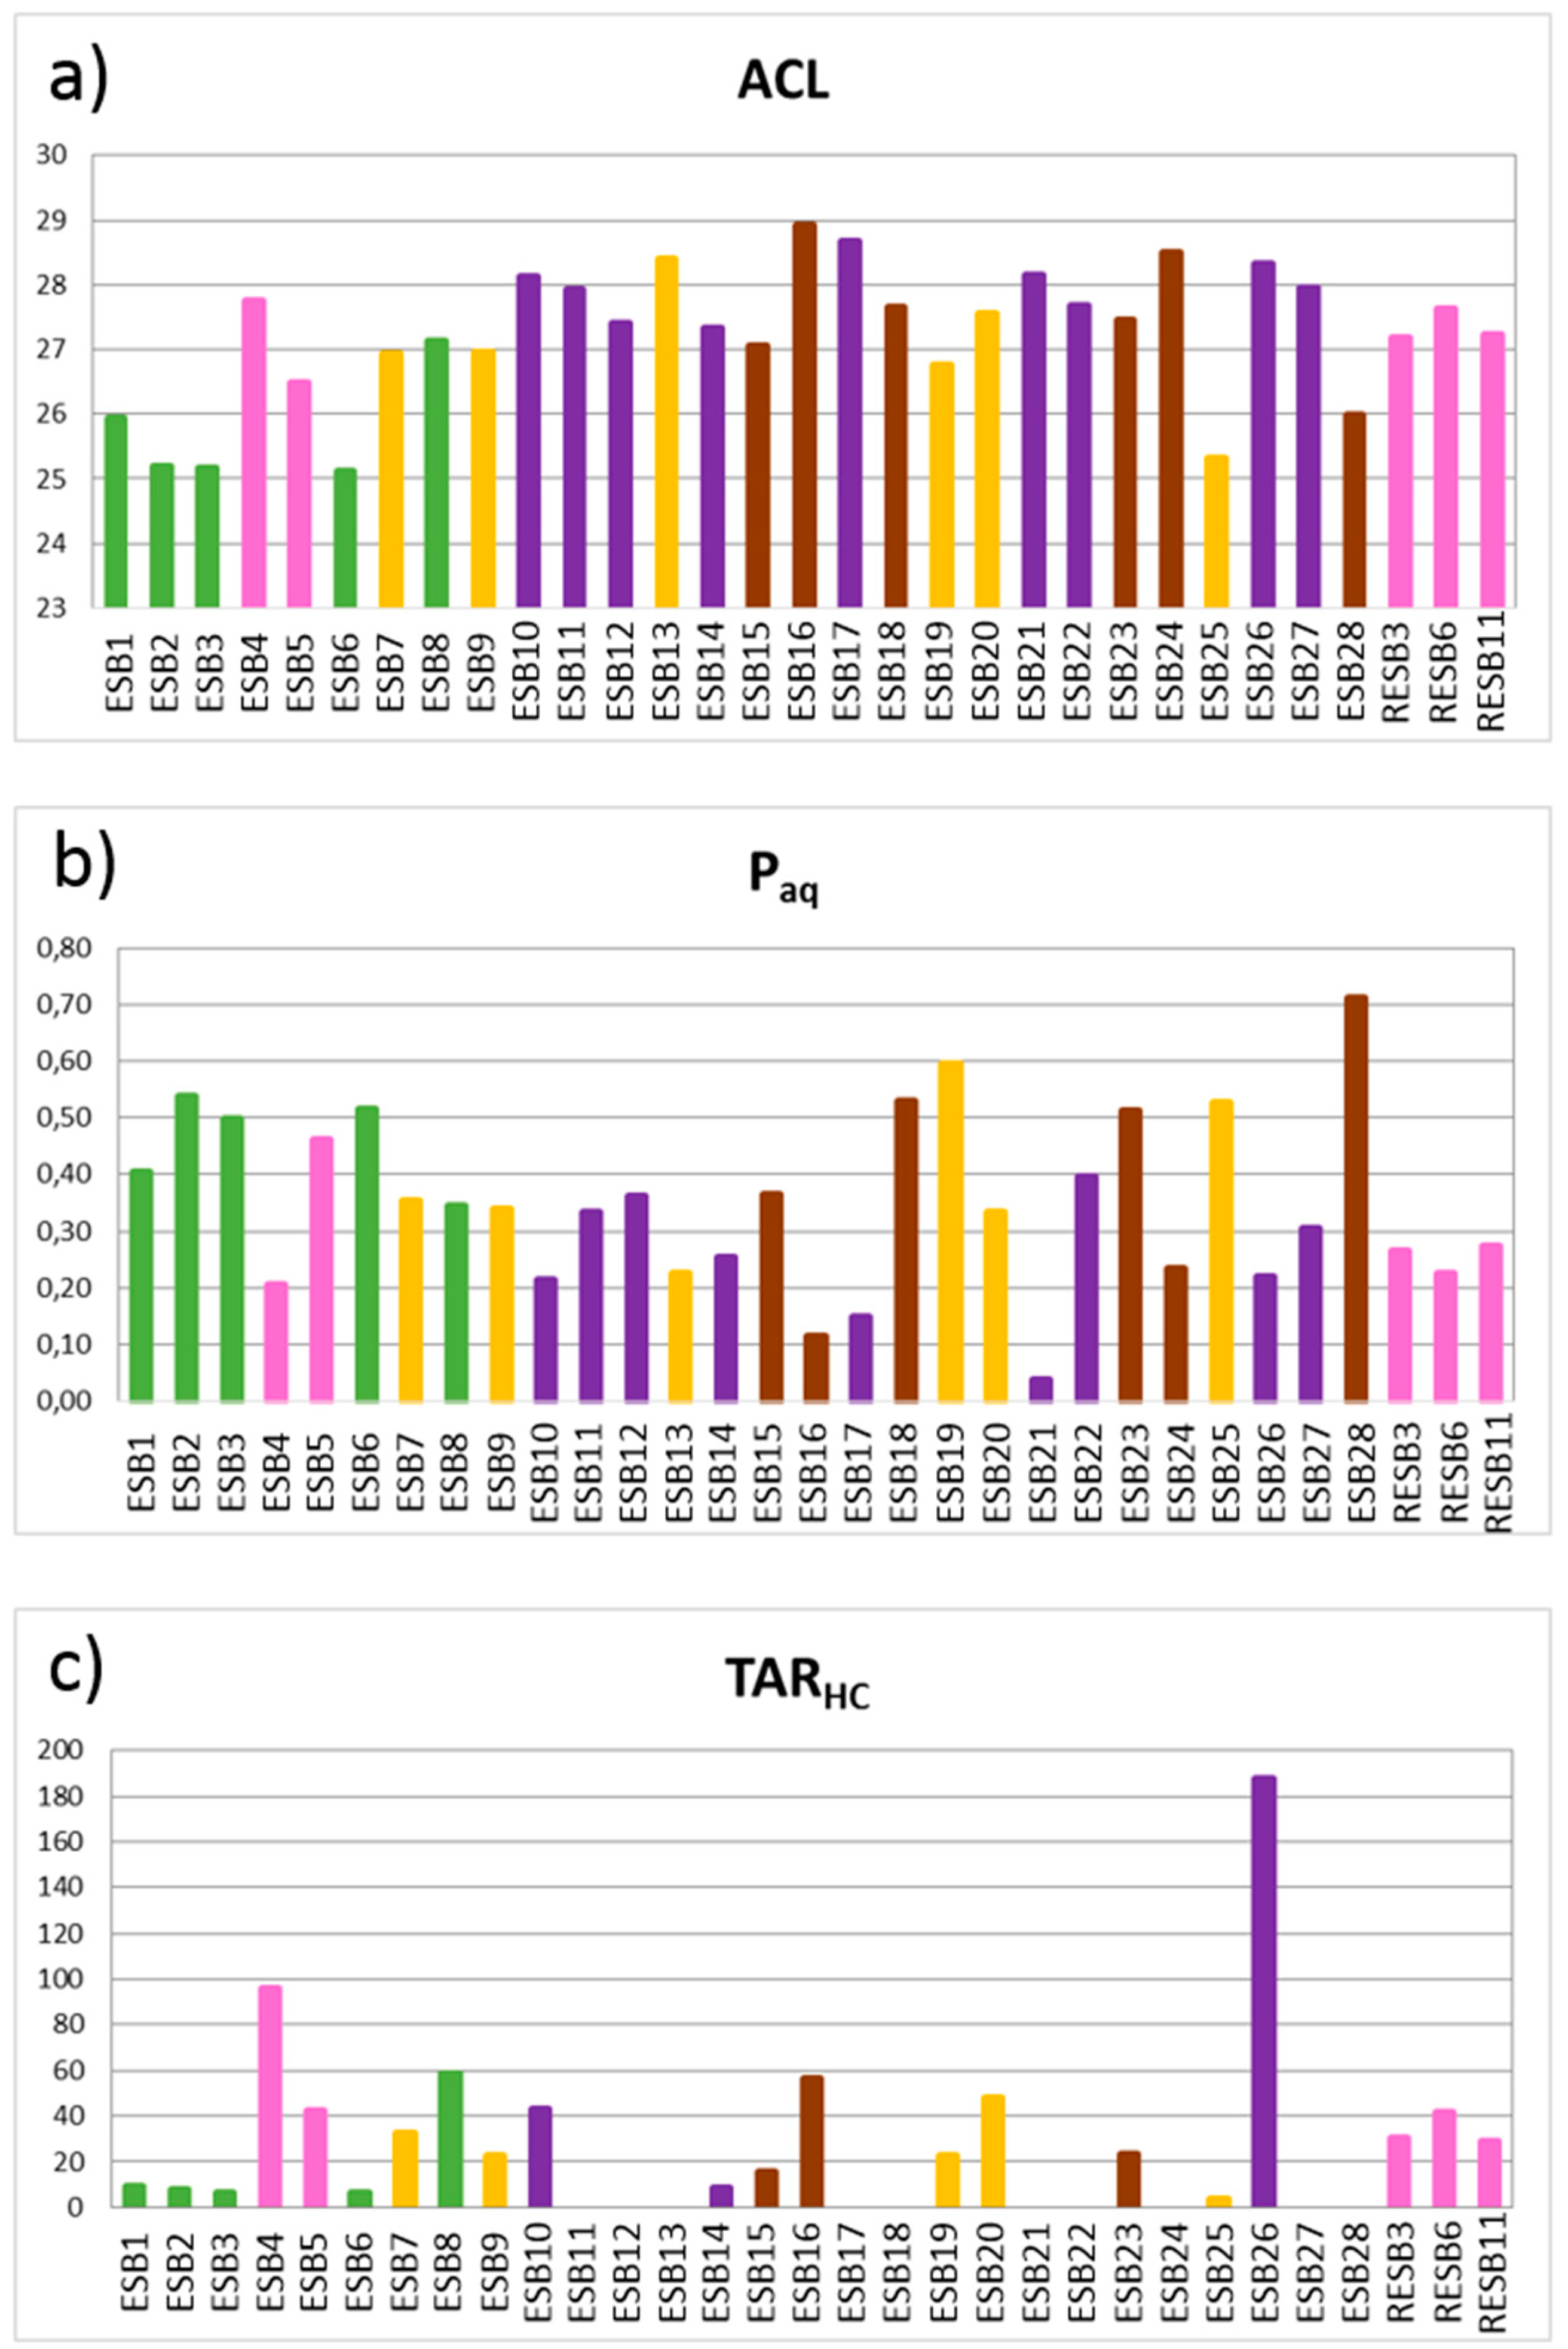
54]. This interpretation coincides with that of the average chain length (ACL; [55], calculated as [(Ci × i + Ci+1 × (i + 1) + Ci+2 × (i + 2) ... + Cn × n))/(ΣCn+1 + Cn+2 + ... + Cn), with i = 13, n = 33], which is a good proxy for distinguishing between the predominance of low vs. high molecular weight n-alkanes [54,56]. The ACL oscillates between 25 and 29 (Figure 9a), linked to a major input from aquatic macrophytes and terrestrial plants. However, there is no evidence of a relationship with the mineralogy because these values differ in samples from within the same association.
Figure 9. Projection of the proxies from the n-alkanes. (a) Average chain length (ACL); (b) Paq index; (c) Terrigenous/aquatic acid ratio (TARHC). (Green): green clays; (Pink): pink clays; (Purple): illitic samples; (Brown): sandy samples; (Yellow): carbonatic samples.
In this regard, some bentonitic (ESB1, ESB2, ESB3 and ESB6), carbonatic (ESB25) and sandy samples (ESB28) have low ACL values, probably indicating a similar source of the organic matter. According to bibliographical references [54], these samples are linked to important aquatic macrophytes input. Therefore, samples having an aquatic origin belong to different groups of samples, according to these data. The remaining samples show higher ACL values, indicating a terrestrial origin, although with certain influence of aquatic macrophytes.
Focusing on the abundance of n-alkanes, the highest values are linked to the betonitic samples, more obviously in the pink clays (Figure 8b). The correlation matrix between mineralogy and biomarker concentrations shows that the only mineral which presents a positive significant correlation is smectite (Table 8), justifying the higher concentrations at the bentonitic samples. This higher concentration within bentonitic samples, especially within pink clays, can be justified by the high specific surface area of these materials, being higher in pink clays [19] than in green clays [57].
Table 8. Correlation matrix of the total content in n-alkanes (µg/g) and mineral content of the samples.
The Paq index, calculated as the (C23 + C25)/(C23 + C25 + C29 + C31) ratio [46], was postulated to reflect the relative contribution of emergent and submerged/floating aquatic macrophytes, which typically maximize at C23 and C25. In general, the Paq index (Figure 9b) shows values comprised between 0.1 and 0.6, indicating a mixed input of aquatic macrophytes and terrestrial plants [46], coinciding with the interpretation of the n-alkane predominant chain length and ACL values. However, an illitic (ESB21) and a sandy sample (ESB28) fall out of this range.
The terrigenous/aquatic ratio (TARHC) index (Figure 9c), calculated as (C31 + C29+ C27)/(C15 + C17 + C19) [47], was studied in order of distinguishing between land plants and algal input, its being higher values associated with a higher input of land plants and lower values with a higher algal input. It must be highlighted that it was not possible to obtain this proxy for several samples, due to lack of low molecular weight n-alkanes. There are two families of samples, characterized by values over and below 20, regardless of their mineralogy. Samples with lower values are bentonitic (ESB1, ESB2, ESB3 and ESB6), illitic (ESB14), sandy (ESB15) and carbonatic (ESB25), and are interpreted according to [47] as having a mixed origin of organic matter, while samples with a higher value are interpreted as having a more important input of terrestrial organic matter.
The n-alkanoic acid predominant chain length show a unimodal distribution maximizing at C16 (Figure 10a), although several samples show a bimodal distribution maximizing at C24 and C28. The samples with a bimodal distribution are bentonitic, both pink and green clays. It is important to remark that not all of the bentonitic samples show the same distribution. The lack of correspondence between the PCL and ACL of n-alkanes and n-alkanoic acids (Figure 9 and Figure 10) suggests a certain preferential microbial synthesis of long-chain saturated fatty acids from primary organic matter (OM) and/or bacterial activity producing an increase in short chain homologues (mainly C16 and C18), i.e., n-alkanoic acids in lake sediments typically originate from multiple sources (algae, aquatic macrophytes, land plants), but they are more sensitive to degradation and modification than other types of lipid biomarker [58]. Thus, the n-alkanoic acid content reveals not only the OM source but can also be used to evaluate the degree of preservation, especially when the n-alkanes distribution does not coincide with the n-alkanoic acid one.
Figure 10. Projection of the proxies from the n-alkanoic acids. (a) Predominant chain length (PCL); (b) Sum of the concentration of all the n-alkanoic acids; (c) Terrigenous/aquatic acid ratio (TARFA). (Green): green clays; (Pink): pink clays; (Purple): illitic samples; (Brown): sandy samples; (Yellow): carbonatic samples.
We calculated the terrigenous/aquatic ratio for fatty acids (TARFA) as (C24 + C26+ C28)/(C12 + C14 + C16) [47] to distinguish between algal (low TARFA values) vs. land plant sources (high TARFA values). However, selective degradation and diagenetic processes commonly overprint n-alkanoic acid distributions. Short-chain acids are often preferentially degraded by microbes during early diagenesis [59,60] and they produce higher TARFA values [49]. On the other hand, the microbial synthesis of secondary fatty acids from primary OM produces short-chain components [60] and can depress TARFA values. The low TARFA values (Figure 10c), along with the unimodal distribution of n-alkanoic acids, maximizing mainly at C16, and the most abundant alkanes being C25 to C31, point to the occurrence of microbial degradation of high molecular weight n-alkanoic acids from primary organic matter, a process that produces short-chain homologues [61], with the exception of samples ESB3, ESB4, ESB5, ESB8, RESB3, RESB6 and RESB11, as will be further discussed.
The TARFA index (Figure 10c) shows two different groups of samples. On one hand, we have samples with values lower than 1 and, on the other, samples whose values are higher than 1. The latter group is formed by eight bentonitic samples (ESB3, ESB4, ESB5, ESB6, ESB8, RESB3, RESB6 and RESB11) and one carbonatic sample (ESB7). The values of the TARFA index indicate that the organic matter present in these samples did not suffer important degradation processes as in the other samples [48,49].
As in the case of the n-alkanes, it is possible to observe a higher concentration of n-alkanoic acids in the bentonitic samples, and especially in the pink clays (Figure 10b). The correlation values of the mineralogy and biomarkers also show the same tendency (Table 9), smectite being the only mineral significantly correlated to the alkanoic acids.
Table 9. Correlation matrix of the total content in n-alkanoic acids (µg/g) and mineral content of the samples.
Summarizing the interpretations of the biomarkers analyzed, we can observe several clashes between them. Different proxies employed for the study of n-alkanes reveal that pink clays have a more important input of organic matter of terrestrial origin, while green clays show a higher input of aquatic macrophytes (PCL, ACL and Paq). The Paq index values indicate that a pink clay (ESB5) has more aquatic macrophytes input than the rest of the pink clays, clashing with all the other proxies studied.
The n-alkanoic acid PCL indicates that three green clays (ESB1, ESB2 and ESB6) have suffered important organic matter degradation, while the TARFA values show that only two green clays (ESB1, ESB2) have undergone important organic matter degradation. The rest of the bentonitic samples are interpreted, according to both proxies, as not having suffered important organic matter degradation.
The PCL of the n-alkanes shows all pink clays and one green clay (ESB2) as having a major input of organic matter of terrestrial origin, which is corroborated by the n-alkanoic acid PCL values, these latter also indicate that all the pink clays and one green clay (ESB8) did not suffer important organic matter degradation. This is confirmed with the low TARHC values in all pink clays and one green clay (ESB8), together with TARFA values, showing that all pink clays and three green clays (ESB3, ESB6, ESB8) have a major input from land plants and suffered less important organic matter degradation). These differences are probably caused by selective degradation and diagenetic processes, which commonly overprint n-alkanoic acid distributions.
A multivariate cluster analysis of the biomarkers data was performed (n-alkanes + n-alkanoic acids) (Figure 11a), not grouping well in respect to the mineralogical associations established. This indicates that the biomarker content is not related to the mineralogical characteristics of the samples, in an opposite way to the geochemical data. Performing a multivariate analysis including biomarkers and geochemical data (Figure 11b), it is possible to observe the same cluster than when considering only the geochemical data (Figure 6), reinforcing the idea that biomarkers do not help in the discrimination between the different mineralogical associations established.
Figure 11. (a) Multivariate cluster of the biomarkers’ content; (b) Multivariate cluster of the biomarker plus geochemical contents.
Thus, it seems evident that biomarkers, in contrast to the geochemical analyses, are not related to the mineralogy. Only the total concentration of both n-alkanes and n-alkanoic acids seems to be directly correlated to smectite, and therefore to the bentonitic samples. The interpretation of biomarkers also discards the idea that samples having similar mineral associations belong to similar sedimentary environments, as can be seen from different proxies obtained from the n-alkanes analysis. Biomarkers also give contradictory sedimentological interpretations with those from bibliographical references of the Tajo Basin, such as pink clays being formed in a reducing palustrine environment and green clays in an oxidizing lacustrine one [22], which agree with the geochemical analysis presented in this paper; therefore, having different ratios of organic matter degradation, clashing with the interpretation of the TARFA proxy of the n-alkanoic acids. It must be highlighted that organic matter incorporates during the sedimentation processes many sources (algal, aquatic macrophytes, land plants) and also has variable degree of preservation. During diagenesis original organic matter suffers alteration when sinking to the lake bottom, but biomarkers retain key information about their origin [58]. Thus, biomarkers reveal not only the organic matter source but can also be used to evaluate the degree of preservation and diagenesis.

4. Conclusions

The geochemical and biogeochemical analyses of these samples lead us to the following concluding remarks:
  • MgO and F are correlated with bentonitic samples and MnO, CaO and Sr with the carbonatic samples, both of these types of samples having an authigenic origin. The rest of the major and trace elements are linked to both illitic and sandy samples, which have a detrital origin.
  • It is possible to distinguish elements associated with a detrital origin, more concentrated in illitic and sandy samples, as well as elements of neoformation linked to bentonitic and carbonatic samples. These differences can be observed also within the bentonitic samples, because green clays have a higher detrital character than pink clays.
  • Green and pink clays are mainly differentiated by their LILE, REE and other trace elements content, along with elements from the other groups to a lesser extent.
  • Biomarker analyses provide interesting information, although they are not discriminant by themselves, due to the apparent lack of relationship with the mineralogical content of the samples. The lack of correlation is probably originated by the postdepositional degradation of the studied biomarkers.
  • The correlation values of the mineralogy and biomarkers show that smectite is the only mineral significantly correlated to them. The n-alkanes and n-alkanoic acids present higher concentrations at the bentonitic samples, especially within pink clays.

Author Contributions

J.G.-R. collected the samples, performed the XRD characterization, interpreted all the data and wrote the original draft of the paper. T.T., Y.S.-P. and J.E.O. performed the biomarker analyses and first interpreted them. M.S. and E.G.-R. conceived the study, supervised its progress and reviewed the original draft of the paper.

Funding

This research was funded by the Spanish Ministerio de Economía y Competitividad project CGL2016-77005-R. The Spanish Ministerio de Economía y Competitividad is acknowledged for the funding of the predoctoral contract of Javier García-Rivas (BES-2013-065092).

Acknowledgments

We would like to thank the three anonymous reviewers for their careful review of our manuscript and their insightful comments and suggestions.

Conflicts of Interest

The authors declare no conflict of interest. The founding sponsors had no role in the design of the study; in the collection, analyses, or interpretation of data; in the writing of the manuscript, and in the decision to publish the results.

References

  1. Calvo, J.P.; Alonso Zarza, A.M.; García Del Cura, M.A. Models of Miocene marginal lacustrine sedimentation in response to varied depositional regimes and source areas in the Madrid Basin (Central Spain). Palaeogeogr. Palaeoclimatol. Palaeoecol. 1989, 70, 199–214. [Google Scholar] [CrossRef]
  2. Bellanca, A.; Calvo, J.P.; Censi, P.; Neri, R.; Pozo, M. Recognition of lake-level changes in Miocene lacustrine units, Madrid Basin, Spain. Evidence from facies analysis, isotope geochemistry and clay mineralogy. Sediment. Geol. 1992, 76, 135–153. [Google Scholar] [CrossRef]
  3. Domínguez Díaz, M.C. Mineralogía y Sedimentología del Neógeno del sector Centro-Occidental de la Cuenca del Tajo. Ph.D. Thesis, Universidad Complutense de Madrid, Madrid, Spain, 1994. [Google Scholar]
  4. García-Romero, E. Estudio mineralógico y Estratigráfico de las Arcillas de las Facies Centrales del Neógeno del Borde sur de la Cuenca del Tajo. Ph.D. Thesis, Universidad Complutense de Madrid, Madrid, Spain, 1988. [Google Scholar]
  5. García-Romero, E. Génesis de arcillas magnésicas en la Cuenca de Madrid: Interrogantes planteados. Bol. Geológico Min. 2004, 115, 629–640. [Google Scholar]
  6. Mejías, A.G.; Leguey, S.; Ordóñez, S. Interpretación tectonosedimentaria de la génesis de fibrosos de la arcilla en series detríticas continentales (Cuencas de Madrid y del Duero). España. In Quinto Congreso Latinoamericano de Geología, Actas, II; Servicio Geologico Nacional: Santo Domingo, Dominican Republic, 1982; pp. 427–439. [Google Scholar]
  7. Mejías, A.G.; Ordóñez, S.; Calvo, J.P. Nuevas aportaciones al conocimiento geológico de la Cuenca de Madrid. Rev. Mater. Procesos Geológicos 1983, 1, 163–191. [Google Scholar]
  8. Alberdi Alonso, M.T.; Hoyos Gómez, M.; Junco Aguado, F.; López Martínez, N.; Morales, J.; Sesé, C.; Soria, D. Biostratigraphie et evolution sedimentaire du Neogene continental de l’aire de Madrid. In Interim Colloquium on Mediterranean Neogene Continental Paleoenvironments and Paleoclimatic Evolution; R.C.M.N.S.: Montpellier, France, 1983; pp. 15–18. [Google Scholar]
  9. Junco Aguado, F.; Calvo, J.P. Cuenca de Madrid. In Libro Jubilar de J.M. Ríos. Geología de España; Comba, J.A., Ed.; IGME: Madrid, Spain, 1983; Volume 1, pp. 534–543. [Google Scholar]
  10. Leguey, S.; Pozo, M.; Medina, J.A. Polygenesis of sepiolite and palygorskite in a fluvio-lacustrine environment in the Neogene Basin of Madrid. Mineral. Petrogr. Acta 1985, 29A, 287–301. [Google Scholar]
  11. Pozo, M.; Medina, J.A.; Leguey, S. Mineralogénesis de paligorskita en la zona central de la Cuenca de Madrid. Bol. Soc. Esp. Mineral. 1985, 8, 271–283. [Google Scholar]
  12. Brell, J.M.; Doval, M.; Caramés, M. Clay mineral distribution in the evaporitic Miocene sediments of the Tajo Basin, Spain. Mineral. Petrogr. Acta 1985, 29, 267–276. [Google Scholar]
  13. Doval, M.; Domínguez Díaz, M.C.; Brell, J.M.; García-Romero, E. Mineralogía y sedimentología de las facies distales del borde norte de la cuenca del Tajo. Bol. Soc. Esp. Mineral. 1985, 8, 257–269. [Google Scholar]
  14. Doval, M.; García Santiago, P.; Domínguez Díaz, M.C.; Brell, J.M. Mineralogía de las arcillas de las facies evaporíticas de la Cuenca del Tajo. Trabajos de Geología 1985, 15, 267–274. [Google Scholar]
  15. García-Romero, E.; Brell, J.M.; Doval, M.; Navarro, J.V. Caracterización mineralógica y estratigráfica de las formaciones neógenas del borde sur de la Cuenca del Tajo (Comarca de la Sagra). Bol. Geológico Min. 1990, 101, 945–956. [Google Scholar]
  16. Pozo, M.; Moreno, A.; Casas, J.; Martín Rubí, J.A. Estudio geoquímico de litofacies con arcillas magnésicas en depósitos lacutres-palustres de la Cuenca de Madrid. Bol. Soc. Esp. Mineral. 1996, 19, 71–83. [Google Scholar]
  17. Domínguez Díaz, M.C.; Brell, J.M.; Doval, M.; García-Romero, E. Análisis de los minerales de la arcilla y sus procesos genéticos en las formaciones arcillosas de la Cuenca del Tajo. Estud. Geológicos 1997, 53, 185–196. [Google Scholar] [CrossRef]
  18. De Santiago Buey, C.; Suárez Barrios, M.; García-Romero, E.; Domínguez Diaz, M.C.; Doval Montoya, M. Electron microscopic study of the illite-smectite transformation in the bentonites from Cerro del Aguila (Toledo, Spain). Clay Miner. 1998, 33, 501–510. [Google Scholar] [CrossRef]
  19. De Santiago Buey, C.; Suárez Barrios, M.; García-Romero, E.; Doval Montoya, M. Mg-rich smectite “precursor” phase in the Tagus Basin, Spain. Clays Clay Miner. 2000, 48, 366–373. [Google Scholar] [CrossRef]
  20. Martin de Vidales, J.L.; Pozo, M.; Alia, J.M.; Garcia-Navarro, F.; Rull, F. Kerolite-stevensite mixed-layers from the Madrid Basin, central Spain. Clay Miner. 1991, 26, 329–342. [Google Scholar] [CrossRef]
  21. Pozo, M.; Casas, J. Origin of kerolite and associated Mg clays in palustrine-lacustrine environments. The Esquivias deposit (Neogene Madrid Basin, Spain). Clay Miner. 1999, 34, 395–418. [Google Scholar] [CrossRef]
  22. Moreno, A.; Pozo, M.; Martín Rubí, J.A. Geoquímica del yacimiento de arcillas magnésicas de Esquivias (Cuenca de Madrid). Bol. Geológico Min. 1995, 106, 559–570. [Google Scholar]
  23. Pozo, M.; Medina, J.A.; Casas, J.; Moreno, A. Variabilidad textural, mineralógica y geoquímica de la bentonita de Yuncos (Cuenca de Madrid). Estud. Geológicos 1993, 49, 295–306. [Google Scholar] [CrossRef]
  24. Pozo, M.; Moreno, A.; Martín Rubí, J.A. Distribución de Li y F en depósitos de kerolitas y esmectitas magnésicas de la cuenca de Madrid. Implicaciones genéticas. Bol. Geológico Min. 1999, 110, 197–214. [Google Scholar]
  25. Torres-Ruíz, J.; López-Galindo, A.; González-López, J.M.; Delgado, A. Geochemistry of Spanish sepiolite-palygorskite deposits: Genetic considerations based on trace elements and isotopes. Chem. Geol. 1994, 112, 221–245. [Google Scholar] [CrossRef]
  26. Clauer, N.; Fallick, A.E.; Galán, E.; Pozo, M.; Taylor, C. Varied crystallization conditions for Neogene sepiolite and associated Mg-clays from Madrid Basin (Spain) traced by oxygen and hydrogen isotope geochemistry. Geochim. Cosmochim. Acta 2012, 94, 181–198. [Google Scholar] [CrossRef]
  27. Pozo, M.; Carretero, M.I.; Galán, E. Approach to the trace element geochemistry of non-marine sepiolite deposits: Influence of the sedimentary environment (Madrid Basin, Spain). Appl. Clay Sci. 2016, 131, 27–43. [Google Scholar] [CrossRef]
  28. Rubio Pascual, F.J.; Mediavila López, R.; Portero Urroz, J.; Sanz Montero, M.E.; Rodríguez Aranda, J.P.; Galán de Frutos, L.A.; Vivar, V.; Baltuille Martín, J.M. Mapa geológico y Memoria de la Hoja no 605 (Aranjuez). Mapa Geológico de España E. 1:50.000 (MAGNA), Segunda Serie, Primera Edición; IGME: Madrid, Spain, 2001. [Google Scholar]
  29. Martín Pozas, J.M. Analisis cuantitativo de fases cristalinas por DRX. In Método de Debye-Scherrer; Saja, J., Ed.; ICE Universidad de Valladolid: Valladolid, Spain, 1975. [Google Scholar]
  30. Hammer, Ø.; Harper, D.A.T.; Ryan, P.D. PAST: Paleontological statistics software package for education and data analysis. Palaeontol. Electron. 2001, 4, 1–9. [Google Scholar]
  31. Eren, M.; Kadir, S. Colour origin of red sandstone beds within the Hüdai Formation (Early Cambrian), Aydıncık (Mersin), southern Turkey. Turk. J. Earth Sci. 2013, 22, 563–573. [Google Scholar] [CrossRef]
  32. Eren, M.; Kadir, S.; Kapur, S.; Huggett, J.; Zucca, C. Colour origin of Tortonian red mudstones within the Mersin area, southern Turkey. Sediment. Geol. 2015, 318, 10–19. [Google Scholar] [CrossRef]
  33. Middelburg, J.; Vanderweijden, C.; Woittiez, J. Chemical processes affecting the mobility of major, minor and trace elements during weathering of granitic rocks. Chem. Geol. 1988, 68, 253–273. [Google Scholar] [CrossRef]
  34. González López, J.M.; Bauluz, B.; Fernández-Nieto, C.; Oliete, A.Y. Factors controlling the trace-element distribution in fine-grained rocks: The Albian kaolinite-rich deposits of the Oliete Basin (NE Spain). Chem. Geol. 2005, 214, 1–19. [Google Scholar] [CrossRef]
  35. Wedepohl, K.H. Handbook of Geochemistry; Springer: Berlin, Germany, 1978; Volume II, ISBN 978-3-540-09022-9. [Google Scholar]
  36. McLennan, S.M.; Nance, W.B.; Taylor, S.R. Rare earth element-thorium correlations in sedimentary rocks, and the composition of the continental crust. Geochim. Cosmochim. Acta 1980, 44, 1833–1839. [Google Scholar] [CrossRef]
  37. Boynton, W.V. Cosmochemistry of the Rare Earth Elements: Meteorite Studies. In Developments in Geochemistry; Henderson, P., Ed.; Elsevier: New York, NY, USA, 1984; Volume 2, pp. 63–114. ISBN 978-0-444-42148-7. [Google Scholar]
  38. Möller, P.; Bau, M. Rare-earth patterns with positive cerium anomaly in alkaline waters from Lake Van, Turkey. Earth Planet. Sci. Lett. 1993, 117, 671–676. [Google Scholar] [CrossRef]
  39. Jolliffe, I.T. Principal Component Analysis; Springer: New York, NY, USA, 1986; ISBN 978-1-4757-1906-2. [Google Scholar]
  40. Deer, W.A.; Howie, R.A.; Zussman, J. An Introduction to the Rock-Forming Minerals; Longman: London, UK, 1966; ISBN 978-0-582-44210-8. [Google Scholar]
  41. Mosser, C.; Brillanceau, A.; Besnus, Y. Relationship between sediments and their igneous source rocks using clay mineral multi-element chemistry: The Cenozoic lacustrine Anloua basin (Adamaoua, Cameroon). Chem. Geol. 1991, 90, 319–342. [Google Scholar] [CrossRef]
  42. Smith, J.V. Feldspar Minerals 2: Chemical and Textural Properties; Springer: Berlin, Germany, 1974. [Google Scholar]
  43. Robinson, C. Lago Grande di Monticchio, southern Italy: A long record of environmental change illustrated by sediment geochemistry. Chem. Geol. 1994, 118, 235–254. [Google Scholar] [CrossRef]
  44. Bray, E.E.; Evans, E.D. Distribution of n-paraffins as a clue to recognition of source beds. Geochim. Cosmochim. Acta 1961, 22, 2–15. [Google Scholar] [CrossRef]
  45. Eglinton, G.; Hamilton, R.J. Leaf Epicuticular Waxes. Science 1967, 156, 1322. [Google Scholar] [CrossRef] [PubMed]
  46. Ficken, K.J.; Li, B.; Swain, D.L.; Eglinton, G. An n-alkane proxy for the sedimentary input of submerged/floating freshwater aquatic macrophytes. Org. Geochem. 2000, 31, 745–749. [Google Scholar] [CrossRef]
  47. Silliman, J.E.; Meyers, P.A.; Bourbonniere, R.A. Record of postglacial organic matter delivery and burial in sediments of Lake Ontario. Org. Geochem. 1996, 24, 463–472. [Google Scholar] [CrossRef]
  48. Bourbonniere, R.A.; Meyers, P.A. Sedimentary geolipid records of historical changes in the watersheds and productivities of Lakes Ontario and Erie. Limnol. Oceanogr. 1996, 41, 352–359. [Google Scholar] [CrossRef]
  49. Tenzer, G.E.; Meyers, P.A.; Robbins, J.A.; Eadie, B.J.; Morehead, N.R.; Lansing, M.B. Sedimentary organic matter record of recent environmental changes in the St. Marys River ecosystem, Michigan–Ontario border. Org. Geochem. 1999, 30, 133–146. [Google Scholar] [CrossRef]
  50. Hedges, J.I.; Prahl, F.G. Early Diagenesis: Consequences for Applications of Molecular Biomarkers. In Organic Geochemistry: Principles and Applications; Engel, M.H., Macko, S.A., Eds.; Springer: Boston, MA, USA, 1993; pp. 237–253. ISBN 978-1-4615-2890-6. [Google Scholar]
  51. Cranwell, P.A.; Eglinton, G.; Robinson, N. Lipids of aquatic organisms as potential contributors to lacustrine sediments—II. Org. Geochem. 1987, 11, 513–527. [Google Scholar] [CrossRef]
  52. Rielley, G.; Collier, R.J.; Jones, D.M.; Eglinton, G. The biogeochemistry of Ellesmere Lake, U.K.—I: Source correlation of leaf wax inputs to the sedimentary lipid record. Org. Geochem. 1991, 17, 901–912. [Google Scholar] [CrossRef]
  53. Nott, C.J.; Xie, S.; Avsejs, L.A.; Maddy, D.; Chambers, F.M.; Evershed, R.P. n-Alkane distributions in ombrotrophic mires as indicators of vegetation change related to climatic variation. Org. Geochem. 2000, 31, 231–235. [Google Scholar] [CrossRef]
  54. Pancost, R.D.; Baas, M.; van Geel, B.; Sinninghe Damsté, J.S. Biomarkers as proxies for plant inputs to peats: An example from a sub-boreal ombrotrophic bog. Org. Geochem. 2002, 33, 675–690. [Google Scholar] [CrossRef]
  55. Poynter, J.G.; Farrimond, P.; Robinson, N.; Eglinton, G. Aeolian-Derived Higher Plant Lipids in the Marine Sedimentary Record: Links with Palaeoclimate. In Paleoclimatology and Paleometeorology: Modern and Past Patterns of Global Atmospheric Transport; Leinen, M., Sarnthein, M., Eds.; Springer: Dordrecht, The Netherlands, 1989; pp. 435–462. ISBN 978-94-009-0995-3. [Google Scholar]
  56. Rommerskirchen, F.; Eglinton, G.; Dupont, L.; Güntner, U.; Wenzel, C.; Rullkötter, J. A north to south transect of Holocene southeast Atlantic continental margin sediments: Relationship between aerosol transport and compound-specific δ13C land plant biomarker and pollen records: Holocene transect of SE atlantic margin. Geochem. Geophys. Geosyst. 2003, 4. [Google Scholar] [CrossRef]
  57. Suárez Barrios, M.; de Santiago Buey, C.; García-Romero, E.; Martín Pozas, J.M. Textural and structural modifications of saponite from Cerro del Aguila by acid treatment. Clay Miner. 2001, 36, 483–488. [Google Scholar] [CrossRef]
  58. Meyers, P.A. Applications of organic geochemistry to paleolimnological reconstructions: A summary of examples from the Laurentian Great Lakes. Org. Geochem. 2003, 34, 261–289. [Google Scholar] [CrossRef]
  59. Haddad, R.I.; Martens, C.S.; Farrington, J.W. Quantifying early diagenesis of fatty acids in a rapidly accumulating coastal marine sediment. Org. Geochem. 1992, 19, 205–216. [Google Scholar] [CrossRef]
  60. Ho, E.S.; Meyers, P.A. Variability of early diagenesis in lake sediments: Evidence from the sedimentary geolipid record in an isolated tarn. Chem. Geol. 1994, 112, 309–324. [Google Scholar] [CrossRef]
  61. Kawamura, K.; Ishiwatari, R.; Ogura, K. Early diagenesis of organic matter in the water column and sediments: Microbial degradation and resynthesis of lipids in Lake Haruna. Org. Geochem. 1987, 11, 251–264. [Google Scholar] [CrossRef]

Article Metrics

Citations

Article Access Statistics

Multiple requests from the same IP address are counted as one view.