Characterisation of Mineralised Material from the Loki’s Castle Hydrothermal Vent on the Mohn’s Ridge


Abstract
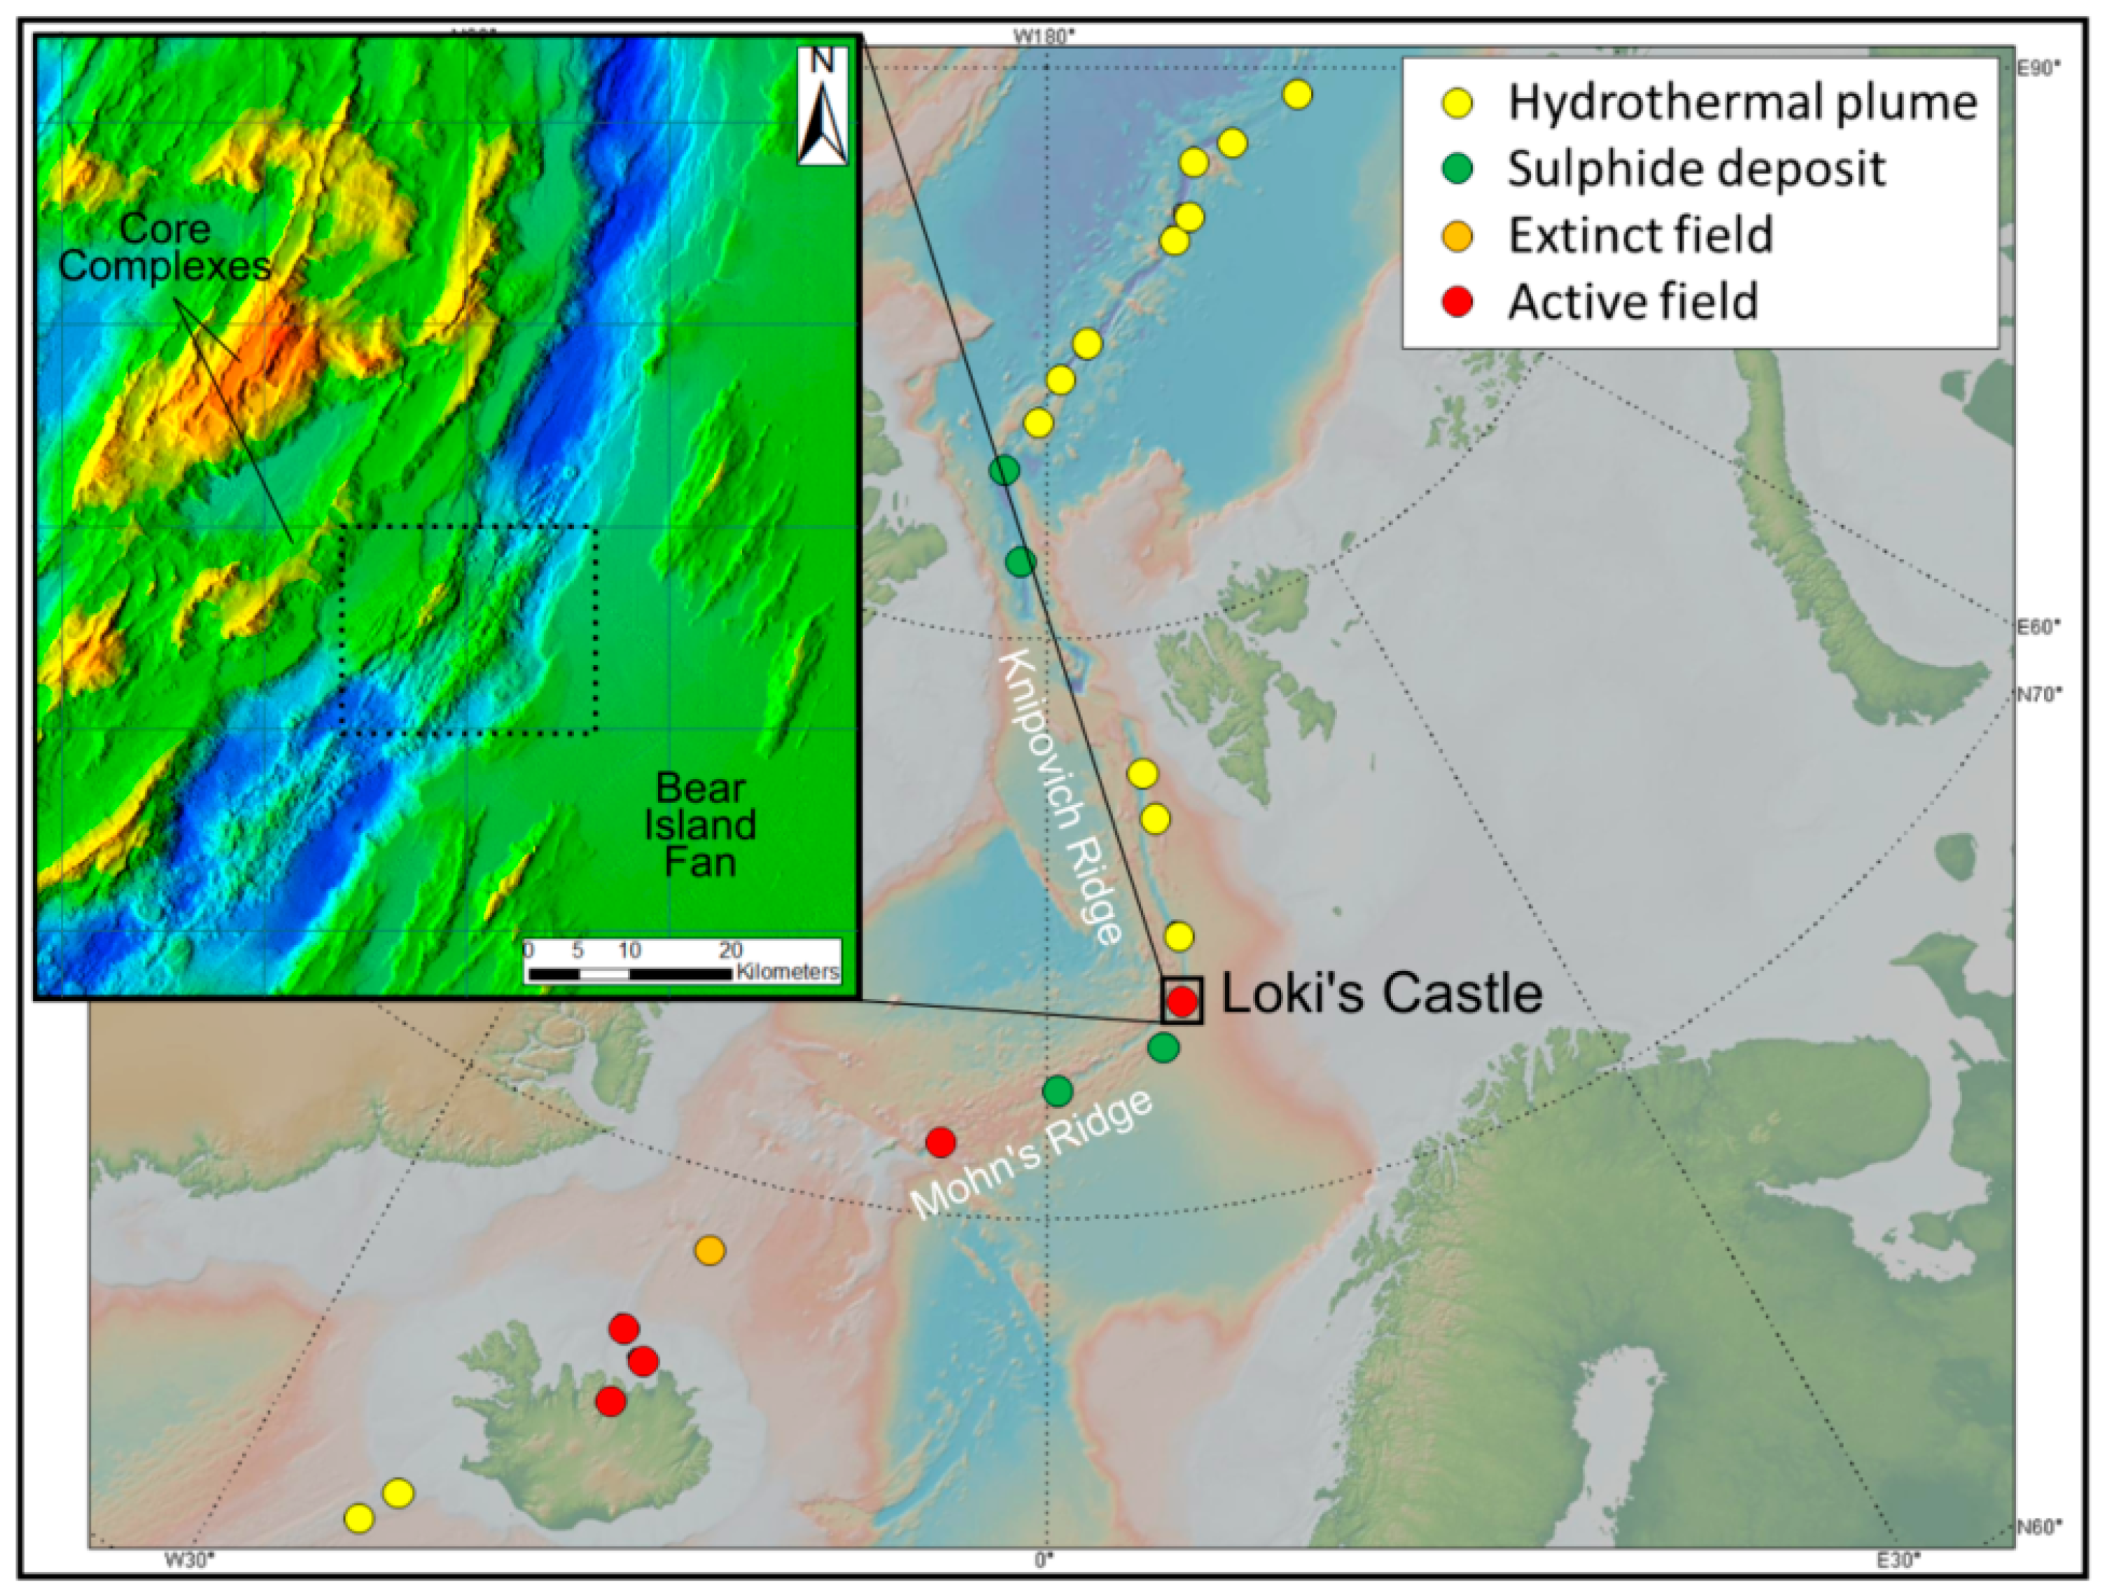
1. Introduction
2. Materials and Methods
3. Results
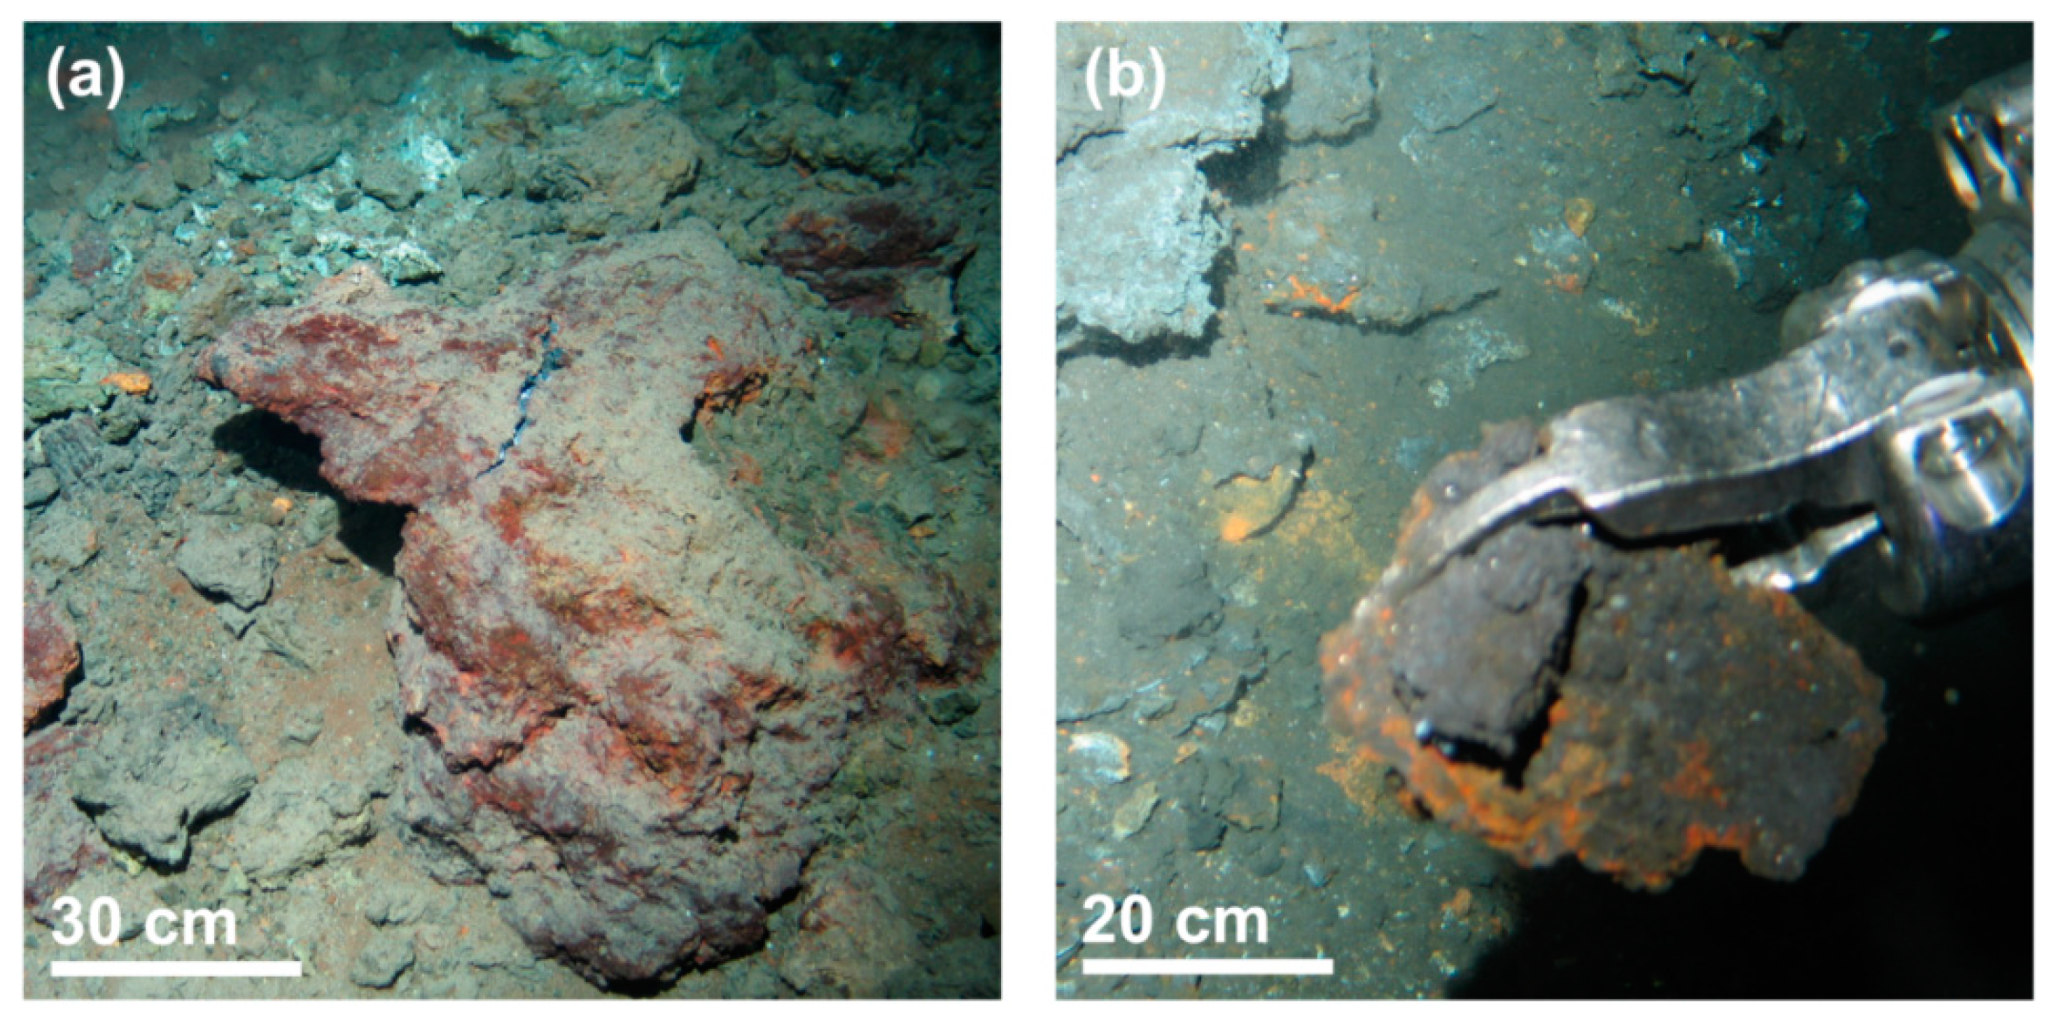
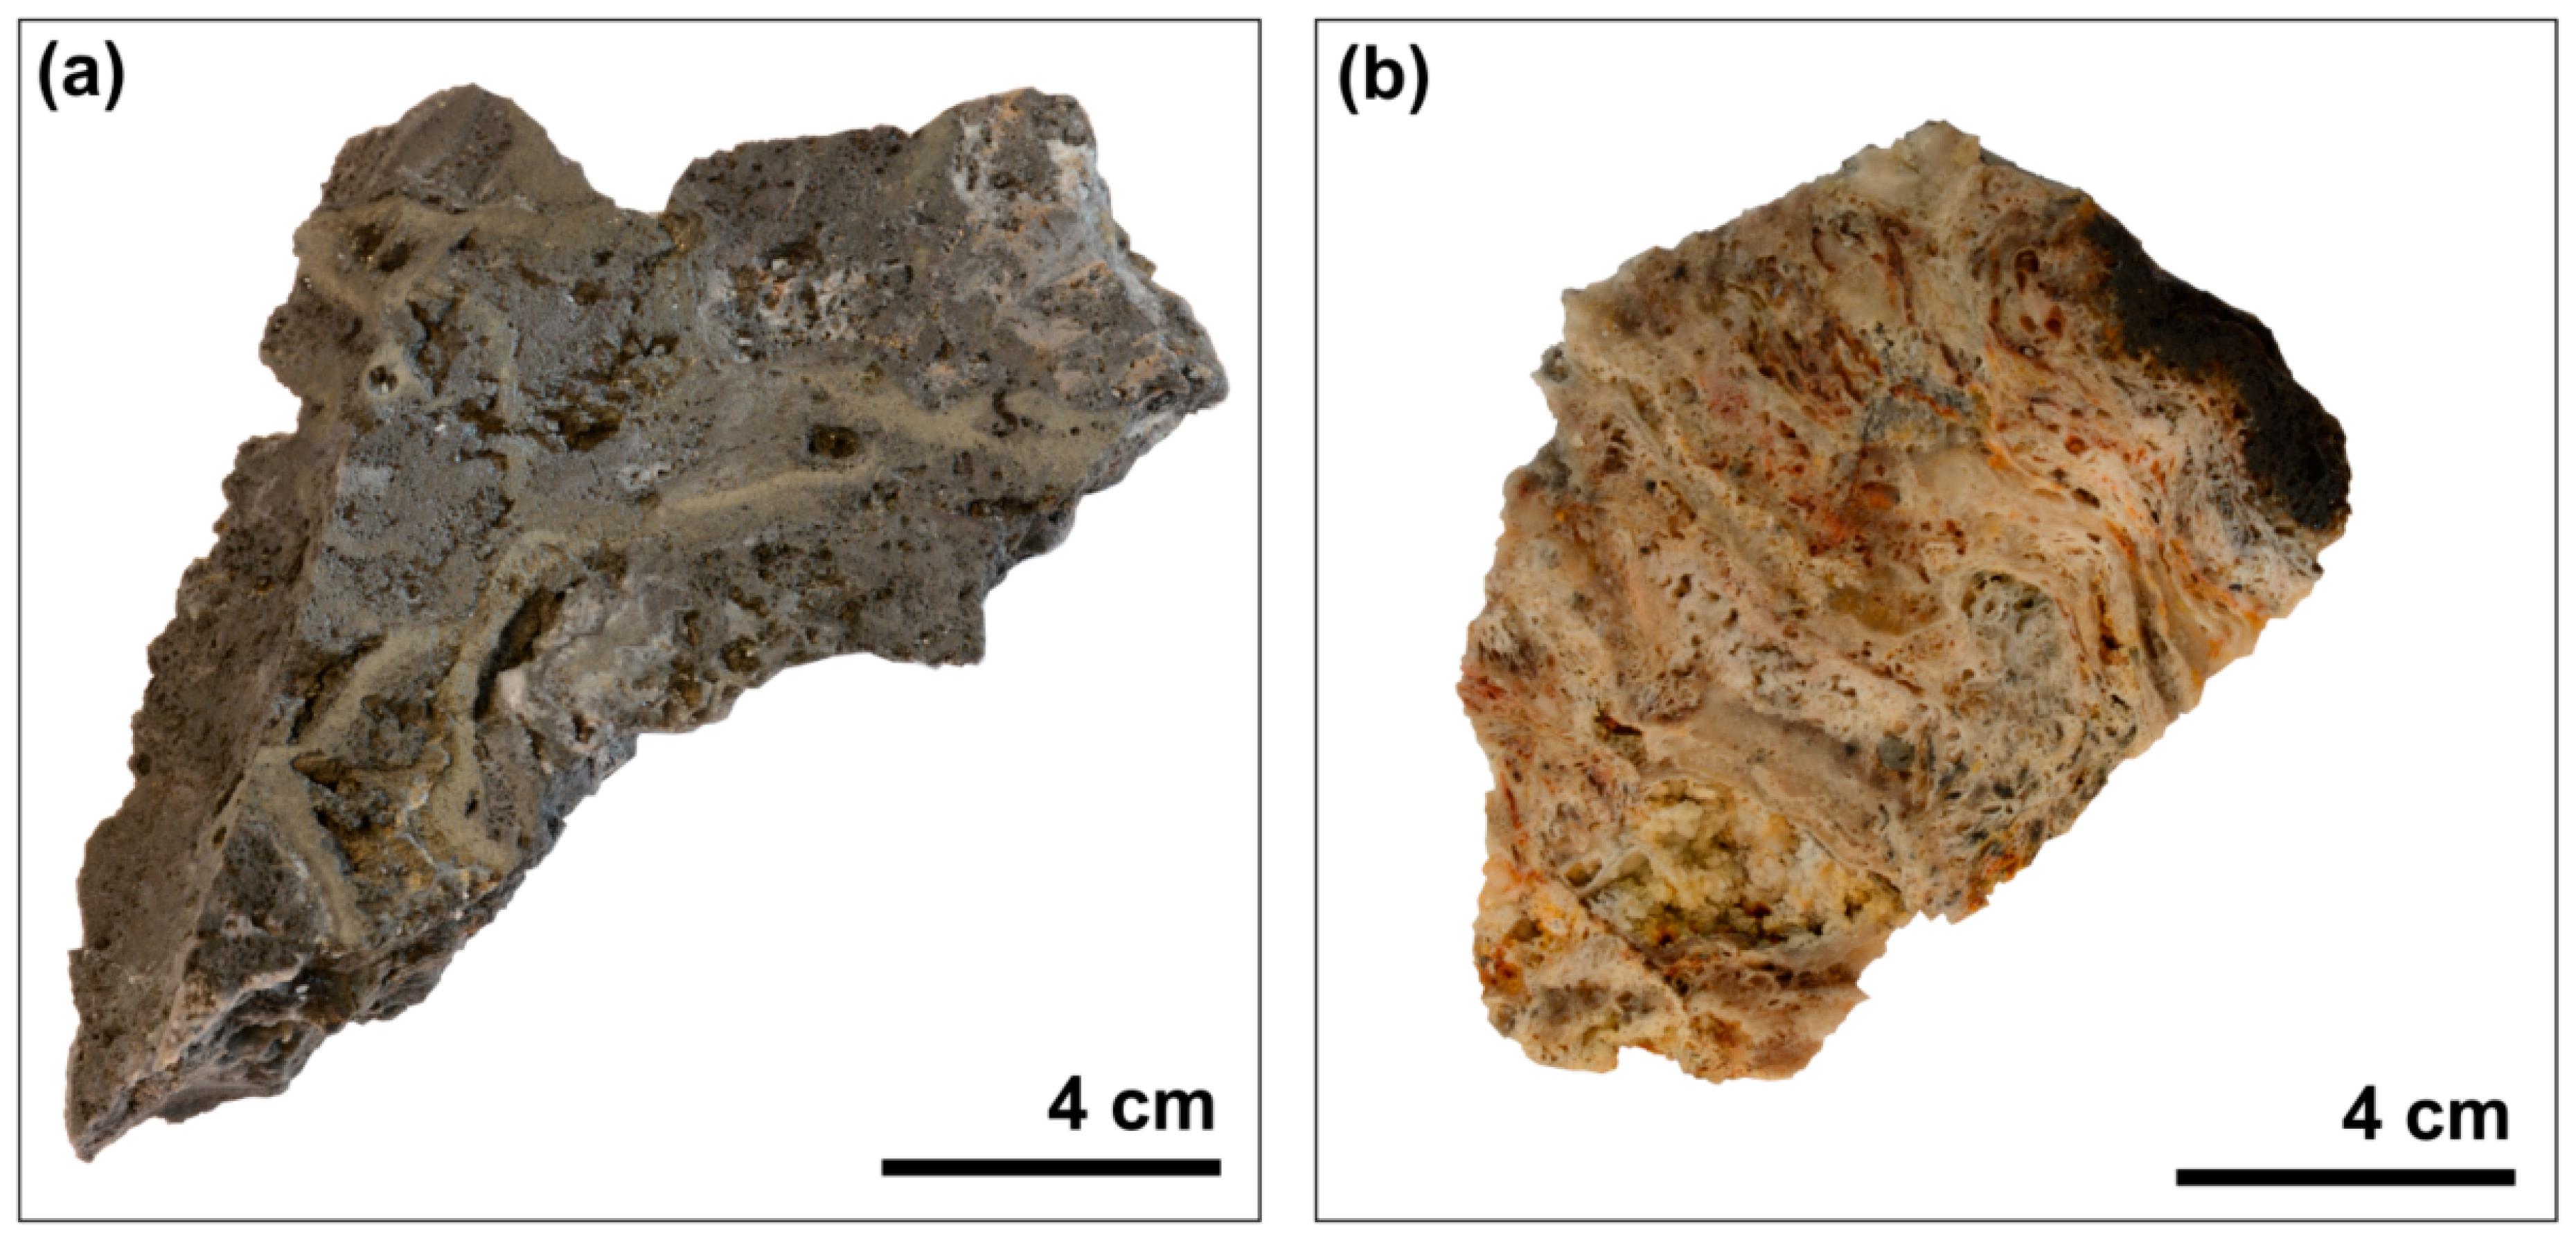
3.1. Macrocharacteristics of Vent Material
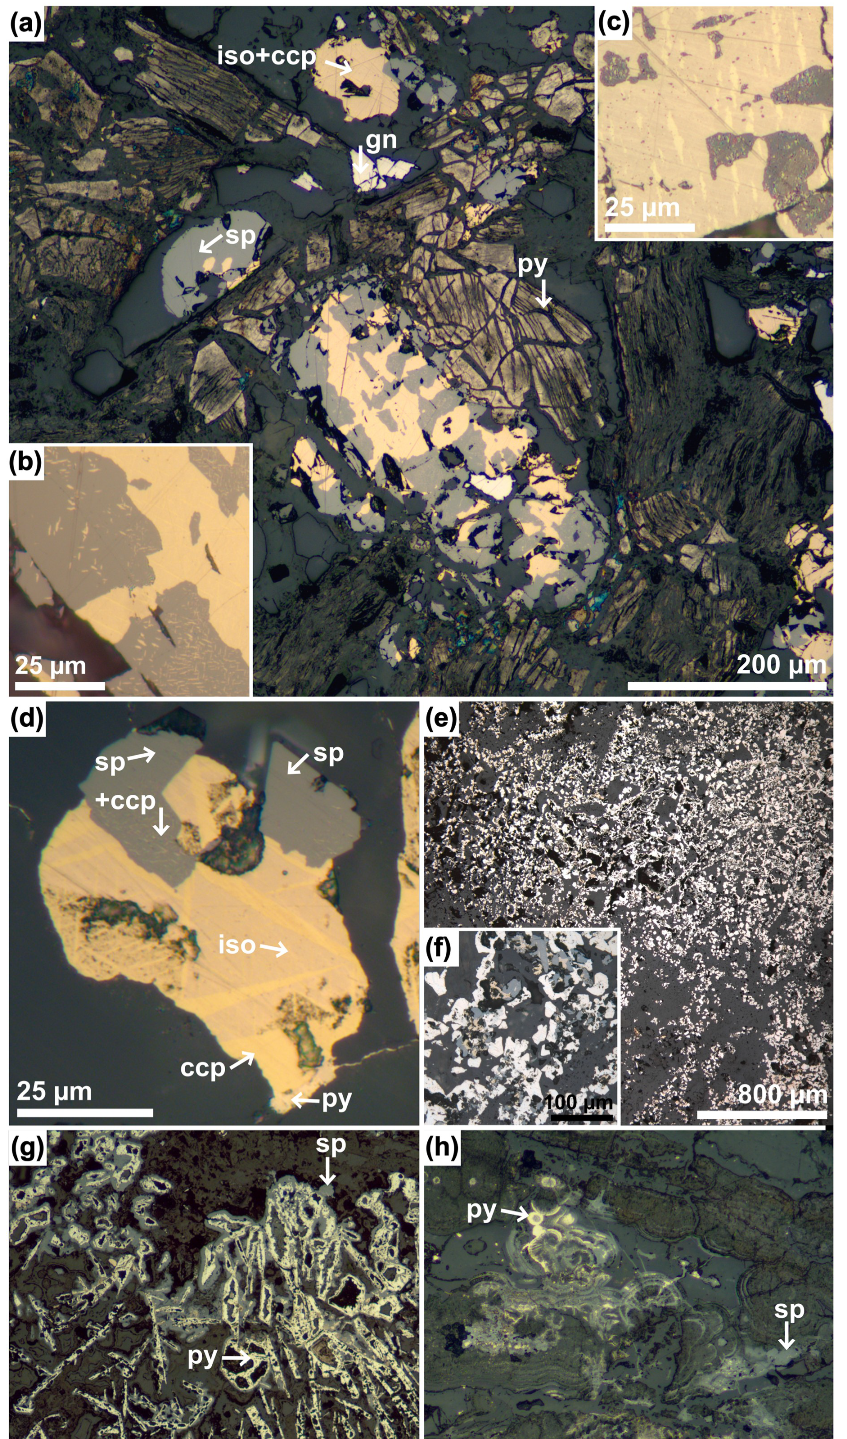
3.2. Mineralogy of Hydrothermal Vent Material after Petrography and XRD
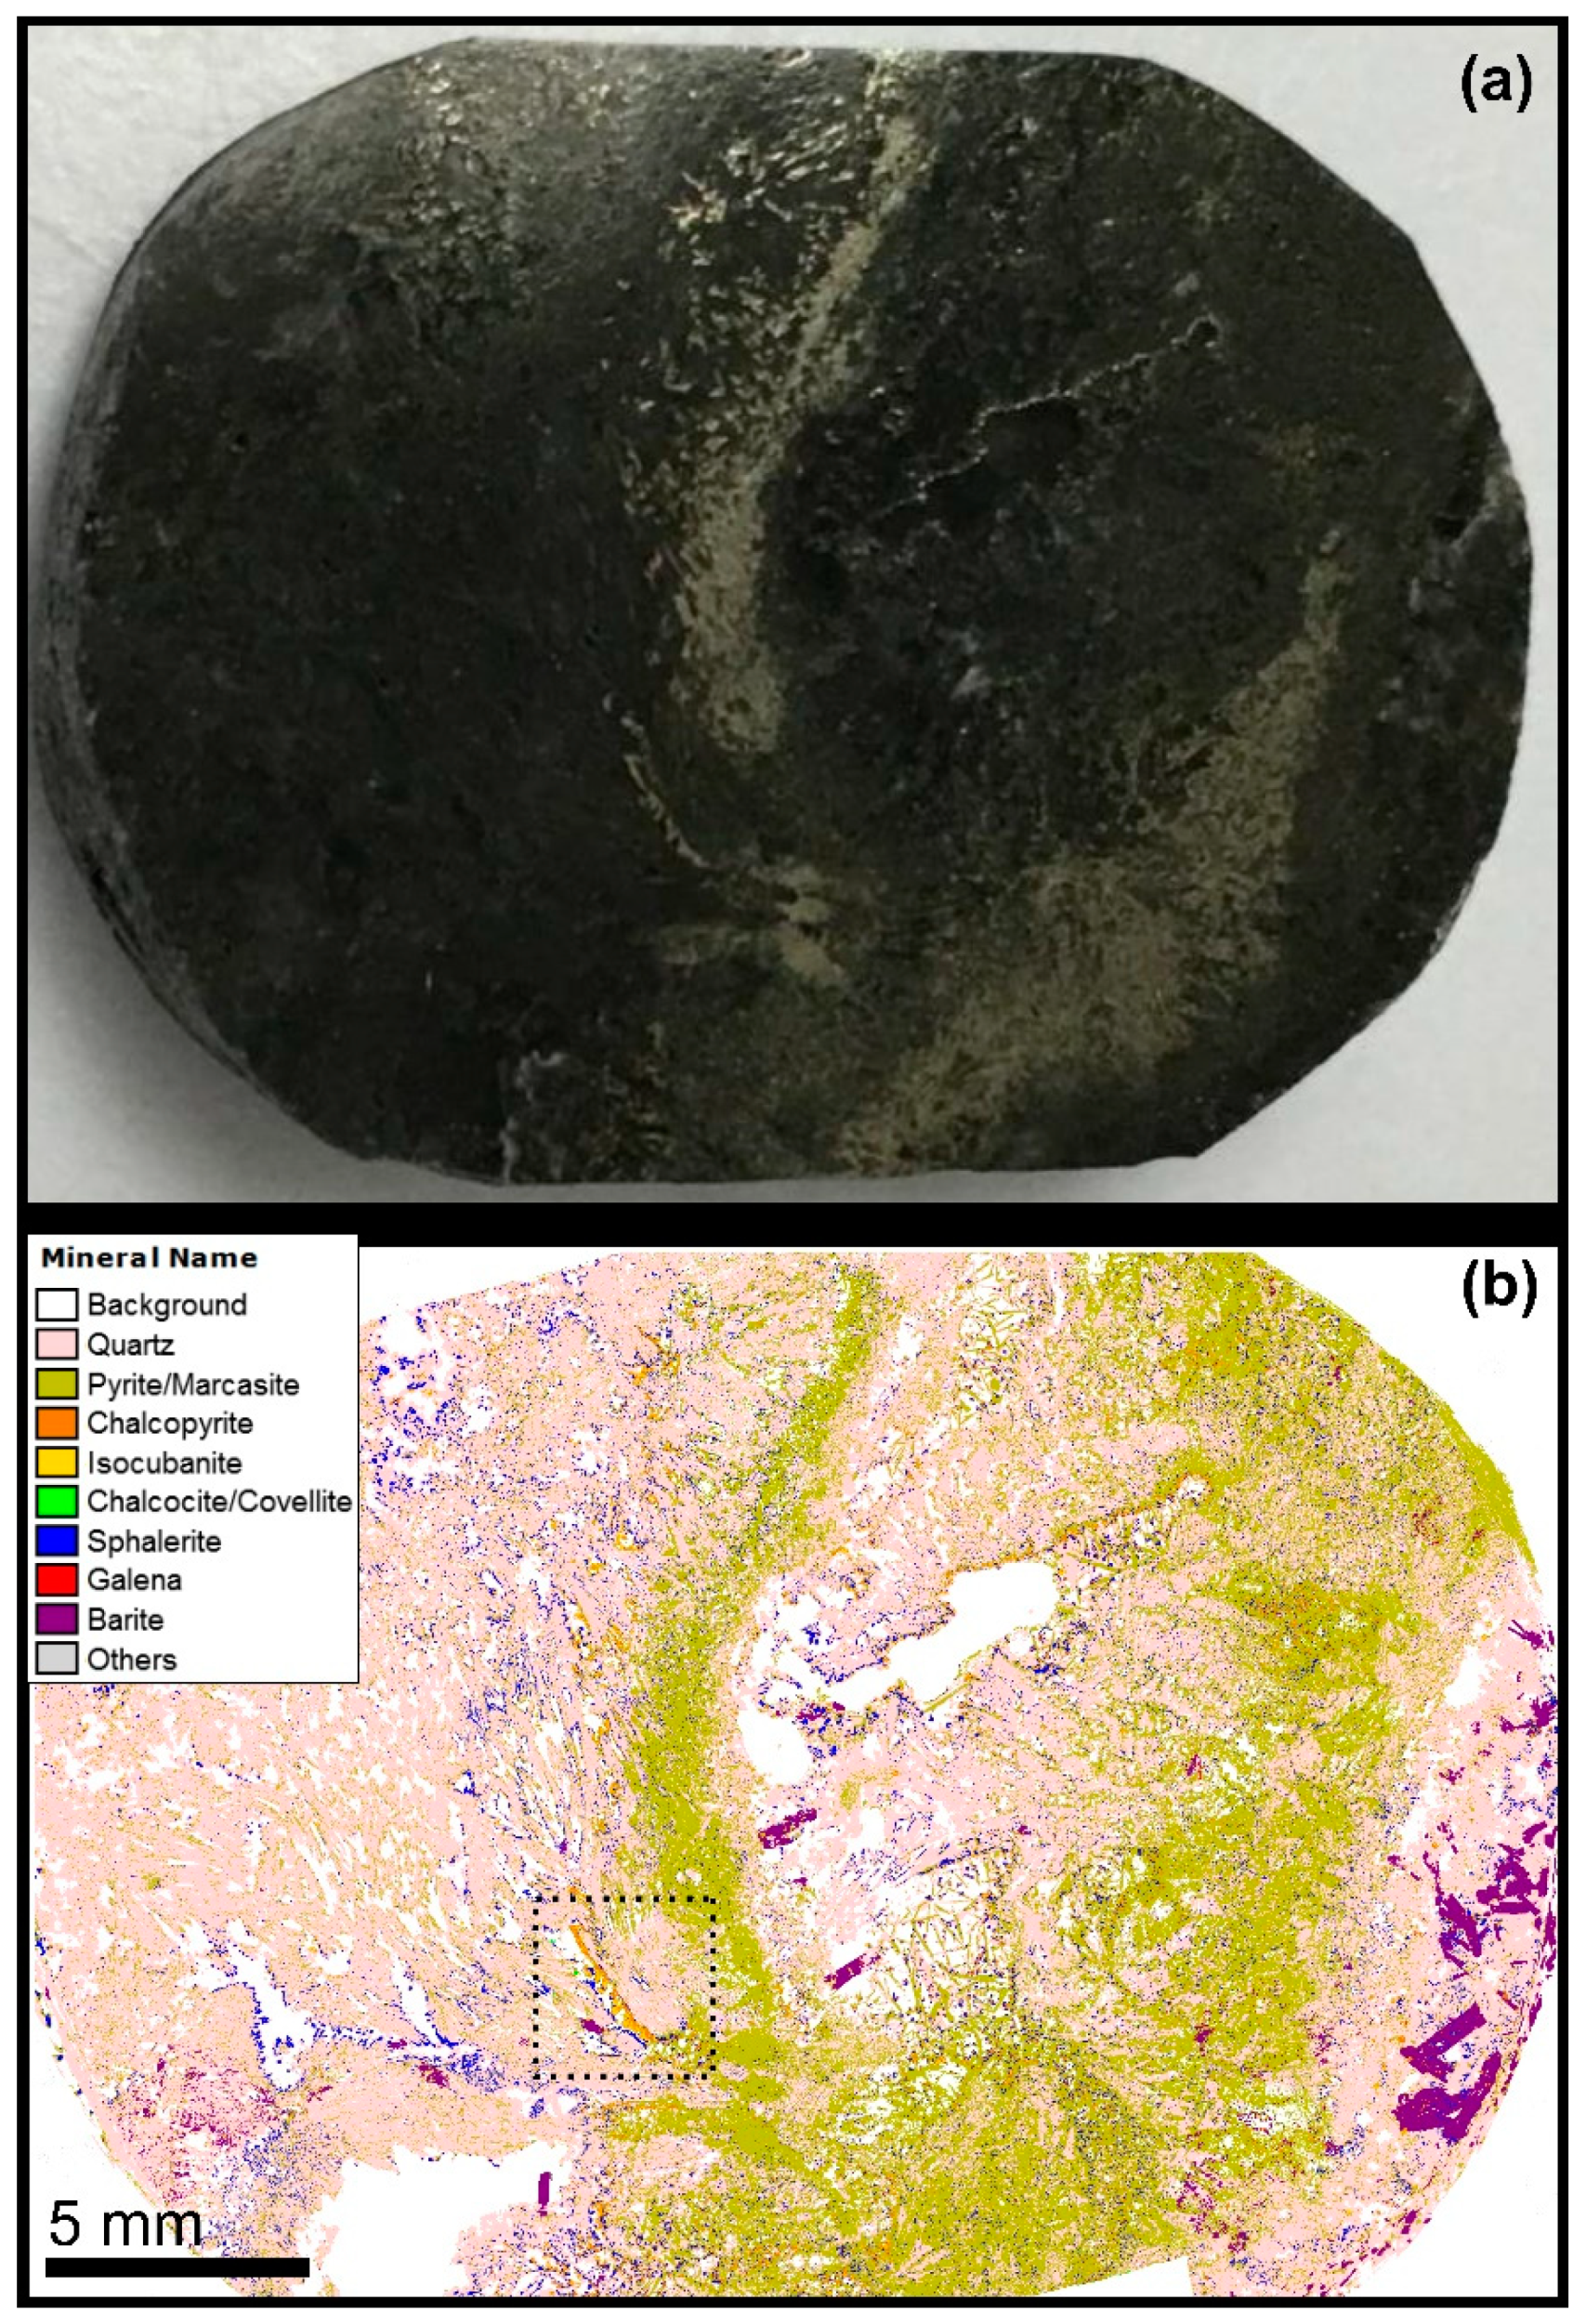
3.3. QEMSCAN
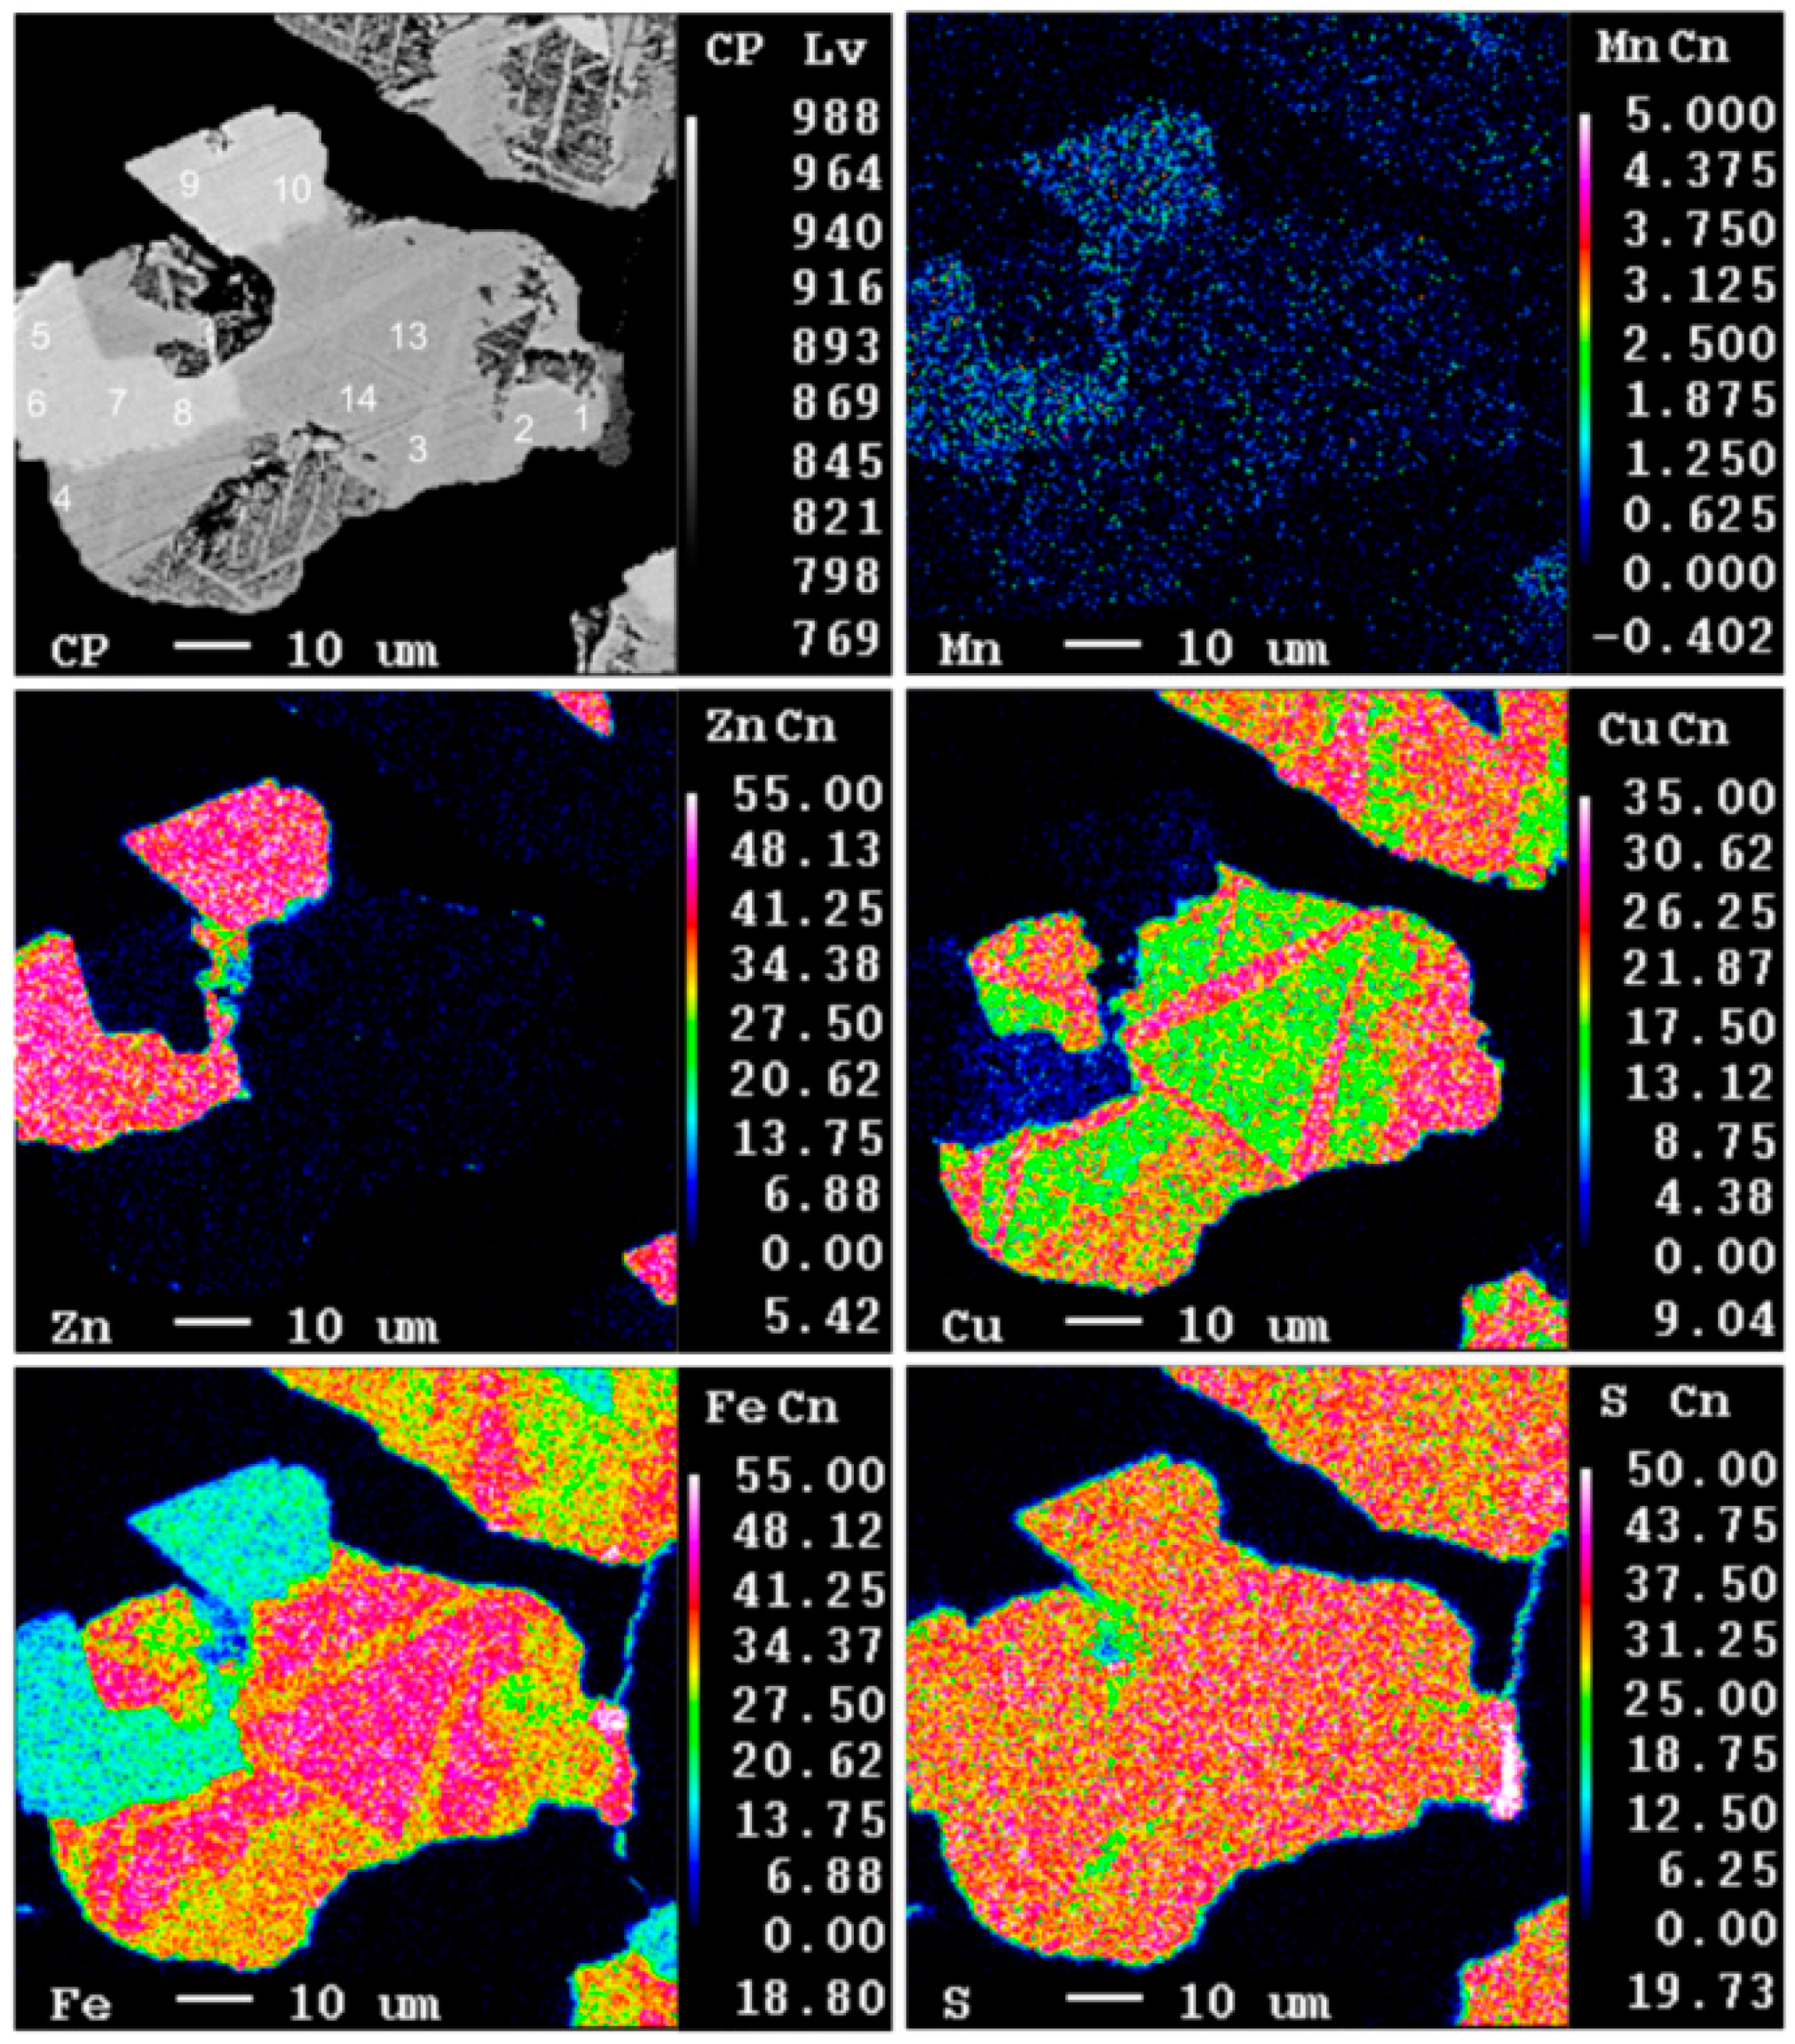
3.4. EPMA
3.5. Geochemistry of Vent Material
4. Discussion
4.1. Composition of Mineralised Material from the AMOR
4.1.1. Mineralogical Implications
4.1.2. Grade of Mineralised Material from Loki’s Castle
4.1.3. Considerations for Possible Exploration Strategies
4.2. Characterisation of Mineralised Material
4.2.1. Methods of Characterisation
4.2.2. Electron Beam Techniques in the Characterisation of Sulphide-bearing Material
4.2.3. Implications for Mineral Processing
5. Conclusions
- Sulphide-bearing material from a hydrothermal vent site on the AMOR is characterised in detail for the first time; sulphide mineralisation consists of chalcopyrite, isocubanite, and sphalerite, with pyrite, marcasite, and lesser galena and pyrrhotite, whilst Au- and Ag-bearing phases remain undefined.
- Several instances of Cu, Zn, Au, and Ag grades at the Loki’s Castle hydrothermal vent system are favourable compared to the average grades of other SMS deposits and to mafic-hosted VMS deposits. Further investigation of in situ samples (e.g., drill cores) is a necessity before any economic conclusions can be drawn.
- Fundamental microscopy is an effective methodology to identify minerals and mineral textures in mineralised vent material. QEMSCAN can be used to effectively, graphically, spatially, and statistically determine mineral textures at a scale above 10 µm, but even at a 1 µm pixel spacing, it fails to define some micron-scale features, which requires EPMA. QEMSCAN can be used to efficiently generate grain size and mineral association data, as well as compositional data, and it is likely to be a powerful tool in assessing the effectiveness of SMS mineral processing.
Author Contributions
Funding
Acknowledgments
Conflicts of Interest
Appendix A

| Point | As | S | Mn | Pb | Fe | Bi | Co | Cd | Ni | Sb | Cu | Zn |
|---|---|---|---|---|---|---|---|---|---|---|---|---|
| 1 ccp | 122.0 | 0.6 | 216.2 | 441.0 | 0.5 | 100.0 | 34.6 | 87.5 | 100.0 | 151.3 | 0.5 | 12.9 |
| 2 ccp | 100.0 | 0.6 | 99.1 | 344.6 | 0.5 | 100.0 | 34.8 | 482.5 | 100.0 | 100.0 | 0.5 | 12.6 |
| 3 ccp | 100.0 | 0.6 | 319.3 | 100.0 | 0.5 | 100.0 | 22.6 | 129.3 | 100.0 | 192.5 | 0.5 | 11.5 |
| 4 ccp | 526.6 | 0.6 | 68.4 | 333.5 | 0.5 | 100.0 | 20.3 | 223.0 | 100.0 | 61.8 | 0.5 | 8.9 |
| 5 spl | 100.0 | 0.6 | 3.7 | 100.0 | 0.7 | 100.0 | 44.2 | 16.7 | 100.0 | 100.0 | 17.2 | 0.5 |
| 6 spl | 100.0 | 0.6 | 3.8 | 163.0 | 0.7 | 100.0 | 41.0 | 19.5 | 82.2 | 100.0 | 14.7 | 0.5 |
| 7 spl | 100.0 | 0.6 | 3.1 | 100.0 | 0.6 | 100.0 | 79.2 | 19.7 | 105.2 | 171.8 | 2.1 | 0.5 |
| 8 spl | 100.0 | 0.6 | 2.9 | 79.7 | 0.6 | 100.0 | 74.0 | 26.4 | 68.2 | 100.0 | 1.9 | 0.5 |
| 9 spl | 100.0 | 0.6 | 3.0 | 56.8 | 0.7 | 100.0 | 103.8 | 31.7 | 112.8 | 100.0 | 5.3 | 0.5 |
| 10 spl | 100.0 | 0.6 | 2.8 | 100.0 | 0.6 | 100.0 | 230.4 | 26.9 | 100.0 | 108.7 | 3.0 | 0.5 |
| 11 gn | 100.0 | 0.9 | 100.0 | 0.8 | 6.4 | 100.0 | 100.0 | 26.3 | 113.8 | 100.0 | 9.0 | 33.5 |
| 12 gn | 100.0 | 0.9 | 100.0 | 0.8 | 9.9 | 100.0 | 100.0 | 20.6 | 100.0 | 75.9 | 20.5 | 83.4 |
| 13 iso | 388.7 | 0.6 | 16.9 | 406.9 | 0.4 | 100.0 | 23.1 | 160.8 | 100.0 | 209.2 | 0.7 | 6.7 |
| 14 iso | 100.0 | 0.6 | 18.6 | 58.2 | 0.4 | 100.0 | 29.8 | 100.0 | 45.2 | 54.9 | 0.7 | 3.1 |
References
- Singer, D.A. Future copper resources. Ore Geol. Rev. 2017, 86, 271–279. [Google Scholar] [CrossRef]
- European Comission—Critical Raw Materials. Available online: http://ec.europa.eu/growth/sectors/raw-materials/specific-interest/critical_en (accessed on 18 July 2018).
- German, C.R.; Petersen, S.; Hannington, M.D. Hydrothermal exploration of mid-ocean ridges: Where might the largest sulfide deposits be forming? Chem. Geol. 2016, 420, 114–126. [Google Scholar] [CrossRef]
- Hannington, M.; Jamieson, J.; Monecke, T.; Petersen, S.; Beaulieu, S. The abundance of seafloor massive sulfide deposits. Geology 2011, 39, 1155–1158. [Google Scholar] [CrossRef]
- White, M.; Manocchio, A.; Sant, T.; Johnston, M.; Lowe, J.; Minerals, N. Resource drilling of the solwara 1 seafloor massive sulfide (SMS) deposit. In Proceedings of the Offshore Technology Conference, Houston, TX, USA, 2–5 May 2011. [Google Scholar]
- Galley, A.G.; Hannington, M.D.; Jonasson, I.R. Volcanogenic massive sulfide deposits. In Mineral Deposits of Canada: A Synthesis of Major Deposit-Types, District Metallogeny, the Evolution of Geological Provinces, and Exploration Methods; Goodfellow, W.D., Ed.; Geological Association of Canada: St. John’s, NL, Canada, 2007; pp. 141–161. [Google Scholar]
- Herzig, P.M.; Hannington, M.D. Polymetallic massive sulfides at the modern seafloor a review. Ore Geol. Rev. 1995, 10, 95–115. [Google Scholar] [CrossRef]
- Pedersen, R.B.; Rapp, H.T.; Thorseth, I.H.; Lilley, M.D.; Barriga, F.J.A.S.; Baumberger, T.; Flesland, K.; Fonseca, R.; Früh-Green, G.L.; Jorgensen, S.L. Discovery of a black smoker vent field and vent fauna at the arctic mid-ocean ridge. Nat. Commun. 2010, 1, 126. [Google Scholar] [CrossRef] [PubMed]
- Humphris, S.E.; Herzig, P.M.; Miller, D.J.; Alt, J.C.; Becker, K.; Brown, D.; Brügmann, G.; Chiba, H.; Fouquet, Y.; Gemmell, J.B.; et al. The internal structure of an active sea-floor massive sulphide deposit. Nature 1995, 377, 713–716. [Google Scholar] [CrossRef]
- Monecke, T.; Petersen, S.; Hannington, M.D.; Grant, H.; Samson, I. The minor element endowment of modern sea-floor massive sulfide deposits and comparison with deposits hosted in ancient volcanic successions. In Rare Earth and Critical Elements in Ore Deposits; Verplanck, P.L., Hitzman, M.W., Eds.; Society of Economic Geologists: Knoxville, TN, USA, 2016; Volume 18, pp. 245–306. [Google Scholar]
- Eickmann, B.; Thorseth, I.H.; Peters, M.; Strauss, H.; Brocker, M.; Pedersen, R.B. Barite in hydrothermal environments as a recorder of subseafloor processes: A multiple-isotope study from the loki’s castle vent field. Geobiology 2014, 12, 308–321. [Google Scholar] [CrossRef] [PubMed]
- Firstova, A.; Stepanova, T.; Cherkashov, G.; Goncharov, A.; Babaeva, S. Composition and formation of gabbro-peridotite hosted seafloor massive sulfide deposits from the ashadze-1 hydrothermal field, mid-atlantic ridge. Minerals 2016, 6, 19. [Google Scholar] [CrossRef]
- Mozgova, N.N.; Borodaev, Y.S.; Gablina, I.F.; Cherkashev, G.A.; Stepanova, T.V. Mineral assemblages as indicators of the maturity of oceanic hydrothermal sulfide mounds. Lithol. Miner. Resour. 2005, 40, 293–319. [Google Scholar] [CrossRef]
- Rona, P.A.; Petersen, S.; Becker, K.; Von Herzen, R.P.; Hannington, M.D.; Herzig, P.M.; Naka, J.; Lalou, C.; Thompson, G. Heat flow and mineralogy of TAG relict high-temperature hydrothermal zones: Mid-Atlantic ridge 26°N, 45°W. Geophys. Res. Lett. 1996, 23, 3507–3510. [Google Scholar] [CrossRef]
- Brett, R.; Evans, H.T.; Gibson, E.K.; Hedenquist, J.W.; Wandless, M.V.; Sommer, M.A. Mineralogical studies of sulfide samples and volatile concentrations of basalt glasses from the southern Juan de Fuca ridge. J. Geophys. Res. Solid Earth 1987, 92, 11373–11379. [Google Scholar] [CrossRef]
- Krasnov, S.; Stepanova, T.; Stepanov, M. Chemical composition and formation of a massive sulfide deposit, middle valley, northern Juan de Fuca ridge (site 856). In Proceedings of the Ocean Drilling Program, 139 Scientific Results; Texas A&M University: College Station, TX, USA, 1994. [Google Scholar]
- Conte, A.M.; Caramanna, G. Preliminary characterisation of a shallow water hydrothermal sulphide deposit recovered by scientific divers (Aeolian Islands, southern Tyrrhenian Sea). Underw. Technol. 2010, 29, 109–115. [Google Scholar] [CrossRef]
- Iizasa, K.; Yuasa, M.; Yokota, S. Mineralogy and geochemistry of volcanogenic sulfides from the Myojinsho submarine caldera, the Sshichito-Iwojima ridge, Izu-ogasawara arc, northwestern Pacific. Mar. Geol. 1992, 108, 39–58. [Google Scholar] [CrossRef]
- Missack, E.; Stoffers, P.; El Goresy, A. Mineralogy, parageneses, and phase relations of copper-iron sulfides in the Atlantis II Deep, Red Sea. Miner. Deposita 1989, 24, 82–91. [Google Scholar] [CrossRef]
- Schlindwein, V. Ultraslow spreading processes along the Arctic mid-ocean ridge system. In Proceedings of the EPIC3EGU General Assembly, Vienna, Austria, 7–11 April 2013. [Google Scholar]
- Cruz, M.I.; Dias, A.S.; Relvas, J.M.R.S.; Carvalho, C.; Fonseca, R.; Pedersen, R.B.; Barriga, F.J.A.S. Geochemistry of the Artic Loki’s Castle hydrothermal vent products. In Proceedings of the Goldschmidt Conference, Prague, Czech Republic, 14–19 August 2011. [Google Scholar]
- Pedersen, R.B.; Thorseth, I.H.; Nygård, T.E.; Lilley, M.D.; Kelley, D.S. Hydrothermal activity at the Arctic mid-ocean ridges. Divers. Hydrothermal Syst. Slow Spreading Ocean Ridges 2013, 188, 67–89. [Google Scholar]
- Kelley, D.S.; Karson, J.A.; Blackman, D.K.; Früh-Green, G.L.; Butterfield, D.A.; Lilley, M.D.; Olson, E.J.; Schrenk, M.O.; Roe, K.K.; Lebon, G.T.; et al. An off-axis hydrothermal vent field near the mid-Atlantic ridge at 30° N. Nature 2001, 412, 145–149. [Google Scholar] [CrossRef] [PubMed]
- Boschi, C.; Früh-Green, G.L.; Delacour, A.; Karson, J.A.; Kelley, D.S. Mass transfer and fluid flow during detachment faulting and development of an oceanic core complex, Atlantis Massif (MAR 30°N). Geochem. Geophys. Geosyst. 2006, 7. [Google Scholar] [CrossRef]
- McCaig, A.M.; Cliff, R.A.; Escartin, J.; Fallick, A.E.; MacLeod, C.J. Oceanic detachment faults focus very large volumes of black smoker fluids. Geology 2007, 35, 935. [Google Scholar] [CrossRef]
- Juliani, C.; Ellefmo, S.L. Probabilistic estimates of permissive areas for undiscovered seafloor massive sulfide deposits on an Arctic mid-ocean ridge. Ore Geol. Rev. 2018, 95, 917–930. [Google Scholar] [CrossRef]
- Geomapapp. Available online: http://www.geomapapp.org (accessed on 18 July 2018).
- Ryan, W.B.F.; Carbotte, S.M.; Coplan, J.O.; O’Hara, S.; Melkonian, A.; Arko, R.; Weissel, R.A.; Ferrini, V.; Goodwillie, A.; Nitsche, F.; et al. Global multi-resolution topography synthesis. Geochem. Geophys. Geosyst. 2009, 10. [Google Scholar] [CrossRef]
- Ludvigsen, M.; Aasly, K.; Ellefmo, S.L.; Hilário, A.; Ramirez-Llodra, E.; Søreide, F.X.; Falcon-Suarez, I.; Juliani, C.J.; Kieswetter, A.; Lim, A.; et al. Marmine Cruise Report—Arctic Mid-Ocean Ridge 15.08.2016–05.09.2016; NTNU: Trondheim, Norway, 2016. [Google Scholar]
- Bruvoll, V.; Breivik, A.J.; Mjelde, R.; Pedersen, R.B. Burial of the Mohn-Knipovich seafloor spreading ridge by the Bear Island fan: Time constraints on tectonic evolution from seismic stratigraphy. Tectonics 2009, 28. [Google Scholar] [CrossRef]
- Baumberger, T.; Früh-Green, G.L.; Thorseth, I.H.; Lilley, M.D.; Hamelin, C.; Bernasconi, S.M.; Okland, I.E.; Pedersen, R.B. Fluid composition of the sediment-influenced Loki’s Castle vent field at the ultra-slow spreading Arctic mid-ocean ridge. Geochim. Cosmochim. Acta 2016, 187, 156–178. [Google Scholar] [CrossRef]
- Charlou, J.L.; Donval, J.P.; Fouquet, Y.; Jean-Baptiste, P.; Holm, N. Geochemistry of high H2 and CH4 vent fluids issuing from ultramafic rocks at the Rainbow hydrothermal field (36°14′N, MAR). Chem. Geol. 2002, 191, 345–359. [Google Scholar] [CrossRef]
- Proskurowski, G.; Lilley, M.D.; Kelley, D.S.; Olson, E.J. Low temperature volatile production at the lost city hydrothermal field, evidence from a hydrogen stable isotope geothermometer. Chem. Geol. 2006, 229, 331–343. [Google Scholar] [CrossRef]
- Fontaine, F.J.; Wilcock, W.S.D.; Foustoukos, D.E.; Butterfield, D.A. A Si-Cl geothermobarometer for the reaction zone of high-temperature, basaltic-hosted mid-ocean ridge hydrothermal systems. Geochem. Geophys. Geosyst. 2009, 10. [Google Scholar] [CrossRef]
- Klingelhofer, F.; Geli, L.; Matias, L.; Steinsland, N.; Mohr, J. Crustal structure of a super-slow spreading centre: A seismic refraction study of Mohns Ridge, 72° N. Geophys. J. Int. 2000, 141, 509–526. [Google Scholar] [CrossRef]
- Hannington, M.D.; Galley, A.G.; Herzig, P.M.; Petersen, S. Comparison of the TAG mound and stockwork complex with Cyprus-type massive sulphide deposits. Proc. Ocean Drill. Prog. Sci. Results 1998, 158, 389–415. [Google Scholar]
- Gottlieb, P.; Wilkie, G.; Sutherland, D.; Ho-Tun, E.; Suthers, S.; Perera, K.; Jenkins, B.; Spencer, S.; Butcher, A.; Rayner, J. Using quantitative electron microscopy for process mineralogy applications. JOM 2000, 52, 24–25. [Google Scholar] [CrossRef]
- Pirrie, D.; Butcher, A.R.; Power, M.R.; Gottlieb, P.; Miller, G.L. Rapid quantitative mineral and phase analysis using automated scanning electron microscopy (QEMSCAN); potential applications in forensic geoscience. In Forensic Geoscience, Principles, Techniques and Applications; Pye, K., Croft, D.J., Eds.; Geological Society Special Publication: London, UK, 2004; Volume 232, pp. 123–136. [Google Scholar]
- Pirrie, D.; Rollinson, G.K. Unlocking the applications of automated mineral analysis. Geol. Today 2011, 27, 226–235. [Google Scholar] [CrossRef]
- Andersen, J.C.Ø.; Rollinson, G.K.; Snook, B.; Herrington, R.; Fairhurst, R.J. Use of QEMSCAN® for the characterization of Ni-rich and Ni-poor goethite in laterite ores. Miner. Eng. 2009, 22, 1119–1129. [Google Scholar] [CrossRef]
- Rollinson, G.K.; Andersen, J.C.Ø.; Stickland, R.J.; Boni, M.; Fairhurst, R. Characterisation of non-sulphide zinc deposits using QEMSCAN®. Miner. Eng. 2011, 24, 778–787. [Google Scholar] [CrossRef]
- Barton, P.B., Jr.; Bethke, P.M. Chalcopyrite disease in sphalerite: Pathology and epidemiology. Am. Miner. 1987, 72, 451–467. [Google Scholar]
- Whitney, D.L.; Evans, B.W. Abbreviations for names of rock-forming minerals. Am. Miner. 2010, 95, 185–187. [Google Scholar] [CrossRef]
- McDonough, W.F.; Sun, S.-S. The composition of the earth. Chem. Geol. 1995, 120, 223–253. [Google Scholar] [CrossRef]
- Cruz, M.I. Mineralogy and geochemistry of contrasting hydrothermal systems on the Arctic mid-ocean ridge (AMOR): The Jan Mayen and Loki’s Castle vent fields. Ph.D. Thesis, Universidade de Lisboa, Lisboa, Portugal, 2016. [Google Scholar]
- Yıldırım, N.; Dönmez, C.; Kang, J.; Lee, I.; Pirajno, F.; Yıldırım, E.; Günay, K.; Seo, J.H.; Farquhar, J.; Chang, S.W. A magnetite-rich Cyprus-type VMS deposit in Ortaklar: A unique VMS style in the Tethyan metallogenic belt, Gaziantep, Turkey. Ore Geol. Rev. 2016, 79, 425–442. [Google Scholar] [CrossRef]
- Steeves, N.J.; Hannington, M.D.; Gemmell, J.B.; Green, D.; McVeigh, G. The glacier creek Cu-Zn VMS deposit, southeast Alaska: An addition to the Alexander Triassic metallogenic belt. Econ. Geol. 2016, 111, 151–178. [Google Scholar] [CrossRef]
- Gromet, L.P.; Haskin, L.A.; Korotev, R.L.; Dymek, R.F. The “North American shale composite”: Its compilation, major and trace element characteristics. Geochim. Cosmochim. Acta 1984, 48, 2469–2482. [Google Scholar] [CrossRef]
- Yund, R.A.; Kullerud, G. Thermal stability of assemblages in the Cu–Fe–S system. J. Petrol. 1966, 7, 454–488. [Google Scholar] [CrossRef]
- Craig, J.R.; Ljokjell, P.; Vokes, F.M. Sphalerite compositional variations in sulfide ores of the Norwegian Caledonides. Econ. Geol. 1984, 79, 1727–1735. [Google Scholar] [CrossRef]
- Barton, P.B., Jr.; Skinner, B.J. Sulfide mineral stabilities. In Geochemistry of Hydrothermal ore Deposits; Barnes, H.L., Ed.; Wiley-Interscience: New York, NY, USA, 1979; pp. 278–403. [Google Scholar]
- Fallon, E.K.; Petersen, S.; Brooker, R.A.; Scott, T.B. Oxidative dissolution of hydrothermal mixed-sulphide ore: An assessment of current knowledge in relation to seafloor massive sulphide mining. Ore Geol. Rev. 2017, 86, 309–337. [Google Scholar] [CrossRef]
- Baker, E.T.; German, C.R. On the global distribution of hydrothermal vent fields. In Mid-Ocean Ridges; German, C., Lin, J., Parson, L., Eds.; American Geophysical Union: Washington, DC, USA, 2013; Volume 148.55. [Google Scholar]
- Dumke, I.; Ludvigsen, M.; Ellefmo, S.L.; Søreide, F.; Johnsen, G.; Murton, B.J. Underwater hyperspectral imaging using a stationary platform in the Trans-Atlantic Geotraverse hydrothermal field. IEEE Trans. Geosci. Remote Sens. 2017. Submitted. [Google Scholar]
- OECD—The Platform for Cooperation on Tax Discussion Draft: Addressing the Information Gaps on Prices of Minerals Sold in an Intermediate Form. Available online: https://www.oecd.org/ctp/discussion-draft-addressing-the-information-gaps-on-prices-of-minerals-sold-in-an-intermediate-form.pdf (accessed on 20 July 2018).
- Fountain, C. The whys and wherefores of penalty elements in copper concentrates. MetPlant 2013, 5, 502–518. [Google Scholar]
- Goldstein, J.I.; Newbury, D.E.; Michael, J.R.; Ritchie, N.W.M.; Scott, J.H.J.; Joy, D.C. Scanning Electron Microscopy and x-ray Microanalysis, 3rd ed.; Springer: New York, NY, USA, 2003. [Google Scholar]
- Kowalczuk, P.B.; Snook, B.; Kleiv, R.A.; Aasly, K. Efficient extraction of copper and zinc from seafloor massive sulphide rock samples from the Loki’s Castle area at the Arctic mid-ocean ridge. Miner. Eng. 2018, 115, 106–116. [Google Scholar] [CrossRef]
- Kowalczuk, P.; Manaig, D.; Drivenes, K.; Snook, B.; Aasly, K.; Kleiv, R. Galvanic leaching of seafloor massive sulphides using MnO2 in H2SO4-NaCl media. Minerals 2018, 8, 235. [Google Scholar] [CrossRef]


| Sample | Description | brt | qtz | amo | py | mrc | sp | iso | ccp | gn | po | anh | gp | tlc | hl | bss |
|---|---|---|---|---|---|---|---|---|---|---|---|---|---|---|---|---|
| i | dark rusty | ++ | ++ | ++ | +++ | ++ | + | + | ? | + | ||||||
| ii | dark rusty | +++ | + | +++ | +++ | + | + | + | ||||||||
| iii | mixed | +++ | + | |||||||||||||
| iv(w) | white | +++ | + | |||||||||||||
| iv(b) | dark rusty | +++ | ++ | + | + | ++ | + | ++ | + | + | ||||||
| v | white/grey | +++ | + | |||||||||||||
| vi | mixed | +++ | +++ | + | ||||||||||||
| vii | grey rusty | ++ | +++ | + | + | + | + | + | + | + | ||||||
| viii | dark rusty | + | +++ | + | + | ++ | +++ | ++ | + | + | ||||||
| ix | grey rusty | +++ | +++ | + | ? | |||||||||||
| x | mixed rusty | +++ | +++ | + | ? | + | ||||||||||
| xi | mixed | + | +++ | + | + | + | ||||||||||
| xii | grey | + | + | +++ | ++ | +++ | + | |||||||||
| xiii | green | +++ | ? | + | +++ | ++ | ||||||||||
| xiv | green | +++ | ? | + | +++ | ++ | ||||||||||
| xv | mixed | + | + | +++ | +++ | +++ |
| 10 µm | 1 µm | ||
|---|---|---|---|
| Measurement | Measurement Mode | Field Image | Field Image |
| Measurement Area (mm) | 20 × 28 | 3 × 3 | |
| No. X-ray Analysis Points | 3,831,192 | 8,598,413 | |
| Mineral mass (wt %) | Quartz | 48.08 | 51.32 |
| Pyrite/Marcasite | 43.69 | 35.23 | |
| Chalcopyrite | 1.68 | 4.75 | |
| Isocubanite | 0.68 | 3.73 | |
| Chalcocite/Covellite | 0.01 | 0.19 | |
| Sphalerite | 3.14 | 3.59 | |
| Galena | 0.05 | 0.02 | |
| Barite | 2.61 | 1.15 | |
| Others | 0.08 | 0.04 | |
| Mineral volume (area %) | Quartz | 61.47 | 63.48 |
| Pyrite/Marcasite | 29.27 | 22.83 | |
| Chalcopyrite | 1.92 | 4.95 | |
| Isocubanite | 0.48 | 2.57 | |
| Chalcocite/Covellite | 0.01 | 0.13 | |
| Sphalerite | 4.82 | 5.17 | |
| Galena | 0.03 | 0.01 | |
| Barite | 1.95 | 0.83 | |
| Others | 0.06 | 0.03 | |
| Grain size min/avg/max (nearest µm) | Quartz | ≤15/73/1511 | ≤1.5/28/226 |
| Pyrite/Marcasite | ≤15/41/388 | ≤1.5/9/109 | |
| Chalcopyrite | ≤15/22/133 | ≤1.5/5/63 | |
| Isocubanite | ≤15/23/85 | ≤1.5/4/43 | |
| Chalcocite/Covellite | ≤15/22/75 | ≤1.5/17/39 | |
| Sphalerite | ≤15/23/145 | ≤1.5/11/59 | |
| Galena | ≤15/18/60 | ≤1.5/6/14 | |
| Barite | ≤15/71/578 | ≤1.5/26/137 | |
| Others | ≤15/16/60/60 | ≤1.5/3/16 |
| b/g | qtz | py/mrc | ccp | iso | cc | spl | gn | brt | other | |
|---|---|---|---|---|---|---|---|---|---|---|
| wt % | n/a | 51.32 | 35.23 | 4.75 | 3.73 | 0.19 | 3.59 | 0.02 | 1.15 | 0.04 |
| vol % | n/a | 63.48 | 22.83 | 4.95 | 2.57 | 0.13 | 5.17 | 0.01 | 0.83 | 0.03 |
| size µm | n/a | 28 | 9 | 5 | 4 | 17 | 11 | 6 | 26 | 3 |
| b/g | 0.00 | 20.99 | 10.52 | 1.08 | 0.47 | 28.17 | 7.10 | 2.74 | 18.57 | 22.06 |
| qtz | 58.97 | 0.00 | 65.98 | 0.61 | 0.01 | 0.00 | 12.49 | 3.65 | 30.77 | 22.41 |
| py/mrc | 33.86 | 75.55 | 0.00 | 27.67 | 2.78 | 0.56 | 66.50 | 47.03 | 39.33 | 24.70 |
| ccp | 1.25 | 0.25 | 9.87 | 0.00 | 96.68 | 71.07 | 13.49 | 0.68 | 0.66 | 9.45 |
| iso | 0.35 | 0.00 | 0.65 | 62.89 | 0.00 | 0.15 | 0.08 | 0.00 | 0.01 | 0.00 |
| cc | 0.27 | 0.00 | 0.00 | 0.59 | 0.00 | 0.00 | 0.00 | 0.00 | 0.00 | 0.03 |
| spl | 4.24 | 2.66 | 12.35 | 7.02 | 0.06 | 0.00 | 0.00 | 5.48 | 2.79 | 5.78 |
| gn | 0.01 | 0.00 | 0.03 | 0.00 | 0.00 | 0.00 | 0.02 | 0.00 | 1.94 | 0.59 |
| brt | 0.72 | 0.43 | 0.48 | 0.02 | 0.00 | 0.00 | 0.18 | 36.07 | 0.00 | 14.98 |
| other | 0.34 | 0.12 | 0.12 | 0.13 | 0.00 | 0.05 | 0.15 | 4.34 | 5.93 | 0.00 |
| Point | As | S | Mn | Pb | Fe | Bi | Co | Cd | Ni | Sb | Cu | Zn | Total |
|---|---|---|---|---|---|---|---|---|---|---|---|---|---|
| 1 ccp | 0.02 | 34.36 | 0.01 | 0.02 | 31.45 | <DL | 0.04 | 0.03 | <DL | 0.02 | 30.76 | 0.40 | 97.10 |
| 2 ccp | <DL | 34.26 | 0.01 | 0.03 | 32.11 | <DL | 0.04 | 0.01 | <DL | <DL | 30.30 | 0.41 | 97.16 |
| 3 ccp | <DL | 34.14 | 0.00 | <DL | 31.87 | <DL | 0.06 | 0.02 | <DL | 0.01 | 30.33 | 0.44 | 96.88 |
| 4 ccp | <DL | 33.67 | 0.02 | 0.03 | 31.60 | <DL | 0.07 | 0.01 | <DL | 0.04 | 30.51 | 0.60 | 96.56 |
| 5 spl | <DL | 32.21 | 0.45 | <DL | 15.50 | <DL | 0.03 | 0.17 | <DL | <DL | 0.25 | 46.69 | 95.29 |
| 6 spl | <DL | 32.01 | 0.43 | 0.06 | 15.97 | <DL | 0.03 | 0.14 | 0.02 | <DL | 0.29 | 46.39 | 95.33 |
| 7 spl | <DL | 32.81 | 0.55 | <DL | 17.52 | <DL | 0.02 | 0.14 | 0.02 | 0.02 | 2.99 | 42.03 | 96.09 |
| 8 spl | <DL | 32.90 | 0.61 | 0.11 | 17.87 | <DL | 0.02 | 0.10 | 0.02 | <DL | 3.54 | 42.01 | 97.18 |
| 9 spl | <DL | 31.78 | 0.61 | 0.16 | 15.91 | <DL | 0.01 | 0.08 | 0.01 | <DL | 0.89 | 45.10 | 94.56 |
| 10 spl | <DL | 32.82 | 0.65 | 0.00 | 16.88 | <DL | 0.01 | 0.10 | <DL | 0.03 | 1.80 | 43.94 | 96.22 |
| 11 gn | <DL | 12.89 | <DL | 83.41 | 0.53 | <DL | <DL | 0.13 | 0.02 | <DL | 0.57 | 0.18 | 97.73 |
| 12 gn | <DL | 12.78 | <DL | 83.92 | 0.32 | <DL | <DL | 0.17 | <DL | 0.05 | 0.24 | 0.07 | 97.55 |
| 13 iso | 0.01 | 34.26 | 0.08 | 0.02 | 43.00 | <DL | 0.06 | 0.02 | <DL | 0.01 | 18.81 | 0.82 | 97.09 |
| 14 iso | <DL | 34.24 | 0.07 | 0.15 | 41.45 | <DL | 0.05 | 0 | 0.04 | 0.05 | 19.99 | 2.10 | 98.13 |
| Cu | Zn | Fe | S | Au | Ag | Mo | Ni | Co | Mn | Pb | As | Cd | Sb | Ba | |
|---|---|---|---|---|---|---|---|---|---|---|---|---|---|---|---|
| Unit | % | % | % | % | ppm | ppm | ppm | ppm | ppm | ppm | ppm | ppm | ppm | ppm | ppm |
| DL | 5 × 10⁻⁵ | 0.0005 | 0.01 | 0.05 | 0.005 | 0.5 | 0.5 | 0.5 | 1 | 5 | 0.5 | 5 | 0.5 | 0.5 | 5 |
| i | 0.55 | 1.16 | 10.26 | 11.17 | 2.15 | 20.3 | 5.5 | 1034 | 12 | 402 | 1847 | 575 | 34.8 | 30.6 | 193 |
| ii | 1.19 | 1.49 | 18.9 | 19 | 2.42 | 81.5 | 18.3 | 375 | 8 | 1283 | 313 | 2880 | 48.4 | 34 | 66 |
| iii | 0.02 | 0.04 | 0.8 | 0.27 | 2.51 | 139.9 | 1.5 | 1604 | 2 | 164 | 460.3 | 259 | 0.7 | 15.8 | 5612 |
| iv(w) | 0.01 | 0.01 | 0.39 | 0.31 | 5.33 | 7.3 | 3.9 | 846.8 | 1 | 16 | 6 | 221 | <0.5 | 8.3 | 8124 |
| iv(b) | 0.76 | 1.34 | 3.6 | 5.42 | 4.03 | 130.4 | 13.2 | 1818 | 5 | 341 | 7367 | 1387 | 29.5 | 84.2 | 252 |
| v | 0.03 | 0.21 | 0.09 | 0.32 | 6.3 | 339.7 | 0.7 | 1043 | <1 | 26 | 103 | 343 | 5.7 | 48.7 | 4513 |
| vi | 0.03 | 0.08 | 0.9 | 0.72 | 3.1 | 24.9 | 8.2 | 1574 | 1 | 204 | 103.5 | 777 | 1.1 | 63.4 | 2855 |
| vii | 0.55 | 0.56 | 5.83 | 5.33 | 1.07 | 12.2 | 18.8 | 1189 | 3 | 563 | 7808 | 364 | 13.9 | 17.8 | 323 |
| viii | 2.05 | 7.38 | 21.27 | 18.43 | 0.05 | 18.2 | 6.1 | 469.9 | <1 | 777 | 37,418 | 5 | 186.4 | 3.1 | 91 |
| ix | 0.09 | 0.18 | 1.72 | 0.86 | 3.15 | 41.7 | 6 | 1020 | 2 | 468 | 605.9 | 409 | 3.9 | 38.9 | 2079 |
| x | 0.09 | 0.17 | 1.46 | 1.16 | 3.76 | 42.5 | 11.7 | 1998 | <1 | 88 | 568.9 | 1129 | 2.2 | 69.1 | 1650 |
| xi | 0.13 | 0.23 | 1.85 | 1.03 | 0.28 | 4.9 | 11.2 | 1463 | 3 | 392 | 1362 | 181 | 4.4 | 6.9 | 2307 |
| xii | 0.14 | 0.06 | 2.25 | 14.25 | na | 0.8 | <0.5 | 39.8 | 4 | 159 | 24.2 | <5 | 2.3 | 0.6 | 204 |
| xiii | 0.51 | 0.02 | 4.65 | 3.02 | na | 1.1 | <0.5 | 14.9 | 5 | 521 | 20.9 | 12 | <0.5 | <0.5 | 280 |
| xiv | 0.43 | 0.03 | 4.4 | 3.58 | na | 0.9 | <0.5 | 21 | 5 | 495 | 33.3 | 13 | <0.5 | <0.5 | 165 |
| xv | 0.08 | 0.08 | 1.34 | 18.03 | na | <0.5 | <0.5 | 27.1 | 2 | 60 | 34.7 | 6 | 2.6 | 0.5 | 164 |
© 2018 by the authors. Licensee MDPI, Basel, Switzerland. This article is an open access article distributed under the terms and conditions of the Creative Commons Attribution (CC BY) license (http://creativecommons.org/licenses/by/4.0/).
Share and Cite
Snook, B.; Drivenes, K.; Rollinson, G.K.; Aasly, K. Characterisation of Mineralised Material from the Loki’s Castle Hydrothermal Vent on the Mohn’s Ridge. Minerals 2018, 8, 576. https://doi.org/10.3390/min8120576
Snook B, Drivenes K, Rollinson GK, Aasly K. Characterisation of Mineralised Material from the Loki’s Castle Hydrothermal Vent on the Mohn’s Ridge. Minerals. 2018; 8(12):576. https://doi.org/10.3390/min8120576
Chicago/Turabian StyleSnook, Ben, Kristian Drivenes, Gavyn K. Rollinson, and Kurt Aasly. 2018. "Characterisation of Mineralised Material from the Loki’s Castle Hydrothermal Vent on the Mohn’s Ridge" Minerals 8, no. 12: 576. https://doi.org/10.3390/min8120576
APA StyleSnook, B., Drivenes, K., Rollinson, G. K., & Aasly, K. (2018). Characterisation of Mineralised Material from the Loki’s Castle Hydrothermal Vent on the Mohn’s Ridge. Minerals, 8(12), 576. https://doi.org/10.3390/min8120576