
A Study of Digging Productivity of an Electric Rope Shovel for Different Operators

Abstract
:
1. Introduction
2. Background
3. Approach
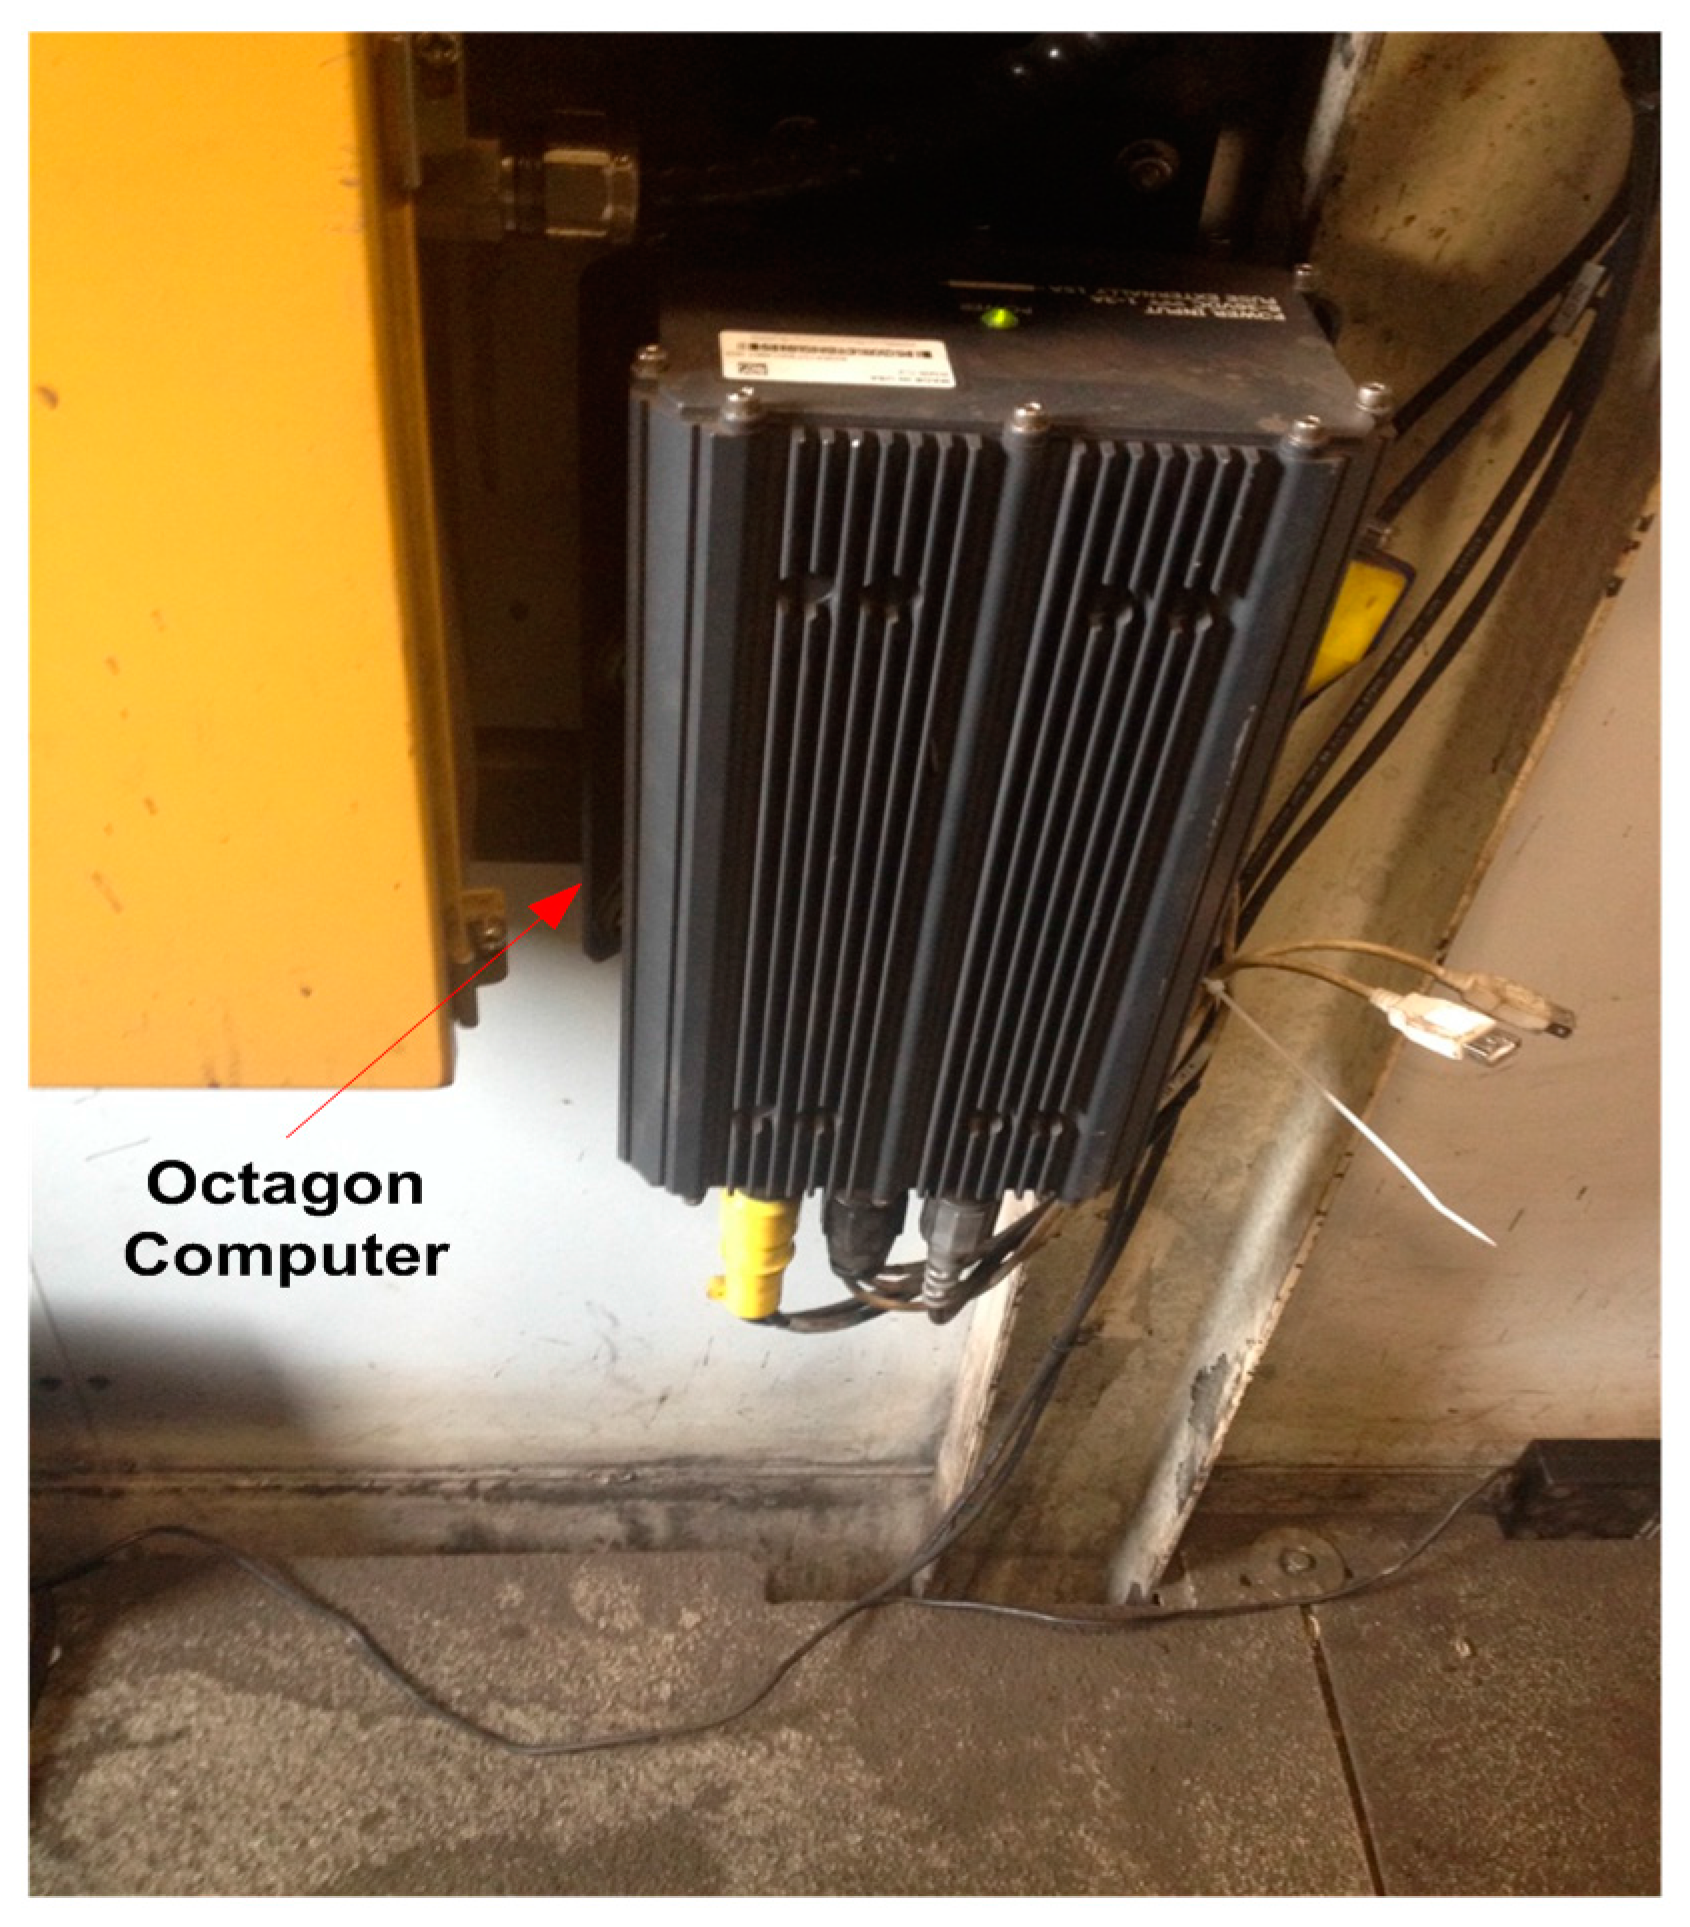
3.1. Field Studies
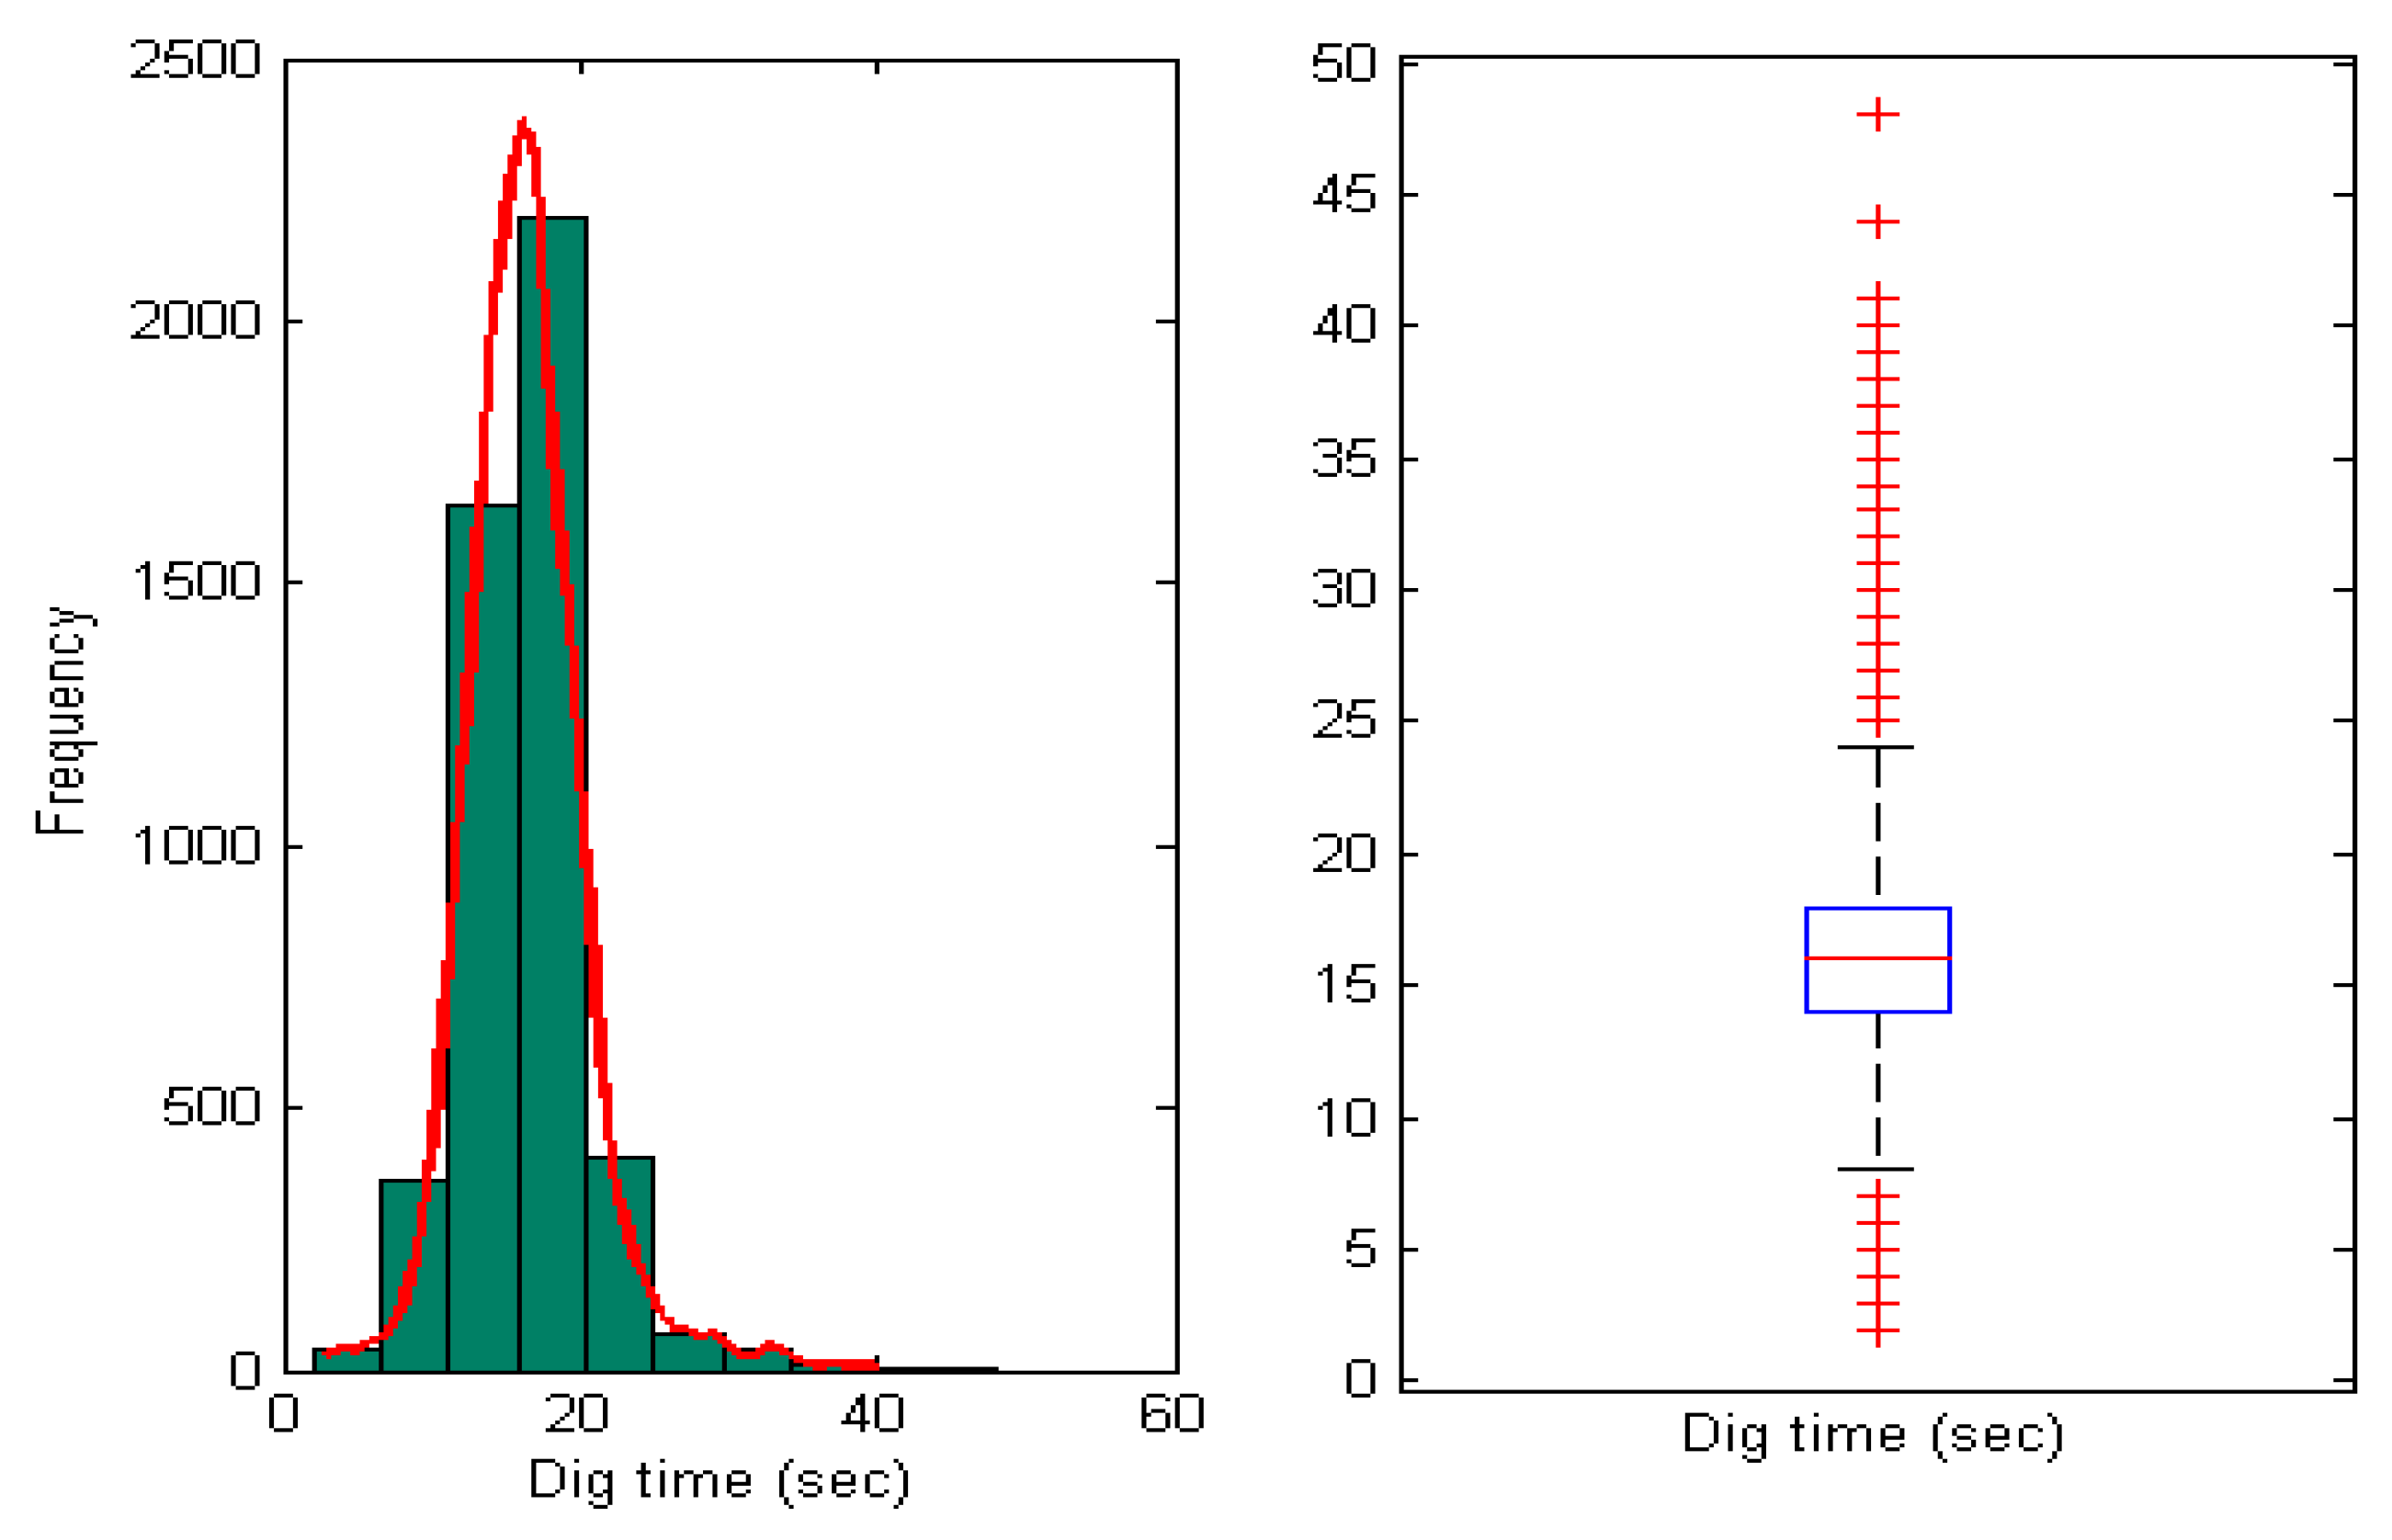
3.2. Statistical and Clustering Analysis
4. Analysis of Results
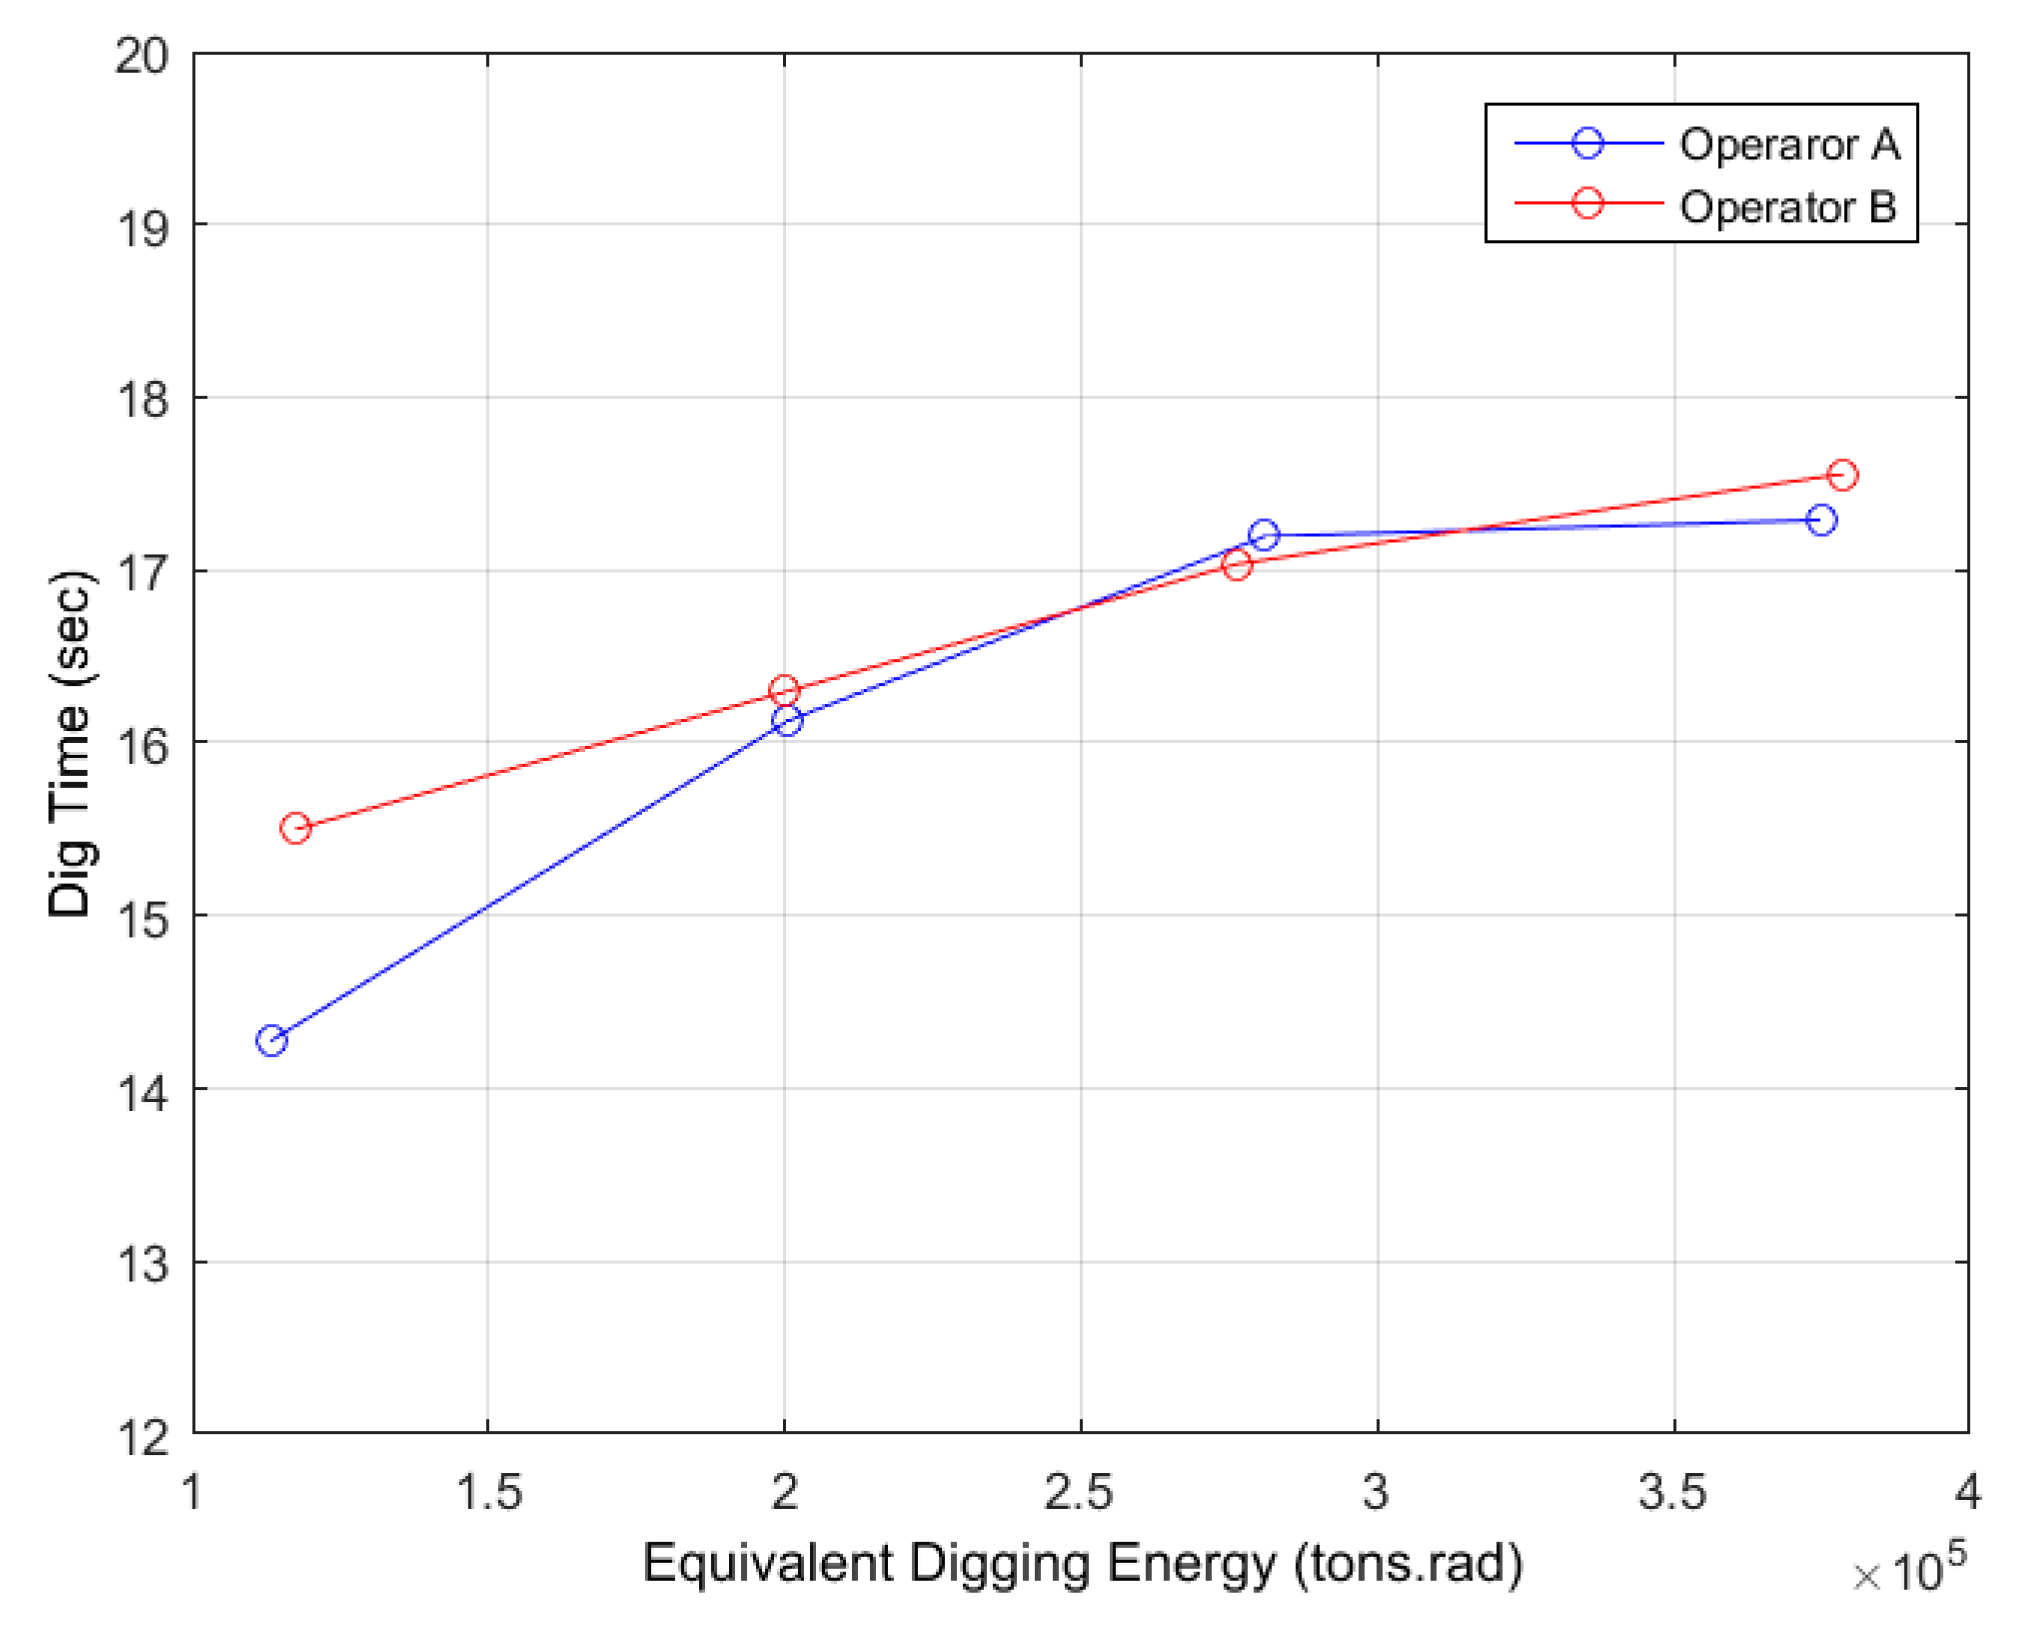
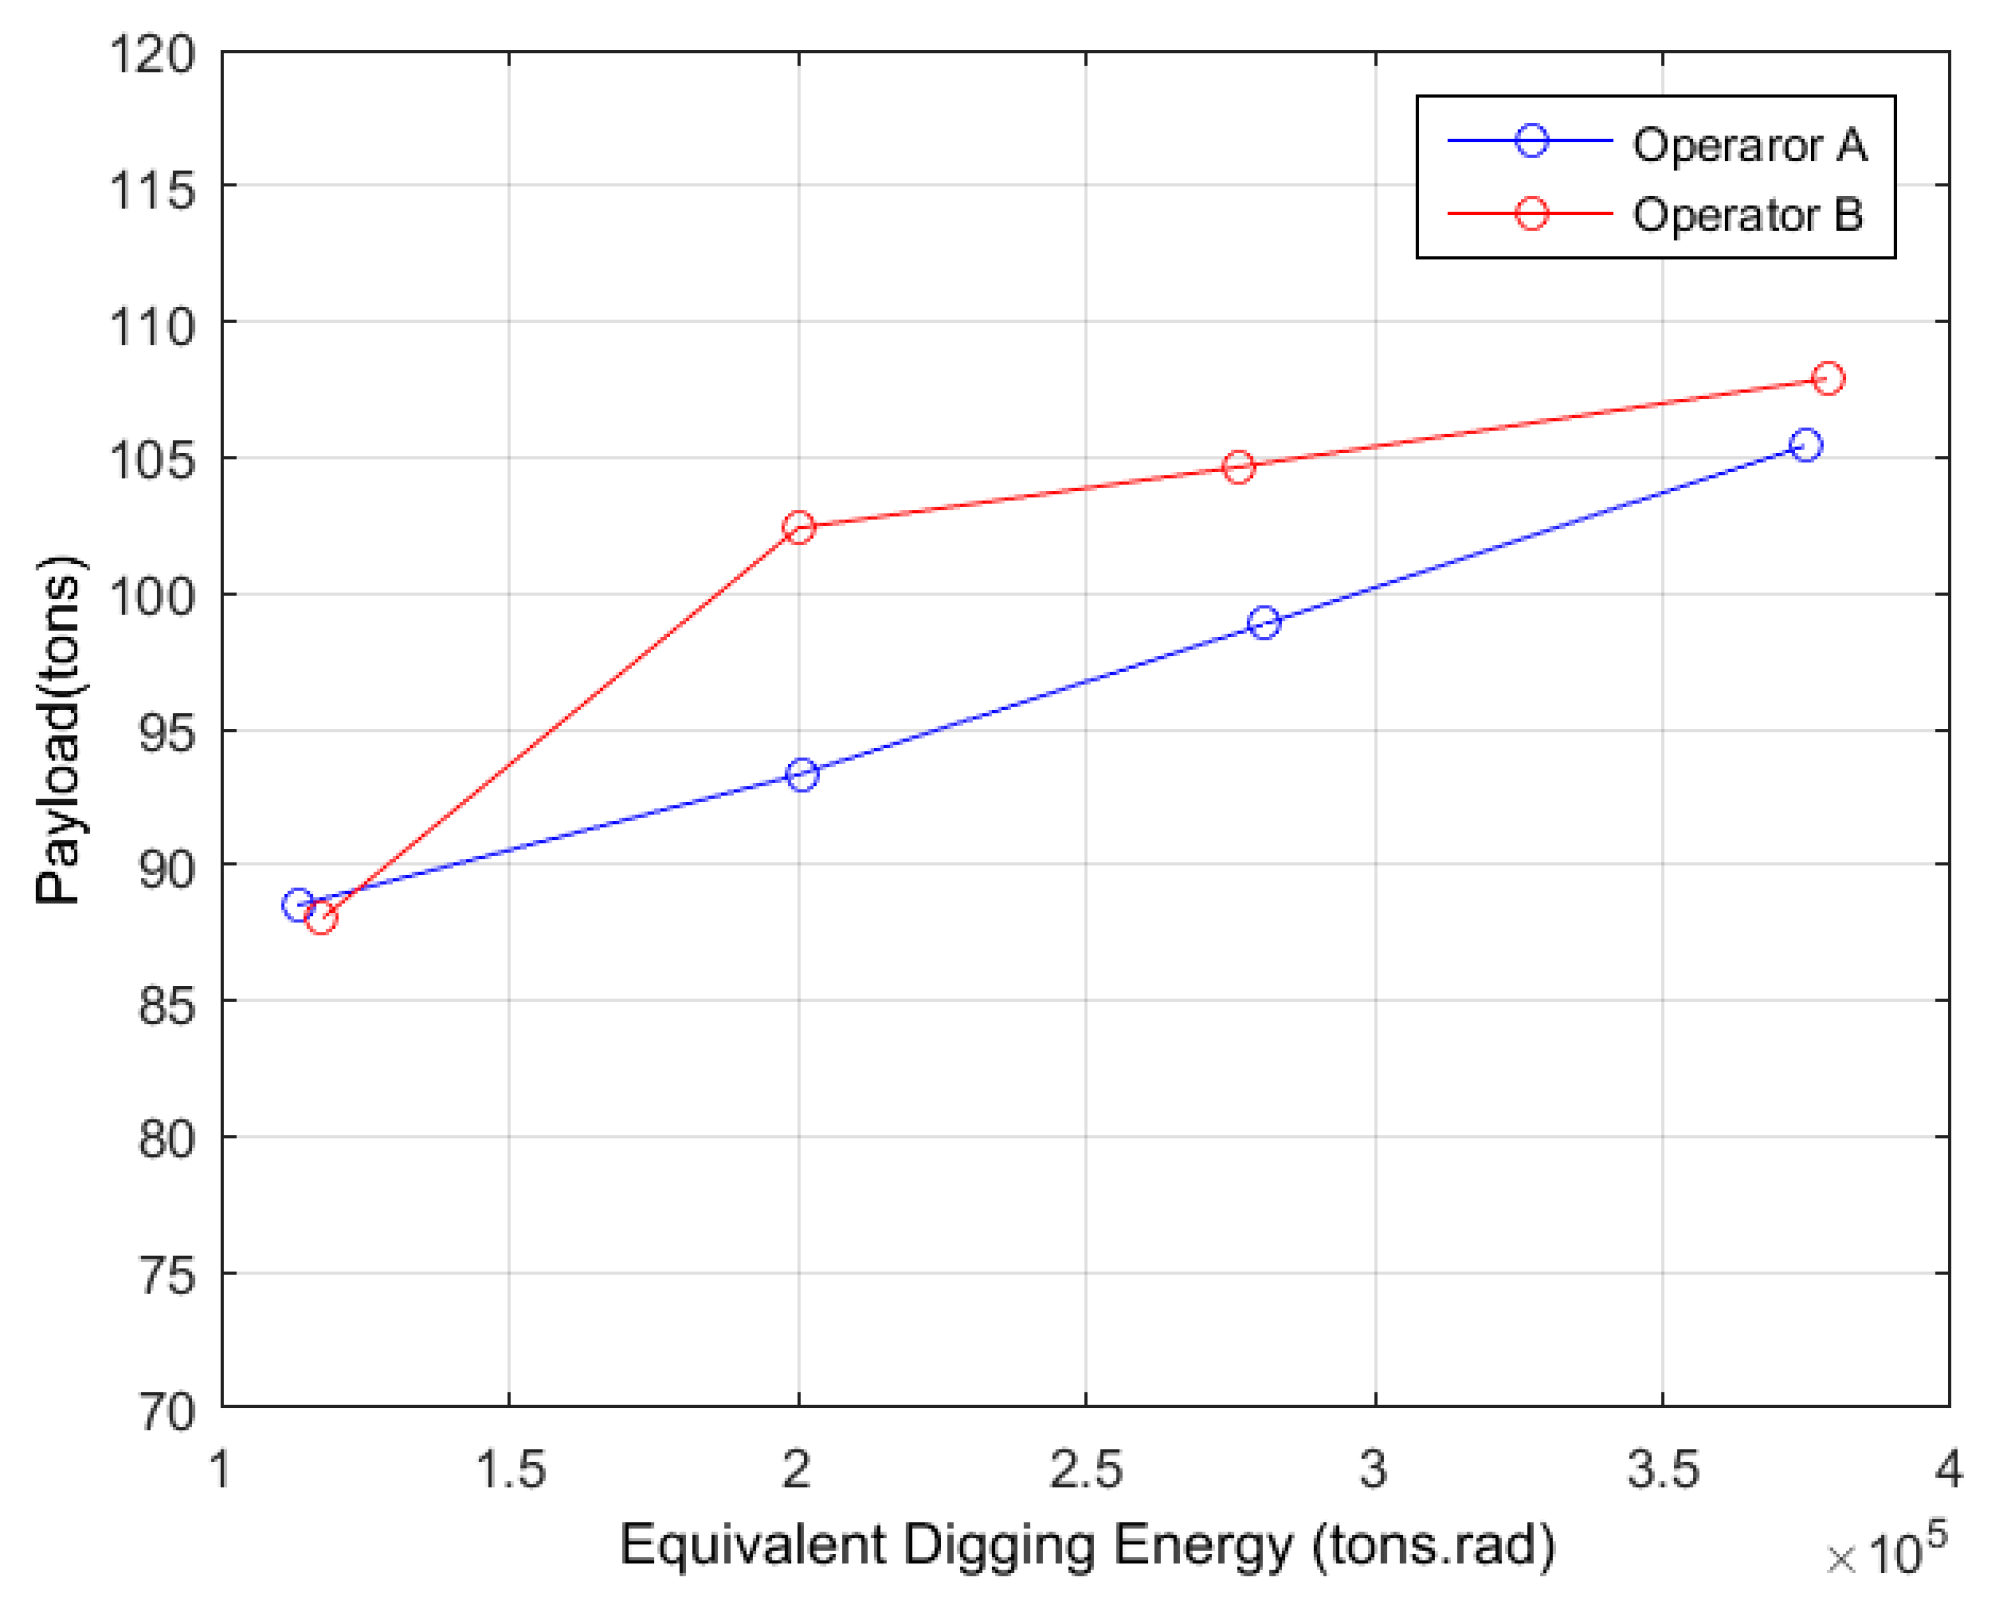
4.1. Productivity
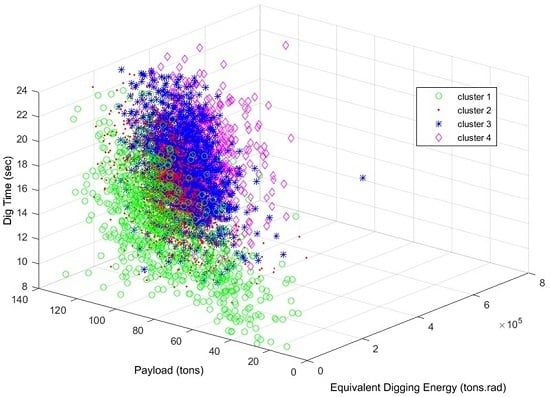
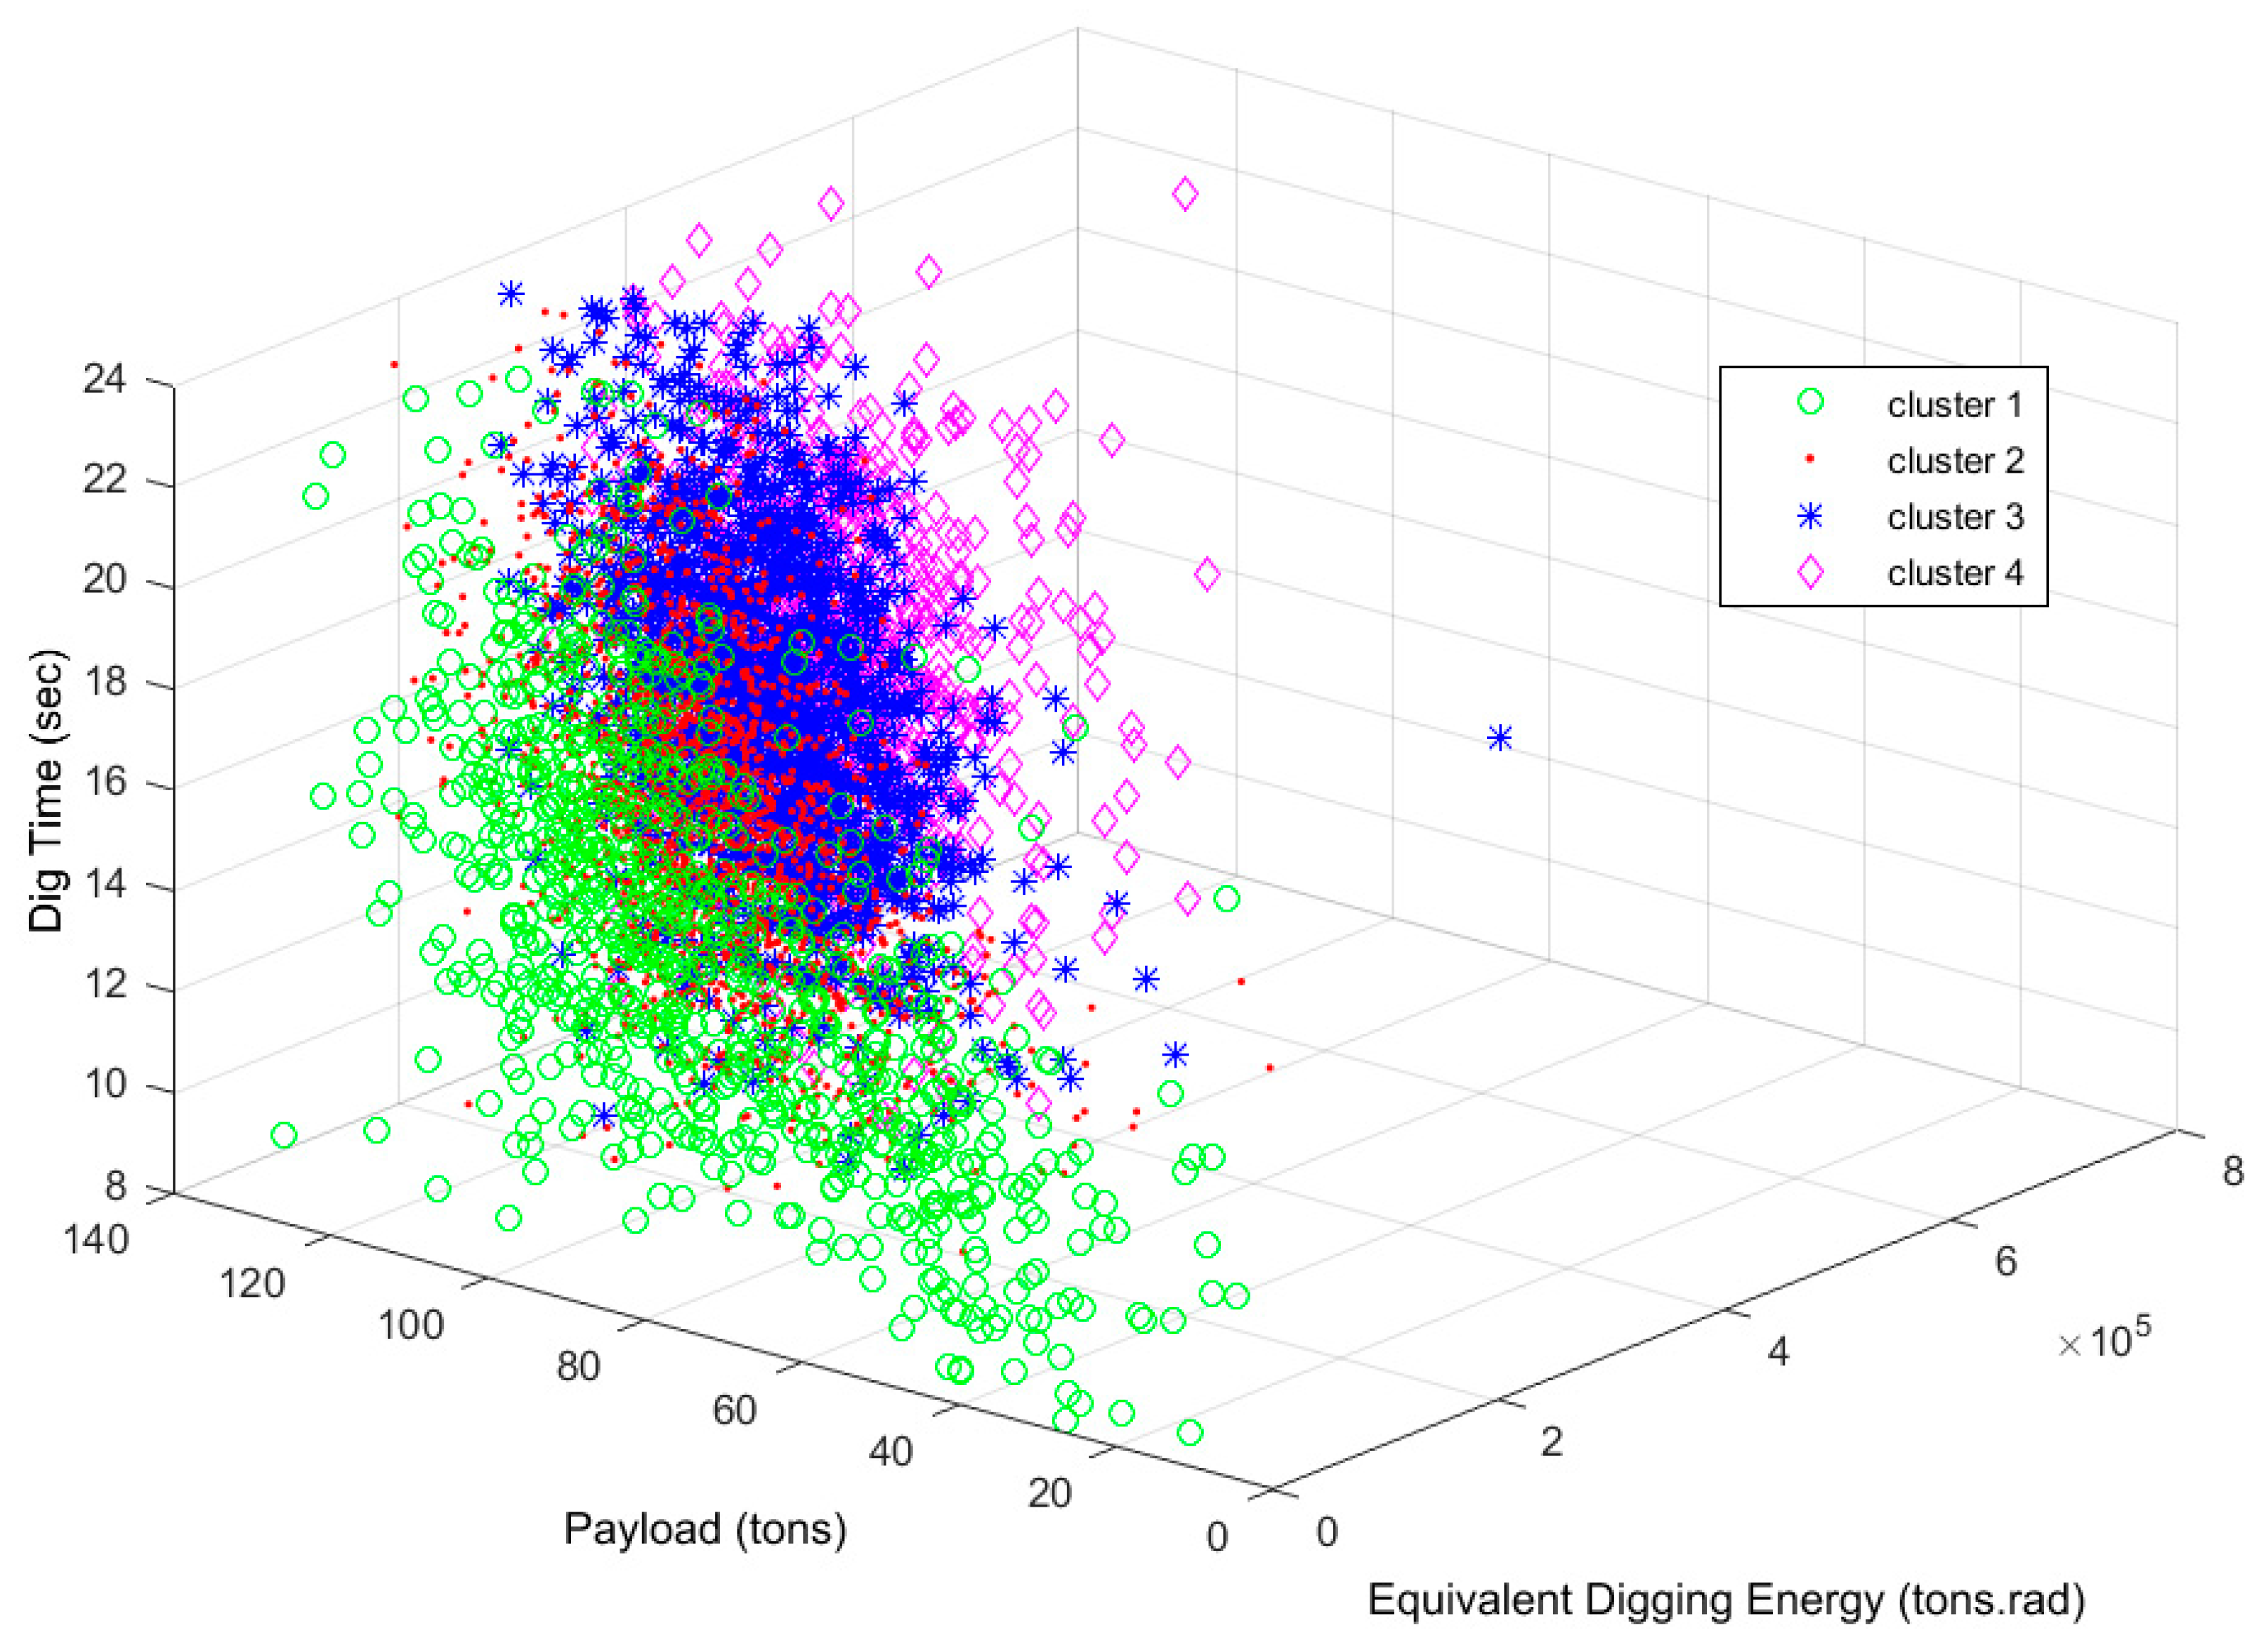
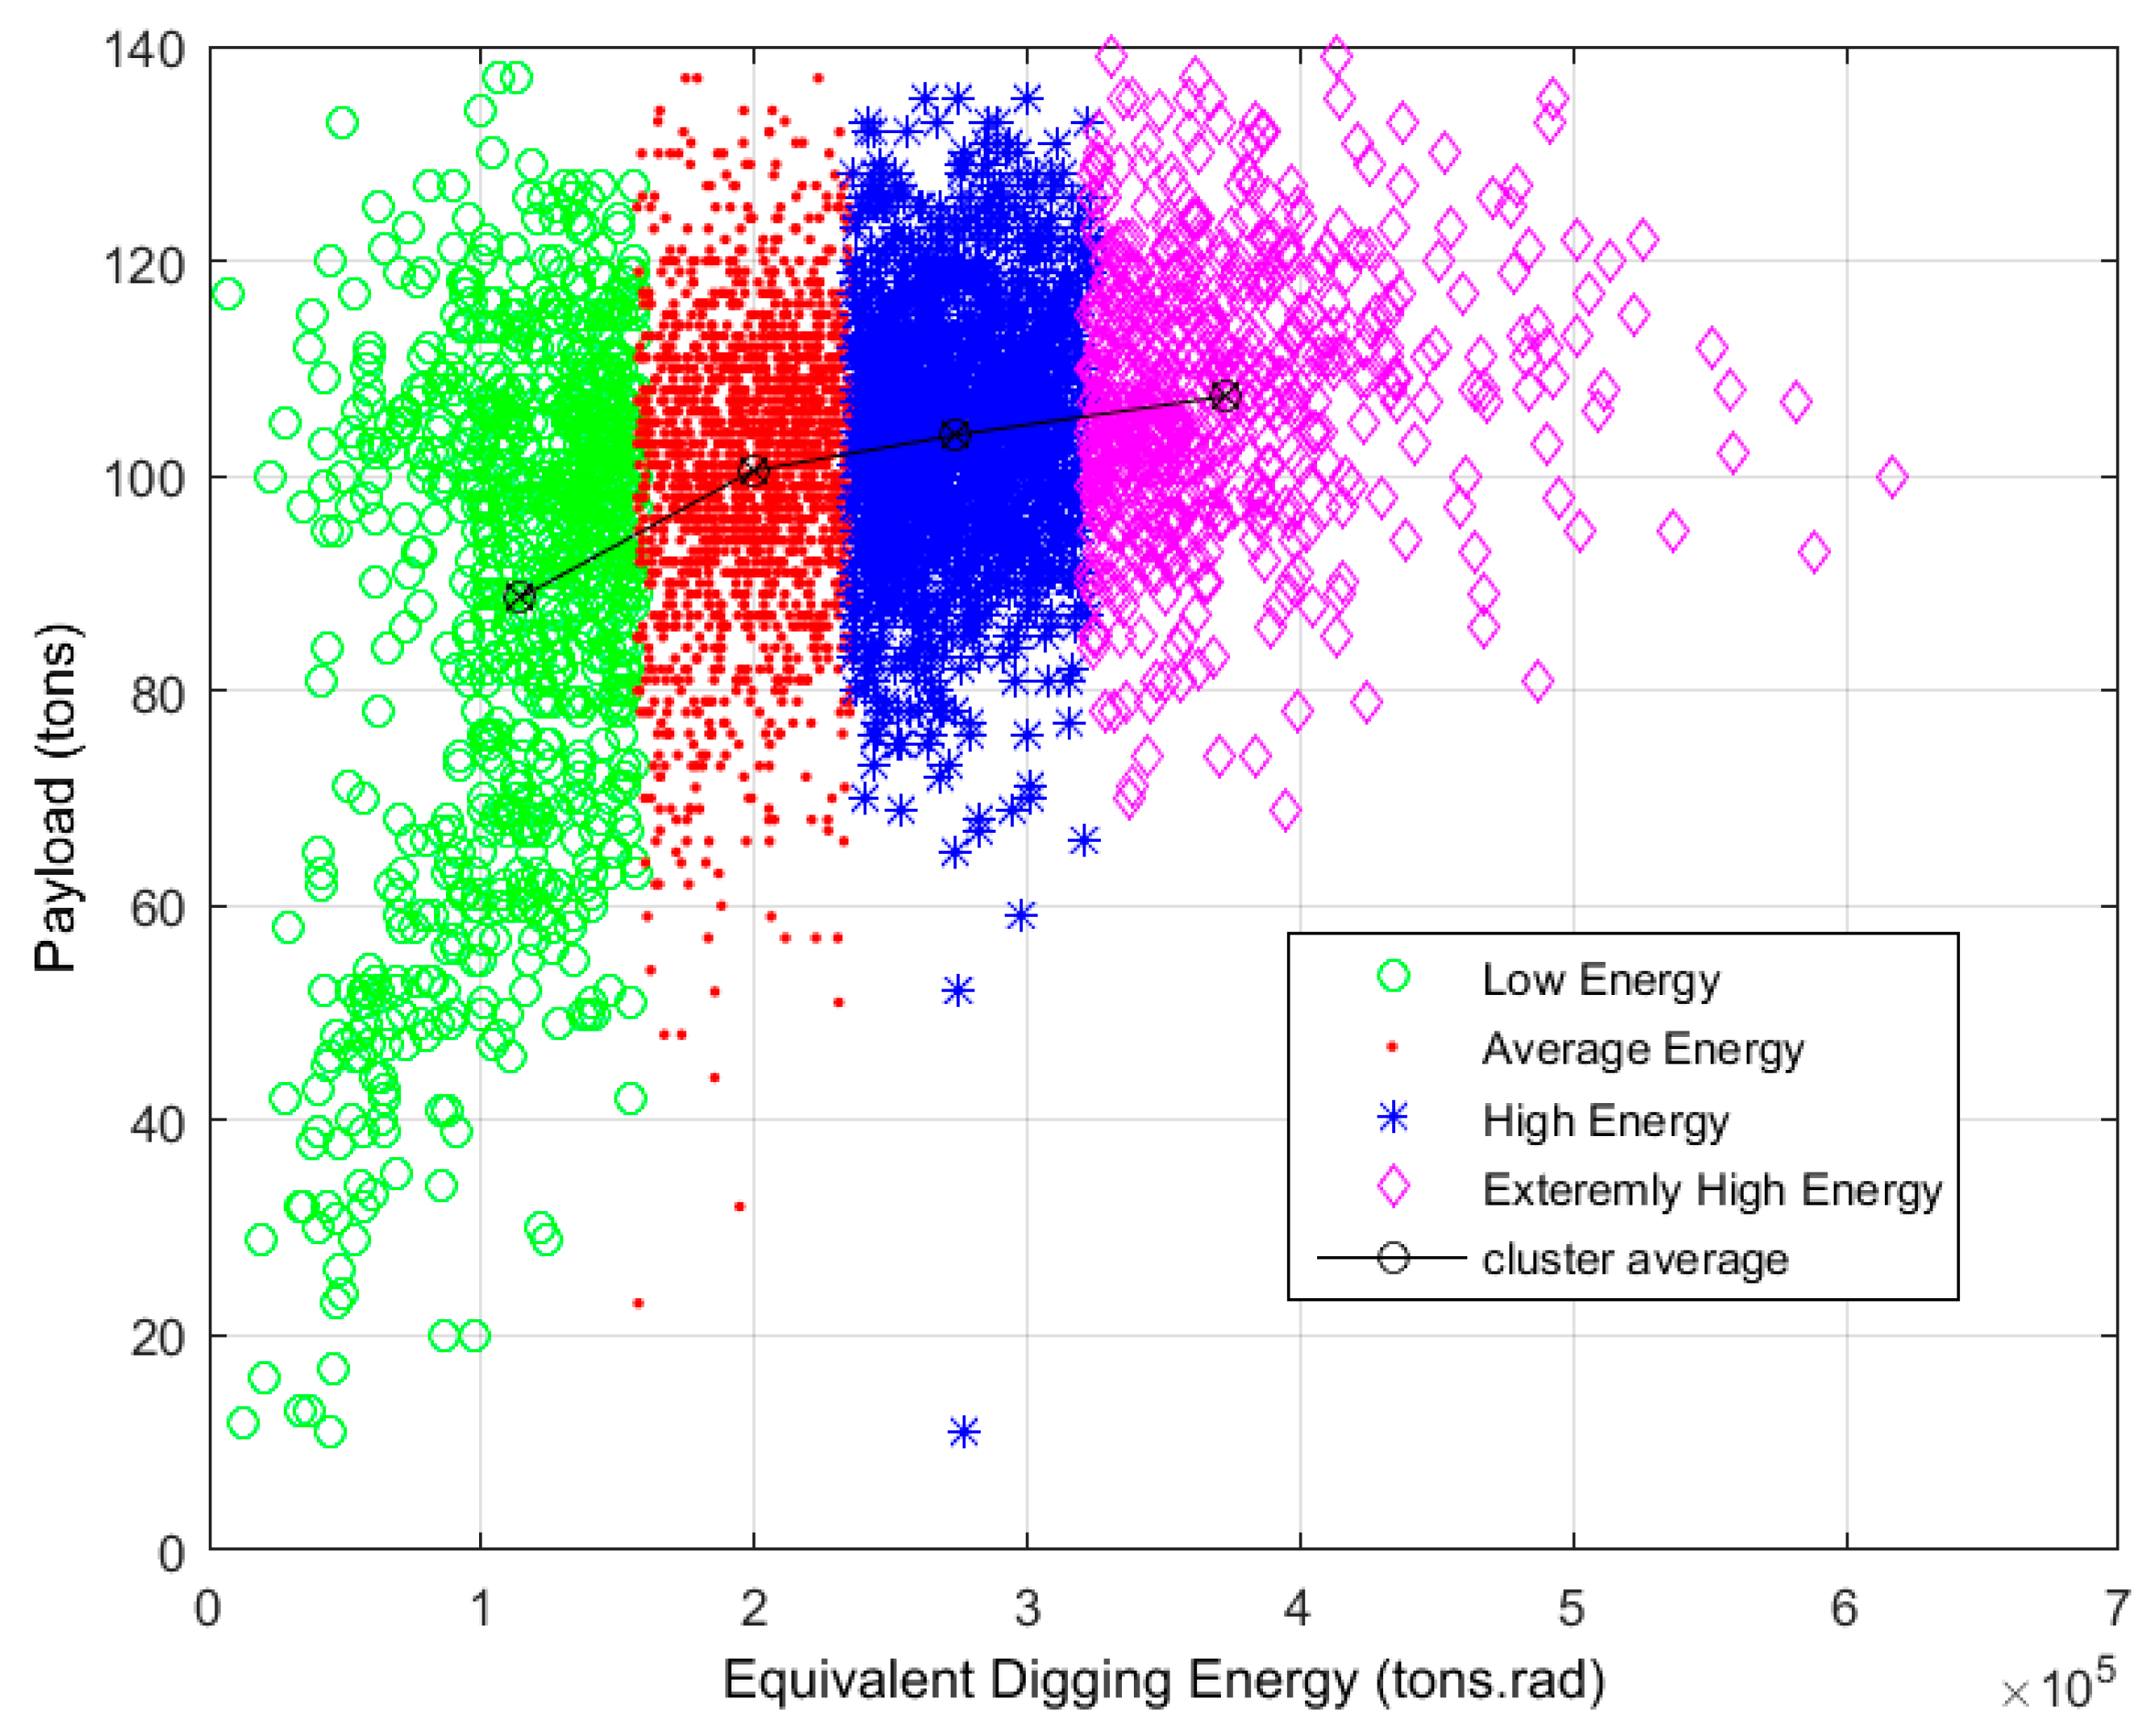
4.2. Clustering of Shovel Cycles
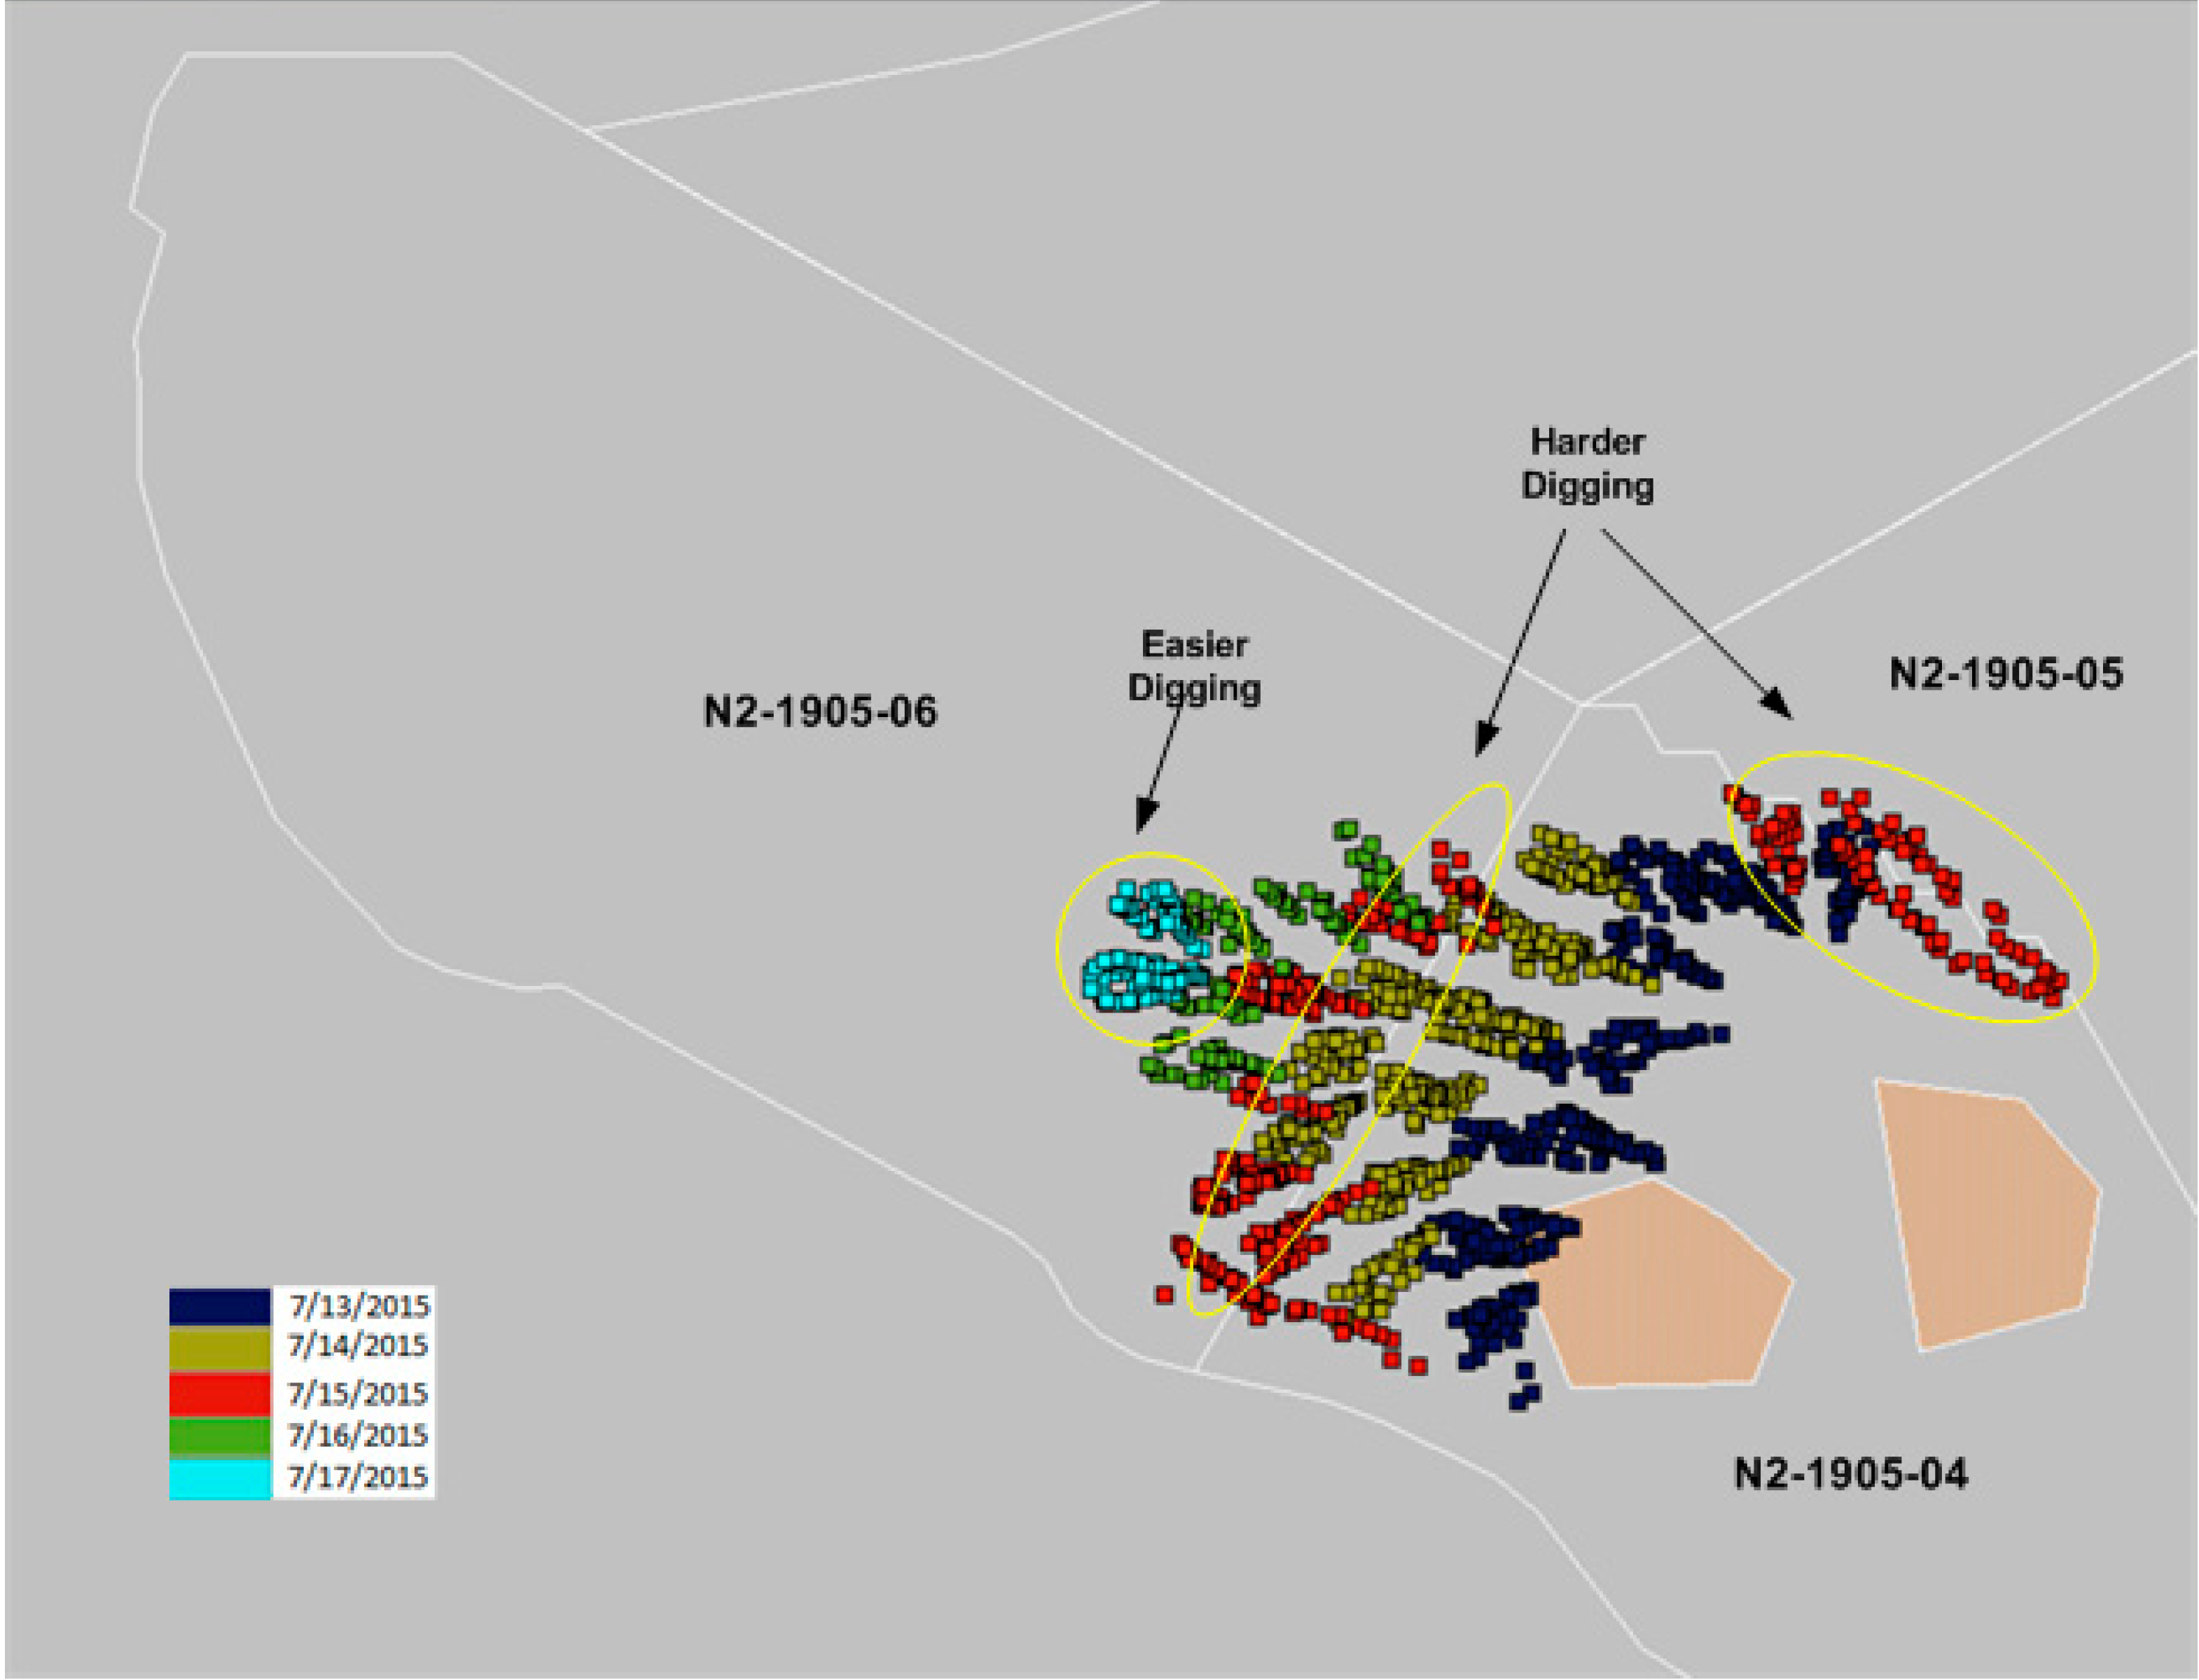
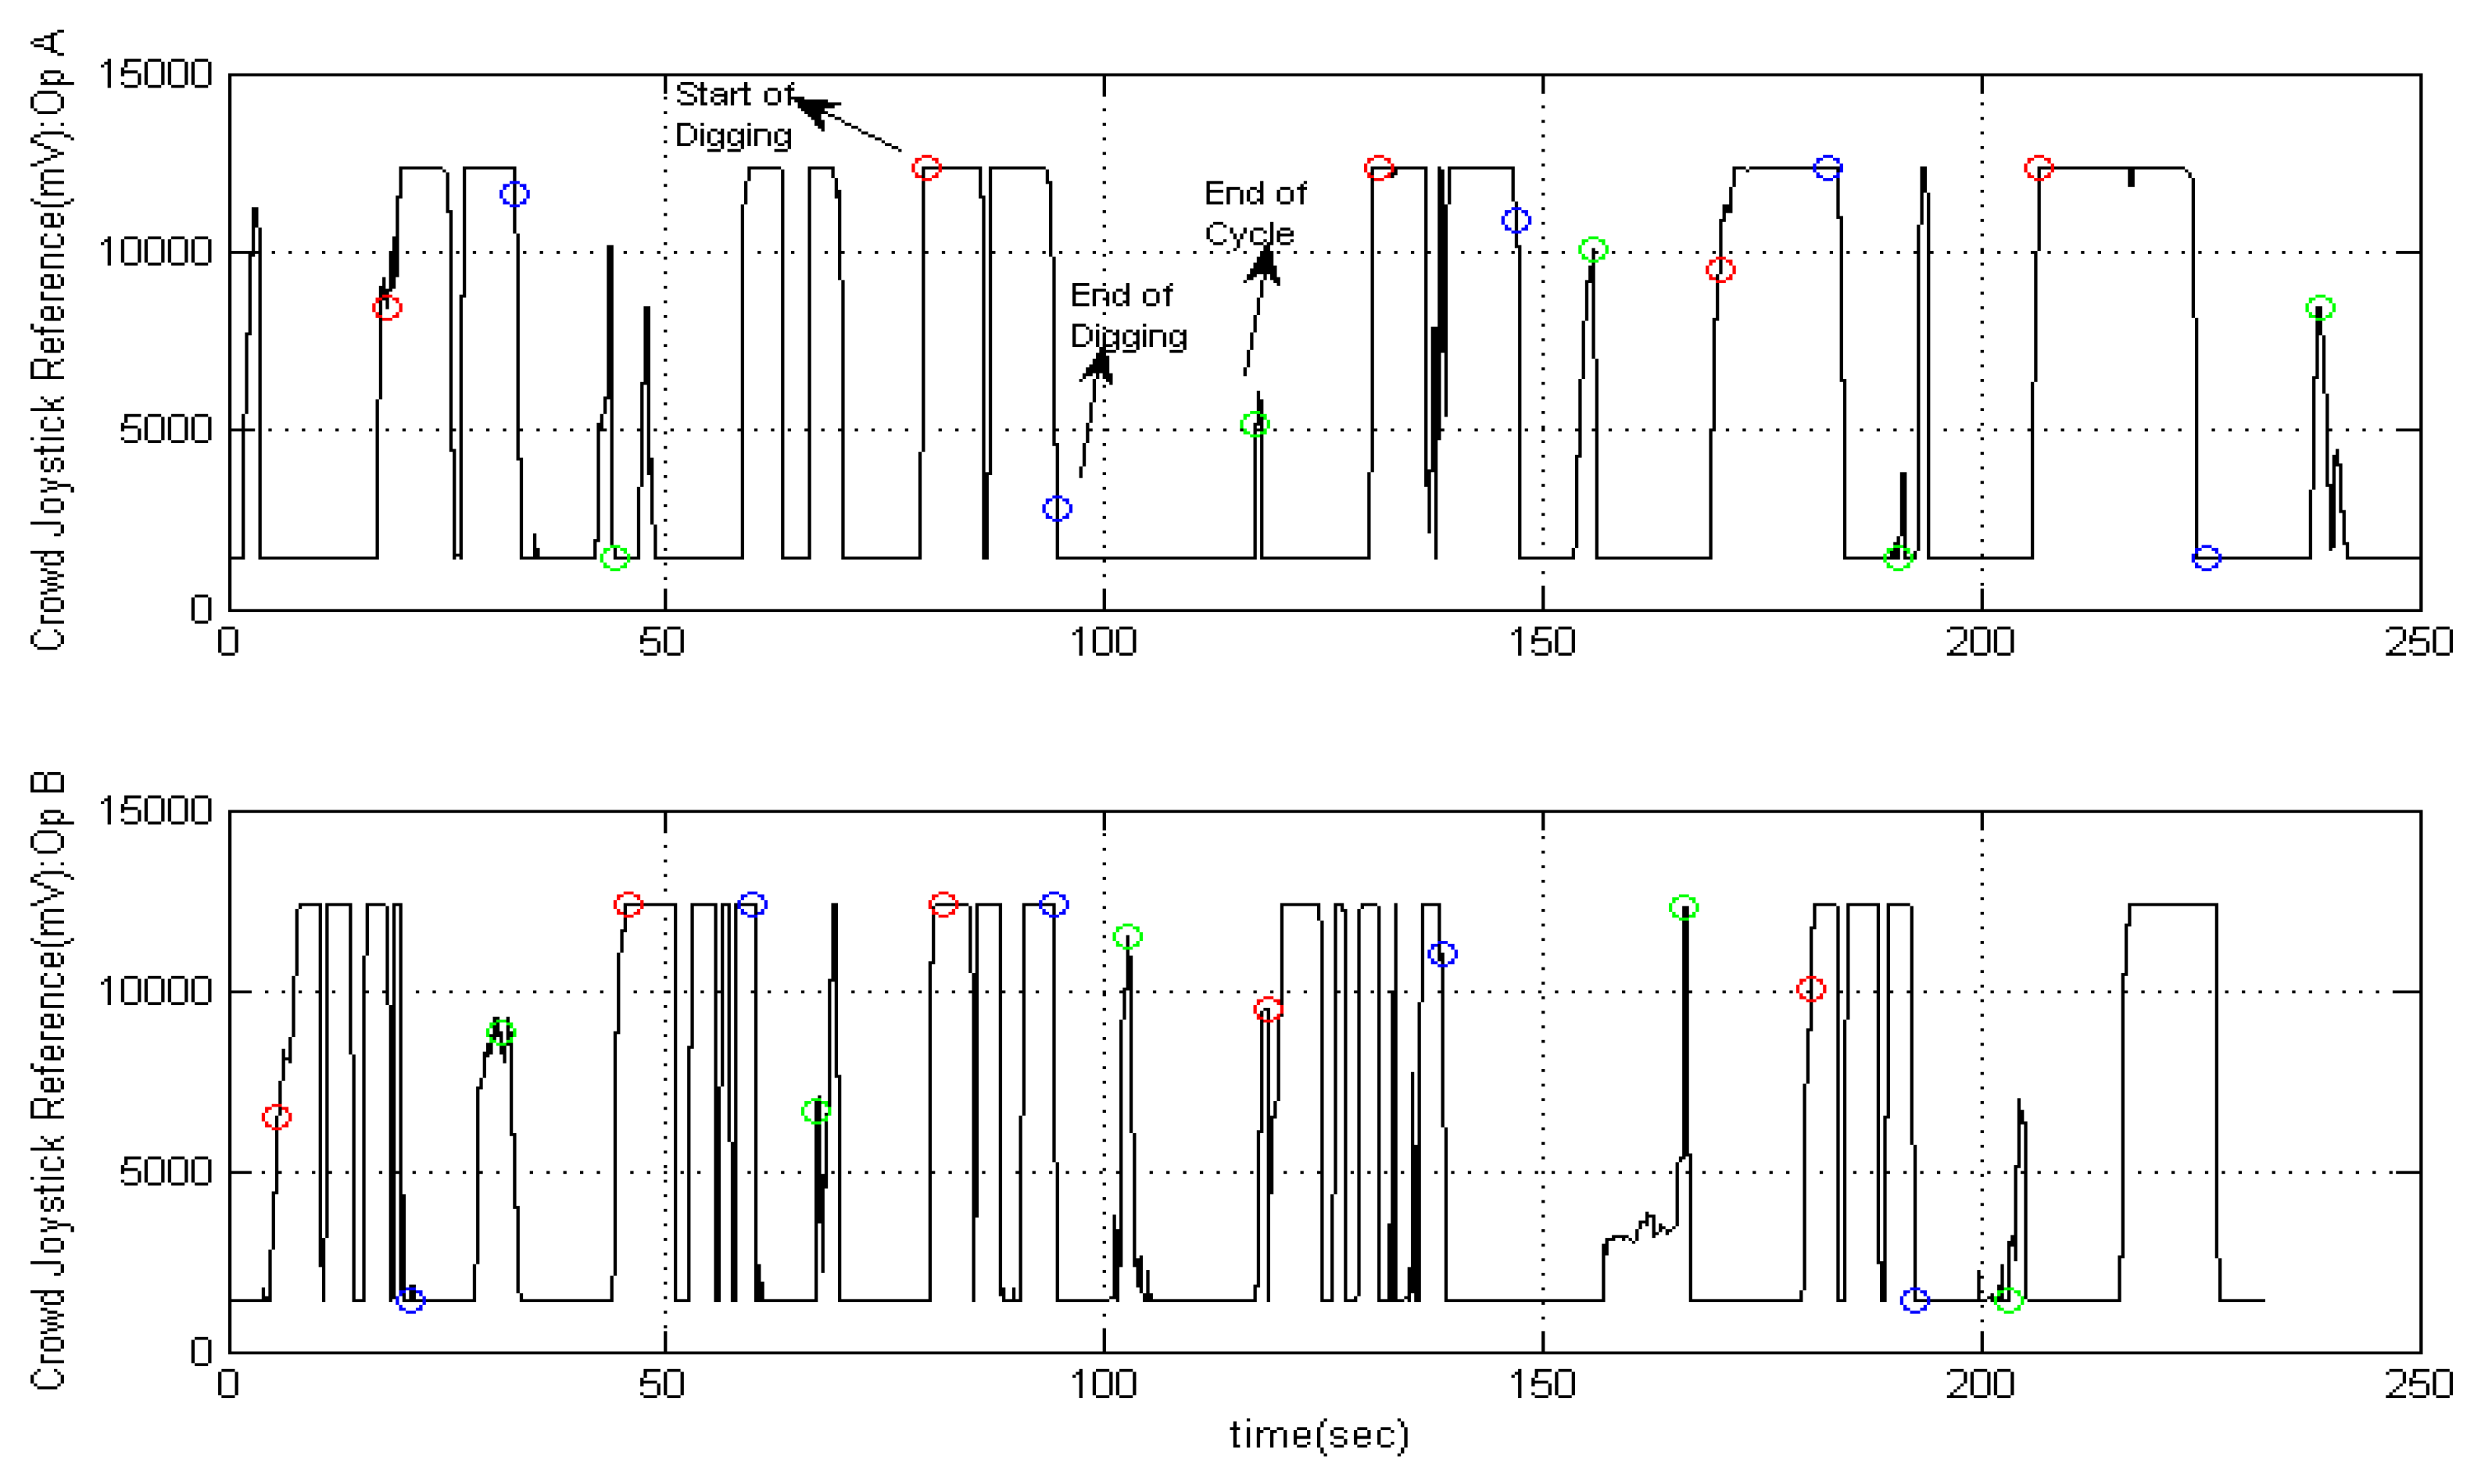
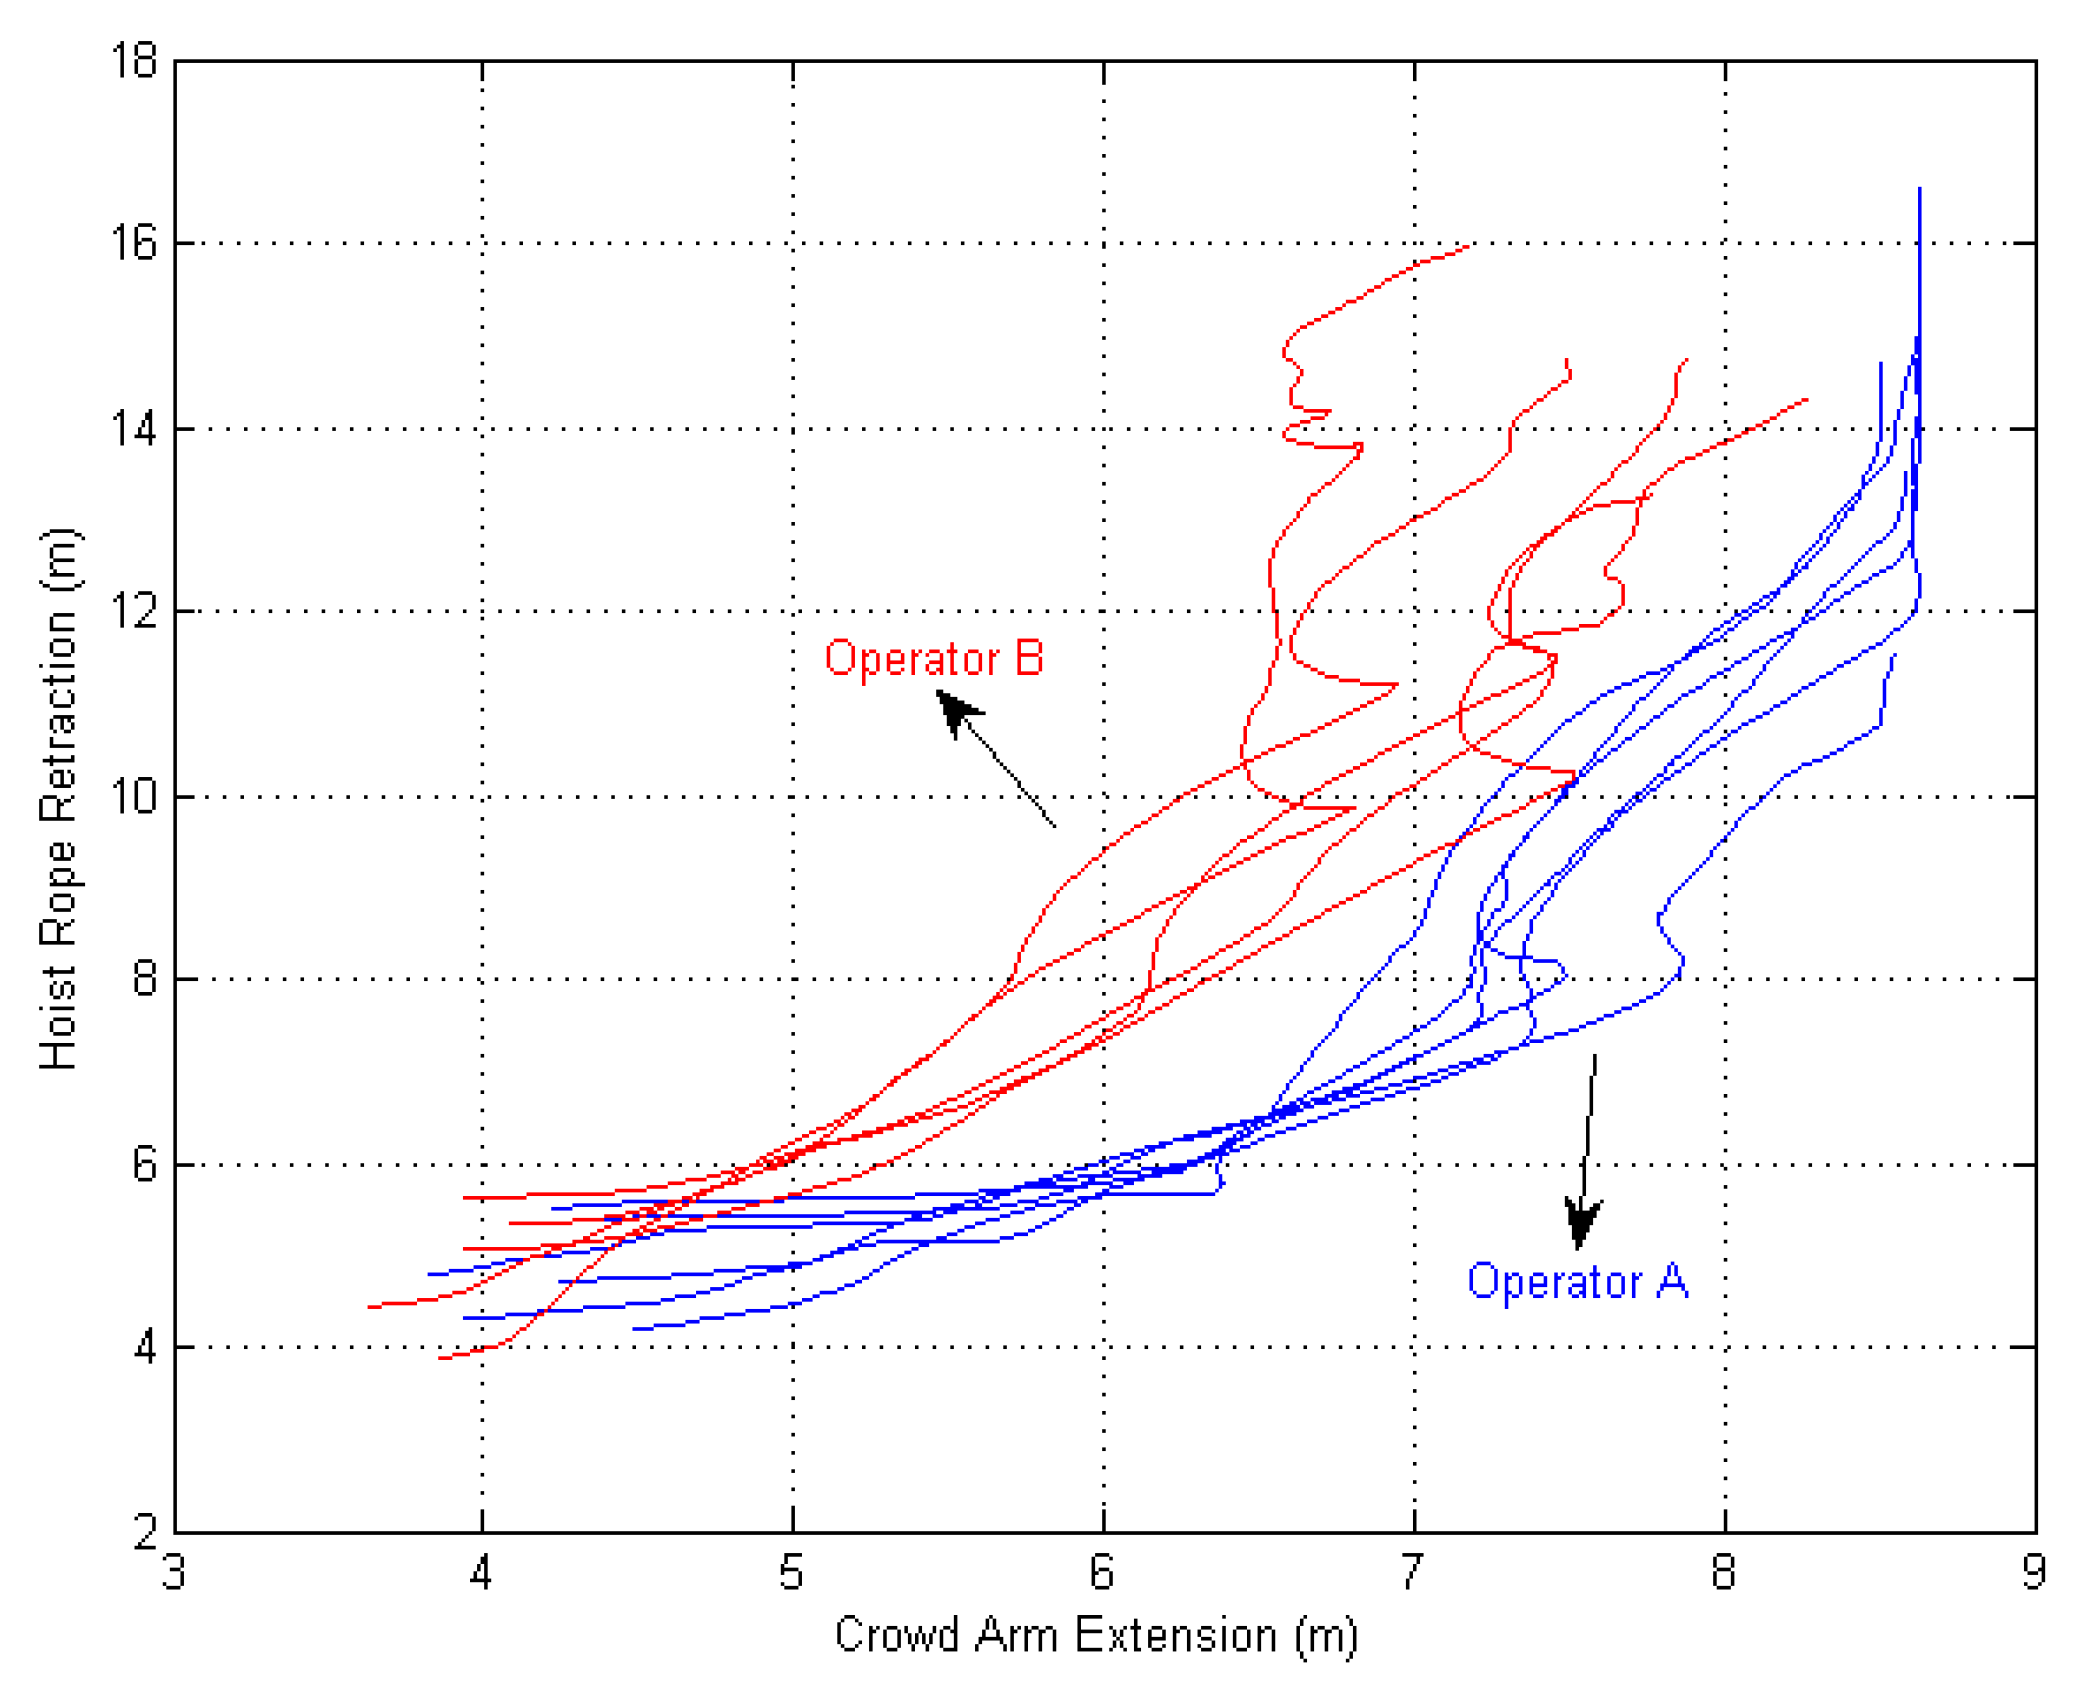
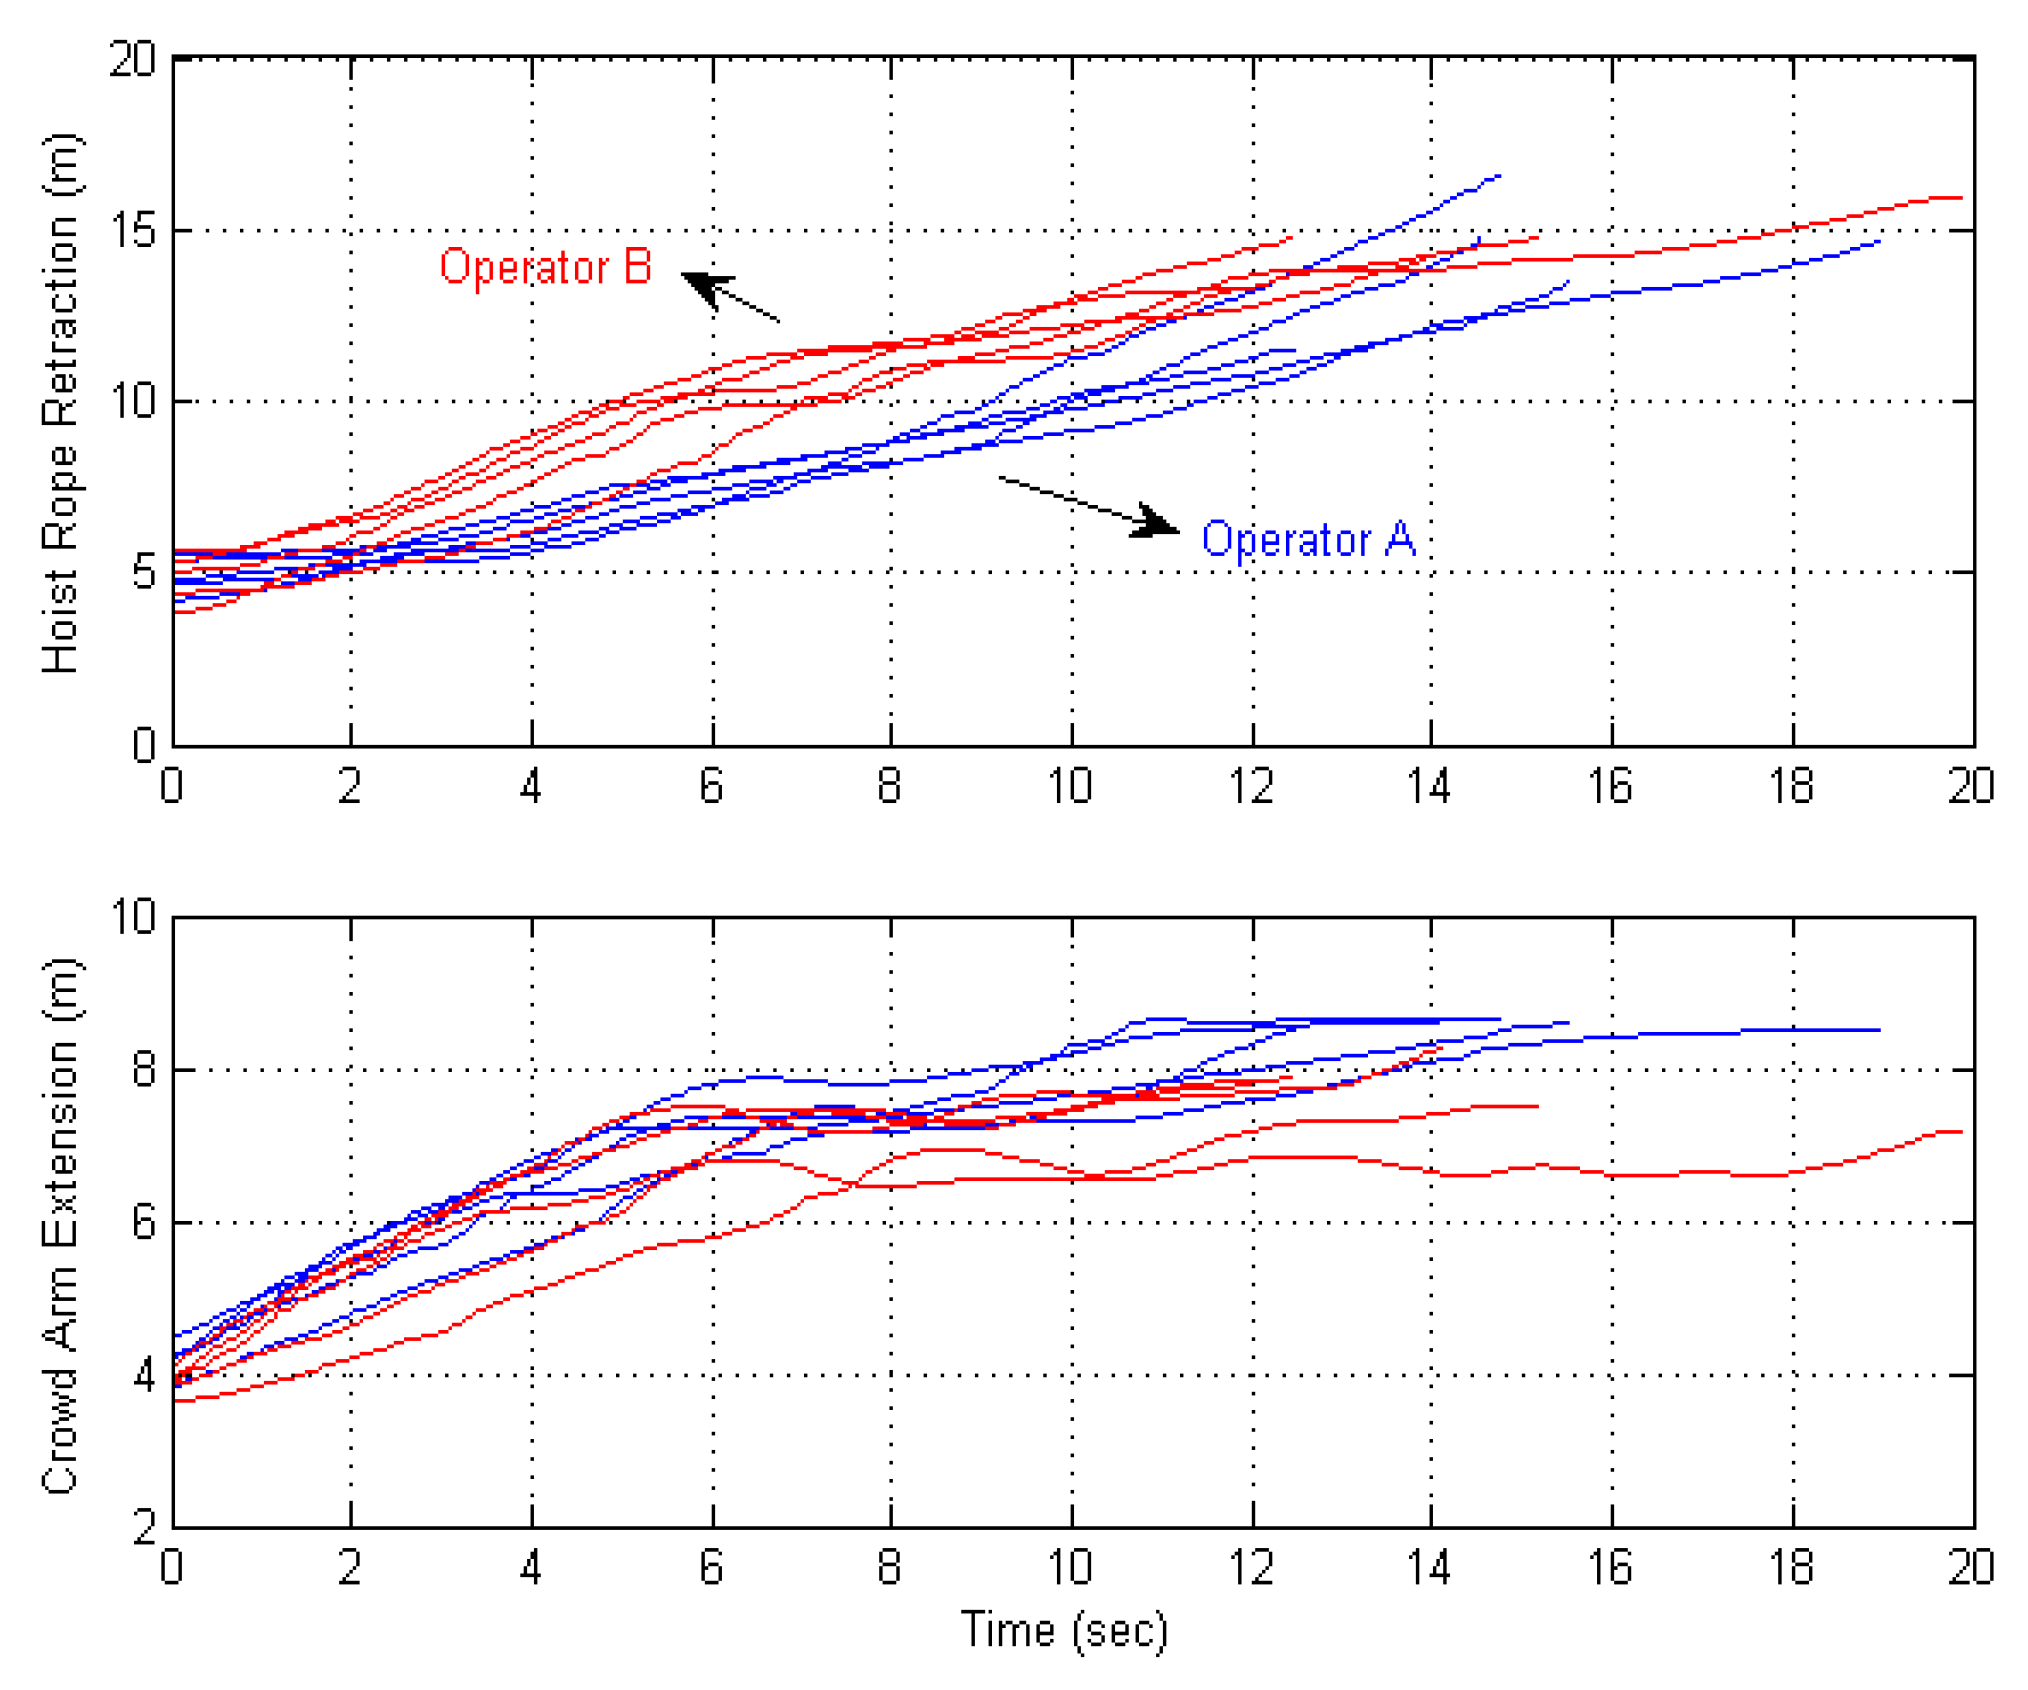
4.3. Operator Digging Practice
- Constant crowd speed until the desired dipper depth of penetration is achieved (the first part of the digging);
- Once the dipper penetrates into the bank, digging is mainly accomplished by hoist action, and the crowd speed is approximately zero.
5. Conclusions
Author Contributions
Conflicts of Interest
References
- Hustrulid, W.A. Blasting Principles for Open Pit Mining; A.A. Balkema: Rotterdam, The Netherlands, 1999; Volume 1. [Google Scholar]
- Scott, A.; McKee, D.J. The interdependence of mining and mineral beneficiation process on the performance of mining projects. In Proceeding of the Australian Institute of Mining and Metallurgy Annual Conference, Melbourne, Australia, 5–9 August 1994.
- Osanloo, M.; Hekmat, A. Prediction of shovel productivity in the Gol-E-Gohar iron mine. J. Min. Sci. 2005, 41, 177–184. [Google Scholar] [CrossRef]
- Singh, S.P.; Narendrula, R. Factors affecting the productivity of loaders in surface mines. Int. J. Min. Reclam. Environ. 2007, 20, 20–32. [Google Scholar] [CrossRef]
- Hendricks, C. Performance Monitoring of Electric Mining Shovels. Ph.D. Thesis, McGill University, Montreal, QC, Canada, 1990. [Google Scholar]
- Jessett, A. Tools for Performance Monitoring of Electric Rope Shovels. Master’s Thesis, University of Queensland, Brisbane, Australia, 2001. [Google Scholar]
- Onederra, I.; Brunton, I.; Battista, J.; Grace, J. Shot to shovel-understanding the impact of muck-pile conditions and operator proficiency on instantaneous shovel productivity. In Proceeding of the EXPLO 2004, Perth, WA, USA, 26–28 July 2004; pp. 205–213.
- Patnayak, S.; Tannant, D.D.; Parsons, I.; Del Valle, V.; Wong, J. Operator and dipper tooth influence on electric shovel performance during oil sands mining. Int. J. Min. Reclam. Environ. 2008, 22, 120–145. [Google Scholar] [CrossRef]
- Awuah-Offei, K.; Summers, D. Reducing Energy Consumption and Carbon Footprint through Improved Production Practices; Technical Report; Missouri University of Science and Technology: Rolla, MO, USA, 2010. [Google Scholar]
- Vukotic, I.M. Evaluation of Rope Shovel Operators in Surface Coal Mining Using a Multi-Attribute Decision-Making Model. Master’s Thesis, West Virginia University, Morgantown, WV, USA, 2013. [Google Scholar]
- Oskouei, M.A.; Awuah-Offei, K. Statistical methods for evaluating the effect of operators on energy efficiency of mining machines. Min. Technol. 2014, 123, 175–182. [Google Scholar] [CrossRef]
- Oskouei, M.A.; Awuah-Offei, K. A method for data-driven evaluation of operator impact on energy efficiency of digging machines. Energy Effic. 2015, 123, 175–182. [Google Scholar] [CrossRef]
- Widzyk-Capehard, E.; Lever, P. Towards rope shovel automation operation information system. In Proceeding of the CRC Mining Conference, Queensland, Australia, 15–16 June 2004.
- Bernold, L. Quantitative assessment of backhoe operator skill. J. Constr. Eng. Manag. 2007, 133, 889–899. [Google Scholar] [CrossRef]
- Komljenovic, D.; Bogunovic, D.; Kecojevic, V. Dragline operator performance indicator. Int. J. Min. Reclam. Environ. 2010, 24, 34–43. [Google Scholar] [CrossRef]
- Awuah-Offei, K.; Frimpong, S. Cable shovel digging optimization for energy efficiency. Mech. Mach. Theory 2007, 42, 995–1006. [Google Scholar] [CrossRef]
- Lloyd, S. Least squares quantization in PCM. IEEE Trans. Inform. Theory 1982, 28, 129–137. [Google Scholar] [CrossRef]
- Arthur, D.; Vassilvitskii, S. K-means: The advantages of careful seeding. In Proceedings of the Eighteenth Annual ACM-SIAM Symposium on Discrete Algorithms, Philadelphia, PA, USA, 7 January 2007; pp. 1027–1035.
- Awuah-Offeik, K.; Frimpong, S. Geometric simulation of material weight resistance in cable shovel loading. In Proceedings of the 15th IASTED Conference, Marina Del Rey, CA, USA, 1–3 March 2004; pp. 141–146.
- Kirsten, H.A.D. A classification system for excavation in natural materials. Civ. Eng. S. Afr. 1982, 24, 293–308. [Google Scholar]
- Scoble, M.J.; Muftuoglu, Y.V. Derivation of a diggability index for surface mine equipment selection. Min. Sci. Technol. 1984, 1, 305–322. [Google Scholar] [CrossRef]
- Hadjigeorgiou, J.; Poulin, R. Assessment of ease of excavation of surface mines. J. Terramechanics 1998, 35, 137–153. [Google Scholar] [CrossRef]


| Operator | Statistics | Payload (tons) | Dig Time (s) | Swing Time (s) | Swing Angle (°) | Return Time (s) | Return Angle (°) | Productive Cycle Time (s) | Waiting Time (s) | Equivalent Digging Energy (tons × rad) | Loading Rate (tons/s) | Mucking Rate (tons/s) |
|---|---|---|---|---|---|---|---|---|---|---|---|---|
| Operator A 589 Cycles | Mean | 98.3 | 16.4 | 8.2 | 68.8 | 8.6 | 62.3 | 33.3 | 18.9 | 266,265.5 | 6.2 | 3.0 |
| COV | 0.17 | 0.20 | 0.31 | 0.36 | 0.24 | 0.36 | 0.15 | 1.94 | 0.36 | 0.26 | 0.19 | |
| Min | 13 | 8 | 2 | 9 | 1 | 0 | 21 | 0 | 36,461 | 1 | 0 | |
| Max | 133 | 24 | 18 | 180 | 27 | 173 | 53 | 373 | 588,114 | 15 | 6 | |
| Operator B 1629 Cycles | Mean | 104.1 | 16.5 | 8.5 | 66.8 | 8.1 | 61.8 | 33.1 | 18.9 | 231,875.7 | 6.5 | 3.2 |
| COV | 0.14 | 0.18 | 0.33 | 0.32 | 0.33 | 0.43 | 0.16 | 2.18 | 0.32 | 0.20 | 0.16 | |
| Min | 11 | 8 | 2 | 1 | 0 | 0 | 18 | 0 | 6717 | 1 | 0 | |
| Max | 139 | 24 | 30 | 166 | 36 | 175 | 67 | 411 | 617,241 | 15 | 6 | |
| Operator C 1633 Cycles | Mean | 98.6 | 15.7 | 8.5 | 70.8 | 8.5 | 64.6 | 32.7 | 17.0 | 204,946.2 | 6.5 | 3.1 |
| COV | 0.16 | 0.20 | 0.32 | 0.32 | 0.30 | 0.38 | 0.15 | 2.03 | 0.34 | 0.22 | 0.19 | |
| Min | 17 | 8 | 1 | 2 | 1 | 0 | 16 | 0 | 19,629 | 1 | 0 | |
| Max | 137 | 24 | 23 | 172 | 46 | 161 | 70 | 540 | 491,753 | 15 | 6 | |
| Operator D 671 Cycles | Mean | 97.0 | 15.3 | 7.6 | 66.8 | 8.5 | 58.8 | 31.4 | 12.8 | 253,197.2 | 6.4 | 3.1 |
| COV | 0.21 | 0.21 | 0.31 | 0.37 | 0.31 | 0.37 | 0.16 | 2.46 | 0.37 | 0.22 | 0.19 | |
| Min | 11 | 8 | 2 | 4 | 1 | 0 | 19 | 0 | 22,938 | 1 | 1 | |
| Max | 139 | 24 | 23 | 165 | 32 | 131 | 59 | 476 | 557,642 | 17 | 5 | |
| All Data 4522 Cycles | Mean | 100.3 | 16.0 | 8.3 | 68.5 | 8.4 | 62.5 | 32.7 | 17.4 | 230,100.6 | 6.4 | 3.1 |
| COV | 0.16 | 0.20 | 0.32 | 0.34 | 0.31 | 0.40 | 0.16 | 2.14 | 0.36 | 0.22 | 0.18 | |
| Min | 11 | 8 | 1 | 1 | 0 | 0 | 16 | 0 | 6717 | 1 | 0 | |
| Max | 139 | 24 | 30 | 180 | 46 | 175 | 70 | 540 | 617,241 | 17 | 6 |
| Digging Energy Class | Energy Range () | Percentage of Cycles (All Data) | Percentage of Cycles (Operator A) | Percentage of Cycles (Operartor B) | Percentage of Cycles (Operator C) | Percentage of Cycles (Operator D) |
|---|---|---|---|---|---|---|
| Low Energy | <1.57 | 18 | 14.2 | 14.4 | 24 | 15.2 |
| Average Energy | 1.57–2.36 | 37 | 22.6 | 39.1 | 44 | 25.4 |
| High Energy | 2.36–3.23 | 33 | 34.2 | 36.2 | 27 | 37.5 |
| Extremely High Energy | >3.23 | 12 | 29 | 10.3 | 5 | 21.9 |
| Operator | Cycle # | 1 | 2 | 3 | 4 | 5 | Mean | Standard Deviation | Coefficient of Variation |
|---|---|---|---|---|---|---|---|---|---|
| Operator A | Crowd Speed (m/s) | 0.460 | 0.523 | 0.567 | 0.599 | 0.402 | 0.510 | 0.080 | 0.157 |
| R-squared | 0.994 | 0.986 | 0.986 | 0.989 | 0.959 | ||||
| Hoist Speed (m/s) | 0.692 | 0.816 | 0.518 | 0.528 | 0.571 | 0.625 | 0.127 | 0.204 | |
| R-squared | 0.954 | 0.966 | 0.992 | 0.983 | 0.995 | ||||
| Operator B | Crowd Speed (m/s) | 0.379 | 0.654 | 0.553 | 0.462 | 0.493 | 0.508 | 0.103 | 0.202 |
| R-squared | 0.988 | 0.996 | 0.986 | 0.992 | 0.947 | ||||
| Hoist Speed (m/s) | 0.782 | 0.617 | 0.766 | 0.591 | 0.792 | 0.709 | 0.097 | 0.137 | |
| R-squared | 0.983 | 0.961 | 0.978 | 0.942 | 0.970 | ||||
| Parameters | Class | |||
|---|---|---|---|---|
| Rating | ||||
| Loading Rate (tons/s) | <5.4 | 5.4–6.9 | 6.9–8.8 | >8.8 |
| 4 | 6 | 8 | 10 | |
| Digging Energy | Low | Average | High | Extremely High |
| 5 | 4 | 3 | 2 | |
| Hoist Speed (m/s) | <0.6 | 0.6–0.7 | 0.7–0.8 | >0.8 |
| 1 | 2 | 3 | 4 | |
| Crowd Speed (m/s) | <0.3 | 0.3–0.4 | 0.4–0.5 | >0.5 |
| 0.5 | 0.4 | 0.3 | 0.2 | |
| Patarameters | Loading Rate (tons/s) | Digging Energy | Hoist Speed (m/s) | Crowd Speed (m/s) | N |
|---|---|---|---|---|---|
| Average Value | |||||
| ai | |||||
| Operator A | 6.2 | 266,265.5 | 0.625 | 0.510 | 7.2 |
| 6 | 3 | 2 | 0.2 | ||
| Operator B | 6.5 | 231,875.7 | 0.709 | 0.508 | 14.4 |
| 6 | 4 | 3 | 0.2 | ||
© 2016 by the authors; licensee MDPI, Basel, Switzerland. This article is an open access article distributed under the terms and conditions of the Creative Commons Attribution (CC-BY) license (http://creativecommons.org/licenses/by/4.0/).
Share and Cite
Babaei Khorzoughi, M.; Hall, R. A Study of Digging Productivity of an Electric Rope Shovel for Different Operators. Minerals 2016, 6, 48. https://doi.org/10.3390/min6020048
Babaei Khorzoughi M, Hall R. A Study of Digging Productivity of an Electric Rope Shovel for Different Operators. Minerals. 2016; 6(2):48. https://doi.org/10.3390/min6020048
Chicago/Turabian StyleBabaei Khorzoughi, Mohammad, and Robert Hall. 2016. "A Study of Digging Productivity of an Electric Rope Shovel for Different Operators" Minerals 6, no. 2: 48. https://doi.org/10.3390/min6020048
APA StyleBabaei Khorzoughi, M., & Hall, R. (2016). A Study of Digging Productivity of an Electric Rope Shovel for Different Operators. Minerals, 6(2), 48. https://doi.org/10.3390/min6020048