Abstract
Recent incidents of hazardous accumulations of CO2 in homes on or adjacent to reclaimed mine land have been shown to be linked to neutralization reactions between acidic mine drainage and carbonate material. An efficient and economic method is necessary to identify the presence of acid mine drainage- (AMD-) derived CO2 on reclaimed mine land, prior to construction. One approach to identify the presence of AMD-derived CO2 is to characterize stable carbon isotope ratios of soil CO2. To do so, a viable method is necessary to acquire soil gas samples for isotope ratio analysis. This paper presents preliminary investigations of the effectiveness of two methods of acquiring gas samples (sampling during soil flux measurements and using slam bar) for isotope analysis. The results indicate that direct soil gas sampling is cheaper and provides better results. Neither method is adequate without accounting for temporal effects due to changing gas transport mechanisms. These results have significant implications for safe post-mining land uses and future investigations of leakages from geologic carbon sequestration sites.
1. Introduction
In the last decade, CO2 from neutralization reactions between acid mine drainage (AMD) and carbonate minerals has become an emerging geo-hazard. AMD is an acid leachate produced when sulfide minerals are exposed to water and oxygen, resulting in a low pH discharge with elevated dissolved metals and equally high sulphate content. Carbonates, either naturally occurring or added as a mining practice, mitigate the environmental impacts of AMD. Several instances of elevated concentrations of AMD-derived CO2, sometimes in excess of 20%, in structures built on or near reclaimed mine land have been reported in the literature [1,2,3,4]. High concentrations of CO2, usually accompanied by low concentrations of oxygen (O2), can lead to asphyxiation. CO2 concentrations above 3% can cause headaches, sweating, rapid breathing, increased heartbeat, shortness of breath, dizziness, mental depression, visual disturbances, or shaking in humans. Above 10%, CO2 can lead to unconsciousness and even death. Researchers have reported four fatalities in one instance [2], while five pets were reported killed in another [4].
High concentrations of CO2 in reclaimed mine soil with AMD and mineral carbonates is not a new phenomenon. For instance, Cravotta et al. [5] reported concentrations over 16% 11 m below the surface in reclaimed coal mine spoil. However, until the early 2000s no cases of hazardous concentrations of CO2 in homes due to AMD were reported in the literature. In such homes, episodes of sudden rise in CO2 concentrations in the home atmosphere occur with low pressure atmospheric systems, and, unmitigated, render the home uninhabitable and dangerous [3,4]. Forensic geochemistry, using stable carbon isotopes of CO2, has demonstrated that the large quantities of CO2 that migrate into these homes come from carbonate neutralization reactions in the subsurface and not from biogenic sources like plant root respiration and microbial activity [3].
Natural substances have specific 13C/12C ratios due to fractionation, which is a process of local enrichment or depletion of the heavier isotope (13C) depending on their geographical, chemical, or biological origin. This shift in the isotopic ratio of a substance of interest from that of a standard reference material, can be used to identify the origin of a substance. Laughrey and Baldassare [3] successfully used isotope ratios to identify the source of AMD-derived CO2 in several homes using the δ13C-CO2 (defined by Equation (1); where Rsample and Rstandard are the 13C/12C isotope ratios of the CO2 in the sample and the standard, respectively). In their work (as well as this work), the standard is the Vienna Pee Dee Belemnite reference standard. Due to depletion of 13C during photosynthesis, biogenic CO2 is depleted in 13C or enriched in 12C with δ13C (‰) in the range of −35% to −8‰. Carbonate rocks are relatively enriched in 13C due to isotope equilibrium exchange reactions in the inorganic carbon system (atmospheric CO2-dissolved bicarbonate-solid carbonate) with δ13C (‰) in the range of −7% to +4‰ [3,6,7].
It is important to note that the studies, prior to this work, concentrated on the gases intruding into structures (mainly homes) built on or adjacent to reclaimed mine land. Due to accumulation in the basements of these structures, indoor air sampling was relatively easy. In order to investigate this phenomenon, prior to residential or commercial real estate construction, there is a need for soil gas samples (or some sort of sampling indicative of subsurface CO2). Soil gas sampling for isotopic studies face two challenges: (i) differences in diffusion rates of the isotopologues, 13CO2 and 12CO2, through soil [8]; and (ii) soil transport mechanisms that drive CO2 flow to the surface [8]. It has been shown that CO2 from AMD-carbonate reactions accumulate at depth and only flow to the surface in episodes [4,5]. In addition, any sampling method needs to be fast and economic to cover the large tracts of land under study. Hence there is a need to evaluate different methods of acquiring soil gas samples for isotope ratio mass spectrometry, with a view to identify potentially hazardous CO2, delineate the extent of such hazards, and apportion mitigation liability.
The two sampling methods investigated in this work can be classified as whole air-active and air-passive methods (using language in ASTM D5314 [9]). In the whole air-active method, the researchers used a slam bar to drive a small diameter hole (~9.5 mm) into the soil, creating a low pressure zone, and draw a bulk sample of soil gas using a hand aspiration pump. In the whole air-passive method, samples of soil atmosphere migrating into an accumulation chamber (during accumulation chamber flux measurement) are drawn using a syringe. The air-passive method done in conjunction with accumulation chamber flux measurement is relevant because the authors were also evaluating the potential to use soil flux monitoring to delineate the hazard posed by AMD-derived CO2 [10].
The objective of this work was to evaluate the effectiveness of the described sampling methods for identifying the presence of hazardous AMD-derived CO2 on reclaimed mine land, prior to commercial or residential real-estate development. The research team conducted two sampling campaigns on two different reclaimed mine plots in the United States (US). The sampling methods were evaluated based on speed of sample acquisition, number of soil atmosphere samples required to obtain a single estimate of soil δ13C-CO2, and the ability to predict underlying AMD-derived CO2. On both sites, δ13C-CO2 from monitoring wells was used to determine the ability of the sampling method to predict underlying AMD-derived CO2. Both plots of land were known to have AMD-derived CO2 in the sub-soil [3,4].
Safe post-mining land use requires an ability to evaluate hazards. The emergence of AMD-derived CO2 as a geohazard requires effective and economic methods to evaluate such hazards. There is also a need to identify the source of any anomalously high CO2 concentrations to establish liability for mitigation efforts, if necessary. This work will provide valuable insight into the potential pitfalls and benefits of the evaluated sampling methods. The results will encourage further research to develop more robust sampling methods for identifying AMD-derived CO2 on reclaimed mine land.
2. Soil Gas Sampling Methods
Soil gas sampling methods are used in various applications including agriculture, volcanology, and environmental site characterization to monitor various trace gases and contaminants [11,12,13]. Generally, soil gas sampling methods used for monitoring the vadose zone can be classified into active and passive methods, based on how a gas sample is obtained, or whole-air and sorbent methods, depending on whether all or only a portion of the constituents of the soil atmosphere is collected [9]. Active methods are those methods that use a device in the subsurface to withdraw a soil gas sample while passive methods allow the atmosphere within the sampling device to come into equilibrium with the soil atmosphere. Whole-air methods withdraw a sample of the entire soil atmosphere for analysis, while sorbent methods sample only contaminants adsorbed onto a collection medium. The particular soil gas sampling method suitable for any application depends on several factors including the type of sampling system, the methodology for applying the system and the quality assurance/quality control (QA/QC) protocol [9]. Other considerations include cost, speed and ease of sample acquisition. ASTM D5314-92 [9] provides standard protocols for monitoring soil gases in the vadose zone.
In whole air-active sampling, a bulk sample of the soil atmosphere is forced into a collection device through a probe or similar device. The sample of soil gas is then sent to the laboratory for analysis or coupled with a field analysis apparatus for analysis. In some instances, the collection device (or probe) is driven into the soil with a drill or similar device. In other instances, the collection device is such that researchers have to use a slam bar to first drive a hole before sample collection [14]. A disadvantage of this method is that the process of driving the hole and its removal, prior to sample collection, can result in venting of soil gases [9]. Therefore, the subsequent sample may not be representative. Also, since the hole and the tubes used in sampling have to be purged before gas collection, the soil atmosphere is further purged and can contribute to non-representative samples. Nevertheless, soil sampling using a slam bar and a collection method (such as a sample bag with a pump) is common in the literature [15,16,17].
In most applications of this method, the goal is to identify and estimate the concentration of contaminant gases in the soil atmosphere [16,17]. However, the same sample can be used in isotope ratio mass spectrometry to determine isotopic signatures. So long as the gas sample is a representative one, no further adjustments are necessary for isotopic analysis.
In contrast to whole air-active sampling, researchers conducting whole air-passive sampling collect a bulk sample of soil atmosphere from a near-surface sampling horizon into a collection device via a flux chamber or other similar apparatus. During accumulation chamber flux measurement, a collar is installed to constrain a section of soil and an accumulation chamber is installed over the soil. Soil gas gradually migrates into the headspace in the chamber. The flux is estimated from measurements of the concentrations of a particular gas constituent over time. A gas sample drawn from the chamber headspace is a whole air-active sample. To assess the isotopic composition of a particular gas constituent, the sample drawn from the chamber, during flux measurement, can be used for isotope ratio mass spectrometry (IRMS).
The isotopic composition of soil gas, determined using a gas sample acquired during chamber accumulation flux measurement, can be affected by gas mixing (between atmospheric and soil gases in the chamber) and diffusion [18].
Gas mixing is an issue because the sample is not a sample of the soil pore gas but rather a mixture of the soil and atmospheric gases. Keeling [19,20] proposed a linear mixing model (Equation (2)), which can be used to predict the δ13C of CO2 in the presence of multiple sources. δ13CM, δ13CB, and δ13CS are the delta-13 of the CO2 mixture, background CO2, and the source CO2, respectively; and and are the background and mixture CO2 concentrations, respectively. Using Equation (2), one can obtain the δ13C of the source gas graphically as the intercept on the vertical axis by plotting δ13C of the mixture CO2 against the inverse of the mixture CO2 concentration. This is the so called Keeling plot.
However, the Keeling plot is most useful when the δ13C measurements are independent (e.g., measurements from different sample locations). When all the samples are from the chamber headspace during the same closure, the δ13C measurements are not independent. In such a case, it is possible to estimate the source isotopes directly from the isotope ratios and concentrations of two samples [18]. In this work, we used Equation (3) to estimate the δ13C of the source CO2, , from the concentration, , and δ13C-CO2, , of two samples ().
Estimating isotopologue composition of CO2 from a sample that is drawn after diffusing through soil can be problematic because of the aforementioned difference in diffusion rates of 13CO2 and 12CO2 through soil. Fortunately, it has been shown theoretically and experimentally that, in many instances, the different diffusion rates result in a 4.4‰ difference in the δ13C [7]. This knowledge can be used to adjust estimates of isotopic ratios determined from samples which diffuse, preferentially, through soil (i.e., not in equilibrium).
3. Materials and Methods
3.1. Study Sites
3.1.1. The Hudson Site
This site is located in Pike County in south-western Indiana (38°19′42′′ E and 87°08′27′′ N). It is a reclaimed surface coal mine that has a single story residential building with a walk-in basement constructed on it. The home has been the subject of scientific and regulatory investigations of stray CO2 gases since 2006 due to intermittent episodes of elevated concentrations of stray CO2. Five pets have died in the home and one teenager has been sent to the emergency room as a result of episodes of high CO2 concentrations in the basement and garage of the home [4].
Mining was carried out between 1986 and 1992 and the site was reclaimed with lime amendment and about 0.91 m of top soil capping. The spoil material extends about 11.6 meters below the surface. The area receives an average total rainfall of 1184.1 and 304.8 mm of snowfall, annually. The average daily temperature is 12.7 °C with minimum and maximum temperatures of −6.1 and 31.1 °C for the winter (January) and summer (July) months, respectively [21].
The predominant plant cover is C3 type (native grasses). We did not evaluate the isotopic signature of organic matter because we assumed this will not have a significant bearing on the results. However, such analysis may be warranted in cases where there is significant C4 plant cover.
The area under investigation (Figure 1) covers about 16 hectares with soils described as Fairpoint loam. The site was reclaimed at 1° to 15° slopes [22].
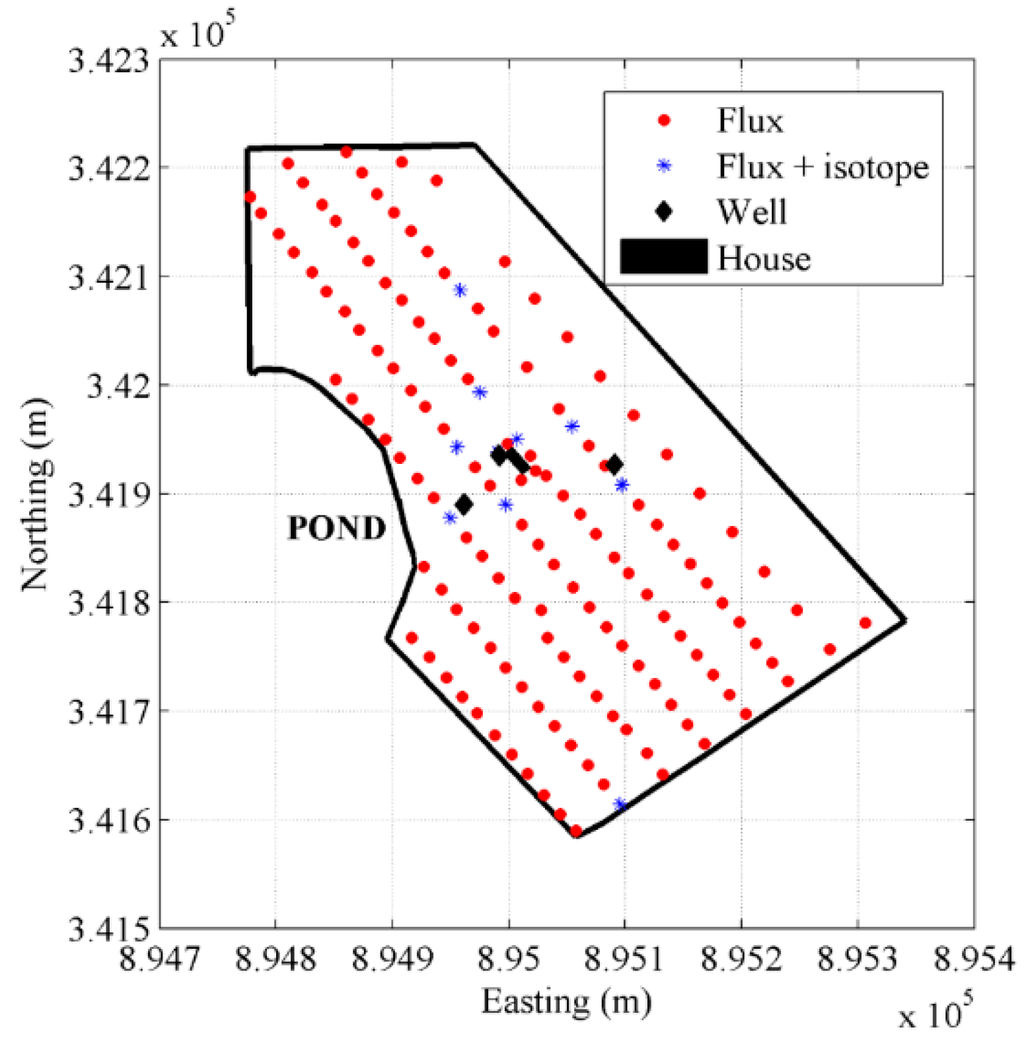
Figure 1.
Hudson site showing flux and isotope sampling locations. All coordinates are in Indiana State plane coordinates.
3.1.2. The Godin Site
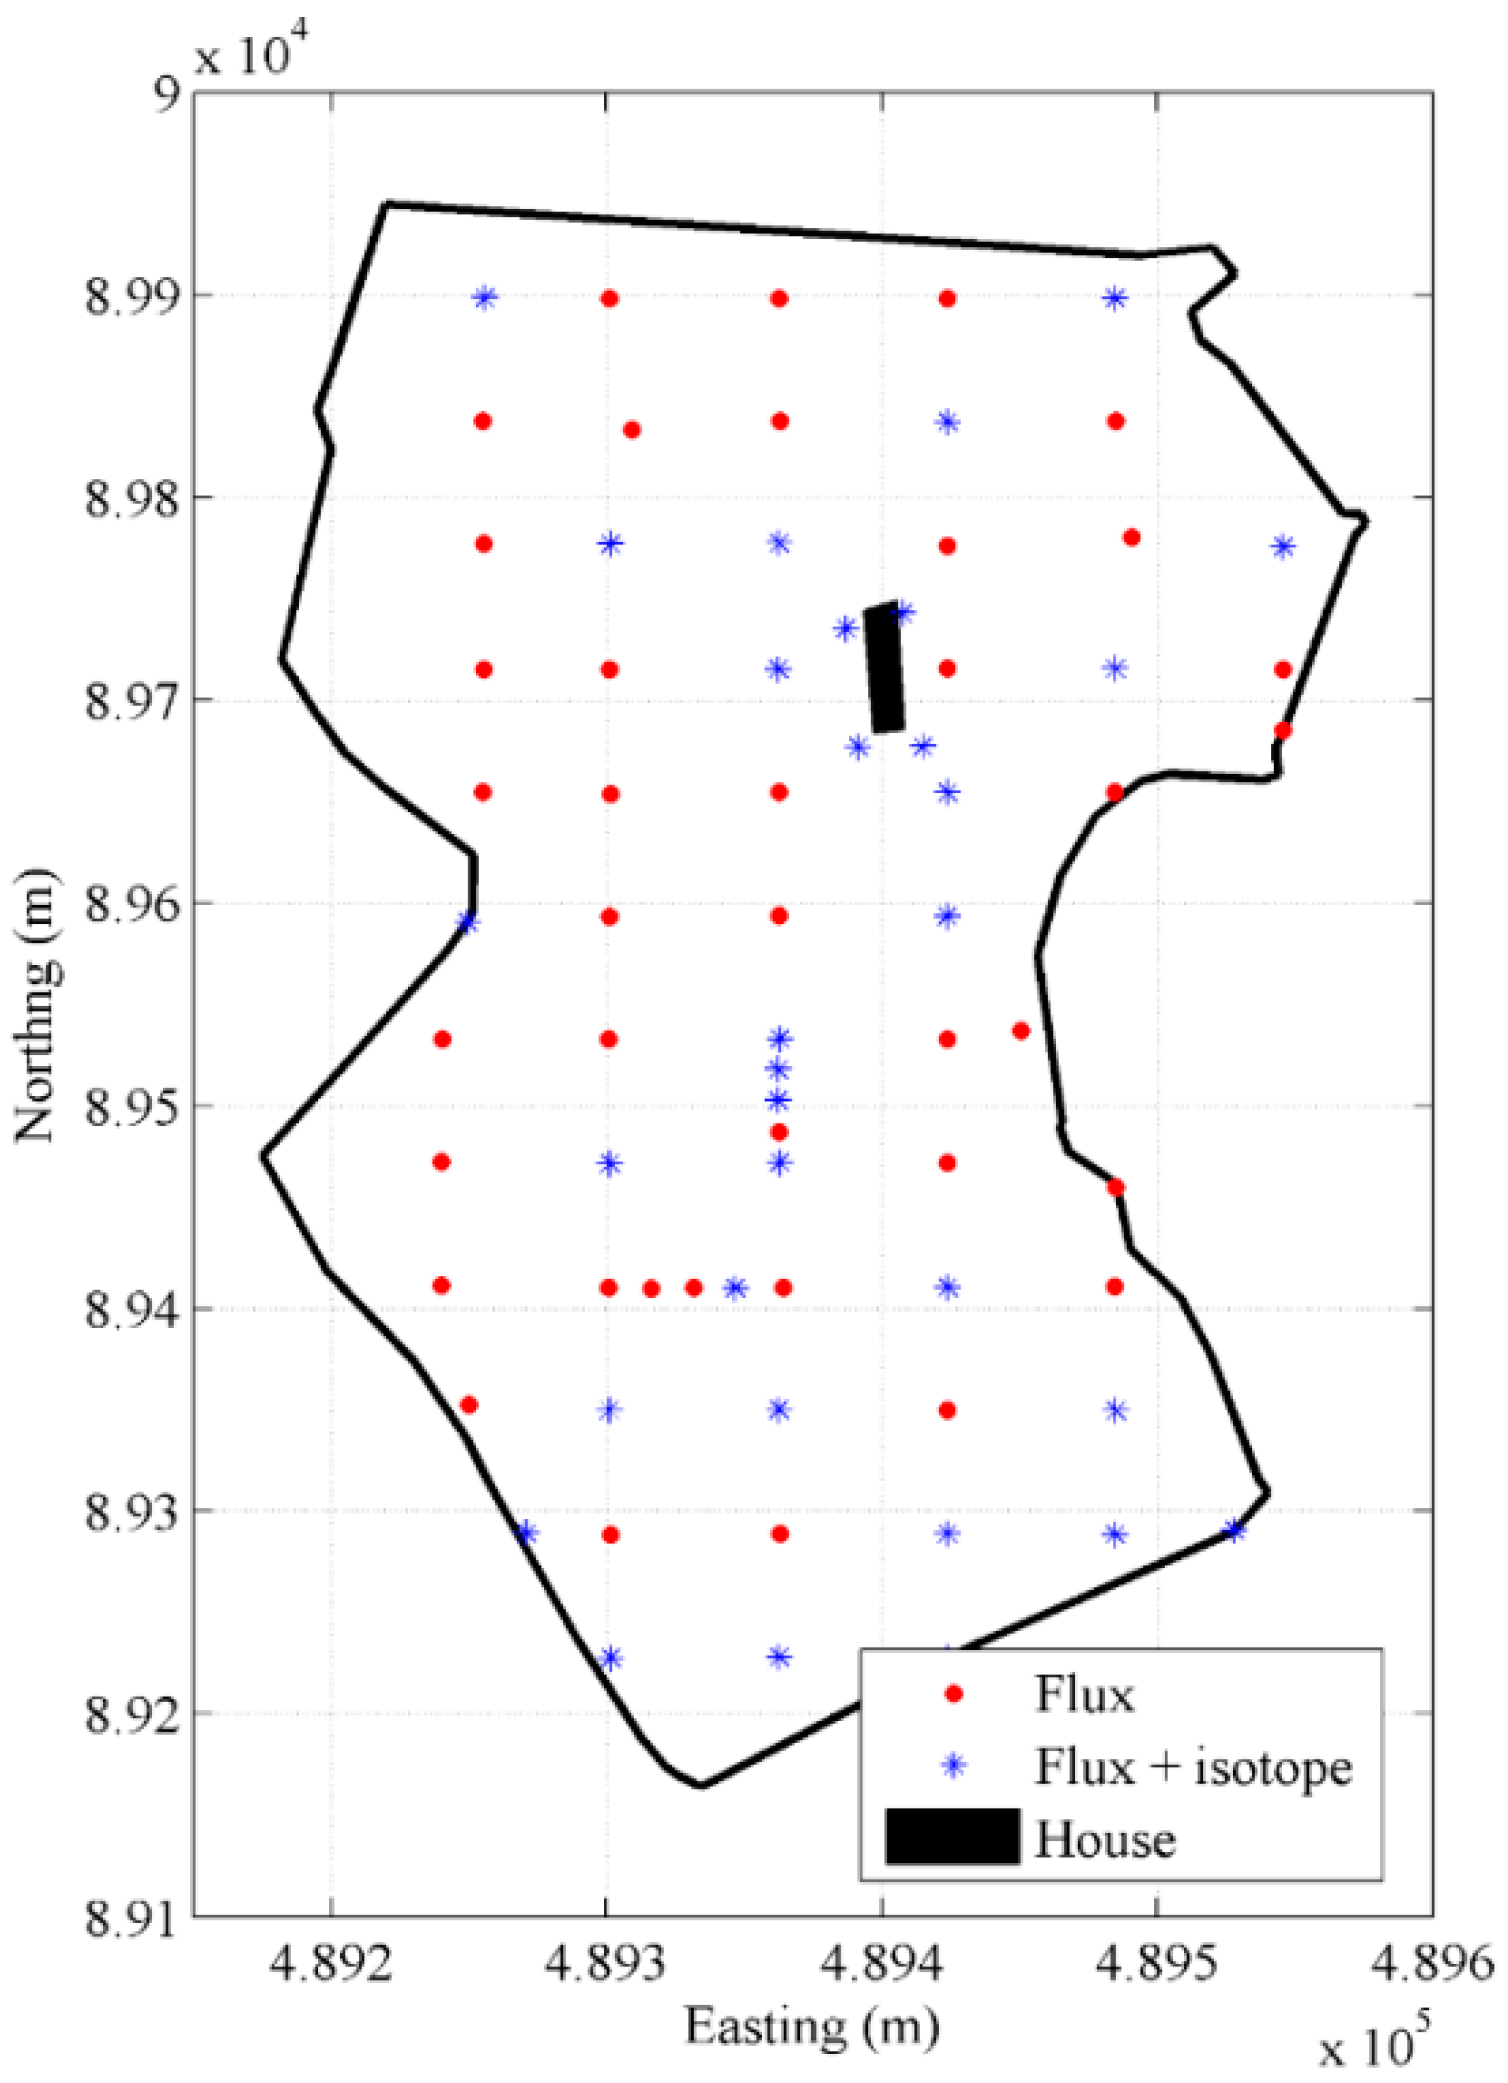
Figure 2 shows the location of the Godin site. This site also has a single family residential building, which has had episodes of elevated CO2 concentrations due to AMD-derived CO2 in the subsoil. The home was built on the spoil of the reclaimed Godin Mine, which is about 21.34 m thick. The site is situated near Jenners, a town in Somerset County, southwestern Pennsylvania (40°08′2′′ E and 79°02′52′′ N). Stray CO2 in the Godin residence was investigated by the Pennsylvania Department of Environmental Protection (PA-DEP) in 2003 [3]. The mine’s permit required an operational plan that included disposing of the material from the surface mine pit floor in pods at least 3.05 m above the pit floor. Lime was added to the pit floor at a rate of 45 tonnes/hectare prior to backfilling and grading. The total annual precipitation averages 1053 and 881 mm of rainfall and snowfall, respectively. The average daily temperature is 6.7 °C and ranges from an average minimum temperature of −4.9 °C to a maximum of 18.9 °C for the winter (January) and summer (July) months, respectively [21].
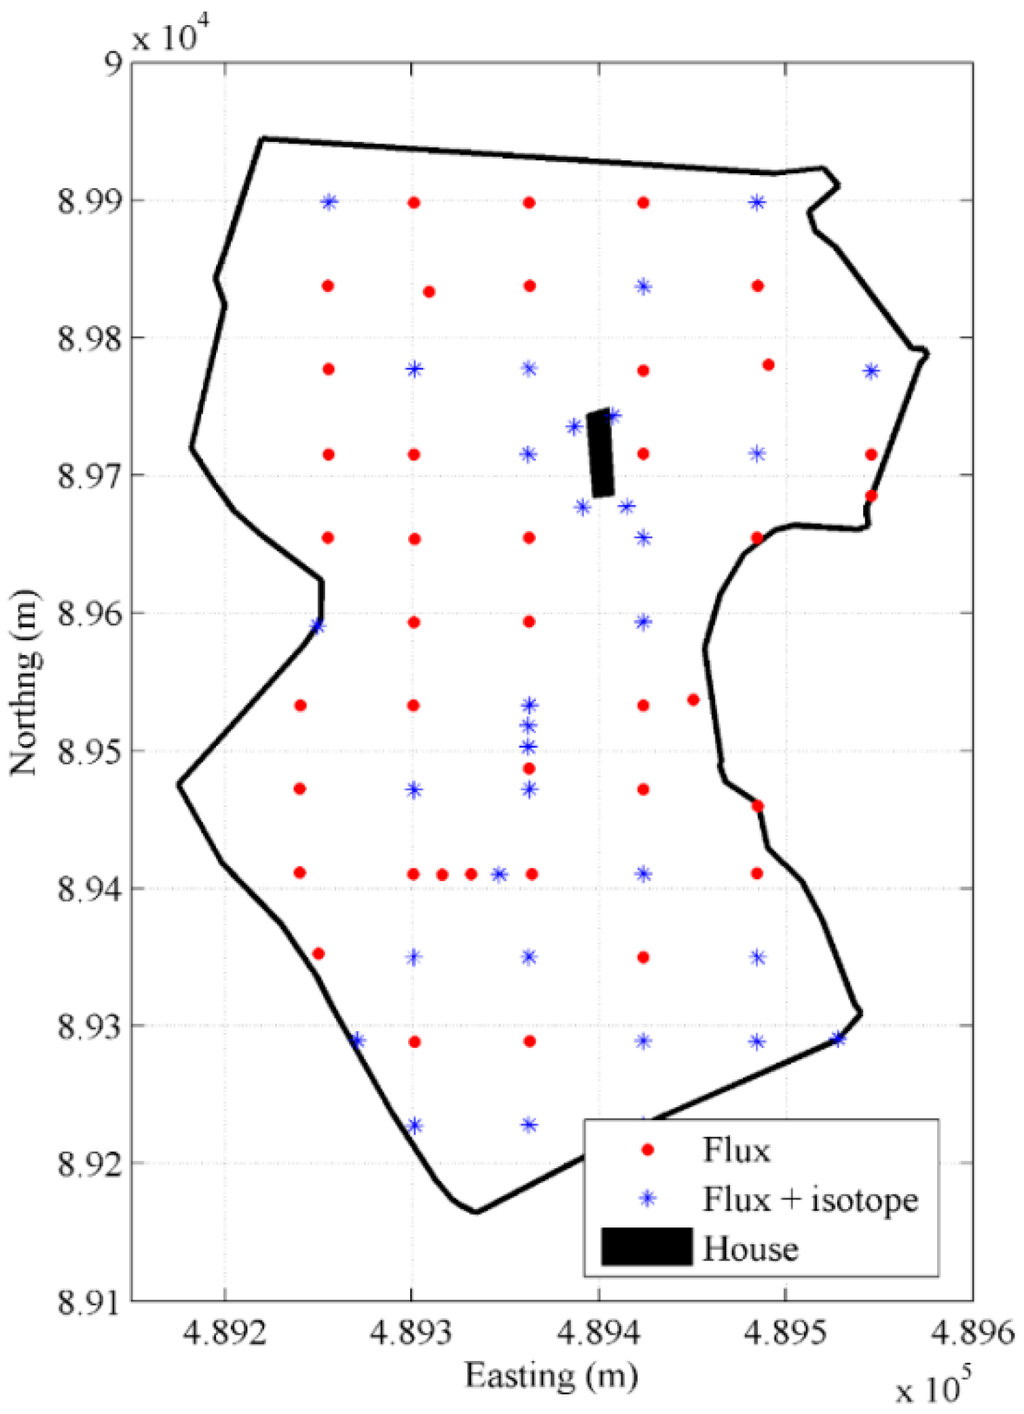
Figure 2.
Godin site showing flux and isotope sampling locations. All coordinates are in Pennsylvania State plane coordinates.
Similar to the Hudson Site, the vegetation covering this site is also predominantly grasses (C3 plants). We did not evaluate the isotopic signature of organic matter for the same reasons discussed above.
3.2. Sampling Methods
This section describes the two sampling methods used in this research to acquire soil gas samples for laboratory and subsequent analysis. All gas samples were subjected to the same gas chromatography (GC) and IRMS techniques to estimate the δ13C of the CO2 in the sample. The researchers used Isotech Laboratories, Inc. (Champaign, IL, USA, www.isotechlabs.com), a reputable commercial laboratory with experience doing forensic geochemistry for the oil and gas and mining industries, for all the laboratory analysis. The two methods used to acquire soil gas samples are: (1) an accumulation chamber technique, which is a whole air-passive method; and (2) a slam bar and hand aspiration technique, which is a whole air-active method. These methods are described in the subsections below.
Admittedly, it would have been better (from a scientific experimental design standpoint) to have used both methods on both sites to ensure comparable results. However, the practical limitations of the research project (The initial research design included only the accumulation chamber technique which the team used at the Hudson site. Upon reviewing the results, the team decided to use the slam bar method at the Godin site as an alternative. At this stage, the residents at the Hudson site had dropped out of the study and we did not have the funding to conduct further isotope tests.) did not allow this. Instead, the research team used the accumulation chamber at the Hudson site and the slam bar and hand aspiration technique at the Godin site. This is a limitation of the current research that will need to be addressed with future research. However, the authors believe the work presented here makes enough of a contribution to the literature on its own.
3.2.1. Accumulation Chamber Technique
This technique involved collecting gas samples from the headspace of an accumulation chamber for isotope analysis during flux sampling. In this work, researchers used a portable automated accumulation chamber monitor (model: LI-8100) manufactured by Licor Biosciences Inc. (Lincoln, NE, USA). The chamber diameter is 20 cm with a headspace volume of 4.8 L. The LI-8100 monitor has an infra-red gas analyzer (IRGA), which is used to measure the CO2 concentration during flux measurement. The monitor has tubes that draw air from the chamber headspace to the IRGA. In this application, a T-fitting with a septum is installed in the tubes to facilitate sample acquisition. Researchers used a syringe to draw a sample from the air stream through the septum.
It is necessary to acquire multiple samples to account for the gas mixing issues discussed earlier. In this work, the authors decided to draw three samples to minimize cost but allow for multiple estimates (each estimate requires two samples). The chamber was deployed for 20 min (as opposed to the usual 2 min for flux measurement) to allow for all three samples to be collected during flux measurement. The first sample was taken after the chamber CO2 concentration reached at least 500 ppm (according to the LI-8100 monitor), to ensure there is enough CO2 for isotopic analysis. Depending on the flux at the particular sampling point, this took approximately 10 min. Following this first sample, two subsequent samples were drawn in the remaining time. Each sample was 60 mL (Note that the sample volume need not be 60 mL. Samples of 10 mL or more could suffice and smaller sample volumes are desirable. We used 60 mL samples to ensure duplicate testing was possible without more field visits. We assume that drawing three 60 mL samples over 20 min did not significantly disturb the chamber headspace. We confirmed this by monitoring the CO2 concentrations during sampling.) and was transferred into the sample bag via a one-way valve with a septum.
Twenty-seven samples were collected from nine sample locations around the property on 2 April, 2010 (Figure 1). All the samples were shipped to Isotech for GC/IRMS analysis. The results of the isotopic analysis were used to estimate the carbon isotopic ratios of the soil CO2, accounting for both preferential diffusion and gas mixing. The results are reported in the Results and Discussions Section.
3.2.2. Slam Bar and Hand Aspiration Technique
The second technique involved drilling a hole, about 9.5 mm in diameter, into the soil to a depth of 0.61 m (2–3 ft) with a slam bar. The researcher then inserts a clear, polyethylene tubing of the hand aspiration pump into the soil to about 5 cm short of the bottom of the hole. The top of the hole is sealed with a cap and soil. After purging the system (tubing and pump), a soil gas sample was hand aspirated into a pre-evacuated specialty gas sample bag. A single sample was collected from each of the 32 sample locations at the Godin site on 15 July 2010 (Figure 2).
The samples were then shipped to Isotech (Isotech Laboratories, Inc.) for GC/IRMS analysis. The results are reported in the Results and Discussions Section.
4. Results and Discussions
4.1. Accumulation Chamber Results
Table 1 shows the results of the laboratory analysis of the 27 samples. The table shows the concentration of CO2 in the samples and the δ13C of the CO2. From the results, we observe that as the concentration of CO2 increases (more soil gas migrates into the chamber headspace), δ13C-CO2 becomes more negative. This indicates the ratio of 13C to 12C in the soil CO2 is lower than that in the atmospheric CO2. Using Equation (3), we estimated the carbon isotope ratio of the soil CO2 for each sample location. The results are shown in Table 2. We estimated the δ13C three times using all combinations of the three samples. We consider the estimate using the first and third sample (column 4 of Table 2) the most reliable since it represents the largest difference in CO2 concentration. Based on these estimates, the average δ13C-CO2 of the nine sample locations was found to be −24.5‰.

Table 1.
Isotope ratio results for Hudson site.
Table 2.
Isotope ratio results using Keeling plot and adjusted for preferential diffusion.
4.2. Slam Bar Results
Table 3 shows the results of laboratory analysis of the soil gas samples acquired using the slam bar and hand aspiration pump. The table shows the CO2 concentrations and δ13C-CO2 of the soil gas samples. The CO2 concentrations are much higher than day time concentrations in the atmosphere, which averages around 400 ppm [23]. The CO2 concentrations range from 590 to 29,900 ppm with a mean of nearly 6000 ppm. The high CO2 concentrations indicate that the samples are not samples of atmospheric gases circulated through the soil.
Table 3.
Isotope results for Godin site.
The δ13C-CO2 range from −24.5‰ to −11‰ with a mean of −20.1‰. We did not correct our δ13C-CO2 results for any mixture or diffusion effects. However, it is important for the reader to note that there may be some mixing between CO2 from the near surface soil horizon and the deeper AMD-related CO2 during sampling. These two sources do not have the same ratios of CO2 isotopologues due to differential diffusion of the two isotopologues from the AMD-related CO2 reservoir to the surface. It is likely, however, that the difference between the ratio of the two CO2 isotopologues in the AMD-related CO2 and the sampled CO2 is lower than 4.4‰ since the tubing is flushed prior to sampling. These factors make it difficult to adjust for the effect of preferential diffusion without further research. Consequently, we chose not to adjust our isotope ratio results.
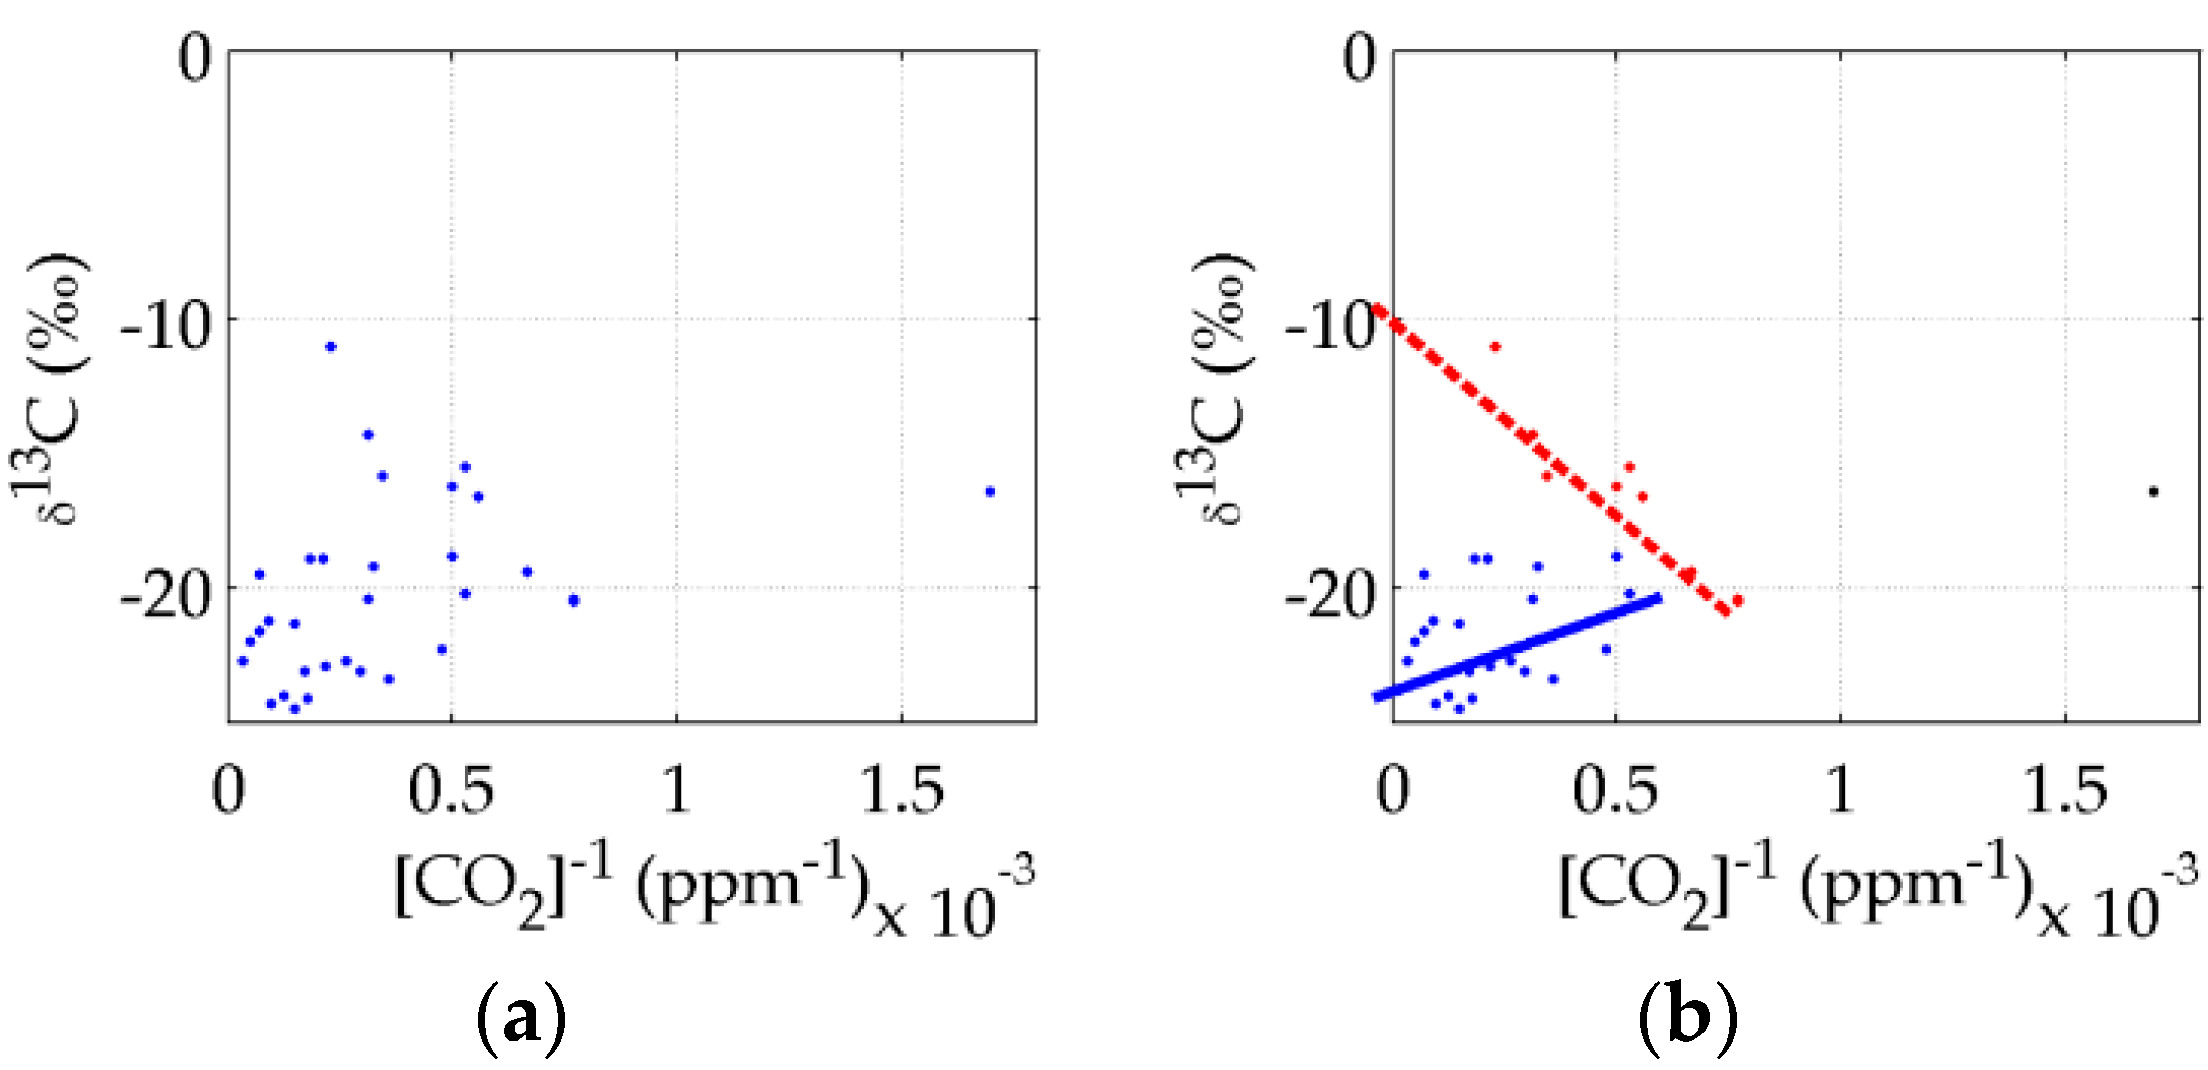
Given that the slam bar samples are independent, we proceeded to plot Keeling plots of the field (Figure 3). We used the plot to evaluate, in a preliminary fashion, whether any conclusions can be made with regards to the sources of CO2 at the study site.
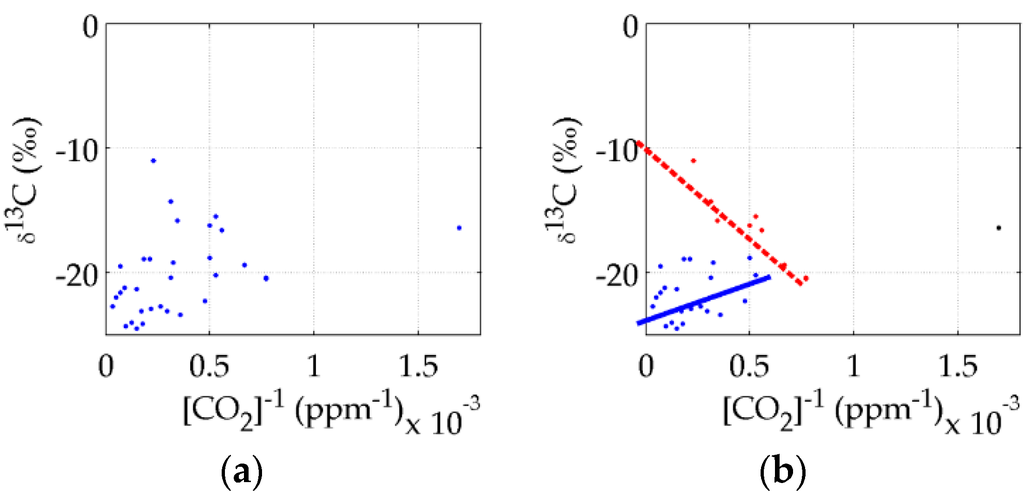
Figure 3.
Keeling plot of isotope results from Godin Site. (a) Raw; (b) With interpretation.
4.3. Discussions
To evaluate the usefulness of the two methods for field investigations, the authors focused on three criteria: speed of sample acquisition, number of gas samples required for analysis, and ability to indicate the presence of AMD-derived CO2.
The speed of acquiring samples and the number of samples are directly proportional to the cost of the survey. This is because personnel costs increase with time spent acquiring samples and laboratory costs (time, man-power, and consumables) increase with the number of samples.
The experience on this project indicates that the time required to acquire a sample is significantly less for the slam bar method compared to the accumulation chamber method. The actual sample acquisition (taking samples by syringe or hand aspiration pump) is similar; although, the hand aspiration method is slightly faster (no transfer is required as the sample is pumped directly into the sample bag). The major difference between the two methods is the long time required for the soil gas to migrate into the chamber (20 min in this study). Based on the authors’ experience, this is possibly the least time required to acquire three samples (although, we note that the estimates can be obtained with only two samples). It took about 10 min for the CO2 concentration to reach 500 ppm, at which point the first sample can be drawn. The remaining 10 min is just about enough to draw the remaining two samples. In instances where low fluxes resulted in more than 10 min to reach 500 ppm, the research team found itself struggling to acquire all three samples in time. On the contrary, the slam bar method did not require any such waiting period. Researchers were able to draw the sample soon after driving the hole into the soil. The time it takes to drive the hole is not significantly longer than the time it takes to drive the collar and set up equipment for accumulation chamber measurement.
The slam bar method requires only one sample per sampling location. To account for the gas mixing, the accumulation chamber method requires at least two from the same sampling location. In this work, the authors used three samples. The advantage of using only two samples, spaced as far apart as possible to ensure maximum change in CO2 concentration, is that there is limited disturbance of the chamber headspace atmosphere. However, three samples ensure that researchers have a higher chance of obtaining an estimate if laboratory results for one sample yield an unreliable result. For example, the second sample at D16 appears to be an anomaly. Without the third sample, we would not have been able to obtain a reliable estimate of the delta-13. Regardless of how many samples are taken per chamber closure (two or three), the accumulation chamber method will still require more samples than the slam bar method.
Thus, with the same number of soil gas samples, the slam bar method would provide more δ13C-CO2 estimates. For instance, in this work, the two surveys obtained similar numbers of samples (27 and 32 samples for the accumulation chamber and slam bar methods, respectively). Yet, the slam bar method resulted in three times more δ13C-CO2 estimates (9 and 32, respectively). The higher number of samples allow for statistically more significant estimates of the population mean and nature of the distribution. However, the accumulation chamber approach is useful in situations where isotopic characterization is used in conjunction with flux measurement to delineate the hazard [10].
The ability to accurately indicate the presence of AMD-derived CO2 is, perhaps, the most important criteria. Table 4 shows data from the authors’ other work on the δ13C-CO2 estimates of the underlying CO2. As the table shows, the δ13C values of the underlying CO2 are relatively closer to zero (the standard) than the values observed using both methods (Table 2 and Table 3). The mean δ13C-CO2 estimate for the Godin site using the slam bar method is −20.1‰ (with standard deviation of 3.29‰). This compares to δ13C-CO2 estimate of −4.2‰ for soil gases in the reclaimed mine subsoil (Table 4). The mean for the Hudson site using the accumulation chamber method is −24.47‰ (with standard deviation of 2.5‰) compared to −11.4‰ to −5.0‰ for soil gases in the reclaimed mine subsoil (Table 4).
Table 4.
Isotope ratios of the underlying CO2.
Figure 3 provides further insight on the sources of the CO2 at the Godin site. At first glance (Figure 3a), there appears to be no discernible trend to the δ13C-CO2 values. Upon careful examination, however, there appears to be multiple sources underlying the data. The two clusters that appear to be the most prominent are identified in Figure 3b. These two clusters seem to point to sources with δ13C-CO2 of −9‰ and −23‰. Although, none of these sources have the same signature as the limestone source, it is conceivable that the −9‰ source may have some contribution from a limestone-based source. This is, however, not conclusive evidence of the presence AMD-derived CO2 at this study site. It only points to the presence of multiple sources, one of which is likely to be organic matter (−23‰).
We observe then that both methods fail to predict the presence of AMD-derived CO2 in the subsoil. The authors hypothesize that this is due to the episodic nature of the events resulting from varying transport mechanisms. It is important to note here that the CO2 in the homes during episodes show δ13C-CO2 values that are similar to those observed in the monitoring wells [3]. Thus, when AMD-derived CO2 is transported from the subsoil into homes during episodes (of low barometric pressure events) in significant quantities, the isotope ratios are similar. The authors hypothesize that under normal conditions when the CO2 transport through the soil is controlled by concentration gradients, the amount of AMD-derived CO2 transported through the soil is not high enough to significantly alter the carbon isotope composition of native biogenic CO2. However, during episodes, when the CO2 transport is controlled by pressure gradients, the transport of significant amounts of AMD-derived CO2 should alter the carbon isotope composition of CO2 measured with either method [3,4,8,10]. This hypothesis can be tested by acquiring soil gas samples during episodes, which is beyond the scope of this work but will be pursued as future research.
However, given the advantages of the slam bar method over the accumulation chamber method (higher speed of sample acquisition and lower number of samples required), it appears the slam bar method shows more promise than the accumulation chamber method. Both methods, without accounting for gas transport mechanisms, will however yield false negatives. It is, therefore, important not to rule out this hazard without careful long term monitoring that accounts for pressure pumping effects.
These results and observations have a significant effect on regulatory and legal liability investigations for post-mining land-use of reclaimed mine land (in particular, coal mine land). The results show that using these methods in field investigations to declare a piece of land free of this hazard can be problematic. While positive detection of high fluxes and carbon isotope signatures can be conclusive, the lack of such evidence may not indicate the absence of risks. It is important to consider results such as this in assigning legal liability or declaring a plot of land safe for residential or commercial real-estate use. These observations are also relevant for carbon sequestration sites, as some of these same transport mechanisms may affect CO2 leakages trapped in subsoil.
5. Conclusions and Recommendations
This work investigated the effectiveness of two methods of soil gas sampling (sampling during soil flux measurements and sampling using a slam bar and hand aspiration pump) in acquiring representative samples for stable carbon isotope analysis. The goal of such analysis is to determine, using isotope ratio mass spectrometry, the carbon isotope signature of the soil CO2 for source identification. The methods were evaluated based on the speed of sample acquisition, number of samples required for the analysis, and ability to accurately identify the presence of acid mine drainage- (AMD-) derived CO2.
The results indicate that the slam bar method is faster and requires fewer samples per sample location. The accumulation chamber method requires at least two times more samples to cover the same number of sampling locations. This means the slam bar method will be cheaper per sampling location. However, the accumulation chamber method will be useful in situations where accumulation chamber flux measurement is part of the sampling protocol already. Neither method adequately predicts the presence of AMD-derived CO2 in the subsoil. This is most likely due to the absence of significant transport of AMD-derived CO2 from the subsoil upwards. The authors hypothesize that this will change if the samples were acquired during episodes of barometric pressure pumping where significant amounts of AMD-derived CO2 is transported through the soil to the atmosphere. Even so, the slam bar method appears to predict carbon isotope ratios closer to the isotope ratios of the AMD-derived CO2 than the accumulation chamber method.
These results have significant implications for declaring commercial and residential real-estate as safe post-mining land uses of reclaimed mine land with potential for AMD and future investigations of leakages from geologic carbon sequestration sites. The observations from this work imply false negatives are likely and stakeholders have to take this into consideration when acquiring soil gas samples using either method.
Further work is required to test the hypothesis that these sampling methods will perform better if CO2 migration episodes due to low barometric pressure are accounted for in the monitoring. This requires long term monitoring of CO2 fluxes, barometric pressure and other weather-related variables, and isotopic signatures. In addition, future work should examine the effect, if any, of fractionation bias due to differences in CO2 isotopologue diffusion, especially when using the slam bar method. The effect of any such fractionation should be examined under normal conditions and during CO2 migration episodes since the effect might differ under the two conditions.
Acknowledgments
The authors would like to acknowledge: Office of Surface Mining, Reclamation and Enforcement’s Applied Science program’s project #S09AC15437 and the Government of Botswana for financial support; Bret A. Robinson for his assistance in accessing the study site; and Bismark Osei for his assistance in this work. The authors are also grateful for the reviewers’ comments on the initial manuscript which improved the analysis and discussions in this paper.
Author Contributions
Kwame Awuah-Offei conceived the research project, wrote the proposal to obtain funding and directed the researcher effort. He also wrote the initial draft of the manuscript for the co-authors review. Moagabo Mathiba revised the initial experimental design as needed, conducted data analysis, wrote key portions of the manuscript, and reviewed the entire manuscript. Fred Baldassare provided isotope geochemistry expertise, participated in experimental design and proposal development, and reviewed the manuscript. All authors participated in the field data collection.
Conflicts of Interest
The authors declare no conflict of interest.
References
- Ehler, W.C. Dangerous atmosphere created by strip mine spoil. In Proceedings of the 24th National Association of Abandoned Mine Lands Programs; National Association of Abandoned Mine Lands Programs: Park City, UT, USA, 2002; pp. 1–16. [Google Scholar]
- Hockley, D.; Walter Kuit, W.; Phillip, M. Sullivan Mine fatalities: Key conclusions and implications for other sites. In Proceedings of the 8th International Conference on Acid Rock Drainage (ICARD), Skelleftea, Sweden, 22–26 June 2009.
- Laughrey, C.D.; Baldassare, F.J. Some applications of isotope geochemistry for determining sources of stray carbon dioxide gas. Environ. Geosci. 2003, 10, 107–122. [Google Scholar] [CrossRef]
- Robinson, B.A. The Occurrence and Mitigation of Carbon Dioxide in Homes Built on Reclaimed Coal Mines; U.S. Geological Survey: Reston, VA, USA, 2010.
- Cravotta, C.A., III; Dugas, D.L.; Brady, K.B.C.; Kovalchuk, T.E. Effects of selective handling of pyritic, acid-forming materials on the chemistry of pore gas and ground water at a reclaimed surface coal mine, Clarion County, PA, USA. In Proceedings of the International Land Reclamation and Mine Drainage Conference and the 3rd International Conference on the Abatement of Acidic Drainage, Pittsburgh, PA, USA, 24–29 April 1994; pp. 365–374.
- Hoefs, J. Stable Isotope Geochemistry; Springer: Berlin, Germany; Heidelberg, Germany, 2009; Volume 46. [Google Scholar]
- Davidson, G.R. The stable isotopic composition and measurement of carbon in soil CO2. Geochim. Cosmochim. Acta 1995, 59, 2485–2489. [Google Scholar] [CrossRef]
- Scanlon, B.R.; Nicot, J.P.; Massmann, J.W. Soil gas movement in unsaturated systems. In Soil Physics Companion; CRC Press: Washington, DC, USA, 2002; pp. 297–341. [Google Scholar]
- ASTM International. ASTM Standard Guide for Soil Gas Monitoring in the Vadose Zone; ASTM International: West Conshohocken, PA, USA, 2006; pp. 1–37. [Google Scholar]
- Awuah-Offei, K.; Que, S.; Mathiba, M. Delineating hazardous CO2 fluxes from acid mine drainage. Environ. Earth Sci. 2015. Accepted. [Google Scholar] [CrossRef]
- Skiba, U.; Smith, K. The control of nitrous oxide emissions from agricultural and natural soils. Chemosphere Glob. Chang. Sci. 2000, 2, 379–386. [Google Scholar] [CrossRef]
- Chiodini, G.; Caliro, S.; Cardellini, C.; Avino, R.; Granieri, D.; Schmidt, A. Carbon isotopic composition of soil CO2 efflux, a powerful method to discriminate different sources feeding soil CO2 degassing in volcanic-hydrothermal areas. Earth Planet. Sci. Lett. 2008, 274, 372–379. [Google Scholar] [CrossRef]
- Venterea, R.T.; Burger, M.; Spokas, K.A. Nitrogen oxide and methane emissions under varying tillage and fertilizer management. J. Environ. Qual. 2005, 34, 1467–1477. [Google Scholar] [CrossRef] [PubMed]
- U.S. Environmental Protection Agency (EPA). U.S. EPA Standard Operating Procedure 2149; U.S. Environmental Protection Agency: Washington, DC, USA, 1988.
- Devitt, D.A.; Evans, R.B.; Jury, W.A.; Starks, T.P.; Eklund, B.; Gnolson, A.; van Ee, J.J. Soil Gas Sensing for the Detection and Mapping of Volatile Organics; National Ground Water Association: Westerville, OH, USA, 1987. [Google Scholar]
- Rivett, M.O. Soil-gas signatures from volatile chlorinated solvents: Borden field experiments. Groundwater 1995, 33, 84–98. [Google Scholar] [CrossRef]
- Moseley, C.L.; Meyer, M.R. Petroleum contamination of an elementary-school—A case-history involving air, soil-gas, and groundwater monitoring. Environ. Sci. Technol. 1992, 26, 185–192. [Google Scholar] [CrossRef]
- Bertolini, T.; Inglima, I.; Rubino, M.; Marzaioli, F.; Lubritto, C.; Subke, J.; Peressotti, A.; Cotrufo, M. Sampling soil-derived CO2 for analysis of isotopic composition: A comparison of different techniques. Isotopes Environ. Health Stud. 2006, 42, 57–65. [Google Scholar] [CrossRef] [PubMed]
- Keeling, C.D. The concentration and isotopic abundances of atmospheric carbon dioxide in rural areas. Geochim. Cosmochim. Acta 1958, 13, 322–334. [Google Scholar] [CrossRef]
- Keeling, C.D. The concentration and isotopic abundances of carbon dioxide in rural and marine air. Geochim. Cosmochim. Acta 1961, 24, 277–298. [Google Scholar] [CrossRef]
- National Centers for Environmetal Information Data. Available online: http://www.ncdc.noaa.gov/cdo-web/ (accessed on 1 March 2016).
- Natural Resources Conservation Service Web Soil Survey. Available online: http://websoilsurvey.sc.egov.usda.gov/App/HomePage.htm (accessed on 1 March 2016).
- Pataki, D.E.; Bowling, D.R.; Ehleringer, J.R. Seasonal cycle of carbon dioxide and its isotopic composition in an urban atmosphere: Anthropogenic and biogenic effects. J. Geophys. Res. 2003, 108, 1–8. [Google Scholar] [CrossRef]
- Mathiba, M. Spatial Variation of AMD Related CO2 Emissions on Reclaimed Mine Spoil; Missouri University of Science & Technology: Rolla, MO, USA, 2013. [Google Scholar]

© 2016 by the authors; licensee MDPI, Basel, Switzerland. This article is an open access article distributed under the terms and conditions of the Creative Commons by Attribution (CC-BY) license (http://creativecommons.org/licenses/by/4.0/).