Article

Gemological and Chemical Characteristics of the Origin Determination of Emeralds from Afghanistan, Kamar Safid

School of Gemology, China University of Geosciences Beijing, 29 Xueyuan Road, Beijing 100083, China
*
Author to whom correspondence should be addressed.
Minerals 2026, 16(9), 865; https://doi.org/10.3390/min16090865
Submission received: 23 July 2026 / Revised: 21 August 2026 / Accepted: 22 August 2026 / Published: 25 August 2026
(This article belongs to the Special Issue Formation Study of Gem Deposits)

Abstract

Afghanistan’s Panjshir Valley is an important emerald-producing region in Asia. In this study, emeralds from Kamar Safid in Southeastern Panjshir were investigated by Fourier-transform infrared (FTIR), Raman spectroscopy, ultraviolet–visible–near-infrared (UV-Vis-NIR) spectroscopy, and laser ablation–inductively coupled plasma–mass spectrometry (LA-ICP-MS). These Kamar Safid emeralds are generally small, light-green-to-green crystals. Microscopic observations revealed abundant acicular and tubular three- or two-phase fluid inclusions, with transparent feldspar-group mineral inclusions. Solid phases in the fluid inclusions commonly consist of carbonate crystals or several transparent halite daughter crystals. FTIR spectra of samples indicated that the absorption of type II H2O was higher than type I H2O in the emeralds from Kamar Safid. The UV-Vis-NIR spectra are characterized by Cr- and V-related absorption bands, which are stronger than Fe-related absorptions. LA-ICP-MS results indicate slightly higher V contents and lower Cr contents than emeralds from other Panjshir mining areas. The relatively low total Cr and V contents of Kamar Safid emeralds account for the overall lighter color, suggesting that Cr and V are the principal chromophores, whereas Fe secondarily modifies hue. Rb, Cs, and Sc contents are 6.2–24.3 ppm, 11.9–141.6 ppm, and 92–1461 ppm, with total alkali contents of 4903.10–14,257.18 ppm. Cs-Rb, Cs-Sc, Li-Cs, and Li-Sc binary logarithmic diagrams indicate enrichment in Sc and Rb and depletion in Li and Cs.

1. Introduction

Emerald, with the ideal chemical formula Be3Al2[Si6O18], is a beryllium aluminum silicate mineral and the most valued member of the beryl group, often referred to as the “king of green gemstones” due to its vivid green coloration [1]. The term “emerald” derives from the Old French esmeraude, which in turn originates from the Latin smaragdus, meaning “green gemstone.” This vibrant yet gentle green hue has provided emeralds with enduring appeal across centuries—from the royal collections of the Mughal Empire to the ornate crowns of the Andes, emeralds have long symbolized wealth and nobility. Owing to their natural scarcity and increasing market recognition, emeralds exhibit considerable appreciation potential, making the exploration and characterization of high-quality emerald resources a continuing focus for gemologists.
Globally, emerald deposits are widely distributed, though traditional high-quality sources are primarily concentrated in Colombia, Brazil, and Zambia. In contrast, Asian occurrences are comparatively limited, found mainly in India, Pakistan, Russia, China, and Afghanistan [2]. Afghanistan is notable for its abundant gemstone resources, including lapis lazuli, tourmaline, corundum, and emerald. Since the discovery of gem-quality emerald deposits by Soviet geologists in the 1970s, Afghan emeralds, particularly those from the Panjshir Valley, have gradually attracted international attention. High-quality emerald crystals from the Panjshir Valley can rival Colombian Muzo emeralds, establishing the region as a key source in the high-end colored gemstone market. Afghan emeralds have since emerged as one of the fastest-growing and most closely followed sectors in the high-end colored gemstone market, becoming famous in international auctions. For example, in 2015, Christie’s auctioned a ring featuring a 10.11 ct Panjshir emerald for HKD 175,600, establishing a world auction record for Afghan emeralds and underscoring their market value [3].
Previous studies of Panjshir Valley emeralds have largely focused on the geological characteristics of the deposits and basic mineralogical properties [4,5,6,7,8,9], but detailed studies on gemological features, spectroscopic signatures, and chemical composition differences at specific sub-localities remain limited. In this study, emeralds from the Kamar Safid mining site were analyzed using standard gemological tests, Raman spectroscopy, FTIR spectroscopy, UV-Vis-NIR spectroscopy, and LA-ICP-MS. These analyses help describe the gemological features of the emeralds, assess their mineralization environment, and compare them with emeralds from other major sources worldwide. They also support geographic-origin determination and source identification within the Panjshir Valley, helping to improve emerald origin databases.

2. Geological Settings and Mining History
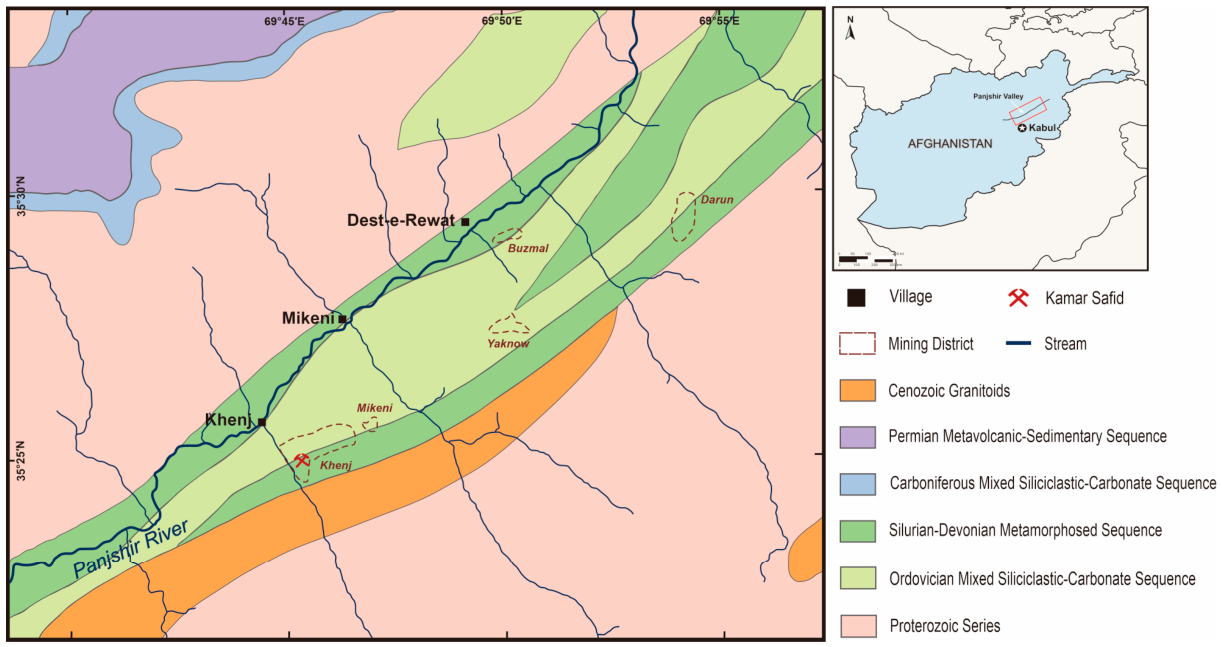
The Panjshir Valley is situated in the Hindu Kush Mountains of North–Central Afghanistan. The valley trends NE-SW, extends approximately 100 km, and has an elevation range from 2000 to 4000 m [10]. High-quality Afghan emeralds are concentrated in this region, with mining sites distributed along the valley in a belt-like pattern (Figure 1). Its geological evolution is closely related to the closure of the Paleo-Tethys Ocean, and the valley lies within the Herat–Panjshir suture zone, which has been extensively reworked during the Himalayan orogeny since the Cenozoic. Continuous compressional stress and multiple phases of complex tectonic activity generated a dense fracture network, providing critical pathways for the upward migration of ore-forming hydrothermal fluids and their interaction with host rocks, an essential prerequisite for regional emerald mineralization [11].
The exposed strata in the mining area are mainly Paleozoic sedimentary–metamorphic rock sequences. Emerald orebodies occur mainly near structurally weak zones, such as the contact zones between the Silurian–Lower Carboniferous carbonate strata and the Lower Carboniferous–Lower Permian carbonate schist strata. The ore-hosting strata have undergone regional metamorphism, with the original limestones largely transformed into marble. At the same time, frequent magmatic activity in the region formed several intrusive bodies, including gabbro–diorite, quartz porphyry, and the Laghman granite. Classified according to Giuliani et al. [12], Panjshir emerald deposits belong to Type IIC: tectonic-metamorphic-related, hosted in medium-pressure metamorphic rocks, excluding mafic–ultramafic rocks and black shales. The regional metamorphic basement includes gneiss, schist, marble, amphibolite, and other metamorphic rocks.
Emerald-bearing veins in the Panjshir Valley are dominated by quartz and albite. Intense hydrothermal activity has caused significant alteration of surrounding wall rocks, notably characterized by albitization and muscovite–tourmaline replacements. Associated minerals include pyrite, quartz, dolomite, tourmaline, albite, carbonate minerals, and halogen minerals, likely linked to local quartz–feldspar porphyry intrusions [8]. This suggests that the hydrothermal system responsible for mineralization, as well as key ore-forming components, such as beryllium (Be) and chromium (Cr), originated from fluids derived from intermediate–felsic magmas.
Although gem-quality emeralds in Afghanistan were first discovered by geologists in the 1970s, long-term instability in the region limited large-scale mining. Small-scale mining gradually resumed in the late 20th century, but it was still limited by climate and political conditions. Mining conditions in the Panjshir area were very basic. Early miners often followed hydrothermal alteration-related vein systems and used pyrite as a guide for prospecting. After workers found emerald crystals, they usually used explosives for blasting, but this caused permanent damage to the recovered crystals and reduced the quality of later mining [13]. In recent years, mechanized equipment has helped change mining methods from simple shaft and tunnel excavation to diversified extraction methods, including trenching and open-pit mining. Mineralized zones are now identified by core drilling, followed by controlled blasting and manual excavation to recover emerald crystals or mineralized samples. These methods have greatly improved both mining quality and yield.
The Panjshir Valley contains five major emerald mining areas: Khenj, Mikeni, Yaknow, Buzmal, and Darun [13]. Collectively, these areas have produced several thousand carats of high-quality emerald rough. Khenj village alone accounts for nearly 70% of valley production, with approximately 250 registered mining tunnels. Miners’ experience and mining records indicate that the highest-quality crystals are mainly obtained from Mikeni and Khenj. Samples examined in this study were sourced from the Kamar Safid mining area, located in the Southeastern Panjshir Valley (35°25′00″ N, 69°45′43″ E), near Khenj village. Although relatively small, the deposit is close to Be-bearing intrusive rocks, resulting in concentrated hydrothermal activity. Compared to the high-altitude northeastern areas of the valley, the relatively gentle topography of Kamar Safid facilitates geological sampling and mineral exploration, making it an ideal site for investigating small-scale hydrothermal-type emerald deposits in the Panjshir Valley.
Figure 1. Geological overview map of the Panjshir Valley, Afghanistan. Major emerald-producing areas are distributed along the valley, with the Kamar Safid mining site in the southeastern part, adjacent to Khenj village. Modified from [14].
Minerals 16 00865 g001

3. Materials and Methods

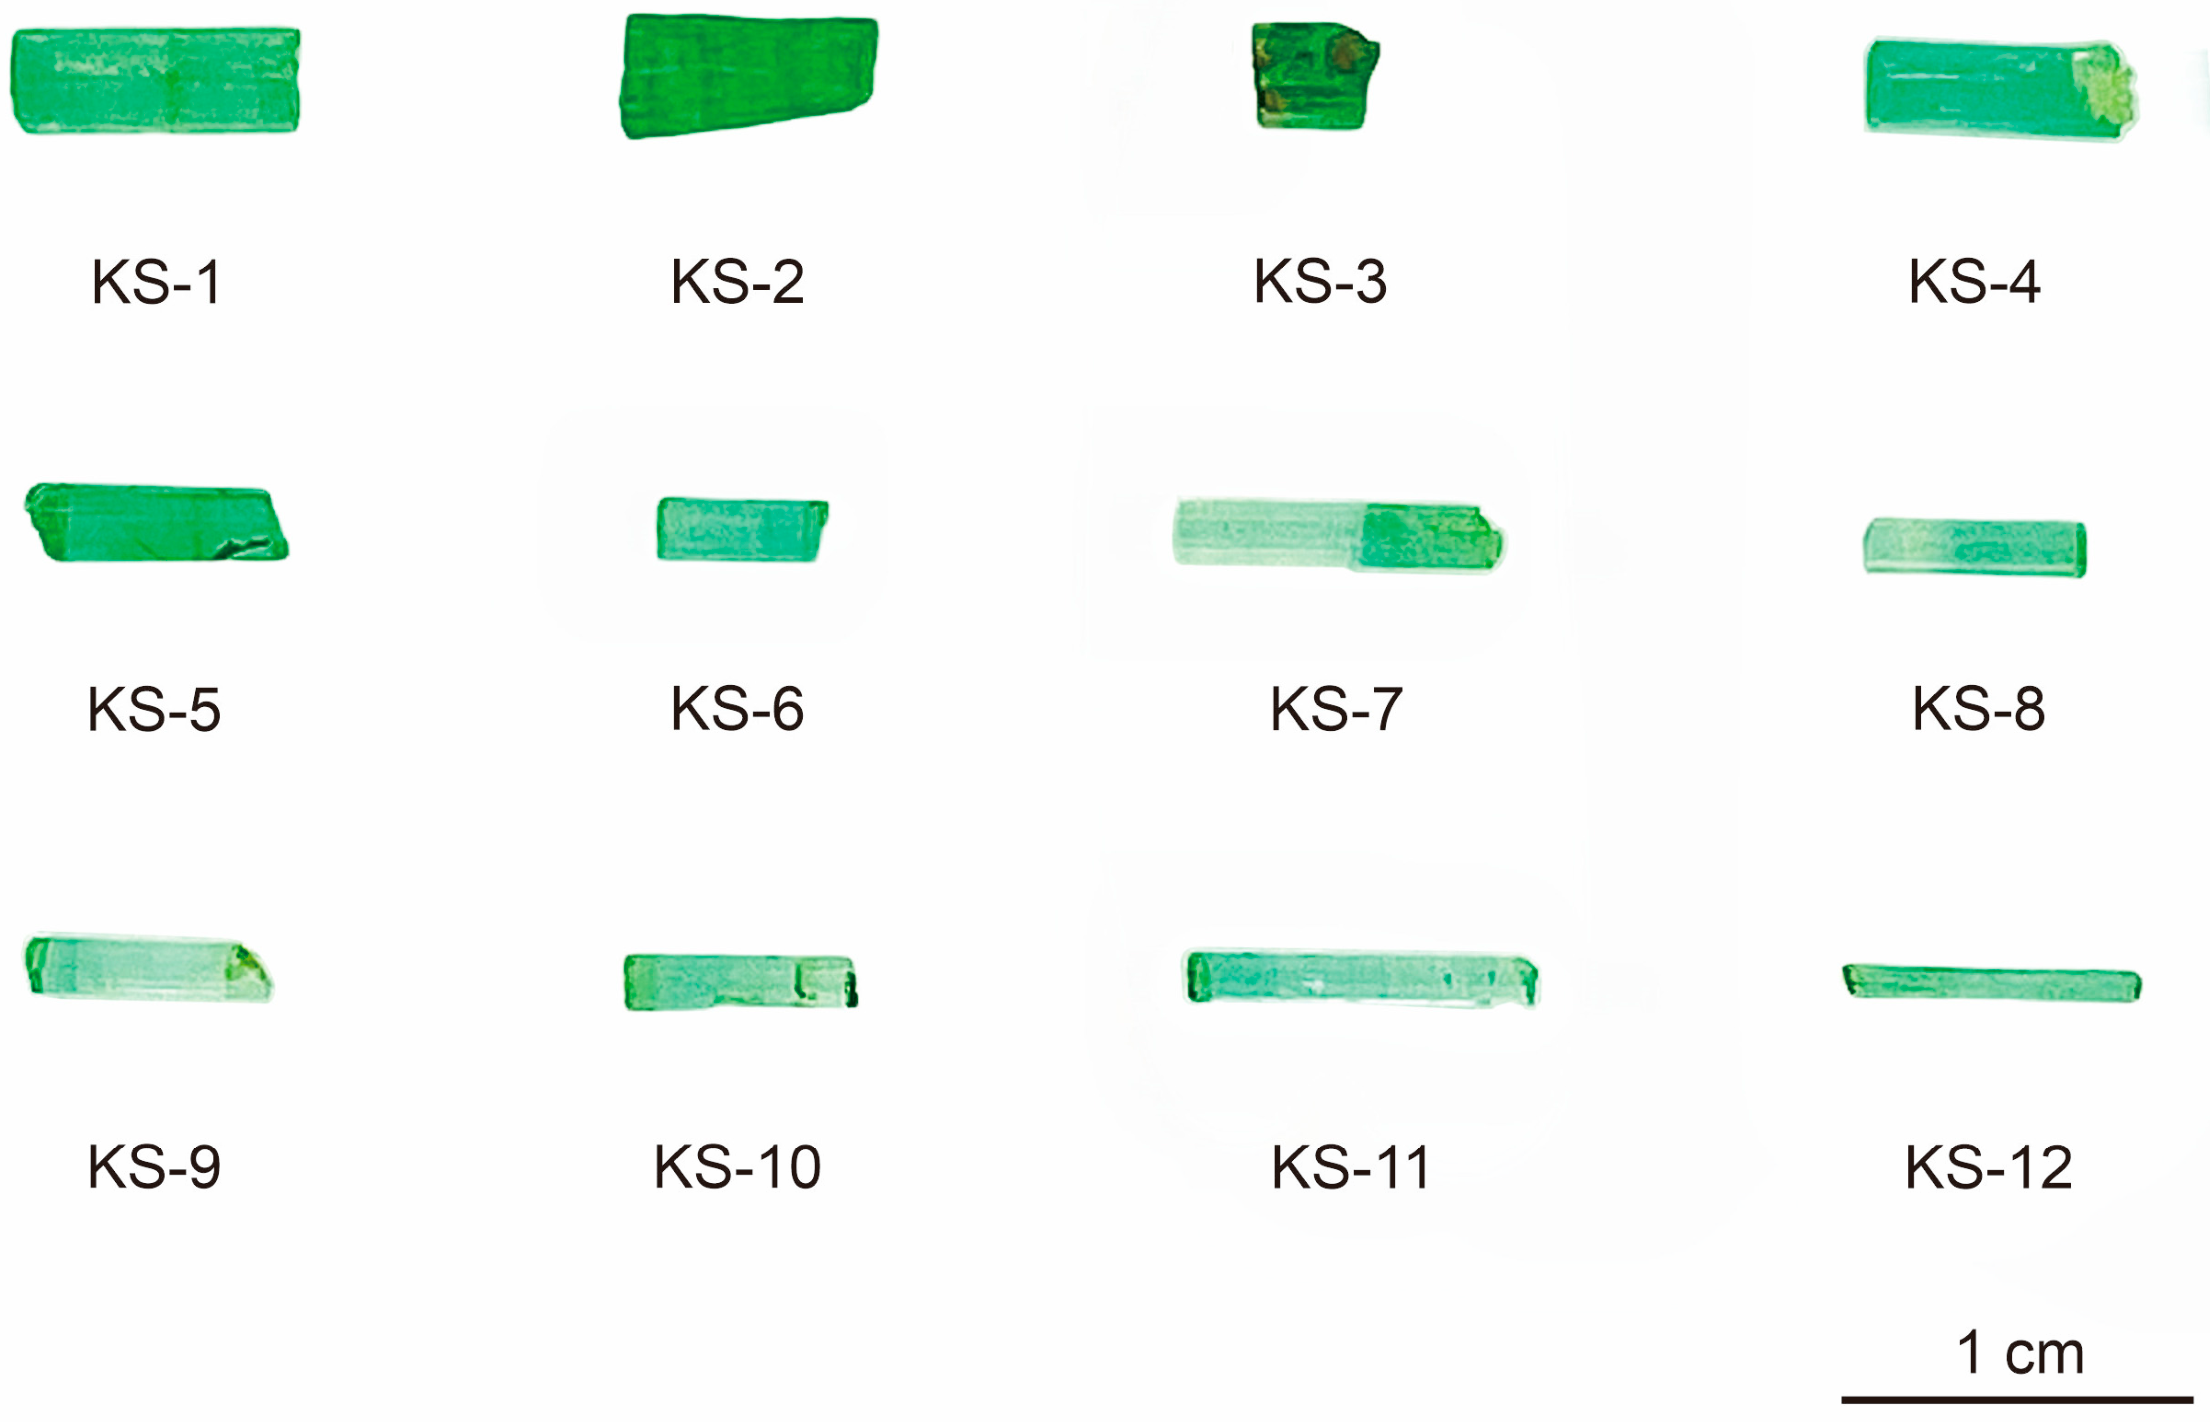
A total of 12 emerald samples from the Kamar Safid mining area, Panjshir Valley, Afghanistan, were examined in this study, designated KS-1 to KS-12, with weights ranging from 0.075 to 0.640 ct (Figure 2). The samples are generally small and elongated, exhibiting a hexagonal columnar habit, approximately 4–10 mm in length, with regular hexagonal cross-sections of 1–3 mm in width. All crystals display vitreous luster and relatively high transparency, with colors ranging from light green or bluish-green to green. Some crystals exhibit uneven color distribution, with visible color boundaries and gradation. Longitudinal striations and etch patterns are observed on crystal faces, along with localized iron staining and conchoidal fractures. For convenience, all the tested samples are collectively referred to as Kamar emeralds.
Standard gemological analyses were performed at the Gemological Research Laboratory of China University of Geosciences, Beijing. Each sample was examined using a refractometer (Baoguang, Nanjing, China), Chelsea color filter (CCF), long-wave (365 nm) and short-wave (254 nm) ultraviolet lamps (Baoguang, Nanjing, China), DiamondView™ (IIDGR, London, UK), and specific gravity was determined using the hydrostatic method.
Surface features and internal inclusions were observed using a GI-MP22 gemological photographic microscope (Baoguang, Nanjing, China) under darkfield, brightfield, and fiber-optic illumination. Selected inclusions were further examined and photographed using a polarizing microscope (Leica, Wetzlar, Germany) with 50× to 400× magnification. Raman spectroscopy analyses of inclusions were conducted jointly at the Gemological Research Laboratory of China University of Geosciences, Beijing; and the Institute of Geology and Geophysics, Chinese Academy of Sciences. At the Gemological Laboratory, Raman spectra were acquired using a Horiba LabRAM HR-Evolution Raman spectrometer (HORIBA, Longjumeau, France) with a 532 nm excitation wavelength, laser power of 30–40 mW, acquisition time of 20 s, and spectral range of 100–2000 cm−1. At the Institute of Geology and Geophysics, spectra were obtained using a WITec Alpha300 R confocal Raman spectrometer (WITec, Ulm, Germany), with a 532 nm excitation wavelength, spectral range of 100–3000 cm−1, laser power of 5–10 mW, 2–4 accumulations, and integration times of 2–20 s.
Infrared spectroscopy and UV-Vis-NIR spectroscopy were performed at the Gemological Research Laboratory of China University of Geosciences, Beijing. Infrared spectra were collected using a Bruker Tensor 27 Fourier-transform infrared spectrometer (Bruker Optics, Ettlingen, Germany) at room temperature (22 °C) and 31% relative humidity. The instrument was equipped with a room-temperature DLaTGS pyroelectric detector (Bruker Optics, Ettlingen, Germany), which was used for both the mid- and near-infrared measurements. Spectra were measured in reflectance mode, from 400 to 4000 cm−1, with 32 scans and a resolution of 4 cm−1, and in transmission mode, from 4000 to 8000 cm−1, with 16 scans and a resolution of 4 cm−1. For the reflection measurements, a specular reflectance accessory with near-normal incidence was used. The background spectrum was measured using a standard reference mirror. The resulting specular reflectance spectra were processed in OPUS software using the Kramers–Kronig transformation to obtain the corresponding absorption spectra.
UV-Vis-NIR spectra and color parameters were acquired using a QSPEC GEM-3000 fiber-optic spectrometer (Biaoqi, Guangzhou, China). Spectra were collected from 300 to 1000 nm, with 9 scans, a 220 ms integration time, and a smoothing width of 2 nm. Color measurements were performed at 6700 K, and the data were converted using the built-in software based on the CIE 1976 Lab* color space. Before UV-Vis-NIR measurements and color-parameter acquisition, the testing surfaces were ground and polished, and samples with relatively similar thickness along the measurement path were selected to reduce the influence of thickness and surface differences.
Laser ablation–inductively coupled plasma–mass spectrometry (LA-ICP-MS) analyses were conducted at the National Research Center for Geoanalysis, Chinese Academy of Geological Sciences, Beijing, China. A Thermo-Finnigan Element II ICP-MS (Thermo Fisher Scientific, Bremen, Germany) coupled with a laser ablation system was used for multi-element quantitative analysis. The laser-spot diameter was 40 μm, repetition rate was 20 Hz, and fluence was 5 J/cm2, with ~80 s total acquisition per analysis (including ~20 s background, ~40 s sample, and ~20 s post-ablation helium flushing). NIST SRM 612 and KL-2G were used as external standards, with three standard analyses for calibration every ten samples. Element concentrations were calculated using 29Si as the internal standard, with SiO2 in emerald calculated as 66.94% based on theoretical composition. Detection limits ranged from 0.05 × 10⁻⁶ to 0.1 × 10⁻⁶, with an analytical precision within 10%.

4. Results

4.1. Conventional Gemological Properties

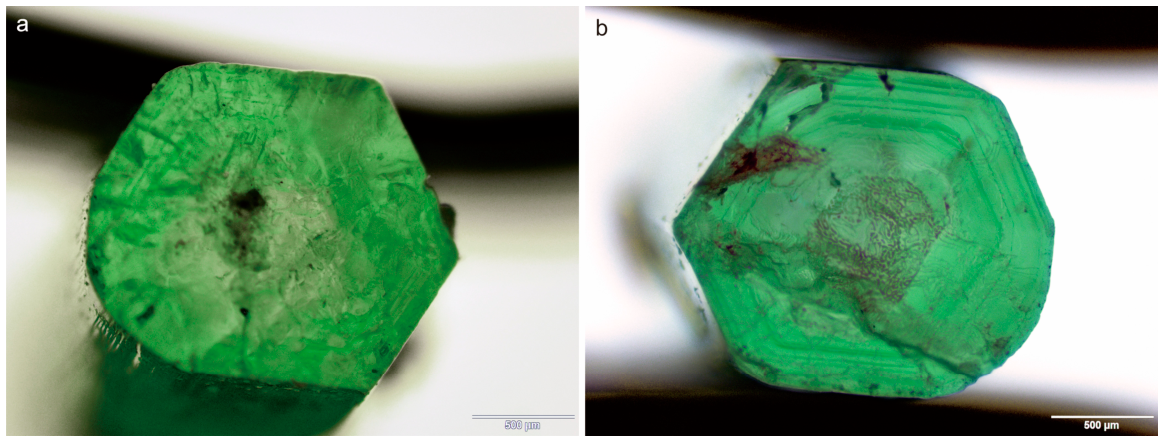
The Kamar emerald samples range from light green to green, exhibiting the bluish hue characteristic of Afghan emeralds. Some samples display uneven color distribution along the c-axis or concentric zoning in cross-section, with lighter coloration compared to emeralds from other Panjshir mining areas. For example, the center of sample KS-6 is pale yellowish green (Figure 3a, diffused transmitted light, lower illumination intensity, and smaller aperture), and the green color becomes darker toward the rim, with a clear color boundary. Under certain lighting conditions, concentric growth bands are observable (Figure 3b, diffused transmitted light, higher illumination intensity, and larger aperture).
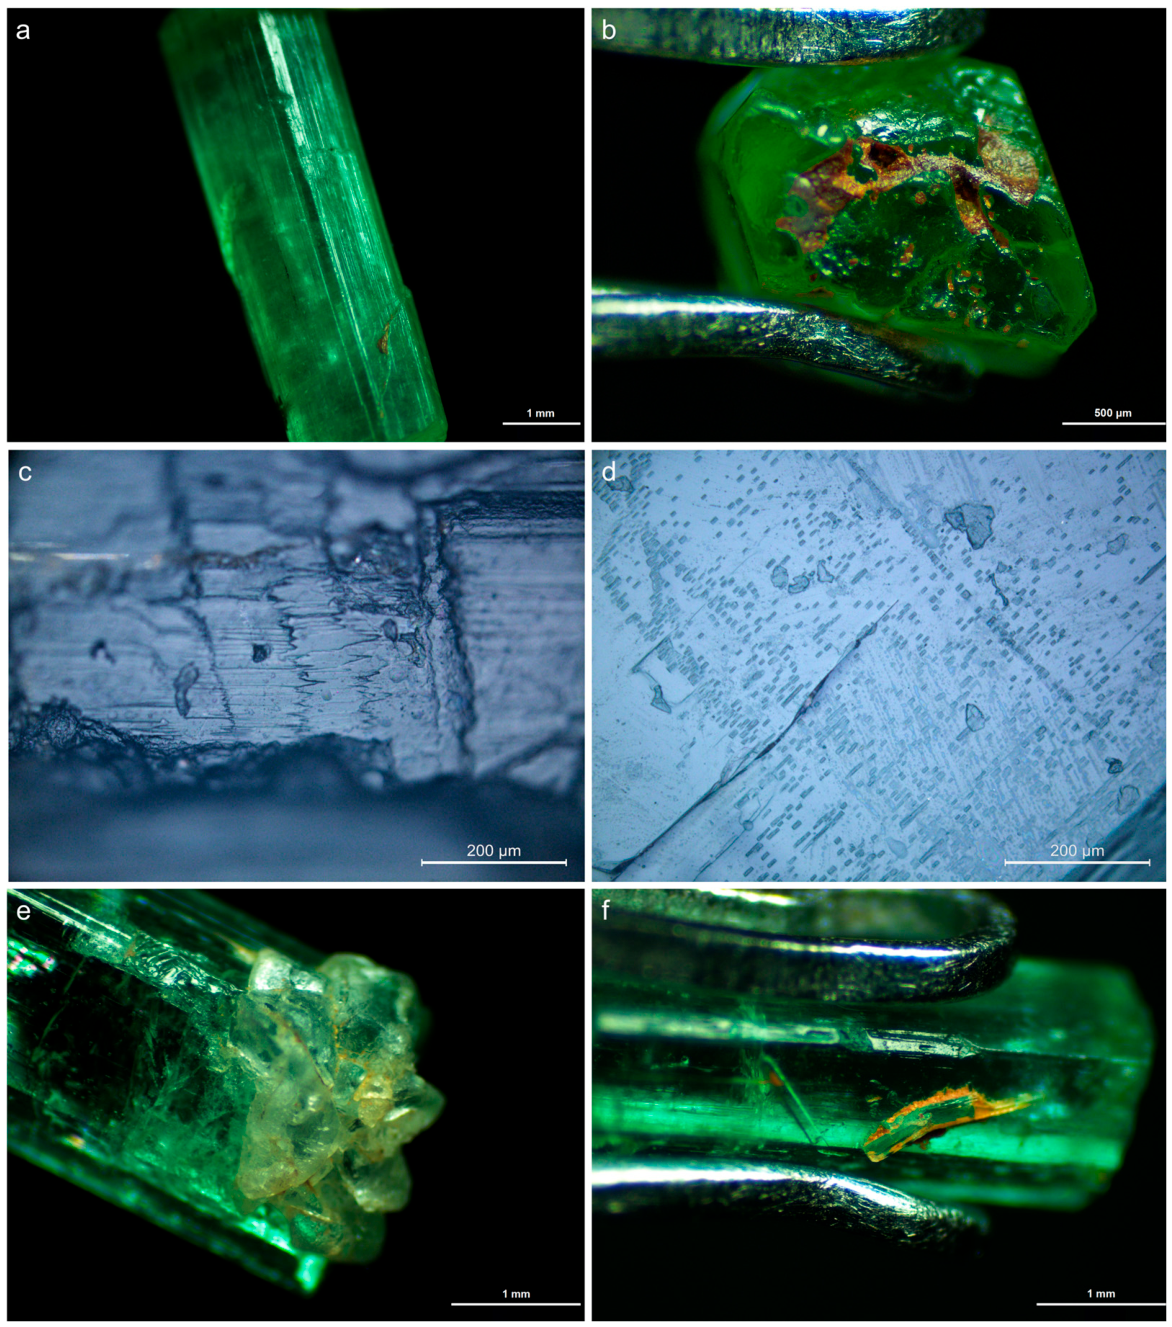
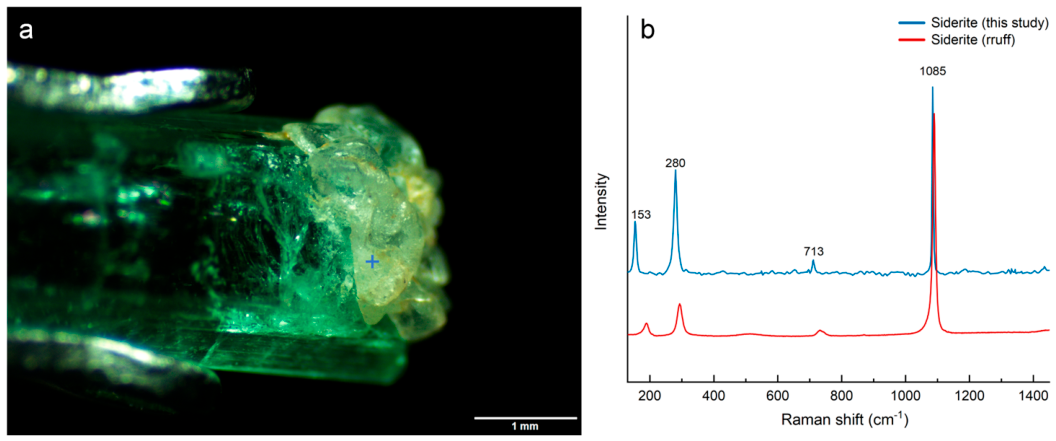
Longitudinal striations are present along the c-axis on crystal faces. Growth bands and groups of rectangular etch pits parallel to the c-axis are observed on the crystal surfaces, with yellowish-brown iron stains along fractures (Figure 4a). Sample KS-4 shows a white associated mineral at the termination, identified as siderite by Raman spectroscopy (Figure 5). Intergrowth of small crystals is visible on the surface of sample KS-6 (Figure 4f). Upon magnification, the interiors of the Kamar emerald samples contain abundant inclusions, including numerous fluid inclusions and healed fractures (Figure 6).
The refractive indices of Kamar emeralds are Ne = 1.572–1.577 and No = 1.581–1.585, with a birefringence of 0.006–0.010. The spectroscope reveals the typical visible spectral characteristics of emerald. Under the Chelsea color filter (CCF), the samples appear pinkish-red, with the intensity of the red correlated with the body color depth of the crystals. The samples display moderate dichroism, appearing green (o-ray) and bluish-green (e-ray). Most samples are inert to ultraviolet fluorescence, although some exhibit localized moderate bluish-green fluorescence under long-wave UV light, which is attributed to oil treatment. The specific gravity of the samples ranges from 2.67 to 2.88. A summary of the conventional gemological properties of Kamar Safid emeralds is provided in Table 1.

4.2. Microscopic Characteristics

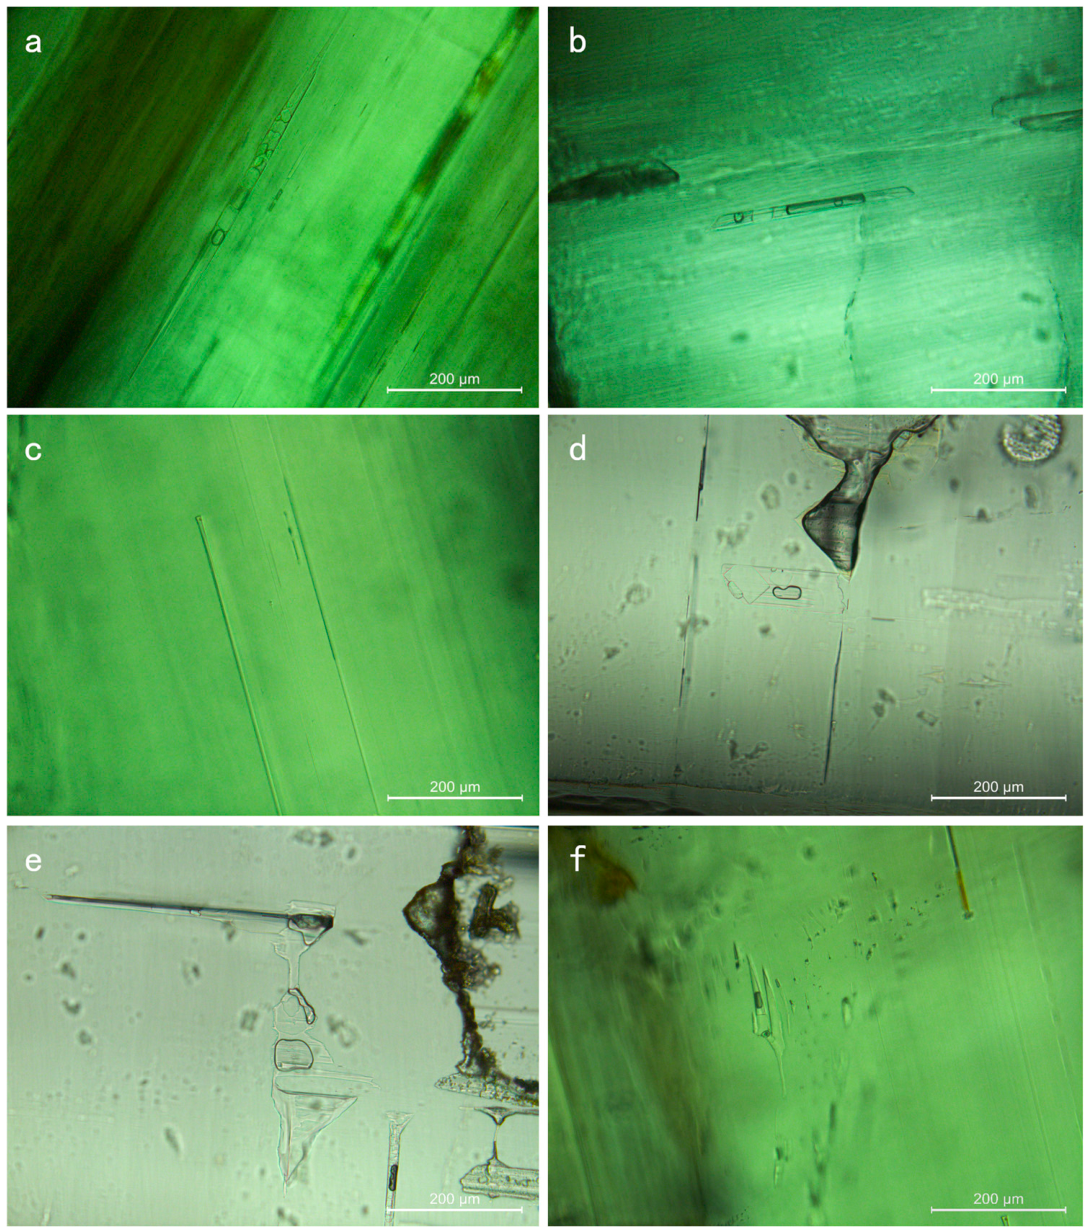
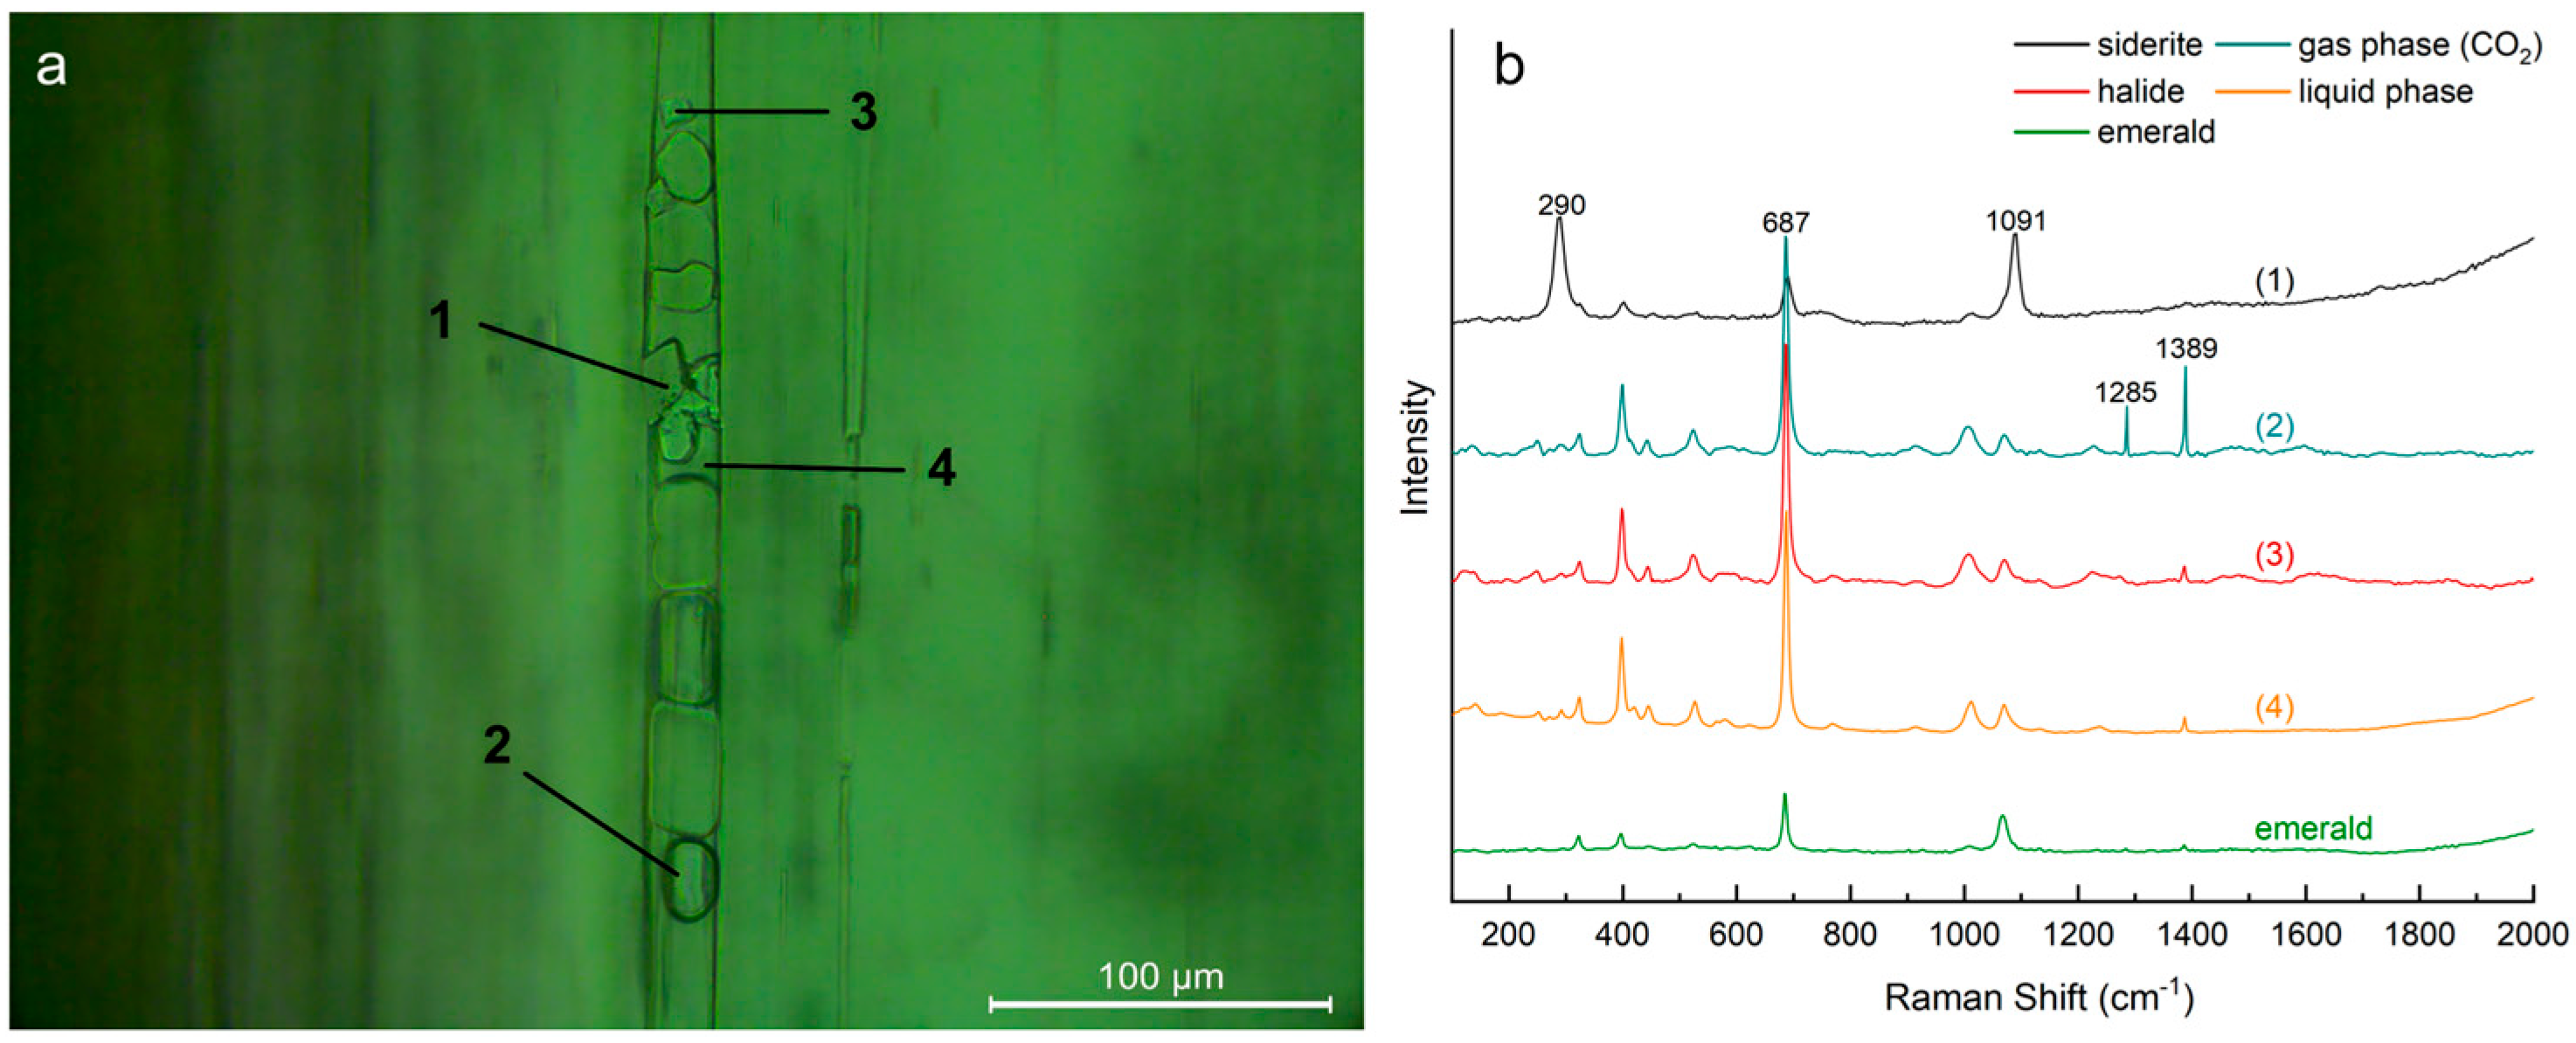
Kamar emeralds contain abundant fluid inclusions, which are mainly three-phase or two-phase inclusions. Similar to emeralds from other Afghan localities, Kamar emeralds commonly show characteristic elongated needle-like or tubular three-phase fluid inclusions (Figure 7a–c). Other forms are also observed, like rectangular inclusions (Figure 7d), irregular or “necked-down” inclusions, “pinhead-like” inclusions (Figure 7e), and jagged inclusions (Figure 7f). These inclusions commonly occur in groups parallel to the crystal c-axis. Detailed observation of the three-phase fluid inclusions (Figure 8) shows that the solid phases are mostly transparent daughter minerals, whose sizes are related to the size of the host inclusion. One type of crystal is relatively large and has a square to rectangular shape. Raman analysis indicates that these crystals are carbonate minerals, including siderite and ankerite, which is consistent with the composition of the associated minerals. The other type consists of smaller square or irregular polygonal crystals. These crystals commonly occur as aggregates within the same inclusion, where two to five or even more grains can generally be observed, and they are inferred to be halides such as halite (NaCl) [15]. However, at the corresponding positions of the suspected halides, only Raman peaks from the emerald matrix were observed, and no diagnostic peaks assignable to the halide phase were detected. This may be related to the extremely weak Raman activity of halides. Minute dark opaque inclusions are occasionally observed. The gas phase is commonly oval in shape and may be distorted or compressed depending on the morphology of the host inclusion. Raman spectra show two characteristic CO2 peaks at 1285 and 1389 cm−1. In addition, yellowish-brown filling material is observed in some tubular inclusions, which may indicate iron staining.
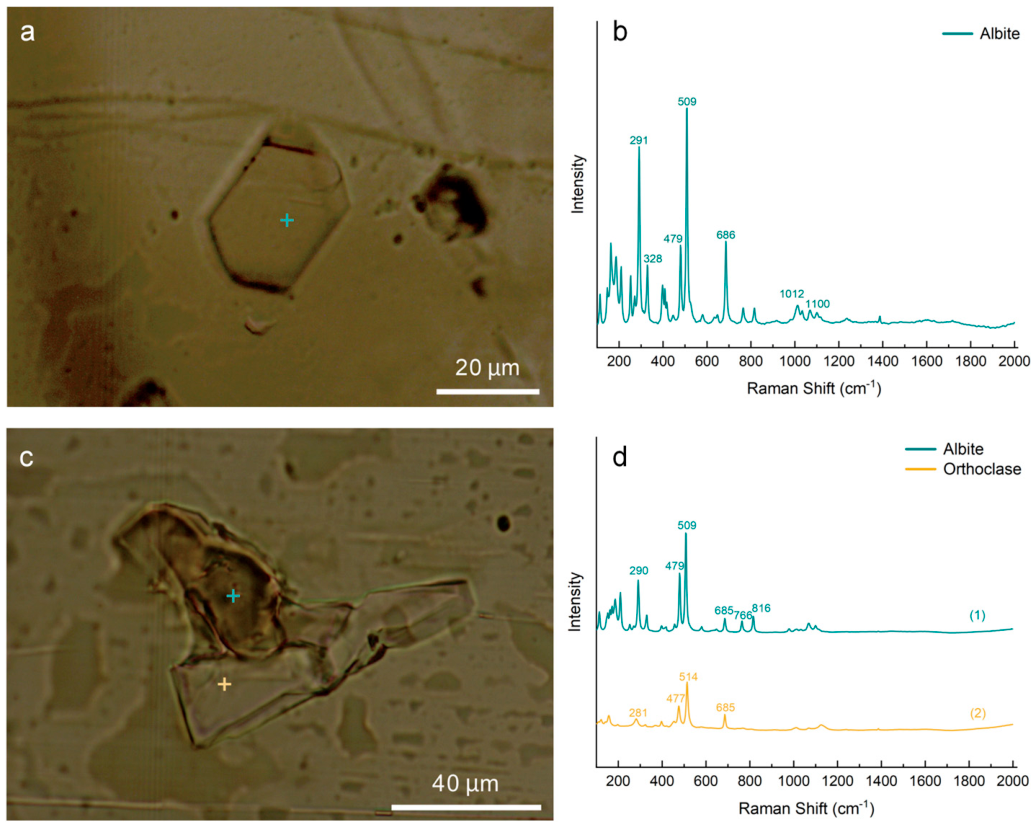
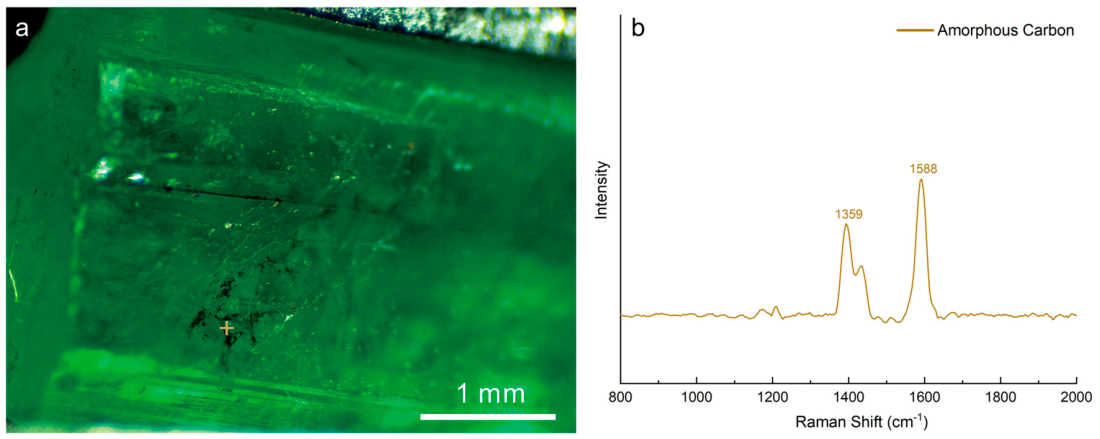
Mineral inclusions commonly reported in Afghan emeralds include calcite, pyrite, hematite, fluorite, quartz, and apatite [16]. Compared with fluid inclusions, mineral inclusions are less abundant in Kamar emeralds. They are mainly transparent crystal inclusions and commonly occur near fractures and healed fissures. Raman spectroscopic analysis indicates that most of these inclusions are feldspar-group minerals (Figure 9). In addition to mineral inclusions with well-developed crystal forms, black irregular flocculent material was observed in the near-surface region of some samples. Raman analysis identified this material as amorphous carbon, with characteristic bands at 1359 and 1588 cm−1 (Figure 10) [17].
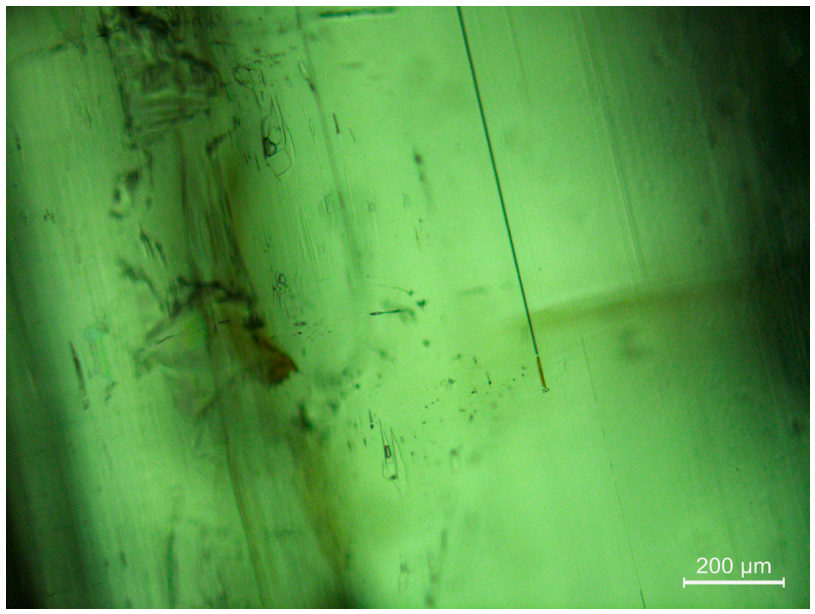
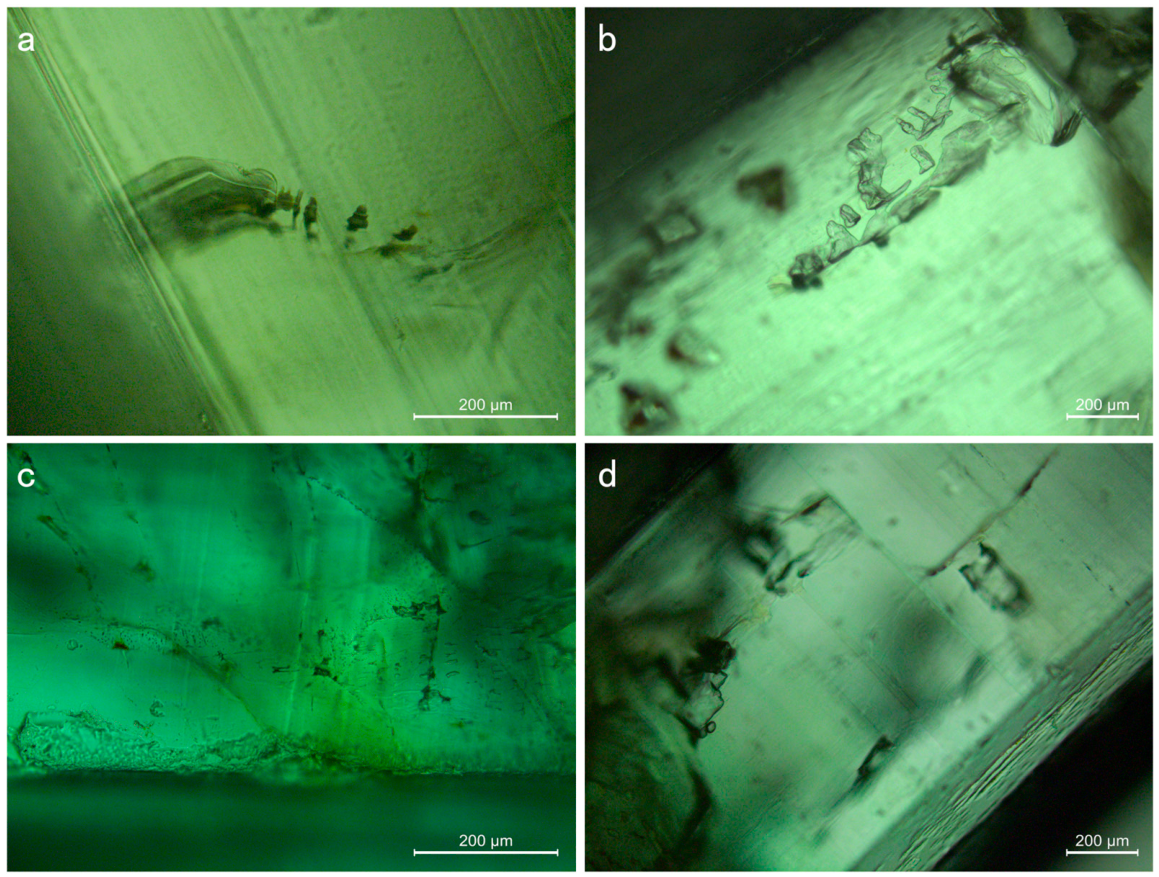
Kamar emeralds contain numerous internal fractures. Under magnification, distinct black or yellowish-brown secondary fissures can be observed near the fractures (Figure 11a,b). Small gas–liquid inclusions are locally distributed along these fissures (Figure 11c). In addition, parallel and alternating growth color bands are visible along the crystallographic c-axis (Figure 11d).

4.3. Spectral Characteristics

4.3.1. UV-Vis-NIR Spectroscopy

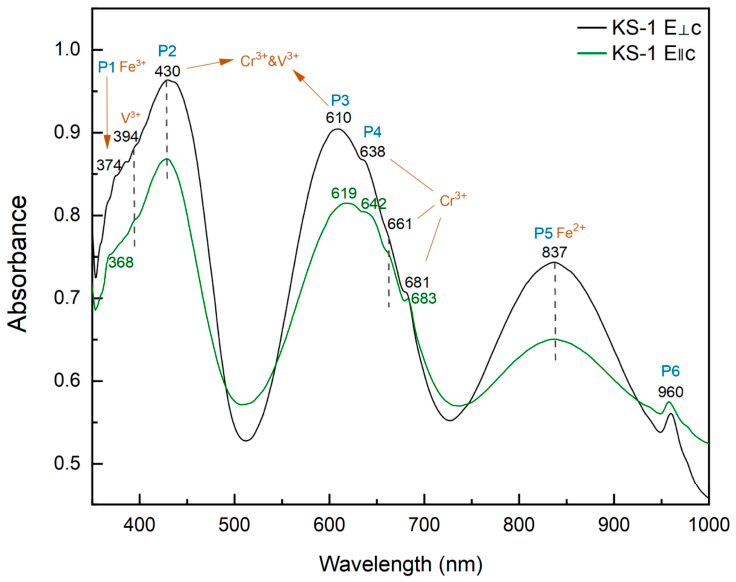
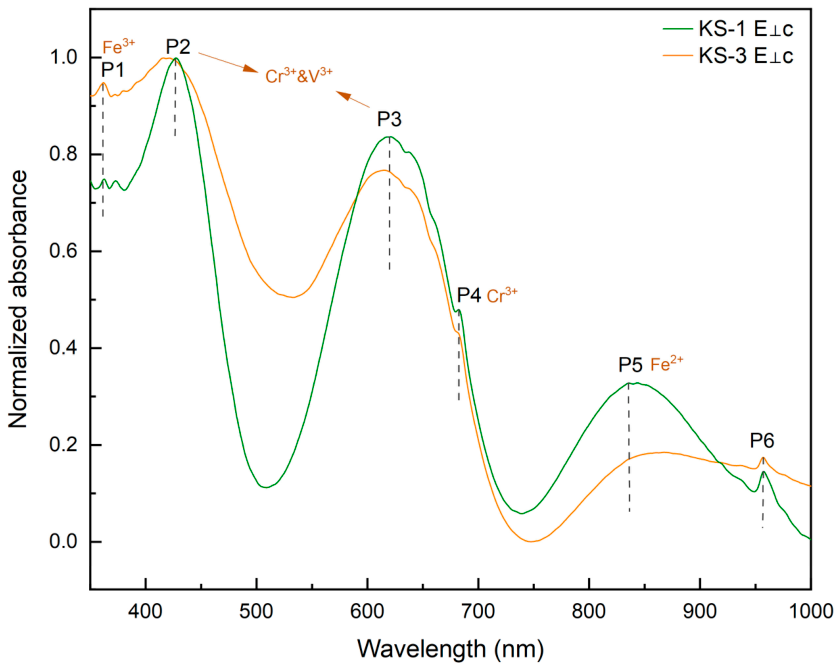
The UV-Vis-NIR absorption spectra of the Kamar emerald samples are shown in Figure 12. Because the spectra of the samples are similar, sample KS-1 was selected as a representative example. The absorption band at 374 nm (P1) is attributed to Fe3+, while a weak shoulder at 394 nm is assigned to V3+. The strong absorption bands at 430 nm (P2) and 610 nm (P3) are produced by the combined effects of Cr3+ and V3+. The bands at 638, 661, and 681 nm are characteristic Cr3+ absorptions and are collectively labelled as P4. In the near-infrared region, an absorption band occurs at approximately 837 nm (P5), which is associated with Fe2+ occupying different lattice sites in the crystal structure. Its intensity is much lower than that of the Cr3+- and V3+-related absorption bands. A distinct P6 absorption peak occurs near 960 nm, but its origin is still unclear. The Fe2+-related absorption at 837 nm (IP5) is clearly weaker than the Cr3+- and V3+-related absorption bands near 430 and 610 nm (IP2 and IP3), with IP5 < IP2 and IP5 < IP3. This spectral pattern is commonly observed in Afghan emeralds [16]. Furthermore, to evaluate possible directional effects, sample KS-1 was also measured in different crystallographic directions, and the resulting spectra show broadly consistent peak positions. The spectra measured perpendicular and parallel to the c-axis show differences in their spectral profiles, indicating directional optical effects. In the e-ray spectrum, the absorption feature near 374 nm is weak and nearly absent.
Overall, the UV-Vis-NIR absorption spectra of Kamar emeralds display typical emerald absorption features. Strong Cr3+- and V3+-related bands occur near 430 and 610 nm, indicating that Cr and V are the principal chromogenic elements. A Fe2+-related absorption band is also present near 827 nm, but it is significantly weaker than the Cr3+- and V3+-related absorptions. Based on the relative intensities of P5, P2, and P3, the Kamar emeralds mainly show a spectral pattern in which the intensity of P5 is lower than those of both P2 and P3.

4.3.2. FTIR Spectroscopy

FTIR not only assists in gem identification but also provides direct evidence for the presence of filling materials and the type of channel water in emerald. It is therefore one of the important references for geographic-origin determination. Figure 13 shows the FTIR spectra of Kamar emeralds in the 400–8000 cm−1 range. All samples were measured perpendicular to the c-axis.
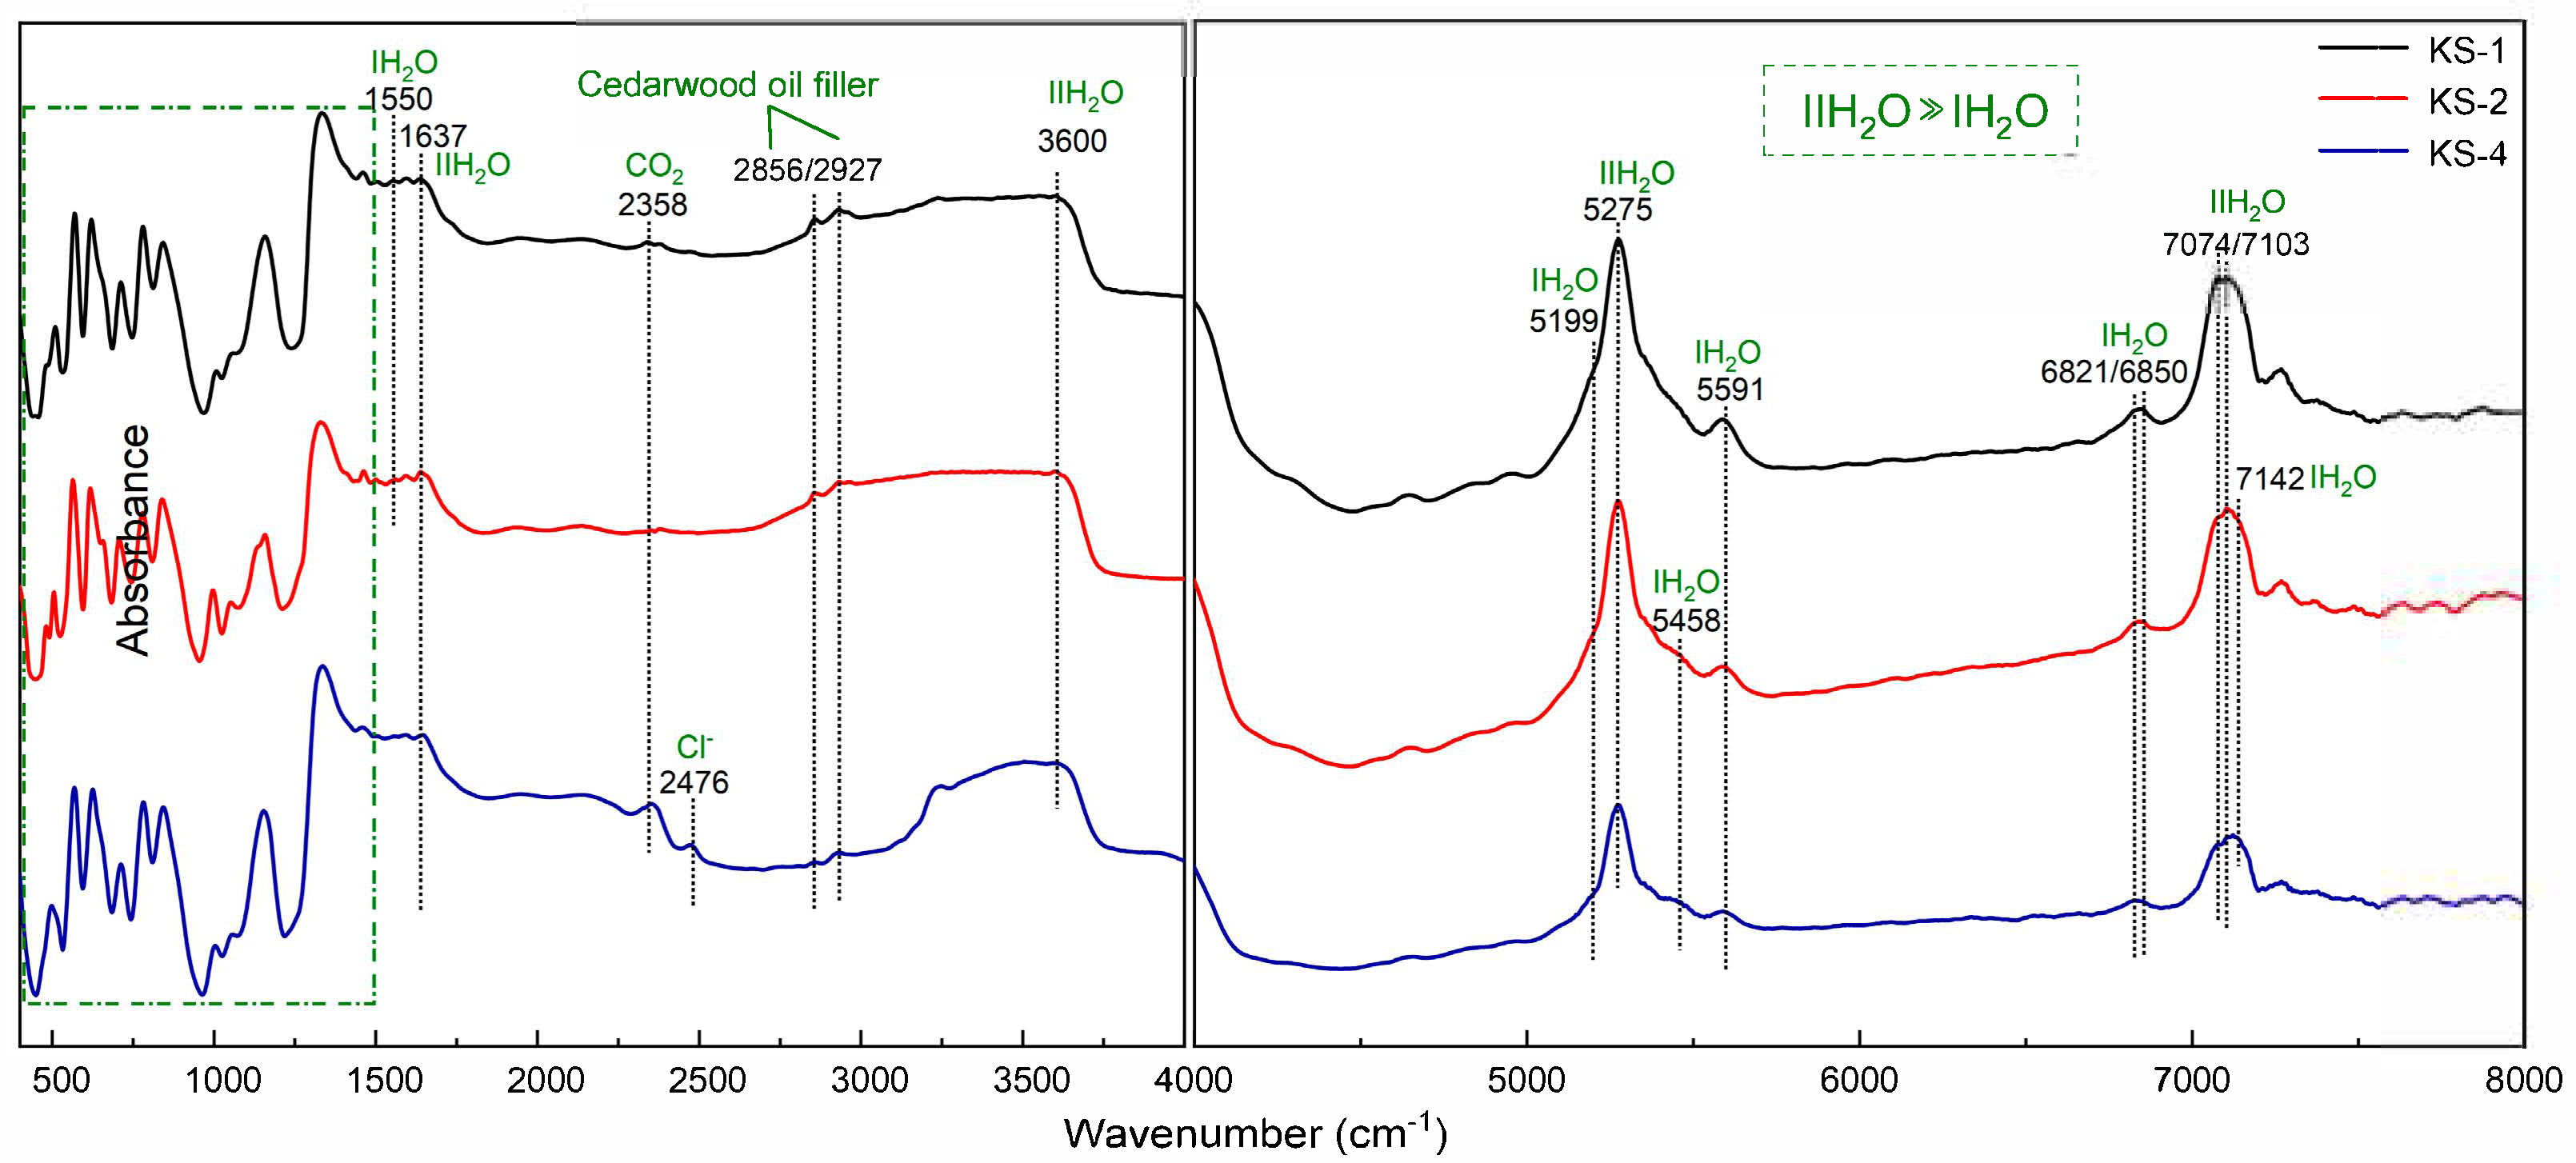
In the 400–4000 cm−1 mid-infrared region, the 400–1300 cm−1 absorption bands are generally consistent with the standard beryl in number and frequency range, although the bands are slightly shifted to higher wavenumbers. This shift may be related to the isomorphous substitution of Al by trace elements such as Cr, V, and Fe in emerald [18]. The absorption band at 2358 cm−1 corresponds to the characteristic absorption of CO2, while the sharp peak at 2474 cm−1 is assigned to Cl absorption. Organic-related bands at 2856 and 2927 cm−1 indicate that the samples underwent filling treatment. Based on previous studies, the material is inferred to be an organic filler [19]. This interpretation is consistent with the local bluish-green fluorescence observed under ultraviolet light, as described above.
Channel water in emerald is commonly classified as type I and type II H2O. Previous studies have shown that the occurrence of these two water types is closely associated with the alkali-metal ion content. Without alkali metals in the channels, H2O molecules align parallel to the c-axis (type I H2O). In contrast, when alkali-metal ions are present in the channels, the H-O-H molecule is oriented perpendicular to the c-axis (type II H2O). The incorporation of alkali-metal ions may also cause a slight increase in the bending-vibration frequency of water molecules. In natural emeralds, type I and type II H2O may coexist.
As shown in Figure 13, in the 1500–1700 cm−1 range, the ν2 bending vibration of type I H2O occurs at 1550 cm−1, whereas that of type II H2O occurs at 1637 cm−1 [20]. One or two accompanying peaks are also observed beside the main bands. These features correspond to the ν2 vibrational absorptions of water complexes with different coordination states in emerald [16]. The shoulder near 3600 cm−1 is assigned to the ν1 symmetric stretching vibration of type II H2O, but the ν3 vibration of type I H2O near 3700 cm−1 is absent.
In the near-infrared region of 4000–8000 cm−1, the infrared spectra of emerald mainly reflect combination and overtone vibrations of structural water. Type II H2O shows a strong, sharp peak at 5275 cm−1, while type I H2O displays weaker bands at 5199, 5458, and 5591 cm−1. In addition, the strong absorption bands at 7074/7103 cm−1 are related to overtone vibrations of type II H2O. The type I H2O bands at 6821/6850 and 7142 cm−1 are much weaker. Taken together, these features indicate that type II channel-water absorption is much stronger than type I H2O in Kamar emeralds. The absence of the type I H2O ν3 vibration near 3700 cm−1 in the mid-infrared region further suggests that the spectra are dominated by type II H2O, indicating that Kamar emeralds belong to the medium-alkali type.

4.4. Chemical Composition Characteristics

Several Kamar emerald samples with relatively homogeneous color (KS-1, KS-2, KS-3, and random analytical spots) and samples with uneven color distribution (KS-7 and random analytical spots in different color zones) were selected for LA-ICP-MS analysis. The aim was to determine the major- and trace-element contents of the emeralds.
The LA-ICP-MS results are listed in Table 2. The Cr content ranges from 213 to 4844 ppm, with an average of 1179 ppm. The V content ranges from 665 to 7533 ppm, averaging 1550 ppm, and the Cr/V ratio ranges from 0.31 to 1.85. The Fe content ranges from 1029 to 3978 ppm, with an average of 1804 ppm. Afghan emeralds generally show Cr/V > 1, indicating higher Cr than V contents. In contrast, the Kamar emeralds show V contents comparable to Cr, and some samples even contain higher V than Cr. This suggests that both Cr and V act as chromogenic elements in Kamar emeralds, with Cr/V generally lower than those reported for emeralds from other Afghan localities.
The Kamar emeralds also contain moderate amounts of alkali metals. The total alkali-metal content ranges from 4631 to 14,257 ppm, with an average of 6759 ppm. Li ranges from 46 to 135 ppm, with an average of 89 ppm. Na is the dominant alkali element, ranging from 4452 to 13,814 ppm and averaging 6447 ppm. Rb and Cs contents are 6.2–24.3 ppm and 11.9–141.6 ppm, with averages of 12.7 ppm and 30.4 ppm, respectively. K ranges from 76 to 455 ppm, with an average of 181 ppm. In addition, Mg contents range from 4454 to 14,919 ppm, averaging 6668 ppm, whereas Sc contents range from 92 to 1461 ppm, with an average of 269 ppm.

5. Discussion

5.1. The Relationship Between Trace Elements and Origin Determination of Kamar Emeralds

Emeralds from different geological environments commonly show distinct gemological and chemical characteristics. The geological setting of a deposit plays a decisive role in emerald formation. Beyond conventional gemological properties, trace-element compositions can record the crystallization history of emeralds and provide clues to the nature of the mineralizing fluids and host rocks. They are useful for geographic-origin determination and for reconstructing the mineralization process. With the development of LA-ICP-MS, this method has been widely used to study the trace-element composition of emeralds because of its high sensitivity and accuracy [21,22].
Emerald is the green variety of beryl colored by Cr and/or V. For this reason, the type and abundance of chromogenic elements are important indicators of origin. Emeralds from the Panjshir region of Afghanistan are commonly intense green with a bluish tone, and high-quality stones may be comparable to Colombian emeralds. In contrast, the Kamar emeralds examined in this study are much lighter and paler in color.
Previous studies reported Cr contents of 57.7–11,624 ppm for Panjshir emeralds, with an average of 2291 ppm. Their V contents range from 142 to 4052 ppm, averaging 1237 ppm [16]. The Kamar emeralds analyzed in this study contain 213–4844 ppm Cr and 665–7533 ppm V, with average values of 1179 ppm and 1550 ppm, respectively. Their Cr/V ratios vary from 0.31 to 1.85, but several samples have Cr/V < 1. In general, the Cr and V contents of Kamar emeralds fall within the compositional range reported for Panjshir emeralds. However, the average Cr content is low, while the average V content is relatively high. In particular, Cr content is generally at the low-to-moderate level compared with emeralds from other Panjshir mining areas [6,7,8]. These results suggest that Kamar emeralds may have a relatively V-enriched chemical signature. Their lighter color is likely related to the lower total content of the chromophore elements Cr and V.
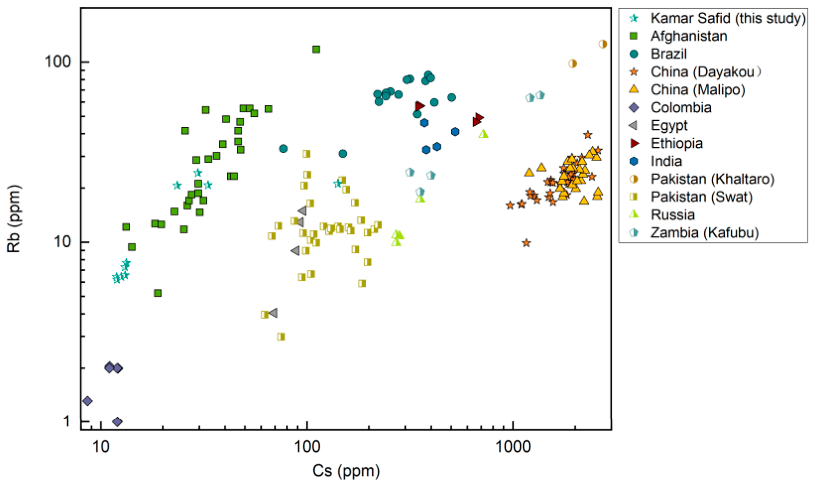
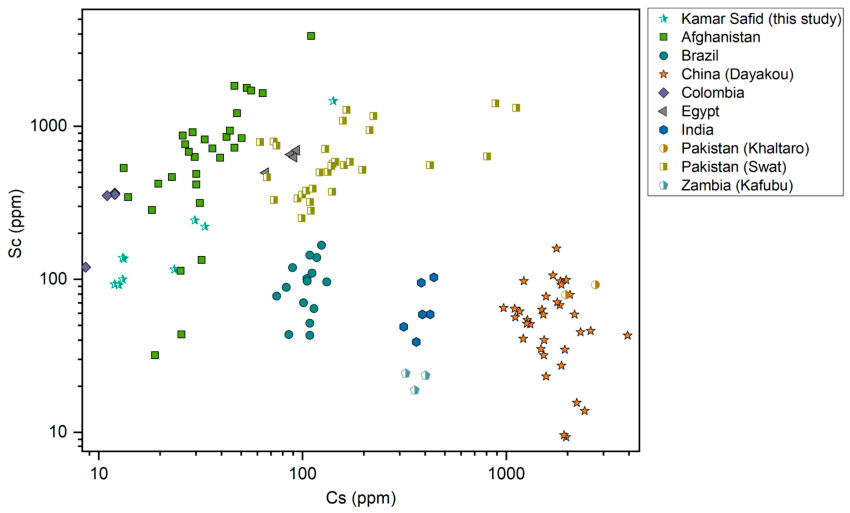
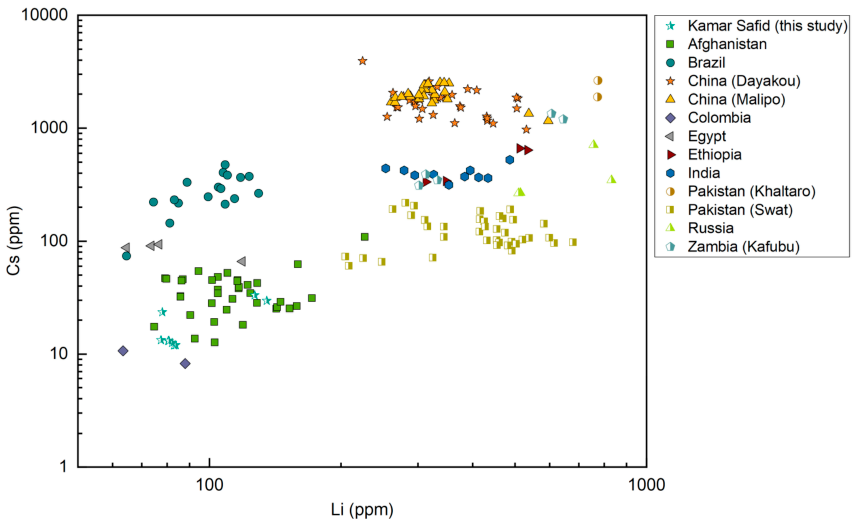
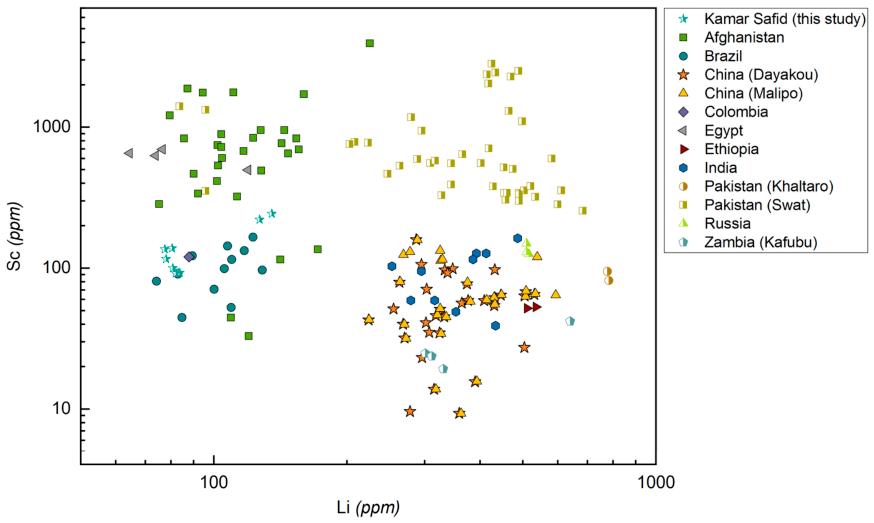
Conventional gemological properties and inclusion characteristics can provide an initial basis for emerald origin determination. For origins with similar features, trace-element composition is useful for further discrimination. Emeralds from different localities show characteristic trace-element enrichment patterns. The LA-ICP-MS trace-element data of Kamar emeralds were compared with those of emeralds from other major localities, including Swat and Khaltaro in Pakistan, Russia, Malipo and Dayakou in China, India, Ethiopia, Kafubu in Zambia, Egypt, Brazil, Colombia, and other Afghan deposits. Four binary log–log plots were selected for comparison: Cs-Rb, Cs-Sc, Li-Cs, and Li-Sc (Figure 14, Figure 15, Figure 16 and Figure 17). In these diagrams, the data points of Kamar emeralds mostly fall within the field of other Afghan emeralds. Only the Li-Sc plot shows a small difference (Figure 17). In most cases, the Kamar samples may be discussed together with other Afghan emeralds as part of a broader Afghan compositional field.
In general, Afghan emeralds are relatively rich in Sc and Rb, and have relatively low Li and Cs contents, with relatively wide ranges of Rb and Sc contents. The plotted fields of Afghan emeralds partly overlap with those from Colombia, Brazil, and Egypt. Even so, different binary plots can help separate them. This indicates that chemical origin determination should be based on the relationships among multiple trace elements rather than on a single element or one diagram alone.
In the gem trade, high-quality Afghan emeralds can look similar to Colombian emeralds in color and crystal forms. Both may contain typical three-phase fluid inclusions, display similar crystal habits, and have comparable contents of the main chromogenic elements. Geochemical discrimination between these two origins is therefore of considerable importance. In the Cs-Rb plot (Figure 14), Afghan emeralds show a clear positive trend, and their data field is well separated from most other localities. Colombian emeralds have distinctly lower Cs (average ~12 ppm) and Rb (average ~2 ppm) contents than emeralds from other localities. This feature can effectively distinguish Colombian emeralds from Afghan emeralds. Egyptian emeralds can also be well separated from Afghan emeralds in this diagram.
In the Cs-Sc plot (Figure 15), Afghan emeralds generally show relatively low Cs contents and a wide range of Sc contents, and can be clearly distinguished from emeralds from China, India, and Zambia. In contrast, Afghan emeralds partially overlap with Colombian and Swat, Pakistan, emeralds. Most Kamar samples still fall within the overall compositional field of Afghan emeralds, but their Sc contents extend toward lower values and approach the compositional field of Brazilian emeralds.
The Li-Cs plot (Figure 16) shows partial overlap between Afghan emeralds and those from Colombia and Egypt. Overall, Pakistani emeralds have higher Li (average ~395 ppm) and Cs (average ~303 ppm) contents than Afghan emeralds. The data fields of the Khaltaro and Swat deposits in Pakistan are also clearly distinct. In this diagram, Swat emeralds are well separated from Afghan emeralds.
In the Li-Sc plot (Figure 17), Afghan and Pakistani emeralds form relatively distinct fields. Their Sc contents are higher than those of most other sources (Afghan emeralds, average ~610 ppm; Pakistani emeralds, average ~822 ppm). However, some Afghan emerald data points overlap with those of Colombian, Egyptian, and Brazilian emeralds. The wide Sc range of Afghan emeralds should also be noted. This is mainly due to the lower Sc contents of Kamar emeralds compared with other Afghan localities. As a result, Kamar emeralds overlap with Colombian and Brazilian emeralds, while emeralds from other Afghan localities mostly overlap with Egyptian emeralds and those from Swat, Pakistan.
Taken together, these four binary diagrams provide complementary information for emerald origin determination. It should be noted that the geographic origin of emeralds should be evaluated using multiple lines of evidence. These binary trace-element relationships alone cannot fully determine the origin, especially because considerable overlap exists among some localities. Therefore, these trace-element relationships should be considered together with conventional gemological properties and inclusion characteristics, rather than regarded as a single criterion for origin determination. Based on the above analysis, several representative origins relevant to the origin determination of Kamar emeralds were selected for comparison. Their main characteristics and useful discrimination criteria are summarized in Table 3.
In addition, the alkali elements in emeralds also deserve attention. Many alkali metal ions can occur in the emerald crystal lattice. Based on the total alkali-metal content (ΣA+ = Li + Na + K + Rb + Cs), previous studies divided emeralds into three groups: low-alkali emeralds (ΣA+ < 10,000 ppm), medium-alkali emeralds (10,000 ppm < ΣA+ < 20,000 ppm), and high-alkali emeralds (ΣA+ > 20,000 ppm) [27]. These studies also showed that the alkali-metal content is closely related to the type of channel water in emerald, and this relation can reflect the formation conditions of the source deposit and can be identified by water-related bands in FTIR spectra.
The LA-ICP-MS data show that the total alkali-metal content of Kamar emeralds ranges from 4903 to14,257 ppm, with an average of about 6760 ppm, among which the average Na+ content is about 6447 ppm. This shows that Na+ is the main alkali-metal ion in Kamar emeralds. Previous studies reported total alkali-metal contents of 4900–16,000 ppm for Afghan emeralds. Compared with low-alkali localities such as Colombia (3000–7300 ppm), the range is markedly higher, but it is still much lower than that of high-alkali localities such as Zimbabwe (~22,900 ppm). Although the range is relatively wide, Afghan emerald is generally categorized as medium-alkali, and Kamar emeralds fall well within this compositional spectrum.

5.2. Correlation Between Chemical Composition and UV-Vis-NIR of Kamar Emeralds

The study of origin-related features in gems usually needs several lines of evidence. Chemical composition and spectral features can support each other. For example, differences in chemical composition are often shown in spectra, and spectral features can also show the presence and relative amount of certain elements or ions. By comparing the LA-ICP-MS data with the UV-Vis-NIR data, the origin-related features of Kamar emeralds can be discussed further.
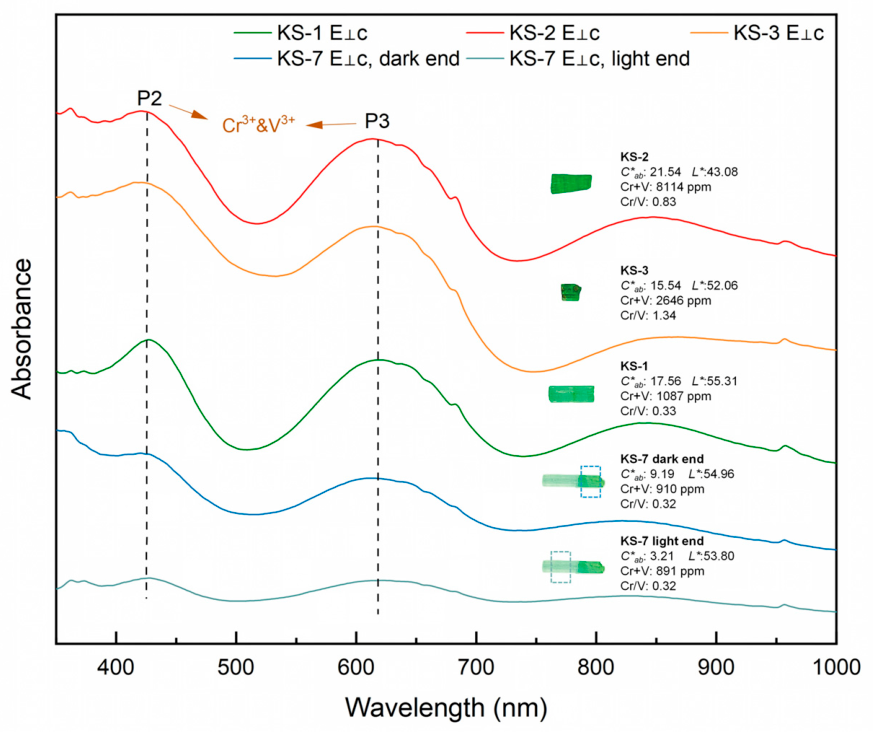
Cr and V are the key elements that give emerald its green to dark green color. Their total contents mainly control the color depth of the crystal, and variations in their relative proportions can also affect the hue. This study compares four samples with distinct color differences, and KS-7 was discussed separately because of the obvious color variation between its two ends. The contents of the main chromogenic elements and the color parameters are listed in Table 4. The color parameters show that KS-2 has the lowest lightness but the highest chroma and color purity among the samples, indicating a darker and more vivid green color. In contrast, the two color zones of KS-7 show clear differences in chroma and excitation purity, while their lightness values are similar. This suggests that the color variation in KS-7 is mainly related to differences in color saturation rather than lightness. In addition, comparison of trace-element data shows that the color differences among these samples are closely related to the contents of Cr, V, and Fe. The total content of chromogenic elements in samples with darker and more vivid colors is generally higher.
The color of Kamar emeralds is controlled by both Cr3+ and V3+. Figure 18 compares the UV-Vis-NIR absorption spectra of different samples, and the main differences occur in the intensity of the Cr3+- and V3+-related absorption bands near 430 and 610 nm. These variations show a clear relationship with the Cr and V contents. Among the samples, KS-2 has the highest total Cr and V contents, corresponding to the strongest Cr3+- and V3+-related absorption bands. It also shows the highest chroma, resulting in a more vivid and deeper green color. In contrast, KS-7 has the lowest total Cr and V contents. Its related absorption bands are significantly weaker, and the spectrum is lower and flatter as a whole. The absorption band intensities of other samples also gradually decrease with decreasing total Cr and V contents. This indicates that the total content of chromogenic elements, especially Cr and V, is the main factor controlling crystal color and UV-Vis-NIR absorption intensity.
The color parameters in Table 3 also show a general relationship between C*ab and L* values and the total Cr and V contents. Higher Cr and V contents generally correspond to higher chroma, lower lightness, and a more saturated and deeper green color. However, this relationship is not completely linear. For example, KS-3 has higher chromogenic-element contents than KS-1 but shows lower chroma. KS-7 has much lower Cr and V contents than KS-1, but its lightness is only slightly lower. Therefore, other factors may also influence the final color expression of Kamar emeralds.
The Cr/V ratio reflects the relative contribution of Cr and V in the chromogenic system of emeralds. KS-3 shows a relatively higher Cr/V ratio, indicating a greater contribution of Cr compared with V. The other samples generally show lower Cr/V ratios, suggesting a relatively higher contribution of V in the chromogenic system. Although the positions of Cr- and V-related absorption bands remain generally consistent among different samples, variations in the Cr/V ratio may affect the relative intensities of these absorption bands and the positions of related absorption centers [26]. These changes can further influence the spectral features and final hue of emeralds. Therefore, the relative contribution of Cr and V is also an important factor affecting the color of emerald crystals.
Fe also affects the color of emeralds. The color contribution of Fe is related to its valence state, lattice site, and total content. Charge transfer between Fe2+ and Fe3+, together with changes in Fe content, can give emeralds a bluish tone. A higher Fe2+ content usually produces a stronger blue tone. This is one feature of Afghan emeralds [18]. Although Fe2+ can affect emerald color, its absorption band is not located in the visible region. Its peak intensity is usually lower than that of Cr3+, so the effect of Fe3+ and Fe2+ on emerald color is much weaker than that of Cr3+ and V3+. However, Fe can still influence the spectral features by affecting the relative intensities of absorption bands.
The relative intensity between the Fe2+-related absorption band ~835 nm (P5) and the Cr3+/V3+-related absorption bands is also an important feature for emerald origin determination. Based on the normalized UV-Vis-NIR spectra of all samples (Figure 19), most Kamar emeralds, represented by KS-1, show the IP5 < IP2 and IP5 < IP3 feature. A weak absorption band related to Fe2+ can be observed near 835 nm. A few samples, such as KS-3, show an extremely weak P5 band that appears only as a weak shoulder. This spectral feature is similar to that of Colombian emeralds, where the P5 band is very weak or even absent [16]. Such differences may be related to the relative contents of Fe, Cr, and V in emerald crystals. Thus, the differences in crystal color and visible absorption intensity among Kamar emeralds are mainly related to the combined effects of Cr and V. Fe mainly acts as a secondary factor that modifies the hue.

5.3. The Relationship Between Inclusions and Ore-Forming Process of Kamar Emeralds

Afghan emeralds commonly contain abundant inclusions. Saeseaw et al. [15] noted that Afghan emeralds commonly contain elongated needle-like and tubular multiphase fluid inclusions that often contain several daughter minerals. This feature can help distinguish Afghan emeralds from those of Colombia and Xinjiang, China, which also contain three-phase inclusions but differ in morphology and internal characteristics. Other studies have also shown that solid inclusions are relatively rare in Afghan emeralds, with the main types including pyrite, limonite, beryl, carbonate minerals, and fluorite, while xenotime has been reported in recent work [28], and well-formed crystalline inclusions remain uncommon [23].
Under magnification, several notable features can be observed in the Kamar emeralds, especially the abundance of fluid inclusions with varied shapes. The solid phases within these inclusions were analyzed in multiple samples, and the carbonate daughter minerals are found to be mainly siderite (FeCO3), with minor ankerite. This mineral assemblage indicates a reducing, CO2-rich ore-forming fluid, in which Fe was mainly present as Fe2+, and the formation temperature was sufficiently high to stabilize carbonate phases [9,12]. In addition, the solid phases in the fluid inclusions show the same composition as the associated siderite, suggesting that during the trapping and sealing of the inclusions, a decrease in temperature and pressure led to the crystallization of daughter minerals identical to the external associated phases. This relationship clearly indicates a common fluid source and further supports that Fe2+ and CO2 were primary characteristics of the ore-forming fluid.
The solid crystalline inclusions are dominated by transparent feldspar-group minerals, which are also commonly observed in the samples. Sample KS-4 serves as a representative example. White translucent siderite is intergrown at one end of this sample, and its composition is identical to that of the solid phase in the fluid inclusions. Several transparent albite crystalline inclusions are additionally present inside the crystal. Dark opaque mineral inclusions are only rarely observed. Moreover, numerous rectangular etch pits are visible on the surfaces of other samples.
The large number of euhedral albite crystals in Kamar emeralds suggests strong albitization of the host rocks during mineralization. This hydrothermal alteration may have been influenced by regional magmatic activity and related acidic-to-intermediate-acidic intrusions, which may have affected the thermal conditions of the hydrothermal system and the composition of the hydrothermal fluids. The hydrothermal fluids moved upward along fractures, and, after strong hydrothermal metasomatism with the host rocks, the pH may have changed greatly [29]. The fluids then evolved into high-salinity, CO2-rich alkaline fluids, which provided a suitable environment for stable emerald growth [9,30]. At the same time, early minerals that were stable in the acidic stage, such as already crystallized albite and even early emerald crystals, became unstable. The fluid dissolved mineral surfaces along crystal defects or cleavage planes. This process formed regular rectangular etch pits. Because the pH was high, CO2 in the fluid mainly occurred as CO32-. It combined with Fe2+, Mg2+, and Ca2+ and formed carbonate minerals such as siderite and ankerite [30]. Emerald mineralization mainly occurred during structurally controlled hydrothermal activity and fluid–rock interaction with the metamorphic host rocks, consistent with the characteristics of Type IIC deposits [12]. In general, the formation of Kamar emeralds was a dynamic and multi-stage process.

6. Conclusions

The gemological properties of Kamar emeralds are generally similar to those of emeralds from other small mining areas in the Panjshir region of Afghanistan. However, they also show some regional characteristics: the crystals are small and are mostly light green to green; they contain many characteristic needle-like and tubular multiphase fluid inclusions; transparent crystalline inclusions are mainly albite, while dark inclusions are rare.
Compared with emeralds from other Afghan localities, Kamar emeralds are obviously lighter in color. In the UV-Vis-NIR spectra of most crystals, the strong Cr3+/V3+-related absorption bands P2 (~430 nm) and P3 (~610 nm) exhibit greater intensity than the Fe2+-related absorption band P5 (~835 nm). This relation is expressed as IP5 < IP2 and IP5 < IP3. This feature indicates that Cr3+ and V3+ are the main chromogenic ions in Kamar emeralds. LA-ICP-MS data show that Kamar emeralds have lower Cr contents and slightly higher V contents than emeralds from other Panjshir mining areas. Their Cr/V ratios are also mainly at the low-to-moderate level within the known range of Panjshir emeralds. This suggests that Kamar emeralds may have a relatively V-enriched chemical signature. Based on the UV-Vis-NIR and the color parameters of some crystals, Kamar emeralds are colored by both Cr and V. In general, the color depth of Kamar emeralds is mainly controlled by the total Cr and V contents, so the low total contents of Cr and V are the main reason for their lighter color. At the same time, the hue differences are related to the Cr/V ratio and the secondary effect of Fe.
FTIR spectra show that type II H2O dominates the channel water in Kamar emeralds. Type II H2O ν1 vibration is commonly observed. The total alkali-metal content ranges from 4900 to 14,200 ppm, indicating that Kamar emeralds belong to the medium-alkali type. Their trace-element composition is characterized by enrichment in Sc and Rb and depletion in Li and Cs. The Sc content is slightly lower than that of emeralds from other Panjshir mining areas. This result also indicates a broad variation in Sc content among Afghan emeralds. Such variation provides a useful basis for distinguishing them from emeralds from Colombia, Egypt, Pakistan, and other localities.
Based on the inclusions and associated minerals, the formation of Kamar emeralds was likely linked to strong albitization. It was also influenced by the Panjshir suture zone and magmatic–hydrothermal activity associated with the Himalayan orogeny. The abundant inclusions in the crystals record multi-stage tectonic–hydrothermal activity during mineralization. However, the exact formation conditions still need further testing, such as fluid-inclusion microthermometry and crystal–chemical analysis.

Author Contributions

Conceptualization, X.-R.T. and X.-Y.Y.; methodology, X.-R.T. and X.-Y.Y.; software, X.-R.T.; validation, X.-R.T. and X.-Y.Y.; formal analysis, X.-R.T. and X.-Y.Y.; investigation, X.-R.T. and X.-Y.Y.; resources, X.-Y.Y.; data curation, X.-R.T.; writing—original draft preparation, X.-R.T.; writing—review and editing, X.-R.T. and X.-Y.Y.; visualization, X.-R.T. and X.-Y.Y.; funding acquisition, X.-Y.Y. All authors have read and agreed to the published version of the manuscript.

Funding

This research was supported by the China Geological Survey Project (grant no. DD20190379-88) and the National Natural Science Foundation of China Project (grant no. 27812022003).

Data Availability Statement

The original contributions presented in this study are included in the article.

Acknowledgments

The authors would like to thank Ru-Jie Wang and Cloud Walker Jewel, Inc. for providing samples and valuable information. Additionally, the authors would like to express their gratitude to Yi Zhang and Yi Guo for their constructive comments and for their support and technical guidance in Raman spectroscopy analyses. The authors also thank Yu-Yu Zheng for guidance in photomicrography, and Guang-Ya Wang and Ying Yan for their assistance in the experimental work. During the preparation of this manuscript, the authors used ChatGPT (GPT-5.6 Sol) and DeepSeek-V4 for language polishing.

Conflicts of Interest

The authors declare no conflicts of interest.

References

  1. Yu, X.Y. Colored Gemology Tutorial, 2nd ed.; Geological Publishing House: Beijing, China, 2016; pp. 152–167. [Google Scholar]
  2. Gao, H. Gemological and Origin Characteristics of Emerald from Afghanistan. Master’s Thesis, Hebei GEO University, Shijiazhuang, China, 2019. [Google Scholar]
  3. Krzemnicki, M.S. New Emerald from Afghanistan. SSEF Facet. 2018, 24, 12–13. [Google Scholar]
  4. Dong, X.; Chen, T.; Zhou, Z.Y. Gemmological and Spectral Characteristics of Emerald from Afghanistan. J. Gems Gemmol. 2023, 25, 17–29. [Google Scholar] [CrossRef]
  5. Wang, L.; Luo, M.; Bai, Y.; Zhang, Q.C. Spectroscopic Characteristics of Afghan Emerald. J. Light Scatt. 2025, 37, 744–750. [Google Scholar] [CrossRef]
  6. Guo, H.S. Comparative Study on Origin Characteristics of Emerald from Afghanistan and Pakistan. Master’s Thesis, China University of Geosciences, Beijing, China, 2021. [Google Scholar]
  7. Krzemnicki, M.S.; Wang, H.A.O.; Büche, S. A New Type of Emerald from Afghanistan’s Panjshir Valley. J. Gemmol. 2021, 37, 474–495. [Google Scholar] [CrossRef] [Scilit]
  8. Chen, Q.L.; Bao, P.J.; Li, Y.; Shen, A.H.; Gao, R.; Bai, Y.L.; Gong, X.; Liu, X.Y. A Research of Emeralds from Panjshir Valley, Afghanistan. Minerals 2023, 13, 63. [Google Scholar] [CrossRef] [Scilit]
  9. Bowersox, G.W. A Status Report on Gemstones from Afghanistan. Gems Gemol. 1985, 21, 192–204. [Google Scholar] [CrossRef] [Scilit]
  10. Fritsch, E.; Rossman, G.R. An Update on Color in Gems. Part 3: Colors Caused by Band Gaps and Physical Phenomena. Gems Gemol. 1988, 24, 81–102. [Google Scholar] [CrossRef] [Scilit]
  11. Montenat, C. The Mesozoic of Afghanistan. GeoArabia 2009, 14, 147–210. [Google Scholar] [CrossRef] [Scilit]
  12. Giuliani, G.; Groat, L.A.; Marshall, D.D.; Fallick, A.E.; Branquet, Y. Emerald Deposits: A Review and Enhanced Classification. Minerals 2019, 9, 105. [Google Scholar] [CrossRef] [Scilit]
  13. Bowersox, G.W.; Snee, L.W.; Foord, E.E.; Seal, R.R., II. Emeralds of the Panjshir Valley, Afghanistan. Gems Gemol. 1991, 27, 26–39. [Google Scholar] [CrossRef] [Scilit]
  14. DeWitt, J.D.; Chirico, P.G.; O’Pry, K.L.; Bergstresser, S.E. Mapping the Extent and Methods of Small-Scale Emerald Mining in the Panjshir Valley, Afghanistan. Geocarto Int. 2022, 37, 246–267. [Google Scholar] [CrossRef] [Scilit]
  15. Saeseaw, S.; Pardieu, V.; Sangsawong, S. Three-Phase Inclusions in Emerald and Their Impact on Origin Determination. Gems Gemol. 2014, 50, 114–132. [Google Scholar] [CrossRef] [Scilit]
  16. Zheng, Y.Y.; Yu, X.Y.; Xu, B.; Guo, H.S.; Yan, Y.; Zhang, Y.; Zhao, S.Y. Review on Identification of Emerald Origin. Acta Petrol. Mineral. 2024, 43, 525–561. [Google Scholar]
  17. Ferrari, A.C.; Robertson, J. Interpretation of Raman spectra of disordered and amorphous carbon. Phys. Rev. B 2000, 61, 14095–14107. [Google Scholar] [CrossRef] [Scilit]
  18. Saeseaw, S.; Renfro, N.D.; Palke, A.C.; Sun, Z.; McClure, S.F. Geographic Origin Determination of Emerald. Gems Gemol. 2019, 55, 614–646. [Google Scholar] [CrossRef] [Scilit]
  19. Johnson, M.L.; Elen, S.; Muhlmeister, S. On the Identification of Various Emerald Filling Substances. Gems Gemmol. 1999, 35, 82–107. [Google Scholar] [CrossRef] [Scilit]
  20. Wood, D.L.; Nassau, K. The Characterization of Beryl and Emerald by Visible and Infrared Absorption Spectroscopy. Am. Mineral. 1968, 53, 777–800. [Google Scholar]
  21. Abduriyim, A.; Kitawaki, H. Applications of Laser Ablation—Inductively Coupled Plasma—Mass Spectrometry (LA-ICP-MS) to Gemology. Gems Gemol. 2006, 42, 98–118. [Google Scholar] [CrossRef] [Scilit]
  22. Sun, Z.; Jollands, M.; Palke, A.C. Chemical Analysis in the Gemological Laboratory: XRF and LA-ICP-MS. Gems Gemol. 2025, 60, 536–559. [Google Scholar] [CrossRef] [Scilit]
  23. Zheng, Y.Y. Channel Water Spectral Characteristics and Origin Tracing of Emerald from Dayakou, Yunnan. Master’s Thesis, China University of Geosciences, Beijing, China, 2020. [Google Scholar]
  24. Hainschwang, T.; Notari, F. Standards and Protocols for Emerald Analysis in Gem Testing Laboratories. InColor 2015, (Special Issue), 106–114. [Google Scholar]
  25. Aurisicchio, C.; Conte, A.M.; Medeghini, L.; Ottolini, L.; De Vito, C. Major and Trace Element Geochemistry of Emerald from Several Deposits: Implications for Genetic Models and Classification Schemes. Ore Geol. Rev. 2018, 94, 351–366. [Google Scholar] [CrossRef] [Scilit]
  26. Qin, L.J.; Yu, X.Y.; Guo, H.S. Fluid Inclusion and Chemical Composition Characteristics of Emeralds from Rajasthan Area, India. Minerals 2022, 12, 641. [Google Scholar] [CrossRef] [Scilit]
  27. Karampelas, S.; Al-Shaybani, B.; Mohamed, F.; Sangsawong, S.; Al-Alawi, A. Emeralds from the Most Important Occurrences: Chemical and Spectroscopic Data. Minerals 2019, 9, 561. [Google Scholar] [CrossRef] [Scilit]
  28. Sun, X.; Gao, Y.; Sun, J. Gem Notes: Emerald from Afghanistan with Xenotime-(Y) Inclusion. J. Gemmol. 2024, 39, 105–106. [Google Scholar]
  29. Smith, D.J.; Naden, J.; Jenkin, G.R.T.; Keith, M. Hydrothermal alteration and fluid pH in alkaline-hosted epithermal systems. Ore Geol. Rev. 2017, 89, 772–779. [Google Scholar] [CrossRef] [Scilit]
  30. Ding, X.; Harlov, D.E.; Chen, B.; Sun, W. Fluids, Metals, and Mineral/Ore Deposits. Geofluids 2018, 2018, 1452409. [Google Scholar] [CrossRef] [Scilit]
Figure 2. The 12 Kamar Safid, Afghanistan, emerald samples for this study.
Minerals 16 00865 g002
Figure 3. Color zoning (a) and hexagonal concentric growth bands (b) are visible in crystal cross-sections of sample KS-6.
Minerals 16 00865 g003
Figure 4. Surface features of Kamar emeralds: (a) longitudinal striations on crystal faces (KS-5); (b) yellowish brown fracture fillings on the surface (KS-3); (c) jagged marginal growth layers (KS-2); (d) groups of rectangular etch pits (KS-7); (e) white translucent associated minerals at crystal terminations (KS-4); (f) crystal intergrowth (KS-6).
Minerals 16 00865 g004
Figure 5. White translucent associated mineral at the crystal termination of sample KS-4 (a) and its Raman spectrum, identified as siderite (b). The blue cross indicates the Raman analysis point.
Minerals 16 00865 g005
Figure 6. Variously shaped fluid inclusions in Kamar emeralds.
Minerals 16 00865 g006
Figure 7. Kamar emeralds contain abundant multiphase fluid inclusions: (a) typical elongated needle-like three-phase fluid inclusion containing several transparent square daughter crystals; (b) tubular fluid inclusion; (c) empty tubes arranged parallel to the c-axis; (d) rectangular three-phase fluid inclusion showing two types of square crystals of different sizes, with the gas bubble compressed by the positions of the crystals; (e) “necked-down” multiphase fluid inclusion, with the shape of the gas bubble affected by the inclusion morphology and the positions of other phases; and (f) group of jagged multiphase fluid inclusions.
Minerals 16 00865 g007
Figure 8. Three-phase fluid inclusions and Raman spectra of the individual phases. (a) Photomicrograph. (b) Raman spectra of the individual phases. Due to the extremely weak Raman activity of halides and the difficulty of detecting liquid-phase signals effectively, only Raman peaks from the emerald matrix were observed.
Minerals 16 00865 g008
Figure 9. Transparent crystalline mineral inclusions and their Raman spectra. The colored crosses indicate the Raman analysis points. (a,b) Pseudo-hexagonal platy albite inclusions. (c,d) Irregular elongated feldspar-group mineral inclusions, which are not single homogeneous mineral phases but alkali-feldspar exsolution intergrowths.
Minerals 16 00865 g009
Figure 10. (a) Black flocculent amorphous carbon in sample KS-2 and (b) its Raman spectrum. The yellowish-brown cross indicates the Raman analysis point.
Minerals 16 00865 g010
Figure 11. (a,b) Black secondary fissures. (c) Gas–liquid inclusions filling fractures and healed fissures. (d) Growth color zoning.
Minerals 16 00865 g011
Figure 12. UV-Vis-NIR absorption spectra of sample KS-1 measured in different crystallographic directions.
Minerals 16 00865 g012
Figure 13. FTIR spectra of Kamar emeralds. The spectra are vertically offset for clarity.
Minerals 16 00865 g013
Figure 14. Cs-Rb log–log plot for Kamar emeralds and other important worldwide localities. Sources of data: [6,18,23,24,25,26].
Minerals 16 00865 g014
Figure 15. Cs-Sc log–log plot for Kamar emeralds and other important worldwide localities. Sources as in Figure 14.
Minerals 16 00865 g015
Figure 16. Li-Cs log–log plot for Kamar emeralds and other important worldwide localities. Sources as in Figure 14.
Minerals 16 00865 g016
Figure 17. Li-Sc log–log plot for Kamar emeralds and other important worldwide localities. Sources as in Figure 14.
Minerals 16 00865 g017
Figure 18. Comparison of UV-Vis-NIR absorption-band intensities for different samples. The spectra are vertically offset for clarity.
Minerals 16 00865 g018
Figure 19. Comparison of normalized UV-Vis-NIR absorption spectra of samples KS-1 and KS-3.
Minerals 16 00865 g019
Table 1. Gemological properties of Kamar emeralds.
PropertiesResults
ColorLight green or bluish-green to green
ClaritySlightly to heavily included
Refractive indicesNo = 1.581–1.585; Ne = 1.572–1.577
Birefringence0.006–0.010
Specific gravity2.67–2.88
PleochroismGreen (o-ray) and bluish-green (e-ray)
FluorescenceInert, locally moderate bluish-green (oil-filled)
Visible spectrumDistinct lines at ~680 nm, with partial absorption between 580 and 630 nm and complete absorption < 450 nm.
Chelsea filterPinkish Red
Internal featuresAbundant three-phase fluid inclusions occur in clusters parallel to the crystal long axis, showing needle-like, tubular, jagged, or irregular forms;
Yellowish-brown material fills fractures;
Transparent colorless inclusions are common, while dark opaque inclusions are rare;
Growth color bands are distributed parallel to the crystal long axis, and concentric growth zones and color bands are visible in cross-section.
Table 2. Chemical composition of emerald from Kamar Safid by LA-ICP-MS (ppm).
SampleKS-1KS-2KS-3KS-7
(Light End)
KS-7
(Dark End)
Average
Li78–8146–78127–1358381–8288
Be75,417–75,14771,052–72,76372,605–73,06271,486–72,43571,954–72,68772,861
B2–33–42–322–33
Na5164–53416136–13,8147337–77054452–47604707–50586447
Mg5283–55935349–14,9137988–84824454–48454697–50736668
Al129,520–130,398103,791–123,890125,488–125,954129,035–131,248130,133–130,382125,984
P47–6630–3250–5143–4543–4545
K92–93234 –455260–3307695–102181
Ca227–310263–604168–227168–1941544–208252
Sc136–138116–1461221–2439392–100269
Ti68–7171–7871–7469–7168–7271
V798–8321350–75331127–1130665–678679–7081550
Cr262–2802501–48441475–1560213–225215–2181179
Mn26–542228
Fe1398–14323652–39781029–12331247–13711308–13921804
Co0.03–0.04bdl–0.030.05–0.08bdl–0.03bdl–0.03bdl
Znbdlbdl–6.27bdlbdlbdlbdl
Ga24.3–25.028.1–40.222.0–21.919.4–21.120.7–21.324.4
Rb7.3–7.720.7–21.120.8–24.36.4–6.26.4–6.612.7
Cs13.1–13.323.5–141.629.6–33.211.9–12.012.6–13.130.4
bdl = below detection limit.
Table 3. Comparison of key characteristics of Kamar emeralds and selected origins.
OriginInclusion CharacteristicsTrace-Element CharacteristicsKey Discrimination Points
Kamar Safid,
Afghanistan
Abundant needle-like and tubular multiphase inclusions; feldspar-group inclusions common.Relatively low total Cr + V and Cr/V; relatively rich in Rb and Sc and poor in Li and Cs.Overall, within the Afghan compositional field, total Cr + V and Cr/V are relatively low within Afghan emeralds. Sc is also lower than in other Afghan emeralds, causing partial overlap with Brazilian and Colombian emeralds.
Other Panjshir,
Afghanistan
Abundant needle-like, tubular, and irregular multiphase fluid inclusions; mineral inclusions are less common and include pyrite, carbonate minerals, feldspar, and limonite.Relatively high Sc; relatively rich in Rb and poor in Li and Cs.Higher total Cr + V, Cr/V, and generally higher Sc than Kamar; substantial compositional overlap remains.
ColombiaJagged three-phase fluid inclusions are characteristic; carbonate and black-shale-related mineral inclusions may occur.Generally low Rb and Cs.Cs–Rb is useful for separation; partial overlap remains in some other plots.
Swat,
Pakistan
Two-phase fluid inclusions are common, often along healed fissures; three-phase inclusions are less common; mineral inclusions are abundant.Relatively high Sc, Li, Mg, Fe, and Cr.Partly overlaps with Afghan emeralds; Li–Cs and Li–Sc provide useful discrimination.
Note: Kamar Safid data are from this study; characteristics of other origins are from Zheng et al. [16], and discrimination points are based on this study.
Table 4. Color parameters and chromophore concentrations of KS-1–KS-3 and KS-7. The element contents are given as average values.
SampleDominant Wavelength,
λd/nm
Lightness,
L*
Chroma,
C*ab
Excitation Purity,
pe/%
Cr/ppmV/ppmFe/ppmCr+V/ppmCr/V
KS-1 (E⊥c)521.8555.3117.567.47271816141510870.33
KS-2 (E⊥c)528.3143.0821.549.8336734441381581140.83
KS-3 (E⊥c)549.1252.0615.5411.7615181128113126461.34
KS-7 (E⊥c, dark end)533.7254.969.194.5621769313549100.32
KS-7 (E⊥c, light end)544.6153.803.212.0221967213098910.32
Disclaimer/Publisher’s Note: The statements, opinions and data contained in all publications are solely those of the individual author(s) and contributor(s) and not of MDPI and/or the editor(s). MDPI and/or the editor(s) disclaim responsibility for any injury to people or property resulting from any ideas, methods, instructions or products referred to in the content.