Review

Handheld Laser-Induced Breakdown Spectroscopy (LIBS) in the Exploration of Critical Metals: Recent Advancements and Challenges


CSIR-National Geophysical Research Institute (NGRI), Hyderabad 500007, India
Minerals 2026, 16(7), 757; https://doi.org/10.3390/min16070757
Submission received: 9 May 2026 / Revised: 29 June 2026 / Accepted: 11 July 2026 / Published: 20 July 2026
(This article belongs to the Section Mineral Exploration Methods and Applications)

Abstract

Handheld Laser-Induced Breakdown Spectrometry (hLIBS) is capable of simultaneous multi-element analysis of a variety of geological materials such as rocks, minerals, ores, soils, sediments, and water. This is a transformative analytical technology that is currently revolutionizing the field of critical mineral exploration studies. By providing real-time, in situ elemental analysis in the field with detection and quantitative determination capabilities for light elements (such as Li, Be, and B), where other handheld techniques like portable XRF struggle, hLIBS empowers geologists to make faster and more informed decisions in the field, significantly accelerating the exploration process from prospecting to target delineation. Several important practical examples of the exploration of critical metals, such as lithium, rare earth elements, copper, cobalt, and titanium, are presented. In particular, the detection capability of indicator minerals and pathfinding elements by hLIBS is extremely valuable for critical mineral exploration studies. Similar instruments have also been successfully used in recent years in challenging environments like space and deep-sea environments. The capability of remotely operated miniature LIBS in hostile environments such as the deep sea, Moon, and Mars is discussed with examples. LIBS has become a key technology for in situ chemical analysis in both space and deep-sea exploration because of its ability to identify elemental composition rapidly and without physical contact.

1. Introduction

Critical minerals are the physical foundation of the green energy transition, making technologies like electric vehicles (EVs), solar panels, and wind turbines possible. These clean energy technologies are far more mineral-intensive than their fossil-fuel counterparts. This makes critical minerals/metals such as Li, Co, Ni, Cu, and the rare earth elements (REEs) indispensable for the transition to a sustainable, decarbonized future. Ultimately, the success of the global energy transition depends not just on innovation in clean energy but on a fundamental reimagining of how we source, use, and reuse the critical metals that make it all possible [1,2,3]. Table 1 presents the role of some important critical metals/minerals used in the energy transition. The rapid, large-scale deployment of technologies such as electric vehicles (EVs), renewable energy infrastructure, and battery storage would not be possible without a secure supply of these materials. To achieve strategic autonomy in critical minerals, there is a great need to strengthen the exploration efforts by deploying state-of-the-art analytical equipment, including portable analytical tools, and related infrastructural facilities in addition to the traditional methods with sufficiently skilled manpower [4].
Certainly, laboratory instruments such as atomic absorption spectrometry (AAS), X-ray fluorescence spectrometry (XRF), inductively coupled plasma optical emission spectrometry (ICP-OES), microwave plasma atomic emission spectrometry (MP-AES), and inductively coupled plasma mass spectrometry (ICP-MS) in geochemical laboratories will stand the best to provide high-quality data with very good precision and accuracy [5,6,7,8,9]. However, they are expensive to buy and to maintain, and take time to provide data because of the requirement of sample transport, extensive sample preparation, and long analysis time. On the other hand, handheld or portable analytical techniques are preferred in mineral exploration primarily because they offer rapid, non-destructive, real-time analysis of geological materials such as rocks, soils, and ores, saving time and reducing costs, minimizing further return trips to the field site. This will dramatically reduce turnaround times, enabling immediate on-site decisions that save significant time and money. While they are less precise than laboratory methods, they are indispensable for screening and selecting some important samples for more precise analysis using laboratory analytical techniques, and thus, they guide the exploration campaigns and enable geologists to make more informed decisions while still in the field.
Handheld techniques like portable XRF (pXRF), handheld laser-induced breakdown spectrometer (hLIBS), handheld Raman spectrometer, handheld gamma-ray spectrometer, and handheld LED fluorimeter, and land, drone, and satellite-based hyperspectral and multispectral remote sensing techniques have dramatically improved the exploration scenario for critical minerals in recent years because of their ability to provide rapid, in situ near-real-time analysis of geological materials, which directly addresses several key challenges in modern exploration [10,11,12,13,14,15]. Portable XRF provides rapid, real-time elemental analysis in the field. Still, it has significant limitations, including poor detection of light elements, vulnerability to matrix effects such as moisture and surface roughness, and a shallow depth of analysis.
Table 1. Role of the important critical metals/minerals used in the energy transition.
Metals/MineralsPrimary UseReference
LiLi-ion batteries, energy storage systems[16]
NiLi-ion batteries[17]
CoLi-ion batterie[18]
Nd, Pr, Dy, Sm, etc.Permanent magnets [19,20]
Eu, Tb, Y, and CeLED lighting[21]
CuElectrical wiring, motors, electrical grid infrastructure, Li-ion batteries[22]
AgSolar photovoltaics, solar panels[23]
SiSolar photovoltaics[24]
AlElectric vehicle frames, solar panels[25]
GraphiteLi-ion batteries[26]
TiSolar energy, water purification, and carbon capture. [27]
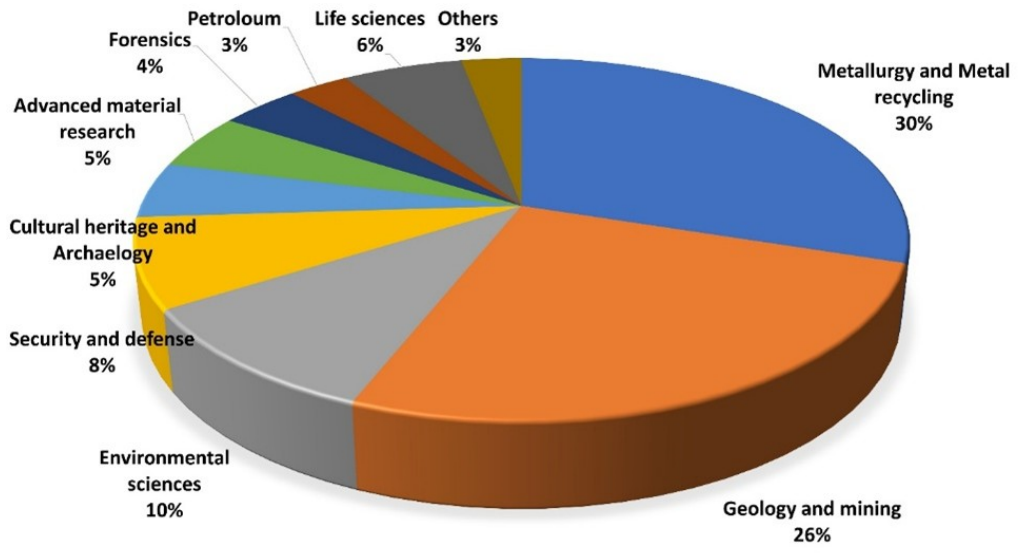
Currently, handheld LIBS has become a significant analytical tool in critical mineral exploration programs due to its speed, portability, and ability to detect both metals and light, some non-metallic elements in geological samples [28,29,30,31]. Its primary role is to provide real-time, on-site elemental data to accelerate decision-making, reduce exploration costs, and improve the efficiency of drilling programs [32]. In addition, hLIBS overcomes key limitations of pXRF by efficiently detecting lighter elements such as C, Li, and Be. This makes LIBS highly complementary to XRF, especially in metal sorting and aerospace quality control, in addition to lithium exploration. Thus, the hLIBS instrument has made an excellent stride in mineral exploration, both in general and in the exploration of critical minerals, with significant advantages, including in situ, non-contact, non-destructive, and in real-time determinations in the field itself. There is no need to bring the samples to the laboratory [33]. This period also saw important advancements in the technique, such as more compact designs, powerful lasers, spectrometer design with improved spectral resolution, and more sensitive detectors. Application of hLIBS in diverse fields such as R&D, analysis of gemstones, meteorites, rocks, soils, metal extraction, industry, recycling of e-waste and mine waste, space science, archaeology, analysis of different types of catalyst samples, pharmaceuticals, medical applications, environmental studies, in addition to mineral exploration, and mining [34] (Figure 1).
In this review, the recent advancements in hLIBS and its utility in the exploration of critical metals such as lithium, REEs, copper, cobalt, and titanium during the last two decades are presented. This comprehensive review aims to provide a clear overview of the utility of this extraordinary analytical tool in the exploration of critical minerals, and also its value in challenging environments such as deep-sea and space.

2. Basic Principles of LIBS and Its Historical Development

Laser-induced breakdown spectroscopy (LIBS) has evolved from a basic physics concept into a versatile analytical tool. After a period of basic plasma research, a breakthrough occurred in 1981 when Leon Radziemski, David Cremers, and their team at Los Alamos National Laboratory officially revolutionized LIBS research and its application. Radziemski and Cremers [35] furnished the historical developments and further advancements in LIBS technology and instrumentation over the past 50 years.

2.1. Laboratory LIBS Instrument

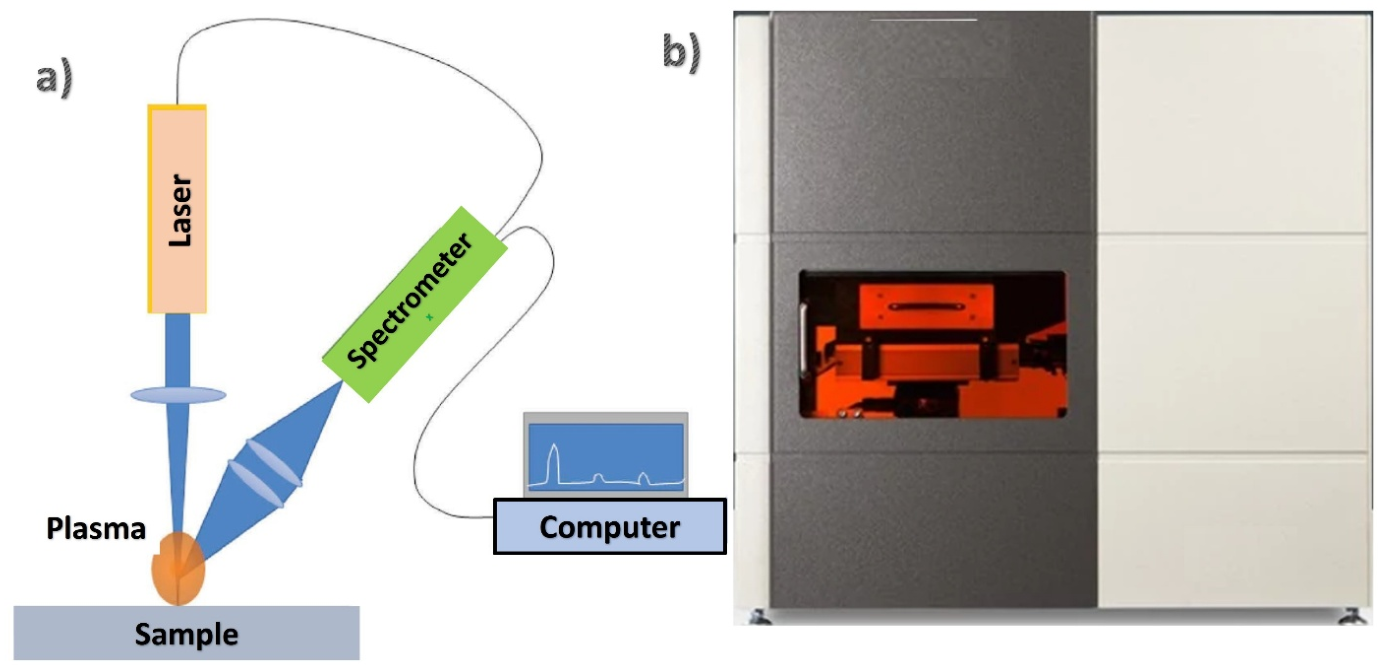
The credit for the invention of LIBS cannot be given to a single inventor. Shortly after the invention of the laser in 1960 by Theodore Maiman [36], Debras-Guédon and Liodec [37] were the first to demonstrate the analytical use of laser-induced breakdown spectroscopy (LIBS) for the spectrochemical analysis of surfaces. The first analytical applications of laser-induced plasma on surfaces were demonstrated by Brech and Cross in 1962 [38]. Several elements could not be detected due to the lower sensitivity in the UV region, as well as due to the intense continuum background emission. However, it was Runge et al. [39] who published the first calibration plots and determined Cr and Ni in steel standards using a pulsed laser source. The Pioneers: Leon Radziemski, David Cremers, and their team at Los Alamos National Laboratory revolutionized LIBS. They formally coined the acronym LIBS in two seminal 1981 papers, and their work laid the groundwork for nearly all modern applications [7,40,41]. The first commercial instruments became available in the 1990s. LIBS can analyse any state of matter (solid, liquid, and gaseous). There are four different categories of LIBS instruments: laboratory-based, online, handheld, and telescopic [42]. The principles of a bench-top LIBS instrument are presented in Figure 2.

2.2. Handheld LIBS Instrument

The handheld LIBS instrument (hLIBS) has evolved into a sophisticated, field-deployable analytical technique, driven by advancements in laser technology, detection systems, and data processing. The most common short form for handheld laser-induced breakdown spectroscopy is hLIBS, and hence this acronym is used hereafter. hLIBS instruments can be differentiated as either person-portable or transportable systems based upon whether the instrument is battery-operated, fits into a suitcase or backpack, and can be used by a single person. The handheld versions were available after 2010. The handheld LIBS wins on convenience for rapid, in situ screening. These instruments are rugged, simple to use, and provide actionable data in seconds with minimal sample preparation. Portable systems, though bulkier, are often built as custom prototypes for specialized research applications, offering the flexibility to be tailored to specific, complex analytical tasks. Before 2013, true LIBS was confined to bulky laboratory setups. The first field-portable systems developed were backpack or suitcase-sized units connected by cables. These were mobile but not yet “handheld.” In 2013, Lasersec Systems (Finland) released the world’s first commercial handheld LIBS analyser (https://analyticalscience.wiley.com/content/news-do/lasersec-releases-world-s-first-handheld-libs-elemental-analyzer, accessed on 1 July 2026). During 2015 and 2016, other key manufacturers also entered the market, pushing performance boundaries. The period from 2021 to the present focused on achieving laboratory-grade performance in a rugged, field-ready form. Lasers shifted from bulky Nd: YAG to compact diode-pumped solid-state (DPSS), microchip, and fibre lasers, enabling higher repetition rates and smaller footprints. Advanced miniaturized high-resolution spectrometers and simplified optical paths were introduced for precise wavelength separation within a confined space. Laser energy increased significantly, and the spectral range expanded into the vacuum UV region, which is essential for detecting light elements like carbon, sulphur, and phosphorus. Huang et al. [44] described an overview of the development of handheld LIBS and its applications. Figure 3 explains the principle of hLIBS.

2.3. Instrumentation and Principles of LIBS Operation

The whole LIBS system (both laboratory and handheld) can be divided into three parts: (i) laser and optics, (ii) plasma generation, signal collection, and (iii) data processing and analysis (Figure 2 and Figure 3).

2.3.1. Laser and Optics

A high-power, pulsed laser, very often a neodymium-doped yttrium aluminium garnet (Nd: YAG) laser (that generates approximately 5–7 mJ/pulse in 2 ns pulses) is focused through an optical window onto the sample surface, creating a micro-plasma with temperatures exceeding 10,000 K. The broadband LIBS emission spectrum covers all elements from lithium to uranium due to detector response in the 200 to 980 nm range with 0.1 nm spectral resolution [45].

2.3.2. Plasma Generation and Signal Collection

The technique creates a “spectral fingerprint” by analysing the light emitted by a plasma plume generated from a target sample, allowing for the identification of its elemental composition. Detectors used in LIBS, in general, are advanced, miniaturized charge-coupled devices (CCDs) and complementary metal-oxide-semiconductor (CMOS) sensors (Figure 2 and Figure 3). These detectors are integrated into a spectrometer, where they measure the light emitted by different excited atoms and ions in the sample [43,46,47].

2.3.3. Data Processing and Analysis

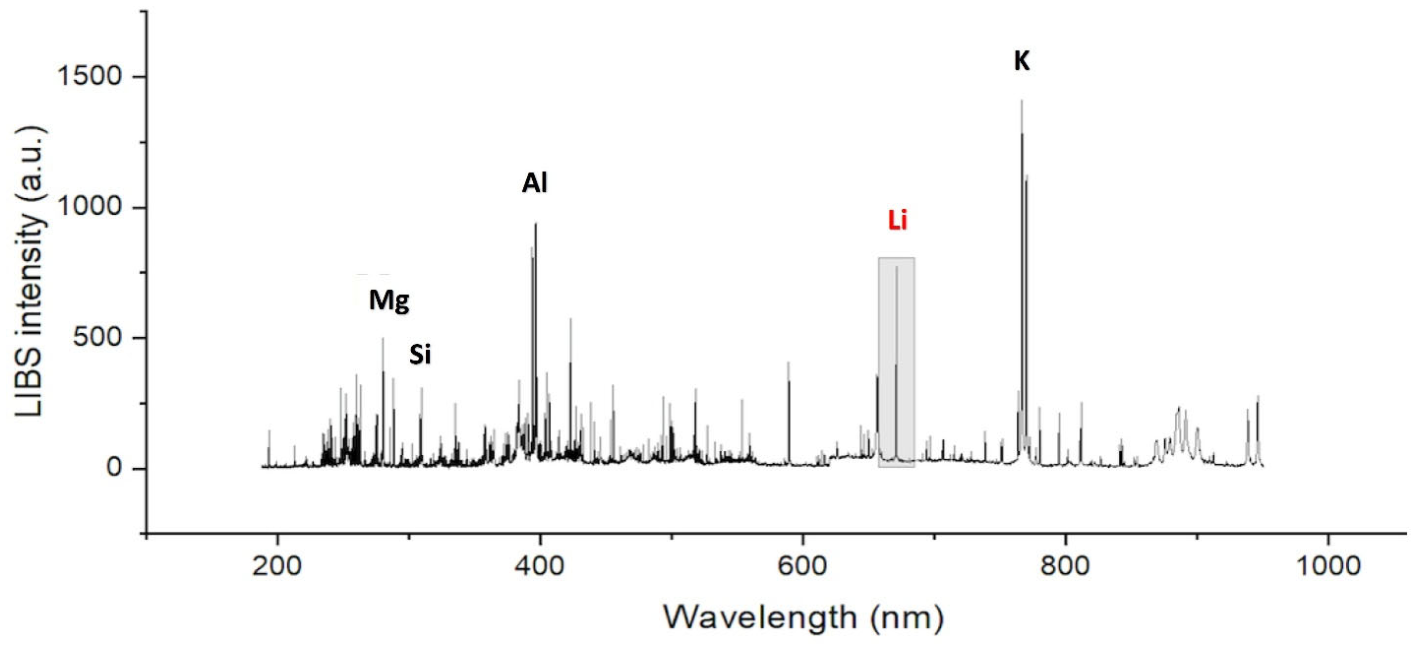
By identifying the characteristic emission lines (peaks at specific wavelengths) in the spectrum and comparing them to known spectral libraries, qualitative and quantitative analysis can be carried out as the intensity of a spectral line is related to the concentration of that element in the sample. A broadband LIBS spectrum with specific emission lines of some elements like Mg, Si, Al, and K, together with that of Li at 610.79 nm, of a metamorphic rock is shown in Figure 4.

3. Comparison Between Laboratory LIBS and Handheld LIBS

While the core technology is the same, choosing between a laboratory LIBS and a handheld LIBS is actually a trade-off between uncompromised performance and ultimate portability. A laboratory system’s high-powered laser produces a hotter, more luminous plasma, resulting in stronger signals for detecting trace elements. Conversely, a handheld device’s low-energy pulse generates a weaker signal, making trace analysis more difficult for elements present in low concentrations, as the handheld system uses less expensive and less sophisticated laser and detector components [50]. A laboratory spectrometer’s high-resolution capability provides a detailed “fingerprint” of a complex alloy or a material such as a rock. A laboratory LIBS uses a controlled, stable environment and precise timing, ensuring consistent results. On the other hand, handheld devices are more sensitive to changes in the sample surface and environment, leading to signal variation and lower precision for quantitative work. Table 2 presents the important differences between laboratory LIBS and handheld LIBS.

4. Performance Characteristics of HLIBS

Handheld LIBS systems represent a trade-off between the performance of a laboratory instrument and a handheld unit used in the field. For mineral exploration, the unique ability to detect critical elements such as Li, Be, and REEs in the field often outweighs its quantitative limitations, making it an important tool in the exploration toolkit alongside portable XRF (pXRF) and laboratory analytical instruments, such as ICP-MS and ICP-OES. Handheld LIBS offers a broad elemental range from Li to U. Its unique capability to detect light elements, such as Li, Be, B, C, etc., is difficult for handheld XRF (Table 3).
Table 3. Detection limits (µg/g) obtainable by pLIBS for some important critical metals including lithium and rare earth elements in comparison with those obtainable by pXRF.
ElementhLIBS [51]hLIBS * [52]pXRF [53]pXRF [54]
Li0.10.71
Be0.10.12
Mg0.021.32
Al11.18
Si0.52.48
P200.03
Sc0.26.9
Ti0.20.27<10
V168<10
Cr130<10
Mn0.2251<10
Co25.428<10
Ni221
Cu0.12417<10
Zn11811<5
Ga12.8
Ge10.007
As100.11<5
Se506.9
W1014<10
Y0.57.1<5
In50.001
La110
Ce524
Pr21.6
Nd15.2
Sm510
Eu0.50.14
Gd220
Tb10.11
Dy10.80
Ho0.10.23
Er10.62
Tm0.50.02
Yb0.10.43
Lu0.10.05
U0.50.22
* LIBS instrument built with 2D CCD detectors used by SuperCam on the Perseverance rover [55], – not available.

4.1. Detection Limits Obtainable by hLIBS

Detection limits for handheld LIBS vary significantly with the element, sample matrix, sample preparation, and instrumental factors. A flat, fresh sample surface yields the best results, whereas a rough surface scatters laser energy and reduces sensitivity. Higher-resolution spectrometers and controlled argon purge can improve the limits of detection. The detection limit also depends on the chosen emission line. For example, for lithium, the primary line is at 670.776 nm, which is strong and relatively free of interference, though in some matrices, iron or calcium lines can cause spectral overlap. Typical detection limits for handheld LIBS will be in µg/g range (Table 3). Usually, the detection limits cannot be compared as it depends on the laser spot, the measurement time, and a few other aspects, such as the matrix and the environment. A close look at these comparative detection limits of both techniques reveals that hLIBS offers lower detection limits on light elements. The pXRF offers better detection limits on heavy elements in general. A close look at the detection limits of hLIBS shows two sets of data in the literature that are greatly variable, especially for the elements concerned in this study. In general, the detection limits depend on sample preparation, sample matrix, measurement time, spot size, depth of analysis, instrument design, and the type of detector. For the most comprehensive field analysis, both hLIBS and pXRF techniques are highly complementary. But the detection power offered by hLIBS is sufficient in many exploration programmes. For some trace critical metals like certain REEs, detection limits may not be low enough to detect background concentrations, though they are sufficient for detecting ore-grade mineralization.

4.2. Mineral Analysis

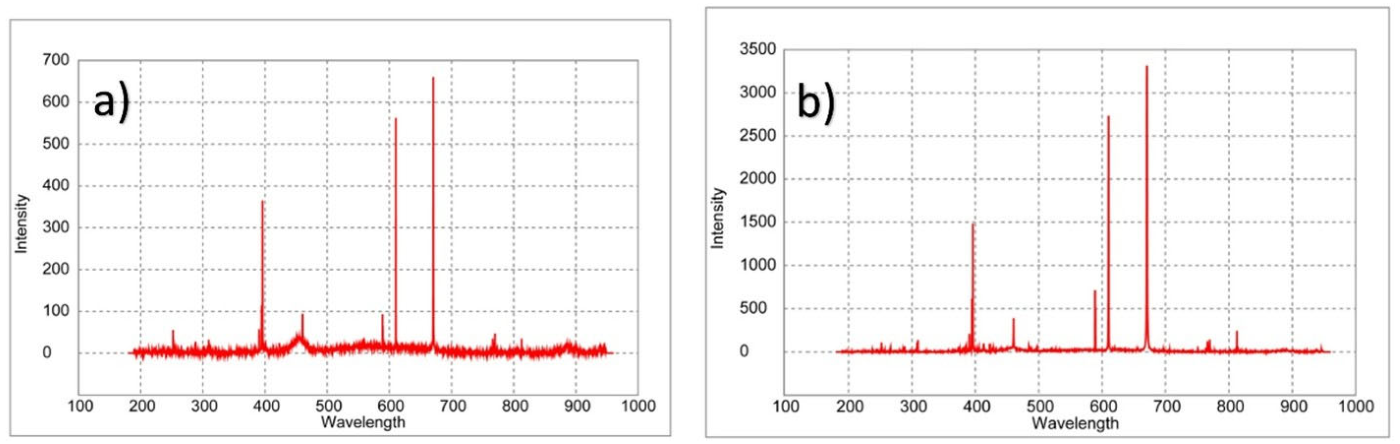
Handheld LIBS can analyse all those mineral groups such as oxides, silicates, sulphates, carbonates, sulphides, and phosphates, but with varying degrees of effectiveness and different primary purposes. This feature is particularly valuable in the field for the identification of ore grades. It can be used as a screening tool, and not a replacement for a pXRD or handheld Raman spectrometer [23,56]. An LIBS spectrum obtained from a mineral sample reflects the nature, structure, and proportions of the elements it contains, generating a unique spectral fingerprint for each mineral. For example, Figure 5 presents a couple of hLIBS spectra of lithium minerals. Usually, commercial hLIBS instruments contain thousands of reference LIBS spectra for several mineral species, including oxides, silicates, sulphides, sulphates, carbonates, and phosphates [48,57]. The spectrum of a mineral sample is compared to the spectra available in the instrument software library to identify that particular mineral. Some studies have demonstrated that qualitative LIBS spectral data can be processed using open-source machine learning tools to distinguish features such as Cr-diopside, kelyphite rims on pyrope garnet, and calcite veinlets and primary mantle mineralogy [58]. Table 4 presents some important strengths and limitations of hLIBS in the analysis of minerals.

4.3. Isotopic Analysis Capability of hLIBS

Isotopic analysis by hLIBS is a challenging but rapidly advancing frontier in analytical chemistry and in field-deployable instrumentation. Distinguishing between different isotopes of the same element (e.g., 6Li vs. 7Li) is possible because, though isotopes have nearly identical chemical properties, they have different nuclear masses, leading to tiny shifts in their atomic emission lines called isotope shifts [60,61]. These isotope shifts are very small, often in the picometers range, and it is challenging to identify these spectral shifts because a typical handheld spectrometer has a resolution of ~0.1 nm (100 picometers). However, only laboratory LIBS instruments with larger spectrometers with higher resolution (e.g., ~0.02 nm or 20 picometers) can get closer to resolving shifts for specific elements like Li, B, or U. By mapping, for instance, the gradient of δ7Li across a Salar or a pegmatite swarm, exploration teams can vector directly toward the most fertile fluid pathways or alteration zones, dramatically reducing the time and cost of discovery. A handheld LIBS instrument for isotopic analysis is a powerful but indirect screening tool, not a definitive quantitative technique. Because spectral resolution (~0.1 nm) on typical handheld systems is too broad to resolve picometer-scale isotope shifts, handheld systems bypass this hardware bottleneck using chemometrics. By coupling partial least squares (PLS) algorithms with high-resolution hardware, these analysers extract isotopic ratios (e.g., 6Li/7Li or 235U/238U) even when peaks overlap [62]. Its value lies in its speed, portability, and ability to provide real-time, in situ spatial maps of isotopic variation. Using an hLIBS with a modest resolving power, these authors detected 6Li within a 95% confidence interval in minutes to an hour, hinting at the direct applications for geological exploration. However, isotopic Li analysis is already extremely hard, even with the most advanced commercial laboratory LIBS instrument. Recently, Morris and Patnaik [63] used a high-resolution Trivista-777 spectrometer in the three-stage configuration, using consecutive dispersion gratings of 1800 g/mm, 1800 g/mm, and 1200 g/mm, which provided a final resolution of approximately 8 pm when combined with an intensified charge-couple device (ICCD) detector, and a 532 nm nanosecond pulsed laser. This high-resolution LIBS spectrometer proved to be a promising alternative approach for rapid analysis of lithium isotopes.

4.4. Element Mapping by hLIBS

Understanding the distribution of major, minor, and trace elements by multi-element mapping assisted by semi-automated machine-learning in pegmatite minerals is important for the identification and tracking of the magmatic, metasomatic, and hydrothermal stages of their evolution [64,65]. This transforms the discovery process, making it faster, cheaper, and more effective, particularly in the search for the critical hard-rock lithium deposits.

4.5. Comparison with Other Analytical Techniques

In the world of critical metals exploration, hLIBS has emerged as a game-changing analytical tool, offering distinct advantages over other field-handheld and laboratory-based techniques. LIBS spectra contain molecular emission bands (e.g., CN, C2, CaO, and CaOH), which can offer significant advantages in mineral exploration, particularly valuable for identifying minerals that are difficult to distinguish by atomic emission alone [66]. The sequential laser shots on the same spot on a sample can create a micro-drill hole, providing a depth profile of elemental composition. This is invaluable for distinguishing between weathering rinds and fresh rock composition, and understanding zonation in minerals.
The hLIBS can be used for a direct determination of lithium in minerals and rocks such as pegmatites in outcrops and drill cores, and also can be used to map K/Rb and K/Cs ratios as fractionation indicators [67]. In the case of REEs, key elements such as Ce, La, Nd, and Y can be determined in real-time directly in the field, often with accuracy comparable to laboratory ICP-MS methods in the exploration of tin and tungsten, both these elements can be directly determined, which is challenging for pXRF. No single analytical technique is the best in mineral exploration studies. The choice depends on the stage of exploration, required data quality, speed, cost, and elements of interest. Modern exploration programs strategically combine field-handheld tools such as hLIBS and pXRF for rapid decision-making with laboratory methods such as ICP-MS for definitive validation and resource estimation [68]. Table 5 presents a comparison of working features of an hLIBS, pXRF, and handheld Raman spectrometer (in the field), and laboratory-based ICP-OES and ICP-MS.
There are only two major handheld instruments regularly used in exploration studies: hLIBS and pXRF, in addition to the VNIR-SWIR spectrometer, which are very useful instruments for mineral identification and for alteration identification in the field. Both are well-established elemental analysis techniques that satisfy the requirements of field use by geoscientists in ambient conditions and are highly successful tools in mineral exploration studies. Both are complementary tools, and the best choice depends heavily on the specific exploration target. However, pXRF cannot detect light elements such as Li, Be, B, and C. However, pXRF currently performs better than hLIBS in the analysis of REEs and base metals [69]. In the case of pXRF, over 30 elements ranging in concentration from about 10 μg/g to 100% can be analysed in less than a minute with detection limits ranging from 5 to 10 μg/g in the field. In the case of hLIBS, the initial laser shots can be used to ablate and clean the sample surface when needed. Each technique requires some kind of sample preparation, such as preparation of a flat, smooth sample surface each time before acquiring the data to ensure accuracy, repeatability, and reliability. pXRF requires strict safety protocols, controlled access, and regulatory compliance, but hLIBS often has fewer regulatory hurdles. pXRF can provide more precise data for many elements because its spectra are much simpler and easier to interpret than the complex emission spectra produced by hLIBS. The advantages of hLIBS over pXRF devices include sensitivity to the light elements, high spatial resolution, and the possibility to distinguish between different layers of the sample [44]. The hLIBS is emerging as a powerful, real-time tool for rapid, in situ screening of REEs during geological exploration. REEs have nearly identical outer electron shell configurations. As a result, their emission spectra in the case of hLIBS and X-ray fluorescence lines will be extremely close together, leading to severe interferences. These are the fundamental physical limitations of simultaneous elemental analysis using hLIBS and pXRF.

4.6. Advantages over Other Techniques

Handheld LIBS provides a unique combination of portability, speed, and sensitivity to light elements. Its ability to deliver laboratory-quality data on critical metals like lithium directly in the field makes it an invaluable tool for modern mineral exploration. The handheld LIBS has also proven effective for quantifying elements such as Rb and Cs. This technique offers several decisive advantages for exploring critical metals and minerals, particularly when compared to traditional laboratory methods like ICP-MS and other portable techniques like pXRF. pXRF cannot detect elements such as Li, Be, B, and C. On the other hand, though a portable Raman spectrometer offers rapid, real-time analysis and identifies mineral structures and phases, it cannot detect and determine metals. The hLIBS technique can analyse solids, liquids, and gases directly. It is virtually a non-destructive and non-contact analytical technique, as the laser pulse removes only a microscopic amount of material. LIBS is the only field-handheld tool that can directly analyse lithium in field conditions. Instant analysis results can help to quickly close decision-making loops, reduce risks of errors, and plan. In addition, the technique is a multi-element technique, and the results are obtained in seconds. When a few elements were measured on both hLIBS in the field and ICP-MS in the laboratory, no significant differences were observed (Table 6 and Table 7), proving that hLIBS can deliver accurate data on par with ICP-MS in the case of certain elements. During the last two decades, the technology has matured and become a truly rugged handheld system with miniaturization. The demand for critical minerals (e.g., Li, REEs, Cu, and Ni) pushed mining companies to adopt this technology for rapid, on-site analysis, making hLIBS a perfect fit.

4.7. Limitations

Matrix effects represent the single greatest obstacle to accurate quantitative geochemical analysis using hLIBS. Major variations in the LIBS signal that are unrelated to the analyte concentration arise from the sample’s physical and chemical properties. In geochemical applications, where sample matrices range from soils to ores with highly variable compositions, understanding and mitigating these effects is critical for obtaining reliable quantitative data. Matrix effects in hLIBS for geochemical analysis are broadly categorized into two types: (i) chemical matrix effects, which arise from the sample’s elemental and mineralogical composition. For example, the rich emission spectrum of ore matrix elements can cause strong spectral line overlap with analyte peaks, further preventing accurate quantification of the analyte, and (ii) physical matrix effects which arise from variations in the sample’s surface state, hardness, absorption coefficient, thermal conductivity, grain size, and reflectivity. In addition, moisture content and particle-size variability are physical factors that degrade hLIBS accuracy under field conditions. Since lasers operate at atmospheric pressure, ambient nitrogen and oxygen mix with the plasma, creating diatomic molecular emission bands, specifically cyanogen (CN) at around 388.3 nm and nitric oxide (NO) bands that complicate the spectra. These bands, along with atomic emissions from the air, often mask or overlap with characteristic lines of metallic elements like Fe, Al, and Ca. Thus, emission lines from different elements can overlap, especially in the rich, complex spectra generated by LIBS. For example, lines for V, Ti, and Cr can interfere with those of REEs. In addition, collisions with air molecules cool the plasma rapidly, shortening its lifetime and reducing the intensity of emission lines compared to the continuous background. Thus, the technique’s sensitivity to both chemical composition and physical sample state requires careful calibration strategies, often the use of matrix-matching calibration, and the application of advanced chemometric methods to achieve reliable results [47,71,72,73]. Self-absorption is a severe drawback in LIBS. It occurs when photons emitted by excited atoms in the hot plasma core are reabsorbed by cooler atoms of the same element in the plasma’s outer regions. This effect is particularly problematic for hLIBS in mineral exploration, as it causes a non-linear relationship between the signal intensity and the element’s concentration, which significantly undermines quantitative accuracy. Understanding and correcting for self-absorption is critical for transforming hLIBS from a qualitative screening tool into a reliable quantitative instrument for mineral exploration. To overcome these challenges, advanced strategies such as Principal Component Analysis (PCA) and Artificial Neural Networks (ANNs) are useful in extracting key features of LIBS spectra [65,74]. However, these elements display numerous emission lines, and we can often find non-interference lines to accurately determine them. Handheld LIBS is best suited for rapid preliminary screening and qualitative analysis, with more accurate laboratory-based techniques like ICP-OES or ICP-MS for definitive quantification when needed.
Meaningful quantification by hLIBS often requires a flat, fresh surface for solid samples. In the field, this necessitates breaking the rock and sometimes grinding to create a homogeneous powder pellet for a reliable calibration. This is particularly difficult on weathered outcrops where highly variable data may be obtained. In addition, there is a limitation in the sampling depth as the laser typically ablates only microns to tens of microns into the surface. Harmon et al. [60] made an innovative use of handheld LIBS for the in situ analysis of rock weathering rinds. Handheld instruments require battery power, and analyses such as high-resolution mapping can drain batteries quickly. Despite automation, the skill of the operator still matters. In particular, the understanding of the limitations of the technique is crucial for obtaining reliable data. Interpreting complex spectra, especially those of REEs with many overlapping lines, requires specialized training and often sophisticated software algorithms. Continued development of matrix-independent calibration methods and improved handheld instrument designs will be essential for expanding the technique’s role in field geochemical applications.

5. Recent Advances

The advances in hLIBS have been driven by improvements in lasers, spectrometers, software, and data processing. The shift from bulky Nd: YAG lasers to microchip lasers and fibre lasers has been crucial. These lasers are smaller, more energy-efficient, and can operate at high repetition rates (e.g., 50–1000 Hz), allowing for faster analysis [75]. The development of compact, high-resolution CCD/CMOS detector-based spectrometers has enabled the creation of lightweight units without sacrificing analytical performance. Some systems now cover a broad spectral range (e.g., 200–1000 nm) in a single device. Handheld LIBS devices are now rugged, making them work in even more challenging conditions, such as space and deep-sea environments. Handheld LIBS is currently emerging and uses two sequential laser pulses, significantly enhancing the plasma emission, leading to lower limits of detection and better precision [76].
Advances in optics allow for incredibly small laser spot sizes, approximately 50 to 100 µm. This enables micro-analysis of inclusions, coatings, and fine-grained materials in the field, a capability previously reserved only for laboratory-based instruments like SEM-EDS [77]. Another major advancement is “Smart” software with artificial intelligence (AI), which enables automated material identification, like mineral species or soil type, by comparing the spectrum to an onboard library. Game-changing dual-source instruments like pXRF + hLIBS in a single handheld unit are also being developed, which offer several advantages over single instruments. pXRF provides excellent data for heavy elements Sn, Ta, W, U, REEs, while LIBS provides accurate data for light elements like Li, Be, and B. This combination can give a near-complete picture of the geochemistry of a critical mineral deposit. Enhancements in the power and stability of the laser and spectrometer resolution, which lead to better detection limits and improved reproducibility, make the data more reliable for quantitative decisions.

Advanced Chemometrics and AI

The integration of advanced chemometrics and artificial intelligence (AI) with hLIBS is revolutionizing mineral exploration. The raw LIBS spectra are complex, affected by matrix effects, self-absorption, and spectral interferences. Traditional univariate calibration often fails. This is where chemometrics and AI become indispensable [78,79,80]. Using sophisticated software and machine learning (ML) algorithms addresses long-standing challenges in both elemental and mineral analysis by hLIBS, allowing instruments to move beyond simple elemental detection toward more accurate and specific quantitative results. This approach provides a solution for resolving complex spectra, mitigating matrix effects, and predicting the presence of specific minerals like spodumene and petalite while doing lithium exploration studies. By seamless integration of GPS, cameras, and inertial sensors and data streams directly into GIS and resource modelling software (e.g., Leapfrog), the instant creation of geochemical maps and 3D models in the field is enabled. Motorized stages allow for automated raster scanning over a small area (e.g., on a rock chip), which can reveal the textural relationship between minerals (e.g., zoned crystals, intergrowths), which is vital for understanding ore genesis and planning mineral processing. The fusion of advanced chemometrics and AI with hLIBS is not merely an incremental improvement but a transformative enabler for mineral exploration. It empowers geologists with immediate, quantitative, and actionable data, significantly accelerating discovery and reducing exploration risks.

6. Safety Issues

Handheld LIBS devices are generally safe for industrial use when operating procedures are followed. The safety issues of hLIBS must be taken into account while these instruments are in use. Class 4 high-power laser devices pose substantial hazards, especially to the eyes of the user, if not used properly. In addition to the user, the laser system can also cause harm to bystanders. Usually, the user is aware of the danger and may take precautions, but bystanders often may not take proper precautions.

7. Role of hLIBS in Critical Mineral Exploration

Critical metals such as lithium, cobalt, copper, and rare earth elements (REEs) are indispensable to the green transition. They form the physical backbone of low-carbon technologies like electric vehicles (EVs), wind turbines, and solar panels. Strengthening any country’s critical mineral exploration involves a comprehensive modernization of laboratories, technology, and workforce. There have been tremendous advancements in recent times in analytical technologies and mineral exploration techniques [81,82,83,84]. Miniaturization has led to the development of handheld devices like pXRF, hLIBS, and Raman spectrometers. These allow for in situ chemical analysis directly in the field, enabling geologists to make real-time decisions on drilling targets [19,41]. The rising requirement for critical metals triggered several exploration studies around the world. Geochemical analysis of rocks, minerals, ores, sediments, soils, and water, together with their constituent minerals, is an important component of any mineral exploration program that requires rapid, sensitive, multi-element determination by handheld analytical techniques such as hLIBS and pXRF [66,85,86]. Their exploration is challenging because they are often found in complex ore systems, sometimes finely disseminated within host rocks, making them difficult to identify visually. Rapid on-site identification is necessary to guide sampling and drilling, thereby reducing the time and cost associated with sending samples to distant laboratories. The hLIBS serves as a “geochemical fingerprinting” tool at every stage of early exploration, as it can offer real-time prospecting and field mapping. Geologists can quickly scan outcrops, boulders, or trench walls to identify rock types based on their geochemical signature (e.g., distinguishing pegmatites from surrounding country rock). This instantly confirms the presence of key elements like Li in pegmatites, REEs in carbonatites, or ionic clays [67,87]. This turns a geologist’s hypothesis into an immediate, data-driven fact. The hLIBS can be scanned along drill core or chips to create continuous geochemical profiles [88]. This helps pinpoint exact depths where mineralized zones begin and end, as hLIBS provides excellent relative grade control. It can quickly differentiate between low-grade and high-grade intervals (e.g., % Li in a spodumene pegmatite), allowing for prioritization of samples for laboratory submission and guiding the direction of the drill program in near-real time [89]. Beyond just elements, advanced hLIBS systems with multivariate analysis can help identify specific minerals based on their chemical composition (e.g., distinguishing spodumene from other lithium-bearing minerals like lepidolite or petalite) [90]. At the mine face or in the processing plant, it can be used to assess ore quality and liberation, helping to optimize beneficiation processes. This immediate data allows geologists to identify the most promising mineralized sections of rock and those with the highest concentration of elements in question. This saves time and money by focusing expensive, time-consuming laboratory analysis only on the most relevant samples. In summary, while hLIBS is not a replacement for laboratory analysis, it is a transformative field tool that uniquely unlocks the exploration of light critical minerals, significantly accelerating the critical mineral supply.

7.1. Possible Role of hLIBS in Hydrogeochemical Exploration Studies

Hydrogeochemical exploration is a powerful tool that uses surface and groundwater to detect mineralization of buried mineral deposits, guiding exploration efforts more efficiently and with a deeper understanding of the subsurface environment. When groundwater moves through a mineralized zone, it triggers chemical reactions (often accelerated by bacteria) that lower the pH (increasing acidity) and alter the Eh (redox potential). These conditions make heavy metals such as copper, lead, and cadmium more soluble, allowing them to dissolve into the water and migrate away from the source [91,92]. Handheld LIBS, with its ability to perform simultaneous multi-element analysis of water samples, is particularly valuable for detecting light elements like Li and Be and can act as a geochemical metal detector and real-time mapping tool for the field geologist [93]. In hydrogeochemical exploration studies, it can drastically optimize the sampling strategy, ensuring that expensive laboratory resources are used only on the most promising samples [42,94]. While presenting the advantages of hLIBS, including minimal or no sample preparation, and fast and easy operation, these authors presented guidance on how to use hLIBS as an alternate technique to the established techniques for elemental analysis in aqueous solutions. The integration of hLIBS into hydrogeochemical exploration represents a significant technological leap, moving analysis from the laboratory directly to the field.

7.2. hLIBS as a Core Scanner During Drilling Operations

Handheld LIBS is revolutionizing critical mineral exploration by transforming conventional drill core logging into a high-resolution, geochemical mapping process during exploration and mining, offering near real-time, quantitative, and qualitative data for key elements, particularly Li, Rb, and other light elements. Its application as a core scanner provides unprecedented real-time data that significantly enhances discovery efficiency and reduces exploration and mining risks. It can help in grade control and clearly delineate ore boundaries based on metal concentrations and demarcate them. Thus, hLIBS as a core scanner represents a paradigm shift in critical mineral exploration. It provides the light element detection capability missing from traditional field tools, combined with the speed and spatial resolution needed for effective drill program management [48,49,59,95,96,97].

7.3. Lithium

Lithium is the cornerstone of the global green energy transition, serving as the foundational element for high-density energy storage. It is essential for decarbonizing both the transportation sector and power grids, making it the most critical metal for achieving net-zero emissions. Lithium exploration involves regional-scale geological mapping to identify prospective terrains such as ancient greenstone belts near fertile granites for pegmatites; volcano-sedimentary rocks, and closed arid basins for brines [98,99,100]. Geothermal brines represent a revolutionary and increasingly viable source for critical minerals, like Li [101,102,103]. Prospecting pegmatites requires looking for the indicator minerals like spodumene, petalite, and amblygonite, using pXRF as well as hLIBS (Table 6). Commercial hLIBS instruments, particularly those designed for geology, contain pre-loaded libraries of emission spectra for numerous known minerals [48]. By using the stored in-built library of emission spectra of thousands of minerals, hLIBS can identify different lithium minerals and discriminate different mineral phases during field operations using the emission spectra. In addition, using machine learning tools, LIBS spectra can be converted to mineralogy [59]. Figure 5 presents a couple of hLIBS spectra of lithium minerals. Granites and associated pegmatites are the primary targets for lithium [104]. Mapping granitic bodies is done using airborne geophysical exploration methods such as magnetic survey, radiometric survey, and identifying pathfinding minerals (Table 8), especially identifying various critical metal deposits.
By collecting soil, sediment, and rock samples, analysing them not just for Li, but for the full pathfinder suite, and using the concentrations of these pathfinding elements, in particular Cs, target areas can be identified for drilling [6]. In the case of brine deposits, seismic surveys will help to understand basin structure, then drill shallow holes or use push tools to sample brine at different depths, and immediately test the Mg/Li ratio to assess the economic potential of the area [106]. Exploration for brines focuses on understanding the hydrogeological basin. Pathfinder elements here help to identify the right chemical and physical conditions for lithium concentration. In short, while lithium itself is the ultimate target, explorers rarely look for it alone. They follow the clues left by lithium’s more expressive and easily detected geological companions like B, Be, K, Ca, Cs, and Rb [98].
For lithium exploration, hLIBS is proven to be an excellent practical field tool for the identification and quantification of lithium mineralization, requiring less than 5–10 s [57]. Lithium concentrations in rocks, minerals, and other types of geological samples were achieved by the use of the emission line at 670.776 nm and the calibration by using synthetic glasses and natural minerals [107,108]. In addition, the K/Rb ratio is a powerful geochemical tool used in lithium exploration, particularly for finding LCT (Li-Cs-Ta) type pegmatites, which are the primary source of hard-rock lithium [109]. K/Rb is a reliable index of fractionation (a low K/Rb ratio < 20 is a strong indicator of highly fractionated LCT). The most highly fractionated pegmatites are the ones enriched in the rare “incompatible” elements like Li, Cs, Ta, Rb, and Be [23,109]. The advantage here is that both K and Rb can be determined accurately by hLIBS. In addition, hLIBS can be used to create mineral maps of lithium across commodities [59]. Korbel et al. [109] used both hLIBS and pXRF for the determination of lithium and other elements such as K, Rb, Cs, Sn, Nb, and Ta in the Beauvoir granite by using various statistical metrics to ensure accuracy. A few more examples of the hLIBS in mineral exploration studies are presented in Table 9.
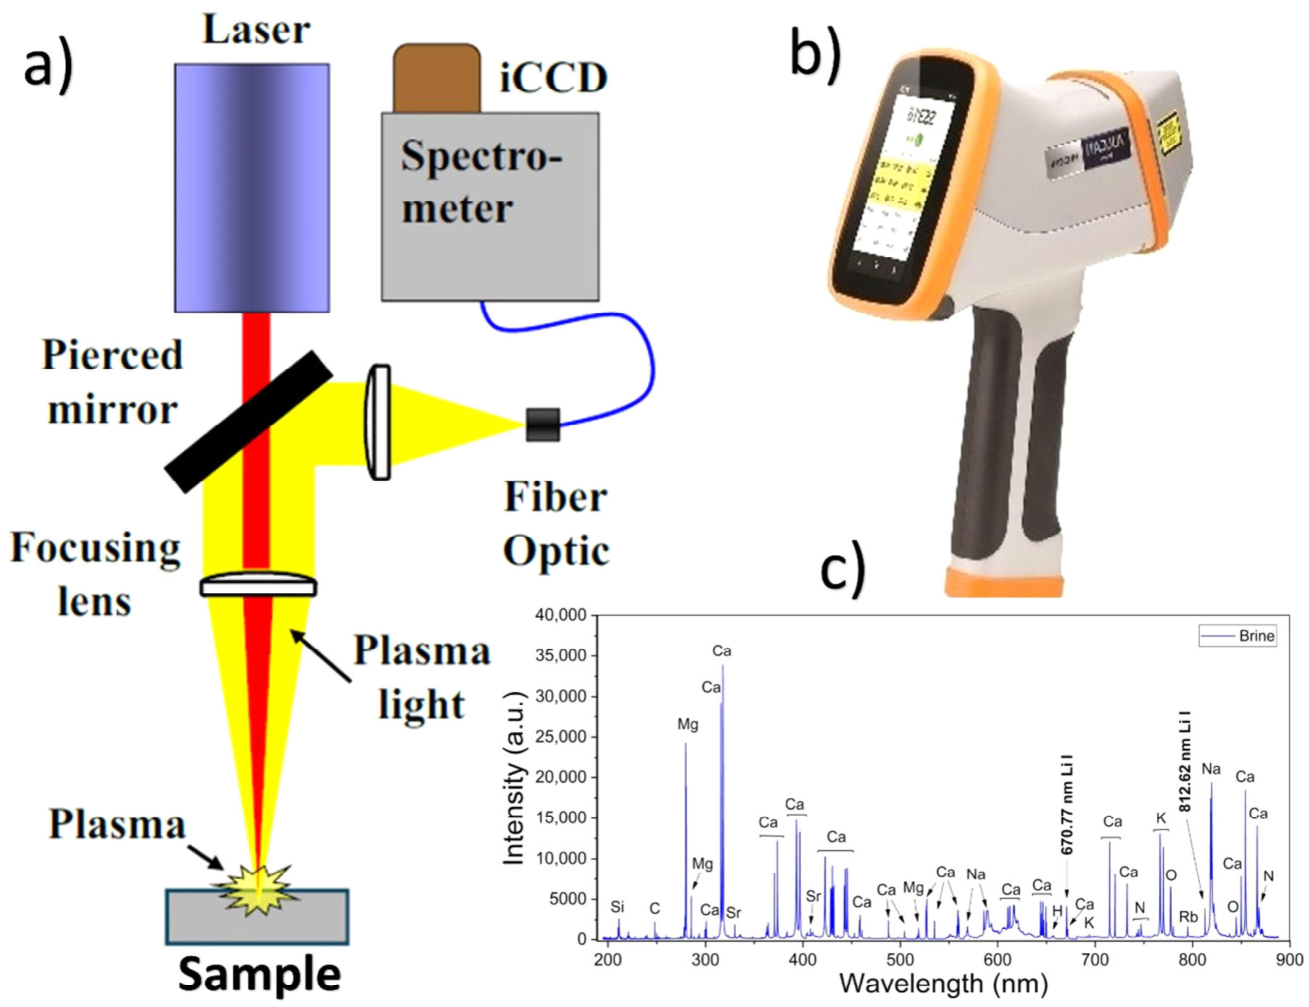
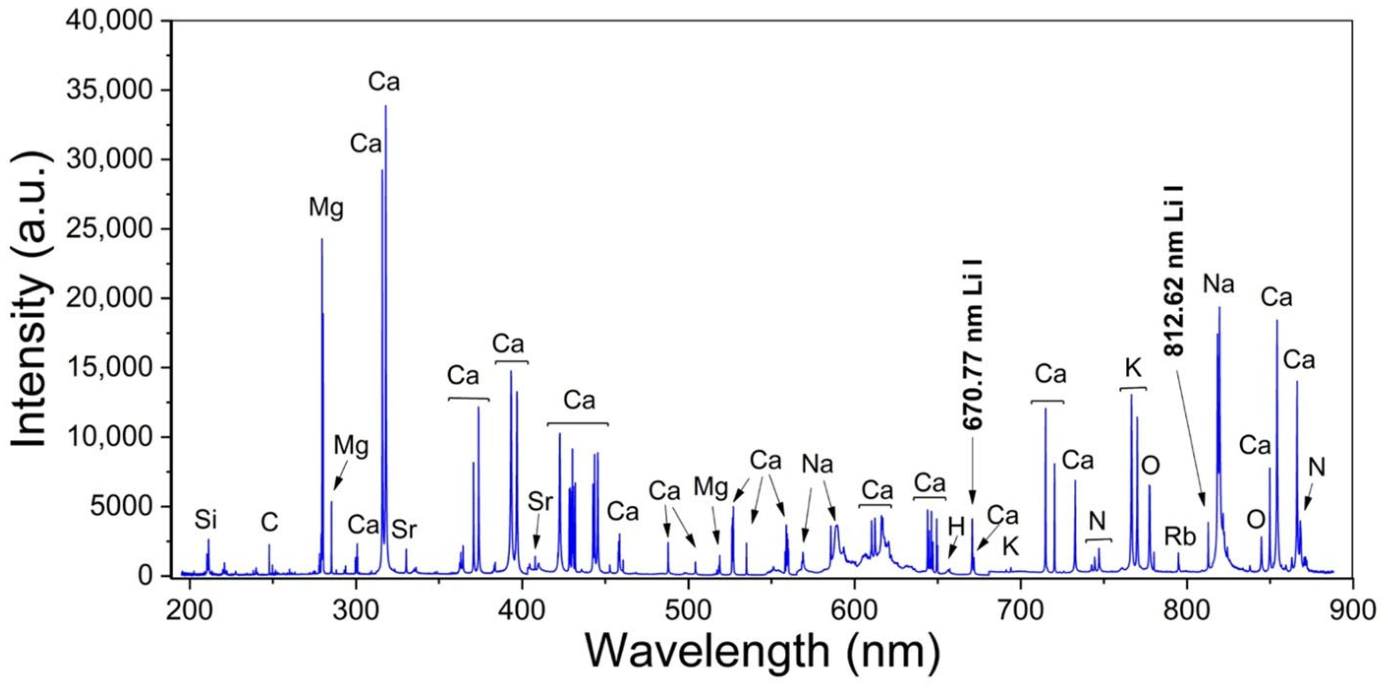
In lithium brine deposits, the ratio Mg/Li is critically important as a high Mg/Li ratio makes lithium extraction difficult and expensive [112]. Explorers look for brines with a low Mg/Li ratio < 10, which is ideal, but economic deposits can have higher values. Erbetta et al. [92] proved that lithium in brine samples can be determined directly using hLIBS by employing an injection system based on the Venturi effect without any sample treatment, with precisions < 4% RSD with comparable accuracy on the majority of the samples. The hLIBS can detect lithium in brine samples, but standard handheld analysers are not designed for direct liquid analysis. The primary challenge is splashing; when the laser hits the liquid surface, it creates a splash that seriously hurts precision and accuracy. To overcome the splashing issue, the solution uses a Venturi effect sample injection system. He et al. [110] detected Li in water at 670.776 nm, with a detection limit of 18.4 ng/mL with filter paper as the adsorption substrate. López et al. [46] determined Li in brines for the control of industrial mining processes using two portable LIBS devices, based on direct laser impact on the sample without any sample pretreatment. The hydrogen line at 653.3 nm was used as an internal standard to compensate for signal fluctuations. Lithium in brine samples was determined with errors less than 20% relative and a quantification limit of 13 µg/g. So, in practice, detecting Li in brine requires more than just an hLIBS; it requires a complete, specialized portable system built to handle liquids. Figure 6 presents a broadband LIBS spectrum of a brine sample. The lithium concentrations obtained compared favourably with those obtained by the atomic absorption spectroscopy (AAS), and LIBS showed a good agreement (normalized standard deviation (Table 10 and Table 11). These observations show the feasibility of monitoring the lithium concentration in water online at ng/mL concentration levels, and demonstrate that hLIBS can be equally valuable in the exploration studies of brine deposits.
Mezoued et al. [49] presented a case study of lithium exploration of the Beauvoir rare-metal granite, France, by hLIBS. Eleven hand specimens and four drill cores were extensively analysed in the spectral range of 190–950 nm using hLIBS, and accurate data were obtained for elements like Li, Rb, Sn, Nb, and Ta, directly at the exploitation site, which was consistent with the data produced on the same samples in the laboratory. A flat, smooth sample surface was the only requirement before the analysis. This work demonstrates the utility of hLIBS in lithium exploration studies. Based on an analysis of lithium content using two handheld instruments, namely, hLIBS and pXRF, a strategic sample-dependent approach is recommended by Korbel et al. [109] to optimize speed and accuracy. For low-grade lithium samples, hLIBS should be preferred. For lithium specifically, hLIBS has a detection limit of about 1 µg/g (Table 3), making it indispensable for exploration and mining. On the other hand, pXRF plays a crucial but complementary role by detecting associated elements and some important pathfinder elements.
While this level of detection power is not enough to detect subtle anomalies required for early-stage exploration, it can easily detect lithium in LCT pegmatites because it offers a unique balance of speed, portability, and adequate sensitivity. The LCT pegmatites often have Li2O grades between 0.5% to 2.5% (corresponding to ~2300 µg/g to >11,500 µg/g Li). This is the primary and most successful application of hLIBS [57,111]. This sensitivity is sufficient to detect the low-grade sedimentary lithium deposits, which often have lower but still economic grades (e.g., 600–1200 µg/g Li [111].

During Lithium Mining Operations

The hLIBS has great potential for on-site analysis in all types of mining. In the case of hard rock mining, it can guide mining operations with its ability to differentiate between barren and mineralized zones [113]. In the case of clay (sedimentary) deposits, hLIBS will be valuable for in situ mapping of lithium distribution in clay horizons and identifying impurities that may affect processing in the later stage [99]. During the exploitation of lithium brine deposits, hLIBS will be useful for understanding the chemistry of the reservoir rocks and salts during evaporation pond control, by providing rapid, real-time geochemical data to optimize resource management and achieve economic sustainability. Its speed, portability, and multi-element analysis capabilities enable informed decisions directly during mining operations, reducing costs and maximizing efficiency [49]. During mining activity, hLIBS can make the decision-making very fast, and reduce operating costs by minimizing misdirected drilling and processing of waste, and increase overall resource recovery efficiency.

7.4. Rare Earth Elements (REEs)

This special group of elements is a critical component of many advanced technologies, such as power generation, phosphors, high-power magnets, powerful loudspeakers, autocatalytic converters, and lasers used in a variety of industrial and defence sectors. Yttrium is a classified rare earth element that is often found alongside the lanthanides [114]. Handheld LIBS can detect and analyse REEs in various geological samples like rocks and soils, offering rapid, on-site elemental analysis without extensive sample preparation [70,115]. Hence, hLIBS became a valuable tool for exploring yttrium and other REEs. Its ability to provide rapid, on-site elemental analysis makes it ideal for geochemical exploration, though it has distinct advantages and disadvantages compared to other techniques like pXRF.
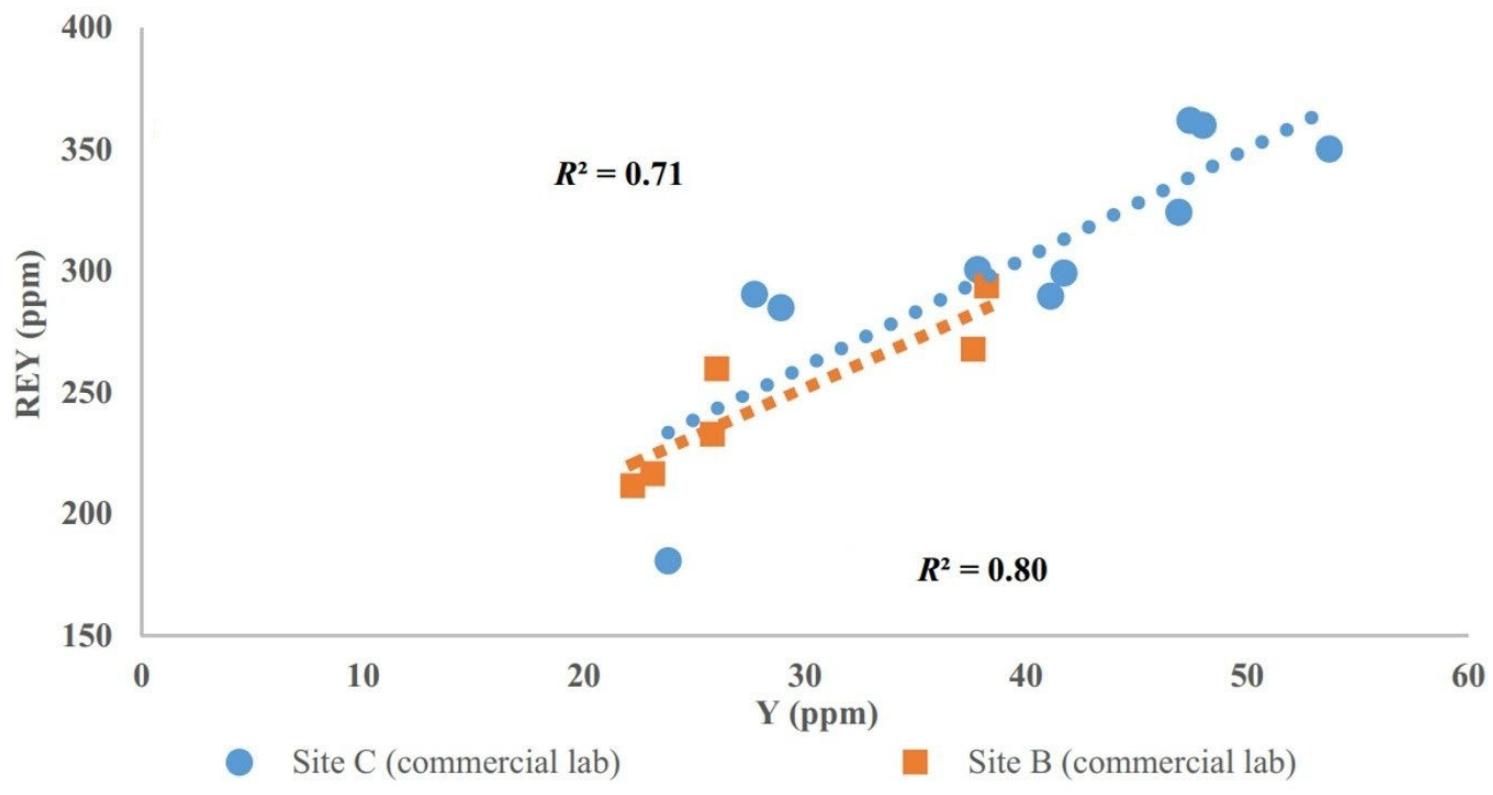
The problem of significant overlapping of REE emission lines in LIBS emission spectra, particularly in on-field quantitative analysis of REEs using a handheld instrument with relatively low spectral resolution, is a challenging task [116]. Another issue is the rich emission spectrum of matrix elements of ores, which can cause strong interference effects. But by using matrix matching calibration standards and multivariate calibration models, this problem can be solved [116]. In REE exploration, yttrium serves as a powerful indicator of REE deposits that are enriched in heavy rare earth elements (HREEs), specifically ion-adsorption clay deposits and peralkaline igneous systems. Its geochemical similarity to HREEs makes it a reliable tracer for the processes that form these critical and high-value deposits, meaning its presence is a reliable indicator of other REE deposits. Some studies indicated a strong correlation between yttrium concentration and the total concentration of other REEs in certain mineral deposits (Figure 7). Using yttrium as a pathfinder can significantly reduce exploration costs by providing a real-time field screening method and minimizing the need to send numerous samples to the laboratory [117]. Analysis of drill cores on-site to identify target mineralization and make immediate decisions about drill locations is another major advantage of hLIBS [87]. Using the instrument’s GPS and data management features to create high-resolution, multi-element compositional maps of a site (geochemical maps) makes the target identification very quick and easy and helps in the identification and delineation of ore boundaries to reduce the exploration footprint and waste. hLIBS can provide quick feedback on the quality of ore being extracted to guide mining operations. Table 7 presents a comparison of REE concentration results determined using both handheld LIBS and ICP-MS analyses [70].

7.5. Copper

Copper is currently in great demand as it is a very good conductor of electricity, second only to silver, but far more affordable and abundant. Copper is a crucial component in lithium-ion batteries used for grid storage and electric vehicles. Identifying a copper deposit is a multi-stage process that blends traditional field geology and geochemical investigations with cutting-edge technologies. It moves from a broad regional scale down to a very specific, drill-target scale. Porphyry copper deposits, layers of copper minerals within sedimentary rocks, volcanogenic massive sulphide (VMS) deposits, skarn deposits, and vein-type deposits are important. Handheld LIBS, with a detection limit of 0.1 µg/g, allows on-site, real-time analysis and is a promising method for the detection and quantification of copper in copper-bearing samples [118]. Most pathfinder elements (Table 8) can be detected in the field using hLIBS. In addition, the mobility offered by hLIBS makes this instrument highly suitable for measurements in a gridded pattern. In copper exploration, pXRF is a better technique for direct metal detection and trace element analysis, while hLIBS is the superior tool for understanding the geological matrix, alteration, and mineralogy [119]. They are not competing technologies but complementary partners. The integration of these two handheld techniques can guide the exploration in a more effective way. This significantly reduces discovery timelines and costs by empowering field geologists with real-time chemical intelligence.

7.6. Cobalt

In nature, cobalt occurs within a diverse range of minerals. While the primary minerals of cobalt are carrollite and cobaltite, cobalt occurs as a trace component in other minerals like pentlandite, pyrite, or manganese oxides. Handheld LIBS is a rapidly advancing tool for cobalt exploration studies, offering on-site, real-time elemental analysis, including pathfinders including Ni, Cu, and Mn [120,121]. In certain deposits, elements like As and Sb also serve as critical chemical markers that LIBS can identify to locate cobalt enrichment zones (Table 8). While hLIBS devices can detect cobalt in rocks and alloys, they are typically used in conjunction with more established technologies like pXRF for comprehensive field geochemistry [122]. Though hLIBS has an excellent potential to be used as an analytical tool in cobalt exploration studies, a real example of its application was not seen in the literature. Even in cobalt exploration, pXRF and hLIBS form a complementary, powerful duo that addresses the metal’s complexity. While pXRF can do the quantitative screening of cobalt, nickel, copper, and arsenic at low concentrations, hLIBS is essential for understanding the mineral form. While pXRF can detect pathfinder elements, hLIBS can identify different cobalt minerals such as skutterudite and cobaltite. pXRF is used for quick, reliable analyses at a fine scale to detect cobalt even in common minerals. Though the potential of hLIBS for cobalt exploration is clearly evident, not enough relevant references are available in the literature.

7.7. Titanium

The importance of titanium in the energy transition is profound and multifaceted. While it does not receive the same attention as lithium, cobalt, or copper, titanium is a critical enabler for many clean energy technologies due to its unique combination of exceptional properties, such as a high strength-to-weight ratio that allows key clean energy technologies to operate efficiently. Handheld LIBS was used for the quantification of titanium in addition to C, Si, Mg, K, Fe, Al, Zn, and Zr, in some quartz veinlets (Italy), directly in the field [123]. Understanding the specific combination of indicator minerals and elements (Table 8) is crucial for explorers to correctly identify the type of titanium deposit and its economic potential. However, there is a limited number of references on the application of hLIBS in titanium exploration [124].

8. Analysis of Mine Waste and e-Waste for Recycling/Reuse

Handheld LIBS is a powerful tool for the on-site, rapid multi-element analysis of mine waste and e-waste with minimal sample preparation. This technique is emerging as an important analytical tool for the recycling and reuse of mine waste, such as tailings and waste rocks, and e-waste for the circular economy and sustainability of the industry. Mining waste recovery is critical due to the vast amounts of waste generated and its potential as a resource, necessitating efficient characterization methods for resource extraction and environmental safety [125]. Its key advantage over techniques like pXRF is the ability to detect light elements such as Li, C, and Be, which are critical in many modern applications. This helps quickly assess whether a site is worth recycling for materials like, for example, cobalt or indium. By providing immediate data, it helps determine if mine waste can be repurposed for applications like restoring land, extracting remaining useful minerals, or using it as building materials [12]. Mine waste often contains significant amounts of residual critical metals due to past inefficient extraction or changing commodity prices [69]. In addition, hLIBS can also identify hazardous metals such as As, Cd, Pb, and Hg to assess their environmental risks if waste is moved or reprocessed.
hLIBS is increasingly vital for managing the complex material streams of electronic waste to sort scrap metal and determine the content of precious metals in electronic waste and catalytic converters. Some devices can even identify steel grades by detecting carbon. One of the most significant applications is analysing “black mass”—the crushed material from spent batteries [16]. Combined with machine learning, hLIBS can identify different battery types with over 99% accuracy. It can also be used to determine lithium concentration, which is essential for optimizing extraction processes. In another example, permanent magnet scrap is a strategic, high-value resource for REEs. While Nd and Pr account for the bulk of the weight, Dy and Tb are often considered the most important to recover from scrap [84]. Its recycling is crucial for securing supply chains, protecting the environment, and enabling the green technologies of the future. Advanced analysis tools like hLIBS are essential for unlocking this value by enabling rapid, on-site sorting and quality assessment of this critical scrap [19]. The technique’s ability to quickly detect a wide range of elements, including light ones, makes it indispensable for efficient resource recovery and advancing the circular economy in both the mining and electronics recycling industries.

9. Use of LIBS in Extreme Environments Such as Deep-Sea and Space

The LIBS technology is also finding applications in exploration studies in extreme environments, such as the deep ocean, due to the emergence of underwater vehicle platforms that enable rapid, in situ, multi-element detection in deep-sea sediments without sample preparation [126]. While hLIBS is a versatile tool for everyday use on Earth during field work, deep-sea and space instruments are specialized, robust systems designed for remote operation in environments where human access is limited or impossible. While both are portable, deep-sea LIBS instruments diverge significantly from commercial handheld units due to the extreme pressure (up to 60 MPa/6000 m), high salinity, temperatures, and corrosion and sensing challenges [123]. However, those systems are typically field-portable (fpLIBS) or remotely operated, not truly handheld analysers (hLIBS). Handheld LIBS instruments are designed for general field use, while deep-sea and space exploration systems are highly specialized engineering marvels built to survive and operate in some of the most extreme environments on Earth and beyond. Since these systems are similar to hLIBS systems, share common technical grounds such as miniaturization and remote operation, and do a similar job, but in different environments, brief write-ups about these applications are included here.

9.1. LIBS in the Exploration of Deep-Sea Sediments

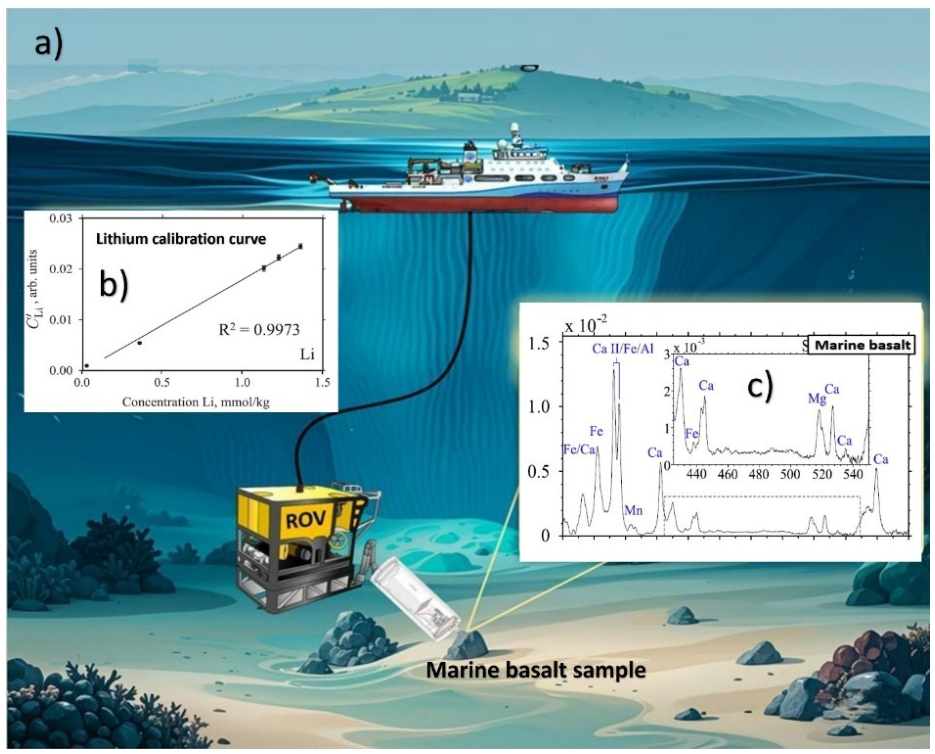
Deep-sea mining is an emerging alternative for sourcing critical minerals like Cu, Ni, Cu, Mn, and REEs [127,128]. Essentially, deep-sea LIBS is a specialized field-portable system typically integrated with underwater vehicles (ROVs), whereas handheld systems are optimized for direct operation by a single person on land [129]. By deploying a miniaturized LIBS instrument (Figure 8) in a Remotely Operated Vehicle (ROV) in a cruise ship, in situ, real-time detection of critical minerals/metals in deep-sea rocks, sediments such as polymetallic nodules, seafloor massive sulphides, and polymetallic crusts, at depths up to 6000 m (596 bar) becomes possible [130]. In addition, REY-rich phosphates from deep-sea sediments [131] and seamounts [132] represent a high-value target for deep-sea LIBS-based in situ elemental screening. Table 12 presents an example of the chemical composition of sediments and rock samples obtained by LIBS in the seafloor in the NW Pacific [133]. Ferromanganese nodules and crusts are enriched not only in Co but also in other critical metals such as Cu, Mn, and Ni [134], providing clear analytical targets for LIBS in deep-sea exploration. Fortes et al. [129] demonstrated underwater analysis of samples at distances up to 80 cm from the sensor at the solid–water interface using an LIBS instrument with dual-pulse excitation from Nd: YAG laser pulses at 532 nm. Yang et al. [135] obtained hyperspectral data of ferromanganese crusts using LIBS during a deep-sea exploration mission in the South China Sea hydrothermal vents at a depth of 2490 m. Deep-sea hydrothermal vents are critical hotspots for mineral-rich deposits. Several exploration studies were carried out using a miniature LIBS instrument in ROW on a cruise ship [133,136].
Hydrothermal chimneys are vertical, tower-like structures formed on the seafloor where superheated, mineral-rich water (up to 400 °C) erupts from the crust, meeting near-freezing seawater. These vents precipitate metallic sulphides, forming “black smokers” (metal-sulphide-rich fluids) or “white smokers” (fluids with silica/barium-based particles), which build massive sulphide deposits (SMS) containing copper, gold, zinc, and other sulphide-forming elements [137]. These instruments typically consist of a long-nanosecond duration pulse-laser, a spectrometer and a high-speed camera [133].
Figure 8. (a) LIBS instrument in a Remotely Operated Vehicle (ROV) in a cruise ship, (b) calibration curve for lithium, and (c) in situ, real-time detection of critical minerals/metals in deep-sea rocks and sediments (modified after [133,138]).
Minerals 16 00757 g008
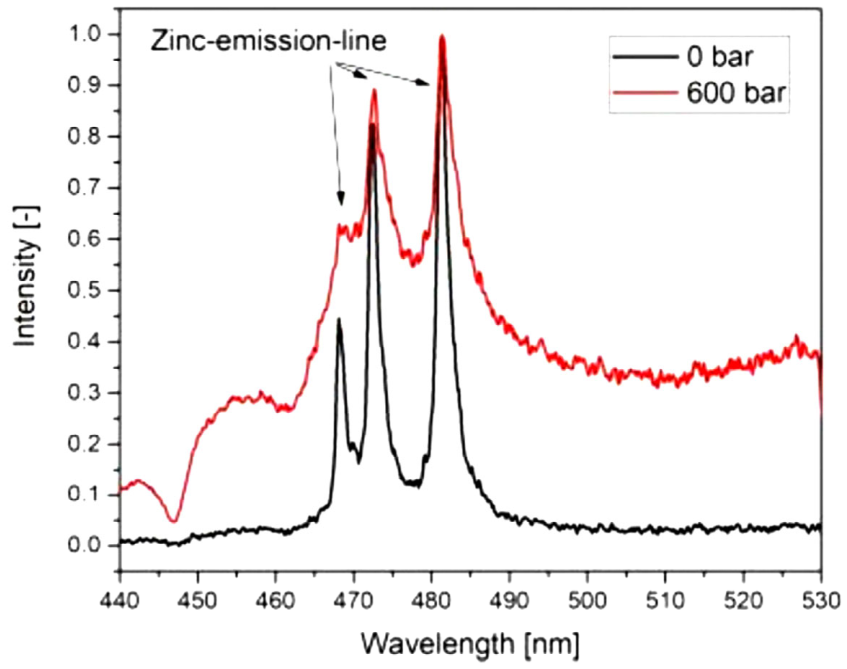
The deep sea represents the most physically hostile regime for plasma survival, requiring aggressive energy input (double-pulse and high power) and posing the greatest engineering challenges to simply acquire a usable signal [139]. By focusing high-energy laser pulses directly onto seabed targets, LIBS generates plasma for the analysis of metals such as Cu, Zn, Co, Ni, and Mn, and acquires data in situ without the need for time-consuming and expensive sample retrieval [138,140] used a long-pulsed miniaturized LIBS system using a ROW and obtained detection limits of 97.1 µg/g and 21.7 µg/g for Cu and Mn, respectively. Specialized techniques, such as using nitrogen gas purges or double-pulse or long-pulse lasers, can overcome high-pressure water constraints to maintain signal intensity [140]. The major difficulties in underwater sediment analyses are the surface roughness and the sample softness. According to Matsumoto and Sakka [141], plasma confinement during underwater LIBS operation causes deformation of spectral lines, and they suggested methods such as principal component regression and partial least squares regression analyses to overcome these difficulties in obtaining accurate data. Figure 9 presents the LIBS spectrum of the zinc sample, demonstrating how the spectrum was deformed at 600 bar pressure. Lazic et al. [142] demonstrated that a double-pulse LIBS can analyse sediments applied directly underwater. Deep-sea sediment exploration encompasses mineral resource exploration in hydrothermal regions and polymetallic mineral areas, as well as environmental monitoring, geochemical mapping, and multi-elemental analysis [126]. Problems include the high hydrostatic pressure in deep water, water interface, remote operation, focus, data processing, and calibration [143]. While traditional methods require costly and time-consuming sample collection and laboratory analysis, LIBS offers a way to get real-time geochemical data, supporting more efficient marine resource exploration and environmental studies. The biggest advantage is that the underwater LIBS can aid the mining industry by providing a way to map and quantify minerals on the ocean floor without disturbing and endangering the marine environment, because LIBS can provide an in situ, non-contact method and provides minimal disturbance to the deep-sea environment.

9.2. LIBS in Space Exploration

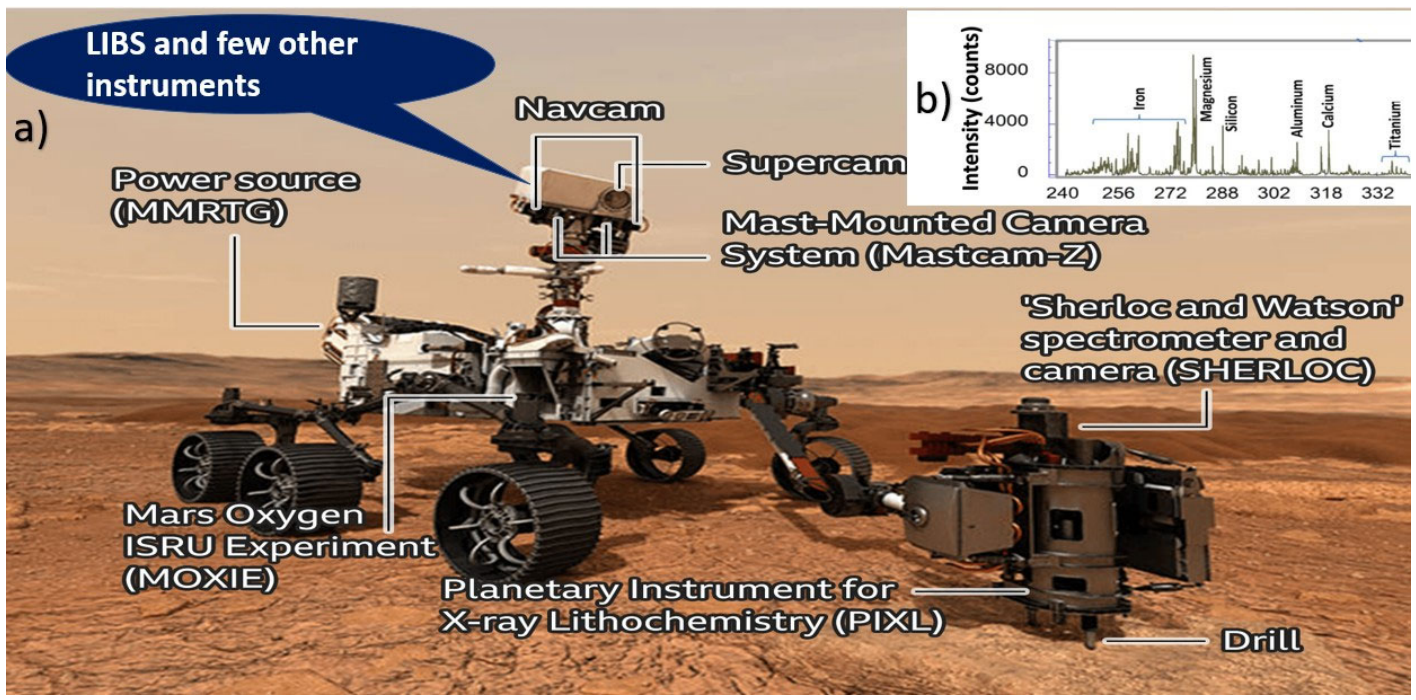
Space exploration is more than a scientific pursuit; it is a critical engine for progress that directly impacts our lives on Earth, with far-reaching implications for humanity’s future. Mini LIBS instruments are also finding applications in the exploration of extreme environments such as space [55,144]. Both hLIBS and the one designed for space exploration use the same core technology; they are optimized for vastly different, and in some ways, more extreme environments than deep-sea systems. While standard hLIBS instruments are optimized for terrestrial convenience, space LIBS instruments are specialized tools built to survive launch and perform under extreme planetary conditions. The gap is closing, with both technologies converging toward more rugged, portable, and powerful analytical tools for exploring the harshest environments. The biggest achievement in the field of LIBS is a state-of-the-art LIBS device developed by NASA for space exploration studies (Figure 10). The LIBS instrument on the Perseverance rover is part of the SuperCam instrument suite, which is not an equivalent instrument to hLIBS. It can be called a “mini-LIBS”, and weighs approximately 10 kg on Earth [142,143,144,145]. For the first time in 2012, NASA deployed the LIBS instrument in the ChemCam instrument aboard the Mars Science Laboratory (MSL) rover and proved its suitability for space missions to explore planetary surfaces [145,146,147]. Subsequently, in two more Mars missions, LIBS technology was utilized. LIBS was made an integral part of ChemCam, which is attached to the Curiosity rover, the Mars Science Laboratory [148,149]. The ChemCam instrument uses a laser to zap rocks from up to 7 m away, and sends the spectral data back to Earth to determine the rock’s composition, helping scientists decide which rocks are worth further investigation [150,151]. Thus, LIBS became a core technique used by both NASA’s Curiosity and Perseverance rovers to analyse the elemental composition of Martian surface materials like rocks and soils. The Perseverance rover, launched in 2021, used the more advanced SuperCam instrument, which was built on the LIBS capabilities and incorporates other spectroscopic tools such as XRF and a Raman spectrometer [52]. LIBS was also used to understand the elemental concentrations of basalt weathering crust on Mars to understand the Martian weathering history [31,151].
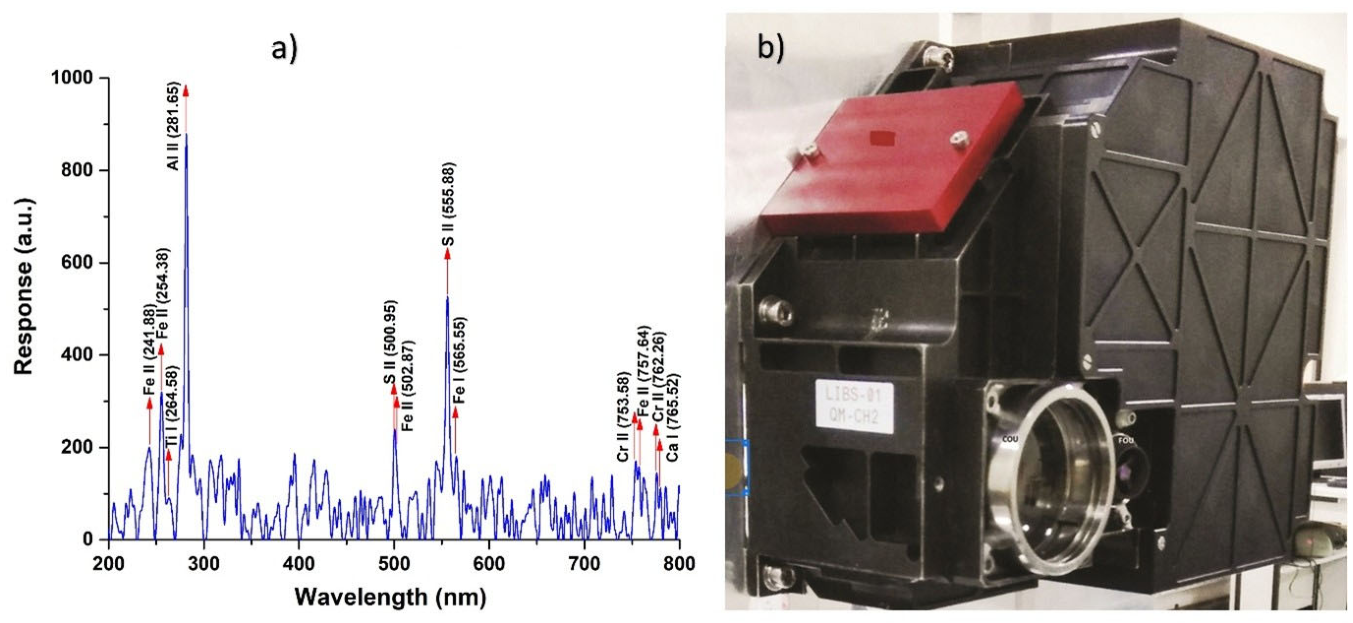
The mini-LIBS instrument was also on India’s Chandrayaan-3 rover, Pragyaan, which used a pulsed laser to analyse the elemental composition of the lunar surface by creating a microplasma and analysing it [152]. Usually, in space exploration, the size of the plasma is larger than on Earth. It was developed by the Indian Space Research Organisation (ISRO) and successfully confirmed the presence of elements like sulphur on the lunar surface in addition to the presence of Al, Ca, Fe, Cr, and Ti on the lunar surface (Figure 11). In particular, the discovery of the presence of sulphur by LIBS is a remarkable development as it was previously not possible to confirm the presence of this element using remote orbiter analysis techniques [153]. This instrument provided the elemental abundance data on the lunar surface with an estimated uncertainty of ≤5% [154]. Further measurements have revealed the presence of Mn, Si, and O. The instrument is a compact, low-power, and lightweight device, which is crucial for its space-based operations. LIBS has also enabled scientists to study the composition of asteroids to understand more about how these celestial bodies formed [146,155,156,157].

10. Future Outlook

Currently, hLIBS is revolutionizing critical mineral exploration by enabling rapid, on-site, in situ multi-elemental analysis, particularly for light pathfinder elements like Li, Be, and B in lithium exploration. The future of hLIBS is focused on expanding its analytical capabilities, improving field reliability, and integrating advanced data processing. AI algorithms are now being combined with hLIBS spectra to perform automated mineral identification and phase classification. Integration of software and data analysis capabilities is enhancing the functionality of handheld devices in general. Future hLIBS with AI combination will not only measure the target metal but also analyse subtle spectral patterns of trace elements (like Rb/Cs ratios in pegmatites) that act as chemical vectors [16]. This helps overcome matrix effects and improves the accuracy of quantifying critical elements in complex geological matrices. This means a geologist can point it at a rock body with a high concentration of Li (core of the deposit) and provide coordinates of the area where to drill. Technological advancements in LIBS technology are another critical factor driving market growth. Innovations in laser technology, detector sensitivity, and data processing algorithms have significantly improved the performance of handheld LIBS analysers. These advancements have led to enhanced accuracy, faster analysis times, and the ability to analyse complex materials with greater precision. In the near future, handheld LIBS is expected to break the sub-10 µg/g detection limit for most REEs.
Future mining permits will demand stringent environmental regulations. The hLIBS supports “smart extraction” by allowing real-time grade control. It will enable on-site waste sorting, so barren rock never leaves the pit, and low-grade stockpiles are accurately quantified. This reduces the carbon footprint of shipping heavy rocks to laboratories and prevents over-processing. Technological advancements in LIBS technology are enhancing the accuracy and efficiency of handheld devices. Handheld LIBS analysers are being designed and manufactured for various applications, including exploration, mining, metal recycling, and environmental analysis. Growing environmental regulations are boosting the demand for environmental analysis applications. Challenges related to device calibration and standardization will continue to remain a concern for users.
Furthermore, the integration of advanced software and data analysis capabilities has expanded the functionality of these devices, allowing users to perform detailed material characterization and generate comprehensive reports. As technology continues to evolve, the capabilities of handheld LIBS analysers are expected to expand, opening up new opportunities for exploration geologists. Additionally, the integration of advanced features like GPS, Bluetooth, and cloud connectivity is enabling seamless data transfer and Remote Monitoring capabilities. These innovations are not only improving the usability of handheld LIBS analysers but also expanding their potential applications across various industries. (https://www.strategicrevenueinsights.com/industry/handheld-libs-analyzers-market, accessed on 1 July 2026).
This technology is poised to provide a cost-effective and efficient way to gather critical geochemical data, supporting both scientific discovery and sustainable resource management. The future of LIBS technology is poised for significant advancement, driven largely by integration with artificial intelligence, the development of more sophisticated hardware systems, and expansion into new application areas. The CSIRO, Australia, is developing a next-generation LIBS system in-house with much more intense laser pulses to enhance elemental composition detail (https://www.csiro.au/en/news/all/articles/2025/august/laser-induced-breakdown-spectroscopy, accessed on 1 July 2026). Similar developments are also possible on hLIBS in the future [158].

11. Conclusions

The handheld LIBS is a critical tool in modern exploration studies for critical metals. Its unique ability to deliver rapid, in situ detection and accurate determination of all metals from lithium to uranium, especially the light elements, and provide high-resolution geochemical data directly in the field makes it indispensable for exploring for the critical minerals that support the global green energy transition and economy. By enabling faster target identification, more efficient drilling, and smarter sample selection, hLIBS can dramatically reduce exploration risk, timelines, and costs to acquire geochemical data, ultimately increasing the chances of discovering the next generation of critical mineral deposits. Though hLIBS technology is very promising for use in mineral exploration investigations at present, some more advances, such as detection limits and analytical precision, need to be improved in the future to make it more popular among exploration geologists.
The ability of a handheld LIBS to detect isotopic concentrations like 7Li has direct applications for geological exploration studies. Currently, this technology is moving towards operational field trials. Success depends on parallel advances in compact high-resolution spectrometers, robust field calibration protocols, and user-friendly data analytics software tailored for exploration geologists.
LIBS can deliver reliable, real-time elemental analysis in extreme environments, from the crushing pressures of the deep sea to the near-vacuum conditions of space (e.g., on Mars). The miniature LIBS in ROVs is capable of non-contact and non-destructive analysis and is best suited for a sustainable exploitation of marine resources, thus having less environmental impact. Miniature LIBS instrument technology has become a transformative analytical tool in space exploration and revolutionized how we conduct in situ planetary science. The combination of hLIBS and pXRF creates a highly effective exploration toolkit because they provide a near-complete geochemical profile of a sample in the field. This synergy reduces the dependency on data from the laboratory, making the exploration faster.

Funding

This research received no external funding.

Data Availability Statement

This is a review article. The data presented in this study are available in the corresponding references (DOI) and the URL provided in the text.

Acknowledgments

V. Balaram would like to acknowledge the support of Prakash Kumar, CSIR-National Geophysical Research, Hyderabad, India. This review is greatly benefitted from the comments and suggestions of an anonymous reviewer on the earlier version of the manuscript.

Conflicts of Interest

The author declares that this research was conducted in the absence of any commercial or financial relationships that could be construed as a potential conflict of interest.

References

  1. Kamran, M.; Raugei, M.; Hutchinson, A. Critical elements for a successful energy transition: A systematic review. Renew. Sustain. Energy Transit. 2023, 4, 100068. [Google Scholar] [CrossRef] [Scilit]
  2. Balaram, V. Combating Climate Change and Global Warming for a Sustainable Living in Harmony with Nature. J. Geogr. Res. 2023, 6, 1–17. [Google Scholar] [CrossRef] [Scilit]
  3. Balaram, V.; Santosh, M. Critical Metal Deposits in Terrestrial and Oceanic Environments and the Global Energy Transition. Habitable Planet. 2025, 1, 86–107. [Google Scholar] [CrossRef] [Scilit]
  4. Balaram, V. Current and emerging analytical techniques for geochemical and geochronological studies. Geol. J. 2021, 56, 2300–2359. [Google Scholar] [CrossRef] [Scilit]
  5. Viets, J.G.; O’Leary, R.M. The role of atomic absorption spectrometry in geochemical exploration. J. Geochem. Explor. 1992, 44, 107–138. [Google Scholar] [CrossRef] [Scilit]
  6. Balaram, V. Microwave Plasma Atomic Emission Spectrometry (MP-AES) and its applications: A Critical Review. Microchem. J. 2020, 159, 105483. [Google Scholar] [CrossRef] [Scilit]
  7. Balaram, V.; Satyanarayanan, M. Data Quality in Geochemical Elemental and Isotopic Analysis. Minerals 2022, 12, 999. [Google Scholar] [CrossRef] [Scilit]
  8. Revenko, A.G.; Pashkova, G.V. X-Ray Fluorescence Spectrometry: Current Status and Prospects of Development. J. Anal. Chem. 2023, 78, 1452–1468. [Google Scholar] [CrossRef] [Scilit]
  9. Han, H.J.; Gysi, A.P.; Frey, B. An ICP-OES method for the precise and accurate quantification of rare earth elements in natural water: A comparative study from mine waste sites in New Mexico, USA. Spectrochim. Acta Part B At. Spectrosc. 2026, 237, 07451. [Google Scholar] [CrossRef] [Scilit]
  10. Dessouky, O.K.; Ali, H.H. Using Portable Gamma-Ray Spectrometry for Testing Uranium Migration: A Case Study from the Wadi El Kareim Alkaline Volcanics, Central Eastern Desert, Egypt. Acta Geol. Sin. 2018, 92, 2214–2232. [Google Scholar] [CrossRef]
  11. Duée, C.; Orberger, B.; Maubec, N.; Laperche, V.; Capar, L.; Bourguignon, A.; Bourrat, X.; El Mendili, Y.; Chateigner, D.; Gascoin, S.; et al. Impact of heterogeneities and surface roughness on pXRF, pIR, XRD and Raman analyses: Challenges for on-line, real-time combined mineralogical and chemical analyses on drill cores and implication for “high speed” Ni-laterite exploration. J. Geochem. Explor. 2018, 198, 1–17. [Google Scholar] [CrossRef] [Scilit]
  12. Gopal, L.; Hanuman, V.V.; Chakrapani, G. Separation Cum Pre-Concentration Technique for Determination of Uranium in Sea, Brine and Ground Water at Nano to Sub nanogram Levels. Int. J. Sci. Res. Sci. Technol. 2020, 7, 302–312. [Google Scholar] [CrossRef] [Scilit]
  13. Moroz, T.N.; Edwards, H.G.M.; Zhmodik, S.M. Detection of carbonate, phosphate minerals and cyanobacteria in rock from the Tomtor deposit, Russia, by Raman spectroscopy. Spectrochim. Acta Part A Mol. Biomol. Spectrosc. 2021, 250, 119372. [Google Scholar] [CrossRef] [Scilit]
  14. Booysen, R.; Lorenz, S.; Thiele, S.T.; Fuchsloch, W.C.; Marais, T.; Nex, P.A.M.; Gloaguen, R. Accurate hyperspectral imaging of mineralized outcrops: An example from lithium-bearing pegmatites at Uis, Namibia. Remote Sens. Environ. 2022, 269, 112790. [Google Scholar] [CrossRef] [Scilit]
  15. Balaram, V.; Sawant, S.S. Indicator Minerals, Pathfinder Elements, and Portable Analytical Instruments in Mineral Exploration Studies. Minerals 2022, 12, 394. [Google Scholar] [CrossRef] [Scilit]
  16. Balaram, V.; Santosh, M.; Satyanarayanan, M.; Srinivas, N.; Gupta, H. Lithium: A review of applications, occurrence, exploration, extraction, recycling, analysis, and environmental impact. Geosci. Front. 2024, 15, 101868. [Google Scholar] [CrossRef] [Scilit]
  17. Lee, S.; Su, L.; Mesnier, A.; Cui, Z.; Manthiram, A. Cracking vs. surface reactivity in high-nickel cathodes for lithium-ion batteries. Joule 2023, 7, 2430–2444. [Google Scholar] [CrossRef] [Scilit]
  18. Chu, B.; Guo, Y.J.; Shi, J.L.; Yin, Y.X.; Huang, T.; Su, H.; Yu, A.; Guo, Y.G.; Li, Y. Cobalt in high-energy-density layered cathode materials for lithium ion batteries. J. Power Sources 2022, 544, 231873. [Google Scholar] [CrossRef] [Scilit]
  19. Cui, J.; Ormerod, J.; Parker, D.; Ott, R.; Palasyuk, A.; Mccall, S.; Paranthaman, M.P.; Kesler, M.S.; McGuire, M.A.; Lograsso, T.; et al. Manufacturing Processes for Permanent Magnets: Part I, Sintering and Casting. JOM 2022, 74, 1279–1295. [Google Scholar] [CrossRef] [Scilit]
  20. Liu, S. Sm–Co high-temperature permanent magnet materials. Chin. Phys. B 2019, 28, 017501. [Google Scholar] [CrossRef] [Scilit]
  21. Ghosh, D.; Biswas, K.; Balaji, S.; Annapurna, K. Realization of warm white light from Ce-Eu-Tb doped zinc fluoroboro silicate glass for lighting applications. J. Alloys Compd. 2018, 747, 242–249. [Google Scholar] [CrossRef] [Scilit]
  22. Widijatmoko, S.D.; Cui, Z.J.; Agalit, H.; Li, Y.; Leeke, G.A. Recycling of enamelled copper wire from end-of-life electric motor via room temperature metanalysis. Resour. Environ. Sustain. 2023, 15, 100143. [Google Scholar] [CrossRef] [Scilit]
  23. Lo Piano, S.; Saltelli, A.; Van der Sluijs, J.P. Silver as a Constraint for a Large-Scale Development of Solar Photovoltaics? Scenario-Making to the Year 2050 Supported by Expert Engagement and Global Sensitivity Analysis. Front. Energy Res. Sec. Sol. Energy 2019, 7, 56. [Google Scholar] [CrossRef] [Scilit]
  24. Prishya, A.S.A.; Chopra, L.; Manikanika. Comprehensive review on uses of silicon dioxide in solar cell. Mater. Today Proc. 2023, 72, 1471–1478. [Google Scholar] [CrossRef] [Scilit]
  25. Farzaneh, A.; Mohammadi, M.; Ahmad, Z.; Ahmad, I. Chapter 13 Aluminium Alloys in Solar Power—Benefits and Limitations. In Aluminium Alloys—New Trends in Fabrication and Application; Ahmad, Z., Ed.; IntechOpen: London, UK, 2013. [Google Scholar] [CrossRef] [Scilit] [PubMed]
  26. Zhao, H.; Zuo, H.; Wang, J.; Jiao, S. Practical application of graphite in lithium-ion batteries: Modification, composite, and sustainable recycling. J. Energy Storage 2024, 98, 113125. [Google Scholar] [CrossRef] [Scilit]
  27. Dirkzwager, A.; Mallee, L.; Groeneveld, T.; Quayson, E.B.; Qumber, M.A.; van Dongen, T.; McMillan, D.G. Green Engineering of Silicon and Titanium Dioxide Architectures and Realizing Downstream Applications. Adv. Sustain. Syst. 2024, 9, 2400591. [Google Scholar] [CrossRef] [Scilit]
  28. Cremers, D.A.; Radziemski, L.J. Handbook of Laser-Induced Breakdown Spectroscopy; John Wiley & Sons, Ltd.: Hoboken, NJ, USA, 2013. [Google Scholar] [CrossRef] [Scilit]
  29. Senesi, G.S.; Harmon, R.S.; Hark, R.R. Chapter 23—Field-portable and handheld LIBS. In Laser-Induced Breakdown Spectroscopy, 2nd ed.; Singh, J.P., Thakur, S.N., Eds.; Elsevier: Amsterdam, The Netherlands, 2020; pp. 537–560. [Google Scholar] [CrossRef] [Scilit]
  30. Senesi, G.S.; Harmon, R.S.; Hark, R.R. Field-portable and handheld laser-induced breakdown spectroscopy: Historical review, current status and future prospects. Spectrochim. Acta Part B At. Spectrosc. 2021, 175, 106013. [Google Scholar] [CrossRef] [Scilit]
  31. Senesi, G.S. Portable Handheld Laser-induced Breakdown Spectroscopy (LIBS) Instrumentation for in-field Elemental Analysis of Geological Samples. Int. J. Earth Environ. Sci. 2017, 2, 146. [Google Scholar] [CrossRef] [Scilit] [PubMed]
  32. Lemière, B.; Harmon, R.S. Chapter 20, XRF and LIBS for Field Geology. In Portable Spectroscopy and Spectrometry; Crocombe, R., Leary, P., Kammrath, B., Eds.; John Wiley & Sons, Ltd.: Hoboken, NJ, USA, 2021. [Google Scholar] [CrossRef] [Scilit]
  33. Harmon, R.S.; Fabre, C.; Senesi, G.S. Laser-induced breakdown spectroscopy. In Treatise on Geochemistry, 3rd ed.; Anbar, A., Weis, D., Eds.; Elsevier: Amsterdam, The Netherlands, 2025; pp. 607–644. [Google Scholar] [CrossRef] [Scilit]
  34. Galli, E.; Massa, M.; Zanoletti, A.; De Iuliis, S.; Bontempi, E.; Depero, L.E.; Palleschi, V.; Borgese, L. Determination of lithium concentration in black mass using laser-induced breakdown spectroscopy hand-held instrumentation. Sci. Rep. 2025, 15, 17483. [Google Scholar] [CrossRef] [Scilit] [PubMed]
  35. Radziemski, L.; Cremers, D. A brief history of laser-induced breakdown spectroscopy: From the concept of atoms to LIBS 2012. Spectrochim. Acta Part B At. Spectrosc. 2013, 87, 3–10. [Google Scholar] [CrossRef] [Scilit]
  36. Rawicz, A.H. Theodore Harold Maiman and the invention of laser. In Proceedings of the SPIE 7138, Photonics, Devices, and Systems IV; SPIE Photonics Prague: Prague, Czech Republic, 2008; p. 713802. [Google Scholar] [CrossRef] [Scilit]
  37. Debras-Guédon, J.; Liodec, N. De l’utilisation du faisceauissu d’un amplificateur á ondes lumineuses par émissioninduite par rayonnement (laser á rubis), comme source énergétique pour l’excitation des spectres d’émission des éléments. Comptes Rendus Hebd. des Séances de l’Académie des Sci. 1963, 257, 3336–3339. [Google Scholar]
  38. Brech, F.; Cross, L. Optical micro emission stimulated by a ruby MASER. Appl. Spectrosc. 1962, 16, 59. [Google Scholar]
  39. Runge, E.F.; Minck, R.W.; Bryan, F.R. Spectrochemical analysis using a pulsed laser source. Spectrochim. Acta 1964, 20, 733–736. [Google Scholar] [CrossRef] [Scilit]
  40. Radziemski, L.J.; Loree, T.R.; Cremers, D.A. Laser-Induced Breakdown Spectroscopy (LIBS): A New Spectrochemical Technique. In Optical and Laser Remote Sensing; Killinger, D.K., Mooradian, A., Eds.; Springer Series in Optical Sciences; Springer: Berlin/Heidelberg, Germany, 1983; Volume 39. [Google Scholar] [CrossRef] [Scilit]
  41. Balaram, V. Glimpses of history and developments in analytical instrumentation: Scientific and engineering advances and industrial applications. Discov. Chem. Eng. 2026, 6, 9. [Google Scholar] [CrossRef] [Scilit]
  42. Schlatter, N.; Lottermoser, B.G. Laser-Induced Breakdown Spectroscopy Applied to Elemental Analysis of Aqueous Solutions—A Comprehensive Review. Spectrosc. J. 2024, 2, 1–32. [Google Scholar] [CrossRef] [Scilit]
  43. Palleschi, V. Forty Years of Laser-Induced Breakdown Spectroscopy and Laser and Particle Beams. Laser Part. Beams 2023, 2023, e4. [Google Scholar] [CrossRef] [Scilit]
  44. Huang, W.; Niu, C.; Li, K.; Deng, N.; Zhang, D.; Hu, Z.; Zhang, J.; Guo, L. Recent developments in laser-induced breakdown spectroscopy. Front. Phys. 2026, 21, 272202. [Google Scholar]
  45. Harmon, R.S.; De Lucia, F.C.; Miziolek, A.W. Laser-induced breakdown spectroscopy (LIBS)—An emerging field-portable sensor technology for real-time, in-situ geochemical and environmental analysis. Geochem. Explor. Environ. Anal. 2005, 5, 21–28. [Google Scholar] [CrossRef] [Scilit]
  46. López, N.; Puebla, G.; Day, D.; Jennings, M.; Loureiro, A.; Green, C.; Gallardo, L.; Quiroz, W. Direct Determination of Lithium in Brines Samples by Two Handheld Laser Induced Breakdown Spectroscopy Devices. SSRN 2026. [Google Scholar] [CrossRef] [Scilit]
  47. Diaz, D.; Fayyaz, A.; Baig, M.A.; Wilson, T.; Hahn, D. Laser-induced breakdown spectroscopy for the characterization of certified reference materials containing rare earth elements. Spectrochim. Acta Part B At. Spectrosc. 2026, 237, 107420. [Google Scholar] [CrossRef] [Scilit]
  48. Mezoued, N.; Fabre, C.; Cauzid, J.; Kim, Y.; Jatteau, M. Analysis of Minerals Using Handheld Laser-Induced Breakdown Spectroscopy Technology. Data 2025, 10, 40. [Google Scholar] [CrossRef] [Scilit]
  49. Mezoued, N.; Fabre, C.; Cauzid, J.; Kahou, Z.S.; Rocher, O. Handheld LIBS contribution to quantify critical elements during mining operations: The Beauvoir granite case study. J. Geochem. Explor. 2025, 271, 107689. [Google Scholar] [CrossRef] [Scilit]
  50. Wainner, R.T.; Harmon, R.S.; Miziolek, A.W.; McNesby, K.L.; French, P.D. Analysis of environmental lead contamination: Comparison of LIBS field and laboratory instruments. Spectrochim. Acta Part B At. Spectrosc. 2001, 56, 777–793. [Google Scholar] [CrossRef] [Scilit]
  51. Casanova, L.; Beldjilali, S.A.; Bilge, G.; Sezer, B.; Motto-Ros, V.; Pelascini, F.; Banaru, D.; Hermann, J. Evaluation of limits of detection in laser-induced breakdown spectroscopy: Demonstration for food. Spectrochim. Acta Part B At. Spectrosc. 2023, 207, 106760. [Google Scholar] [CrossRef] [Scilit]
  52. Dyar, M.D.; Ytsma, C.R.; Lepore, K. Geochemistry by laser-induced breakdown spectroscopy on the moon: Accuracy, detection limits, and realistic constraints on interpretations. Earth Space Sci. 2024, 11, e2024EA003635. [Google Scholar] [CrossRef] [Scilit]
  53. Li, Z.; Wei, N.; Li, M.; Wu, S.; Li, H.; Liu, P. Application of Portable X-Ray Fluorescence Analysis in Mineral Exploration: A Case Study from Cimabanshuo Porphyry Copper Deposit. Minerals 2025, 15, 1286. [Google Scholar] [CrossRef] [Scilit]
  54. Durance, P.; Jowitt, S.M.; Bush, K. An assessment of portable X-ray fluorescence spectroscopy in mineral exploration, Kurnalpi Terrane, Eastern Goldfields Super terrane, Western Australia. Appl. Earth Sci. Trans. Inst. Min. Metall. B 2014, 123, 150–163. [Google Scholar] [CrossRef] [Scilit]
  55. Wiens, R.C.; Cousin, A.; Clegg, S.M.; Gasnault, O.; Chen, Z.; Maurice, S.; Shu, R. Geochemistry of Mars with Laser-Induced Breakdown Spectroscopy (LIBS): ChemCam, SuperCam, and MarSCoDe. Minerals 2025, 15, 882. [Google Scholar] [CrossRef] [Scilit]
  56. Saputra, H.A.; Aji, D.; Ali, B.T.I.; Asranudin. Emerging Analytical Techniques for Rare Earth Element Study: Basic Principles and Cutting-Edge Developments. Analytica 2025, 6, 35. [Google Scholar] [CrossRef] [Scilit]
  57. Kim, Y.; Fabre, C.; Cauzid, J. Access to quantitative analysis of carbonates using a portable LIBS instrument: First applications to single minerals and mineral mixtures. Spectrochim. Acta Part B At. Spectrosc. 2022, 191, 106397. [Google Scholar] [CrossRef] [Scilit]
  58. Lawley, C.J.M.; Somers, A.M.; Kjarsgaard, B.A. Rapid geochemical imaging of rocks and minerals with handheld laser induced breakdown spectroscopy (LIBS). J. Geochem. Explor. 2021, 222, 106694. [Google Scholar] [CrossRef] [Scilit]
  59. Dias, F.; Ribeiro, R.; Gonçalves, F.; Lima, A.; Roda-Robles, E.; Martins, T. Calibrating a Handheld LIBS for Li Exploration in the Barroso–Alvão Aplite-Pegmatite Field, Northern Portugal: Textural Precautions and Procedures When Analyzing Spodumene and Petalite. Minerals 2023, 13, 470. [Google Scholar] [CrossRef] [Scilit]
  60. Harmon, R.S.; Senesi, G.S. Laser-Induced Breakdown Spectroscopy—A geochemical tool for the 21st century. Appl. Geochem. 2021, 128, 104929. [Google Scholar] [CrossRef] [Scilit]
  61. Wood, J.C. Determination of Lithium Isotope Concentration by Laser Induced Breakdown Spectroscopy Using Chemometrics. Graduate Research Thesis, Department of the Air Force, Air University, Air Force Institute of Technology, Wright-Patterson Air Force Base, OH, USA, 2025. [Google Scholar]
  62. Wood, J.C.; Shattan, M.B. Lithium Isotope Measurement Using Laser-Induced Breakdown Spectroscopy and Chemometrics. Appl. Spectrosc. 2021, 75, 199–207. [Google Scholar] [CrossRef] [Scilit] [PubMed]
  63. Morris, T.L.; Patnaik, A.K. Empirical suppression of line broadening and self-reversal for isotopic analysis of lithium samples using surface-enhanced LIBS. In SPIE High-Power Laser Ablation; SPIE: Santa Fe, NM, USA, 2026; Proceedings Volume 14074, High-Power Laser Ablation IX. [Google Scholar] [CrossRef] [Scilit]
  64. Zhao, H.; Shao, Y.; Zhang, Y.; Cao, G.; Zhao, L.; Zheng, X. Big data mining on trace element geochemistry of sphalerite. J. Geochem. Explor. 2023, 252, 107254. [Google Scholar] [CrossRef] [Scilit]
  65. Buday, J.; Výravský, J.; Cemprírek, J.; Prochazka, D.; Pořízka, P.; Kaiser, J. Correlative imaging of large-scale geological samples using LIBS and SEM-EDX automated mineralogy. Spectrochim. Acta Part B At. Spectrosc. 2025, 235, 107397. [Google Scholar] [CrossRef] [Scilit]
  66. Harmon, R.S. Laser-Induced Breakdown Spectroscopy in Mineral Exploration and Ore Processing. Minerals 2024, 14, 731. [Google Scholar] [CrossRef] [Scilit]
  67. Harmon, R.S.; Lu, P.L.; Curry, A.C.; Murray, R.M.; Richter, D.D. LIBS as a tool for Li-pegmatite exploration and prospect evaluation: Soil mica and soil analysis from the Carolina Tin-Spodumene Belt. Appl. Geochem. 2025, 191, 106534. [Google Scholar] [CrossRef] [Scilit]
  68. Balaram, V.; Glorie, S.; Gilbert, S.E.; Perumalsamy, C. Geochemical, Geochronological, and Environmental Applications of Tandem Inductively Coupled Plasma Mass Spectrometry (ICP-MS/MS): A Review. Environ. Earth Sci. 2025, 84, 622. [Google Scholar] [CrossRef] [Scilit]
  69. Senesi, G.S. Handheld Laser-Induced Breakdown Spectroscopy (hLIBS) Applied to On-Site Mine Waste Analysis/Evaluation in View of Its Recycling/Reuse. Chemosensors 2025, 13, 41. [Google Scholar] [CrossRef] [Scilit]
  70. Gibaga, C.R.L.; Montano, M.O.; Samaniego, J.O.; Tanciongco, A.M.; Quierrez, R.N.M.; Gervasio, J.H.C.; Catague, G.V., Jr. Comparative Study on Determination of Critical Minerals in Ni Laterites Using Handheld LIBS, Handheld XRF, and ICP-MS. Philipp. J. Sci. 2023, 152, 397–400. [Google Scholar] [CrossRef] [Scilit]
  71. Abdelhamid, M.; Fortes, F.J.; Harith, M.A.; Laserna, J.J. Analysis of explosive residues in human fingerprints using optical catapulting–laser-induced breakdown spectroscopy. J. Anal. At. Spectrom. 2011, 26, 1445. [Google Scholar] [CrossRef] [Scilit]
  72. Pochon, A.; Desaultya, A.M.; Baillya, L. Handheld laser-induced breakdown spectroscopy (LIBS) as a fast and easy method to trace gold. J. Anal. At. Spectrom. 2020, 35, 254–264. [Google Scholar] [CrossRef] [Scilit]
  73. Pei, H.; Fan, Q.; Duan, Y.; Zhang, M. A Matrix Effect Calibration Method of Laser-Induced Breakdown Spectroscopy Based on Laser Ablation Morphology. Appl. Sci. 2025, 15, 8640. [Google Scholar] [CrossRef] [Scilit]
  74. Su, X.; Chen, F.; Zhu, H.; Zhang, Y.; Zhang, X.; Tang, B.; Wu, J.; Guo, X.; Wang, J.; Jin, X.; et al. Laser-induced breakdown spectroscopy combined with multi-scale convolutional neural network and attention mechanisms for analyzing Dy, Nd, and Yb in uranium polymetallic ores. Anal. Chim. Acta 2025, 1386, 345035. [Google Scholar] [CrossRef] [Scilit] [PubMed]
  75. Rastogi, V.; Chaurasia, S. Advances in and Future Perspectives on High-Power Ceramic Lasers. Photonics 2024, 11, 942. [Google Scholar] [CrossRef] [Scilit]
  76. Rizwan, M.; Afgan, M.S.; Saleem, S.; Kou, K.; Hou, Z.; Wang, Z. Double Pulse laser-induced breakdown spectroscopy (DP-LIBS): A Comprehensive technique Review. Spectrochim. Acta Part B At. Spectrosc. 2025, 227, 107168. [Google Scholar] [CrossRef] [Scilit]
  77. Singh, S.P.; Balaram, V.; Satyanarayanan, M.; Sarma, D.S.; Subramanyam, K.S.V.; Anjaiah, K.V.; Kharia, A. Platinum group minerals from the Madawara ultramafic—Mafic complex, Bundelkhand Massif, Central India: A preliminary note. J. Geol. Soc. India 2011, 78, 281–283. [Google Scholar] [CrossRef] [Scilit]
  78. Li, L.N.; Liu, X.F.; Yang, F.; Xu, W.M.; Wang, J.Y.; Shu, R. A review of artificial neural network based chemometrics applied in laser-induced breakdown spectroscopy analysis. Spectrochim. Acta Part B At. Spectrosc. 2021, 180, 106183. [Google Scholar] [CrossRef] [Scilit]
  79. Chen, T.; Zhang, T.; Li, H. Applications of laser-induced breakdown spectroscopy (LIBS) combined with machine learning in geochemical and environmental resources exploration. TrAC Trends Anal. Chem. 2020, 133, 116113. [Google Scholar] [CrossRef] [Scilit]
  80. Senesi, G.S.; Pascale, O.D.; Allegretta, I.; Terzano, R.; Marangoni, B. Machine Learning-Enhanced Evaluation of Handheld Laser-Induced Breakdown Spectroscopy (LIBS) Analytical Performance for Multi-Element Analysis of Rock Samples. Sensors 2026, 26, 1076. [Google Scholar] [CrossRef] [Scilit] [PubMed]
  81. Khan, M.B. Advances in Mineral Exploration Methods: From Traditional to High-Tech. Am. J. Min. Eng. 2020, 1, 4. [Google Scholar] [CrossRef] [Scilit]
  82. Okada, K. Breakthrough technologies for mineral exploration. Miner. Econ. 2022, 35, 429–454. [Google Scholar] [CrossRef] [Scilit]
  83. Jain, R.; Bhu, H.; Pandey, A.K.; Pour, A.B. Base-metal exploration by using remote sensing, geological, geophysical, and geochemical datasets with clues from ancient mining: A comprehensive review on Aravalli-Delhi Fold Belt, Rajasthan, India. Adv. Space Res. 2025, 75, 277–315. [Google Scholar] [CrossRef] [Scilit]
  84. Balaram, V.; Deb, M. Critical Minerals/Metals: Global perspective, Indian scenario, a Possible Roadmap and Future strategy. J. Earth Syst. Sci. 2026, in press. [Google Scholar]
  85. Guan, H.Y.; Feng, D.; Chi, Y.D.; Wang, Y.B.; Luo, M.; Ma, N. Applications and technological advances of LIBS in water quality monitoring. J. Anal. At. Spectrom. 2026, 41, 899–921. [Google Scholar] [CrossRef] [Scilit]
  86. Fayyaz, A.; Asghar, H.; Alshehri, A.M.; Alrebdi, T.A. LIBS assisted PCA analysis of multiple rare-earth elements (La, Ce, Nd, Sm, and Yb) in phosphorite deposits. Heliyon 2023, 9, e13957. [Google Scholar] [CrossRef] [Scilit] [PubMed]
  87. Kuhn, K.; Jeannet, M.; Dieter, R.; Christian, O. Chemical mapping of mine waste drill cores with laser-induced breakdown spectroscopy (LIBS) and energy dispersive X-ray fluorescence (EDXRF) for mineral resource exploration. J. Geochem. Explor. 2015, 161, 72–84. [Google Scholar] [CrossRef] [Scilit]
  88. Marcus, T.S.; Steven, T. Laser-induced breakdown spectroscopy (LIBS) as a tool for in situ mapping and textural interpretation of lithium in pegmatite minerals. Am. Mineral. 2015, 100, 2141–2151. [Google Scholar] [CrossRef] [Scilit]
  89. Gottfried, J.; Harmon, R.S.; De Lucia, F.G.; Miziolek, A.W. Multivariate analysis of laser-induced breakdown spectroscopy chemical signatures for geomaterial classification. Spectrochim. Acta Part B At. Spectrosc. 2009, 64, 1009–1019. [Google Scholar] [CrossRef] [Scilit]
  90. Balaram, V.; Satyanarayanan, M.; Anabarasu, K.; Rao, D.V.S.; Dar, A.M.; Kamala, C.T.; Charan, S.N. Hydro-Geochemical Prospecting for Platinum Group of Elements (PGE) in the Sittampundi Layered Ultramafic Complex, Tamil Nadu, India: Pd as an Indicator of Mineralization. J. Geol. Soc. India 2019, 94, 341–350. [Google Scholar] [CrossRef] [Scilit]
  91. Kidder, J.A.; Reid, N.; Noble, R.R.; Leybourne, M.I.; Buskard, J.; Bowell, R.; Stoltze, A.; Garrett, R.G. A review of hydrogeochemical techniques for mineral exploration: History, present and future. Geochem. Explor. Environ. Anal. 2025, 25, geochem2024-065. [Google Scholar] [CrossRef] [Scilit]
  92. Erbetta, N.; Puebla, G.; Day, D.; Jennings, M.; Loureiro, A.; Green, C.; Gallardo, L.; Quiroz, W. Direct determination of lithium in brine samples using handheld LIBS without sample treatment: Sample introduction by venturi system. Anal. Methods 2024, 16, 7311–7318. [Google Scholar] [CrossRef] [Scilit] [PubMed]
  93. Goncharova, I.; Guichaoua, D.; Taboukhat, S.; Tarbi, A.; Chtouki, T.; Erguig, H.; Sahraoui, B. Laser-induced breakdown spectroscopy application for heavy metals detection in water: A review. Spectrochim. Acta Part B At. Spectrosc. 2024, 217, 106943. [Google Scholar] [CrossRef] [Scilit]
  94. Rifai, K.; Constantin, M.; Yilmaz, A.; Özcan, L.Ç.; Doucet, F.R.; Azami, N. Quantification of Lithium and Mineralogical Mapping in Crushed Ore Samples Using Laser Induced Breakdown Spectroscopy. Minerals 2022, 12, 253. [Google Scholar] [CrossRef] [Scilit]
  95. Müller, S.; Meima, J.A.; Gäbler, H.E. Improving spatially-resolved lithium quantification in drill core samples of spodumene pegmatite by using laser-induced breakdown spectroscopy and pixel-matched reference areas. J. Geochem. Explor. 2023, 250, 107235. [Google Scholar] [CrossRef] [Scilit]
  96. Kokkinis, A.; Frantzis, T.; Skordis, K.; Nikolakopoulos, G.; Koustoumpardis, P. Review of Automated Operations in Drilling and Mining. Machines 2024, 12, 845. [Google Scholar] [CrossRef] [Scilit]
  97. Cardoso-Fernandes, J.; Teodoro, A.; Lima, A. Remote sensing data in lithium (Li) exploration: A new approach for the detection of Li-bearing pegmatites. Int. J. Appl. Earth Obs. Geoinf. 2018, 76, 10–25. [Google Scholar] [CrossRef] [Scilit]
  98. Singh, Y. Lithium Potential of the Indian Granitic Pegmatites. J. Geol. Soc. India 2022, 98, 877–1019. [Google Scholar] [CrossRef] [Scilit]
  99. Ma, Y.; Qin, X.; Pan, T.; Chen, J.; Jiang, Z.; Ding, C.; Zhang, D.; Zhang, F.; Feng, N.; Liu, C.; et al. Sedimentary Environment and Source Analysis of Sedimentary Lithium Deposits in Dezong Mahai Salt Lake, Qaidam Basin. Sustainability 2024, 16, 10561. [Google Scholar] [CrossRef] [Scilit]
  100. Kölbel, L.; Kölbel, T.; Herrmann, L.; Kaymakci, E.; Ghergut, I.; Poirel, A.; Schneider, J. Lithium extraction from geothermal brines in the Upper Rhine Graben: A case study of potential and current state of the art. Hydrometallurgy 2023, 221, 106131. [Google Scholar] [CrossRef] [Scilit]
  101. Toprak, S.; Öncel, Ç.; Yılmaz, S.; Baba, A.; Koç, G.A.; Demir, M.M. Lithium extraction from geothermal brine using γ-MnO2: A case study for Tuzla geothermal power plant. Heliyon 2024, 10, e39656. [Google Scholar] [CrossRef] [Scilit] [PubMed]
  102. Balaram, V.; Satyanarayanan, M.; Ray, L. Worldwide geothermal systems as potential sources for critical metals like lithium, rare earth elements, and others. Geosci. Front. 2026, 17, 102337. [Google Scholar] [CrossRef] [Scilit]
  103. Fabre, C.; Ourti, N.E.; Ballouard, C.; Mercadier, J.; Cauzid, J. Handheld LIBS analysis for in situ quantification of Li and detection of the trace elements (Be, Rb and Cs). J. Geochem. Explor. 2022, 236, 106979. [Google Scholar] [CrossRef] [Scilit]
  104. Alfuqara, D.A.; Al-E’bayat, M.S.; Alsaaideh, A.S.; Al Dwairi, R.A. Sustainable Exploration of Critical Minerals: Integrated Magnetotelluric And Gravity Surveys For Lithium Pegmatite Targeting. Int. J. Environ. Sci. 2025, 11, 1700–1713. [Google Scholar]
  105. Munk, L.A.; Boutt, D.; Butler, K.; Russo, A.; Jenckes, J.; Moran, B.; Kirshen, A. Lithium Brines: Origin, Characteristics, and Global Distribution. Econ. Geol. 2025, 120, 575–597. [Google Scholar] [CrossRef] [Scilit]
  106. Fabre, C.; Ourti, N.E.; Mercadier, J.; Cardoso-Fernandes, J.; Dias, F.; Perrotta, M.; Koerting, F.; Lima, A.; Kaestner, F.; Koellner, N.; et al. Analyses of Li-Rich Minerals Using Handheld LIBS Tool. Data 2021, 6, 68. [Google Scholar] [CrossRef] [Scilit]
  107. Sager, M. Lithium-Occurrence and Exposure-A Review. Toxics 2025, 13, 567. [Google Scholar] [CrossRef] [Scilit] [PubMed]
  108. Wise, M.A.; Harmon, R.S.; Curry, A.; Jennings, M.; Grimac, Z.; Khashchevskaya, D. Handheld LIBS for Li Exploration: An Example from the Carolina Tin-Spodumene Belt, USA. Minerals 2022, 12, 77. [Google Scholar] [CrossRef] [Scilit]
  109. Korbel, C.; Mezoued, N.; Demeusy, B.; Fabre, C.; Cauzid, J.; Filippova, I.V.; Filippov, L.O. Quantification of lithium using handheld instruments: Application of LIBS and XRF spectroscopy to assay the lithium content of mineral processing products. J. Anal. At. Spectrom. 2024, 39, 1838–1853. [Google Scholar] [CrossRef] [Scilit]
  110. He, Y.; Wang, X.; Guo, S.; Li, A.; Xu, X.; Wazir, N.; Ding, C.; Lu, T.; Xie, L.; Zhang, M.; et al. Lithium-ion detection in liquid with low detection limit by laser-induced breakdown spectroscopy. Appl. Opt. 2019, 58, 422–427. [Google Scholar] [CrossRef] [Scilit] [PubMed]
  111. Harmon, R.S.; Wise, M.A.; Curry, A.C.; Mistele, J.S.; Mason, M.S.; Grimac, Z. Rapid Analysis of Muscovites on a Lithium Pegmatite Prospect by Handheld LIBS. Minerals 2023, 13, 697. [Google Scholar] [CrossRef] [Scilit]
  112. Balaram, V.; Armstrong-Altrin, J.S.; Khan, R.M.K.; Rao, B.S. Land and marine sedimentary deposits as potential sources of lithium. Int. Geol. Rev. 2025, 67, 1217–1250. [Google Scholar] [CrossRef] [Scilit]
  113. Bush, L. The LIBS Advantage in Mining and Energy Applications. Spectroscopy 2019, 34, 3. [Google Scholar]
  114. Rethfeldt, N.; Brinkmann, P.; Riebe, D.; Beitz, T.; Köllner, N.; Altenberger, U.; Löhmannsröben, H.G. Detection of Rare Earth Elements in Minerals and Soils by Laser-Induced Breakdown Spectroscopy (LIBS) Using Interval PLS. Minerals 2021, 11, 1379. [Google Scholar] [CrossRef] [Scilit]
  115. Yang, Y. Economic Assessment of Using MinEx CRC’s Downhole LIBS Tool in an Mineral Exploration Scenario. Master’s Thesis, University College of London, London, UK, 2024. [Google Scholar]
  116. Akhmetzhanov, T.F.; Labutin, T.A.; Korshunov, D.M.; Samsonov, A.A.; Popov, A.M. Determination of Ce and La in REE-rich ores using handheld LIBS and PLS regression. J. Anal. At. Spectrom. 2023, 38, 2134–2143. [Google Scholar] [CrossRef] [Scilit]
  117. Yang, X.; Kozar, D.; Gorski, D.; Marchese, A.; Pagnotti, J.; Sutterlin, R.; Pisupati, S.V. Using yttrium as an indicator to estimate total rare earth element concentration: A case study of anthracite-associated clays from northeastern Pennsylvania. Int. J. Coal Sci. Technol. 2020, 7, 652–661. [Google Scholar] [CrossRef] [Scilit]
  118. Brinkmann, P.; Köllner, N.; Merk, S.; Beitz, T.; Altenberger, U.; Löhmannsröben, H.G. Comparison Spectrometer to Assess Copper ores by Means of Laser-Induced Breakdown Spectroscopy (LIBS). Minerals 2023, 13, 113. [Google Scholar] [CrossRef] [Scilit]
  119. Jatteau, M.; Cauzid, J.; Fabre, C.; Voudouris, P.; Soulamidis, G.; Tarantola, A. Portable Analyses of Strategic Metal-Rich Minerals Using pXRF and pLIBS: Methodology and Database Development. Data 2025, 10, 12. [Google Scholar] [CrossRef] [Scilit]
  120. Sackett, P. In-Field Measurements of Major Elements and Base Metals with Handheld LIBS; Application Notebook 02-01-2016; SciAps, Inc.: Woburn, MA, USA, 2015. [Google Scholar]
  121. Imashuku, S. Laser-induced breakdown spectroscopy for the identification of mineral phases and lithium distribution in refractories used for cobalt metal recovery from spent lithium-ion batteries. J. Eur. Ceram. Soc. 2024, 44, 116661. [Google Scholar] [CrossRef] [Scilit]
  122. Workman, J., Jr. A Brief Survey of Handheld and Portable Instruments Used in Spectroscopy. Spectroscopy 2020, 6, 6–13. [Google Scholar]
  123. De Pascale, O.; Senesi, G.S. Rapid Determination of Ti in Quartz Using a Portable/Handheld Laser-Induced Breakdown Spectroscopy (LIBS) Instrumentation: A Case Study on Quartz Veinlets in Hornfels from Italy. Minerals 2024, 14, 1257. [Google Scholar] [CrossRef] [Scilit]
  124. Senesi, G.S.; De Pascale, O. Laser-Induced Breakdown Spectroscopy (LIBS) In-Situ: From Portable to Handheld Instrumentation. In Handbook of Cultural Heritage Analysis; D’Amico, S., Venuti, V., Eds.; Springer: Cham, Switzerland, 2022. [Google Scholar] [CrossRef] [Scilit]
  125. Lemière, B. How on-site analytical techniques can help mining waste recovery and valorisation. Discov. Civ. Eng. 2025, 2, 90. [Google Scholar] [CrossRef] [Scilit]
  126. Liu, C.; Guo, J.; Tian, Y.; Zhang, C.; Cheng, K.; Ye, W.; Zheng, R. Development and Field Tests of a Deep-Sea Laser-Induced Breakdown Spectroscopy (LIBS) System for Solid Sample Analysis in Seawater. Sensors 2020, 20, 7341. [Google Scholar] [CrossRef] [Scilit] [PubMed]
  127. Ren, J.B.; Yang, Y.; Zhang, L.X.; Zhang, L.M.; Deng, Y.N.; Ren, Y.Z.; Hong, S.; Ma, J.F.; Deng, X.Z.; Yu, M.; et al. Discovery of Dense Ferromanganese Nodules in the Central Basin of the South China Sea: Insights Into Metallogenesis Processes and Resource Potential. Geophys. Res. Lett. 2025, 52, e2025GL115849. [Google Scholar] [CrossRef] [Scilit]
  128. Balaram, V.; Banakar, V.K.; Subramanyam, K.S.V.; Roy, P.; Satyanarayanan, M.; Mohan, M.R.; Sawant, S.S. Yttrium and rare earth element contents in seamount cobalt crusts in the Indian Ocean. Curr. Sci. 2012, 103, 1334–1338. [Google Scholar]
  129. Fortes, F.J.; Guirado, S.; Metzinger, A.; Laserna, J.J. A study of underwater stand-off laser-induced breakdown spectroscopy for chemical analysis of objects in the deep ocean. J. Anal. At. Spectrom. 2015, 30, 1050–1056. [Google Scholar] [CrossRef] [Scilit]
  130. Sharma, R. (Ed.) Deep-Sea Mining Resource Potential, Technical and Environmental Considerations; Springer Nature: London, UK, 2017. [Google Scholar] [CrossRef] [Scilit]
  131. Ren, J.; Jiang, X.; He, G.; Wang, F.; Yang, T.; Luo, S.; Deng, Y.; Zhou, J.; Deng, X.; Yao, H.; et al. Enrichment and sources of REY in phosphate fractions: Constraints from the leaching of REY-rich deep-sea sediments. Geochim. Cosmochim. Acta 2022, 335, 155–168. [Google Scholar] [CrossRef] [Scilit]
  132. Xing, J.; Ren, J.; Xian, H.; Hein, J.; Yang, Y.; Yan, S.; He, G.; Jiang, X.; Qiu, H.; Zhu, J. Biogeochemical cycling controls REY enrichment in marine phosphates. Sci. China Earth Sci. 2026, 69, 2731–2739. [Google Scholar] [CrossRef] [Scilit]
  133. Thornton, B.; Takahashi, T.; Sato, T.; Sakka, T.; Tamura, A.; Matsumoto, A.; Nozaki, T.; Ohki, T.; Ohki, K. Development of a deep-sea laser-induced breakdown spectrometer for in situ multi-element chemical analysis. Deep Sea Res. Part I Oceanogr. Res. Pap. 2015, 95, 20–36. [Google Scholar] [CrossRef] [Scilit]
  134. Ren, J.B.; He, G.W.; Yang, Y.; Yu, M.; Deng, Y.N.; Pang, Y.T.; Zhao, B.; Yao, H.Q. Ultraselective enrichment of trace elements in seawater by Co-rich ferromanganese nodules. Glob. Planet. Change 2024, 239, 104498. [Google Scholar] [CrossRef] [Scilit]
  135. Yang, G.; Chen, G.; Cai, Z.; Quan, X.; Zhu, Y. Laser-induced breakdown spectroscopy instrument and spectral analysis for deep-ocean Fe-Mn crusts. Front. Mar. Sci. 2023, 10, 1135058. [Google Scholar] [CrossRef] [Scilit]
  136. Guo, J.; Lu, Y.; Cheng, K.; Song, J.; Ye, W.; Li, N.; Zheng, R. Development of a compact underwater laser-induced breakdown spectroscopy (LIBS) system and preliminary results in sea trials. Appl. Opt. 2017, 56, 8196–8200. [Google Scholar] [CrossRef] [Scilit] [PubMed]
  137. Cinquemani, S.M.; Lutz, R.A. Deep-Sea Hydrothermal Vent and Impact-Generated Hydrothermal Vent Systems: Insights into the Origin of Life. J. Mar. Sci. Eng. 2026, 14, 486. [Google Scholar] [CrossRef] [Scilit]
  138. Sui, M.; Zhao, B.; Jia, Z.; Xue, Y.; Liu, Q.; Li, M.; Tian, Y.; Lu, Y.; Zhang, X.; Guo, J. An underwater microimage long-pulse LIBS system: Development and preliminary testing. Spectrochim. Acta Part B At. Spectrosc. 2025, 230, 107234. [Google Scholar] [CrossRef] [Scilit]
  139. Cui, M.; Deguchi, Y.; Wang, Z.; Yao, C.; Tan, L.; Zhang, D. Signal Improvement for Underwater Measurement of Metal Samples Using Collinear Long-Short Double-Pulse Laser Induced Breakdown Spectroscopy. Front. Phys. 2020, 8, 237. [Google Scholar] [CrossRef] [Scilit]
  140. Michel, A.P.M.; Farr, N.E.; Chave, A.D. Evaluation of laser-induced breakdown spectroscopy (LIBS) as a new in situ chemical sensing technique for the deep ocean. In Proceedings of the Oceans 2006, Boston, MA, USA, 18–21 September 2006; p. 307134. [Google Scholar] [CrossRef] [Scilit]
  141. Matsumoto, A.; Sakka, T. A Review of Underwater Laser-induced Breakdown Spectroscopy of Submerged Solids. Anal. Sci. 2021, 37, 1061–1072. [Google Scholar] [CrossRef] [Scilit] [PubMed]
  142. Lazic, V.; Colao, F.; Fantoni, R.; Spizzichino, V.; Jovićević, S. Underwater sediment analyses by laser induced breakdown spectroscopy and calibration procedure for fluctuating plasma parameters. Spectrochim. Acta Part B At. Spectrosc. 2007, 62, 30–39. [Google Scholar] [CrossRef] [Scilit]
  143. Takahashi, T.; Yoshino, S.; Takaya, Y.; Nozaki, T.; Ohki, K.; Ohki, T.; Sakka, T.; Thornton, B. Quantitative in situ mapping of elements in deep-sea hydrothermal vents using laser-induced breakdown spectroscopy and multivariate analysis. Deep Sea Res. Part I 2020, 158, 103232. [Google Scholar] [CrossRef] [Scilit]
  144. Wiens, R.C.; Wan, X.; Lasue, J.; Maurice, S. Chapter 20—Laser-induced breakdown spectroscopy in planetary science. In Laser-Induced Breakdown Spectroscopy, 2nd ed.; Singh, J.P., Thakur, S.N., Eds.; Elsevier: Amsterdam, The Netherlands, 2020; pp. 441–471. [Google Scholar] [CrossRef] [Scilit]
  145. Buckley, S. Geochemical Analysis Using Laser-Induced Breakdown Spectroscopy. Spectroscopy 2023, 6, 10. [Google Scholar] [CrossRef] [Scilit]
  146. Saeidfirozeh, H.; Kubelík, P.; Laitl, V.; Křivková, A.; Vrábel, J.; Rammelkamp, K.; Schröder, S.; Gornushkin, I.B.; Képeš, E.; Žabka, J.; et al. Laser-induced breakdown spectroscopy in space applications: Review and prospects. Trends Anal. Chem. 2024, 181, 117991. [Google Scholar] [CrossRef] [Scilit]
  147. Horton, N.E. Exploration of Mars with the ChemCam LIBS Instrument and the Curiosity Rover; Johnson Space Center: Houston, TX, USA, 2016; Document number: 20160012384. [Google Scholar]
  148. Seel, F.; Schroeder, S.; Clave, E.; Dietz, E.; Hansen, P.B.; Rammelkamp, K.; Hübers, H.W. Lifetime, size and emission of laser-induced plasmas for in-situ laser-induced breakdown spectroscopy on Earth, Mars and Moon. Icarus 2025, 427, 116376. [Google Scholar] [CrossRef] [Scilit]
  149. Maurice, S.; Clegg, S.M.; Wiens, R.C.; Gasnault, O.; Rapin, W.; Forni, O.; Vasavada, A.R. ChemCam activities and discoveries during the nominal mission of the Mars Science Laboratory in Gale crater, Mars. J. Anal. At. Spectrom. 2016, 31, 863–889. [Google Scholar] [CrossRef] [Scilit]
  150. Manelski, H.T.; Wiens, R.C.; Bousquet, B.; Hansen, P.B.; Schröder, S.; Clegg, S.; Cousin, A. LIBS plasma diagnostics with SuperCam on Mars: Implications for quantification of elemental abundances. Spectrochim. Acta Part B At. Spectrosc. 2024, 222, 107061. [Google Scholar] [CrossRef] [Scilit]
  151. Mouélic, S.; Gasnault, O.; Herkenhoff, K.; Bridges, N.; Langevin, Y.; Mangold, N.; Maurice, S.; Wiens, R.; Pinet, P.; Newsom, H.; et al. The ChemCam Remote Micro-Imager at Gale Crater: Review of the first year on Mars. Icarus 2014, 249, 93–107. [Google Scholar] [CrossRef] [Scilit]
  152. Jin, G.; Liu, J.; Liu, C.; Zhang, C.; Wu, Z.; Fu, X.; Qin, X.; Tan, W.; Zhang, L. Evaluating chemical weathering degree of basalts using laser-induced breakdown spectroscopy (LIBS) and its implications for Mars. Spectrochim. Acta Part B At. Spectrosc. 2025, 231, 107257. [Google Scholar] [CrossRef] [Scilit]
  153. Workman, J., Jr. New Discoveries from India’s Chandrayaan-3 Rover at the Lunar South Pole Using LIBS and APXS Spectroscopy. Spectroscopy 2023, 38, 31. [Google Scholar]
  154. Laxmiprasad, A.S.; Sridhar, R.V.L.N.; Goswami, A.; Lohar, K.A.; Rao, M.V.H.; Shila, K.V.; Krishnamprasad, B. Laser Induced Breakdown Spectroscope on Chandrayaan-2 Rover: A miniaturized mid-UV to visible active spectrometer for lunar surface chemistry studies. Curr. Sci. 2020, 118, 573–581. [Google Scholar] [CrossRef] [Scilit]
  155. Zhang, Y.; Ren, X.; Chen, Z.; Chen, W.; Zhang, Z.; Liu, X.; Xu, W.; Liu, J.; Li, C. Wavelength Calibration for the LIBS Spectra of the Zhurong Mars Rover. Remote Sens. 2023, 15, 1494. [Google Scholar] [CrossRef] [Scilit]
  156. Wetzel, W. New Study Reveals How NASA’s Perseverance Rover Uses LIBS for Precise Mars Rock Analysis. Spectroscopy 2024. Available online: https://www.spectroscopyonline.com/view/new-study-reveals-how-nasa-s-perseverance-rover-uses-libs-for-precise-mars-rock-analysis (accessed on 18 November 2024).
  157. Wetzel, W. Using Raman Spectroscopy to Detect Life on Mars. Spectroscopy. July 2024. Available online: https://www.spectroscopyonline.com/view/using-raman-spectroscopy-to-detect-life-on-mars (accessed on 18 November 2024).
  158. Kumar, N.; Lan, Y.; Lu, Y.; Li, Y.; Geng, Y.; Zheng, R. Development of a micro-joule portable LIBS system and the preliminary results for mineral recognition. Optoelectron. Lett. 2018, 14, 401–404. [Google Scholar] [CrossRef] [Scilit]
Figure 1. hLIBS demand and its applications in different areas of science and technology.
Minerals 16 00757 g001
Figure 2. (a) Depicts the principle of a bench-top LIBS instrument, (b) a commercial bench-top LIBS instrument, modified after [43].
Minerals 16 00757 g002
Figure 3. (a) Explains the principles of portable LIBS, (b) a commercial portable LIBS instrument, and (c) a typical LIBS spectrum of a lithium brine sample (modified after [45,46,47]).
Minerals 16 00757 g003
Figure 4. Broadband LIBS spectrum with specific emission lines of some elements like Mg, Si, Al, and K, together with that of Li at 610.79 nm, of a metamorphic rock (modified after [48,49]).
Minerals 16 00757 g004
Figure 5. (a) hLIBS analysis of lithium minerals: (a) spodumene and (b) petalite, modified after [59].
Minerals 16 00757 g005
Figure 6. Broadband LIBS spectrum of a brine sample. Different elemental peaks, including those of lithium, are indicated, modified after [46].
Minerals 16 00757 g006
Figure 7. Linear correlations of REY versus Y. Yttrium serves as a highly reliable tracer and proxy for total REY in geochemical analyses, modified after [117].
Minerals 16 00757 g007
Figure 9. Effect of LIBS spectrum underwater. At ambient pressure, the LIBS spectrum in black shows three emission lines characteristic of zinc in the 465–485 nm region. At 600 bar pressure (red line), one of the three lines has nearly disappeared, while the other two appear significantly broadened (after https://optics.org/news/9/10/26, accessed on 1 July 2026).
Minerals 16 00757 g009
Figure 10. (a) Mars Rover Perseverance, launched on 30 July 2020, contained LIBS for the chemical characterization of surface rocks, and soils https://science.nasa.gov/mission/msl-curiosity (accessed on 1 July 2026). (b) First extraterrestrial LIBS spectrum measured with ChemCam on the surface of Mars, modified after [146].
Minerals 16 00757 g010
Figure 11. (a) The first in situ close-range LIBS emission spectrum of the lunar surface; (b) LIBS instrument on India’s Chandrayaan-3 rover, Pragyaan, modified after [154].
Minerals 16 00757 g011
Table 2. Important differences between laboratory LIBS and handheld LIBS.
FeatureLaboratory LIBS InstrumentHandheld LIBS Instrument
Analytical performanceMaximum analytical performance and versatilityRapid on-site analysis, material identification, and screening
Laser energyHigh, 50–200 mJLow, 5–6 mJ
Spectral resolutionHigh, <0.1 nm to resolve complex spectraModerate, 0.1–0.5 nm for faster analysis
Element coverageCan analyse a wider range of elementsGood at elemental coverage, particularly designed for the detection of light elements such as Li, Be, B, and C.
Sensitivity/detection limitHighest sensitivity/lower detection limitsLow to moderate sensitivity
StabilitySignal fluctuation is minimalSignal fluctuation is common
Accuracy and precisionHigh/superiorLow to moderate
PortabilityFixed in the laboratory, requires a bench, power and cooling (controlled, static environments)Very high, light weight (~2 kg), battery powered
Sample preparation requirementExtensive sample preparation such as cutting, polishing, or making into pellets, to ensure homogeneous and high-precision resultsLittle to no sample preparation, allowing for direct analysis of surfaces (in situ), including rough materials, powders, and liquids.
ApplicationsIdeal for fundamental research, geochemistry, forensic, environmental, etc.Mineral exploration (e.g., Li exploration), recycling, archaeological, environmental, etc.
CostHighLow
Table 4. Some important strengths and limitations of hLIBS in the analysis of minerals.
Mineral GroupExamplesKey Metals hLIBS Can DetectRemarks
OxidesHematite Fe2O3, magnetite Fe3O4, rutile TiO2, etc.Fe, Ti, Al. Mn, etc.Difficult to distinguish between Fe3+ and Fe2+
SilicatesQuartz SiO2, feldspars, clays, olivine, etc.Si, Al, Fe, Mg, Ca, Na, K, etc.-
CarbonatesCalcite CaCO3, dolomite CaMg(CO3)2, etc.Ca, Mg. Mn, Fe, etc.Can not detect CO32−
SulphidesPyrite FeS2, chalcopyrite CuFeS2, galena PbS), etc.Fe, Cu, Co, Pb, Zn, Ag, etc.Less sensitive to sulphur detection
PhosphatesApatite, Ca5(PO4)3(F,Cl,OH)), monazite (Ce,La,Nd,Th)PO4, etc.Ca, REEs, etc.Can not detect PO43−
Table 5. Comparative performance characteristics of different popular portable and laboratory analytical techniques.
FeaturehLIBSpXRFPortable Raman SpectrometerTraditional Laboratory Techniques Like ICP-OES and ICP-MS
PrincipleLaser ablates and ionizes microvolume sample and the emission spectrum is analysed.Primary X-rays excite the atoms in the sample; secondary X-rays are measured.When laser light interacts with matter, the energy of the laser photons gets shifted up or down. The shift in energy gives information about the chemical compositions of the sample.Plasma ionizes atoms, the emitted light is measured in ICP-OES and ions are separated by mass spectrometer and measured in ICP-MS.
Excitation sourceHigh-energy laser pulse focused on a sample, creating a micro-plasma.Primary X-rays from an X-ray tube which excite the atoms of a sample.The excitation source is a high-intensity, monochromatic laser.Inductively coupled plasma (ICP) excitation source.
Elements coverage and key strengthExcellent for light elements like Li, Be, B, and C.Generally, offers higher precision for many heavy elements because X-ray spectra are less prone to interferences.It can only identify minerals and organic compounds.Very good for all elements.
Detection limitsµg/g to % levels, greatly varies with element, major strength is in the detection of light elements like Li and Be.µg/g to % levels, best for mid and high atomic number elements.Vary significantly ranging from single-molecule detection to µg/g levels.pg/mL-ng/mL for elements for ICP-MS, and
ng/mL-µg/mL in the case of ICP-OES.
SpeedIn situ, field-basedIn situ, field-basedFast analysisLaboratory instruments
Spectral resolution, and spot sizeHigh (µm scale), laser spot 50–200 µm, can map mineral grains.Low (mm scale), spot size 3–10 mm, bulk analysis.Spectral resolution in the range of 6 to 10 cm−1, ~100 µm spot size is very common.Analysis of homogenized sample.
Depth profilingYes (via repeated laser pulses)Volumetric analysisNot possiblePossible with difficulty
Sample preparationMinimal, can analyse rock samples, drill cores, and hand specimens directly.Minimal, often requires flat surface, or pressed pellet in a cup.Minimum or no sample preparation.Complete dissolution of the sample by acid or fusion digestion required.
Sample throughputVery high (field)Very high (field)Very high (field)Very high (laboratory)
Accuracy and precisionGood to very good with calibrationGood to very good with calibrationGood to very good with calibrationExcellent
Lithium explorationConsidered standard field toolCan not detect lithium, but can detect some lithium pathfinding elementsCan provide rapid, in situ mineralogical identificationLaboratory support
REE explorationEmerging tool for screeningEstablished tool for screeningCan provide rapid, in situ mineralogical identificationLaboratory support
OperatorSkilled operator can do the job in the fieldSkilled operator can do the job in the fieldSkilled operator can do the job in the fieldHighly qualified operator required
CostModerately expensive, hLIBS units are typically more expensive than pXRFCheaperModerateVery expensive
Operational costLowLowLowVery high
PortabilityYes, true field instrumentYes, true field instrumentYes, true field instrumentLaboratory instrument only
Table 6. Comparison of critical metal concentrations determined by pLIBS with those obtained using ICP-MS in Ni laterites, modified after [70].
ElementpLIBSICP-MS
Ni (%)0.71 ± 0.180.66 ± 0.42
Co (µg/g)406 ± 250391 ± 294
Cr (%)0.80 ± 0.520.70 ± 0.48
Mn (%)0.27 ± 0.040.30 ± 0.15
Zn (µg/g)171 ± 71170 ± 95
Table 7. Comparison of REE concentration in Ni laterites determined using handheld LIBS and ICP-MS analyses, data from [70].
ElementhLIBSICP-MS
Avg. (µg/g)Avg. (µg/g)
La54.3 ± 10.353.99 ± 21.88
Ce99.5 ± 3.594.77 ± 30.02
Pr13.1 ± 1.013.72 ± 5.34
Nd36.4 ± 3.952.62 ± 20.08
Sm15.6 ± 3.511.38 ± 4.30
Gd7.5 ± 1,010.4 ± 3.48
Dy6.4 ± 1.29. 58 ± 3.01
Yb8.7 ± 1.24.56 ± 1.46
Table 8. Indicator minerals, pathfinder elements which act as clues to guide explorers toward the mineral species, lepidolite, petalite, and spodumene [105].
Deposits of InterestType of DepositMain Pathfinder MineralsMain Pathfinder Elements, and Element Ratios
LithiumSedimentary
Brine
Smectites, illites, jadarite, searlesite, zeolite, beryl,
diaspore, boehmite, kaolinite, illite and anatase, clinochlore and lithophosphate.
carnallite, sylvite, ulexite, halite, gypsum.
B, Be, K, Ca, Cs, Rb, Sr, Y, Nb, Sn, Cs, Ta, Sb, W, Bi, As, Ga, Tl, F, Cl, and the REE
K/Rb, K/Cs, Mg/Li, and Li/SO4
Hard rock
Lithium-Caesium-Tantalum (LCT) Pegmatites
Spodumene, petalite, amblygonite, quartz, K-feldspar, albite, or montebrasite, lepidolite, zinnwaldite, eucryptite, cassiterite, lithiophilite, holmquisite, triphylite, muscovite, apatite, tourmaline tantalite-columbite, scheelite,
pollucite, elbaite, tantalite.
REECarbonatite rockBastnäsite group, ancylite,
monazite, (fluor)apatite,
pyrochlore, xenotime, florencite.
Na, Mg, Fe, P, Ba,
F, S, Sr, Ca, Nb,
Th, U, Zr, Cu, Ta,
Ti, V, Mn, Pb.
Igneous rocks
(Including
hydrothermal upgrade)
Bastnäsite group, aegirine, eudialyte, loparite,
allanite, monazite, fergusonite, zircon, xenotime,
fluorapatite, ancylite, gadolinite, euxenite,
mosandrite.
Na, K, Fe, Al, Zr,
Ti, Nb, Ta, Li, F,
Cl, Si, Th, U, P, Cs,
Rb, Sn, W, Mo, Be,
Ga, Hf, Mn, B.
Placers and
palaeoplacers
Monazite, xenotime,
allanite, euxenite.
Ti, Nb, Zr, Au, Sn,
Th, U, Pb, F.
LateritesMonazite, apatite,
pyrochlore, crandallite
group, bastnäsite group, churchite, rhabdophane,
plumbogummite, zircon,
florencite, xenotime,
cerianite.
Fe, Al, Nb, Zr, Ti,
Sn, Mn, P, low Si,
negative
Ce anomaly.
Ion absorption clay depositsKaolinite, halloysite, zircon, monazite, xenotime, quartz, goethite, hematite. Y, Li, Cs, Sn, Ai, Si, Fe
CopperPorphyry copper deposits Chalcopyrite, bornite, pyrite, molybdenite sphalerite, galena.Mo, Au, Bi, Te, Ag, Sn, W, Zn, Pb, Mn
Supergene zone (secondary deposits formed by weathering):Chalcocite, covellite, chalcopyrite, bornite crrollite. Au, Ag, Mo, Te, Se
Volcanic-hosted massive sulfide (VHMS) depositsChalcopyrite, sphalerite, pyrite, pyrrhotite, galena, barite.Cu, Zn, Pb, Ag,
Mo, Sn, Ba As, Sb,
In, Te, Bi, and Tl
Iron oxide copper-gold (IOCG) depositsChalcopyrite, bornite, magnetite, hematite, uraninite.Au, Fe, U, Th, Co, Ni, Bi, Te, K, Na, Mn, Ba, Sr, Cl, Br, and F
Skarn depositsBornite, chalcopyrite, garnet, pyroxene.Mo, Sn, W, Au, Ag, Bi, Te, Zn, Pb, As, and Mn
Supergene deposits (native copper)--
CobaltSediment-hosted copper-cobalt depositsUraninite, monazite, and apatite, chlorite, epidote.Bi, V, Mo, As, Cu, Zn, Ni, Ag, Pb, Se
Magmatic sulfide deposits associated with mafic-ultramafic rocksPentlandite, pyrrhotite, chalcopyrite, linnaeite, chromite, magnetite.Ni, Cu, PGE, As, Au, Ga, V, Cr
Laterite deposits from the weathering of ultramafic rocksGoethite, hematite, asbolane, lithiophorite, romanechite, garnierite, serpentine, chromite, magnetite.Ni, Mn, Cr, Sc, REE
Hydrothermal depositsGoethite, hematite, asbolane, lithiophorite, romanechite, garnierite, serpentine, chromite, magnetite.Ni, Mn, Cr, Sc, REE
TitaniumMagmatic (placer source)Zircon, monazite, garnet, magnetite, ilmenite, rutile, leucoxene.Zr, REE, (La, Ce, Nd), Th, V. Cr
Hard rock primaryIlmenite, rutile. Apatite, magnetite, pyroxene, amphibole, plagioclase.P. Fe, V
Alkaline & carbonatitePerovskite, ilmenite, rutile, apatite, magnetite, pyrite, carbonate minerals.P, Nb, REE, Sr, B
Placer (alluvial, beach)Ilmenite, rutile, zircon, monazite, garnet, leucoxene, sillimanite, kyanite, staurolite.Zr, REE, Th, Au
Tin and TungstenFelsic intrusive granites, quartz veins, skarns, greisens, and placer deposits Cassiterite, wolframite, scheelite, topaz, tourmaline, fluorite. Li, Rb, Cs, F, B, p, S, As, Cu, B. Sb
Table 9. Examples of the use of pLIBS in mineral exploration studies.
PlaceMetal ExplorationElements, Element Ratios, Minerals MeasuredReference
Barroso–Alvão Aplite-Pegmatite Field, Northern PortugalLi-explorationLi, Al, Si, Be, Na, P, K, Mn, Fe, Rb and Cs[57]
Parts of EuropeLi-explorationLi, Be, Cs, F, and Rb, and Li-minerals[110]
The Carolina Tin-Spodumene Belt, USALi-explorationSi, Al, Li, Rb, Cs, Na, Mg, Ca Na, Mg, Ca, K, and Be [111]
Gaston County, North Carolina
USA
Li-explorationLi, K/Rb, muscovite minerals[88]
Table 10. Comparison of lithium values (µg/mL) obtained for different Li-rich brine samples in the Lithium Triangle by both LIBS and AAS, modified after [46].
LIBSAAS
51 ± 345 ± 2
72 ± 253 ± 4
262 ±12141 ± 7
278 ± 9240 ± 12
336 ± 9477 ± 24
504 ± 21593 ± 30
538 ± 21626 ± 31
703 ± 30660 ± 33
639 ± 42710 ± 36
663 ± 39807 ± 42
1056 ± 66852 ± 43
Table 11. Comparison of lithium values of 13 different natural brines extracted from the Atacama Desert in Chile by portable LIBS with those obtained by F-AAS, modified after [92].
Portable LIBSF-AAS
1.19 ± 0.051.32
1.26 ± 0.031.34
1.18 ± 0.021.27
1.18 ± 0.011.29
1.17 ± 0.011.28
1.18 ± 0.021.28
1.21 ± 0.011.26
1.01 ± 0.001.28
1.12 ± 0.051.26
4.75 ± 0.724.55
4.30 ± 0.394.54
3.93 ± 0.084.53
4.67 ± 0.424.56
Table 12. Composition of sediment and rock samples obtained by LIBS in the seafloor in the NW Pacific, data from [137].
SampleDepth mZn %Cu %Mn %Co %Ni %Ti %Ag µg/gSb µg/gAs µg/g
Jude Chimney134019.804.390.08<0.01-<0.01182215628
Hatoma Chimney148512.005.250.46<0.01--48659407550
Yoron Chimney5690.640.10<0.01<0.01--53233308550
Manganese crust13900.100.0616.200.570.460.34<100<100217
Basalt14180.020.020.20<0.010.021.45--<100
Limestone1147<0.010.010.47<0.010.030.04--<100
- Not available; Chimney = A chimney at a mid-oceanic ridge is a vertical, pipe-like structure formed by mineral precipitation from hydrothermal vents.
Disclaimer/Publisher’s Note: The statements, opinions and data contained in all publications are solely those of the individual author(s) and contributor(s) and not of MDPI and/or the editor(s). MDPI and/or the editor(s) disclaim responsibility for any injury to people or property resulting from any ideas, methods, instructions or products referred to in the content.