Article

A Pb-Zn Deposit Prospecting Model for Northeast Yunnan Combining Generative Adversarial Networks and ResNet Convolutional Neural Networks


1
School of Earth Sciences, Yunnan University, Kunming 650500, China
2
Yunnan International Joint Laboratory of China-Laos-Bangladesh-Myanmar Natural Resources Remote Sensing Monitoring, Kunming 650500, China
3
Yunnan Key Laboratory of Sanjiang Metallogeny and Resources Exploration and Utilization, Kunming 650051, China
4
Innovation Base for Metallogenic Regularity and Effective Exploration Technology of Hydrothermal Gold-Copper Polymetallic Deposits, Geological Society of China, Kunming 650500, China
5
Faculty of Earth Resources, China University of Geosciences, Wuhan 430074, China
6
Institute of Geology, Geophysics and Geochemistry Exploration, Yunnan Nonferrous Geological Bureau, Kunming 650216, China
*
Author to whom correspondence should be addressed.
Minerals 2026, 16(7), 722; https://doi.org/10.3390/min16070722
Submission received: 11 June 2026 / Revised: 5 July 2026 / Accepted: 8 July 2026 / Published: 9 July 2026

Abstract

Pb-Zn resources are critical strategic assets for many nations. The Dian-Dongbei (northeastern Yunnan) region in Yunnan Province is a significant production area for these resources in China, boasting considerable prospecting potential. However, conventional exploration methods are increasingly inadequate, as they often fail to rapidly and effectively identify concealed mineralization information. To tackle this challenge, we propose a hybrid GAN-ResNet convolutional neural network methodology. This approach constructs a data-driven prospecting model for Pb-Zn deposits in the Dian-Dongbei region, utilizing multi-source geoscientific data encompassing geology, geophysics, geochemistry, and remote sensing (Geo-Phys-Chem-RS) to conduct quantitative mineral prospectivity mapping. A GAN model was introduced to augment the multi-source geoscientific data based on the concepts of random down-sampling and pseudo-window size. The quality of the generated synthetic samples was evaluated using the Peak Signal-to-Noise Ratio (PSNR) metric. The results show that the synthetic samples achieved an average PSNR value of 33.67 dB, effectively preserving the original features of the geoscientific data. This confirms the feasibility and quality of the data generated by this augmentation method. Furthermore, when applied to train the ResNet model, this augmented data effectively increased the prediction accuracy from 0.765 to 0.842. The results demonstrate that the integrated GAN-ResNet method produces prediction maps with higher accuracy. Moreover, it significantly refines and narrows down the target areas with high mineralization potential. This precision can substantially reduce exploration costs, representing a marked improvement in prediction efficacy.

1. Introduction

Mineral resources serve as the cornerstone of national industrialization and economic development, and their stable supply is directly related to national strategic security and sustainable development [1,2]. However, with continuous economic growth and rapid advancements in technology, domestic demand for mineral resources has been steadily increasing [3,4,5]. Consequently, the contradiction between resource supply and demand has become increasingly prominent [6,7,8]. Pb-Zn resources hold an irreplaceable position in China’s industrialization process. Therefore, further intensifying exploration efforts for Pb-Zn mineral resources and enhancing resource reserve security have become urgent strategic tasks. Various regions in Yunnan Province are rich in mineral resources [9,10]. Notably, the Dian-Dongbei region is a crucial Pb-Zn ore cluster area in China. This region hosts a series of large to super-large Pb-Zn deposits, such as Huize, Maoping, Maozu, Lemachang, and Fulchang, indicating broad prospecting potential [11,12]. Hence, conducting exploration targeting Pb-Zn resources in the Dian-Dongbei region is of significant importance for meeting national industrial raw material demands and promoting regional economic development.
In recent years, numerous researchers have applied machine learning algorithms to the field of geoscience using multi-source data encompassing Geo-Phys-Chem-RS [13]. These applications cover various areas, including lithology identification [14,15,16], geological hazard identification [17,18,19,20], geochemical anomaly recognition [21,22,23,24,25,26,27,28], and mineral resource prediction [29,30,31,32,33,34,35]. However, these traditional machine learning models often possess relatively simple architectures. Their “shallow” learning mechanisms frequently suffer from limitations in expressive power and feature extraction depth when processing vast and complex multi-source geological data. Consequently, they struggle to fully uncover the high-order, nonlinear interactions embedded within the data [36,37]. To overcome these limitations, next-generation artificial intelligence techniques, represented by deep learning, have emerged [38]. By constructing complex neural networks with multiple hidden layers (e.g., Convolutional Neural Networks, CNNs), deep learning enables the layered abstraction and deep feature learning of raw data. This method offers diverse and complex network architectures capable of automatically learning and extracting effective features from massive datasets, thereby building high-precision predictive models through data training [39,40]. Such deep learning algorithms, when processing multi-source and multi-type data, learn to identify relevant patterns, significantly enhancing the accuracy and efficiency of mineral prospectivity modeling [41]. Compared to traditional methods, deep learning can more precisely describe geological spatial structures and information interactions, delving deeper into the intrinsic relationships within the data [42,43].
While deep learning demonstrates exceptional theoretical performance, its practical application in mineral resource prediction is critically framed around its dependence on large-scale, high-quality training data. Deep learning models typically contain millions or even billions of tunable parameters. Such immense model capacity requires massive amounts of data to “feed” and “constrain” them, preventing the model from merely memorizing the noise and specific details of the training samples without learning generalizable patterns—a phenomenon known as “overfitting” [44]. However, ore deposit formation is a rare event controlled by multiple extreme geological conditions. Known deposits (i.e., positive samples—the labeled grid cells assigned a value of 1, representing mineralization-present training units) are often exceedingly scarce and limited in number within vast study areas. To address this sample scarcity, researchers have proposed data augmentation techniques [45]. Traditional augmentation methods, primarily originating from the field of computer vision, involve simple geometric transformations of training images (such as rotation, flipping, scaling, and cropping) or pixel value perturbations (such as adding noise or color jitter) [46,47,48]. In mineral prospectivity modeling, such methods have been adapted, for example, by rotating remote sensing images to augment samples for geological mapping, or by using sliding windows to crop data blocks around known deposits to generate more training units [49]. Nonetheless, these simple geometric transformations risk disrupting the inherent spatial structures and statistical relationships within geological data, potentially resulting in generated “pseudo-samples” with ambiguous geological significance or even introducing misleading information [50]. Consequently, Generative Adversarial Networks (GANs)—a class of generative models introduced by Goodfellow—have been employed as an alternative data augmentation approach [51]. This model learns the features of known sample data, progressively approximates and fits the complex distribution of real data, and then simulates this distribution to generate synthetic data using methods like maximum likelihood estimation. A primary advantage of GANs is that they do not require an explicit definition of a likelihood function; parameters are updated indirectly via the model internal backpropagation mechanism to simulate the real data distribution [52]. Leveraging this characteristic, GANs have been employed for synthetic sample generation across various domains. For instance, Ledig [53] proposed a GAN for image super-resolution capable of generating higher-resolution images with richer texture details, while Zhang utilized a stacked GAN to achieve photorealistic image generation [54].
Taking the Pb-Zn deposits in the Dian-Dongbei as a case study, this research utilizes multi-source geoscientific data (Geo-Phys-Chem-RS). Building upon the augmented data generated by GANs, a targeted mineral prospectivity modeling method suitable for the Pb-Zn deposits in the Dian-Dongbei region is developed. This method is then applied within the study area to delineate prospective exploration targets, aiming to provide crucial support for future Pb-Zn exploration and prospecting efforts in northeastern Yunnan Province.

2. Geological Setting

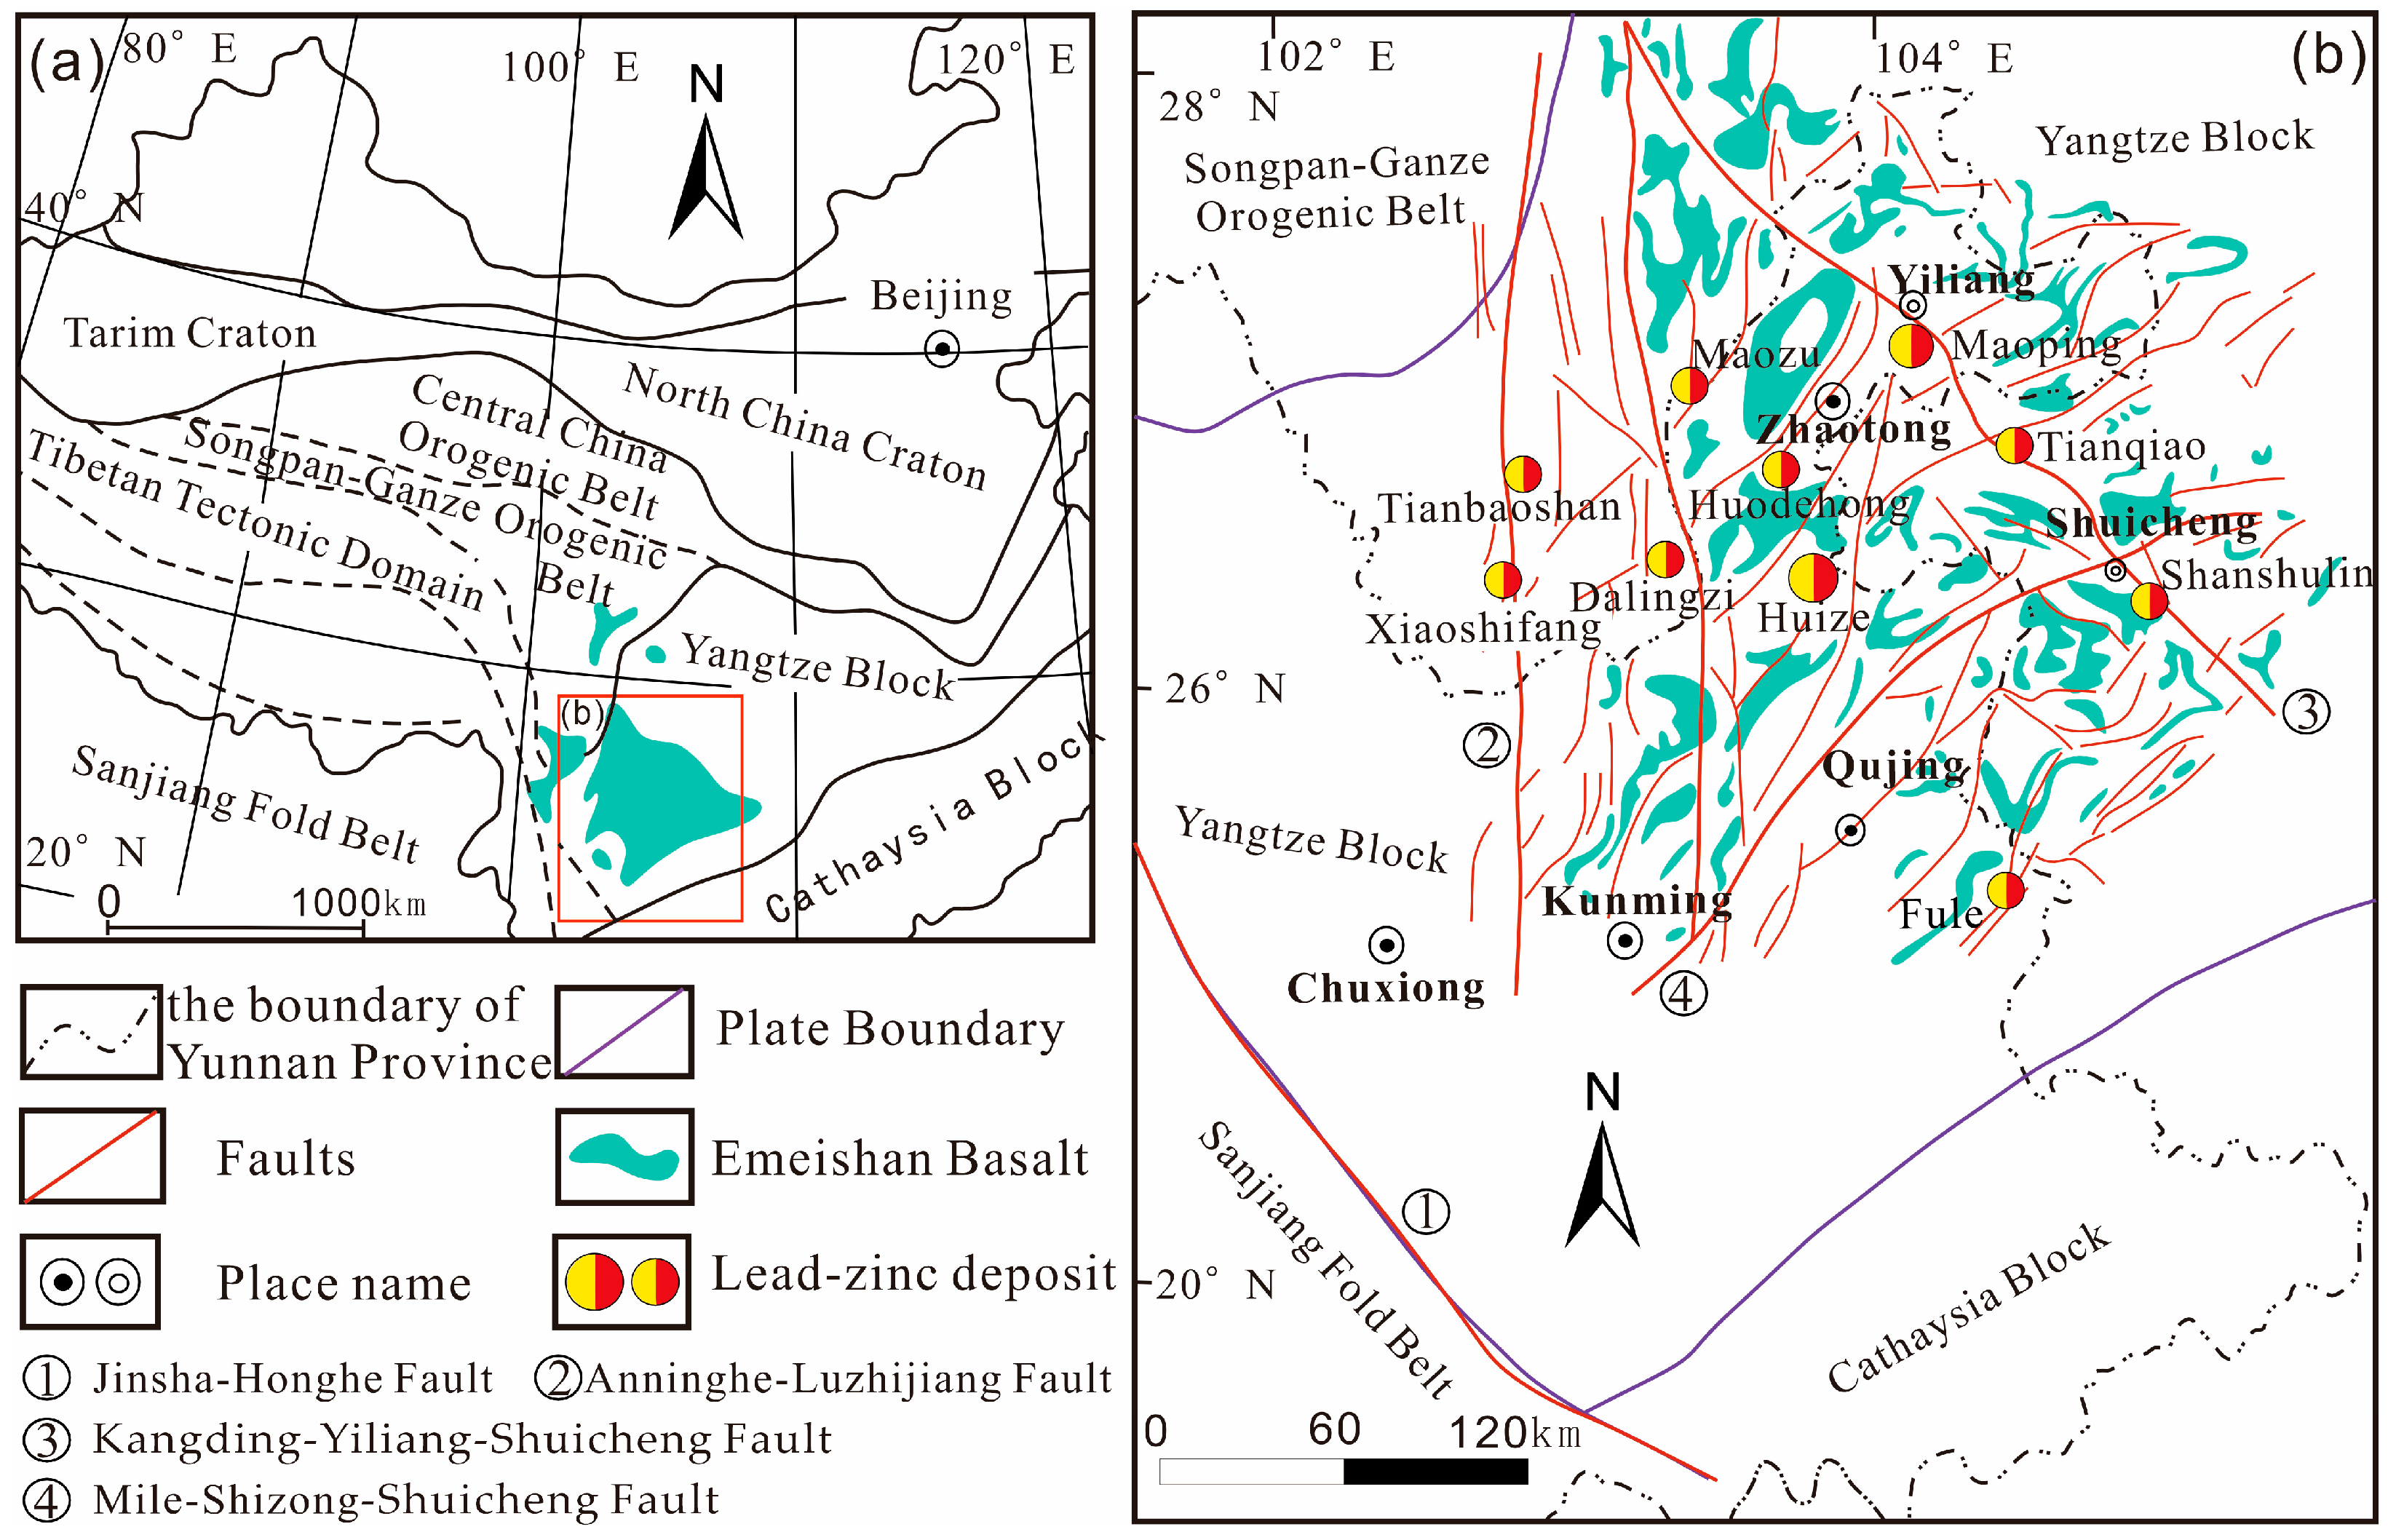
The Sichuan–Yunnan–Guizhou (SYG) Pb-Zn metallogenic province, which includes the northeastern Yunnan study area, is situated in the southwestern part of the Yangtze Block [55]. It lies within the conjunction zone between the Circum-Pacific and Tethyan tectonic domains and is separated from the Sanjiang Fold Belt to its southwest by the Jinsha-Honghe Fault (Figure 1a). The southeastern part of this metallogenic province is adjacent to the Cathaysia Block, its southwestern part borders the Sanjiang Fold System, and its northern part neighbors the Songpan-Ganze Orogenic Belt. This metallogenic province primarily exhibits a triangular shape, which is mainly controlled by a structural framework comprising a fault system with N-S (Anninghe-Luzhijiang Fault), NW-trending (Kangding-Yiliang-Shuicheng Fault), and NE-trending (Mile-Shizong-Shuicheng Fault) orientations (Figure 1b). As an important component of the SYG Pb-Zn metallogenic province, the Dian-Dongbei region is located on the eastern side of the deep-seated Xiaojiang Fault and has undergone multiple episodes of intense tectonic movement (Figure 1b) [56]. The region hosts numerous carbonate-hosted Pb-Zn deposits, often accompanied by associated elements such as silver and germanium [57].
The metallogenic regularity of the Pb-Zn deposits in the Dian-Dongbei region is systematically controlled by multiple factors, including stratigraphy and structure. An in-depth analysis of typical deposits such as Maozu, Huize Qilinchang, and Lemachang reveals their intrinsic mechanisms [58,59,60,61,62]. Research indicates that the ore-hosting horizons exhibit a distinct spatio-temporal migration pattern: from northwest to southeast, these horizons progressively shift from the Sinian–Cambrian systems (e.g., the Maozu deposit) to the Devonian–Carboniferous systems (e.g., the Huize mining district), and finally to the Permian system (e.g., the Fulachang deposit). This spatio-temporal migration of ore-hosting horizons is controlled by the migration of the subsidence center of a NW-trending fault-depression basin, providing a key basis for regional “stratabound prospecting” [62]. A typical example is the Huize Qilinchang deposit, where the primary ore bodies were formed within the Carboniferous Baizuo Formation and were subsequently displaced by later structural modification [60].
Figure 1. (a) Regional tectonic location map and (b) simplified schematic geological map of the Sichuan–Yunnan–Guizhou ore concentration area. (modified from [58,62]).
Minerals 16 00722 g001
The host rocks are predominantly medium- to thick-bedded, coarse-crystalline dolostone, whose genesis is closely related to submarine hydrothermal exhalative sedimentation. From northwest to southeast, the host rock sequences exhibit a distinct and regular evolutionary trend [62]. At the northwestern end, the Maozu deposit features a complex lithological assemblage, including siliceous dolostone, phosphorous-bearing siliceous rock, and limestone, indicating intense hydrothermal activity [62]. In the central area, the Huize Qilinchang deposit is primarily hosted in creamy-yellow, coarse-crystalline dolostone. The surface weathering of pyrite here often forms purplish-red limonite, serving as a prominent prospecting indicator. Towards the southeastern end, at the Fulechang deposit, the lithology becomes more homogeneous, dominated by pure dolostone where the siliceous component disappears while iron and manganese contents increase significantly [61]. Furthermore, the host rock lithology shows a strong correlation with hydrothermal-type mineralization. A typical example is the Lemachang silver-Pb-Zn deposit, where the ore bodies are strictly controlled by fault structures within limestone. In zones of intense dolomitization, where porosity increases, rich ore bodies can form with thicknesses up to 10 m and silver grades reaching 150 g per ton [63]. In contrast, in weakly altered areas, mineralization is often poorly developed, and fault gouge is commonly present.
The regional metallogenic framework is primarily controlled by the NW-trending Yadu-Ziyun synsedimentary fault. As a boundary fault of the northwestern Guizhou–northeastern Yunnan rift basin, its long-term activity governed the submarine hydrothermal exhalative system, establishing the distributional foundation for large deposits such as Maozu and Huize. The fault’s displacement exceeding 2000 m directly influenced the scale of the mineralization. Since the Mesozoic, the NE-trending Mile-Shizong fault experienced compressional-shear activity, which strongly modified pre-existing deposits. A typical example is the Huize Qilinchang deposit, where the originally sub-horizontal ore bodies were compressed into a plunging fold, with their dip angles increasing to 50–70°, resulting in ore body depths (>1000 m) far exceeding their strike lengths (300–500 m). Deeper ore bodies were further uplifted along longitudinal reverse faults, forming near-surface oxidized ores. At the deposit scale, structures play a precise controlling role in the emplacement of hydrothermal ore bodies. For instance, ore bodies in the Lemachang deposit are concentrated within a structural recess where the dip angle of a NE-trending reverse fault changes from steep to gentle (30–40°). Here, fault rocks can reach a thickness of 50 m, and hydrothermal replacement forms thick, massive ore bodies, whereas only narrow veins develop in the steeply dipping segments (>60°). Additionally, tensile spaces formed at anticlinal hinges (e.g., the Lehong deposit) and intersections of multiple fault sets (e.g., the high-grade columnar ore bodies in the Maoping deposit) are also important ore-hosting structures [51].
Based on the analysis of typical Pb-Zn deposits in the northeastern Yunnan (Dian-Dongbei) region, key prospecting indicators can be summarized as follows. Primarily, geochemical anomalies of pathfinder elements such as Pb, Zn, and Ag serve as direct guides for exploration and deep-level prospectivity assessment. Additionally, wall-rock alteration types including dolomitization, calcitization, baritization, and argillization are critical, with dolomitization and limonitization being particularly significant indicators [59]. Furthermore, dolostone is identified as the favorable host lithology for Pb-Zn mineralization. Finally, these deposits are predominantly structurally controlled by fault systems, making areas with well-developed faults favorable targets for exploration. In this context, dolomitization and limonitization serve as surface expressions of hydrothermal fluid activity and oxidation of sulfide minerals, respectively, providing visual guides for exploration. Calcification, baritization, and argillization represent specific hydrothermal alteration types associated with fluid–rock interaction during mineralization. The Pb, Zn, and Ag geochemical anomalies reflect the primary ore-forming elements and their dispersion halos, which are direct indicators of mineralization. The combination of these alteration types, geochemical anomalies, favorable lithology, and structural controls forms the basis for the predictive modeling framework described in Section 3.

3. Materials and Methods

3.1. Data Sources and Processing

To acquire the key prospecting indicators identified in Section 2—namely, lithology, fault structures, wall-rock alteration (dolomitization and limonitization), geochemical anomalies of Pb, Zn, and Ag, and geophysical anomalies—this study utilized multiple data sources, including Landsat-8 OLI and ZY1-02D hyperspectral remote sensing data, WGM2012 and WDMAM gravity and magnetic data, regional geochemical data of Yunnan Province, and fundamental geological and mineral resource information (summarized in Table 1).
Based on the multi-source geoscientific data listed in Table 1, ten types of indicative factor data relevant to Pb-Zn mineralization in the Dian-Dongbei region were obtained through processing. These include lithology, fault structures, residual Bouguer gravity, reduced-to-pole aeromagnetic data, Ag, Pb, Zn, limonite, calcite, and dolomite. Among them, the geochemical elements (Ag, Pb, Zn) are continuous concentration values (in ppm) interpolated from stream sediment data; the geophysical data (gravity and magnetics) are continuous grids; and the alteration minerals (limonite, calcite, dolomite) are binary indicators of mineral presence derived from hyperspectral remote sensing.
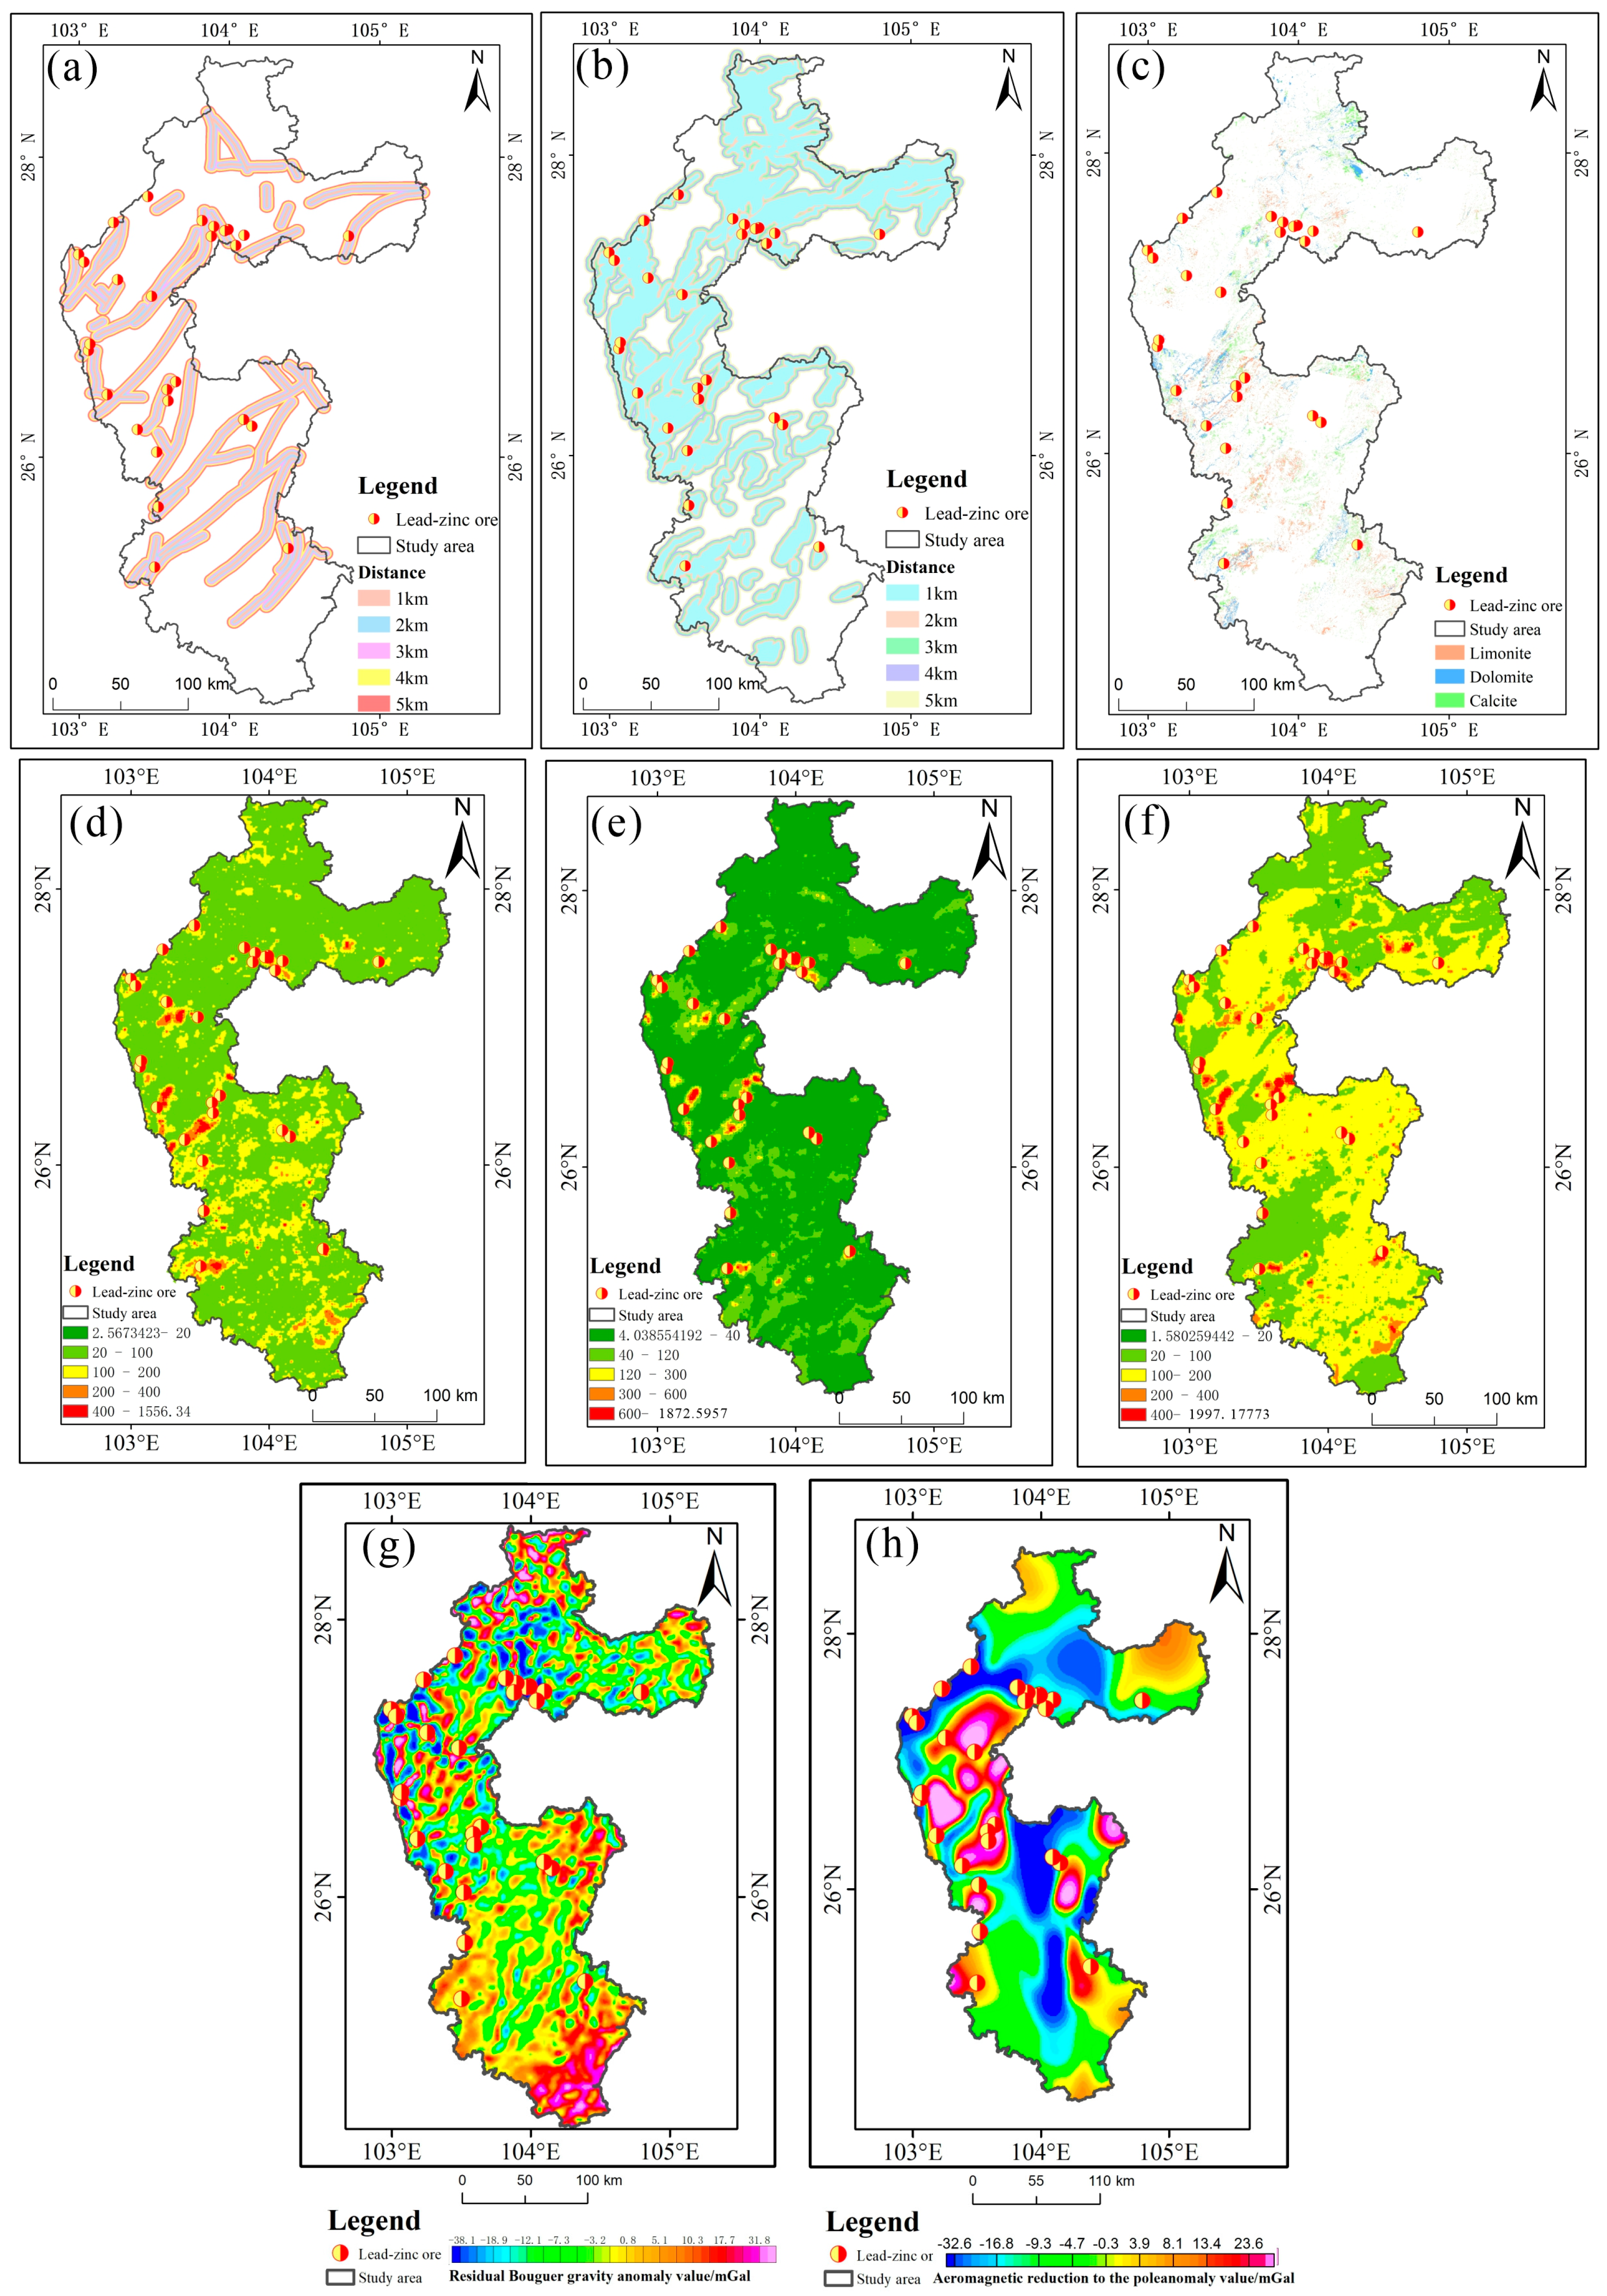
First, using a color composite image (bands 5, 6, 4) of Landsat-8 OLI satellite data as a base map, the remote sensing visual interpretation method was employed to extract a total of 50 linear structures. These were subsequently subjected to buffer analysis using ArcGIS 10.4 software. Five concentric ring buffers with a width of 1 km each were created for the digitized faults (Figure 2a). Buffer values were assigned based on proximity to the fault structures, corresponding to 1, 0.9, 0.8, 0.7, and 0.6 from the nearest to the farthest, respectively [64]. Second, considering the stratigraphic and lithological control on Pb-Zn deposits in the Dian-Dongbei region [65], the Cambrian Lower-Middle Series dolostone, identified as the most favorable for mineralization, was selected as a key geological factor. Using the known outcrop boundaries of the dolostone as a baseline, five concentric ring buffers with a width of 1 km each were constructed outward (Figure 2b). Hierarchical parameter values were assigned to the core area and the buffers. Specifically, the outcrop area was assigned a value of 1, while the five buffers from the innermost to the outermost were assigned values of 0.9, 0.8, 0.7, 0.6, and 0.5, respectively. To minimize interference from zero values during deep learning training and to account for the possibility of concealed rock bodies, areas beyond 5 km from the outermost buffer were uniformly assigned a non-zero background value of 0.1. Third, based on ZY1-02D hyperspectral data, mineral information for limonite, calcite, and dolomite was extracted using the Spectral Angle Mapper (SAM) method (Figure 2c). Fourth, three chemical elements (Ag, Pb, and Zn) closely associated with Pb-Zn mineralization were selected from the geochemical data of Yunnan Province. After processing steps such as outlier removal and inverse distance weighting interpolation, distribution maps for these three elements were generated (Figure 2d–f). Finally, WGM2012 and WDMAM data were used to obtain Bouguer gravity and aeromagnetic data, respectively. Processing using Oasis montaj software (version 8.5) yielded the residual Bouguer gravity data (Figure 2g) and the reduced-to-pole aeromagnetic data (Figure 2h).

3.2. Generative Adversarial Networks

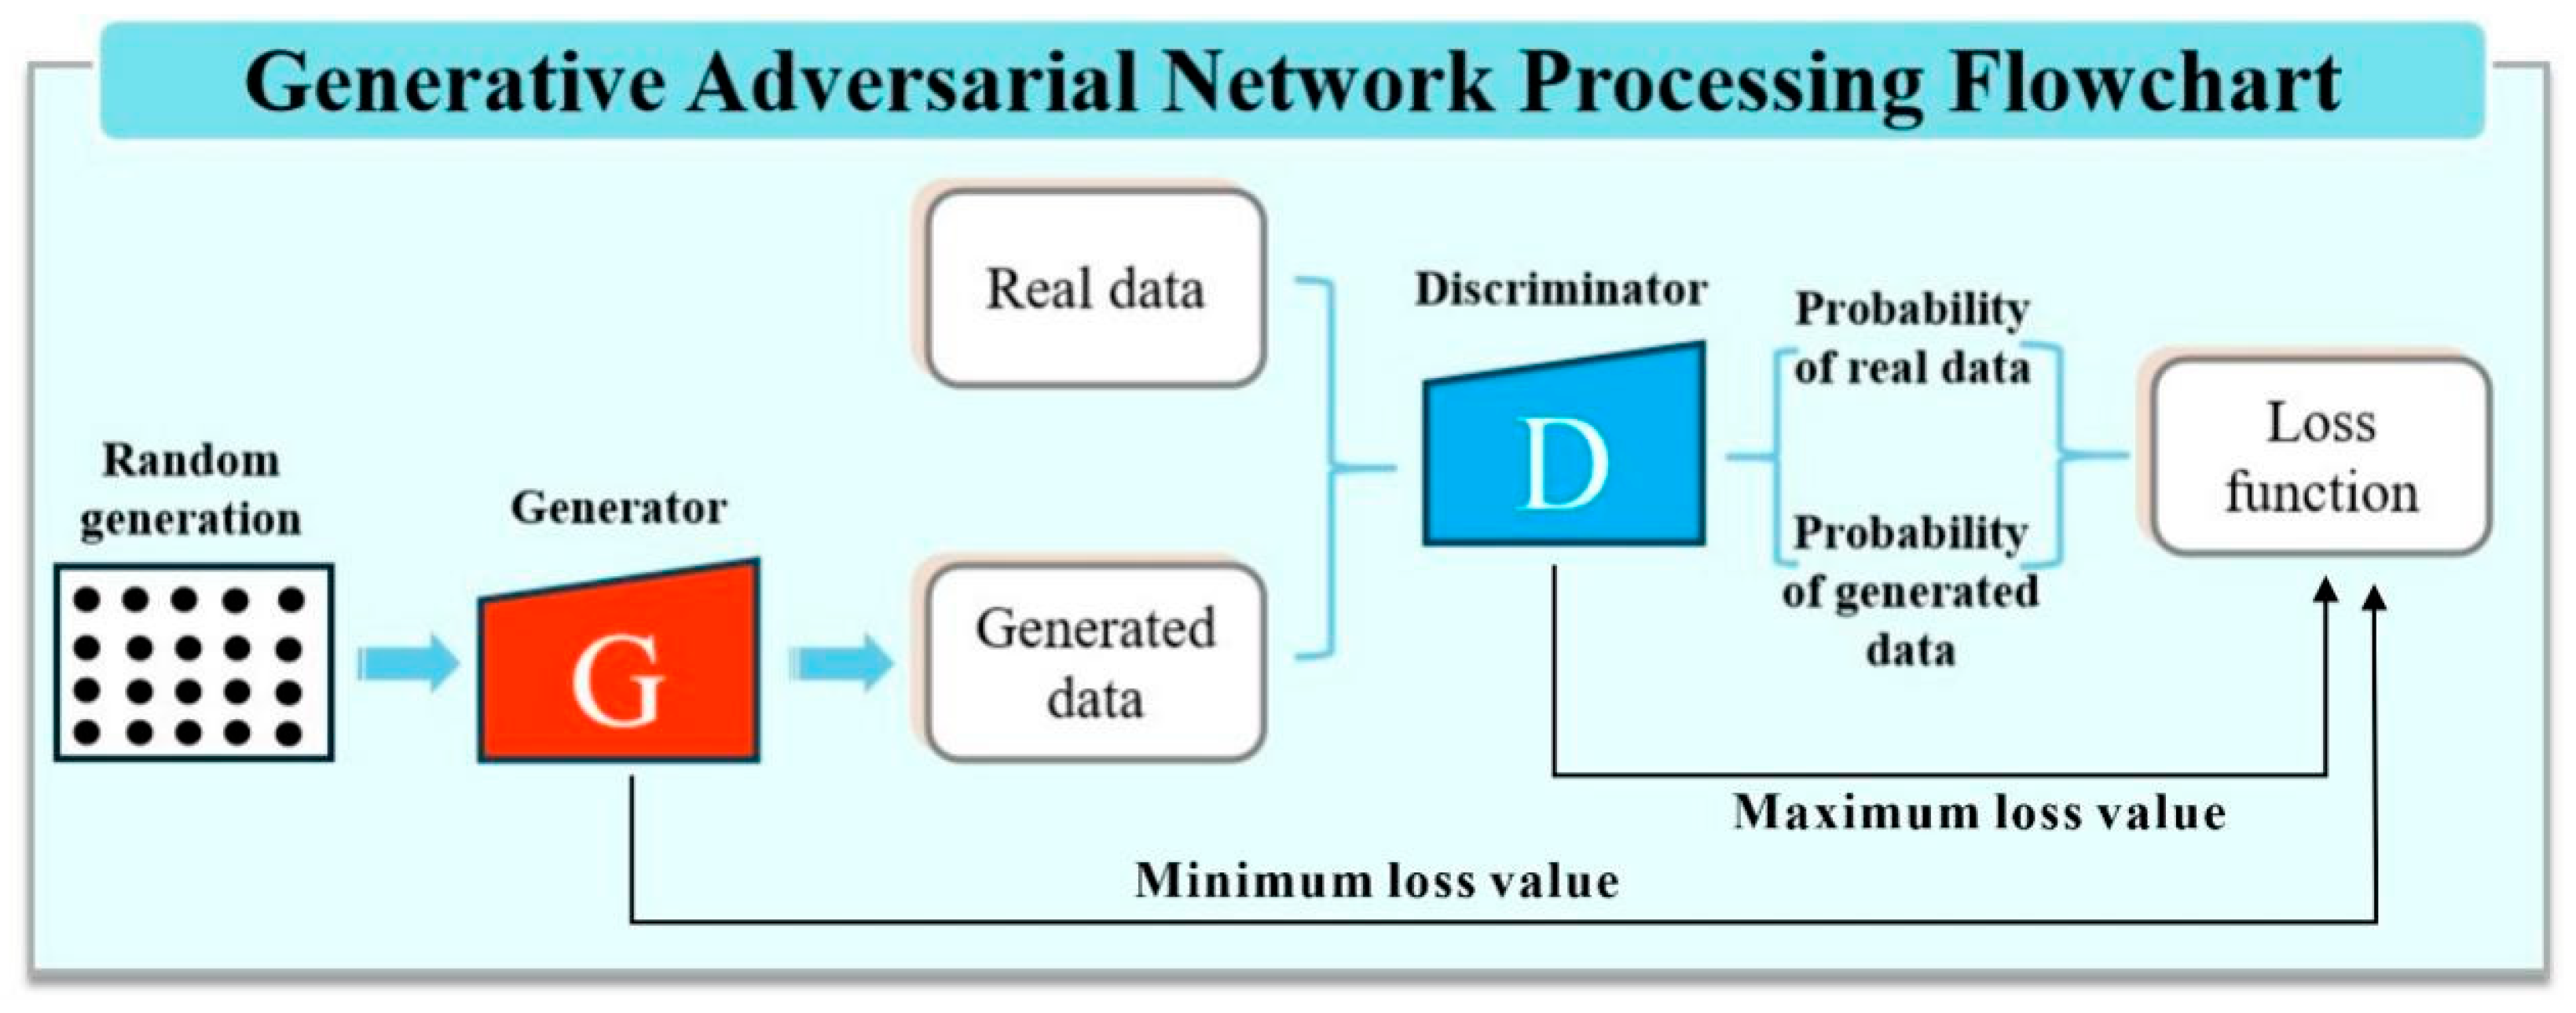
GANs achieve data generation by establishing an adversarial game between a generator and a discriminator. In the classic framework proposed by Goodfellow, the generator attempts to map random noise into realistic synthetic data, while the discriminator tries to distinguish between real data and synthetic data [51]. As shown in Figure 3, a typical GAN consists of two core modules (the generator and the discriminator). The goal of the generator is to produce synthetic samples that the discriminator cannot differentiate from real ones. During training, it continually generates samples that increase the probability of misjudgment by the discriminator, driving the discriminator output toward 1. The objective function for the generator is typically defined as minimizing the following expectation:
min G V ( G , D ) = E Z ~ P Z [ l o g ( 1 ( D ( G ( z ) ) ) ) ]
where z is a random sample drawn from a known random data distribution P Z .
The discriminator is designed to solve a binary classification optimization problem. It receives an input sample and outputs a probability estimate that the sample is real. The training objective for the discriminator is to simultaneously maximize the probability D(x) of correctly classifying real samples as “real” and minimize the probability D(G(z)) of incorrectly classifying generated samples as “real.” This objective can be achieved by optimizing the following expectation function:
max D V ( G , D ) = E x ~ P d a t a [ l o g D ( x ) ] + E Z ~ P Z [ log ( 1 D ( G ( z ) ) ) ]
To quantitatively evaluate the quality of the GAN-synthesized samples, we adopted the Peak Signal-to-Noise Ratio (PSNR), a widely used metric for assessing the similarity between synthetic and real data [67]. This metric assesses the fidelity of augmented samples in terms of their numerical and spatial characteristics by measuring the error between the synthetic data and the original real data. A higher PSNR value indicates the better quality of the generated samples. The specific calculation formula is as follows:
P S N R = 10 × l o g 10 ( M A X 2 M S E )
where Max represents the maximum possible signal value (i.e., the dynamic range of the data), and MSE denotes the Mean Squared Error between the synthetic sample and the real sample. A higher PSNR value indicates closer numerical and spatial structural similarity between the synthetic and real samples, signifying a more effective data augmentation method. The GAN model was implemented using MATLAB R2023a with the Deep Learning Toolbox. The generator and discriminator followed a DCGAN-style architecture, and the network was trained using the vanilla GAN loss. Training was performed with the Adam optimizer (learning rate = 0.0002, β1 = 0.5, β2 = 0.999) with a batch size of 8 and a total of 500 training epochs. A fixed random seed (42) was set.

3.3. Principle of Data Augmentation

To increase the volume of sample data without altering the spatial characteristics of the original data and thereby enhance the accuracy and generalization capability of the deep learning network, a GAN model was constructed using MATLAB software. As a complex deep learning model, the training process of a GAN is inherently unstable and prone to difficulties in convergence [68]. This problem becomes particularly pronounced when the number of training samples is limited. The scarcity of real samples hinders the generator’s ability to adequately explore and fit an overly large latent sample space, making it challenging for the adversarial training to reach an equilibrium. To address this contradiction, a common approach is to impose certain constraints or priors on the generator’s input (random noise) or the network’s learning process, aiming to restrict the search space and stabilize the training dynamics [69].
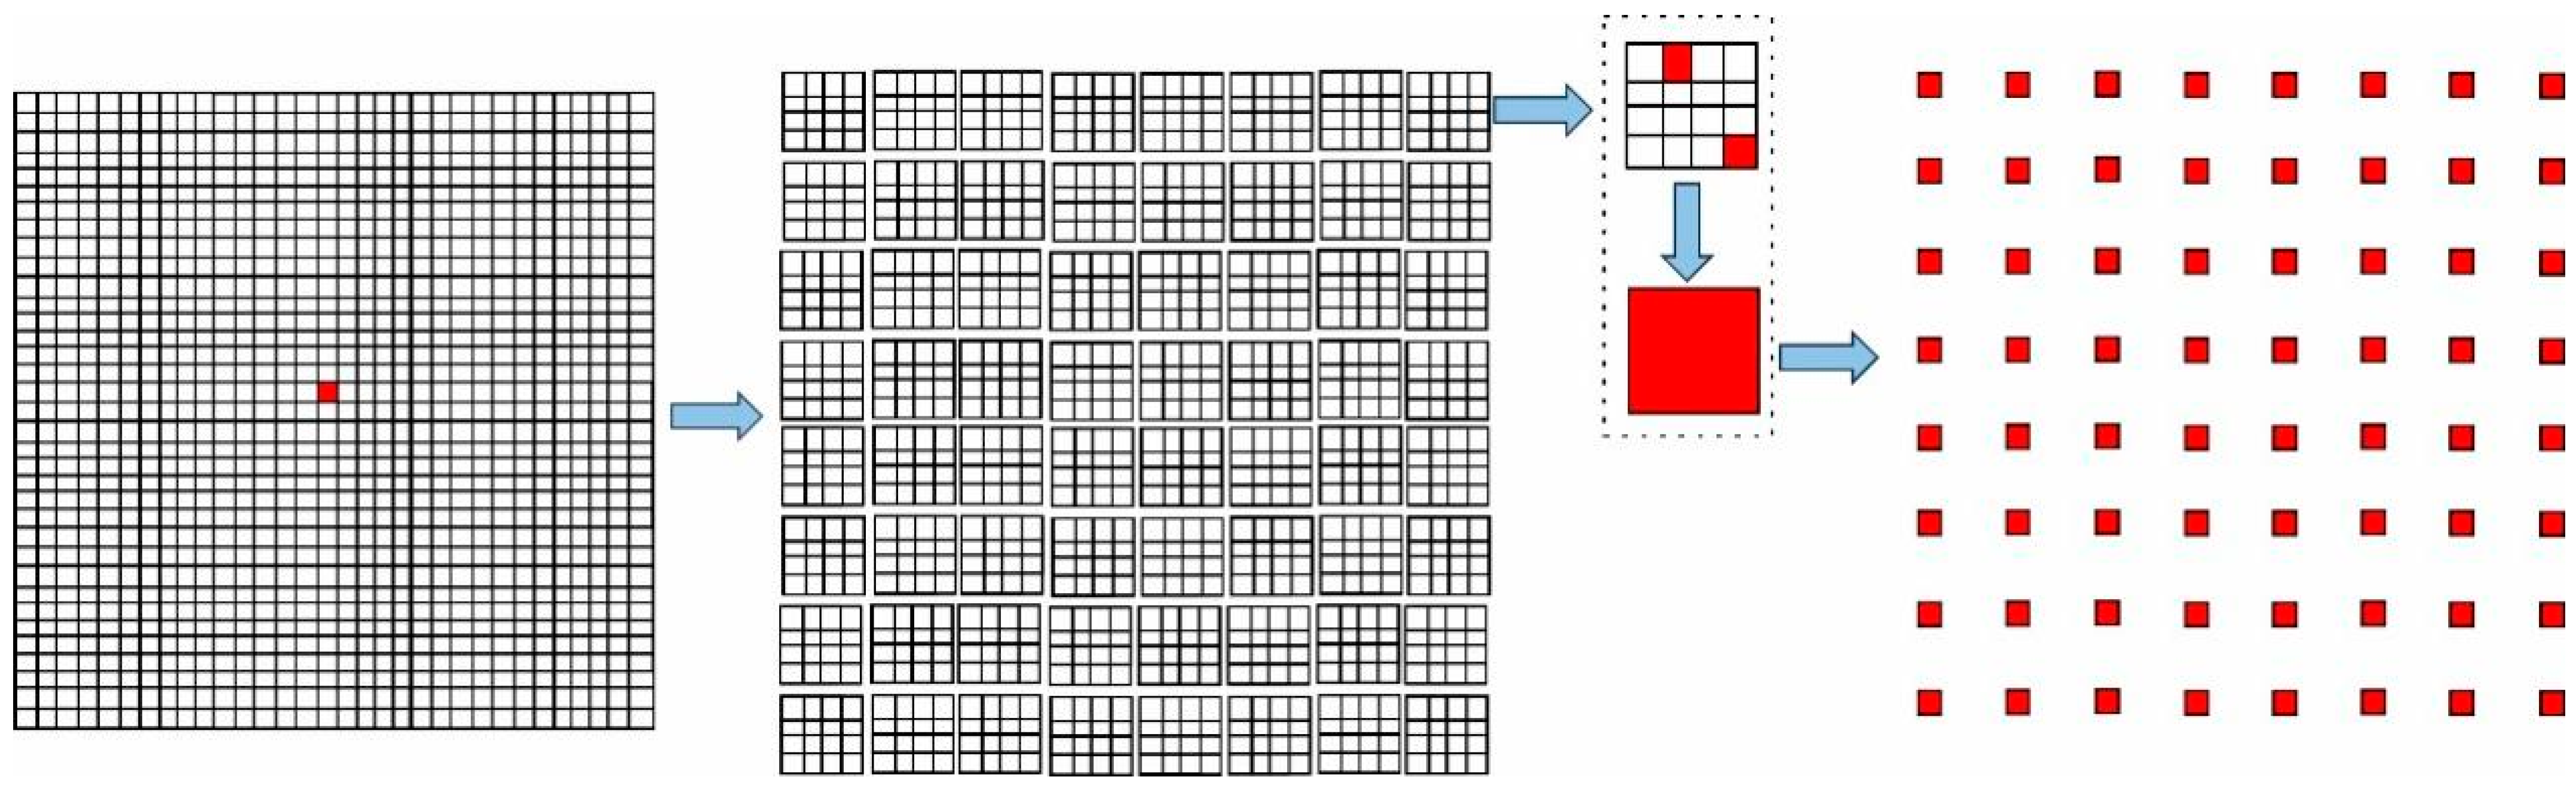
In order to augment multi-source geoscientific data using GANs while ensuring both training stability and the preservation of original geological structural features in the generated data, this study draws inspiration from the concept of Super-Resolution Generative Adversarial Networks [53]. It proposes an input data construction method based on random downsampling to replace simple random noise input. The workflow of this method is as follows: First, a 32 × 32 window centered on a known mineral occurrence is delineated within the dataset as an original sample. Subsequently, this window is evenly divided into 64 sub-units of 4 × 4 pixels each. Within each sub-unit, two non-adjacent grid cells are randomly selected, and their average value is calculated to serve as the downsampled value for that sub-unit. Finally, the downsampled values from all 64 sub-units are reorganized in sequence to form a new 8 × 8 low-resolution sample (Figure 4). This sample serves as the input to the generator. This method preserves the spatial structural information of the original data through the local averaging operation. Simultaneously, the random selection generates nearly infinite possible combinations. This approach ensures the diversity of input data while providing the generator with geologically meaningful guidance, thereby effectively stabilizing GAN training under conditions of limited samples.
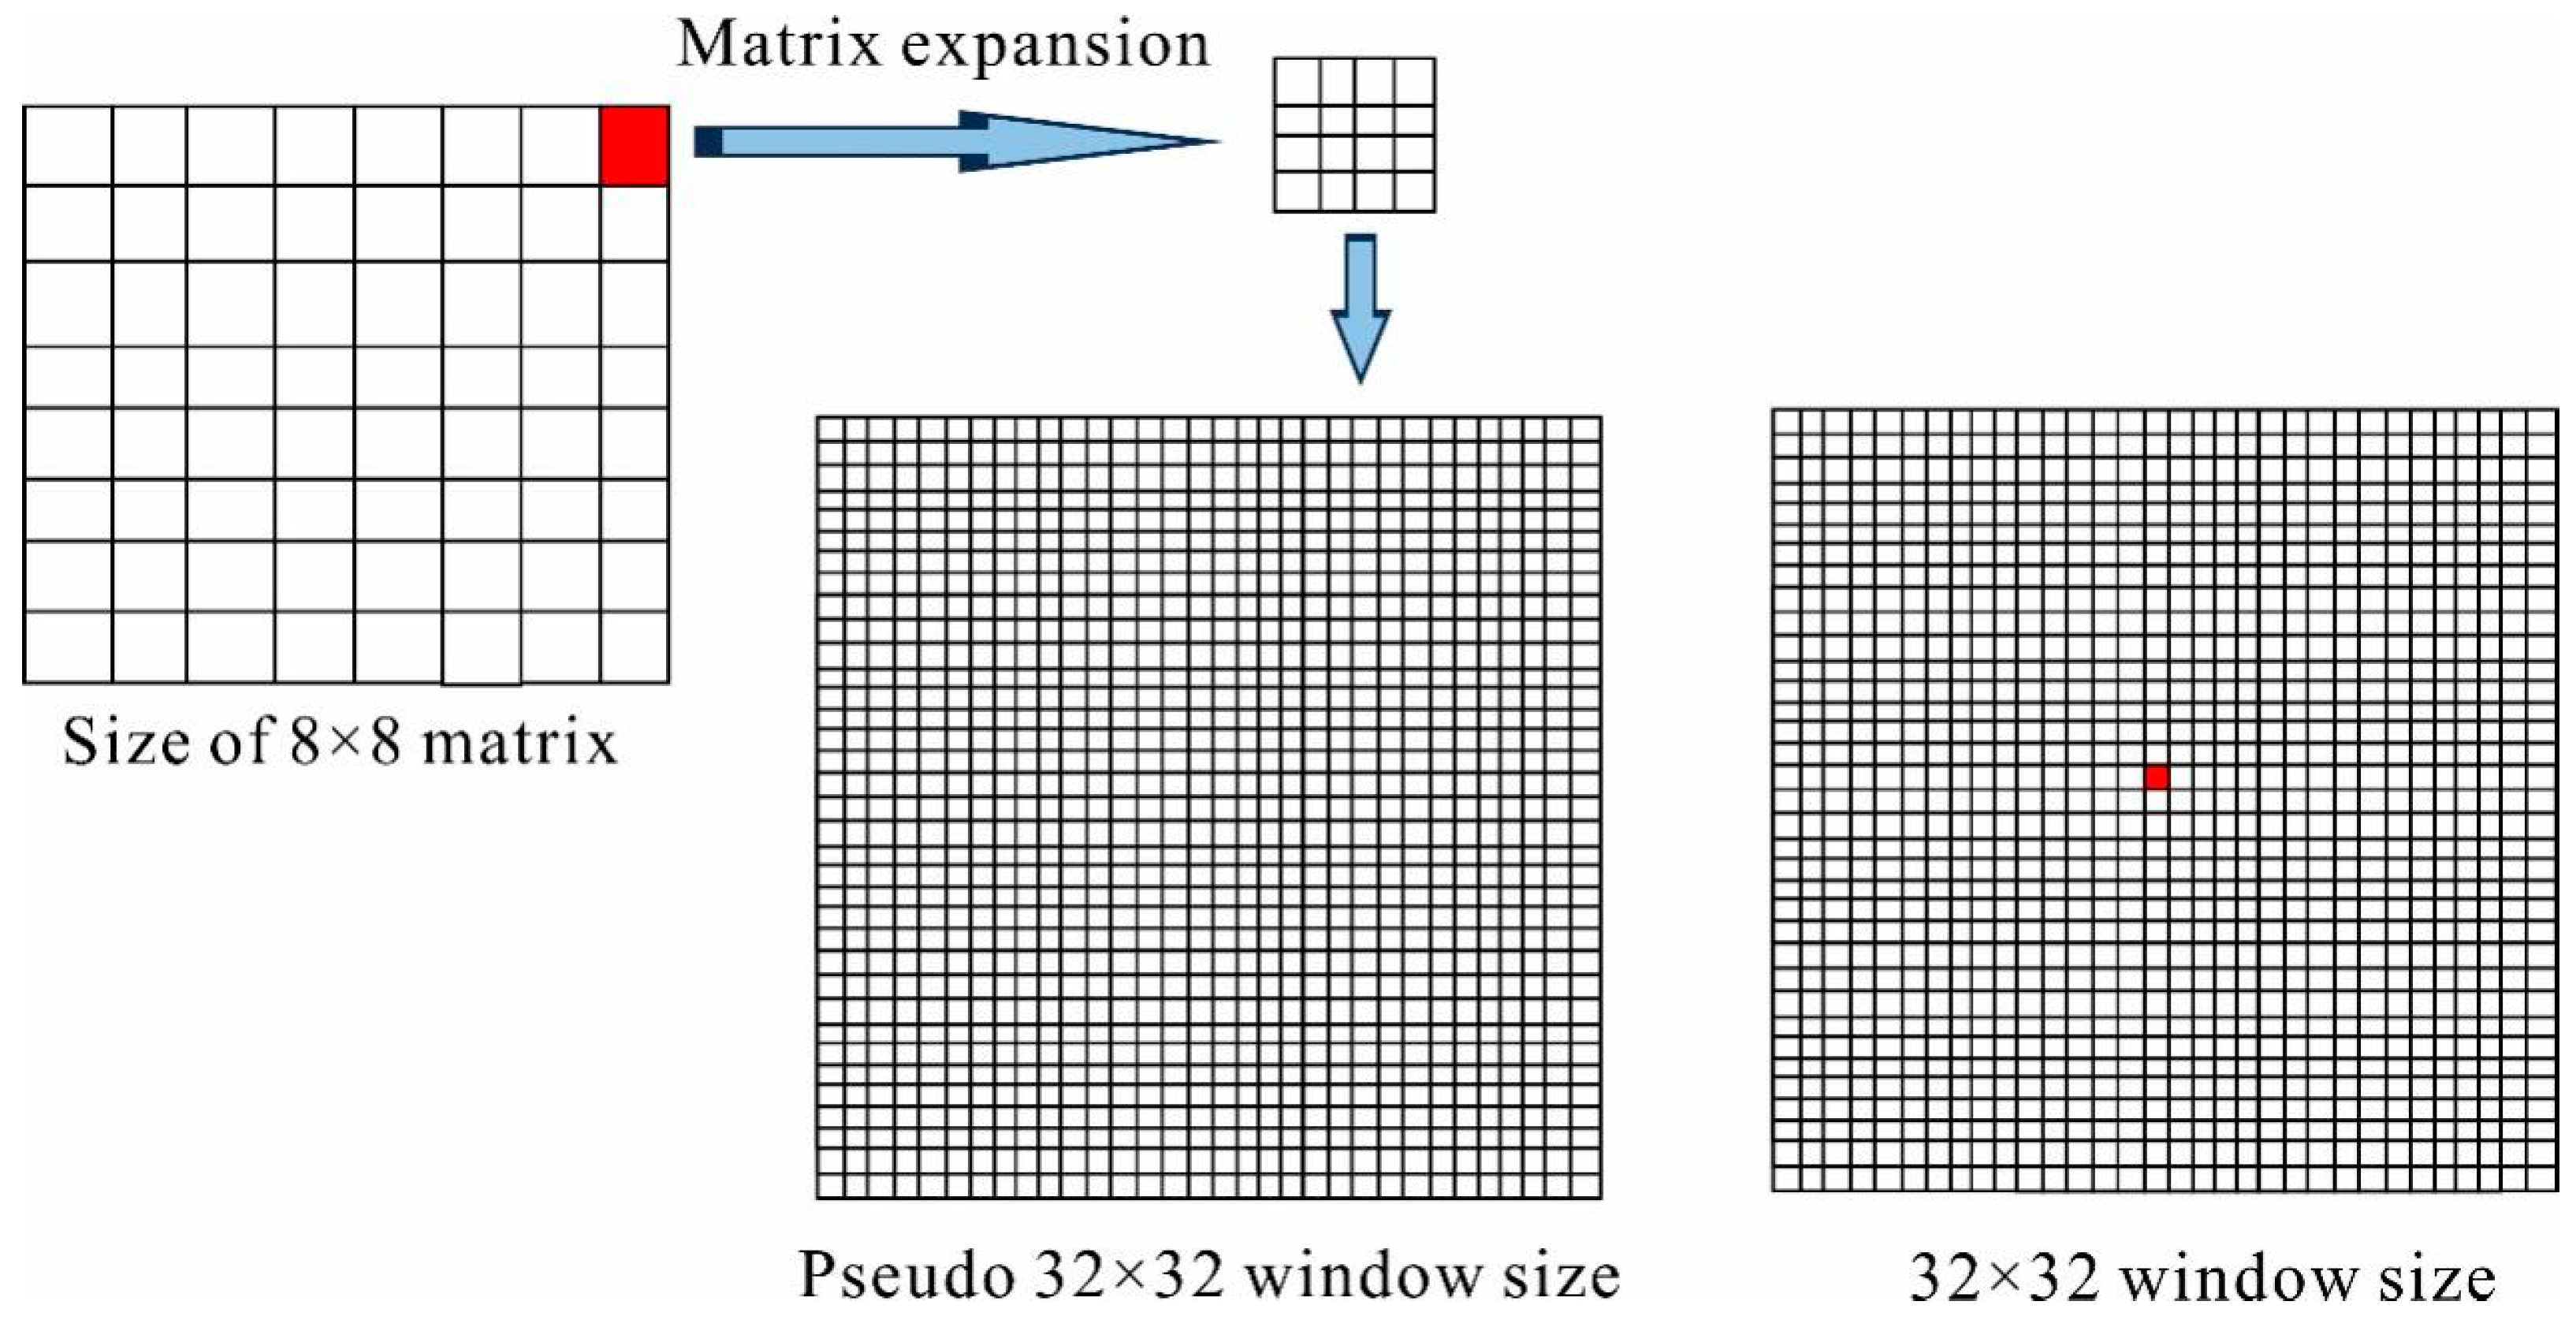
However, a challenge arises in the model architecture of this study: the input training data for the generator has a window size of 8 × 8, while the “learning target” for the generator during training is the real data with a window size of 32 × 32. How to establish a one-to-one correspondence between the training data and the real data was a key problem in building the model. To solve this problem, this study employs a pseudo-window size method (Figure 5). This involves storing the 8 × 8 data in the form of grid cells with a 32 × 32 window size, where each 4 × 4 sub-window of grid cells stores the same data value. By constructing a pseudo 32 × 32 window-sized grid unit, a precise one-to-one correspondence with the real data can be established without losing the original data’s characteristics, thereby better facilitating the generator’s learning process.
After using the 8 × 8 randomly downsampled data as input, the training of the Generative Adversarial Network enters the adversarial stage. The objective of the generator is to reconstruct the 8 × 8 sample into a 32 × 32 sample that possesses the characteristics of real data. Conversely, the objective of the discriminator is to distinguish the generated samples from the original 32 × 32 real samples. The training proceeds iteratively: first, with the discriminator fixed, the generator is updated multiple times based on the gradients backpropagated from the discriminator, driving it to produce samples that can effectively “deceive” the discriminator. Subsequently, with the generator fixed, the discriminator is updated once to enhance its discriminative capability [69]. Since the discriminator typically learns at a faster rate, it can quickly regain its ability to differentiate between real and synthetic samples, thereby initiating a new cycle of generator training. This iterative process continues until the system reaches a Nash equilibrium. At this point, the discriminator’s estimated probability for any input being real approaches 0.5, indicating it has become completely unable to distinguish real from synthetic samples. Concurrently, the generator reaches its optimum, with its loss function values fluctuating around a stable minimum. At this stage, the training is considered to have converged. The generator has learned to sample from a distribution that matches the real data and can generate synthetic data that closely approximates the real samples in both numerical values and spatial structure. This synthetic data can then be effectively used for augmentation.
This study employs a data augmentation method based on Generative Adversarial Networks, with its core innovation lying in the use of data downsampling to replace the common practice of adding random noise in conventional GANs. This improvement offers multiple advantages. First, the downsampled data inherently retains partial spatial structure and numerical characteristics of the original samples, providing the generator with geologically meaningful guidance and simplifying its exploration process. Second, this guided input effectively constrains the latent space, stabilizes the training dynamics, helps prevent issues such as gradient explosion, and accelerates the model’s convergence rate. Ultimately, the trained generator can output synthetic data that closely resembles the real samples in both numerical distribution and spatial structure], thereby achieving high-quality, geologically faithful data augmentation [51,70].

3.4. ResNet Convolutional Neural Network

CNN is a representative model in deep learning, particularly well-suited for processing high-dimensional data with grid-like topological structures. Their core design is inspired by biological visual systems. Through three key mechanisms—local connectivity, weight sharing, and downsampling—CNNs significantly reduce the number of model parameters while effectively extracting hierarchical features from the data. A typical CNN architecture consists of an input layer, convolutional layers, activation functions, pooling layers, fully connected layers, and an output layer. Additionally, layers such as normalization and Dropout can be incorporated to enhance training stability [37,39,46]. A unique strength of CNNs lies in their “end-to-end” learning capability. Taking image processing as an example, the network can directly receive raw pixel data as input and automatically perform feature extraction from low-level to high-level abstractions for classification, bypassing complex manual feature engineering and data reconstruction processes. This not only reduces model complexity and the risk of overfitting but also facilitates optimization [37,46,47]. Consequently, CNNs have demonstrated exceptional performance in fields such as image recognition, speech processing, and within geoscience for tasks like mineral identification and structural interpretation.
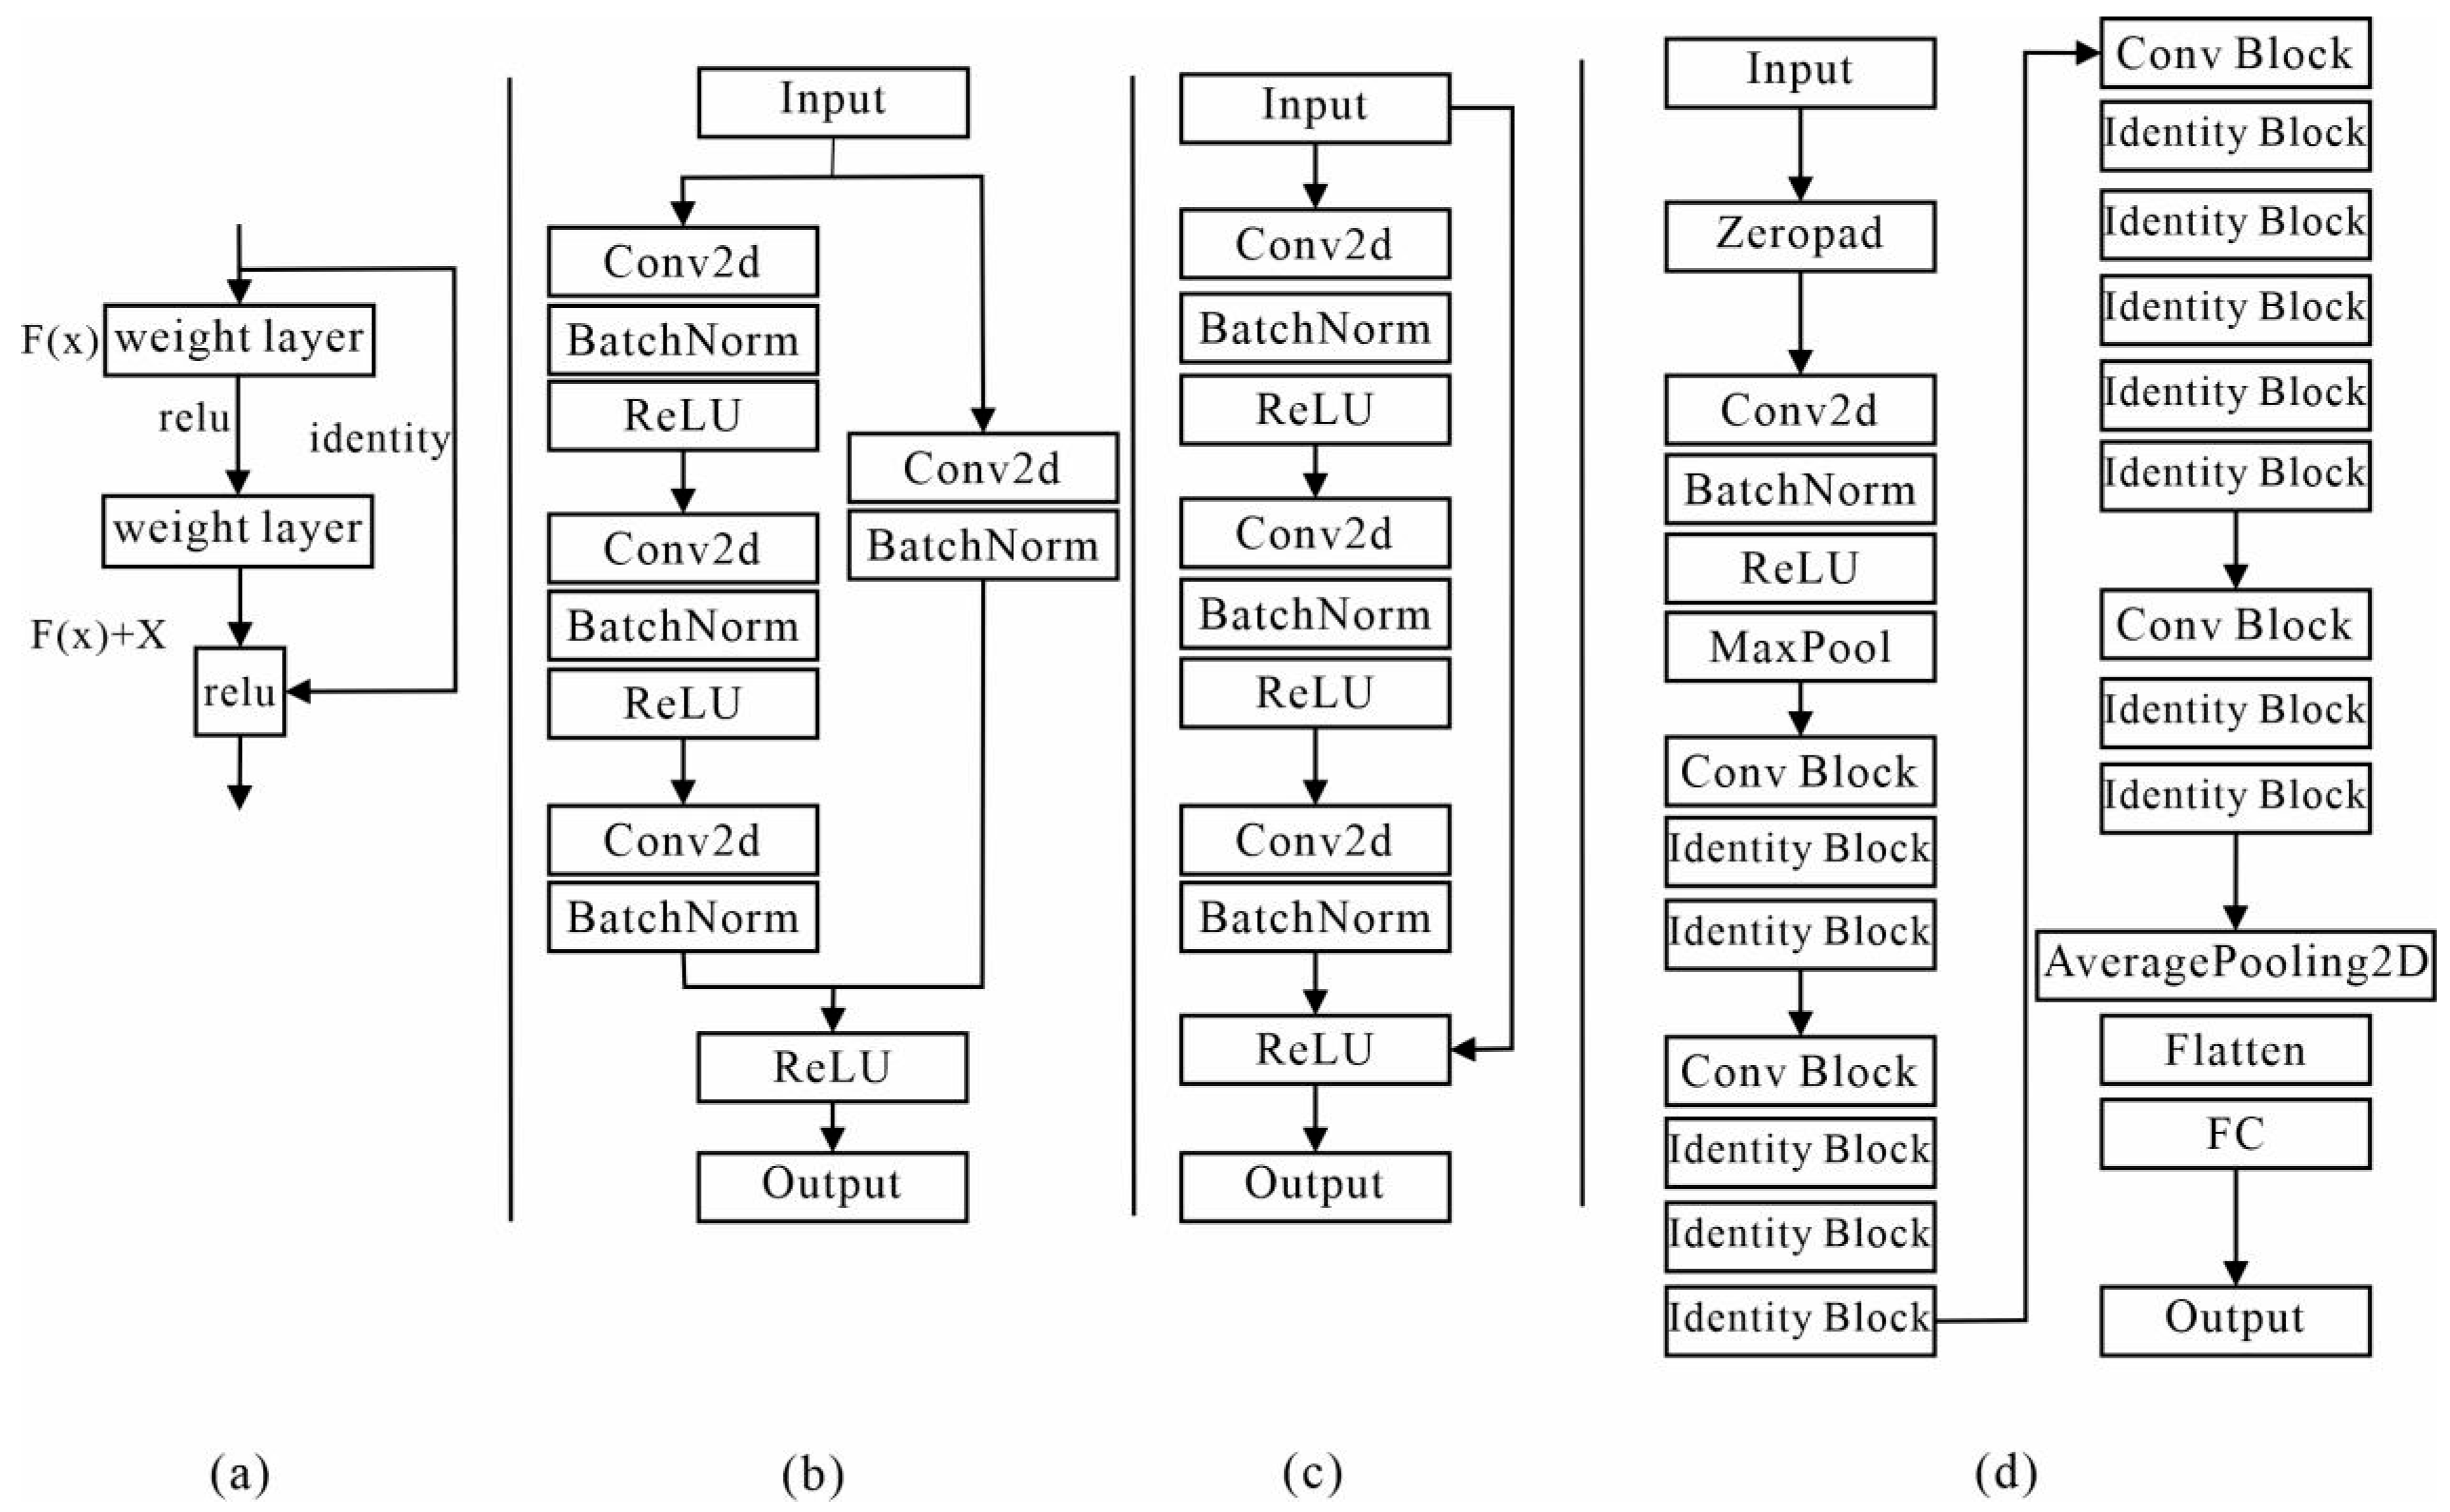
This study employs the Deep Residual Network (ResNet), proposed by Kaiming He, as its foundational framework [71]. The core innovation of this model lies in the introduction of the residual learning concept. By constructing residual blocks with “shortcut connections”, it enables the direct, skip-layer transmission of features from preceding layers to subsequent ones (Figure 6a). This mechanism effectively alleviates the common problems of vanishing or exploding gradients in deep neural networks, making it feasible to train extremely deep networks—a property well-suited for handling complex geoscientific data. ResNet is composed of two fundamental building blocks, namely the Conv Block and the Identity Block. As shown in Figure 6b, the Conv Block contains convolutional layers designed to alter the dimensions of feature maps (e.g., for downsampling) and the number of channels, serving to connect sub-networks of different dimensions. As shown in Figure 6c, the input and output dimensions of the Identity Block remain consistent. It is primarily used for stacking to significantly increase network depth without changing the data dimensions. The specific network topology constructed for this study is illustrated in Figure 6d.
The ResNet-18 architecture was implemented using MATLAB R2023a with the Deep Learning Toolbox. The network was trained using the Adam optimizer with an initial learning rate of 0.001, decayed by a factor of 0.1 every 50 epochs, and a batch size of 32. The loss function was cross-entropy. A maximum of 200 epochs was set, with early stopping (patience = 20) based on the validation loss. A fixed random seed (42) was used.

4. Results

4.1. Data Augmentation Based on Generative Adversarial Networks

A total of 27 Pb-Zn mineral occurrences were vectorized within the study area. To subsequently test the effectiveness and generalization capability of the deep learning model, 20 of these occurrences were randomly selected as training data, with the remaining 7 reserved as test data. Furthermore, in constructing the Pb-Zn prospectivity model, supervised learning requires not only a positive sample set reflecting mineralization characteristics, but also a negative sample set representing background areas with low mineralization probability. The selection of negative samples is crucial for the model to accurately learn the boundary between mineralized and non-mineralized areas, directly impacting the reliability of prediction results [41]. Currently, three main approaches exist for selecting negative samples: (1) random selection of non-mineralized points across the study area; (2) selecting points of other deposit types with completely different genetic origins as negative samples; and (3) selecting low-probability points from areas definitively lacking mineralization conditions (e.g., outside specific strata or structures) based on geological understanding [72,73]. The negative samples were selected by random sampling from areas independently confirmed to lack mineralization conditions, with the number of negative samples set equal to that of the positive samples, yielding a combined dataset of 40 labeled samples (20 positive and 20 negative). Following the creation of the integrated Geo-Phys-Chem-RS dataset described above, the ten indicator layers were compiled for model training. Using MATLAB software, the specific locations of the positive and negative samples were read. Training datasets for each indicative factor were then created by extracting data using a window size of 32 × 32 pixels centered on each sample location.
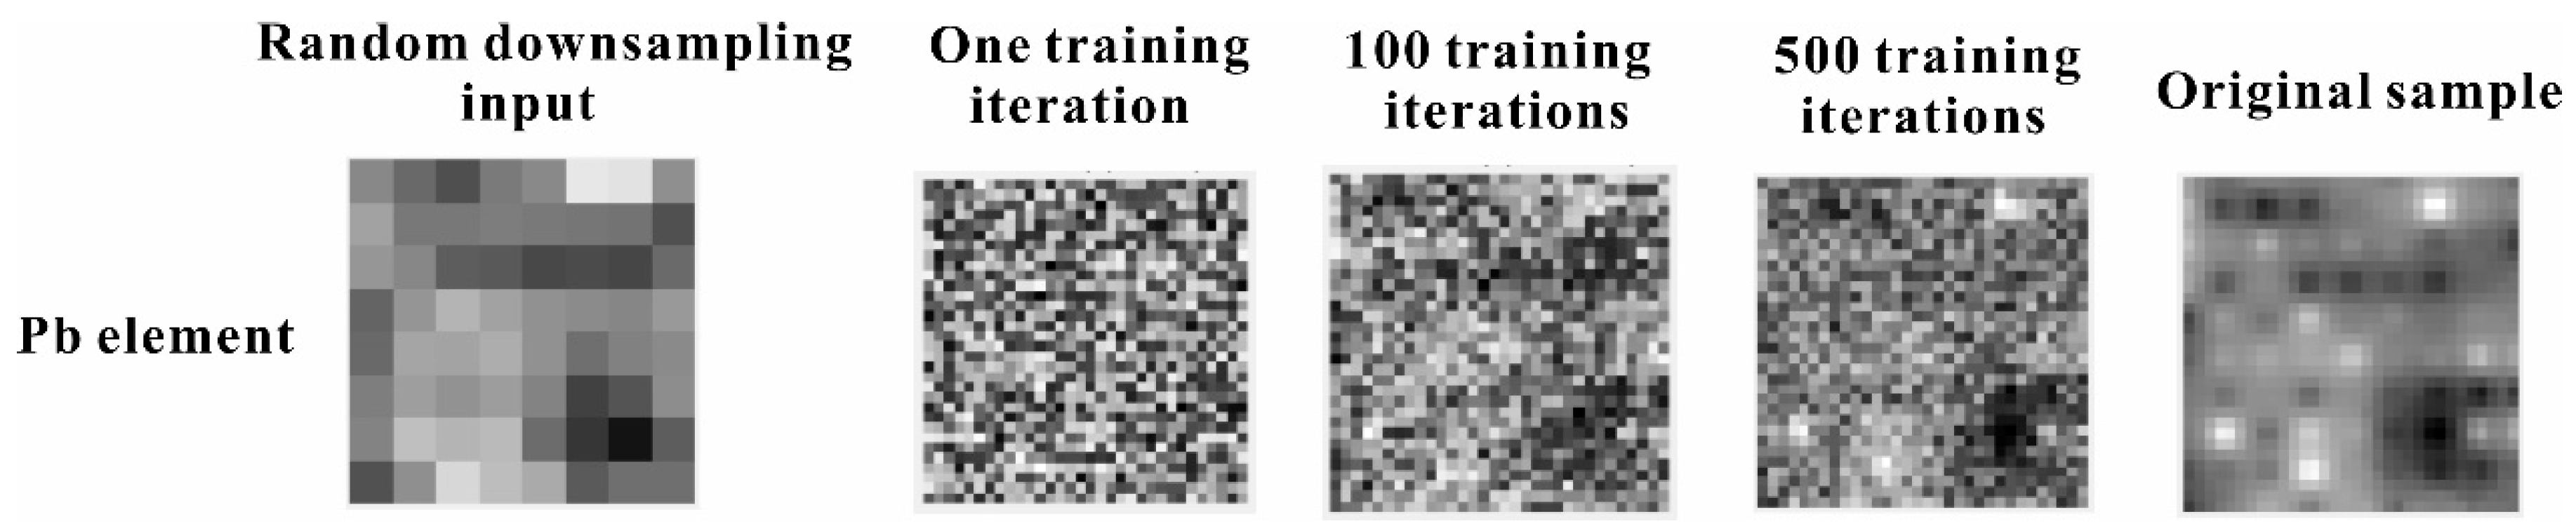
The data augmentation method based on a GAN was applied to learn from and augment the constructed set of 20 positive samples and 20 negative samples, respectively. It is important to emphasize that the GAN was trained exclusively on the training partition (16 positive and 16 negative samples) prior to any augmentation of the validation set. The validation samples were augmented only after the GAN had converged, using the trained generator, and these augmented validation samples were used solely for evaluating the ResNet model—never for training the GAN or for tuning the ResNet model. This strict separation ensures that no data leakage occurs between the training and validation phases. As shown in Figure 7, the quality of the generated samples improved significantly with increasing training epochs. In the initial stages of training, the generated data appeared disorganized. After approximately 100 epochs, the generated data began to capture and exhibit the spatial structural patterns of the original data. As training progressed, the similarity between the generated samples and the real samples continuously increased in terms of both numerical distribution and spatial structure. Around 500 epochs, the generator’s output tended to stabilize, indicating that the model had converged.
A PSNR value greater than 30 typically indicates good image quality with acceptable levels of distortion (as shown in Table 2). Prior to PSNR calculation, all geoscientific data layers were normalized to a unified 8-bit equivalent dynamic range of 0–255 (i.e., Max = 255). This ensures that PSNR values are computed on a consistent scale across all data types (geological, geophysical, geochemical, and remote-sensing layers). The quality classification thresholds in Table 2 follow the established PSNR scale reported in Soliman [69], where the 30–40 dB range is defined as indicating good quality with perceptible but acceptable distortion. In this study, PSNR is employed as a relative consistency check to verify that the GAN-generated synthetic samples maintain numerical and spatial similarity to the original real samples, rather than as an absolute measure of geological fidelity. The calculation results show that the average PSNR value between the synthetic samples generated via GAN-based augmentation and the original real samples remains stable at approximately 33.67 dB. This value indicates that the synthetic data exhibits low pixel-level numerical error and demonstrates high consistency with the real samples in terms of spatial structural characteristics.
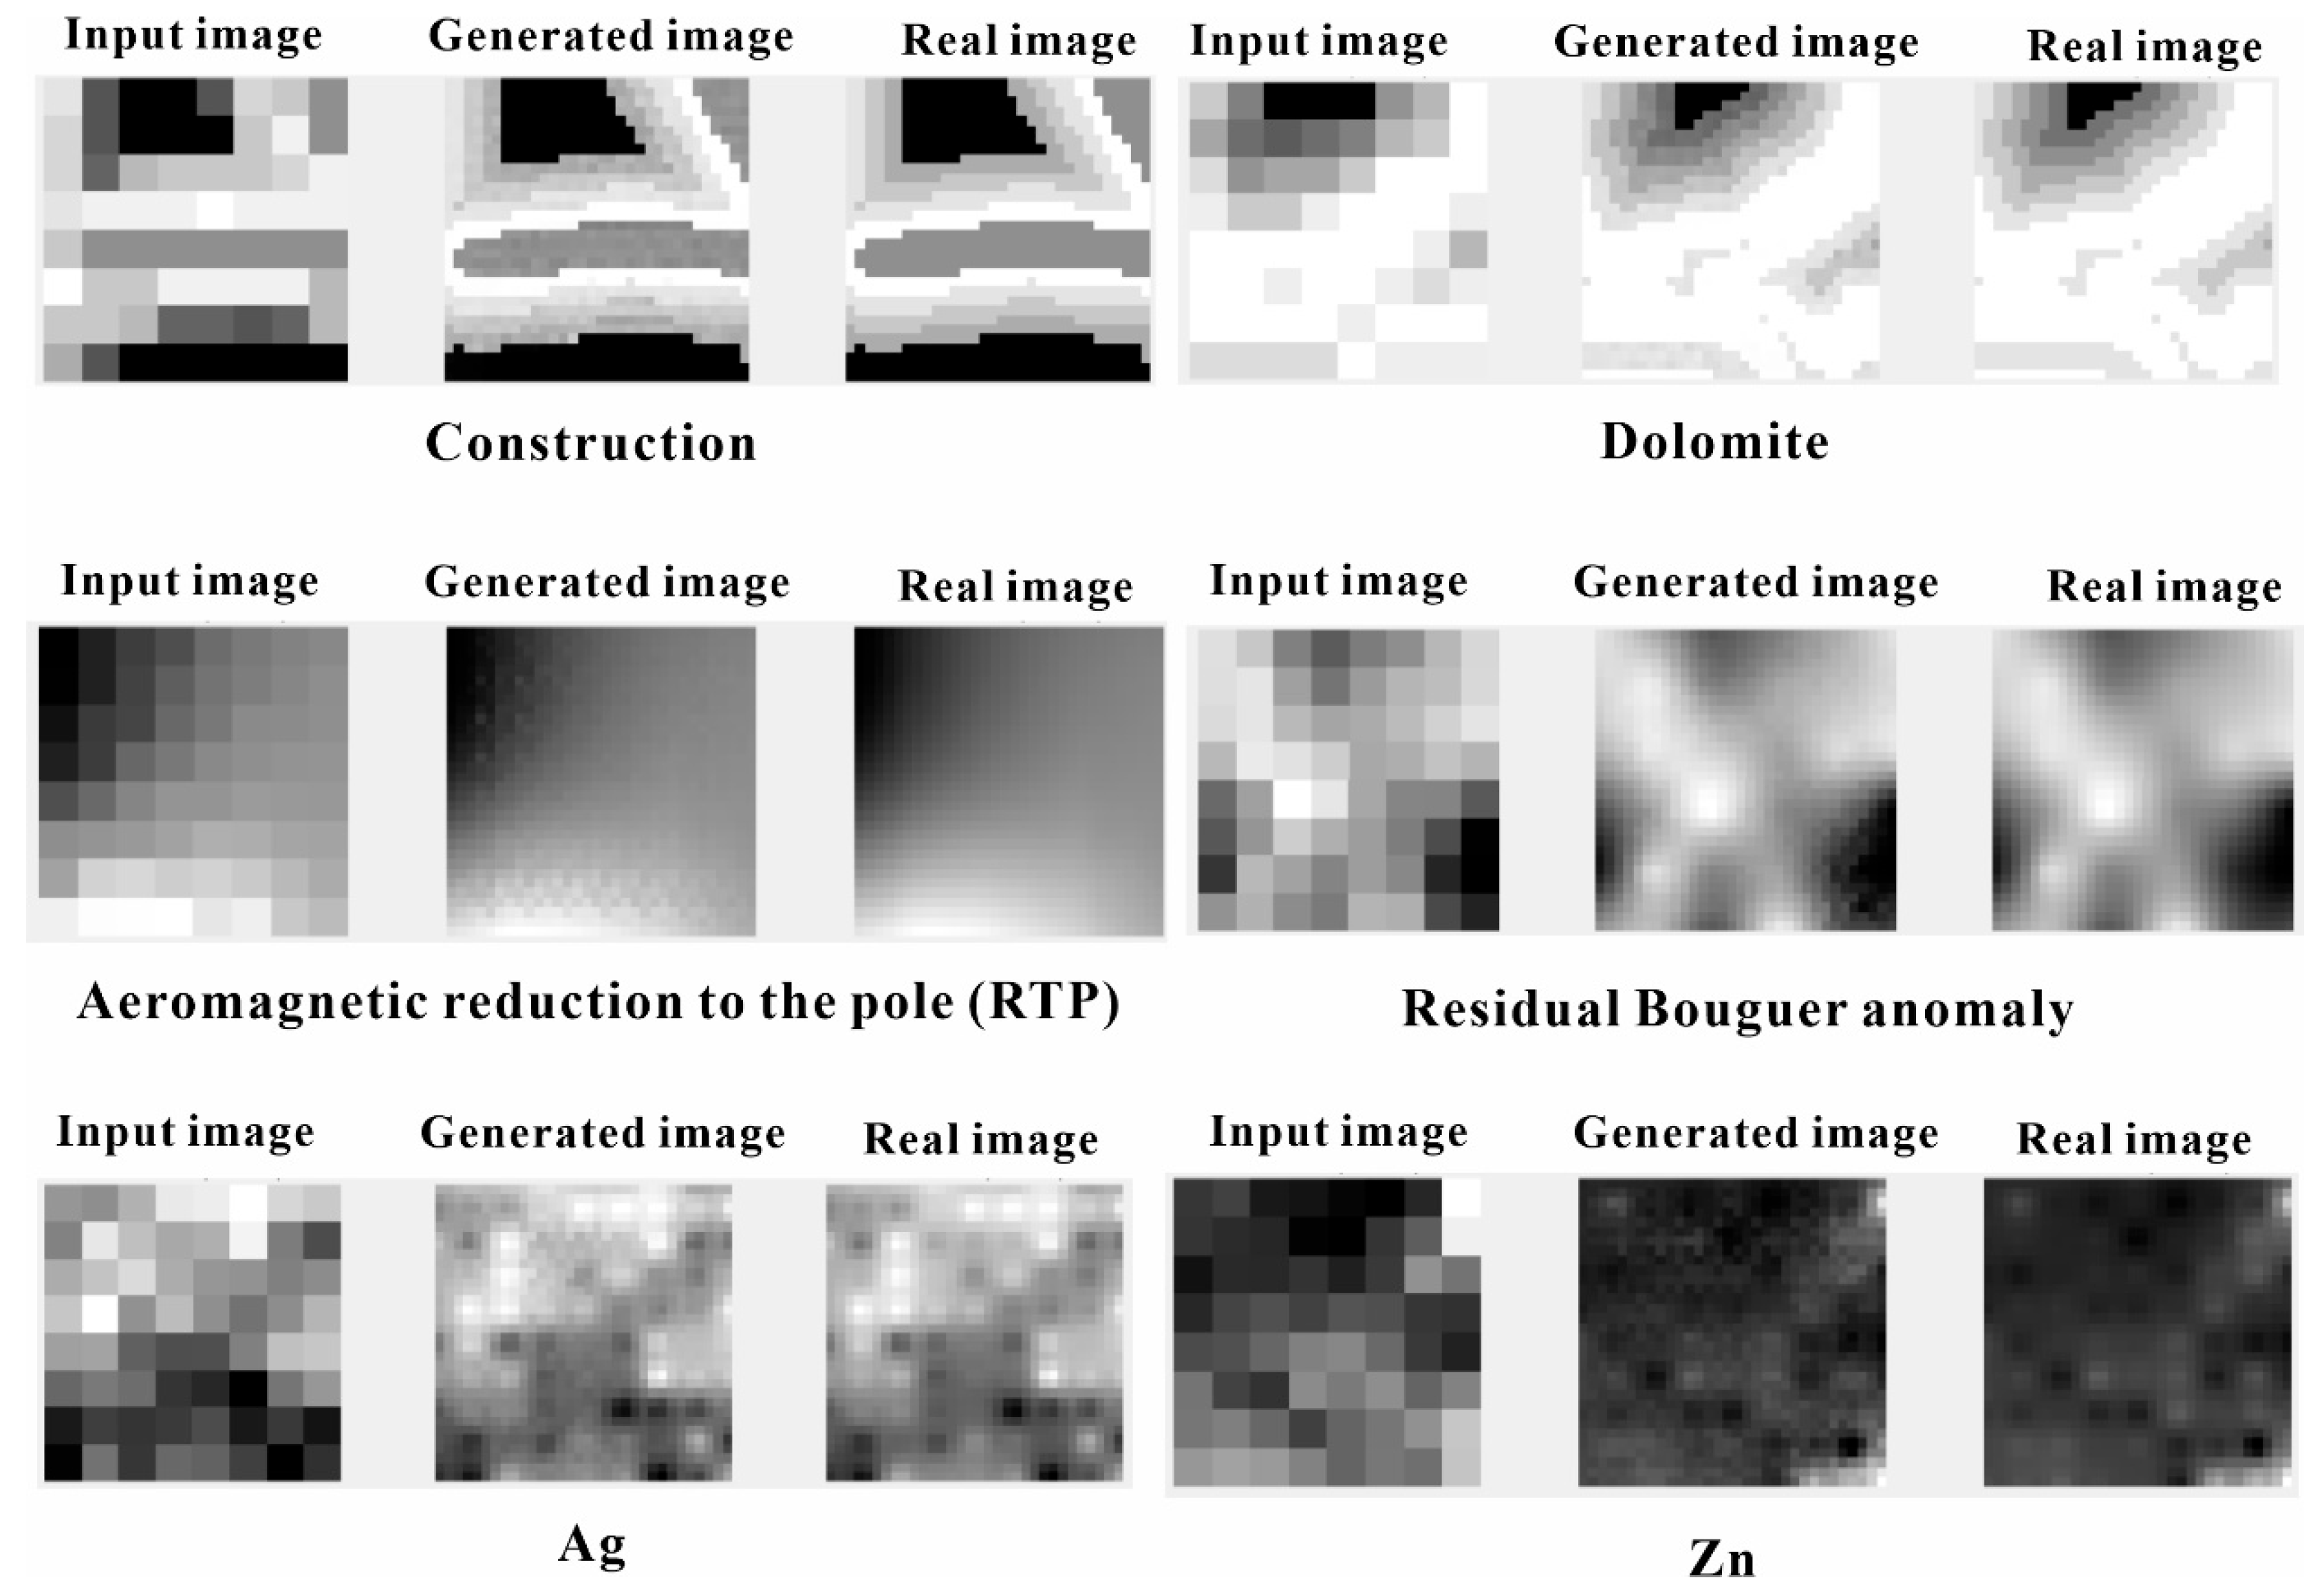
The trained model was then called to perform data augmentation for the Pb element 100 times, followed by a statistical analysis of the quality of these 100 generated samples. The quality of the 100 generated Pb element data samples was good, with the PSNR of all generated data exceeding 30 dB. The average PSNR of this generated dataset was 33.67 dB, with a standard deviation of 0.78 dB and a maximum value reaching 34.94 dB. Of the generated samples, 73% had PSNR values above 32.8 dB. Sample 22 exhibited the highest quality (best PSNR), while Sample 12 had the lowest quality (worst PSNR). The statistical analysis of the generated samples leads to the conclusion that the dataset augmented by this method can effectively serve as reliable training data for subsequent deep learning-based mineral prospectivity modeling. Finally, the trained model was called to perform data augmentation for all ten types of indicative factor data (Figure 8), constructing an augmented indicative factor dataset in preparation for training the subsequent deep learning prospectivity prediction model.

4.2. Comparative Analysis of Prediction Results Based on ResNet

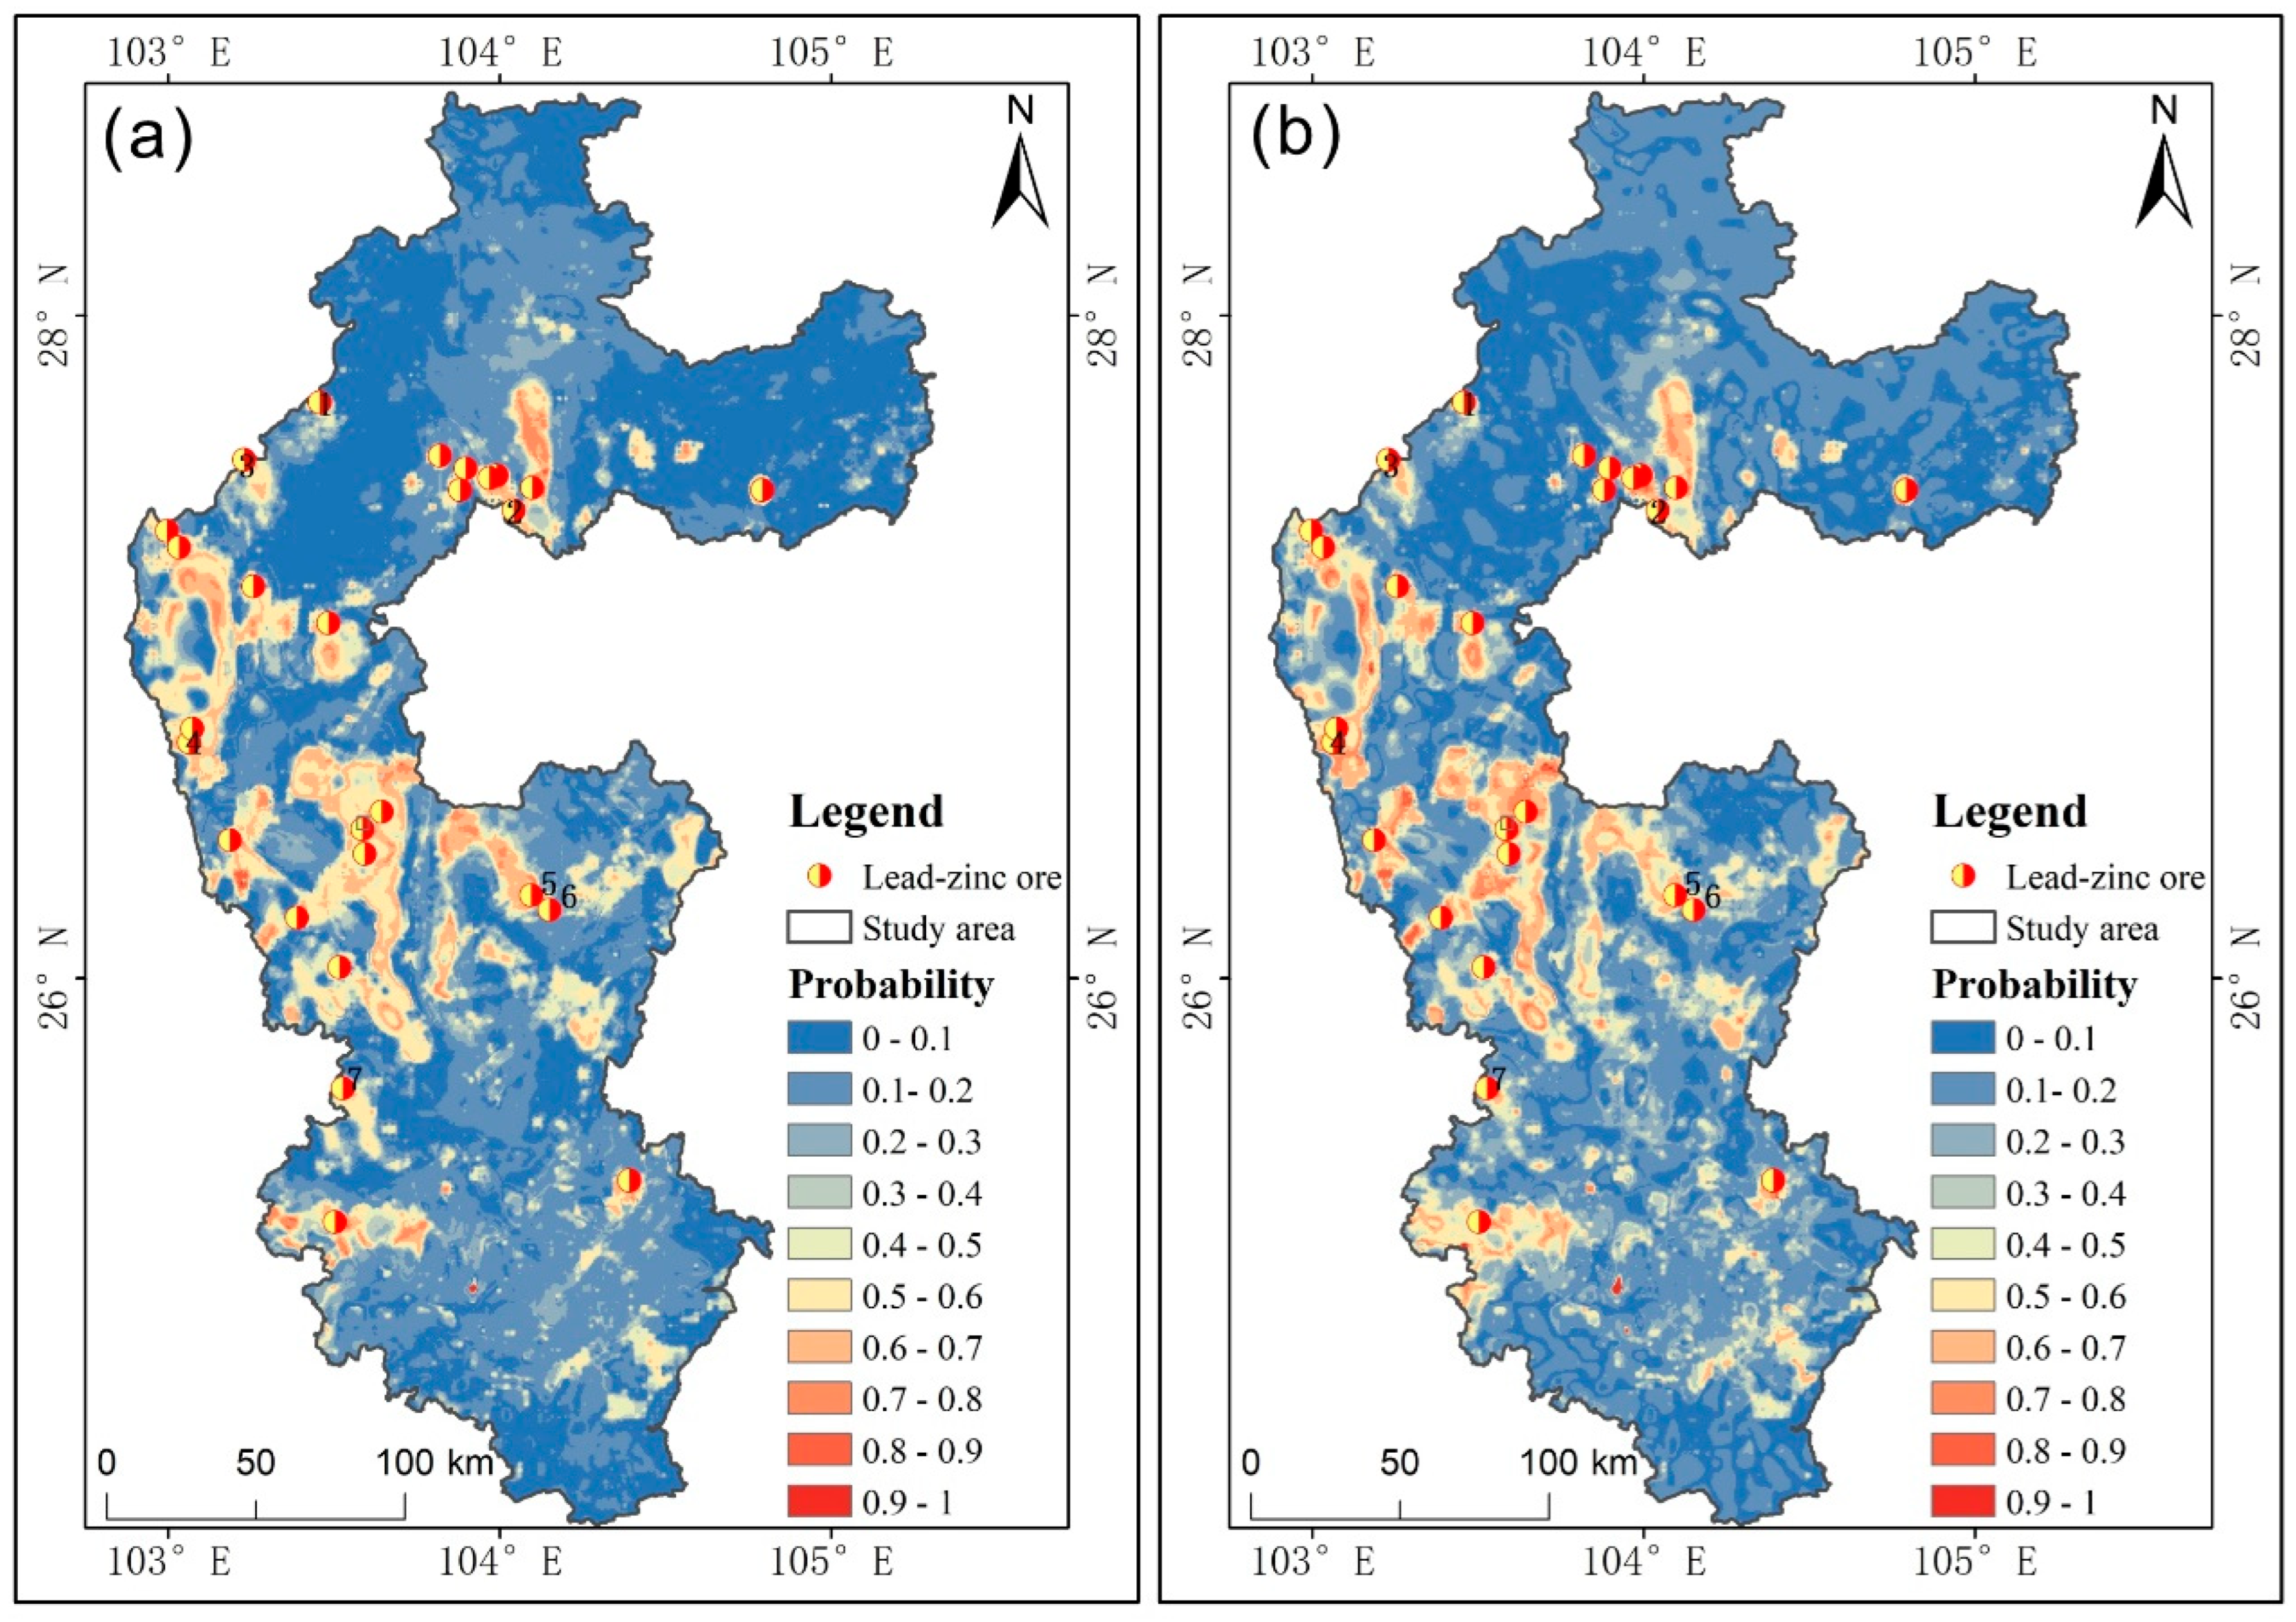
The ResNet model was trained using the prepared dataset, with the following results. Prior to model training, a total of 40 samples (20 mineral occurrences as positive samples and 20 non-mineralized points as negative samples) were selected. The dataset was split into training and validation sets in an 8:2 ratio, resulting in a training set of 16 positive and 16 negative samples, and a validation set of 4 positive and 4 negative samples. The indicative factor dataset was augmented 100 times using the GAN model, yielding a final training set of 3200 samples and a validation set of 800 samples. The training set samples were then fed into the ResNet model for training. The training and validation results are presented in Table 3. This trained model achieved a Root Mean Square Error (RMSE) of 0.1023, a Mean Absolute Error (MAE) of 0.0793, a training accuracy of 0.883, and a validation accuracy of 0.842. These results indicate high accuracy for both the training and validation sets. The mineralization probability prediction result is shown in Figure 9a. Concurrently, the model was also trained on the original indicative factor dataset without data augmentation. The corresponding training and validation results are also listed in Table 3 for comparison. This model trained on non-augmented data achieved an RMSE of 0.1361, an MAE of 0.095, a training accuracy of 0.869, and a validation accuracy of 0.765. The corresponding mineralization probability prediction result is shown in Figure 9b.
A comparison of the training results with and without data augmentation reveals that the model trained on the augmented dataset exhibits smaller Root Mean Square Error (RMSE) and Mean Absolute Error (MAE). Furthermore, it achieves higher accuracy on both the training and validation sets compared to the model trained on the non-augmented dataset. The smaller gap between the training and validation accuracy also indicates the stronger generalization capability of this model. The underlying reason for this outcome likely lies in the inherently small sample size of the non-augmented dataset. This scarcity limits the diversity of features the model can learn, making it prone to “memorizing” the characteristics of the training set. Consequently, when faced with unseen features in the test set, the model struggles to perform effectively, leading to “overfitting” and suboptimal generalization ability.
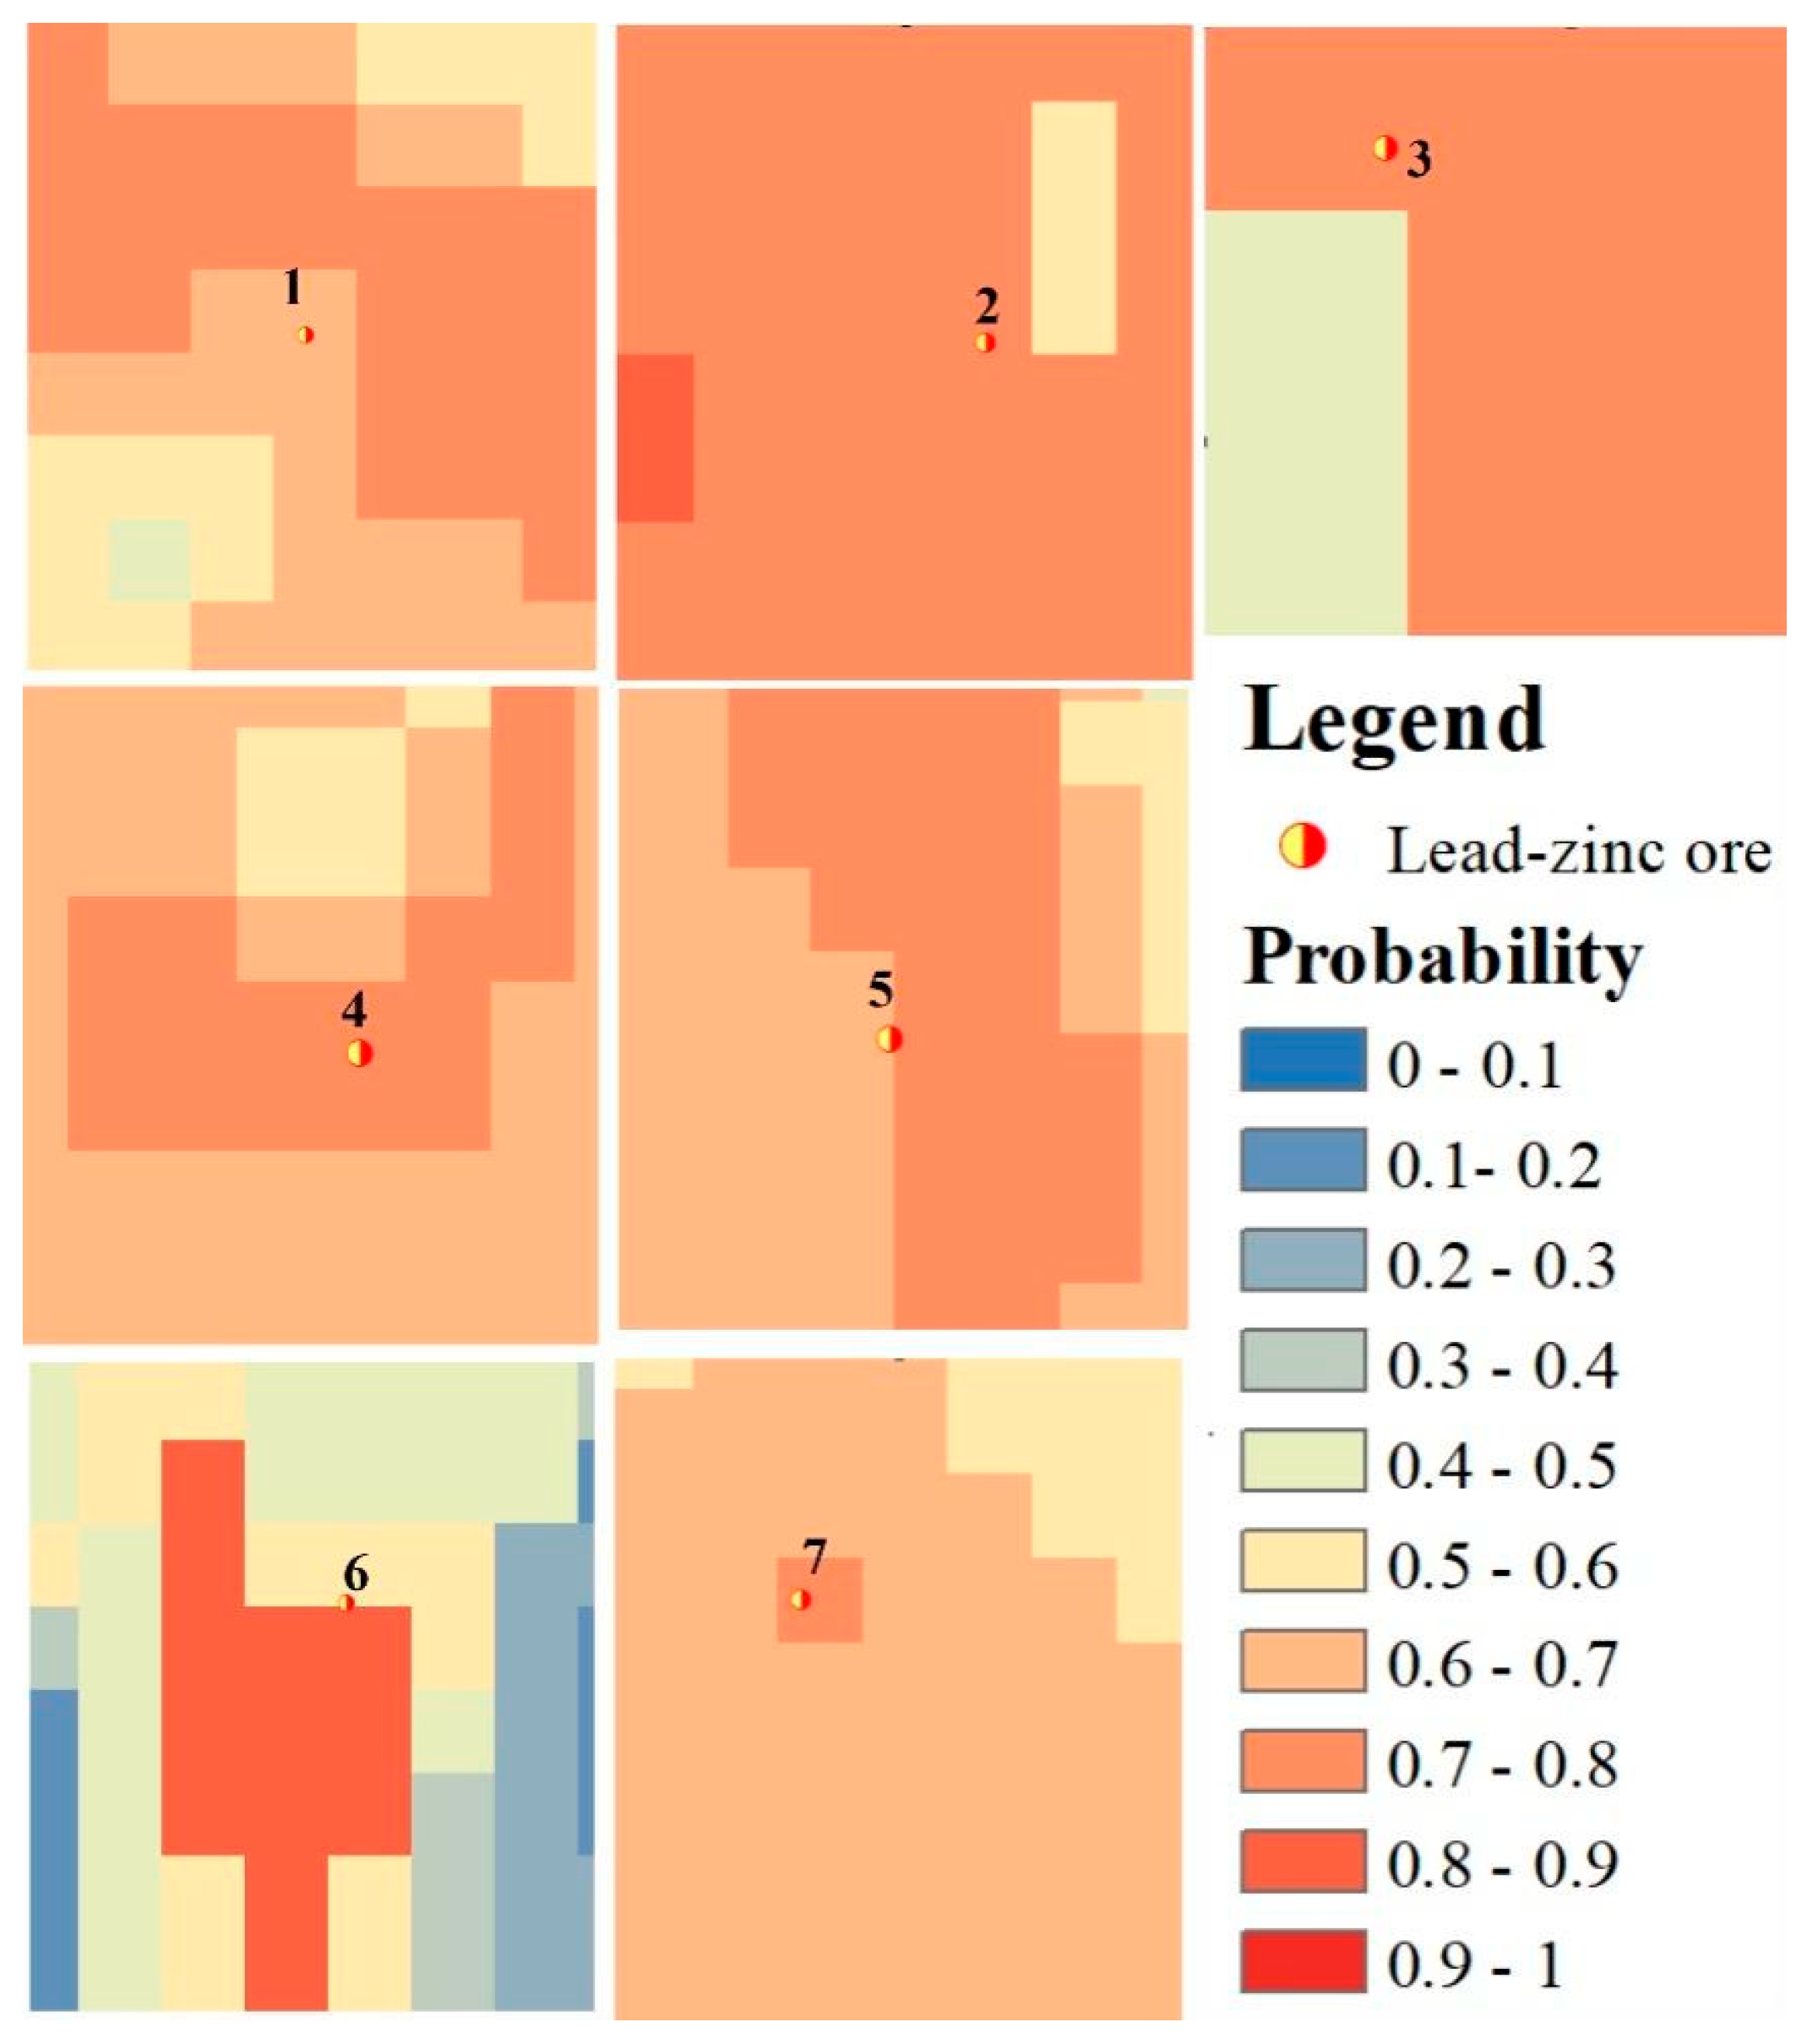
The mineralization probability prediction map generated by the ResNet convolutional neural network indicates that higher probability values correspond to a greater likelihood of mineral occurrences (Figure 9a). All 20 Pb-Zn occurrences that were incorporated into the model training are located within high-probability zones on the map. Furthermore, there are 7 Pb-Zn occurrences that were not used during model training. The prediction results in Figure 10 show that all 7 of these withheld occurrences also fall within high-probability zones of the prediction map. Specifically, Occurrence 1 lies within the 0.6–0.7 probability interval; Occurrences 2, 3, 4, 5, and 7 are within the 0.7–0.8 interval; and Occurrence 6 is within the 0.8–0.9 interval. This outcome demonstrates a certain level of reliability in the model’s predictive results for Pb-Zn deposits in the Dian-Dongbei region.
Figure 9a presents the mineralization probability prediction map based on the augmented dataset, while Figure 9b shows the corresponding map generated without data augmentation. A comparison of these prediction maps reveals that high probability values (where higher values indicate a greater likelihood of mineralization) appear in the vicinity of known mineral occurrences that were withheld from model training, regardless of whether data augmentation was used. This result demonstrates that the ResNet-based methodology is effective for predicting Pb-Zn mineralization in the northeastern Yunnan region. However, the prediction results from the non-augmented dataset exhibit two distinct characteristics: first, the spatial extent of high-probability zones is excessively large; second, some high-probability zones appear overly fragmented or scattered. The primary goal of mineral prospectivity modeling is to pinpoint small, high-probability target areas within a vast region. Excessively large target zones would significantly increase the time, cost, and human resources required for subsequent field exploration, thereby diminishing the practical guidance value of the predictions. The issue of overly extensive high-probability areas in the prediction results may stem from the inherent complexity of the mineralization process itself. The relationships between various indicative factors and mineral occurrences are intricate, increasing the difficulty of prediction and making it challenging to simply delineate the connection between input data and deposit locations.

5. Discussion

This study successfully integrated a GAN with a deep convolutional neural network (ResNet) and applied the combined framework to mineral prospectivity modeling for Pb-Zn deposits in the Dian-Dongbei region. Compared to traditional prediction methods that rely on limited samples, the performance improvement and optimization of prediction results demonstrated in this study represent an attempt to address the issue of insufficient mineralization samples. The following discussion will elaborate from three perspectives: the intrinsic mechanism of data augmentation, the enhancement of model generalization capability, and the geological interpretability along with the practical application value of the prediction results.
First, the effectiveness of GAN-based data augmentation stems from its deep excavation of the structural essence inherent in geoscientific data. While traditional data augmentation methods (e.g., geometric transformations) are effective in the image domain, they are difficult to directly apply to multi-source exploration data that embodies complex spatial relationships and geological principles. The results of this study demonstrate that the GAN can generate high-quality synthetic samples with an average PSNR value of 33.67 dB. Furthermore, the comparative results from models trained with and without data augmentation show that the prediction map generated using the augmented data (Figure 9a) features more reasonably concentrated high-probability zones. This is in contrast to the prediction map from the model trained on the original limited data (Figure 9b), which exhibits unreasonably large-area or fragmented high-probability zones. However, geological mineral prediction differs fundamentally from general image recognition tasks. Whereas the PSNR value can quantitatively indicate the quality of the augmented data at an indicative level, it does not further substantiate whether the augmentation process preserves the necessary physical and geological constraint relationships among the mineralization-controlling factors, or the consistency in statistical distribution characteristics between the augmented and original samples [74]. Therefore, subsequent research should delve deeper into this direction.
Second, the core objective of data augmentation is to enhance the model’s generalization and robustness. Beyond the methodological comparison with Li [70], our findings also align with other recent deep learning applications in mineral exploration. For instance, Farahbakhsh [38] demonstrated the effectiveness of CNNs for alteration mapping using remote sensing data, achieving promising results in mineral prospectivity. Our GAN-ResNet framework extends this line of research by explicitly addressing the data scarcity problem through GAN-based augmentation, which further improves the predictive performance beyond what a standalone CNN can achieve. Additionally, relative to conventional machine learning approaches such as the support vector machine-based models applied in other Pb-Zn prospectivity studies [33], our deep learning framework achieves higher predictive accuracy and generates more spatially focused exploration targets, offering greater practical utility for field exploration. Furthermore, compared with the scarce data-constrained AI framework proposed by Zhang [44] for greenfield mineral prospectivity, our GAN-based augmentation provides a complementary strategy that preserves the spatial continuity and geological constraints inherent in the original data. These comparisons collectively demonstrate that the GAN-CNN framework represents a robust and transferable approach for mineral prospectivity modeling in data-scarce environments. The comparative experiment in this study clearly demonstrates that the augmented dataset improved the model validation accuracy from 0.765 to 0.842, while significantly narrowing the performance gap between the training and validation sets. The fundamental reason for this phenomenon lies in the fact that limited real samples (20 positive samples) define only a few unique “points,” making the model highly susceptible to achieving perfect fit on these points, leading to overfitting. The GAN-based augmentation process can be understood as using these real sample points as “anchor points” to generate a large number of new, structurally similar synthetic samples within their feature neighborhoods. Consequently, the decision boundary learned by the model is no longer confined to a few sample points but is instead based on richer data. This explains why the model successfully predicted the seven unknown mineral occurrences, all of which fall within the high-probability zones, because these points are located within the feature space covered by the augmented data, whose common characteristics the model has already learned. By enhancing the representativeness and diversity of the training samples, the GAN-augmented dataset reduces the model’s reliance on the limited original occurrences, thereby improving its generalization to unseen mineralized areas. We acknowledge that the validation set used in this study is small (only eight original samples), which limits the statistical robustness of the reported accuracy comparisons. Due to the inherently limited number of known mineral occurrences in the study area (27 in total), performing multiple random splits or seed-based repeated experiments would not yield statistically meaningful results, as the sample size is too small to support such analyses. Consequently, the findings presented here should be interpreted as preliminary, and future work with larger datasets or alternative validation strategies (e.g., spatial cross-validation or transfer learning from neighboring regions) is needed to further substantiate the observed improvements.
Finally, the model integrates multi-source data encompassing lithology, structure, geophysics, geochemistry, and remote sensing. The distribution of its high-probability zones can be interpreted as a visual manifestation of the nonlinear integration of these mineralization-controlling factors within the deep learning framework. For instance, the prediction map might implicitly express a high-order prospecting model, such as “integrated structural–geochemical anomalies within a specific stratigraphic context”. Furthermore, the results indicate that predictions based on the augmented data effectively avoid excessive fragmentation of high-value zones. This helps converge exploration focus from numerous “possible points” to several “optimal areas,” thereby significantly improving the efficiency and cost-effectiveness of exploration programs. However, due to the complex internal architecture and numerous parameters of deep learning models, they possess a “black-box” nature. This makes it difficult to directly visualize or explain the relationships between dependent and independent variables, which hinders updating the understanding of Pb-Zn metallogenic patterns in the region. Therefore, demystifying this “black-box” characteristic and constructing interpretable deep learning models represents a crucial research direction. Such models would not only accurately predict mineralization probability but also provide explainable results, potentially leading to the discovery of previously unrecognized metallogenic relationships.
In summary, this study has addressed the sample size constraint at the algorithmic level through GAN-based data augmentation, enhanced model generalization at the architectural level, and ultimately delivered more focused and reliable prediction results at the application level. Future work could further explore how to integrate explicit geological knowledge rules with the implicit data generation of GANs, as well as how to utilize visualization tools to interpret the model’s decision-making process. This would simultaneously improve prediction performance and increase the transparency and acceptability of artificial intelligence models in the field of geology.

6. Conclusions

The Dian-Dongbei region is one of the most significant Pb-Zn metallogenic provinces in China and worldwide, boasting substantial prospecting potential [59]. However, amidst rapid economic growth and recent global geopolitical shifts, China’s demand for Pb-Zn resources has been steadily increasing. Enhancing the reserve base of these resources is crucial for supporting national sustainable development. Therefore, conducting mineral resource surveys in the Dian-Dongbei region to delineate its metallogenic potential areas constitutes a vital measure for safeguarding China’s Pb-Zn resource security. By integrating multi-source geoscientific data encompassing Geo-Phys-Chem-RS), and combining GANs and deep learning models, a comprehensive mineral prospectivity modeling framework for Pb-Zn deposits in this region was constructed. The main conclusions are as follows:
The GAN-based data augmentation method for multi-source geospatial data is viable and effective. Addressing the common issue of insufficient sample data in prospectivity modeling studies, conventional augmentation techniques (e.g., rotation, translation, cropping) risk disrupting the spatial characteristics inherent in multi-source geospatial data, potentially generating low-quality samples that could undermine model reliability. This study introduced a GAN model, augmenting the multi-source sample data based on the concepts of random down-sampling and pseudo-window size. This method effectively preserves the spatial features within the multi-source data, generating synthetic samples structurally similar to the real data, thereby enhancing the generalizability and robustness of the deep learning model. Evaluations of this method’s output and its subsequent application in training the ResNet model confirm the feasibility of the generated sample data, demonstrating its effectiveness in improving the prediction accuracy of the ResNet convolutional neural network.
The ResNet-based prospectivity model, constructed according to the metallogenic patterns of Pb-Zn deposits in the Dian-Dongbei region, can effectively perform quantitative prediction of mineral resources in the study area. Ten types of indicative factor data were developed, including lithology, structures, residual Bouguer gravity, reduced-to-pole aeromagnetics, Ag, Pb, Zn, limonite, calcite, and dolomite. The model was trained using ResNet on both the original and the GAN-augmented datasets for comparison. The results indicate that the integrated GAN-ResNet method produces prediction maps with higher accuracy while significantly refining and narrowing down the target areas with high mineralization potential. This precision can substantially reduce exploration costs.

Author Contributions

Q.C.: conceptualization, methodology, resources, writing—original draft. S.L.: writing—review and editing. Z.Z.: supervision, resources. Y.W.: validation, investigation. T.X.: validation, investigation. Y.T.: validation, investigation. Y.C.: validation, investigation. Y.Z.: validation, investigation. All authors have read and agreed to the published version of the manuscript.

Funding

This research was supported by the National Natural Science Foundation of China (Grant No. 42202329), and Yunnan Fundamental Research Projects (Grant No. 202401CF070183), and the Science and Technology Project of the Yunnan Provincial Department of Natural Resources (Grant No. 2025-YNZRKJ-006).

Data Availability Statement

The Landsat-8 OLI data used in this study are available from the Geospatial Data Cloud (https://www.gscloud.cn/ (accessed on 15 March 2024)). The ZY1-02D hyperspectral data are distributed by the China Centre for Resources Satellite Data and Application (https://www.cresda.com/ (accessed on 20 March 2024)). The WGM2012 gravity data are provided by the International Bureau of Gravimetry (BGI) (https://bgi.obs-mip.fr/ (accessed on 10 April 2024)). The WDMAM magnetic data are available from the World Digital Magnetic Anomaly Map portal (https://wdmam.org/ (accessed on 10 April 2024)). The geochemical data of Yunnan Province are accessible through the National Earth System Science Data Center (http://www.geodata.cn (accessed on 5 May 2024)). The geological data are available from the China Geological Survey (http://geochina.cgs.gov.cn (accessed on 5 May 2024)). All datasets were accessed between 2024 and 2025.

Acknowledgments

We are grateful to the anonymous reviewers and editors for their critical and constructive review of this manuscript.

Conflicts of Interest

The authors declare that there are no conflicts of interest.

References

  1. Yu, S.; Duan, H.; Cheng, J. An evaluation of the supply risk for China’s strategic metallic mineral resources. Resour. Policy 2021, 70, 101891. [Google Scholar] [CrossRef]
  2. Scholz, R.W.; Wellmer, F.-W.; Mew, M.; Steiner, G. The dynamics of increasing mineral resources and improving resource efficiency: Prospects for mid- and long-term security of phosphorus supply. Resour. Conserv. Recycl. 2024, 213, 107933. [Google Scholar] [CrossRef]
  3. Lee, S.; Moon, I. Recent Advances and Future Perspectives of AI-Based Mineral Exploration: A Review of Machine Learning, Deep Learning, and Geologically Informed Approaches. Minerals 2026, 16, 584. [Google Scholar] [CrossRef]
  4. Tshanga, M.M.; Ncube, L.; van Niekerk, E. Remote sensing insights into subsurface-surface relationships: Land Cover Analysis and Copper Deposits Exploration. Earth Sci. Inform. 2024, 17, 3979–4000. [Google Scholar] [CrossRef]
  5. Zhao, Z.; Zhang, G.; Chen, Q.; Cai, D.; Meng, F.; Long, X.; Zhang, T.; Wang, Y.; Xu, T.; Yang, H.; et al. Gold exploration using multi-source remote sensing data in the northern part of the Wa State, Myanmar. Ore Geol. Rev. 2025, 183, 106703. [Google Scholar] [CrossRef]
  6. Vidal, O.; Le Boulzec, H.; Andrieu, B.; Verzier, F. Modelling the Demand and Access of Mineral Resources in a Changing World. Sustainability 2022, 14, 11. [Google Scholar]
  7. Zhang, Z.W.; Wu, H.Y.; Tan, W.J.; Wang, Y.L.; Shao, J.; Li, W.Y. Endowment conditions and prospecting potential of nickel and cobalt mineral resources in China. Acta Petrol. Sin. 2025, 41, 416–430. [Google Scholar] [CrossRef]
  8. Dou, S.Q.; Xu, D.Y.; Zhu, Y.G.; Keenan, R. Critical mineral sustainable supply: Challenges and governance. Futures 2023, 146, 103101. [Google Scholar] [CrossRef]
  9. Wang, A.J.; Gao, X.R. Perspective of energy and critical mineral resources demand in China. Bull. Chin. Acad. Sci. 2020, 35, 338–344. [Google Scholar]
  10. Shirmard, H.; Farahbakhsh, E.; Müller, R.D.; Chandra, R. A review of machine learning in processing remote sensing data for mineral exploration. Remote Sens. Environ. 2022, 268, 112750. [Google Scholar] [CrossRef]
  11. Han, R.S.; Hu, Y.Z.; Wang, X.K.; Huang, Z.L.; Chen, J.; Wang, F.; Wu, P.; Li, B.; Wang, H.J.; Dong, Y.; et al. Deposit model of the Ge-Ag-Pb-Zn polymetallic ore concentration area in northeast Yunnan, China. Acta Geol. Sin. 2012, 86, 280–294. [Google Scholar] [CrossRef]
  12. Han, R.S.; Wang, F.; Hu, Y.Z.; Wang, X.K.; Ren, T.; Qiu, W.L.; Zhong, K.H. Study on metallogenic tectonic dynamics and chronological constraint of the Huize-type (HZT) Ge-Ag-Pb-Zn deposit. Geotecton. Metallog. 2014, 38, 758–771. [Google Scholar]
  13. Wang, L.; Xu, X.; Dong, H.; Gui, R.; Pu, F. Multi-pixel simultaneous classification of PolSAR image using convolutional neural networks. Sensors 2018, 18, 769. [Google Scholar] [CrossRef] [PubMed]
  14. Brandmeier, M.; Chen, Y. Lithological classification using multi-sensor data and convolutional neural networks. ISPRS-Int. Arch. Photogramm. Remote Sens. Spat. Inf. Sci. 2019, 42, 55–59. [Google Scholar] [CrossRef]
  15. Ye, B.; Tian, S.; Cheng, Q.; Ge, Y. Application of lithological mapping based on advanced hyperspectral imager (AHSI) imagery onboard Gaofen-5 (GF-5) satellite. Remote Sens. 2020, 12, 3990. [Google Scholar] [CrossRef]
  16. Wang, Z.; Zuo, R.; Jing, L. Fusion of geochemical and remote-sensing data for lithological mapping using random forest metric learning. Math. Geosci. 2021, 53, 1125–1145. [Google Scholar]
  17. Aghaee, A.; Shamsipour, P.; Hood, S.; Haugaard, R. A convolutional neural network for semi-automated lineament detection and vectorisation of remote sensing data using probabilistic clustering: A method and a challenge. Comput. Geosci. 2021, 151, 104724. [Google Scholar] [CrossRef]
  18. Schapira, J.S.; Bolhar, R. Fibrous Minerals and Naturally Occurring Asbestos (NOA) in the Metacarbonate Hosted Fe Oxide-Cu-Au-Co Mineralized Rocks from the Guelb Moghrein Mine, Akjoujt, Mauritania: Implications for In Situ Hazard Assessment and Mitigation Protocols. Minerals 2025, 15, 991. [Google Scholar] [CrossRef]
  19. Ngo, P.T.T.; Panahi, M.; Khosravi, K.; Ghorbanzadeh, O.; Kariminejad, N.; Cerda, A.; Lee, S. Evaluation of deep learning algorithms for national scale landslide susceptibility mapping of Iran. Geosci. Front. 2021, 12, 505–519. [Google Scholar] [CrossRef]
  20. Mandal, K.; Saha, S.; Mandal, S. Applying deep learning and benchmark machine learning algorithms for landslide susceptibility modelling in Rorachu river basin of Sikkim Himalaya, India. Geosci. Front. 2021, 12, 101203. [Google Scholar] [CrossRef]
  21. Chen, Y.; Lu, L.; Li, X. Application of continuous restricted Boltzmann machine to identify multivariate geochemical anomaly. J. Geochem. Explor. 2014, 140, 56–63. [Google Scholar] [CrossRef]
  22. Xiong, Y.; Zuo, R. Recognition of geochemical anomalies using a deep autoencoder network. Comput. Geosci. 2016, 86, 75–82. [Google Scholar] [CrossRef]
  23. Aryafar, A.; Moeini, H. Application of continuous restricted Boltzmann machine to detect multivariate anomalies from stream sediment geochemical data, Korit, East of Iran. J. Min. Environ. 2017, 8, 673–682. [Google Scholar]
  24. Zuo, R.; Xiong, Y. Big data analytics of identifying geochemical anomalies supported by machine learning methods. Nat. Resour. Res. 2018, 27, 5–13. [Google Scholar]
  25. Zuo, R.; Xiong, Y.; Wang, J.; Carranza, E.J.M. Deep learning and its application in geochemical mapping. Earth-Sci. Rev. 2019, 192, 1–14. [Google Scholar] [CrossRef]
  26. Xiong, Y.; Zuo, R. Recognizing multivariate geochemical anomalies for mineral exploration by combining deep learning and one-class support vector machine. Comput. Geosci. 2020, 140, 104484. [Google Scholar] [CrossRef]
  27. Luo, Z.; Xiong, Y.; Zuo, R. Recognition of geochemical anomalies using a deep variational autoencoder network. Appl. Geochem. 2020, 122, 104710. [Google Scholar] [CrossRef]
  28. Luo, Z.; Zuo, R.; Xiong, Y.; Wang, X. Detection of geochemical anomalies related to mineralization using the GANomaly network. Appl. Geochem. 2021, 131, 105043. [Google Scholar] [CrossRef]
  29. Zuo, R.G. Deep-level mineralization information mining and integration based on deep learning. Bull. Mineral. Petrol. Geochem. 2019, 38, 53–60. [Google Scholar]
  30. Li, H.; Li, X.; Yuan, F.; Jowitt, S.M.; Zhang, M.; Zhou, J.; Zhou, T.; Li, X.; Ge, C.; Wu, B. Convolutional neural network and transfer learning based mineral prospectivity modeling for geochemical exploration of Au mineralization within the Guandian–Zhangbaling area, Anhui Province, China. Appl. Geochem. 2020, 122, 104747. [Google Scholar] [CrossRef]
  31. Zuo, R.; Luo, Z.; Xiong, Y.; Yin, B. A geologically constrained variational autoencoder for mineral prospectivity mapping. Nat. Resour. Res. 2022, 31, 1121–1133. [Google Scholar] [CrossRef]
  32. Twarakavi, N.K.; Misra, D.; Bandopadhyay, S. Prediction of arsenic in bedrock derived stream sediments at a gold mine site under conditions of sparse data. Nat. Resour. Res. 2006, 15, 15–26. [Google Scholar] [CrossRef]
  33. Wang, Y.; Zhou, Y.Z.; Xiao, F. Deep mineral prospectivity prediction based on numerical simulation of metallogenic conditions and support vector machine algorithm: A case study of the Fankou Pb-Zn deposit, northern Guangdong, China. Geotecton. Metallog. 2020, 44, 222–230. [Google Scholar]
  34. Li, H.; Wu, Z.; Wang, S.; Wang, Y.; Dong, C.; Li, X.; Zhang, Z.; Li, H.; Liu, W.; Li, B. Three-Dimensional Attribute Modeling and Deep Mineralization Prediction of Vein 171 in Linglong Gold Field, Jiaodong Peninsula, Eastern China. Minerals 2025, 15, 909. [Google Scholar] [CrossRef]
  35. Yang, N.; Zhang, Z.; Yang, J.; Hong, Z.; Shi, J. A convolutional neural network of GoogLeNet applied in mineral prospectivity prediction based on multi-source geoinformation. Nat. Resour. Res. 2021, 30, 3905–3923. [Google Scholar] [CrossRef]
  36. Chen, J.; Mao, X.C.; Liu, Z.K. Three-dimensional metallogenic prediction of the Dayinggezhuang gold deposit based on random forest algorithm. Geotecton. Metallog. 2020, 44, 231–241. [Google Scholar] [CrossRef]
  37. LeCun, Y.; Bengio, Y.; Hinton, G. Deep learning. Nature 2015, 521, 436–444. [Google Scholar] [CrossRef] [PubMed]
  38. Farahbakhsh, E.; Goel, D.; Pimparkar, D.; Müller, R.D.; Chandra, R. Convolutional Neural Networks for Mineral Prospecting Through Alteration Mapping with Remote Sensing Data. PFG—J. Photogramm. Remote Sens. Geoinf. Sci. 2025, 93, 379–400. [Google Scholar] [CrossRef]
  39. Tian, C.; Cheng, T.; Peng, Z.; Zuo, W.; Tian, Y.; Zhang, Q.; Wang, F.Y.; Zhang, D. A survey on deep learning fundamentals. Artif. Intell. Rev. 2025, 58, 381. [Google Scholar] [CrossRef]
  40. Hinton, G.E.; Osindero, S.; Teh, Y.W. A fast learning algorithm for deep belief nets. Neural Comput. 2006, 18, 1527–1554. [Google Scholar] [CrossRef] [PubMed]
  41. Yuan, M.; Li, Q.; Zhang, B.; Pan, J.; Gao, L.; Jing, L.; Lu, L. A systematic review of deep learning methods for mineral exploration using multisource geoscience data (2018–2025). Int. J. Appl. Earth Obs. Geoinf. 2026, 130, 106703. [Google Scholar]
  42. Yang, F.F.; Zuo, R.G.; Kreuzer, O.P. Artificial intelligence for mineral exploration: A review and perspectives on future directions from data science. Earth-Sci. Rev. 2024, 258, 104941. [Google Scholar] [CrossRef]
  43. Wang, S.; Wang, Y.; Tian, J.; Ning, Y.; An, Z.; Zhang, G. WTCNN–Transformer: An unsupervised model for mineral prospectivity mapping based on wavelet transform, convolutional neural network, and transformer. Ore Geol. Rev. 2026, 191, 107215. [Google Scholar] [CrossRef]
  44. Zhang, J.; Sun, T.; Zhang, Y.; Zhang, H.; Liu, Y.; Wu, H.; Bai, R. Targeting greenfield mineral prospectivity using scarce data-constrained AI framework and dynamic confusion matrix: A case study from Yulong district, China. Ore Geol. Rev. 2026, 191, 106554. [Google Scholar]
  45. Ying, X. An overview of overfitting and its solutions. J. Phys. Conf. Ser. 2019, 1168, 022022. [Google Scholar] [CrossRef]
  46. LeCun, Y.; Bottou, L.; Bengio, Y.; Haffner, P. Gradient-based learning applied to document recognition. Proc. IEEE 1998, 86, 2278–2324. [Google Scholar] [CrossRef]
  47. Krizhevsky, A.; Sutskever, I.; Hinton, G.E. ImageNet classification with deep convolutional neural networks. In International Conference on Neural Information Processing Systems; Curran Associates Inc.: Red Hook, NY, USA, 2012; pp. 1097–1105. [Google Scholar]
  48. Simonyan, K.; Zisserman, A. Very deep convolutional networks for large-scale image recognition. In Proceedings of the 3rd International Conference on Learning Representations (ICLR), San Diego, CA, USA, 7–9 May 2015; pp. 1–14. [Google Scholar]
  49. Xie, M.; Liu, B.; Li, H.; Wang, Z.; Cao, C.; Wu, Y. Quantitative prediction method of gold deposits in Gannan area under unbalanced sample conditions. Earth Sci. Front. 2025, 32, 108–121. [Google Scholar]
  50. Habrat, M.; Młynarczuk, M. Impact of data space augmentation strategy on model accuracy and generalization in thin-section rock classification. Sci. Rep. 2026, 16, 13927. [Google Scholar] [CrossRef] [PubMed]
  51. Goodfellow, I.; Pouget-Abadie, J.; Mirza, M. Generative adversarial networks. Commun. ACM 2020, 63, 139–144. [Google Scholar] [CrossRef]
  52. Gulrajani, I.; Ahmed, F.; Arjovsky, M.; Dumoulin, V.; Courville, A. Improved training of Wasserstein GANs. Adv. Neural Inf. Process. Syst. 2017, 30, 5769–5779. [Google Scholar]
  53. Ledig, C.; Theis, L.; Huszár, F.; Caballero, J.; Cunningham, A.; Acosta, A.; Aitken, A.P.; Tejani, A.; Totz, J.; Wang, Z.; et al. Photo-realistic single image super-resolution using a generative adversarial network. In Proceedings of the IEEE Conference on Computer Vision and Pattern Recognition, Honolulu, HI, USA, 21–26 July 2017; pp. 4681–4690. [Google Scholar]
  54. Zhang, H.; Xu, T.; Li, H.; Zhang, S.; Wang, X.; Huang, X.; Metaxas, D.N. StackGAN++: Realistic image synthesis with stacked generative adversarial networks. IEEE Trans. Pattern Anal. Mach. Intell. 2018, 41, 1947–1962. [Google Scholar] [CrossRef] [PubMed]
  55. Xue, Z.; Shi, W.; Wei, C.; Wu, T.; Huang, Z. Geochronology and geodynamic setting of the carbonate-hosted Pb-Zn deposits in world-class Sichuan-Yunnan-Guizhou triangle, South China. Acta Geochim. 2025, 44, 217–230. [Google Scholar] [CrossRef]
  56. Li, B. Fluid Geochemistry and Structural Geochemistry of the Huize and Songliang Pb-Zn Deposits in Northeast Yunnan, China; Kunming University of Science and Technology: Kunming, China, 2010; p. 194. [Google Scholar]
  57. Hu, R.Z.; Fu, S.L.; Huang, Y.; Zhou, M.F.; Fu, S.H.; Zhao, C.H.; Wang, Y.J.; Bi, X.W.; Xiao, J.F. The giant South China Mesozoic low-temperature metallogenic domain: Reviews and a new geodynamic model. J. Asian Earth Sci. 2017, 137, 9–34. [Google Scholar] [CrossRef]
  58. Wang, L.-J.; Mi, M.; Zhou, J.-X.; Luo, K. New constraints on the origin of the Maozu carbonate-hosted epigenetic Zn-Pb deposit in NE Yunnan Province, SW China. Ore Geol. Rev. 2018, 101, 578–594. [Google Scholar] [CrossRef]
  59. Li, Y.; Yaya, M.; Zhang, Y.; Han, R.; Wang, M.; Wu, J.; Yang, Y. Characteristics of the “multi-layer” mineralization and alteration of lead-zinc deposits in the northeastern Yunnan ore concentration area and their significances for prospecting mineral resources. Acta Mineral. Sin. 2025, 46, 342–360. [Google Scholar] [CrossRef]
  60. Oyebamiji, A.; Hu, R.; Zhao, C.; Zhaanbaeva, A.; Zafar, T. Ore genesis of the Qilinchang Carboniferous carbonate Pb-Zn Mississippi Valley-type deposit, Western Yangtze Platform, Southwest China: Constraints from mineralogy, C-O-S-Pb isotope systematics, and REE studies. Episodes 2020, 43, 761–784. [Google Scholar] [CrossRef]
  61. Zhou, J.X.; Luo, K.; Wang, X.C.; Wilde, S.A.; Wu, T.; Huang, Z.L.; Cui, Y.L.; Zhao, J.X. Ore genesis of the Fule Pb-Zn deposit and its relationship with the Emeishan large igneous province: Evidence from mineralogy, bulk C-O-S and in situ S-Pb isotopes. Gondwana Res. 2018, 54, 161–179. [Google Scholar] [CrossRef]
  62. Li, Z.L.; Ye, L.; Hu, Y.S.; Wei, C.; Huang, Z.L.; Yang, Y.L.; Danyushevsky, L. Trace elements in sulfides from the Maozu Pb-Zn deposit, Yunnan Province, China: Implications for trace-element incorporation mechanisms and ore genesis. Am. Mineral. 2020, 105, 1734–1751. [Google Scholar] [CrossRef]
  63. Han, R.S.; Zou, H.J.; Li, B.; Hu, Y.Z. Tectono-geochemistry ore-finding method for concealed ore-bodies as exemplified by the Zn-Pb-(Ag-Ge) metallogenic district in northeast Yunnan, China. In Proceedings of the 33rd International Geological Congress, Oslo, Norway, 6–14 August 2008. [Google Scholar]
  64. Wu, H.S.; Liu, Y.X.; Pu, Y.L.; Liu, P.; Zhao, W.J.; Guo, X.X. National-scale nighttime high-temperature anomalies from Landsat-8 OLI images. ISPRS J. Photogramm. Remote Sens. 2024, 212, 212–229. [Google Scholar] [CrossRef]
  65. Lv, J.W.; Geng, J.; Xu, X.H.; Yu, Y.; Fang, H.J.; Guo, Y.F.; Cheng, S.L. Estimating Cadmium Concentration in Agricultural Soils with ZY1-02D Hyperspectral Data: A Comparative Analysis of Spectral Transformations and Machine Learning Models. Agriculture 2024, 14, 1619. [Google Scholar] [CrossRef]
  66. Bonvalot, S.; Briais, A.; Kuhn, M.; Peyrefitte, A.; Vales, N.; Biancale, R.; Gabalda, G.; Moreaux, G.; Reinquin, F.; Sarrailh, M. Global Grids: World Gravity Map (WGM2012); Bureau Gravimétrique International: Paris, France, 2012. [Google Scholar]
  67. Maus, S.; Sazonova, T.; Hemant, K.; Fairhead, J.D.; Ravat, D. National Geophysical Data Center candidate for the World Digital Magnetic Anomaly Map. Geochem. Geophys. Geosyst. 2007, 8, Q06017. [Google Scholar] [CrossRef]
  68. Salimans, T.; Goodfellow, I.J.; Zaremba, W.; Cheung, V.; Radford, A.; Chen, X. Improved techniques for training GANs. Adv. Neural Inf. Process. Syst. 2016, 29, 2226–2234. [Google Scholar]
  69. Soliman, F.A.; Ragab, D.A.; El-Shafai, W.; Abaza, M. Hybrid deep learning framework for image restoration in Fso systems affected by log-normal fading. Sci. Rep. 2026, 16, 14653. [Google Scholar] [CrossRef] [PubMed]
  70. Li, T.; Zuo, R.; Zhao, X.; Zhao, K. Mapping prospectivity for regolith-hosted REE deposits via convolutional neural network with generative adversarial network augmented data. Ore Geol. Rev. 2022, 142, 104693. [Google Scholar] [CrossRef]
  71. He, K.; Zhang, X.; Ren, S. Deep residual learning for image recognition. In Proceedings of the IEEE Conference on Computer Vision and Pattern Recognition, Las Vegas, NV, USA, 27–30 June 2016; pp. 770–778. [Google Scholar]
  72. Wang, G.W. 3D Mineral Prospectivity Mapping from 3D Geological Models Using Return–Risk Analysis and Machine Learning on Imbalance Data. Minerals 2023, 13, 1384. [Google Scholar] [CrossRef]
  73. Santos, D.; Azzalini, A.; Mendes, A.; Cardoso-Fernandes, J.; Lima, A.; Müller, A.; Teodoro, A.C. Optimizing Exploration: Synergistic approaches to minimize false positives in pegmatite prospecting—A comprehensive guide for remote sensing and mineral exploration. Ore Geol. Rev. 2024, 175, 106347. [Google Scholar] [CrossRef]
  74. Ahuja, V.R.; Gupta, U.; Rapole, S.R.; Saxena, N.; Hofmann, R.; Day-Stirrat, R.J.; Prakash, J.; Yalavarthy, P.K. Siamese-SR: A Siamese Super-Resolution Model for Boosting Resolution of Digital Rock Images for Improved Petrophysical Property Estimation. IEEE Trans. Image Process. 2022, 31, 3479–3493. [Google Scholar] [CrossRef] [PubMed]
Figure 2. Result map of data processing for ore-indicating factors. (a) Structural buffer zones of faults; (b) Buffer zones of dolostone outcrop; (c) Mineral alteration (limonite, calcite, dolomite) from SAM; (d) Ag geochemical anomaly; (e) Pb geochemical anomaly; (f) Zn geochemical anomaly; (g) Residual Bouguer gravity; (h) Reduced-to-pole aeromagnetics.
Minerals 16 00722 g002
Figure 3. Processing flowchart of the Generative Adversarial Network.
Minerals 16 00722 g003
Figure 4. Schematic diagram of the random downsampling process.
Minerals 16 00722 g004
Figure 5. Schematic diagram of the pseudo-window size method.
Minerals 16 00722 g005
Figure 6. Schematic diagram of the ResNet network model architecture. (a) Residual block with shortcut connection; (b) Conv Block for dimension alteration; (c) Identity Block for depth stacking; (d) Overall ResNet architecture used in this study.
Minerals 16 00722 g006
Figure 7. Data augmentation process based on a Generative Adversarial Network (GAN).
Minerals 16 00722 g007
Figure 8. Data augmentation results for selected ore-indicating factors.
Minerals 16 00722 g008
Figure 9. Mineralization probability prediction maps based on the ResNet convolutional neural network model: (a) using the data augmented dataset; (b) without using the data augmented dataset.
Minerals 16 00722 g009
Figure 10. Mineralization probabilities of seven Pb-Zn ore points not included in training, as shown on the mineralization probability prediction map.
Minerals 16 00722 g010
Table 1. Summary of data sources.
Name of the DataData TypeData Source
Landsat-8 OLIRaster datahttps://www.gscloud.cn
(accessed on 15 March 2024) [64]
ZY1-02DRaster datahttps://www.cresda.com
(accessed on 20 March 2024) [65]
WGM gravity dataRaster datahttps://bgi.obs-mip.fr/grids-and-models-2
(accessed on 10 April 2024) [66]
WDMAM magnetic dataRaster datahttps://wdmam.org/
(accessed on 10 April 2024) [67]
Geochemical data of Yunnan ProvinceVector datahttp://www.geodata.cn
(accessed on 5 May 2024)
Geological dataVector datahttp://geochina.cgs.gov.cn
(accessed on 5 May 2024)
Notes: Spatial resolutions and processing levels of the datasets are as follows: Landsat-8 OLI (30 m, Level-2); ZY1-02D (30 m, L1A); WGM2012 gravity data (2 km grid); WDMAM magnetic data (2 km grid); geochemical data of Yunnan Province (1:100,000 scale, resampled to 2000 m grid); geological data (1:200,000 scale). Processing levels (e.g., Level-2, L1A) apply only to satellite remote sensing data; geochemical and geological data are provided as map scales and grid resolutions, as these data types do not use processing-level terminology.
Table 2. Meaning of the Peak Signal-to-Noise Ratio (PSNR) value indicator.
PSNR (dB)Data Quality
<20The image quality is very poor, and the distortion is extremely severe.
between 20 and 30The image quality is significantly degraded, and distortion is visible.
between 30 and 40The image quality is good, and the distortion is within an acceptable range.
>40The image difference is extremely small, almost imperceptible to the naked eye.
Table 3. Model training and validation results with and without data augmentation.
DatasetRMSEMAEAccuracy of the Training SetAccuracy of the Validation Set
Non-augmented dataset0.13610.0950.8690.765
Augmented dataset0.10230.0790.8830.842
Disclaimer/Publisher’s Note: The statements, opinions and data contained in all publications are solely those of the individual author(s) and contributor(s) and not of MDPI and/or the editor(s). MDPI and/or the editor(s) disclaim responsibility for any injury to people or property resulting from any ideas, methods, instructions or products referred to in the content.