Article

Mineralogical Characterization of a Typical Gray Siliceous Concretion on Marine-Excavated Ceramics from the Nanhai No. 1 Shipwreck: A Multi-Analytical Case Study

1
National Centre for Archaeology, Beijing 100013, China
2
Institute of Culture and Heritage, Northwestern Polytechnical University, Xi’an 710072, China
*
Author to whom correspondence should be addressed.
Minerals 2026, 16(7), 697; https://doi.org/10.3390/min16070697
Submission received: 21 May 2026 / Revised: 29 June 2026 / Accepted: 29 June 2026 / Published: 2 July 2026

Abstract

Gray siliceous concretions represent the most ubiquitous surface deposits on marine-excavated ceramics from the Nanhai No. 1 shipwreck. These concretions obscure decorative motifs and glaze surfaces of the artifacts, posing challenges to archeological interpretation and heritage conservation. This study conducted a multi-technique characterization of one representative gray siliceous concretion using micro-CT, PLM, SEM-EDS, XRD, FTIR, and micro-Raman spectroscopy. The concretion exhibits distinct three-tier density stratification and consists of quartz, muscovite, calcite, pyrite, and Mg-rich authigenic silicates (serpentine and talc), with quartz and muscovite as the dominant crystalline phases. Its mineral components are inferred to originate from terrigenous clastic, biogenic, and authigenic sources. This work provides fundamental mineralogical data to support the development of targeted conservation strategies for analogous marine-excavated ceramic heritage.

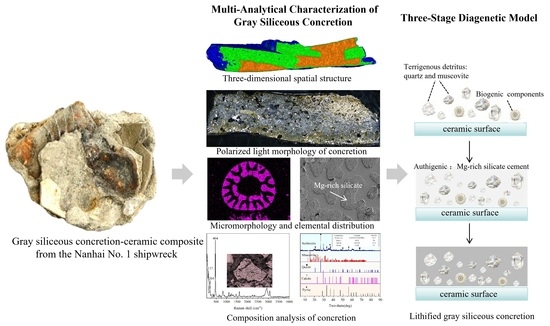
Graphical Abstract

1. Introduction

The Nanhai No. 1 shipwreck is the best-preserved ancient wooden ocean-going merchant ship discovered in the South China Sea. It sank during the Southern Song Dynasty (12th–13th centuries AD), was first identified in 1987 and was fully salvaged in 2007, with its hull originally buried approximately 1 m below the seabed surface [1,2].
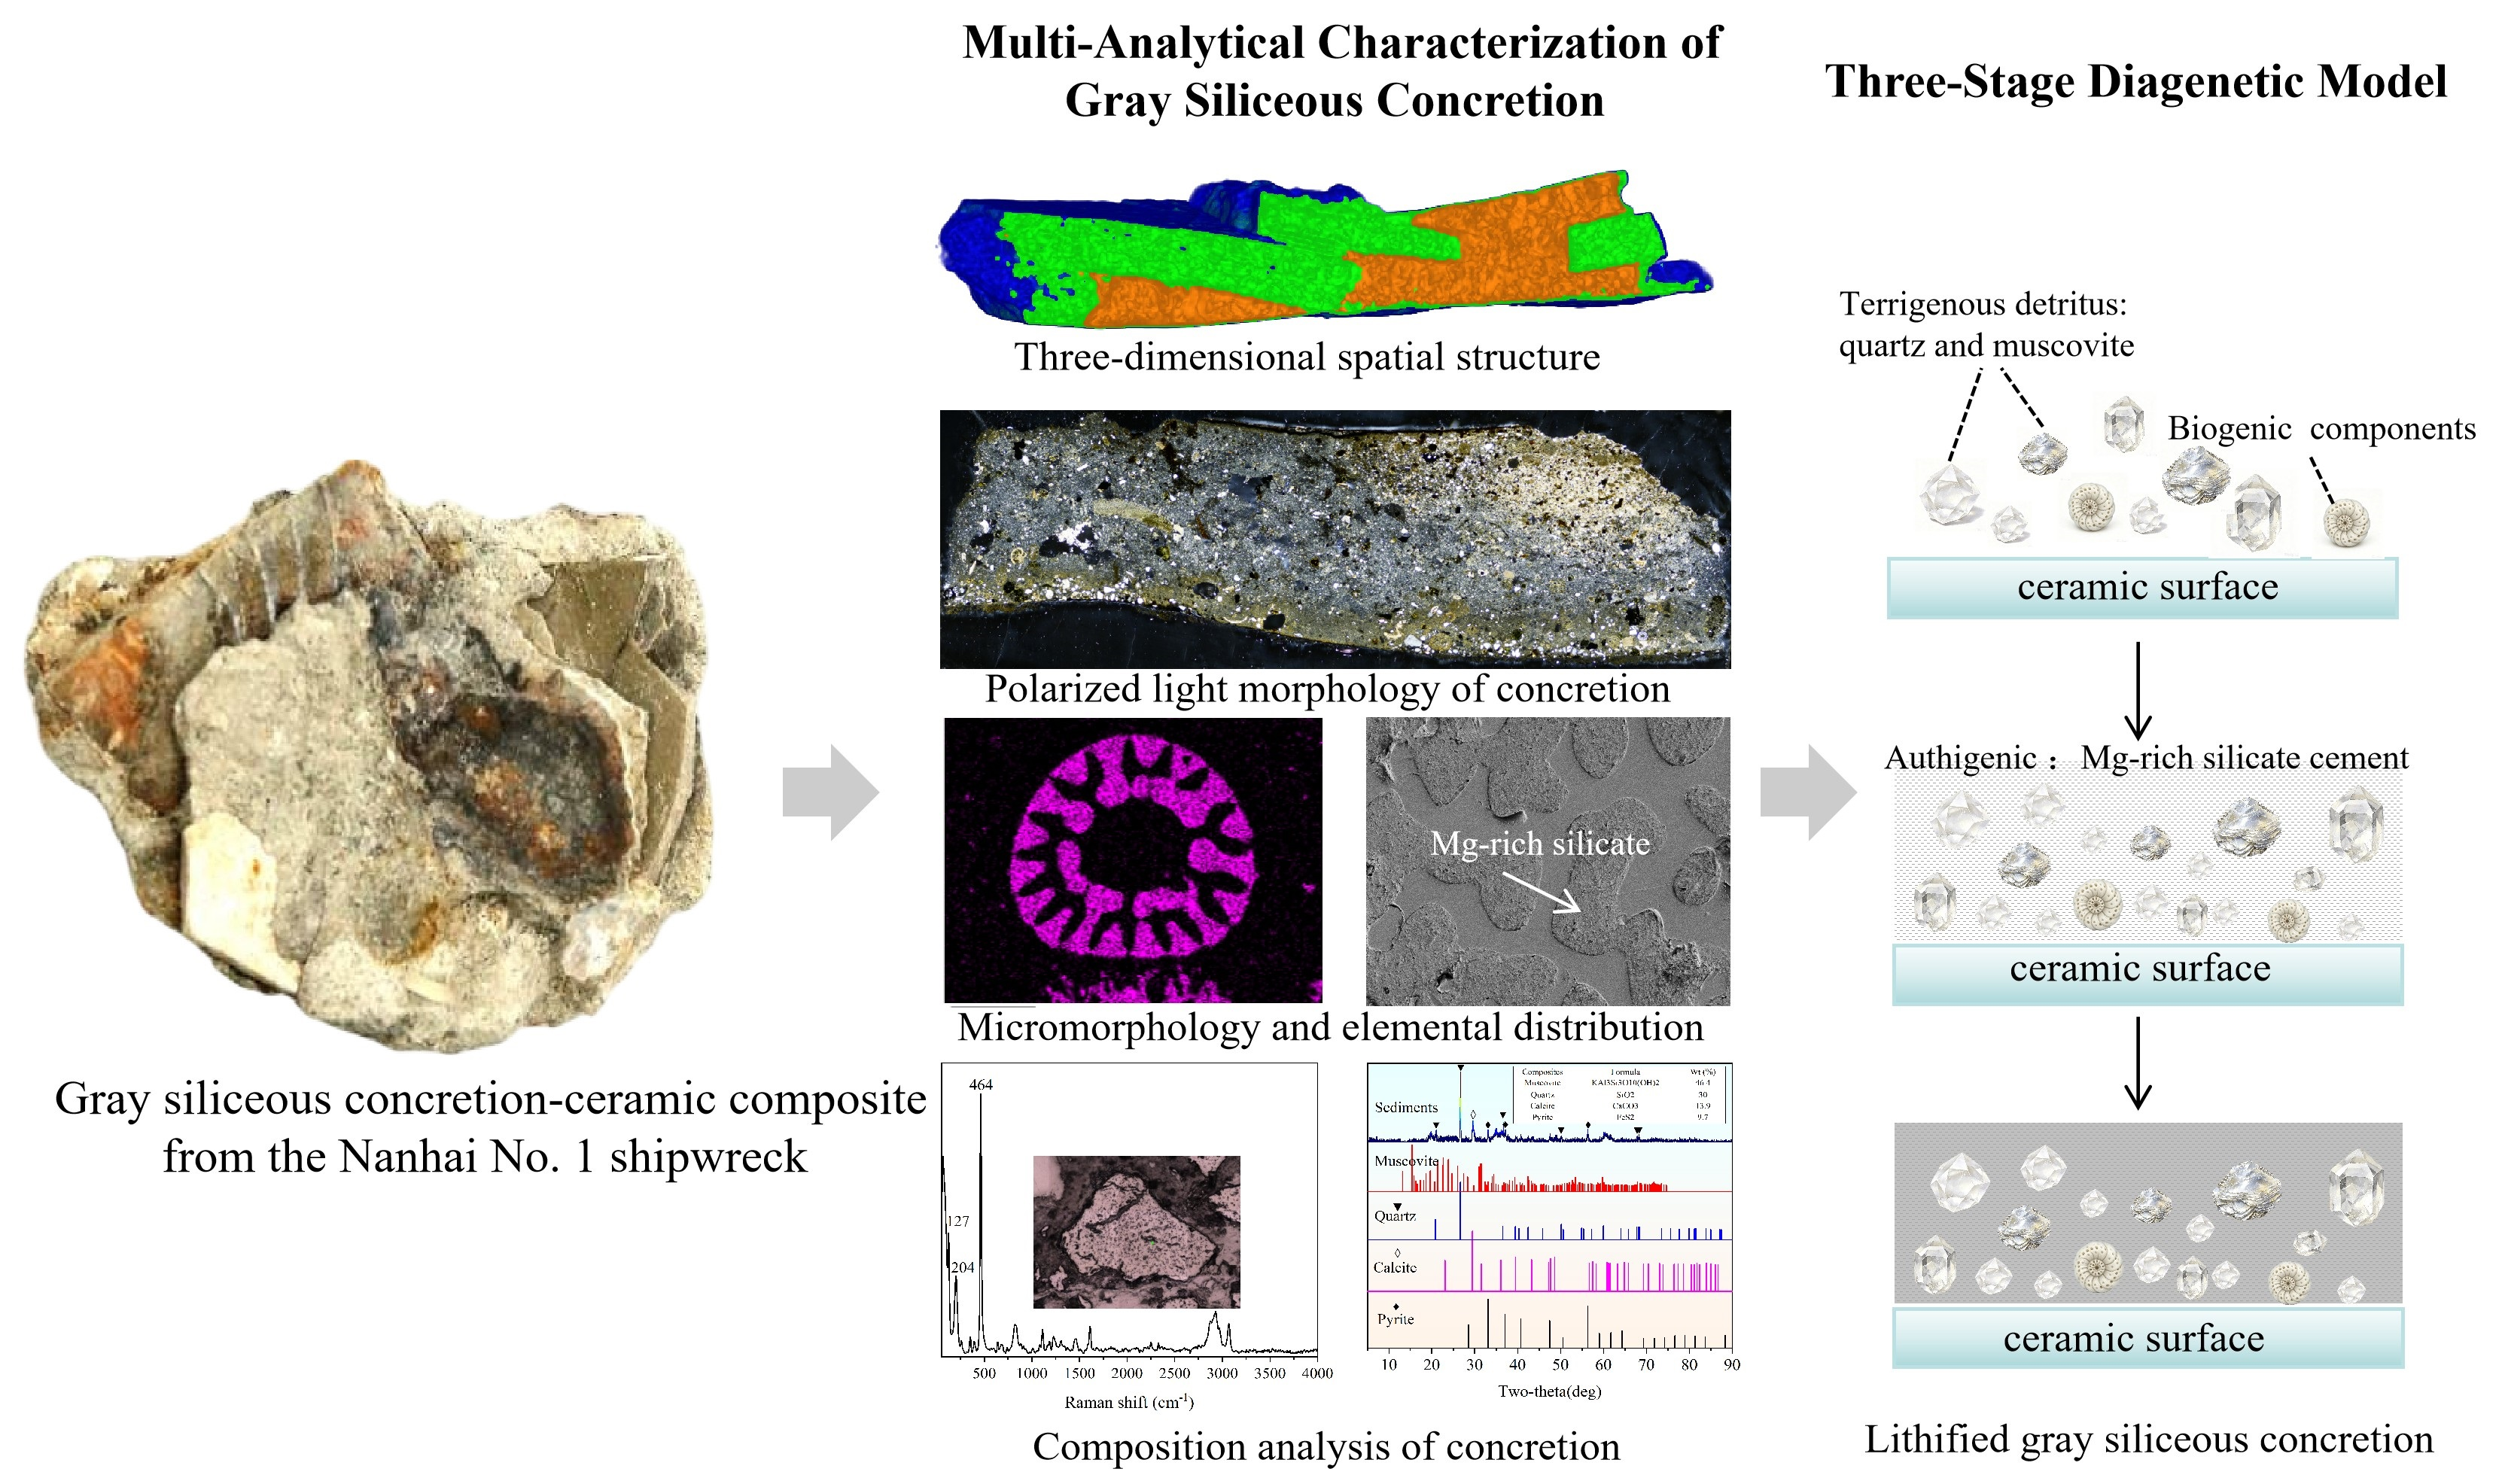
The wreck site is located in waters off the administrative border between Taishan and Yangjiang, Guangdong Province, China (approximately 21°30′ N, 112°22′ E), approximately 188.9 km east of the Pearl River Estuary (Figure 1). Fringed by numerous islands and reefs, the area represents a typical zone of interaction between nearshore sedimentary processes and offshore water masses. The site sits at a water depth of 24–26 m, where the bottom seawater overlying the buried hull has a salinity of 30‰–32‰, a pH value of approximately 8.9, and an annual average temperature of 16–18 °C. The region is characterized by irregular semidiurnal tides with predominantly reversing tidal currents. Shielded by the topographic barrier of adjacent islands and reefs, the site experiences generally low ambient flow velocities and weak hydrodynamic disturbance under normal conditions, with sediment transport intensifying markedly only during extreme weather events.
The seabed surrounding the wreck features gentle, low-relief topography with a slope of less than 0.5°. The regional Quaternary sedimentary succession comprises four units in descending order: grayish-yellow silt, light-gray silty clay, light-gray coarse sand, and basal light-gray silty clay. The bulk sediment is dominated by silt and clay fractions, with subordinate shell debris. This nearshore, shallow-marine, low-energy depositional regime provides stable ambient conditions for the prolonged development and diagenetic lithification of surface concretions on shipboard cargo artifacts.
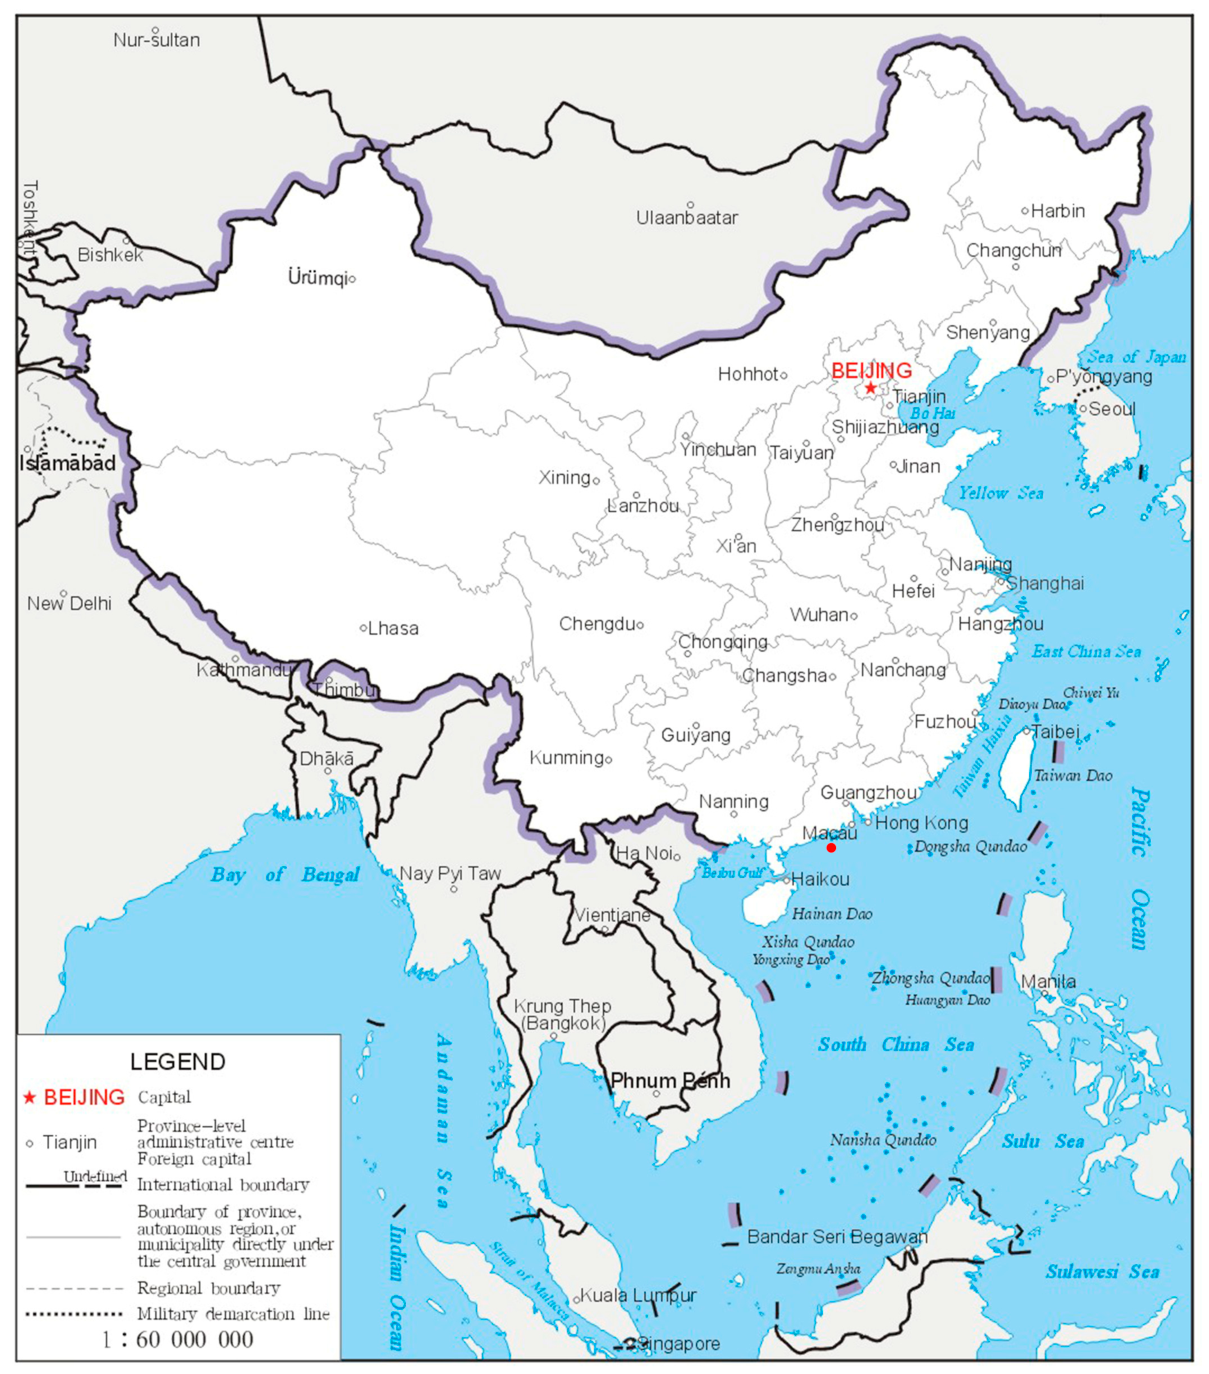
The surviving hull measures 30.4 m in length with a maximum beam of 9.8 m, and 13 watertight bulkheads are preserved in their original positions (Figure 2). More than 180,000 cultural relics have been recovered from the ship’s cargo holds, with ceramics constituting the majority of the assemblage. As the vessel transported commodities for overseas maritime trade, these ceramic finds are typical export porcelains, primarily Longquan celadon and qingbai porcelain fired at kilns in Fujian and Guangdong provinces, China [3].
These artifacts were fired at high temperatures, yielding dense and highly vitrified porcelain bodies dominated by SiO2 and Al2O3. Their glazes are primarily composed of SiO2, Al2O3, CaO, and alkali metal oxides (K2O and Na2O) [4,5]. Benefiting from their compact texture, high vitrification degree and chemically stable nature, most porcelain wares remain intact after underwater excavation. These well-preserved ceramic assemblages provide invaluable physical evidence for reconstructing ceramic trade networks along China’s Maritime Silk Road and investigating maritime cultural exchanges during the Southern Song Dynasty [3].
Following nearly 800 years of anoxic burial in the South China Sea, the hull is entirely encased in sediments of varying thickness. Archeological excavation has revealed widespread hard concretions, which are primarily distributed on the bow and stern, with additional development at the bottom of several mid-ship cargo holds (Figure 2). These concretions encapsulate a diverse artifact assemblage dominated by ceramics and metal objects.
Formed through the combined effects of marine hydrodynamics, sedimentary processes, biological activity, and corrosion of ferrous cargo artifacts, these concretionary crusts mask the morphological features and decorative patterns of ceramic wares, hindering archeological identification and value assessment [6]. Furthermore, they can alter and deteriorate the microstructure of porcelain bodies and glazes via physical cementation and chemical alteration, posing significant challenges to the conservation, restoration and public display of marine archeological heritage.
Based on differences in appearance, the surface concretions on the ceramics from the Nanhai No. 1 shipwreck can be classified into three types: gray siliceous, brown ferruginous, and composite concretions. All types have formed dense consolidated structures through long-term marine diagenesis, among which gray siliceous concretions are the most widely distributed and representative [7,8,9].
Multi-analytical studies have been conducted to characterize surface concretions on marine-excavated ceramics from shipwreck sites worldwide, with a focus on revealing concretion–ceramic interaction mechanisms, mineralogical identification of carbonate, sulfate, and phosphate crusts across varied depositional environments, and the controlling role of marine environmental conditions in concretion genesis [10,11]. For instance, Ricca et al. (2021) identified typical carbonate-sulfate composite encrustations on archeological pottery from the submerged Baia site in the Mediterranean and attributed their mineral assemblages to local marine depositional regimes [12]. These investigations have established general theoretical and methodological frameworks for the conservation of marine ceramic relics. Nonetheless, pronounced regional differences in marine hydrology, sedimentary settings, and burial geochemistry prevent direct extrapolation of these generalized findings to site-specific concretions, especially those from the Nanhai No. 1 shipwreck.
For the Nanhai No. 1 specifically, prior work has identified two dominant categories of surface concretions covering ceramic artifacts: ferruginous brown concretions and siliceous gray concretions. Ferruginous brown concretions are mainly composed of iron-bearing mineral phases, notably iron sulfides (e.g., pyrite) and iron oxyhydroxides (e.g., goethite). These iron-bearing minerals are generated via reactions driven by sulfate-reducing bacteria (SRB) under anaerobic conditions: SRB reduce dissolved sulfate in seawater to produce hydrogen sulfide in the anoxic seabed environment, which further combines with dissolved ferrous ions released from corroded iron components and cargo aboard the shipwreck and precipitates, ultimately forming iron sulfide minerals [5,8]. This concretion type has received comprehensive research attention, with previous investigations exploring its mineralogy, material sources, and corresponding cleaning and removal methods for cultural relic conservation [9].
However, systematic multi-technique mineralogical characterization of gray siliceous concretions remains lacking, despite their widespread distribution and critical implications for cultural heritage conservation. Specifically, their three-dimensional spatial distribution relative to ceramic substrates remains unresolved, and their fine-scale mineralogical, microstructural, and elemental properties have not been comprehensively documented. This knowledge gap impedes the development of targeted protocols for the safe removal of gray siliceous concretions and the conservation of underlying ceramics.
Therefore, clarifying the mineralogy, microstructural features and material provenance of gray siliceous encrustations on ceramics from the Nanhai No. 1 wreck can fill the current research gap and deliver fundamental reference data for the cleaning and conservation of comparable underwater ceramic artifacts. Considering the high value and irreplaceable nature of archeological cultural heritage, only one representative gray siliceous concretion–ceramic composite was selected for in-depth analysis. Recovered from the core burial zone of the wreck with intact concretions and no anthropogenic interference, this specimen can adequately reflect the universal features of ceramic surface deposits across the wreck area due to the uniform sedimentary environment at the site.
This work is framed as an exploratory methodological case study, employing an integrated multi-analytical approach comprising micro-computed tomography (micro-CT), polarized light microscopy (PLM), scanning electron microscopy–energy dispersive spectroscopy (SEM-EDS), X-ray diffraction (XRD), Fourier-transform infrared spectroscopy (FTIR), and micro-Raman spectroscopy (μ-Raman), to systematically characterize its three-dimensional spatial structure, petrographic and morphological features, elemental distribution, phase composition, and microscale chemical heterogeneity. The objective is to provide a comprehensive, reproducible mineralogical characterization of this typical concretion, establish a methodological benchmark and baseline dataset for similar marine archeological deposits, and support the development of safe, targeted removal and conservation protocols for marine-excavated ceramic relics from the Nanhai No. 1 shipwreck.

2. Materials and Methods

2.1. Sample Selection and Preparation

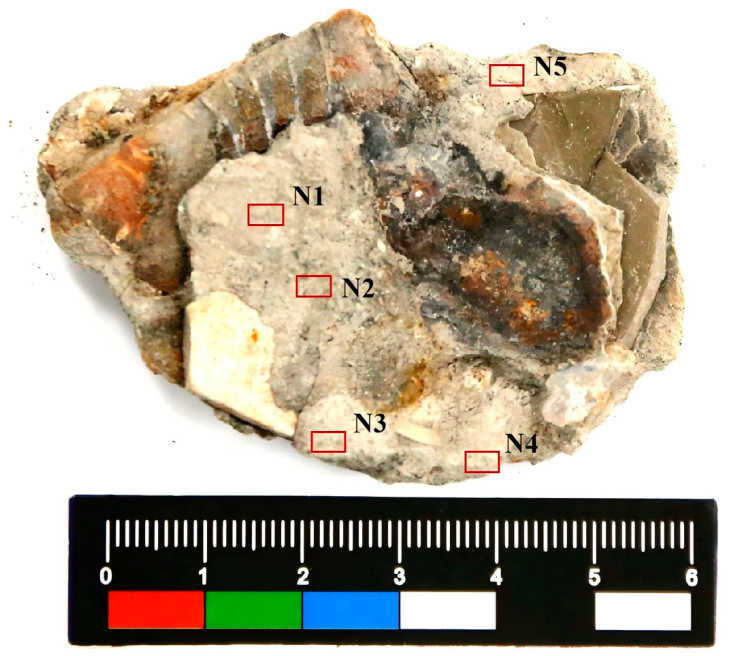
One representative gray siliceous concretion–ceramic composite was selected for this study, with dimensions of approximately 70 mm × 60 mm × 30 mm. The siliceous concretion forms a dense, massive layer fully covering the ceramic surface, and adheres tightly to the substrate with no obvious delamination. Macroscopically, the concretion exhibits a uniform texture without significant weathering or exfoliation, and only minor local cracks are visible on its surface (Figure 3).
Prior to any destructive sampling, the concretion–ceramic composite was first scanned using non-destructive micro-computed tomography (micro-CT). This step was conducted to visualize its overall three-dimensional architecture and internal density stratification, and to provide a structural basis for precise subsequent subsampling.
Five subsamples (labeled N1–N5) were then extracted from the detached concretion matrix for dedicated multi-analytical assays. Given that most characterization techniques involve destructive sample preparation (e.g., thin sectioning, powder grinding) and the available sample mass is limited, analytical tasks were systematically assigned to each subsample according to its sampling location, local structural integrity of the concretion, and compatibility with sample preparation protocols. This analytical workflow allows complementary, multi-dimensional characterization to be achieved with limited sample material. All sampling positions are indicated in Figure 3.
Subsamples N1, N2, and N5 all satisfy the requirements for standard thin-section preparation, sharing a consistent screening criterion: the siliceous concretion at these three positions features moderate thickness and continuous, intact layered structure, and can yield complete vertical profiles extending from the ceramic glaze substrate to the outer crust layer. In total, three standard thin sections were fabricated from these three subsamples. Subsamples N1 and N5 were prepared as thin sections for both polarized light microscopy (PLM) and micro-Raman (μ-Raman) spectroscopic analysis. The adjacent subsample N2 was prepared as a thin section for scanning electron microscopy coupled with energy-dispersive X-ray spectroscopy (SEM-EDS).
In contrast, subsamples N3 and N4 were collected from the marginal zones of the ceramic specimen, where the concretion lacks the continuous structural integrity required for intact oriented cross-sectional thin sections. These two subsamples were therefore allocated to powder-based analyses including X-ray diffraction (XRD) and Fourier-transform infrared spectroscopy (FTIR), for which preservation of in situ structural layering is not required. To further enhance the representativeness of bulk compositional results, subsamples N3 and N4, retrieved from two discrete regions of the concretion, were fully homogenized and combined prior to measurement, yielding a single combined dataset for both XRD and FTIR.
The matching relationship between subsamples and analytical methods is summarized in Table 1. After pretreatment, all specimens were sealed and stored in dark conditions to prevent secondary damage from temperature and humidity fluctuations and external contaminants.

2.2. Micro-Computed Tomography (Micro-CT) Analysis

The concretion–ceramic composite was characterized by micro-computed tomography (micro-CT) to analyze its three-dimensional internal structure and the spatial distribution characteristics of the gray siliceous concretions relative to the ceramic substrate. The measurement was performed using a Bruker SkyScan 2211 high-resolution X-ray computed tomography system (Bruker microCT N.V., Kontich, Belgium), with an accelerating voltage of 130 kV and a tube current of 150 μA. Considering the sample dimensions, the isotropic voxel resolution was optimized to 45.5 μm, and a filter-free scanning mode was adopted to preserve the contrast of the scanned images.
Raw data were processed using Object Research Systems (ORS) Dragonfly (Version 4.1, Object Research Systems Inc., Montreal, QC, Canada), a professional image analysis software package. FDK filtered back-projection reconstruction was implemented on the raw scan data, yielding 2D transverse and longitudinal tomographic images as well as a 3D visual reconstruction model of the sample. Grayscale threshold segmentation was applied to allow effective discrimination between the density-differentiated gray siliceous concretion layers and the ceramic substrate, facilitating further analysis of the three-dimensional spatial occurrence characteristics, density differentiation behavior of the gray siliceous concretions, and their interfacial contact features with the ceramic substrate.

2.3. Polarized Light Microscopy (PLM) Analysis

Optical microscopy was used to investigate the petrographic features of the concretion and the occurrence modes of its constituent mineral grains. All thin sections were prepared from subsamples taken from the same bulk concretion specimen to ensure analytical consistency. Representative fragments were embedded in high-transparency epoxy resin under vacuum (10 Pa, 30 min degassing) and cured at 25 °C for 24 h. The embedded blocks were precision-cut and sequentially ground with diamond abrasive disks (400, 800, 1200, 2000 mesh), then polished to a final thickness of 100 ± 5 μm (verified by the first-order gray-white interference color of quartz).
Observations were performed using a Caikon XP-202 transmitted-light polarizing microscope (Caikon, Shanghai, China) under both plane-polarized light (PPL) and cross-polarized light (XPL) modes. The optical characteristics of minerals (morphology, cleavage, color, pleochroism, interference color, extinction behavior) and marine biological remains were recorded, and preliminary mineral identification was conducted based on standard mineral optical databases [13].

2.4. Scanning Electron Microscopy–Energy Dispersive Spectroscopy (SEM-EDS) Analysis

The scanning electron microscopy–energy dispersive spectroscopy (SEM-EDS) technique was employed to investigate the micromorphology and elemental distribution of different components within the gray concretion sample, elucidating the spatial distribution patterns of concretion composition at the microscale. Polished concretion thin sections were prepared following the method described in the preceding section, then mounted on conductive adhesive tape and vacuum-dried. Subsequently, the sample surfaces were carbon-coated and placed in the SEM sample chamber for analysis.
Observations were conducted using a Hitachi TM-1000 scanning electron microscope (Tokyo, Japan) equipped with an Oxford Swift ED energy-dispersive X-ray spectroscopy (EDS) system (Oxford, UK). The instrument was operated in charge reduction mode with an accelerating voltage of 15 kV, and the secondary electron (SE) mode was adopted for the observation of the sample micromorphology. Following morphological observation, representative regions of interest (ROIs) were selected for EDS mapping analysis to determine the spatial distribution characteristics of the major elements.

2.5. X-Ray Diffraction (XRD) Analysis

X-ray diffraction (XRD) was employed to analyze the crystalline minerals in the gray siliceous concretions, facilitating qualitative and quantitative phase analysis. An appropriate amount of sample was taken from the gray siliceous concretions, ground thoroughly in an agate mortar, and a powdered sample with a particle size of 60–80 mesh was obtained. The measurements were performed using a PANalytical X’Pert 3 powder X-ray diffractometer (Malvern Panalytical B.V., Almelo, The Netherlands) with copper Kα radiation (λ = 1.5406 Å). The operating voltage was set at 60 kV, the tube current at 60 mA, the 2θ scanning range at 5–90°, and the scanning speed at 2°/min. A vacuum optical path was adopted to reduce air-induced scattering interference on the X-rays. For data processing, the experimentally acquired XRD patterns were compared against the ICDD PDF-4+ standard mineral diffraction database to complete the qualitative phase analysis of the crystalline minerals in the gray siliceous concretions. Meanwhile, Rietveld full-profile refinement was applied to refine the diffraction data, enabling the quantitative analysis of the relative contents of individual mineral phases and determining the mass fractions of the main minerals in the samples.

2.6. Fourier Transform Infrared Spectroscopy (FTIR) Analysis

Fourier transform infrared spectroscopy (FTIR) was employed to characterize the amorphous phases, low-crystallinity minerals, and functional groups in the gray siliceous concretions. Powdered samples were prepared from bulk intact concretion material recovered from the ceramic surface, which contained both the fine cement matrix and coarser detrital mineral inclusions. To ensure representative bulk compositional analysis, subsamples N3 and N4 were pooled and homogenized prior to grinding. No pre-sieving step was applied; the combined material was first coarsely crushed and subsequently finely ground using an agate mortar. The resulting fine powder was mixed with pure KBr at a mass ratio of 1:100 and ground thoroughly in an agate mortar until uniform and fine. An appropriate amount of the mixed powder was placed in a pellet mold and pressed into transparent circular KBr pellets. The measurements were performed using an FTIR-650 Fourier transform infrared spectrometer (Tianjin Gangdong Technology Development Co., Ltd., Tianjin, China), with the spectral range set to 4000–400 cm−1 and a spectral resolution of 2 cm−1. Baseline correction was conducted using a pure KBr pellet as the blank reference. Triplicate analyses were performed on the sample, and the average spectrum was used as the final result.

2.7. Micro-Raman Spectroscopy Analysis

Micro-Raman spectroscopy was employed for point-scanning analysis of micro-areas on the cross-section of finely polished concretion thin sections, aiming to accurately characterize the material composition of specific micro-regions within the gray siliceous concretions and assist in determining the genetic types of minerals. Measurements were performed using a Renishaw InVia confocal Raman microscope system (Renishaw plc, Wotton-under-Edge, UK), equipped with a 532 nm laser excitation source, configured in a backscattering geometry, and fitted with Leica long-working-distance objectives of 10×, 20×, 50×, and 100× magnifications. The spectral acquisition range was set to 100–4000 cm−1, with a spectral resolution of approximately 4 cm−1 and an analytical spot diameter of about 10 μm. Typical characteristic micro-areas were selected on the cross-section of the gray siliceous concretions for point-scanning analysis. Triplicate spectra were collected for each micro-area, and the average spectrum was used. Cosmic ray removal, peak position calibration, and spectral fitting were conducted using LabSpec6 software (Version 6.10, HORIBA Scientific, Palaiseau, France). The measured spectra were compared and matched with the Dandekar Mineral Raman Spectral Database (2021 edition), enabling accurate qualitative identification of the micro-area phases.

3. Results

3.1. Three-Dimensional Spatial Structure and Density Zoning

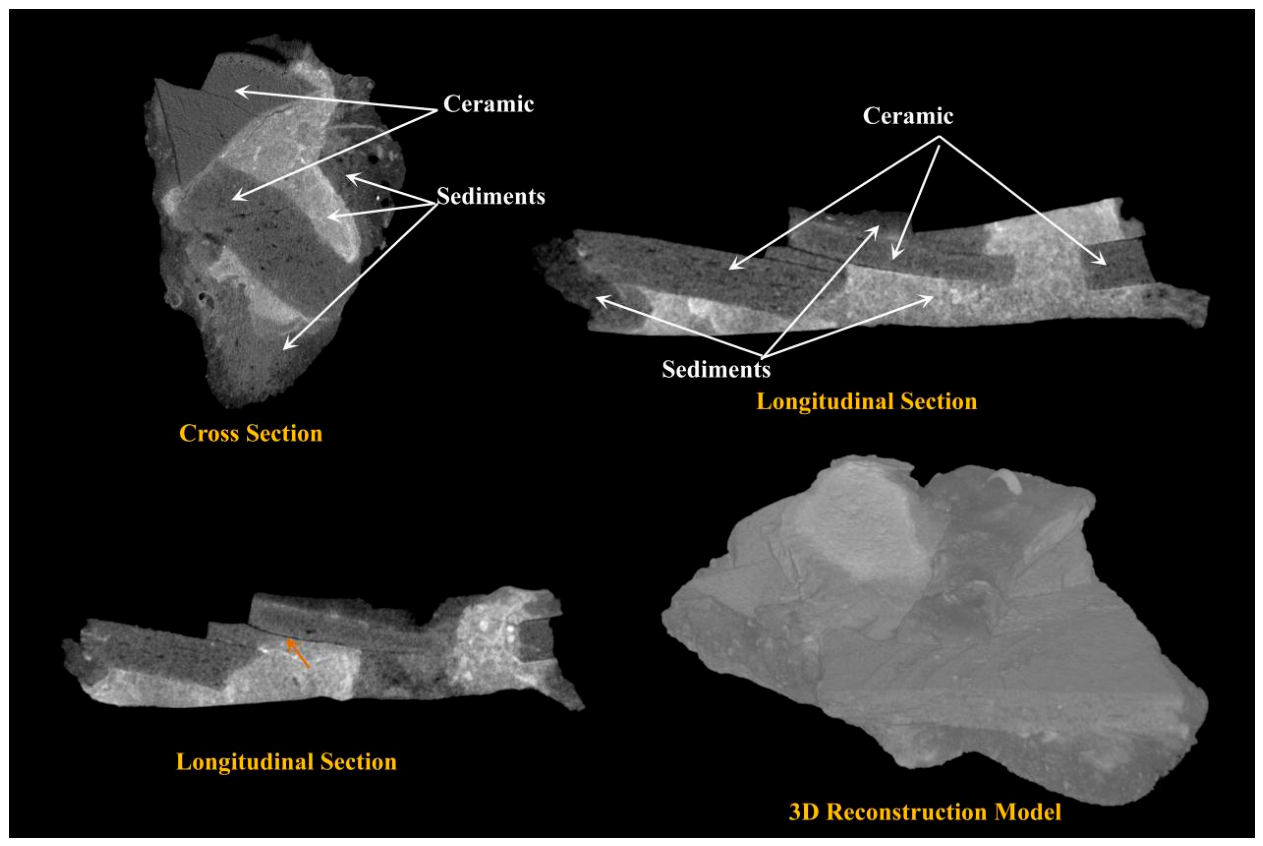
Micro-computed tomography (micro-CT) was used for non-destructive characterization of the three-dimensional internal structure and spatial occurrence characteristics of the concretion–ceramic composite; this technique visually discriminates different materials based on their distinct X-ray absorption coefficients, laying a foundation for analyzing the internal structure and spatial distribution of the gray siliceous concretions. Figure 4 shows the CT grayscale images of the concretion–ceramic composite. The results indicate that notable density heterogeneity exists within the gray siliceous concretions, which exhibit a distinct layered distribution pattern. Meanwhile, cracks are clearly visible at the contact interface between the ceramic substrate and the concretions (marked by orange arrows).
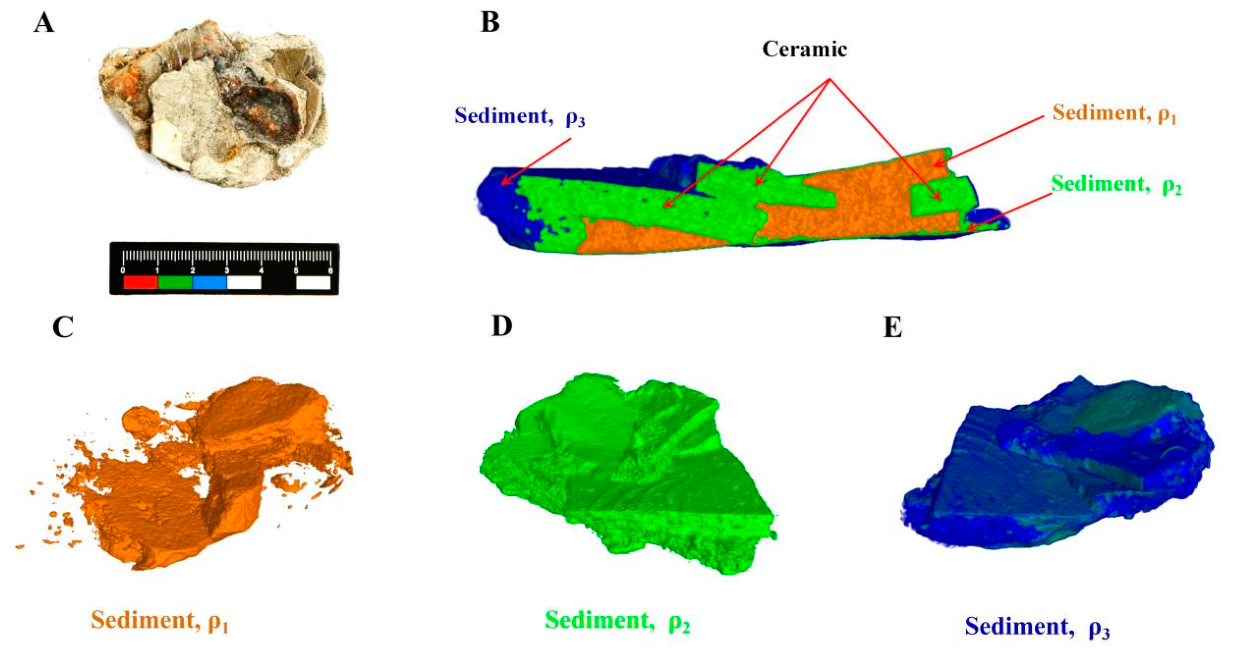
To more intuitively illustrate the spatial occurrence of gray siliceous concretions with different densities, pseudo-color rendering was performed on the three-dimensional micro-CT grayscale images, where different colors represent concretions with different densities (Figure 5). From the CT rendering in Figure 5B, specific spatial distribution patterns of the concretions with different densities on the surfaces of ceramic substrate are observed: the high-density concretions (ρ1) represented by orange are mainly distributed in specific areas on the ceramic surface (Figure 5C), exhibiting an overall heterogeneous distribution and mainly concentrating at the edges and convex regions of the ceramic substrate; the green regions correspond to the overlapping areas of the ceramic substrate and medium-density concretions (ρ2). Owing to the similar densities of the ceramic substrate and this concretion, the two are tightly interconnected spatially. The medium-density concretions (ρ2) are mostly distributed around the ceramic substrate or fill gaps and depressions on the ceramic surface (Figure 5B,D). Blue (ρ3) denotes the lowest-density concretions, which are mainly distributed at the edges and relatively concealed corner areas of the ceramic substrate (Figure 5E). Their morphology and distribution details are clearly distinguishable in Figure 5E, and these concretions are spatially isolated from those of other densities.
Based on the density zoning revealed by micro-CT, five subsamples (N1–N5) were selected for subsequent multi-analytical characterization. Specifically, subsample N1 is located in the medium-density zone (ρ2); subsample N2 lies in the medium-to-high density transition zone (ρ1/ρ2); subsamples N3 and N4 are situated in the low-to-high density transition zone (ρ3/ρ1); and subsample N5 is positioned in the medium-to-low density transition zone (ρ2/ρ3). The correspondence between sampling locations and density zoning can be cross-referenced with the macroscopic sampling map in Figure 3.

3.2. Petrographic Characteristics Under Polarized Light

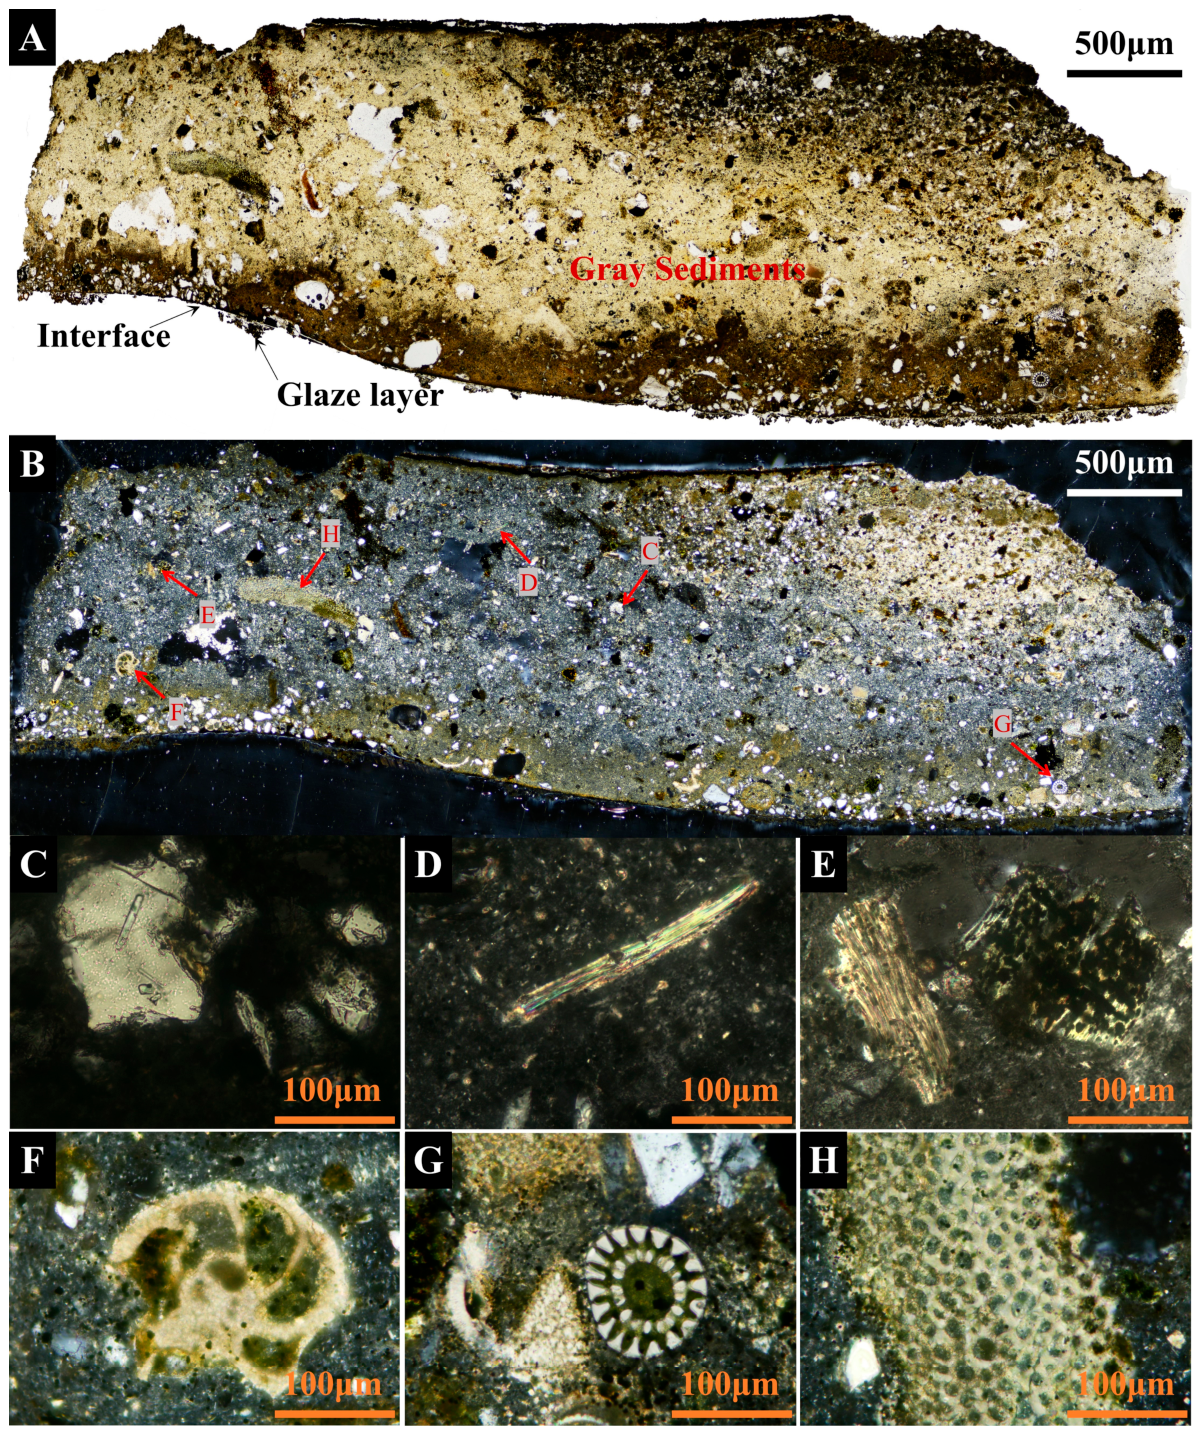
To characterize the major mineral composition and spatial distribution of the gray siliceous concretion, polished thin sections were prepared from its cross-sections and examined with a polarized light microscope. Under plane-polarized light (PPL) mode, emphasis was placed on observing the morphology, cleavage, color, pleochroism, relief, and surface structural features of minerals in the concretions; under cross-polarized light (XPL) mode, the interference colors and extinction behaviors of minerals were observed. Based on the mineral optical characteristics obtained from the two observation modes, preliminary qualitative identification of the main minerals in the concretions was conducted. Figure 6 shows the petrographic characteristics of the polished thin section of the gray siliceous concretion under PPL and XPL modes.
The PPL image (Figure 6A) shows that the color of gray siliceous concretions exhibits a gradual darkening trend from the center toward the ceramic surface. The dark-colored regions result from the high-concentration accumulation of concretions, which indicates that the density of the concretions gradually increases from the center toward the ceramic surface. Furthermore, a large number of white mineral grains of varying sizes and irregular morphologies are visible in the concretion thin sections. These grains are colorless and transparent under PPL, exhibit low positive relief, and lack obvious cleavage features. Meanwhile, scattered elongated acicular or short prismatic mineral grains are observed; these grains are also predominantly colorless under PPL, show moderate positive relief, and possess perfect basal cleavage, with cleavage planes appearing as fine, dense, and continuous parallel lines (Figure 6A).
Under XPL mode (Figure 6B), the aforementioned white grains show extinction phenomena during stage rotation and display first-order gray to white interference colors (Figure 6C); the acicular or short prismatic grains exhibit parallel extinction with vivid high-order interference colors (upper second to third order) (Figure 6D,E). Based on the above optical features and standard mineral optical parameters, the white grains are preliminarily identified as quartz, and the acicular or short prismatic grains as muscovite [13,14]. Additionally, abundant marine bioclasts with typical morphological features are observed in the gray concretion thin sections, mainly including foraminifera (Figure 6F), echinoderm spine fragments (Figure 6G) and sponge fragments (Figure 6H).

3.3. Micromorphology and Elemental Distribution

To elucidate the micromorphological characteristics and elemental distribution patterns of the gray siliceous concretions, representative gray concretion samples were subjected to combined scanning electron microscopy–energy dispersive spectroscopy (SEM-EDS) analysis, with the results presented in Figure 7 and Figure 8.
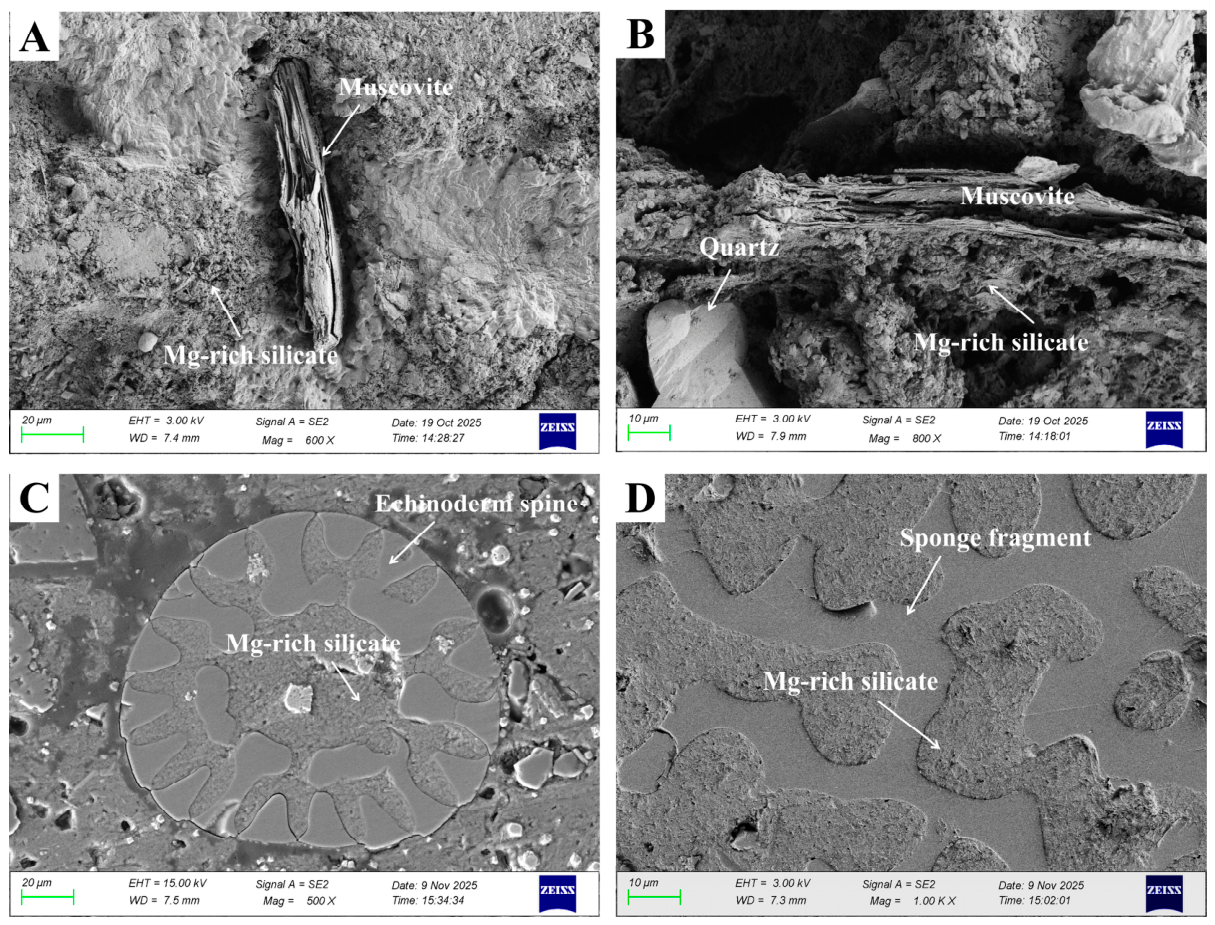
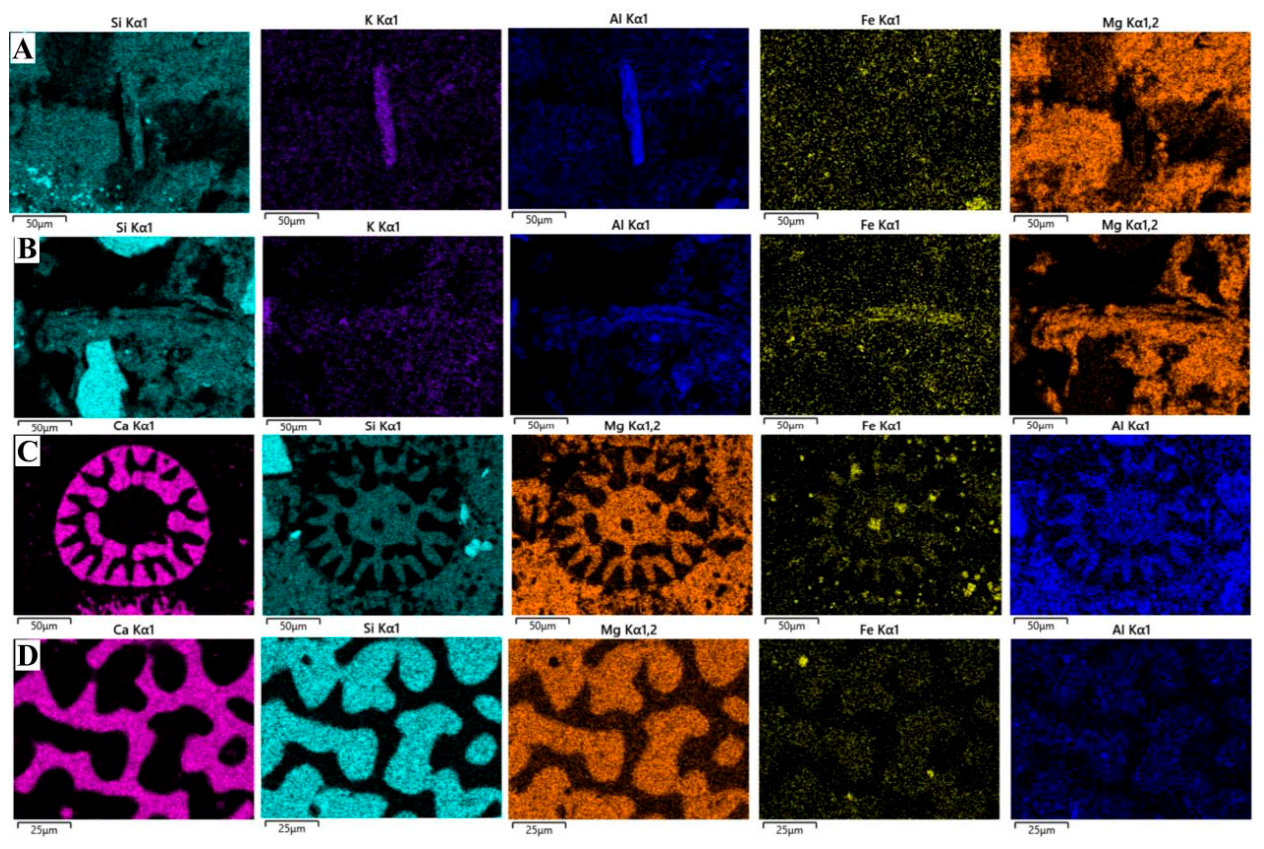
A large number of lamellar mineral grains were observed in the gray siliceous concretions. These grains exhibit a well-defined flaky crystalline structure with sharp crystal edges (Figure 7A,B). EDS elemental analysis revealed that the major constituent elements of these lamellar grains are Si, Al, and K (Figure 8A). Based on the combined micromorphological and elemental composition characteristics, they are preliminarily identified as muscovite [15]. Furthermore, detrital mineral grains with relatively smooth surfaces are visible in the samples (Figure 7B). EDS elemental analysis indicated that these grains are dominated by Si (Figure 8B), and combined with their micromorphological and elemental features, these grains are preliminarily identified as quartz [16].
Meanwhile, subspherical and elongated bioclasts were observed (Figure 7C,D). EDS analysis revealed that their major constituent element is Ca (Figure 8C,D), and based on the morphological characteristics, these deposits are preliminarily identified as skeletal remains of marine organisms such as echinoderm spine and sponge.
Additionally, it was observed that quartz, muscovite, and marine bioclasts were all tightly encapsulated by fine-grained cement (Figure 7). EDS elemental analysis revealed strong co-enrichment of Si and Mg in the matrix region, with their signal intensities markedly higher than those of other elements. Fe is sporadically distributed throughout the matrix, while Al shows an overall weak and homogeneous signal (Figure 8). Dominated by Si and Mg with minor amounts of Fe and Al, this cement is preliminarily identified as Mg-rich authigenic silicate minerals. Its elemental stoichiometric characteristics are highly consistent with the typical composition of serpentine-group authigenic minerals in submarine burial environments, indicating that serpentinization-related authigenic cementation driven by seawater–sediment interaction occurred during concretion formation.

3.4. Mineral Phases and Functional Group Compositions

To further clarify the mineral phase composition and functional group characteristics of the gray siliceous concretions, X-ray diffraction (XRD) was used for qualitative and quantitative analysis of crystalline phases, and Fourier transform infrared spectroscopy (FTIR) was applied for functional group characterization and supplementary phase identification. Notably, all samples were collected exclusively from surface concretion material on the ceramic glaze. Given the well-preserved ceramic body with no obvious pulverization or glaze exfoliation, contamination from primary ceramic phases is negligible in the following analyses.
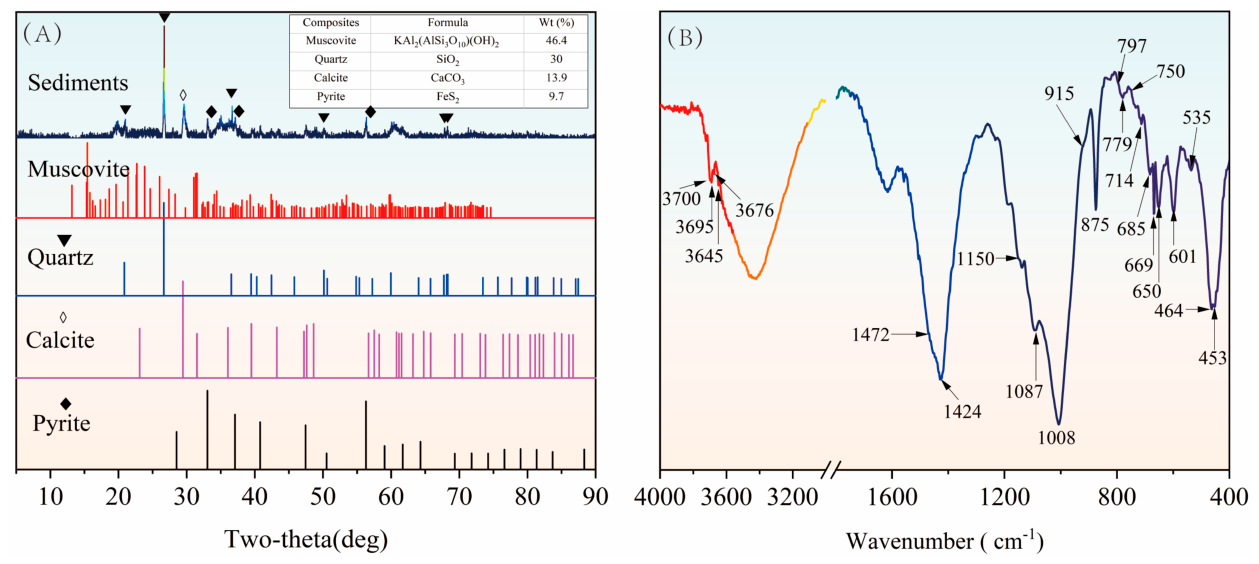
XRD analysis (Figure 9A) identified four major crystalline phases, with characteristic diffraction peaks at 2θ ≈ 8.8°, 26.6°, 29.4°, and 33.1°, respectively. The positions and relative intensities of these characteristic peaks were highly consistent with the standard reference patterns of α-quartz, muscovite, calcite, and pyrite, confirming the presence of these crystalline minerals in the gray siliceous concretions. A prominent broad diffraction peak was also detected at 2θ ≈ 19.76°, indicating the presence of poorly crystalline, layered phyllosilicate minerals in the sample. This peak is attributed to the combined contribution of fine-grained, structurally disordered clay minerals and serpentine, which is corroborated by the FTIR spectroscopic results.
Further quantitative analysis of well-crystallized phases was performed using the Rietveld full-profile refinement method. The results indicated that the mass fractions of muscovite, α-quartz, calcite, and pyrite were 46.4%, 30.0%, 13.9%, and 9.7%, respectively, among which muscovite and α-quartz were the dominant crystalline minerals in the gray siliceous concretions.
The FTIR analysis results (Figure 9B), as an effective complement to XRD analysis, provided additional compositional information of the concretions. Characteristic absorption peaks of α-quartz appeared at 1087 cm−1, 797/779 cm−1, and 464 cm−1, corresponding to Si-O-Si antisymmetric stretching vibration, Si-O-Si symmetric stretching and bending vibration, and O-Si-O bending vibration, respectively [17,18]; characteristic absorption bands of muscovite occurred at 3620–3640 cm−1, 1008 cm−1, and 915 cm−1, sequentially corresponding to hydroxyl stretching vibration, Si-O antisymmetric stretching vibration, and Al-OH bending vibration [10]; characteristic absorption bands of carbonate groups in calcite were observed at 1424 cm−1, 875 cm−1, and 714 cm−1, which mutually corroborated the XRD identification results [19,20].
In addition, additional absorption bands were detected in the ranges of 3600–3700 cm−1, 950–1100 cm−1, and low wavenumber range of 400–700 cm−1, suggesting the potential presence of Mg-rich silicate minerals in the concretions. Through characteristic peak assignment, the strong, sharp OH stretching vibration peak at 3695 cm−1 and the accompanying weak shoulder peak at 3645 cm−1 were both attributed to the hydroxyl groups in serpentine [19]. Meanwhile, the strong, sharp OH stretching vibration peak observed at 3676 cm−1 is one of the typical characteristic peaks of talc, further supporting that the Mg-rich silicate minerals in the gray siliceous concretions are mainly serpentine and talc [21,22]. Furthermore, a broad and weak absorption band was detected near 3580–3600 cm−1. This feature is related to the isomorphic substitution of Al3+ or Fe3+ in the octahedra, indicating that the serpentine crystal lattice contains iron and aluminum dopants.

3.5. Micro-Area Mineral Phase Identification via Micro-Raman

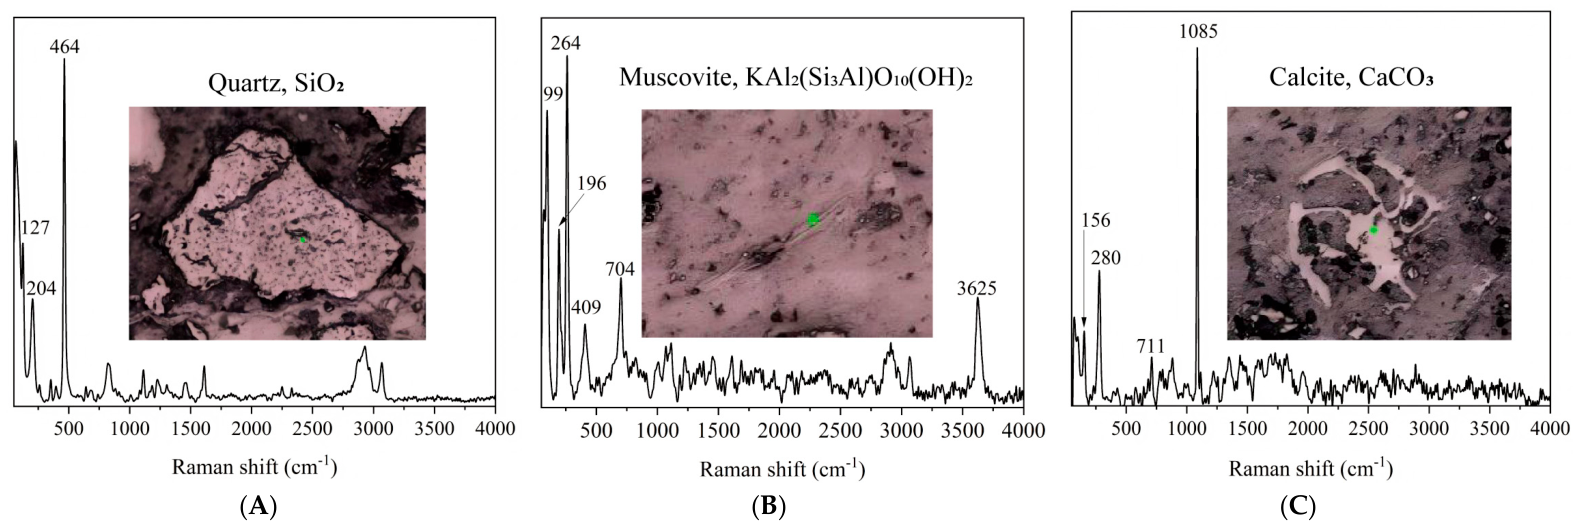
To enable in situ precise identification of mineral phases and validation of the preliminary results obtained from previous characterization, micro-Raman spectroscopic point-scanning analyses were performed on typical micro-areas of suspected quartz, muscovite, and foraminifera in cross-sections of the gray siliceous concretions. These analyses were conducted based on earlier polarized light microscopy observations and SEM-EDS elemental analysis, aiming to achieve accurate micro-area phase confirmation and further distinguish mineral species with similar morphologies or elemental compositions. The results are presented in Figure 10.
The Raman spectrum of the suspected quartz micro-area preliminarily identified in the earlier characterization (Figure 10A) exhibited a sharp and intense characteristic peak at approximately 465 cm−1, corresponding to the symmetric stretching-bending vibration mode of the Si-O bond. Meanwhile, two weak but distinct bands were observed at 128 cm−1 and 206 cm−1, corresponding to the lattice translation/rotation modes of quartz. These spectral features are typical Raman fingerprints of quartz, thus allowing accurate identification of the mineral phase in this micro-area as α-quartz [9,23].
The Raman spectrum of the suspected muscovite micro-area preliminarily identified in the earlier characterization (Figure 10B) exhibited a sharp and intense peak at approximately 3625 cm−1, which was assigned to the O-H stretching vibration [24]. A prominent characteristic peak appeared at approximately 195 cm−1 in the fingerprint region, corresponding to the interlayer vibration mode of muscovite [25]. Characteristic peaks were also observed at approximately 262 cm−1, 409 cm−1, and 703 cm−1, corresponding to deformation and stretching vibrations within the Si-O-Al framework of muscovite [26]. Based on the above spectral features, the mineral phase could be accurately identified as highly crystalline muscovite, effectively distinguishing it from low-order clay minerals such as illite that cannot be differentiated by conventional morphological or elemental analysis.
Raman spectroscopic analysis was conducted on the echinoderm spine fragment micro-area identified in the petrographic observation (Figure 10C). An extremely sharp and intense peak appeared at 1085 cm−1, corresponding to the symmetric stretching (ν1) mode of the CO32− ion [27]. A distinct sharp peak occurred at 711 cm−1, attributed to the in-plane bending (ν4) vibration of the CO32− ion [28]. In addition, doublet peaks characteristic of the calcite lattice mode were observed: a strong absorption band at 278–280 cm−1 and a weak absorption band at 154–156 cm−1 [29]. These spectral features are highly consistent with the Raman characteristics of calcite, verifying that the calcite in the gray siliceous concretions originates from marine biogenic skeletons and offering direct evidence for the biogenic provenance of carbonate minerals that could not be fully constrained by previous analytical techniques.

4. Discussion

Based on the combined results of multi-analytical characterization, this study identifies the mineral composition of the gray siliceous concretion on ceramic recovered from the Nanhai No. 1 Shipwreck. The employed multi-method forms a progressive analytical framework: micro-CT establishes the macro structural framework and guides targeted subsampling; polarized light microscopy and SEM-EDS characterize petrographic textures and microscale elemental distribution; XRD and FTIR jointly constrain both well-crystallized and poorly crystalline mineral phases; micro-Raman spectroscopy provides definitive in situ phase verification. This complementary design ensures the robustness of subsequent provenance interpretation.
Combined with regional sedimentary and burial contexts, these analytical data place multi-dimensional constraints on the material sources of each mineral phase. Non-destructive micro-CT observation reveals three-tiered density stratification and internal textural heterogeneity. Integrated with multi-dimensional analytical data from PLM, SEM-EDS, XRD, FTIR, and micro-Raman spectroscopy, the mineral phases in the concretion can be genetically classified into three categories: terrigenous detritus, biogenic components, and authigenic minerals.
Quartz and muscovite constitute the dominant terrigenous detrital components in the concretion, and their terrigenous origin is supported by multiple lines of microscopic evidence. Morphological observations under polarized light microscopy and SEM show that both mineral grains exhibit subangular morphology with distinct crystal face boundaries and well-preserved crystal structures, without significant rounding or plastic deformation. No traces of marine alteration, such as seawater corrosion pits or bioerosion cavities, are observed on the grain surfaces. Neither XRD nor FTIR analyses detect typical secondary alteration minerals such as vermiculite. Collectively, these findings indicate that the detritus did not undergo prolonged marine dynamic abrasion or significant chemical alteration after deposition.
In terms of mineral assemblage, the quartz–muscovite association is a typical detrital product of weathering from continental acidic magmatic and metamorphic source rocks, and serves as a critical mineralogical indicator for identifying terrigenous material input [30]. In light of the regional sedimentary setting, the shipwreck site is fringed by numerous islands and reefs, and its sediment supply is dominated by weathered detritus from nearshore terrestrial bedrock transported via short-distance longshore currents; the grains therefore did not experience sufficient abrasion from long-distance fluvial transport. Meanwhile, the site lies in a nearshore shallow water area at a depth of 24–26 m, where the ceramic artifact surfaces form a localized low-energy sedimentary microenvironment. Upon arrival, detrital particles settled rapidly and adhered to the artifact surfaces without sustained modification by wave winnowing; thus, their primary subangular morphology was fully preserved.
In addition to terrigenous detritus, calcite in the concretion is a typical biogenic component. Marine bioclasts including echinoderm spines and sponge fragments are identifiable under microscopy, and micro-Raman spectroscopy confirms their mineral composition is calcite. This is consistent with the typical mineralogical features of marine biogenic calcareous skeletons, verifying the marine biological origin of this component.
The remaining Mg-rich silicates (talc and serpentine) and pyrite are authigenic minerals formed in the submarine burial environment [31,32]. Among them, Mg-rich silicates occur as fine-grained disseminated phases, which tightly encapsulate various detrital grains and bioclasts as cement and constitute the matrix phase of the concretion. SEM-EDS elemental analysis shows strong co-distribution of Si and Mg in the matrix region, with elemental ratios generally consistent with the theoretical stoichiometric characteristics of serpentine-group minerals [33,34]. This indicates that these Mg-rich phyllosilicates formed via authigenic precipitation through water–rock interaction between seawater and detrital sediments in the submarine burial environment [35]. This process falls within the scope of authigenic reactions in marine burial environments, referring to in situ mineral precipitation driven by seawater–sediment water–rock interaction under anoxic conditions, and is unrelated to alteration of the ceramic body.
As another typical authigenic phase formed under anoxic burial conditions, pyrite is a characteristic mineral of anoxic marine burial environments, and its formation follows the bacterial sulfate reduction (BSR) mechanism. Under anaerobic conditions, seawater sulfate is microbially reduced to produce sulfide ions, which combine with ferrous ions released from the corrosion of iron artifacts aboard the shipwreck [36,37]. Pyrite ultimately forms via diagenesis, and the large quantity of iron artifacts carried by the vessel provides an abundant local iron source for in situ pyrite precipitation [6]. Within the gray siliceous concretion investigated in this study, pyrite occurs as an authigenic phase that fills intergranular pores within the detrital framework, representing one of the components contributing to concretion lithification and consolidation. The occurrence of authigenic pyrite confirms that the shipwreck was buried in a stable anoxic depositional environment, providing preliminary mineralogical evidence for site formation processes and the burial history of the vessel. The detailed genetic classification of each mineral phase is summarized in Table 2.
Nevertheless, constrained by the single representative specimen, this study cannot yet distinguish between continuous burial and episodic exposure histories at the site. Detailed reconstruction of burial evolution requires further multi-sample comparative studies combined with isotopic and elemental geochemical tracers.

5. Conclusions

This study focuses on a representative gray siliceous concretion formed on marine-excavated ceramics from the Nanhai No. 1 shipwreck. An integrated multi-analytical characterization framework, comprising micro-CT, PLM, SEM-EDS, XRD, FTIR, and micro-Raman spectroscopy, was applied to systematically characterize the three-dimensional spatial structure, petrographic and morphological features, elemental distribution, and phase composition of the concretion.
The results demonstrate that three distinct density zones (high, medium, and low) are clearly developed within the siliceous concretion. The mineral assemblage consists of quartz, muscovite, calcite, pyrite, talc, and serpentine, with quartz and muscovite as the dominant crystalline phases. The interface between the concretion and the ceramic substrate is sharp, with no evident incorporation of ceramic body minerals.
Comprehensive analysis integrating mineral composition, occurrence modes, and petrographic and morphological features suggests that the siliceous concretion on the ceramic surface originates from a multi-source mixed genetic system, with material sources falling into three categories: terrigenous detritus, marine biogenic components, and marine authigenic minerals. Terrigenous detritus such as quartz and muscovite constitutes the initial detrital framework for concretion development. Marine biogenic calcareous components, including echinoderm spines and sponge debris, are the main contributors to the biogenic fraction. Mg-rich authigenic silicate minerals such as talc and serpentine act as the cementing phases and form the primary material basis for concretion lithification. Pyrite also falls within the authigenic mineral category, formed in an anoxic burial environment at the shipwreck site. Its sulfur is derived from the microbial reduction of seawater sulfate, and ferrous ions released by the corrosion of iron artifacts within the shipwreck provide an abundant local iron source for its in situ formation. The co-occurrence of the three components preliminarily reflects a multi-source mixed provenance framework for siliceous concretions on ceramic surfaces in nearshore shipwreck environments.
These findings provide systematic mineralogical baseline data for gray siliceous concretions, the most widely distributed concretion type on ceramics from the Nanhai No. 1 shipwreck. They can serve as a scientific basis for reconstructing the burial environment of the shipwreck site and formulating targeted low-damage conservation protocols for underwater-recovered ceramic artifacts. The established integrated multi-analytical framework can also be extended to the characterization of surface deposits on similar underwater-excavated cultural relics.
Future research may expand sample coverage when sampling conditions permit and combine multiple geochemical tracing techniques to further clarify the diagenetic evolution pathways and key controlling factors of siliceous concretions at nearshore shipwreck sites, to provide more robust theoretical support for the reconstruction of shipwreck burial environments and the development of conservation technologies for underwater-excavated cultural relics.


Author Contributions

X.W. and D.W. designed the experiments. X.W. carried out the experiments, conducted all data analysis, and drafted most of the manuscript. D.W. provided critical revisions to the manuscript and supervised the research. N.L. provided the experimental samples and conceived the research project. All authors have read and agreed to the published version of the manuscript.

Funding

This research was funded by the National Key R&D Program of China, grant number 2023YFF0906400.

Data Availability Statement

All data generated or analyzed during this study are included in this published article. The raw imaging, spectroscopic, and diffraction data supporting the findings are available from the corresponding authors upon reasonable request.

Conflicts of Interest

The authors declare no conflicts of interest.

Abbreviations

The following abbreviations are used in this manuscript:
FTIRFourier-transform infrared spectroscopy
ICDDInternational Centre for Diffraction Data
micro-CTMicro-computed tomography
PLMPolarized light microscopy
PPLPlane-polarized light
ROIsRegions of interest
SEM-EDSScanning electron microscopy–energy dispersive spectroscopy
SRBSulfate-reducing bacteria
μ-RamanMicro-Raman spectroscopy
XPLCross-polarized light
XRDX-ray diffraction

References

  1. Song, J. Shipwreck Archaeology in China Sea; Springer Nature: Singapore, 2022; pp. 163–194. [Google Scholar] [CrossRef] [Scilit]
  2. Wu, J.; Li, N.; Luo, W. Corrosion mechanisms and conservation strategies for marine recovered bronze artifacts: Insights from the Nanhai No. 1 shipwreck. J. Marit. Archaeol. 2024, 19, 351–375. [Google Scholar] [CrossRef] [Scilit]
  3. Zhang, L. Cosmic voyage of “Nanhai I”shipwreck-An interview with Wei Jun, the director of underwater archaeological research center of Guangdong Cultural Relics and Archaeology Institute, and Zhang Wei, captain of underwater archaeological team. China Award Sci. Technol. 2007, 12, 22–28. [Google Scholar]
  4. Wang, Y.R.; Zhu, T.Q.; Feng, Z.Y.; Tan, X.; Ye, D.; Zheng, Y. The Technological Analysis of the Ancient Ceramics Discovered from ‘Nanhai No. 1 Shipwreck’. Rock Miner. Anal. 2014, 33, 337–344. [Google Scholar]
  5. Wang, Y.; Yu, Y.; Li, N.; Wu, Q.; Cheng, X. Corrosion mechanisms of a bluish-white porcelain of Hutian kiln excavated from Nanhai No. 1 shipwreck. npj Herit. Sci. 2025, 13, 359. [Google Scholar] [CrossRef] [Scilit]
  6. Zhang, Y.; Xie, M.; Wang, Y. Metal Trade and Contraband: Archaeological Discoveries and Insights from the Nanhai No. 1 Merchant Shipwreck. J. Marit. Archaeol. 2024, 19, 265–289. [Google Scholar] [CrossRef] [Scilit]
  7. Liu, W.; Zhang, Z.; Li, X.; Ma, Q. Scientific analysis of concretions on ancient marine iron recovered from three shipwrecks in the South China Sea. J. Natl. Mus. China 2011, 2, 145–156. [Google Scholar]
  8. Hao, X.; Zhu, T.; Xu, J.; Wang, Y.; Zhang, X. Microscopic study on the concretion of ceramics in the “Nanhai I” shipwreck of China, Southern Song Dynasty (1,127-1,279 AD). Microsc. Res. Tech. 2018, 81, 486–493. [Google Scholar] [CrossRef] [Scilit] [PubMed]
  9. Wang, Y.; Zhu, T.; Yang, G.; Tan, X.; Ye, D.; Chen, H. The method to soften the concretions of ceramics in the “Nanhai I” Shipwreck of China Southern Song Dynasty (1127–1279AD). Herit. Sci. 2018, 6, 4. [Google Scholar] [CrossRef] [Scilit]
  10. Hassaan, M.A.; El Nemr, A. Classification and identification of different minerals in the mediterranean concretions using psa, ftir, and xrd techniques. Mar. Pollut. Bull. 2021, 173, 113070. [Google Scholar] [CrossRef] [Scilit] [PubMed]
  11. Sanchez-Garmendia, U.; Iñañez, J.G.; Arana, G. Alterations and contaminations in ceramics deposited in underwater environments: An experimental approach. Minerals 2021, 11, 766. [Google Scholar] [CrossRef] [Scilit]
  12. Ricca, M.; Camara, B.; Fort, R.; de Buergo, M.Á.; Randazzo, L.; Petriaggi, B.D.; La Russa, M.F. Definition of analytical cleaning procedures for archaeological pottery from underwater environments: The case study of samples from Baia (Naples, South Italy). Mater. Des. 2021, 197, 109278. [Google Scholar] [CrossRef] [Scilit]
  13. MacKenzie, W.S.; Adams, A.E.; Brodie, K.H. Rocks and Minerals in Thin Section: A Colour Atlas, 2nd ed.; CRC Press: London, UK, 2017; pp. 44–45. [Google Scholar] [CrossRef] [Scilit]
  14. Zhou, Y.; Wang, K.; Jin, Y.; Sun, J.; Cui, Y.; Hu, D. Chemical and microstructural comparison of the export porcelain from five different kilns excavated from Nanhai I shipwreck. Ceram. Int. 2019, 45, 12880–12887. [Google Scholar] [CrossRef] [Scilit]
  15. Jiang, W.; Peacor, D. Transmission Electron Microscopic Study of the Kaolinitization of Muscovite. Clays Clay Miner. 1991, 39, 1–13. [Google Scholar] [CrossRef] [Scilit]
  16. Vos, K.; Vandenberghe, N.; Elsen, J. Surface textural analysis of quartz grains by scanning electron microscopy (SEM): From sample preparation to environmental interpretation. Earth-Sci. Rev. 2014, 128, 93–104. [Google Scholar] [CrossRef] [Scilit]
  17. Müller, C.M.; Pejcic, B.; Esteban, L.; Piane, C.D.; Raven, M.; Mizaikoff, B. Infrared attenuated total reflectance spectroscopy: An innovative strategy for analyzing mineral components in energy relevant systems. Sci. Rep. 2014, 4, 6764. [Google Scholar] [CrossRef] [Scilit] [PubMed]
  18. Liu, C.; Liu, Q.; Zhang, G.; Feng, Q. Novel insights into the hydroxylation behaviors of α-quartz (101) surface and its effects on the adsorption of sodium oleate. Minerals 2019, 9, 450. [Google Scholar] [CrossRef] [Scilit]
  19. Chu, V.; Regev, L.; Weiner, S.; Boaretto, E. Differentiating between anthropogenic calcite in plaster, ash and natural calcite using infrared spectroscopy: Implications in archaeology. J. Archaeol. Sci. 2008, 35, 905–911. [Google Scholar] [CrossRef] [Scilit]
  20. Gueta, R.; Natan, A.; Addadi, L.; Weiner, S.; Refson, K.; Kronik, L. Local atomic order and infrared spectra of biogenic calcite. Angew. Chem. Int. Ed. 2007, 46, 291–294. [Google Scholar] [CrossRef] [Scilit] [PubMed]
  21. Wilkins, R.W.T.; Ito, J. Infrared spectra of some synthetic talcs. Am. Mineral. 1967, 52, 1649–1661. [Google Scholar]
  22. Ling, L.; Zhang, Z. Factor group analyses of infrared spectra of talc and pyrophyllite. Mineral. Petrol. 1986, 6, 1–8. [Google Scholar] [CrossRef]
  23. Perez-Rodriguez, J.L.; Robador, M.D.; Centeno, M.A.; Siguenza, B.; Duran, A. Wall paintings studied using raman spectroscopy: A comparative study between various assays of cross sections and external layers. Spectrochim. Acta Part A Mol. Biomol. Spectrosc. 2014, 120, 602–609. [Google Scholar] [CrossRef] [Scilit] [PubMed]
  24. Cao, S.H.; Zhang, L.F.; Sun, Q.; Zheng, H.F.; Cui, G.I. A Raman spectroscopic study of phengite under high pressure. Acta Petrol. Mineral. 2006, 25, 71–76. [Google Scholar] [CrossRef] [Scilit]
  25. Ake, M.A. Differentiation of muscovites in igneous and metamorphic rocks according to their Raman spectra. Pamukkale Univ. J. Eng. Sci. 2025, 31, 1431–1438. [Google Scholar] [CrossRef] [Scilit]
  26. Li, H.; Zhang, L.; Christy, A.G. The correlation between raman spectra and the mineral composition of muscovite and phengite. In Ultrahigh Pressure Metamorphism: 25 Years After the Discovery of Coesite and Diamond; Elsevier: Amsterdam, The Netherlands, 2011; pp. 187–212. [Google Scholar] [CrossRef] [Scilit]
  27. Motamedi, M.; Rull, F.; Sobron, P. Design of a Mars atmosphere simulation chamber and testing a Raman Laser Spectrometer (RLS) under conditions pertinent to Mars rover missions. Epj Tech. Instrum. 2015, 2, 15. [Google Scholar] [CrossRef] [Scilit]
  28. Itoh, N. Use of calcite for evaluation of spectral resolution of Raman spectrometers. Anal. Sci. 2025, 41, 95–100. [Google Scholar] [CrossRef] [Scilit] [PubMed]
  29. Calandra, S.; Conti, C.; Centauro, I.; Cantisani, E. Non-destructive distinction between geogenic and anthropogenic calcite by Raman spectroscopy combined with machine learning workflow. Analyst 2023, 148, 3268–3281. [Google Scholar] [CrossRef] [Scilit] [PubMed]
  30. Liu, Z.; Colin, C.; Li, X.; Zhao, Y. Clay mineral distribution in surface sediments of the northeastern South China Sea and surrounding fluvial drainage basins: Source and transport. Mar. Geol. 2010, 277, 48–60. [Google Scholar] [CrossRef] [Scilit]
  31. Mozer, A. Authigenic pyrite framboids in concretionary facies of the Mount Wawel Formation (Eocene), King George Island, West Antarctica. Pol. Polar Res. 2010, 31, 255–272. [Google Scholar] [CrossRef] [Scilit]
  32. Liu, X.; Liu, X.; Hu, Y. Investigation of the thermal decomposition of talc. Clays Clay Miner. 2014, 62, 137–144. [Google Scholar] [CrossRef] [Scilit]
  33. Přikryl, J.; Stefánsson, A.; Pearce, C.R. Tracing olivine carbonation and serpentinization in CO2-rich fluids via magnesium exchange and isotopic fractionation. Geochim. Cosmochim. Acta 2018, 243, 133–148. [Google Scholar] [CrossRef] [Scilit]
  34. Evans, B.W.; Hattori, K.; Baronnet, A. Serpentinite: What, why, where? Elements 2013, 9, 99–106. [Google Scholar] [CrossRef] [Scilit]
  35. Baldermann, A.; Banerjee, S.; Czuppon, G.; Dietzel, M.; Farkaš, J.; Löhr, S.; Moser, U.; Scheiblhofer, E.; Wright, N.M.; Zack, T. Impact of green clay authigenesis on element sequestration in marine settings. Nat. Commun. 2022, 13, 2049. [Google Scholar] [CrossRef] [Scilit] [PubMed]
  36. Zhang, H.; Shen, D.; Zhang, Z.; Ma, Q. Characterization of degradation and iron deposits of the wood of Nanhai I shipwreck. Herit. Sci. 2022, 10, 202. [Google Scholar] [CrossRef] [Scilit]
  37. Moore, J.D., III. Long-Term Corrosion Processes of Iron and Steel Shipwrecks in the Marine Environment: A Review of Current Knowledge. J. Marit. Archaeol. 2015, 10, 191–204. [Google Scholar] [CrossRef] [Scilit]
Figure 1. Geographic location of the Nanhai No. 1 shipwreck site. The base map is the standard map of China (Scale 1:60,000,000) produced by the Ministry of Natural Resources of the People’s Republic of China (Drawing Review No. GS(2019)1652). The red dot indicates the wreck site in the northern South China Sea (ca. 21°30′ N, 112°22′ E).
Minerals 16 00697 g001
Figure 2. Plan view of the Nanhai No. 1 shipwreck hull. Top-down aerial photograph of the fully excavated hull, displaying 13 intact watertight bulkheads and the distribution of cultural relics in separate cabins. The red dot denotes the sampling position selected for this research, situated within the core burial zone of the wreck.
Minerals 16 00697 g002
Figure 3. Macroscopic photograph of the representative gray siliceous concretion–ceramic composite sample from the Nanhai No. 1 shipwreck. Sampling locations N1–N5 for multi-analytical characterization are marked on the specimen surface.
Minerals 16 00697 g003
Figure 4. Three-dimensional grayscale CT images of the concretion–ceramic composite. Micro-CT characterization reveals the internal structure of the composite. Orange arrows mark the distinct cracks at the interface between the ceramic substrate and the concretion.
Minerals 16 00697 g004
Figure 5. Spatial distribution of gray siliceous concretions with varying densities. Images show the density stratification combining optical photography and pseudo-color-rendered 3D micro-CT results: (A) Photograph of the concretion–ceramic composite sample. (B) Overall 3D rendering of the concretion–ceramic composite, showing the spatial correlation between ceramics and concretions of different densities (ρ1 = high-density, ρ2 = medium-density, ρ3 = low-density). (C) Local magnified view of the orange high-density concretion (ρ1), which is concentrated at the edges and convex regions of the ceramic substrate. (D) The green medium-density concretion (ρ2), surrounding the ceramic substrate or filling surface depressions. (E) The blue low-density concretion (ρ3), distributed at concealed corners of the ceramic substrate. The ceramic substrate and medium-density concretion exhibit similar densities, resulting in tight spatial interconnection.
Minerals 16 00697 g005
Figure 6. Cross-sectional Polarized Light Microscopy (PLM) images of gray siliceous concretion. (A) Plane-polarized light (PPL) image showing gradual darkening of the concretion from the center to the ceramic glaze layer (Interface); (B) cross-polarized light (XPL) image, with labels C–H marking representative micro-areas magnified in panels C–H below; (C) XPL image of quartz showing extinction behavior during stage rotation and first-order gray-white interference colors; (D,E) XPL images of muscovite with high-order interference colors; (F) XPL image of foraminifera; (G) XPL image of echinoderm spine fragments; (H) XPL image of sponge fragments.
Minerals 16 00697 g006
Figure 7. SEM micrographs of minerals and bioclasts in the gray siliceous concretion. (A) Lamellar muscovite grains. (B) Detrital quartz grains. (C) Echinoderm spine remains. (D) Sponge fragment remains. All mineral grains and bioclasts are tightly cemented and enclosed by fine-grained Mg-rich silicate matrix.
Minerals 16 00697 g007
Figure 8. SEM-EDS mapping of major chemical elements in concretionary minerals. (A) Distribution of Si, Al and K, representing the dominant elements of muscovite. (B) Si-rich elemental distribution, corresponding to the compositional characteristic of quartz. (C) Ca-dominated elemental distribution, derived from biogenic calcite of echinoderm spine. (D) Ca-dominated elemental distribution, derived from biogenic calcite of sponge fragment remains.
Minerals 16 00697 g008
Figure 9. XRD pattern and FTIR spectrum of the gray concretion. (A) XRD pattern (2θ = 5–90°) with characteristic peaks of muscovite (8.8°), α-quartz (26.6°), calcite (29.4°) and pyrite (33.1°), as well as a broad peak at 19.8° corresponding to poorly crystalline layered phyllosilicates; Rietveld refinement yields mass fractions of 46.4%, 30%, 13.9% and 9.7% for the four well-crystallized phases, respectively. (B) FTIR spectrum (4000–400 cm−1) with characteristic bands of α-quartz (1087, 797/779, 464 cm−1), muscovite (3620–3640, 1008, 915 cm−1), calcite (1424, 875, 714 cm−1), and Mg-rich silicate minerals (serpentine: 3695, 3645 cm−1; talc: 3676 cm−1).
Minerals 16 00697 g009
Figure 10. Micro-Raman spectra of key mineral phases in gray concretion. (A) α-quartz spectrum with characteristic peaks at 128, 206 and 465 cm−1 (Si-O bond vibration). (B) Muscovite spectrum with O-H stretching peak (3625 cm−1) and framework vibration peaks (195, 262, 409 and 703 cm−1). (C) Calcite spectrum (derived from echinoderm spine fragment) with CO32− vibration peaks (154–156, 278–280, 711 and 1085 cm−1). All measurements were conducted using a 532 nm laser excitation source (spectral acquisition range: 100–4000 cm−1). The green dot in each inset micrograph indicates the corresponding in-situ Raman measurement spot.
Minerals 16 00697 g010
Table 1. Subsample information and corresponding analytical methods.
Sample No.Characterization MethodsSample State
N1PLM, Micro-RamanThin section
N2SEM-EDSThin section
N3Mixed with N4 for XRD and FTIRPowder
N4Mixed with N3 for XRD and FTIRPowder
N5PLM, Micro-RamanThin section
Table 2. Mineral phases, chemical formulas, and inferred provenances of the gray siliceous concretion.
Genetic OriginMineralChemical Formula
TerrigenousQuartzSiO2
MuscoviteKAl2(AlSi3O10)(OH)2
BiogenicCalciteCaCO3
AuthigenicPyriteFeS2
TalcMg3Si4O10(OH)2
SerpentineMg3Si2O5(OH)4
Disclaimer/Publisher’s Note: The statements, opinions and data contained in all publications are solely those of the individual author(s) and contributor(s) and not of MDPI and/or the editor(s). MDPI and/or the editor(s) disclaim responsibility for any injury to people or property resulting from any ideas, methods, instructions or products referred to in the content.