Article

Geochemical Characteristics and Ore Genesis of the Muhu Manganese Deposit in the Eastern Segment of Markansu Metallogenic Zone, Western Kunlun Mountains, Northwest China

1
Geological Team Changji, Xinjiang Uyghur Autonomous Region Geological Bureau, Changji 831100, China
2
The 607 Geological Brigade, Chongqing Bureau of Geology and Mineral Exploration and Development, Chongqing 400054, China
3
Chongqing Liangping District Planning and Natural Resources Bureau Pingjing Management Office, Chongqing 400054, China
*
Author to whom correspondence should be addressed.
Minerals 2026, 16(7), 696; https://doi.org/10.3390/min16070696
Submission received: 30 March 2026 / Revised: 9 June 2026 / Accepted: 26 June 2026 / Published: 1 July 2026

Abstract

The complex geochemical behaviors of manganese (Mn) enrichment processes remain insufficiently understood, which hinders a deeper understanding of the formation mechanism of sedimentary Mn deposits. A systematic geochemical analysis of a continuous drill-core profile is very important for understanding the Mn enrichment process. This study focuses on the Muhu large Mn deposit, located in the eastern segment of the Markansu metallogenic belt, western Kunlun Mountains. The vertical changes of Mn ore, Mn-bearing black rocks, and wall rocks were systematically evaluated through a single-borehole core section, including their geological characteristics, lithogeochemistry, and paleoenvironmental indicators, revealing the ore genesis of the Muhu deposit. The results indicate that during the initial Mn deposition in the Muhu area, the geochemical environment was relatively oxidized, with relatively high paleosalinity, comparatively low primary productivity, and a relatively deep redox interface. The sedimentary basin was influenced by open-marine seawater and accompanied by the input of hydrothermal materials. The redox conditions of basin waters likely played an important role in controlling the geochemical behavior of Mn cycling, and these oxides initially enriched were subsequently reduced in the presence of organic matter, ultimately contributing to the formation of Mn carbonate ore. Accordingly, a three-stage process of “oxidation–reduction–mineralization” is proposed for the Muhu (Markansu) Mn carbonate deposit. This refined evolutionary model provides further constraints for understanding the metallogenic mechanism of marine sedimentary Mn deposits.

1. Introduction

Marine sedimentary manganese (Mn) deposits represent an important category of global Mn resources, constituting approximately 40% of the world’s total reserves and serving as a crucial component of China’s Mn resources [1]. In view of the huge consumption and strategic demand for Mn resources, it is urgent to clarify the metallogenic rules of sedimentary Mn deposits [2,3,4,5,6]. Nevertheless, current understanding of pivotal aspects, including the provenance of ore-forming materials, geochemical conditions, and the formation processes of marine sedimentary Mn deposits, has not yet reached a consensus, thereby impeding the in-depth development of metallogenic theories for this deposit type [2,3,4,5,6]. Therefore, a systematic investigation into the intricate processes of Mn’s geochemical behaviors, coupled with a clarification of the characteristics of paleo-oceanic sedimentary environments and the formation mechanism of Mn carbonate, is of great significance for the construction of a genetic model for sedimentary Mn deposits [3,4,5,6,7].
The Markansu Mn metallogenic belt in Xinjiang, China, has recently emerged as an important high-quality Mn resource base, with the discovery of large-scale Mn deposits such as Ortokaneshi and Muhu-Marqantou, and its Mn reserves amount to 50 million metric tons. This belt serves as an exemplary case study for the investigation of marine sedimentary Mn deposits (Figure 1). In recent years, this metallogenic belt has attracted extensive attention, yielding a series of significant research achievements [2,6,8,9,10,11,12,13,14,15,16]. However, there remain controversies over several key problems related to the formation of Mn deposits in this region. Previous studies hold differentiated viewpoints on provenance and transport modes respectively [6,9,11,14,16,17]. Concerning the source of metallogenic materials, Li et al. [17] proposed that they predominantly derived from the underlying Early Carboniferous volcanic rocks. Chen et al. [9] and Dong et al. [11] proposed the involvement of volcanic hydrothermal fluids. Zhang et al. [14] argued for a mixed source comprising seafloor hydrothermal fluids and continental crustal materials. Such discrepancies mainly lie in the differentiated understanding of primary material provenance and subsequent transport pathways of metallogenic substances. In terms of metallogenic models, Zhang et al. [16] advocated a model associated with late Paleozoic semi-restricted basin sedimentation and seafloor hydrothermal activity. Dong et al. [11] proposed an expansion model of the oxygen minimum zone, whereas Dong et al. [6] suggested that the mineralization process is controlled by intermittent oxidation events within a relatively deep-water anoxic basin environment.
Therefore, this study focuses on the Muhu large Mn deposit, located in the eastern segment of the Markansu Mn metallogenic zone. Systematic geochemical study of a continuous drill-core profile was conducted, evaluating vertical changes of geochemical characteristics across Mn ore, Mn-bearing black rocks, and wall rocks, including the geological characteristics, lithogeochemistry, and paleoenvironmental indicators. The primary objective of the research is to elucidate key scientific questions concerning the metallogenic conditions, material sources, and formation mechanism of Mn carbonate. Based on these data, this study discusses a three-stage process of “oxidation–reduction–mineralization” for the Muhu (Markansu) Mn carbonate deposit, and emphasizes that the redox conditions of the basin water likely play an important role in controlling the geochemical behavior of the Mn cycle.

2. Geological Setting

2.1. Regional Geology

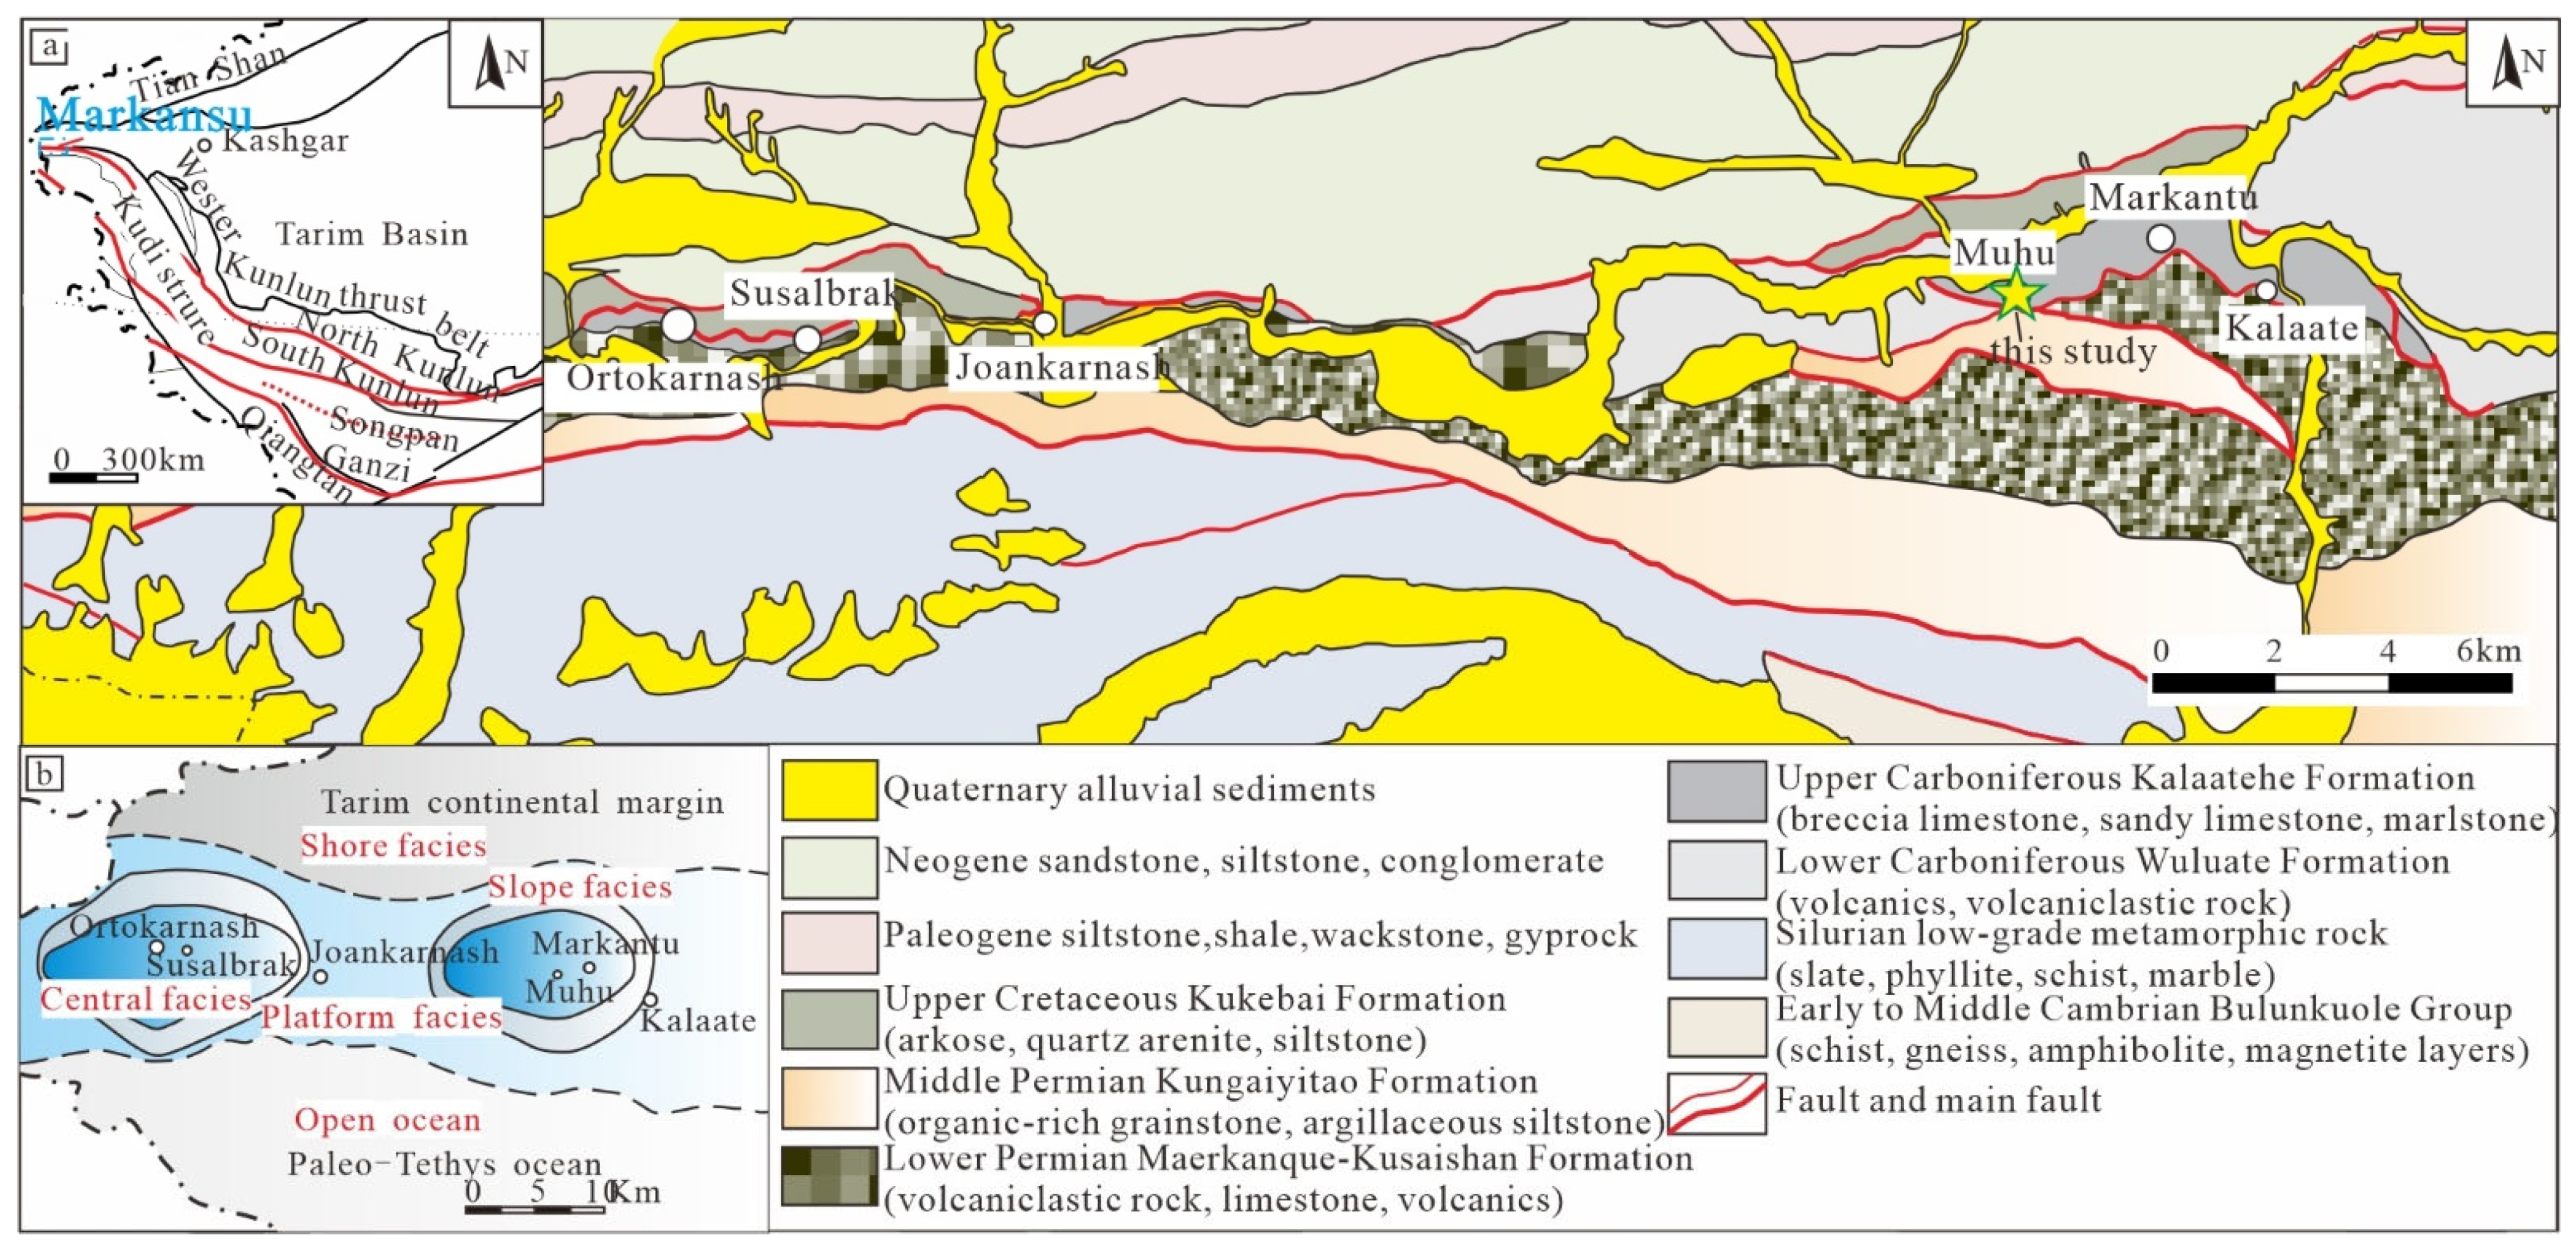
The Markansu Mn metallogenic zone extends approximately 60 km east–west and 0.2–2 km north–south, with a total resource reserve of 50 million tons. It hosts large Mn deposits such as Aertuokanesh in the western segment and Muhu-Markantu in the eastern segment (Figure 1) [3,6]. Previous studies indicate that Mn mineralization in the Markansu region formed in the Late Carboniferous (ca. 320 Ma) [8,12].
The Markansu region is tectonically located at the junction between the Tarim Plate and the West Kunlun Orogenic Belt, forming part of an extensional continental margin rift system that resulted from the northward subduction of the Paleo-Tethys Ocean during the Late Paleozoic (Figure 1a) [3,14].
During the Late Paleozoic to the Early Mesozoic, the Markansu region underwent a complex basin evolutionary history. Basin development initiated during the Devonian in response to plate subduction, followed by a rapid expansion phase in the Early Carboniferous and a stable subsidence stage in the Late Carboniferous. The resulting differential subsidence led to a paleogeographic pattern characterized by a complex arrangement of alternating platforms and basins (Figure 1b) [3,6,14,17]. Subsequently, the evolution of the basin ultimately concluded with its closure during the Late Permian [3,6,14,17,18].
The main exposed strata in the region include the Silurian, Carboniferous-Permian, Cretaceous, and Paleogene-Quaternary systems, with the Devonian and Triassic systems absent (Figure 1). Along the nearly east-west-trending tectonic axis of the Markansu Mn mineralization zone, the main sedimentary formations include the Lower Carboniferous Wuluoate Formation (volcanic and volcaniclastic rocks), the Upper Carboniferous Kalaatehe Formation (marine carbonate rocks), the Lower Permian Markanquekusaishan Formation (volcanic and volcaniclastic rocks), and the Middle Permian Kungaiyitao Formation (carbonate and clastic rocks). Notably, the Kalaatehe Formation is the primary Mn ore-hosting stratum in the area (Figure 1).
Penetrative structures (faults and folds) exhibit a nearly east–west strike in the region (Figure 1). Two main deformation events occurred in the region: brittle-ductile deformation in the Late Permian and brittle deformation in the Late Neogene. The linear fabric is manifested as right-lateral strike-slip faults and thrust faults, respectively. The dominant planar fold structure in the region is the Markansu anticline, which extends along the Markansu River with an axial strike of nearly east-west [8].
From the Devonian to Permian periods, magma intrusion and volcanic eruptions developed along with different stages of basin evolution [3,6,8]. The Devonian period was marked by basic-ultrabasic magmas, while the Carboniferous period was dominated by intermediate-acidic magmas, corresponding to the development of volcanic and volcaniclastic successions at different stratigraphic levels. The distribution of magmatic rocks is mainly controlled by regional fault structures, exhibiting a northwest (NW)–southeast (SE) trending zonal distribution [8].

2.2. Geology of the Muhu Deposit

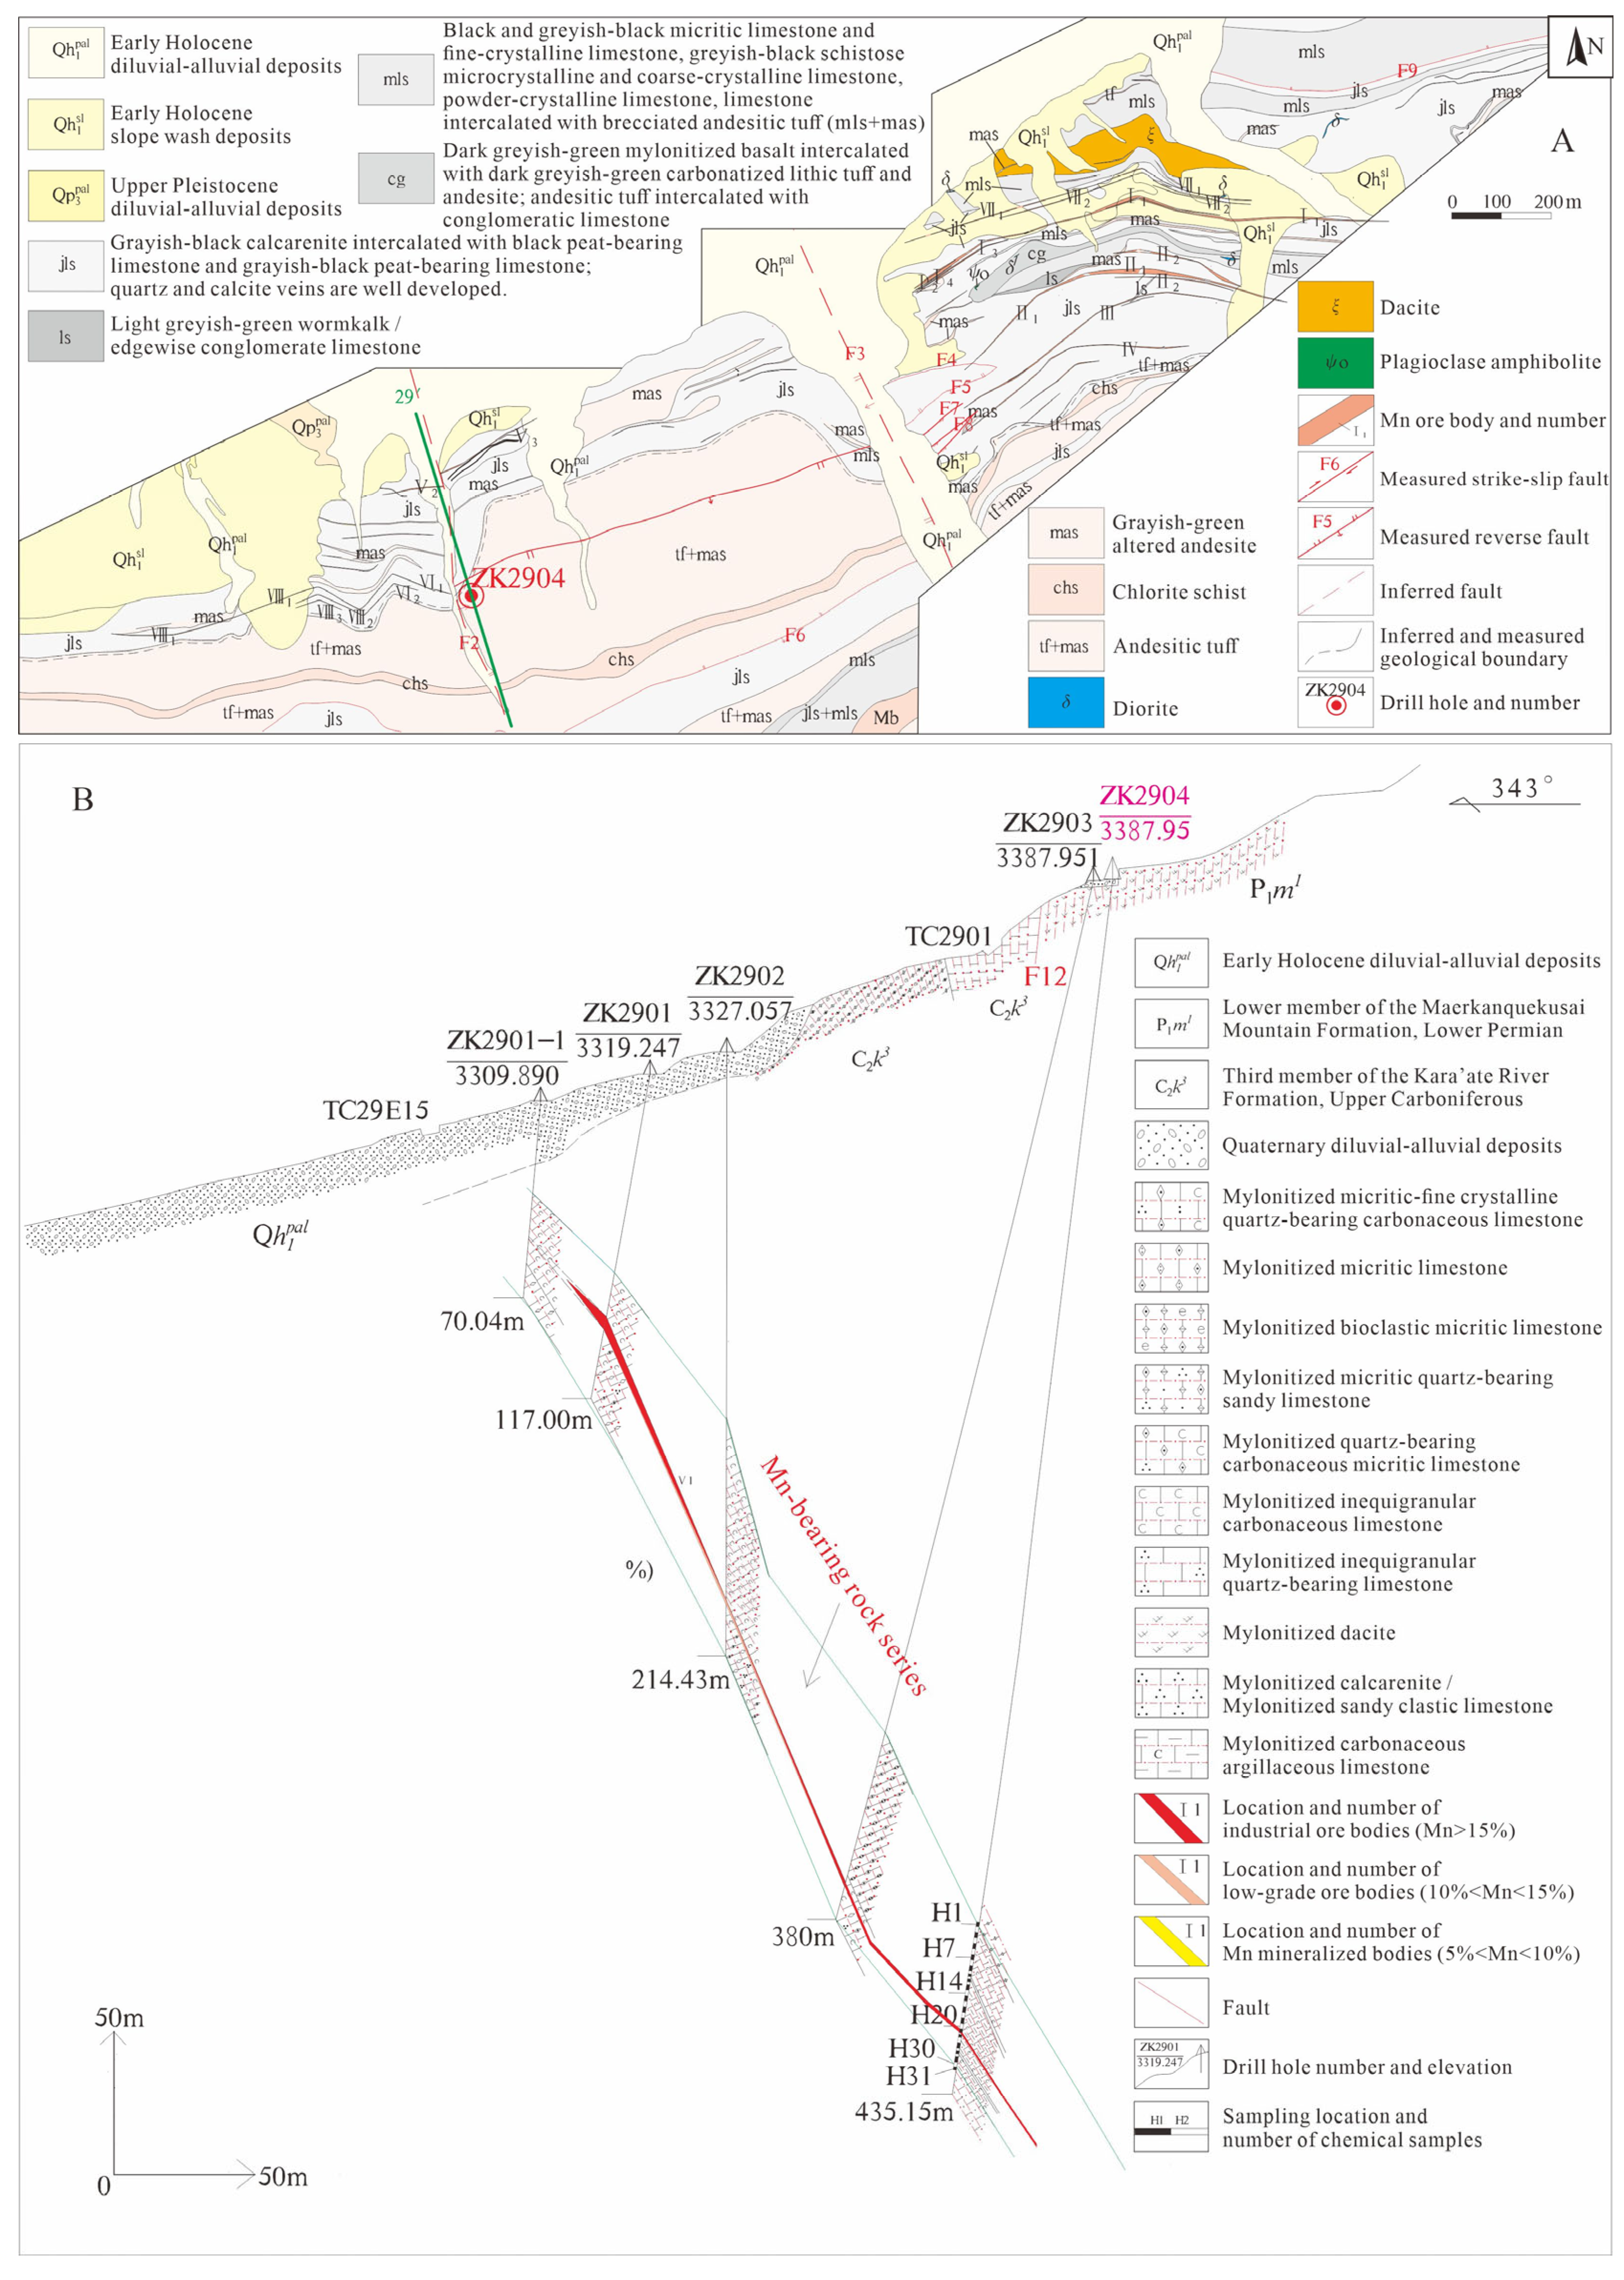
The Muhu Mn deposit, located in the eastern segment of the Markansu metallogenic zone, extends eastward into the Markantu deposit with an exposed length of approximately 4 km. To date, four ore beds, eight ore zones, and twenty ore bodies have been delineated, with an average Mn grade of 29.1% (Figure 2A).
The main strata exposed in the mining area include the Lower Carboniferous Wuluoate Formation (volcanic and volcaniclastic rocks; Zircons U-Pb ages of 326.6 +1.3 and 327.3 ±2.6 Ma [3,8]), Upper Carboniferous Kalaatehe Formation (marine carbonate rocks), Lower Permian Markanquekusaishan Formation (volcanic and volcaniclastic rocks), and Quaternary unconsolidated sediments. Mn mineralization is predominantly hosted within the Kalaatehe Formation, which is subdivided into three lithological members: the upper member consists of carbonaceous argillaceous limestone intercalated with microcrystalline–micritic limestone, the middle member comprises bioclastic limestone and calcarenite, and the lower member is composed of feldspathic quartz sandstone. Mn ore bodies are predominantly distributed within the black rock series of the upper member of the Kalaatehe Formation [9].
Consistent with the characteristics of magmatic activity in the Markansu area, volcanic rocks in the Muhu deposit are widely distributed, mainly consisting of altered andesite, dacite, and andesitic tuff. In contrast, intrusive rocks are limited in outcrop, with only a small amount of diorite and plagioclase amphibolite veins exposed (Figure 2A).
Mn ore bodies in the mining area are mainly distributed on the southern limb of the Markansu anticline and occur stratabound along the Mn-bearing black rock series, with morphologies including stratiform, stratoid, and lenticular. The strike of the Mn ore bodies is northeast–southwest in general, and they dip southeast, among which ore bodies I, II, III, IV, and VII are the main ones in the area (Figure 2B). Mn ore bodies have been generally damaged by later folding and faulting, resulting in local discontinuities along strike and dip, and are interspersed with irregular, net-veined, or lenticular quartz and calcite veins (Figure 3). The main ore minerals are rhodochrosite (Mn calcite), followed by ferromanganite oxides, psilomelane, and minor amounts of hydromanganite, pyrolusite, and Mn dolomite. The gangue minerals are mainly calcite, accompanied by minor quartz, graphite, and clay minerals.

3. Sampling and Analytical Methods

3.1. Samples

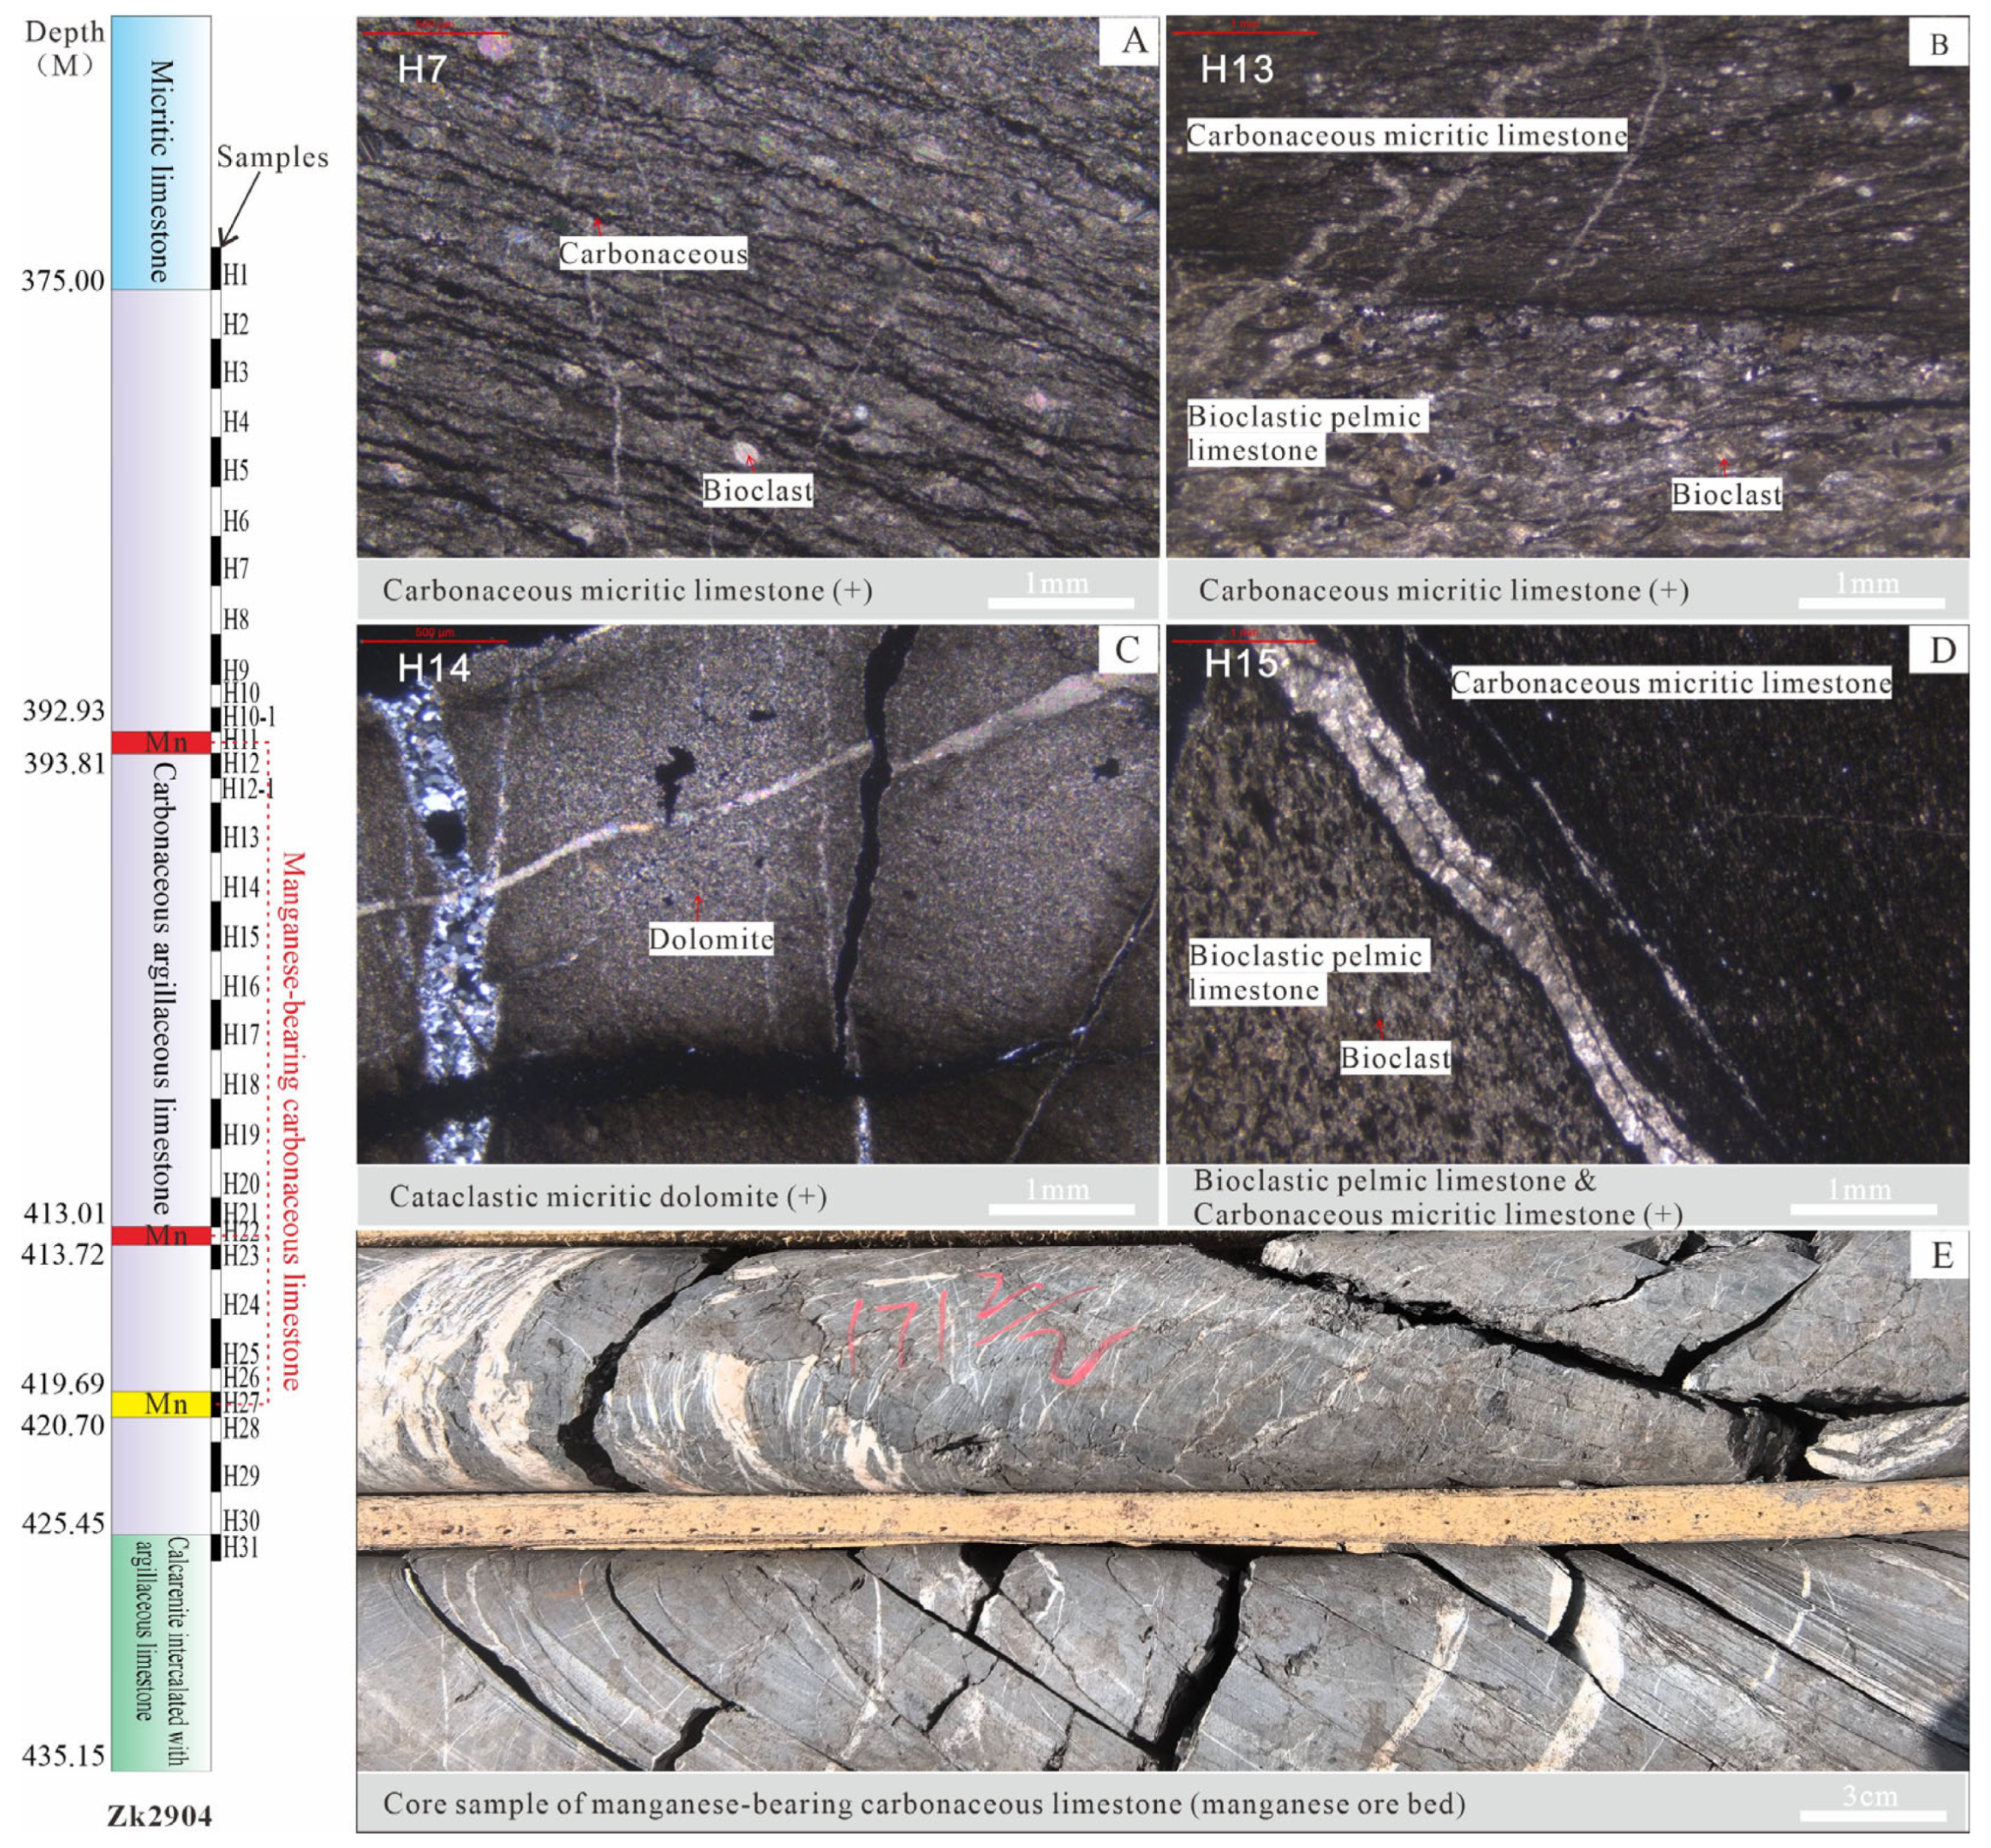
A total of 33 core samples were collected from the upper member of the Kalaatehe Formation in borehole ZK2904, along the 29th exploration line in the western part of the Muhu area. From top to bottom, the lithological sequence consists of micritic limestone at the top and an Mn-bearing black rock series (e.g., carbon-bearing argillaceous limestone, carbonaceous argillaceous limestone, and Mn-bearing carbonaceous limestone), an Mn ore layer (rhodochrosite), and sandy limestone at the bottom. These Mn-bearing black rock series are classified and distinguished primarily based on the relative content proportions of carbonaceous material, argillaceous components and Mn-bearing minerals. The samples include 3 Mn ore (mineralized) layers, 28 Mn-bearing black rock series, and 1 sample each from the top and bottom carbonate rocks (Figure 2B and Figure 3).
Petrographic observations of thin sections show that this sedimentary formation is mainly composed of calcite, biogenic debris, carbonaceous material with varying contents, as well as minor amounts of sand clasts, argillaceous material, and pyrite. The rocks are dominated by a layered structure, with numerous irregular fractures of varying widths interspersed throughout, which are predominantly filled with calcite veins (Figure 3A–C). In some Mn ore layers, fragmented microcrystalline dolomite is observed, intersected and cut by multiple fractures of varying widths; these fractures are mainly filled with carbonate minerals and quartz veins. Some veins underwent significant displacement and deformation, indicating the rocks were strongly affected by later-stage stress (Figure 3D,E).

3.2. Methods

Sample analysis and testing were performed by the Testing Center of the Xinjiang Uyghur Autonomous Region Nonferrous Geological Exploration Bureau, Xinjiang, China. The collected samples were first cleaned, crushed, dried at a constant temperature, and ground to a particle size of less than 200 mesh. Subsequently, samples of different weights were prepared for the analysis of whole-rock major elements, trace elements, organic carbon (TOC), and total carbon (TC). Major and minor elements, including Al2O3, CaO, Cl, Fe, MgO, Mn, P2O5, and SiO2, were determined by X-ray fluorescence spectrometry (XRF) in accordance with the China national standard GB/T 14506.28-2010 [19]. Loss on ignition (LOI) was independently obtained by a high-temperature ignition experiment for subsequent matrix correction. Rare earth elements (REEs) and other trace elements (including Li, Be, Sc, V, Co, Ni, Cu, Zn, Ga, Rb, Sr, Y, Zr, Nb, Mo, Cd, Cs, Ba, Hf, Ta, W, Tl, Pb, Bi, Th, and U) were quantified by inductively coupled plasma mass spectrometry (ICP-MS) via an external standard method, in accordance with the China national standard GB/T 14506.30-2016 [20]. The TC content of the whole rocks was determined via the infrared spectroscopy absorption method, with reference to industry standard DZ/T 0279.25-2016 [21]. TOC content was determined by the potassium dichromate volumetric method, with reference to industry standard DZ/T 0279.27-2016 [22].

4. Results

4.1. Major Elements

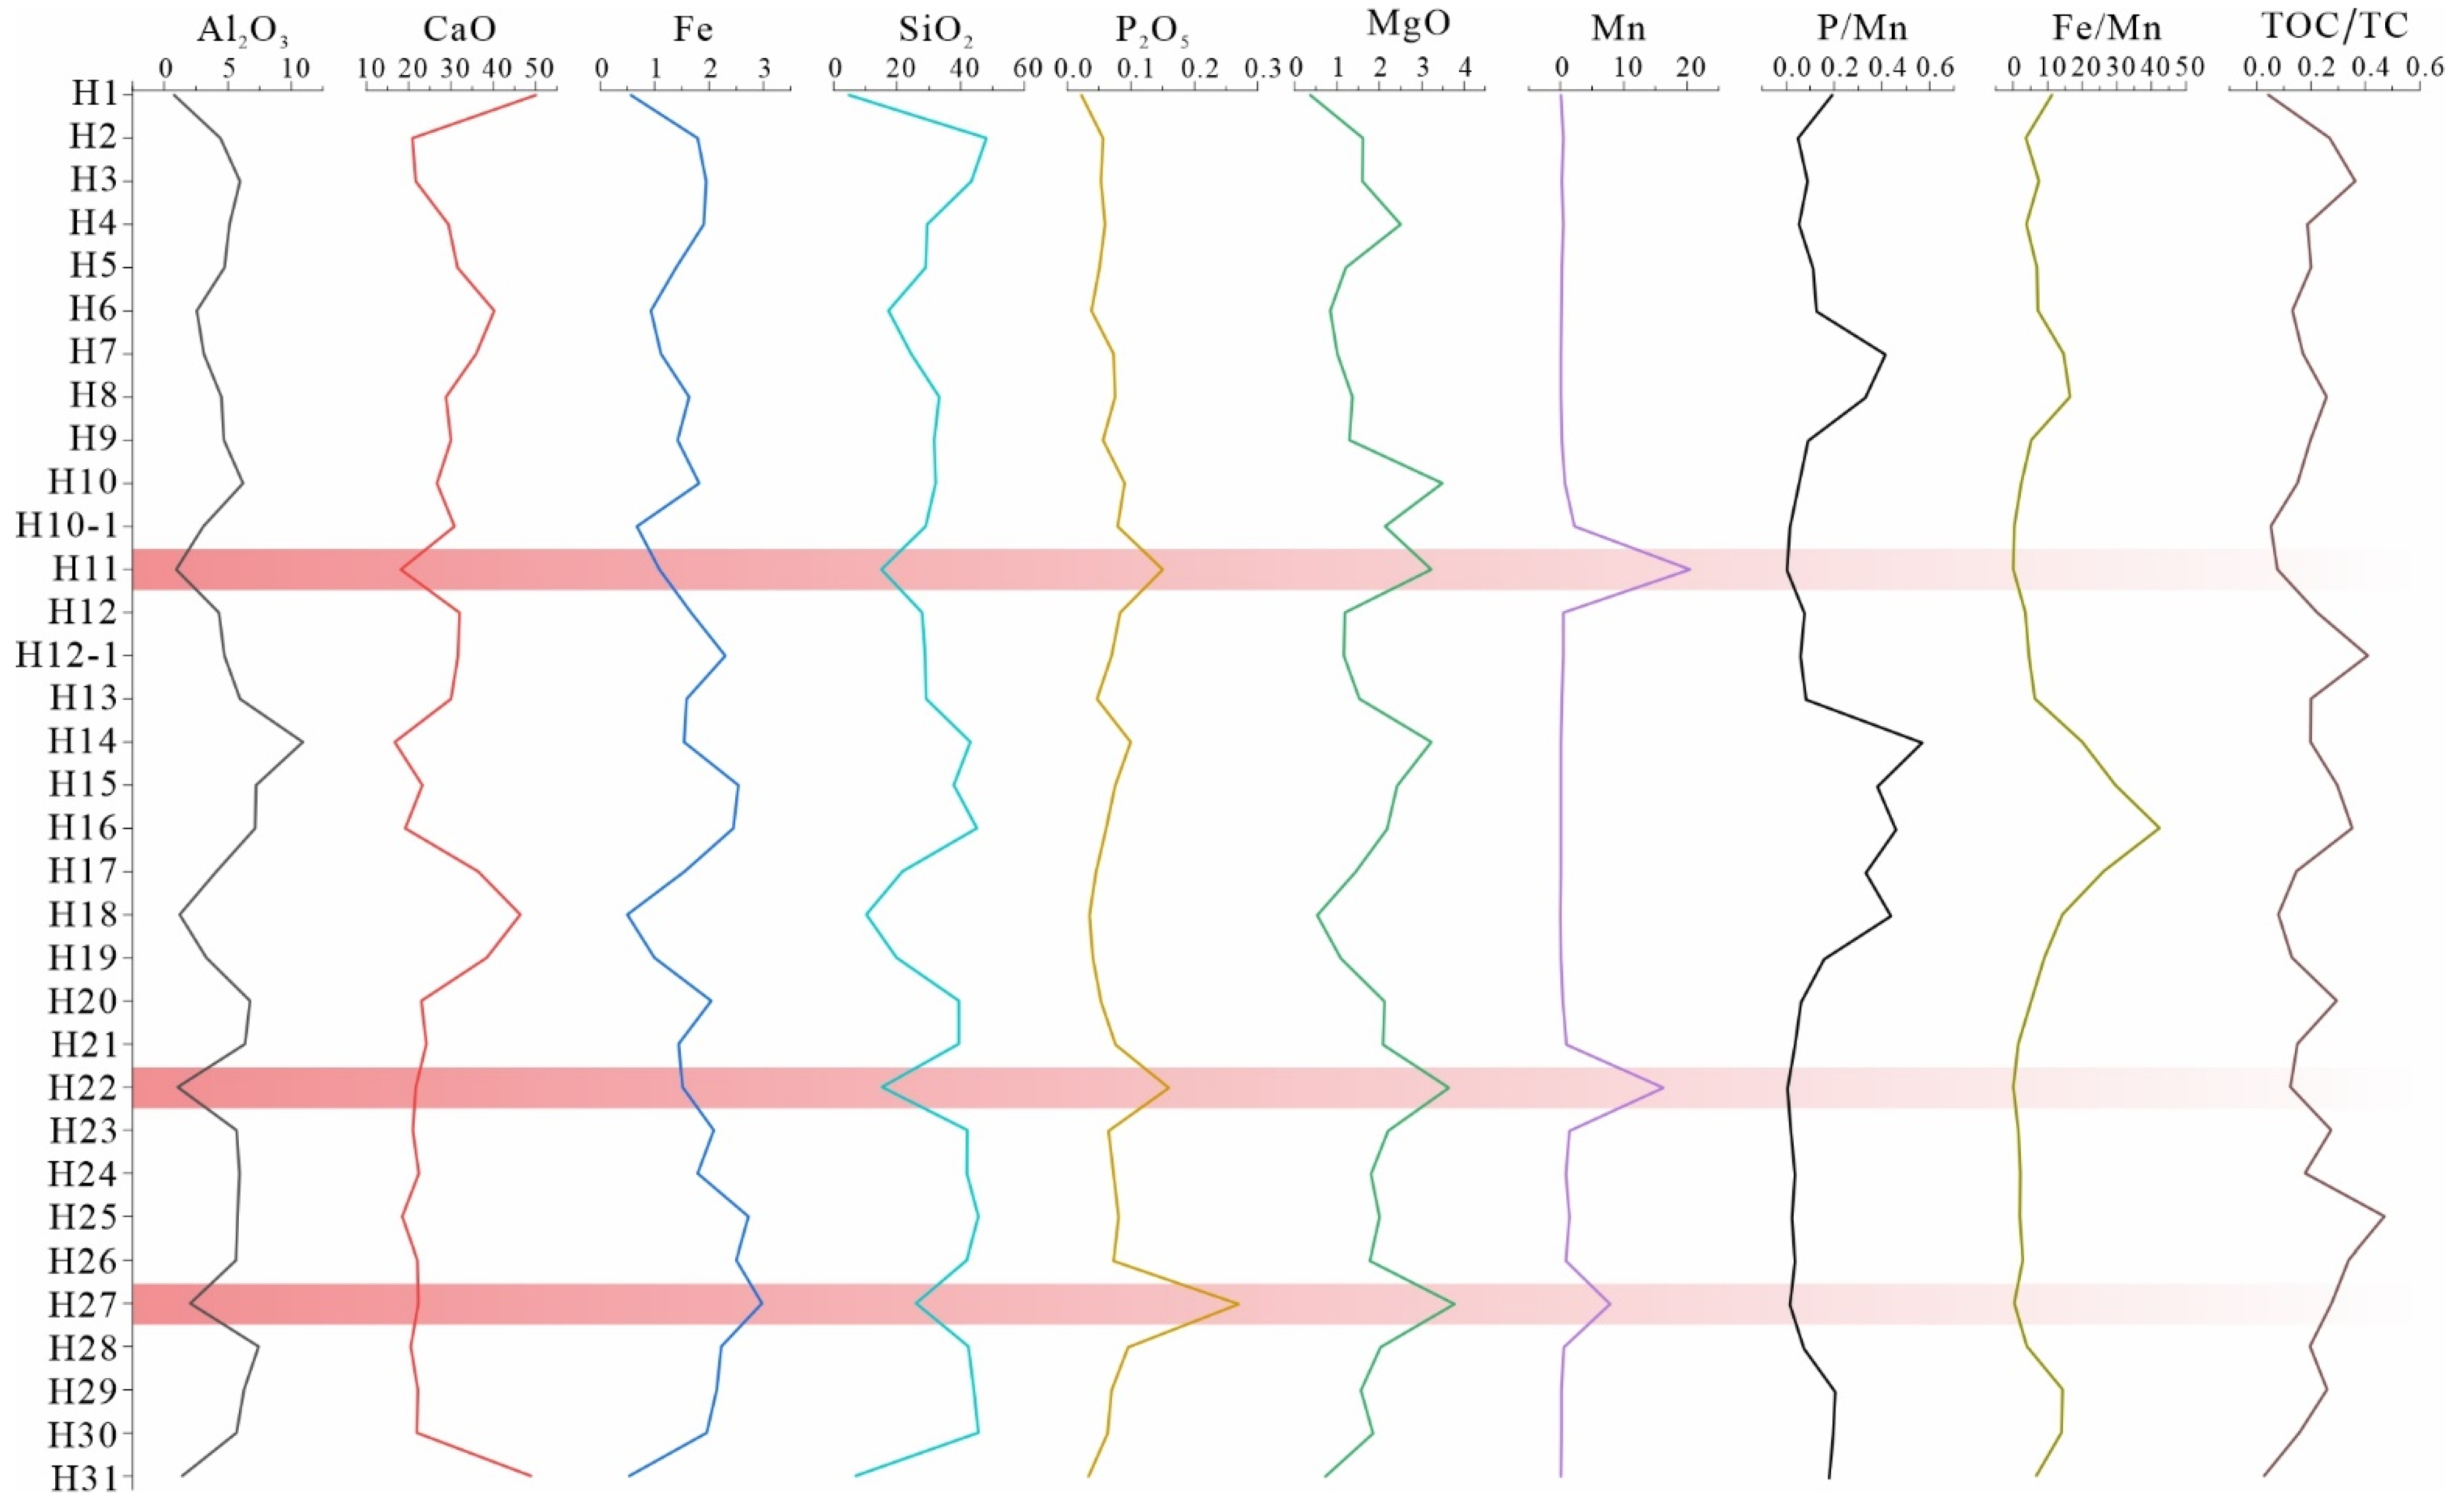
The analytical results of major elements in whole-rock samples are listed in Table S1. The Mn ore (mineralized) layer has relatively low contents of Al2O3 (0.94–2.05 wt.%, with an average of 1.35 wt.%), CaO (18.04–22.24 wt.%, with an average of 20.63 wt.%), and SiO2 (15.03–26.04 wt.%, with an average of 18.73 wt.%). In contrast, it has relatively high contents of Mn (7.86–20.46 wt.%, with an average of 14.86 wt.%), MgO (3.23–3.78 wt.%, with an average of 3.55 wt.%), and P2O5 (0.15–0.27 wt.%, with an average of 0.19 wt.%). The Fe content varies from 1.09 to 2.97 wt.% (mean = 1.86 wt.%), and the LOI ranges from 26.36 to 30.96 wt.% (mean = 29.28 wt.%). By comparison, the host black rock series has relatively higher contents of Al2O3, CaO, and SiO2, which are 1.22–10.92 wt.% (mean = 5.32 wt.%), 16.66–46.43 wt.% (mean = 27.34 wt.%), and 10.28–48.12 wt.% (mean = 34.42 wt.%), respectively. In contrast, the Mn, MgO, and P2O5 contents in the host black rock series are relatively lower, ranging from 0.035–2.23 wt.% (mean = 0.48 wt.%), 0.54–3.49 wt.% (mean = 1.76 wt.%), and 0.035–0.1 wt.% (mean = 0.066 wt.%), respectively. The Fe content of the host black rock series ranges from 0.5 to 2.72 wt.% (mean = 1.74 wt.%), and the LOI ranges from 17.58 to 37.35 wt.% (mean = 24.2 wt.%). The carbonate rock formations at the top and bottom are characterized by high CaO contents (48.94–50.15 wt.%) and high LOI values (38.88–39.94 wt.%), while the contents of other major elements are relatively low. The overall distribution pattern of major elements in these carbonate formations significantly differs from that in the Mn-bearing black rock series (Table S1).
On the depth profile, obvious manganese geochemical anomalies are detected in samples H27, H22 and H11, showing distinct elemental correlation characteristics different from ordinary sedimentary strata (Figure 4). The Mn ore layer is relatively enriched in P2O5 and MgO, but relatively depleted in Al2O3, CaO, and SiO2. The corresponding P/Mn (0.003–0.015) and Fe/Mn (0.05–0.38) ratios fall within the low-value range (Figure 4). This indicates a significant negative correlation between Mn mineralization and the Fe/Mn and P/Mn ratios in the Muhu area, suggesting that the Mn ore belongs to the low-iron and medium-phosphorus carbonate Mn ore type.

4.2. Trace and Rare Earth Elements (REEs)

4.2.1. Trace Elements

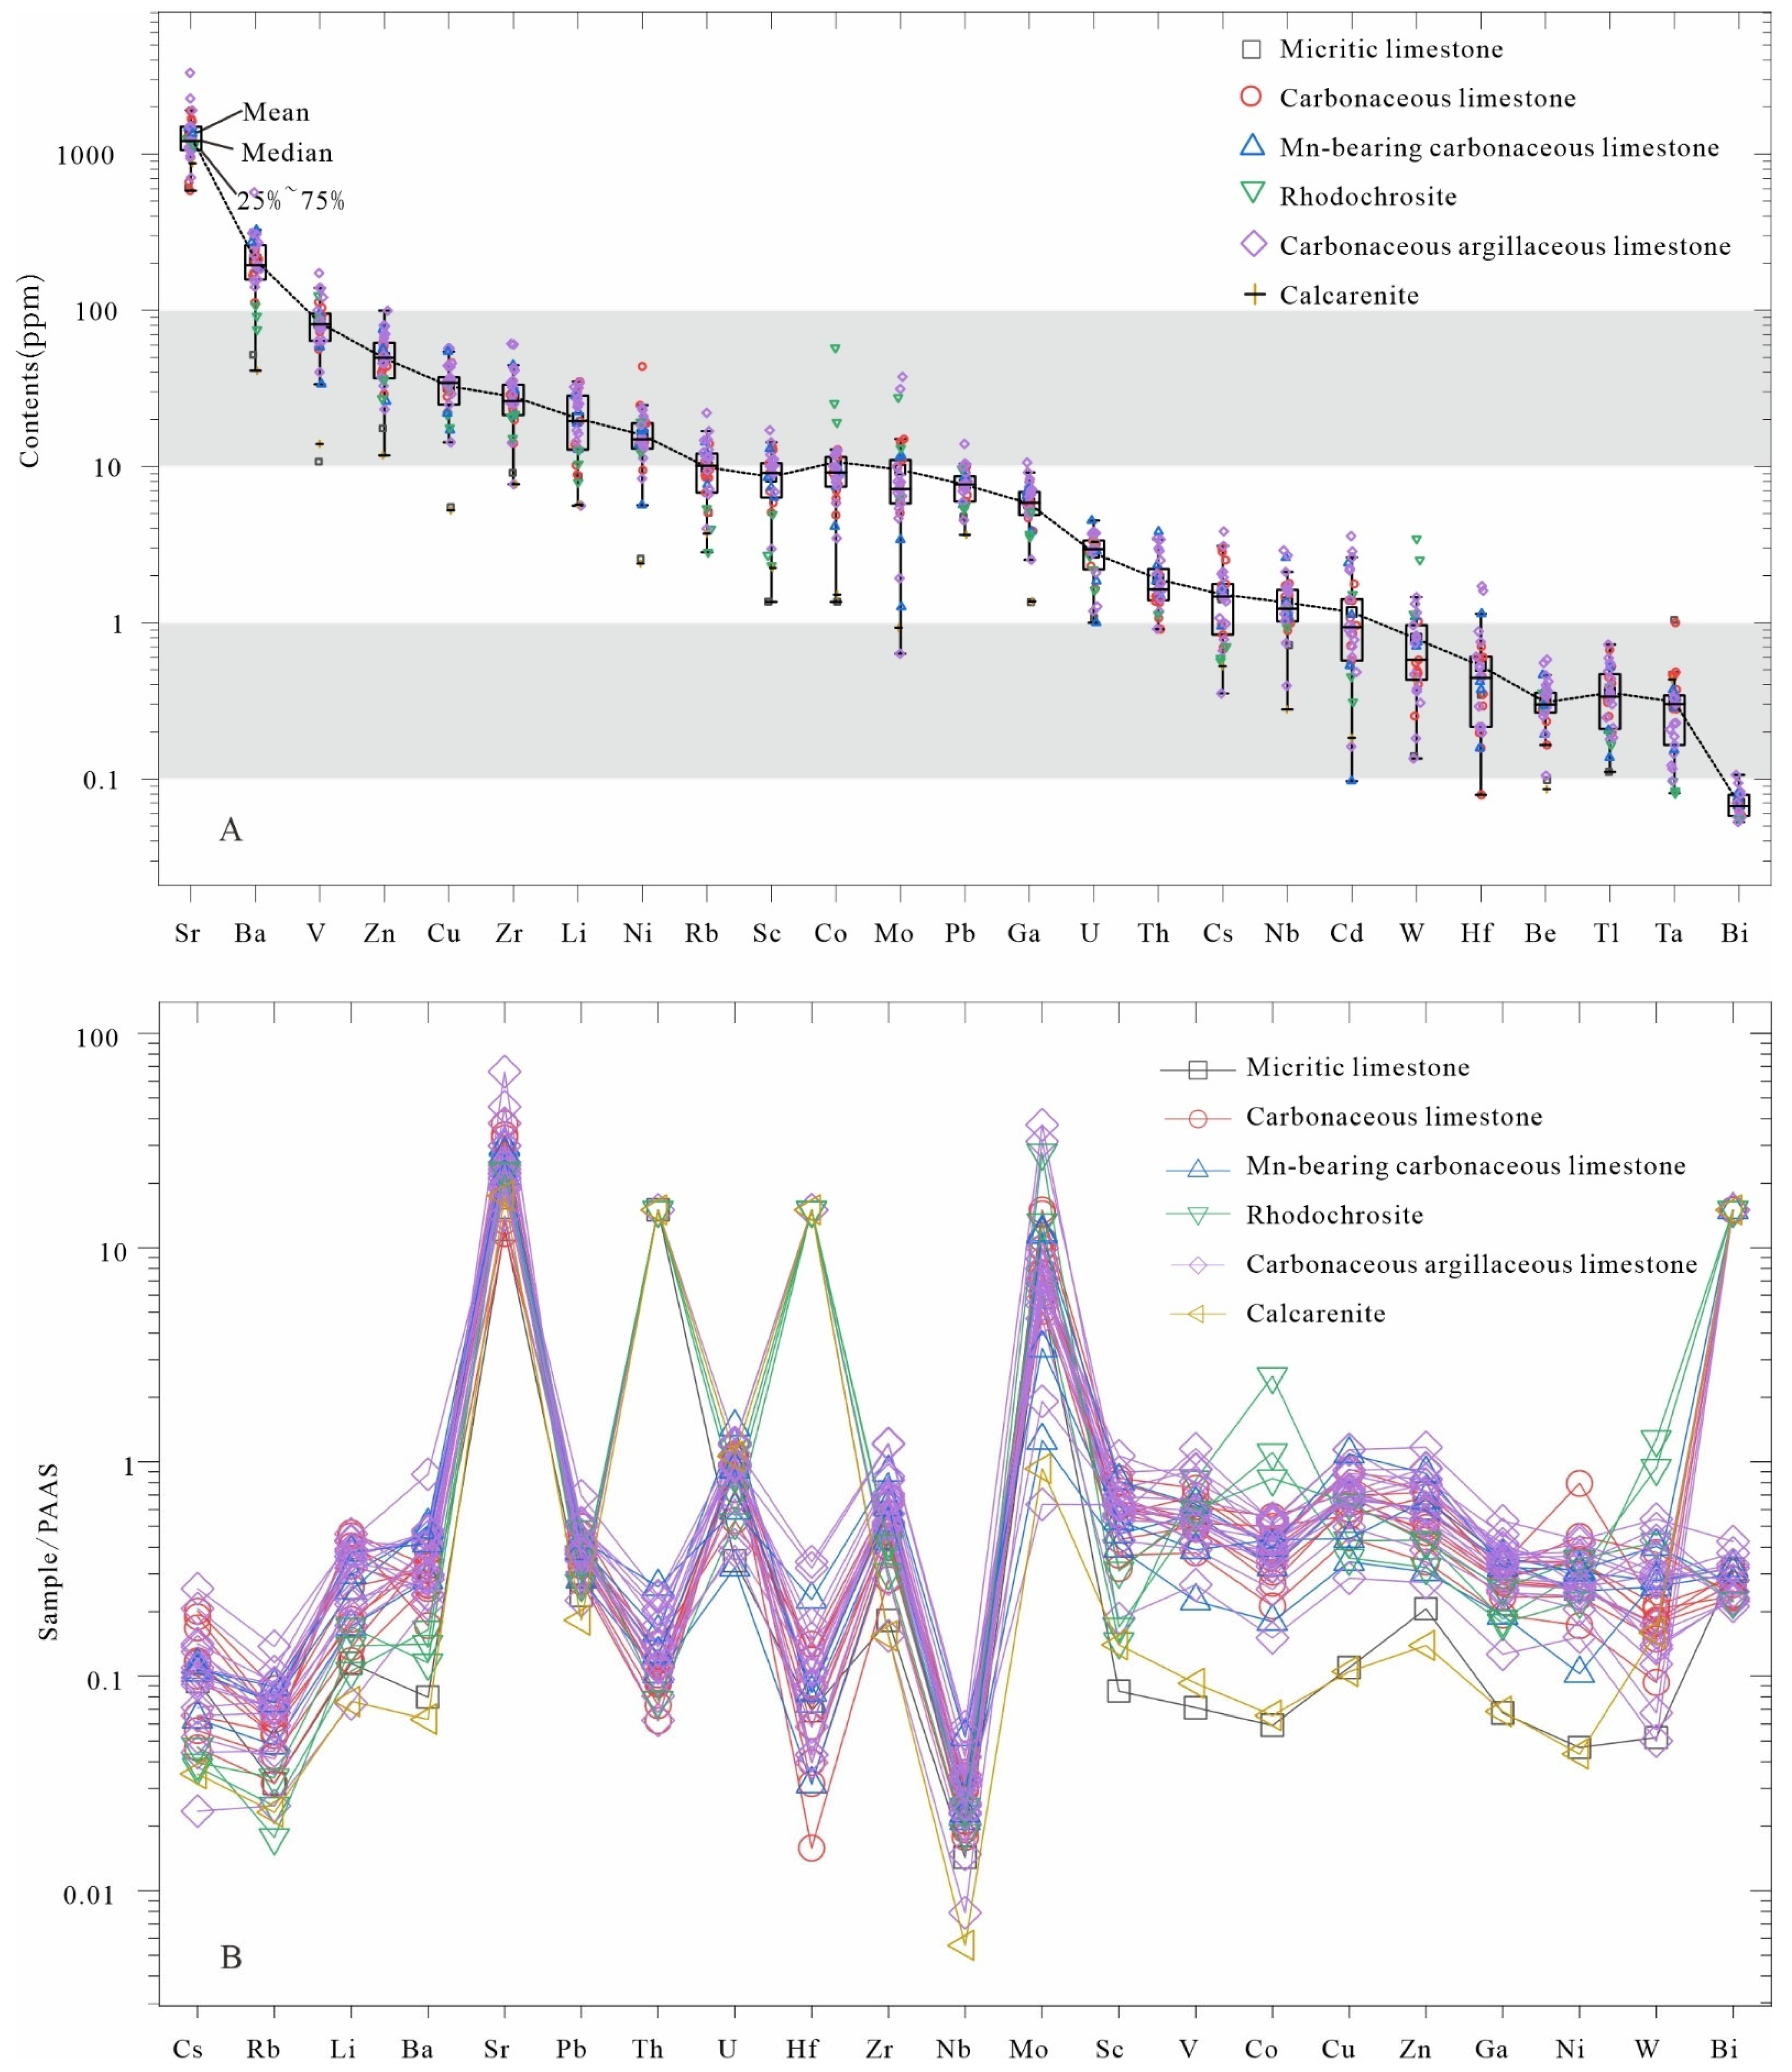
The analytical results of trace elements in whole-rock samples are listed in Table S2, where Sr and Ba elements exhibit the highest contents (>100 ppm), followed by V, Zn, Cu, Zr, and Li, whose contents mostly range from 10 to 100 ppm. Rb, Sc, Co, Mo, Pb, Ga, U, Th, Cs, Nb, Cd, W, Hf, Be, Tl, and Ta contents are mainly between 0.1 and 20 ppm, while Bi shows the lowest content (<0.1 ppm) (Table S2, Figure 5A). After normalization to Post-Archean Australian Shale (PAAS) standards [23], the spider diagram shows relative depletion of Nb, Th, and Hf, as well as relative enrichment of Sr and Mo. The Mn ore layer and some samples of the black rock series show strong enrichment of Sr, Th, Hf, Mo, Bi, W, and Co. The carbonate rock formations at the top and bottom are similar to the Mn ore layer, also showing strong enrichment of Sr, Th, Hf, and Bi; however, the contents of other trace elements are relatively lower than those in the Mn-bearing black rock series and the Mn ore layer (Figure 5B).

4.2.2. REEs

The analytical results of REEs in whole-rock samples are presented in Table S2. The total REE content (∑REE + Y) differs among different strata/lithologies: the Mn ore layer ranges from 86.90 to 118.52 ppm (mean = 97.93 ppm); the Mn-bearing black rock series ranges from 52.19 to 99.12 ppm (mean = 72.99 ppm); and the carbonate rock formations at the top and bottom have the lowest contents, being 16.67 ppm and 15.60 ppm, respectively.
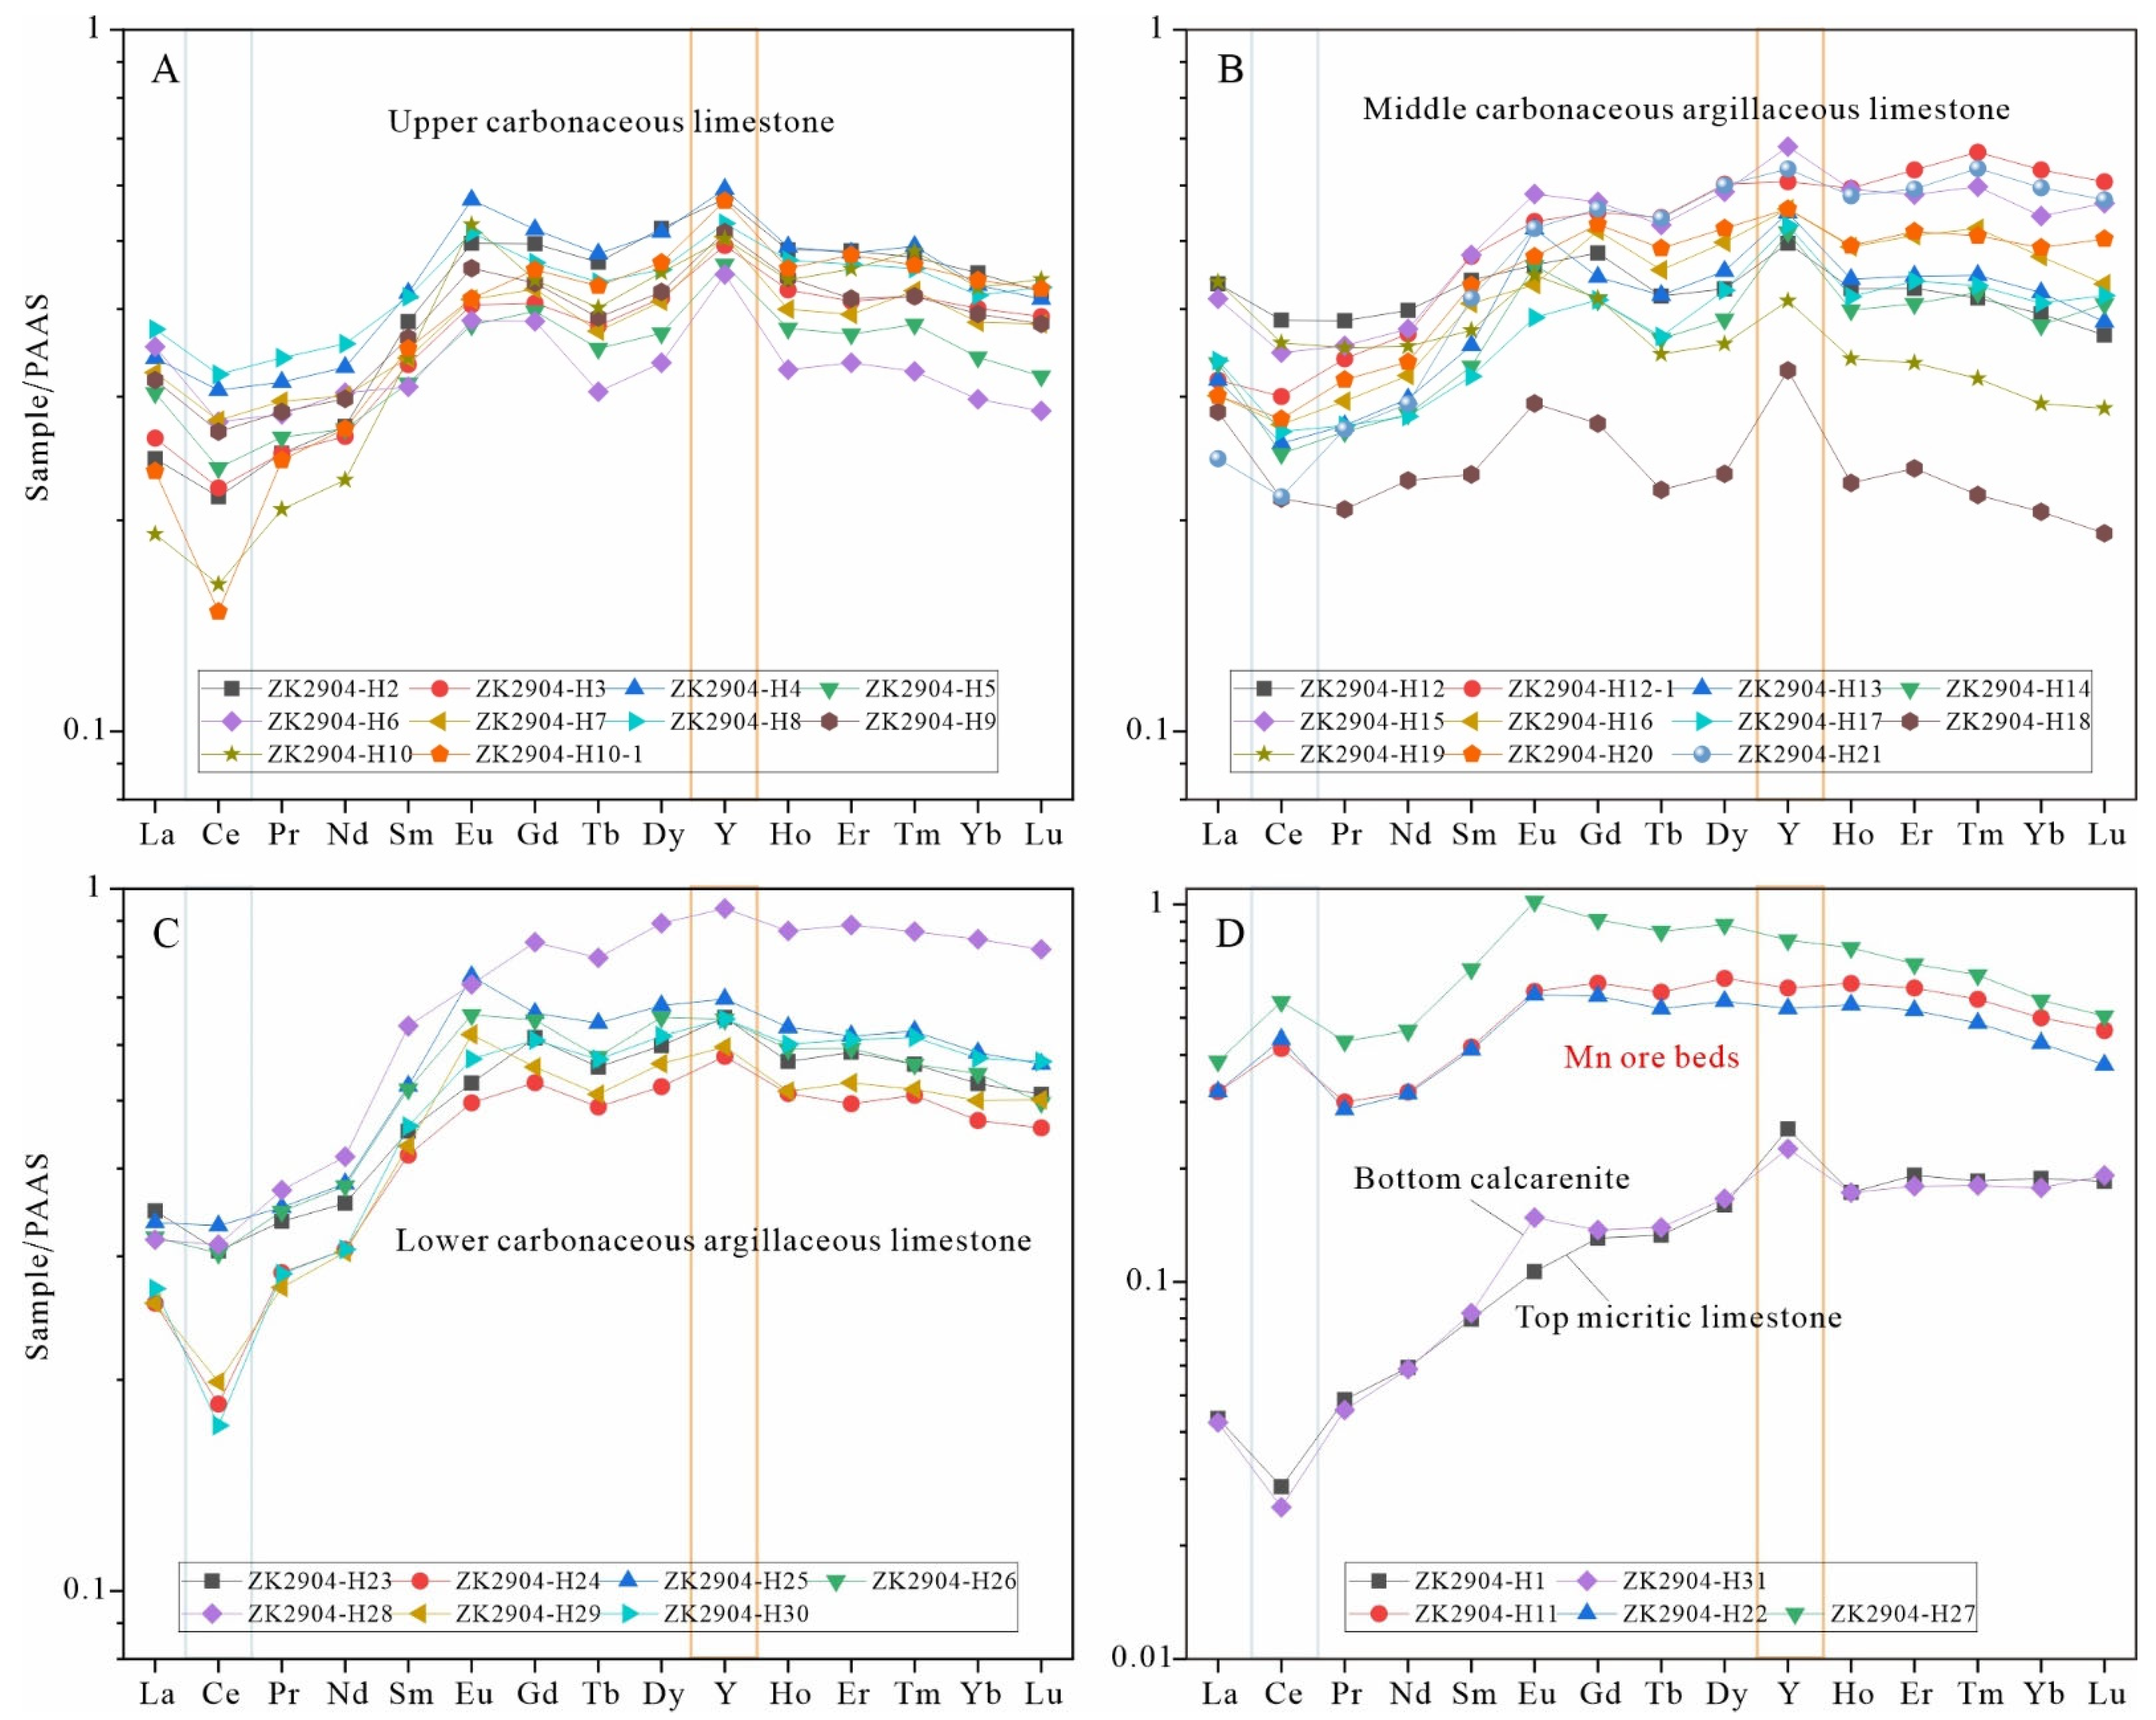
After Post-Archean Australian Shale (PAAS) normalization, the REE + Y distribution pattern shows a depletion of light REEs (LREEs), enrichment of medium REEs (MREEs) and heavy REEs (HREEs), and absent Eu anomalies (δEu = 0.94–1.35, with an average of 1.13). However, differences exist in the degrees of LREE/HREE and MREE/HREE fractionation, as well as in Ce anomalies (δCe) and Y anomalies (Y/Y*), among different strata/lithologies (Figure 6).
Based on the binary classification of REEs, the LREE/HREE ratios of different samples are as follows: 0.71–0.74 (mean = 0.73) for the top and bottom marine carbonate rocks, 2.31–2.69 (mean = 2.45) for the Mn ore layer, and 1.47–3.63 (mean = 2.13) for the black rock series. The LREE/HREE ratios within the black rock series are correlated with the profile depth, presenting a trend of upper strata < middle strata > lower strata, ranging from 1.47 to 2.79 (mean = 2.12), 1.52 to 3.63 (mean = 2.40), and 1.42 to 1.99 (mean = 1.72), respectively. According to the ternary classification of REEs, except for the top and bottom carbonate rock formations, both the Mn-bearing black rock series and the Mn ore layers exhibit slight fractionation between MREEs and HREEs, showing a distribution pattern characterized by relative enrichment of MREEs and relative depletion of HREEs. The MREE/HREE ratios in the Mn ore layer range from 0.50 to 0.57 (mean = 0.53), whereas those in the black rock series range from 0.40 to 0.51 (mean = 0.45).
Furthermore, the Ce and Y anomalies differ among different strata/lithologies: the top and bottom carbonate rock strata have δCe values of 0.57–0.62 and Y/Y* ratios of 1.33–1.53; the black rock series has δCe values of 0.62–0.97 (mean = 0.86) and Y/Y* ratios of 1.01–1.43 (mean = 1.17); and the Mn ore layer has δCe values of 1.34–1.45 and Y/Y* ratios of 0.96–0.97.

4.3. TC and TOC

The analytical results of TC and TOC in whole-rock samples are presented in Table S1. The TOC contents of the top and bottom carbonate rock formations range from 0.31 to 0.47 wt.%, and the TC contents range from 11.18 to 11.20 wt.%. For the black rock series, the TOC contents vary from 0.42 to 2.77 wt.% (mean = 1.53 wt.%), and TC contents range from 5.28 to 10.97 wt.% (mean = 7.17 wt.%). The Mn ore layers have TOC contents of 0.73–2.34 wt.% (mean = 1.42 wt.%) and TC contents of 8.49–9.64 wt.% (mean = 9.26 wt.%).
Comparative analysis indicates that the top and bottom marine carbonate sedimentary strata have the lowest TOC contents and the highest TC contents, corresponding to the low TOC/TC ratios (0.03–0.04). In contrast, the Mn-bearing black rock series and Mn ore layers have relatively higher TOC contents and lower TC contents, resulting in significantly higher TOC/TC ratios (0.05–0.47, with an average of 0.22) (Figure 4).

5. Discussion

5.1. Depositional Environment and Marine Redox Conditions

The formation of marine sedimentary Mn deposits is intricately linked to paleo-oceanic environments. The REE + Y distribution patterns of Mn ore beds in the Muhu area differ from those of the top and bottom marine carbonate wall rocks and Mn-bearing black rock series, characterized by positive Ce anomalies and negative Y anomalies. The low Y/Ho ratios (26.51–28.55, with an average of 27.23) are consistent with the geochemical characteristics of modern marine hydrogenic iron-Mn (oxyhydr)oxides (Figure 6). A positive Ce anomaly is generally interpreted to result from adsorption by Mn oxides, which exhibit a strong uptake capacity for Ce4+ [24]. Therefore, the initial depositional environment of Mn in the Muhu area was likely relatively oxic, suggesting that Mn oxidation occurred during deposition [3,24].
Primary productivity represents another critical proxy for discriminating paleoceanographic redox conditions. High primary productivity generally results in the intensive consumption of dissolved oxidants in the water column, favoring the development of anoxic conditions [3]. Copper in sediments occurs mainly as organic complexes. Calculating the authigenic Cu concentration (Cuauth) using the equation
Xauth = [X]sample − ([X]PAAS/[Al]PAAS) × [Al]sample
provides a reliable tool for reconstructing paleoproductivity [3].
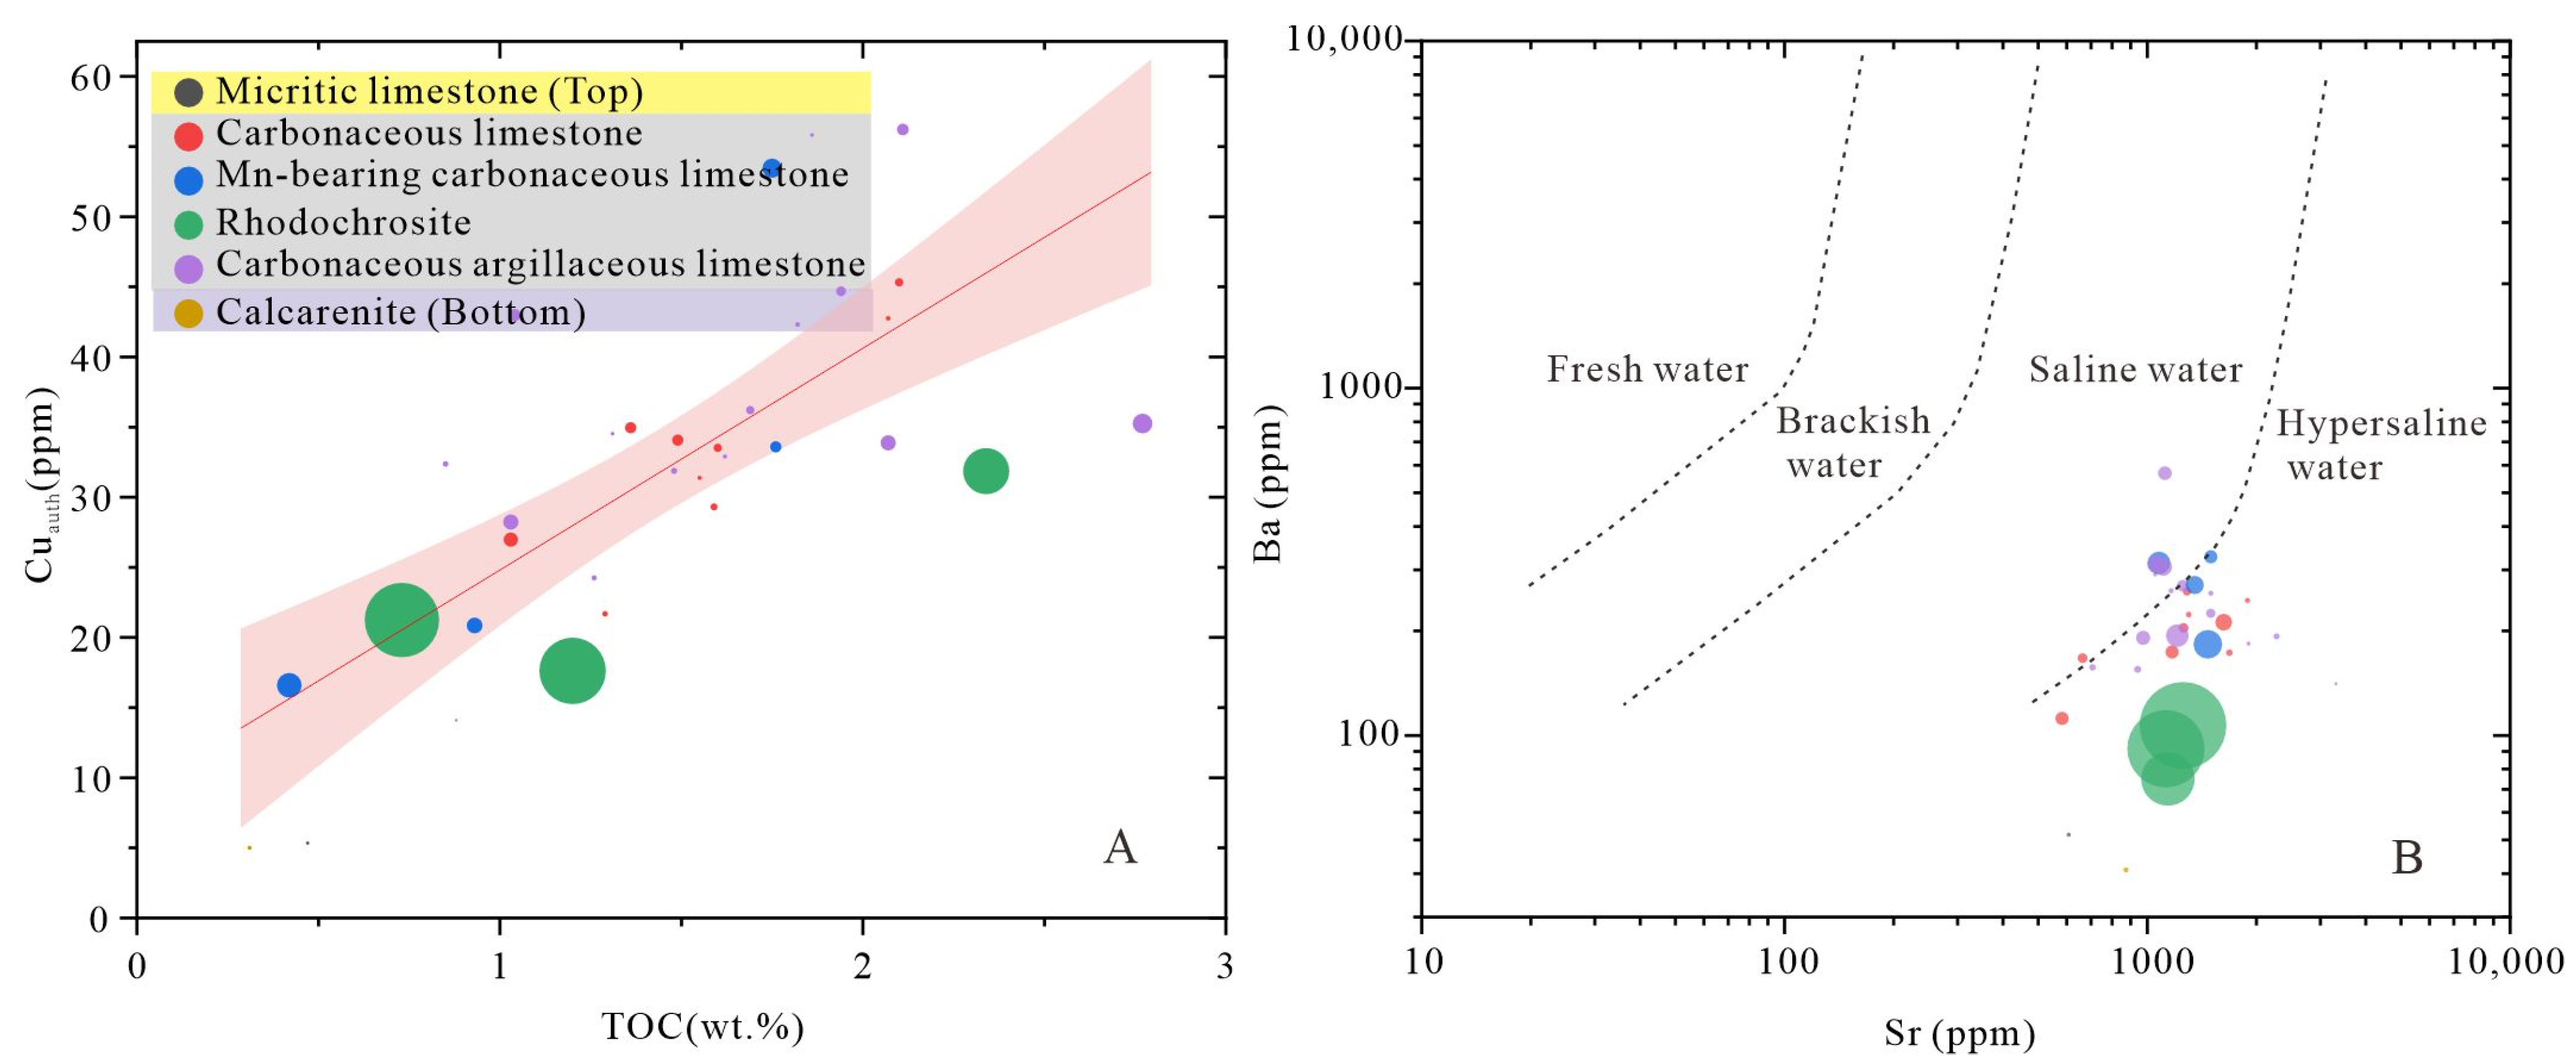
In this study, Cuauth values of the top and bottom limestone beds are 5.01 and 5.35 ppm, respectively, significantly lower than those of the black rock series-limestone intervals (14.10–56.22 ppm, with an average of 34.81 ppm). For Mn carbonate rocks, all samples yield a Cuauth value of 16.59 to 17.63 ppm, except for one weakly mineralized sample (ZK2904-H27) with 31.86 ppm. These values are lower than those of the Mn-bearing black rock series but higher than those of the top and bottom carbonate wall rocks. A positive linear correlation between Cuauth and TOC content is observed in the binary relation diagram (Figure 7A), indicating that Cuauth is a robust proxy for paleoproductivity in the study region [25]. Correspondingly, TOC content increases in the Mn-bearing black rock series and Mn ore beds, while TC content decreases slightly, resulting in a significant increase in the TOC/TC ratio. The TOC/TC ratio in the Mn ore beds remains low overall. The TOC/TC ratio can eliminate carbonate dilution interference and more reliably reflect the actual variation of paleoproductivity in this study area. These results suggest that paleoproductivity during the deposition of the Mn-bearing black rock series was significantly higher than that of the top and bottom carbonate wall rocks, and also moderately higher than that of the Mn carbonate rocks. This can be attributed to the fact that the paleoenvironmental conditions were unfavorable for organism proliferation during manganese carbonate sedimentation. Combined with inadequate input of terrigenous nutrients, the primary productivity remained at a low level in this period. Therefore, the Mn-bearing black rock series in the Muhu area was deposited in a deep, stable, and suboxic–anoxic paleoceanographic setting characterized by relatively high paleoproductivity. In contrast, the relatively lower paleoproductivity recorded in the Mn carbonate rocks implies a shallower, less stable paleoceanographic environment, corresponding to a downward shift of the redox interface.
Similarly, due to the distinct salinity signatures between terrestrial runoff and seawater, paleosalinity variation can effectively trace the provenance of water masses within shelf-margin basins [26]. The Sr/Ba ratio in sediments is a reliable proxy for paleosalinity, with the two exhibiting a positive correlation [26]. This is because seawater is generally enriched in Sr, whereas freshwater is relatively enriched in Ba [9,26]. Additionally, Ba has a lower mobility than Sr, leading to higher Sr/Ba ratios in deep-sea environments [26]. In the Sr-Ba binary diagram, all data from this study plot are within the high brackish to saline water fields (Figure 7B). The Sr/Ba ratios in black rock series (e.g., carbonaceous argillaceous limestone) range from 1.97 to 23.48, with an average of 6.45; those of Mn ore (mineralized) layers range from 11.72 to 15.19, with an average of 13.06; the Sr/Ba ratio is 21.29 in bottom calcarenite limestone and 11.72 in top micritic limestone. There is no obvious correlation between CaO content and Sr content in this study, indicating that carbonate minerals do not lead to abnormal enrichment of Sr [26]. Variable Sr/Ba ratios among sedimentary rocks indicate intermittent fluctuations in the paleosalinity of the depositional water column during Carboniferous in this region [26]. Relatively high paleosalinity occurred during the deposition of Mn carbonate rocks, suggesting an influence from high-salinity seawater [27].
Mn deposits in the Muhu area are hosted within black rock sequences, typically formed in deep-water, low-energy environments of platform basin facies [6]. During the Late Carboniferous, the Markansu metallogenic belt entered a stable subsidence phase, and an alternating platform-basin paleogeographic pattern was formed under the control of synsedimentary fault structures [6,13,14]. Relatively deep restricted depressions developed in the Muhu-Markantu area (Figure 1b) [6,13,14]. Continuous geochemical profiling of the Mn-bearing black rock series shows generally similar REE distribution patterns, with variations at different depths manifesting as negative Ce anomalies, positive Y anomalies, and differing degrees of enrichment in medium and heavy REEs. For instance, the LREE/HREE ratio shows the following trend: upper strata < middle strata > lower strata, suggesting regular fluctuations in water composition, environmental conditions, and other related factors during the deposition of this black rock series (Figure 6).
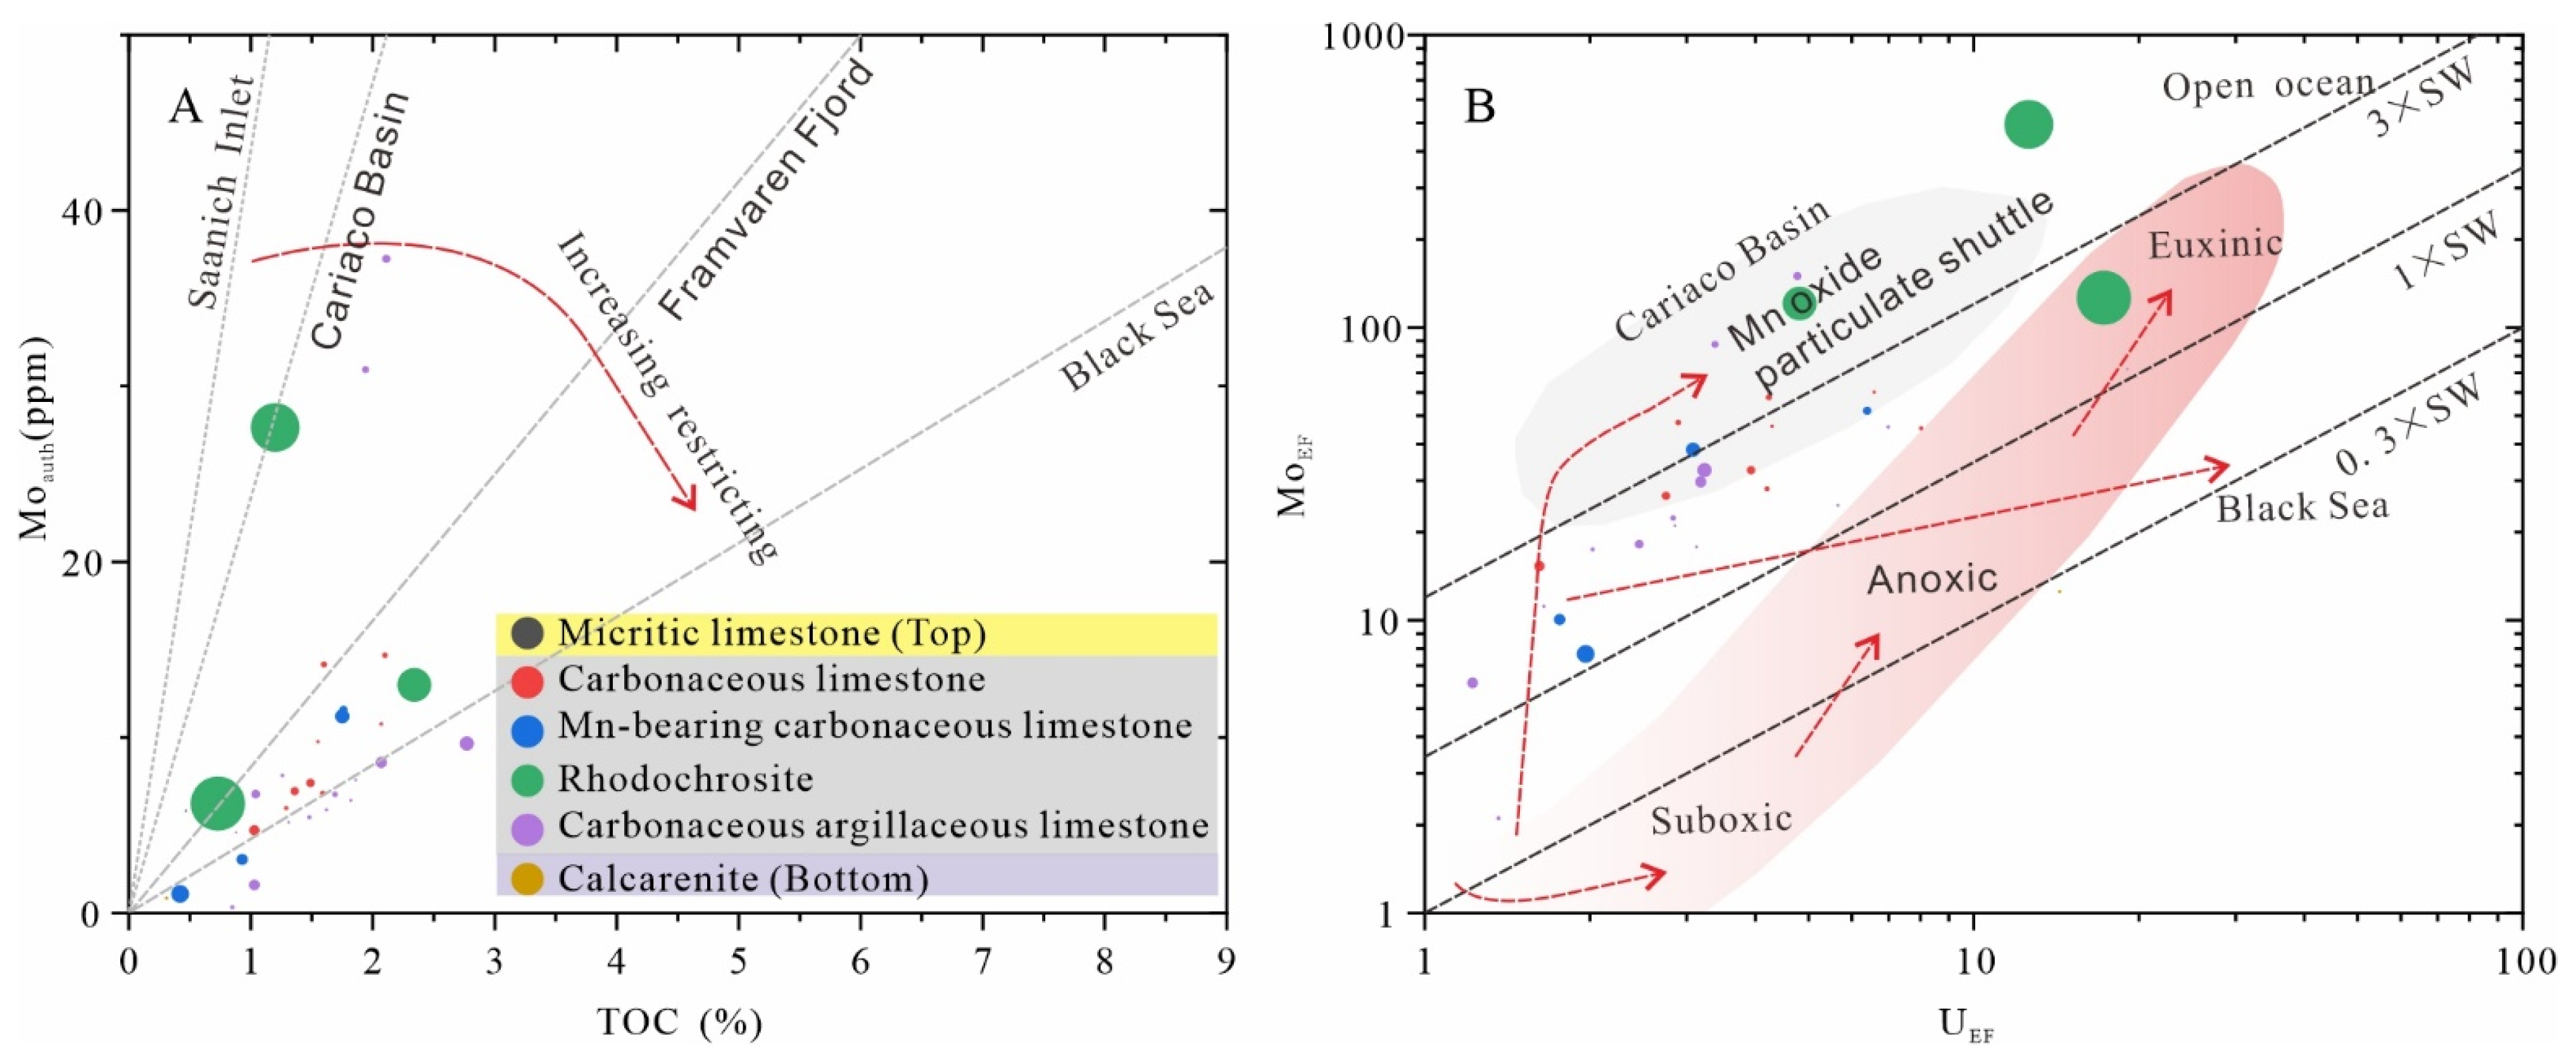
To evaluate whether fluctuations in shelf-edge water masses were controlled by open ocean seawater incursion or terrestrial runoff, authigenic Mo concentration (Moauth), TOC values, Mo enrichment factor (MoEF), and U enrichment factor (UEF) values were used as proxies (Figure 8) [28,29]. Because Mo has a stronger affinity for manganese oxides, while U enrichment is hardly affected by manganese oxides, the differential enrichment of Mo and U can be used as a geochemical indicator for the occurrence of Mn oxides [29]. Enrichment factors were calculated as XEF = [X/Al]sample/[X/Al]PAAS [30]. Seawater represents a major Mo reservoir with significantly higher Mo abundance than terrestrial freshwater [29]. Thus, greater connectivity to open-ocean seawater corresponds positively to higher Moauth/TOC and MoEF/UEF ratios. On the Moauth vs. TOC binary diagram, our data plot is mainly within the fields of strongly restricted basins such as Framvaren Fjord and the Black Sea, with only a few points approaching the Cariaco Basin (a weakly to unrestricted basin). This indicates generally low connectivity to open seawater during the sedimentation period, i.e., the basin was in a restricted and isolated condition. Notably, the Mn ore/mineralized layers display a trend of enhanced connectivity to open seawater, consistent with local sedimentary environmental evolution (Figure 8A). On the MoEF vs. UEF covariant diagram, most samples yield MoEF/UEF ratios that are higher than the modern seawater (SW) line, further verifying the local restricted basin water exchange features (Figure 8B). Data from surrounding rocks of the black rock series mostly fall within or near the weakly restricted basins field, consistent with the particle shuttle effect. In contrast, MoEF/UEF ratios of the Mn ore layers show a trend towards open-marine basin conditions, indicating sustained Mo supply from the open-ocean reservoir during their deposition. Moreover, the MoEF–UEF covariant records active Mn redox cycling in the water column, implying a stratified water column with an upper oxic layer and a lower anoxic–euxinic layer. Relatively low Moauth/TOC ratios further indicate that such redox stratification was closely linked to strong basin restriction (Figure 8) [6]. The Moauth/TOC and MoEF/UEF proxies yield consistent constraints, demonstrating fluctuating open-ocean influence on the depositional environments of the Mn-bearing succession in the study area. Specifically, carbonaceous (argillaceous) limestone and other black shale intervals record limited open-marine influence, whereas Mn carbonate deposition occurred under more open, less restricted basin conditions, reflecting stronger connectivity to the open ocean [28,29]. These patterns are consistent with the intermittent fluctuations in paleosalinity discussed above.
In summary, the initial depositional environment of Mn in the Muhu area was likely relatively oxidizing, with relatively high paleosalinity and noticeable influence from open-ocean seawater. Primary productivity was comparatively low, and the redoxline was positioned at greater water depths and was unstable. In contrast, the paleo-oceanic environment during the deposition of the upper and lower black rock sequences was characterized by lower salinity, higher primary productivity, and a shallower and more stable redox interface. These differences indicate that Mn enrichment was closely associated with fluctuations in basin water chemistry and redox stratification. Such geochemical variations are also closely coupled with sedimentary structural layering and vertical sedimentary sequence differentiation [3,6,28,29].

5.2. The Sources of Mn

High Al contents are generally regarded as important indicators for identifying terrigenous material input. In the Mn ore layer studied, Al content (0.50–1.08 wt.%) is similar to that of the bottom and top micrite limestones and calcarenite limestones (0.42–0.74 wt.%), but it is lower than that in carbonaceous (argillaceous) limestones (0.65–5.78 wt.%, mean = 2.82 wt.%). The negative correlation between Mn and Al contents indicates that a significant input of terrigenous detrital materials can be excluded to a certain extent in the Mn ore layer. The Mn/Fe ratio of the Mn ore layer ranges from 2.65 to 18.77, significantly higher than that of the surrounding black rock series and carbonate rock strata (0.03–3.33, mean = 0.32). It also differs from the Mn/Fe ratio of normal marine sediments (close to 1), indicating that the initial deposition of Mn may have been influenced by hydrothermal fluids (Mn/Fe > 10) [31]. Secondly, the Al/(Al + Fe + Mn) × 100 value is used to evaluate the relative contributions of terrigenous material, seafloor hydrothermal fluids, and normal seawater to Mn deposits. In the Mn ore layer studied, the Al/(Al + Fe + Mn) × 100 value ranges from 2.26 to 9.10, much lower than that of the surrounding black rock series and carbonate rocks (36.12–63.23, with an average of 55.36). The latter are mostly considered sedimentary rocks dominated by terrigenous material input (Al/(Al + Fe + Mn) × 100 > 40), indicating that the Mn source in the Muhu area is closely associated with hydrothermal inputs.
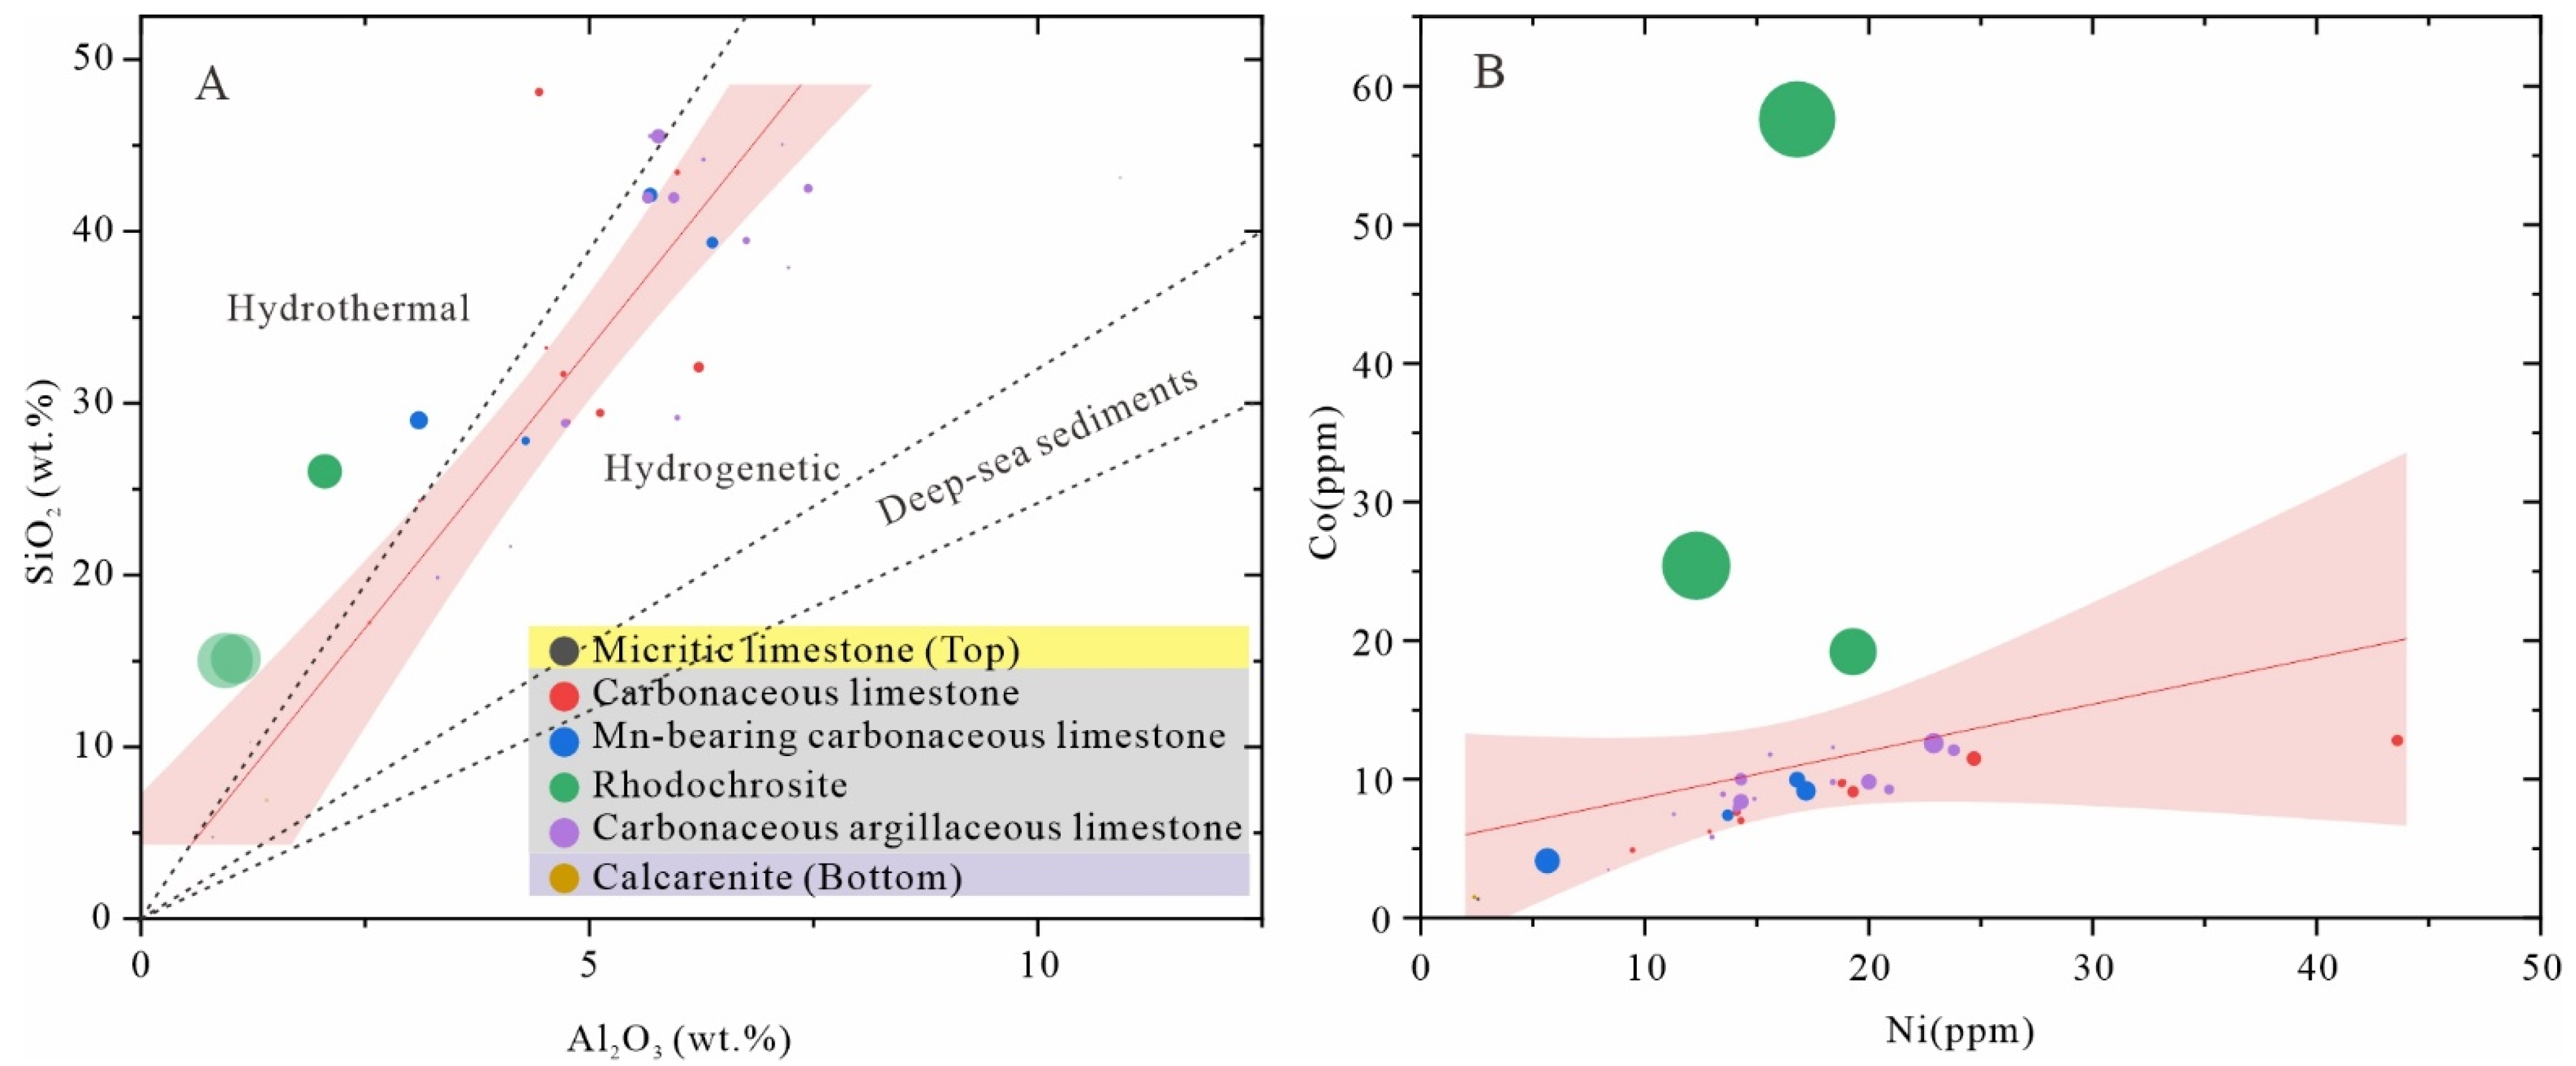
Based on the analysis of multiple discriminant indicators, no gradual transition exists between the Mn ore layer and its wall rocks in the Muhu area. For example, the SiO2/Al2O3 ratio of the Mn ore layers (12.70–15.99) is higher than that of the black rock series (3.95–10.84, with an average of 6.73) and carbonate rocks (4.93–5.94); all these values are higher than the average value of the continental crust (3.6). On the SiO2 vs. Al2O3 binary diagram, data points of the Mn ore layer plot into the hydrothermal field, clearly different from those of the black rock series, which plot into the hydrogenetic field, indicating that Mn precipitation was related to deep-derived hydrothermal activity (Figure 9A) [3]. The Mn ore layers are relatively enriched in Co (19.2–57.6 ppm, with an average of 34.07 ppm), significantly higher than those in the black rock series (3.47–12.8 ppm, with an average of 8.85 ppm) and carbonate rocks (1.36–1.51 ppm). The Co/Ni ratios of Mn ore layers range from 0.99 to 3.43, higher than those of the wall rocks (0.41–0.76, with an average of 0.55), further indicating contributions from deep-derived materials (e.g., seafloor hydrothermal fluid) in the Muhu area (Figure 9B). The Y/Ho ratios of the Mn ore layers (26.51–28.55, with an average of 27.23) are close to that of PAAS, a typical fingerprint of hydrothermal endmembers with negligible Y-Ho fractionation (Y/Ho ratios generally <28) [24,32,33], and slightly lower than those of the wall rocks (29.32–40.18, with an average of 32.53). The Y/Ho ratios of the wall rocks are relatively close to modern seawater values (Y/Ho = 44), indicating that the ore-forming fluids are a mixture of hydrothermal fluids and normal seawater. The P2O5 contents of the Mn ore layers (0.15–0.27 wt.%) are higher than those of the wall rocks (0.022–0.1%, with an average of 0.06 wt.%). Phosphorus enrichment is commonly believed to be related to P-rich materials carried by upwelling ocean currents [11]. In addition, essential nutrient elements represented by phosphorus are core substances controlling biological reproduction and productivity fluctuation. Nutrient supply directly regulates the scale of surface-water biological activities, further altering water redox stratification and depositional redox states, which has been well documented in previous relevant studies (e.g., Hao et al., 2025 [34]).
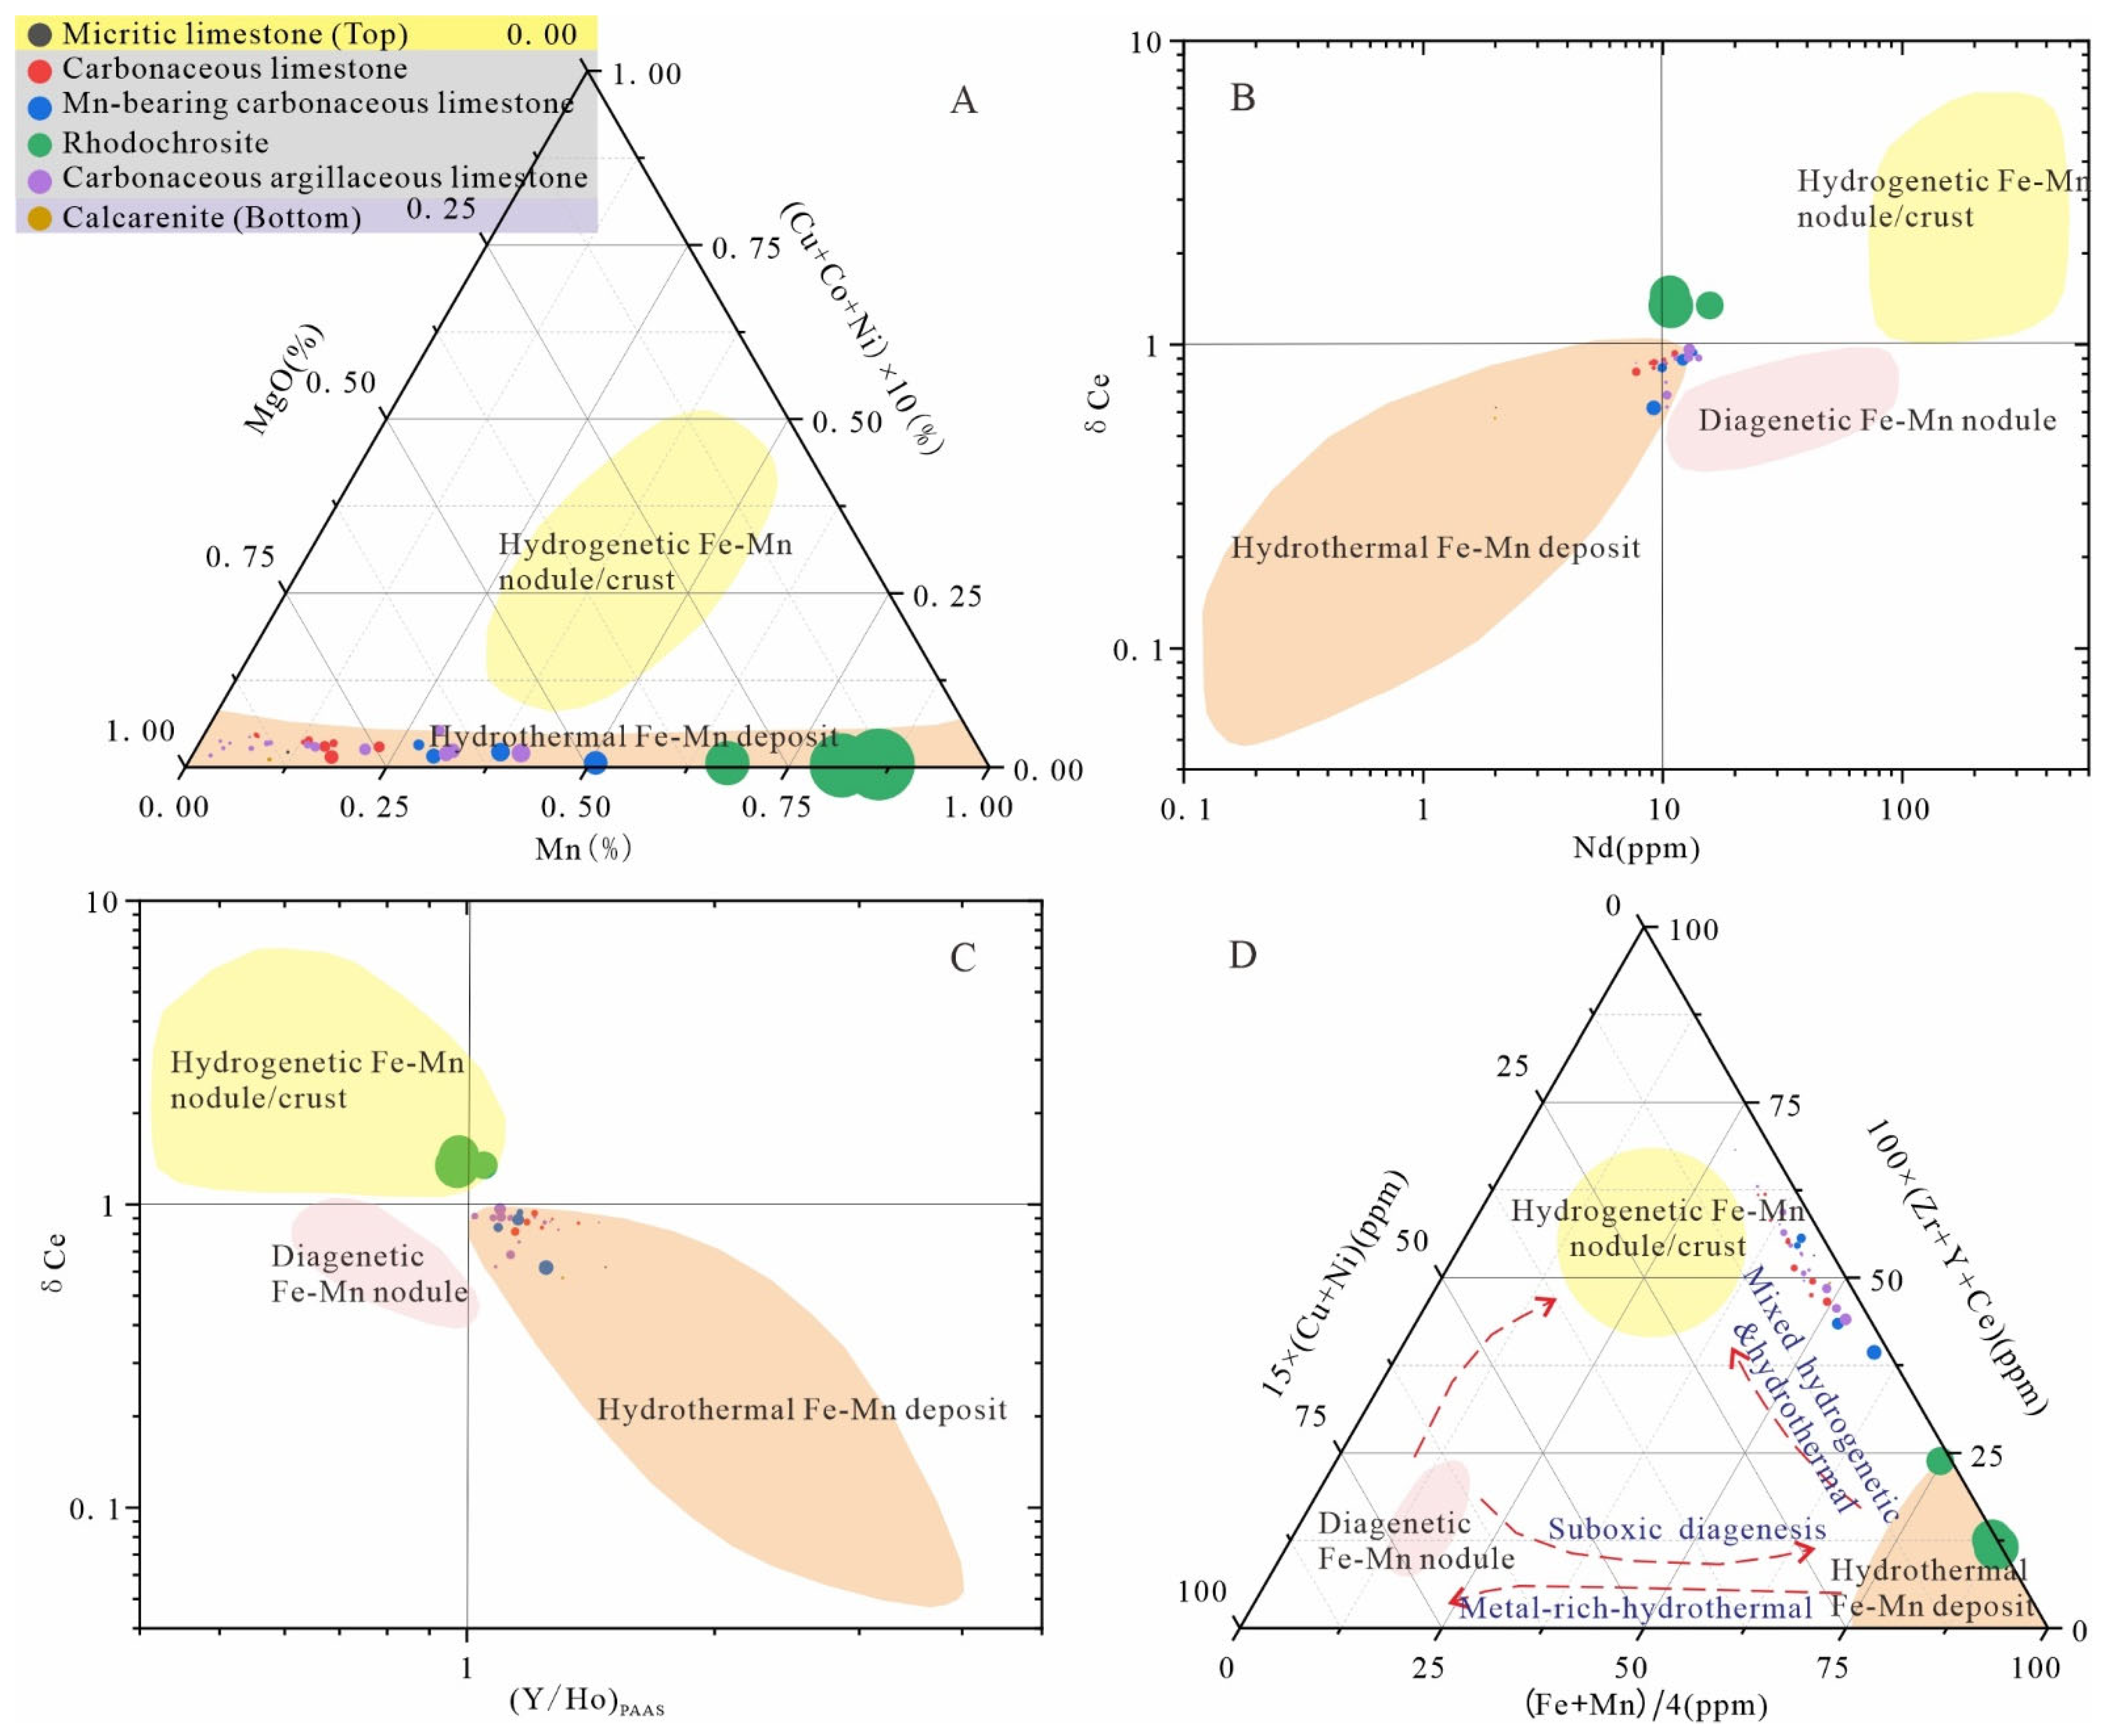
The formation of modern marine Mn can be categorized into three main genetic types: hydrogenetic (high oxidation, with metal elements mainly derived from continental weathering inputs), hydrothermal (low oxidation, with metal elements mainly derived from deep crustal hydrothermal fluids), and diagenetic (weak oxidation to suboxic zone, with metal elements are formed by remobilization and re-precipitation of Mn within sediments driven by early diagenesis) Mn deposits. Various discriminant graphical criteria have been established based on the above differences in element combination, rare earth element fractionation and trace element distribution characteristics of these types (Figure 10) [24,35,36]. On this basis, we further analyzed the genetic affinity of Mn ores and surrounding rocks in the Muhu deposit. In the MgO-Mn-(Cu + Co + Ni) × 10 triangular diagram, all data points plot within the hydrothermal iron-Mn oxide field (Figure 10A) [35]. In the δCe-Nd and δCe-(Y/Ho)PAAS binary diagrams, data from the Mn-bearing black rock series plot within the hydrothermal iron-Mn oxide field. In contrast, data points from the Mn ore layers overlap with the hydrogenetic iron-Mn oxide field in the δCe-(Y/Ho)PAAS diagram ([Y/Ho]PAAS refers to the PAAS-normalized ratio of Y to Ho), and are situated between hydrothermal and hydrogenetic iron-Mn oxides in the δCe-Nd diagram, being relatively close to the hydrothermal genetic type (Figure 10B,C) [24]. In the 15 × (Cu + Ni)-(Fe + Mn)/4 − 100 × (Zr + Y + Ce) triangular diagram, data points from the Mn ore layers plot within the hydrothermal genetic field, whereas wall rocks of the Mn-bearing black rock series plot between hydrothermal and hydrogenetic fields, showing a mixed variation trend (Figure 10D) [36]. Comprehensive analysis indicates that Mn deposition in the Muhu area was affected by the combined effects of seawater and hydrothermal fluids, and the Mn deposition was more closely associated with deep-sea hydrothermal activity.
As mentioned earlier, significant differences exist in the geochemical characteristics between the Mn-bearing black rock series, Mn ore beds, and the top and bottom marine carbonate rocks in the Muhu area. The carbonate strata exhibit relatively high contents of Ca and TC, whereas the contents of Al, Si, Mg, Mn, Fe, P, and TOC are relatively low (Figure 4). Compared with the wall rocks of the Mn-bearing black rock series, the Mn ore beds are relatively enriched in P2O5 and MgO and depleted in Al2O3, CaO, and SiO2. The corresponding ratios of P/Mn, Fe/Mn, Y/Ho, and TOC/TC all fall within the low range, whereas the Co/Ni ratio and the UEF, MoEF, and FeEF are relatively high. These geochemical characteristics suggest that Mn deposition in the Muhu area was strongly influenced by hydrothermal materials, with possible mixing with normal seawater, and that Mn mineralization represents a relatively discrete ore-forming event [3,24,35,36].

5.3. The Origin of the Mn-Carbonate Mineralization

The Mn ore layers in the Muhu area have relatively low Fe (mean = 1.86 wt.%) and P2O5 (mean = 0.19 wt.%) contents, corresponding to low Fe/Mn and P/Mn ratios, indicating that the Mn ore belongs to a low-iron, medium-phosphorus carbonate-type Mn ore. On the geochemical depth profile (Figure 4), there is a significant negative correlation between Mn mineralization and Fe/Mn and P/Mn ratios, indicating that intense Fe-Mn fractionation occurred during Mn deposition. Complete Fe-Mn fractionation is generally regarded as an essential process for the formation of high-quality Mn deposits [15,16].
The formation of large Mn deposits is often constrained by the occurrence and variation of the redox interface in ancient seawater. As a redox-sensitive element, Mn typically exists as dissolved Mn2+ in reducing water bodies and precipitates as Mn (hydro)oxides (Mn4+) in oxidizing water bodies [15,16]. Based on discriminant indicators including primary productivity, paleosalinity, and connectivity with the open ocean, this study reveals that the basin facies water bodies in the Muhu area had a binary stratified structure, characterized by an oxidized upper layer and an anoxic-sulfide lower layer. Furthermore, during the sedimentation of Mn-bearing black rock series, the composition and properties of the water bodies experienced intermittent or regular fluctuations, leading to variations in the corresponding redox interface (Figure 7 and Figure 8). Previous studies have suggested that factors such as basin restriction and the expansion of the oxygen minimum zone (OMZ) may have intensified the redox stratification in the paleo-oceanic water bodies in the Muhu area during the Late Carboniferous [11]. Geochemical analysis of the Mn ore layer indicates that the initial sedimentary environment of Mn in the Muhu area was oxidizing, with high paleosalinity and relatively low primary productivity. It was significantly influenced by open-ocean seawater, and the corresponding redox interface was located at a deep and unstable position.
As mentioned above, the initial sedimentary environment of Mn in the Muhu area was characterized by oxidizing water conditions, indicating that Mn oxidation occurred during deposition [3]. The dominant ore type of the Muhu deposit is Mn carbonate (rhodochrosite), suggesting that the initially deposited Mn oxides (Mn4+) in the oxidized water column were reduced during the later sedimentary–diagenetic stages. This indicates an active Mn redox cycle in the water column, which converted Mn4+ oxides into reduced Mn carbonate (Mn2+) that precipitated to form the deposit. Numerous studies have demonstrated that organic matter plays a crucial role in the precipitation and mineralization of marine sedimentary Mn carbonate [3,6,10,11,14,16]. The Mn-bearing black rock series in the Muhu deposit are rich in organic matter on a relative scale, with an average TOC content of 1.51 wt.% obtained in this study. Meanwhile, the TC content is relatively elevated in the Mn ore layer. Previous studies have shown that rhodochrosite yields light carbon isotope compositions (average δ13CPDB = −11.6‰) [10], significantly lower than those of the wall rocks and coeval seawater, indicating an organic carbon source. This feature is widespread in the Markansu metallogenic belt [3,6]. Furthermore, variations in primary productivity within the Mn-bearing black rock series can regulate the redox conditions of the sedimentary water column, forming an active Mn redox cycle. For example, during the Mn oxidation and deposition stage, the productivity of surface water was relatively low due to reduced terrigenous nutrient input, leading to a decrease in organic matter burial and oxygen consumption. Consequently, the ambient water column became relatively oxidized, corresponding to a shallowing of the redox interface. Therefore, the initially enriched Mn oxides in the Muhu area could be reduced by organic matter, ultimately forming a Mn carbonate deposit.
In summary, the Muhu (Markansu) Mn carbonate deposit is interpreted to record a three-stage process of oxidation, reduction, and mineralization, involving a Mn redox cycle characterized by the transformation sequence Mn2+ → Mn4+ → Mn2+. During the Late Carboniferous, periodic hydrothermal input and marine transgression may have increased the dissolved Mn2+ concentration in the basin water. Under relatively oxidizing conditions, Mn2+ was oxidized and initially enriched as Mn oxides. During subsequent sedimentation and early diagenesis, the transformation of Mn oxides was controlled by both the settling rate and reducing conditions. These Mn oxides were reduced in an organic-rich setting, and part of the Mn was transformed into Mn carbonate minerals. Additionally, residual Mn oxides in sedimentary pores could be dissolved again into anoxic water through reduction, releasing a large amount of inorganic carbon. As primary productivity declined and the redox interface further downward, dissolved Mn2+ that had accumulated in the original weakly oxi-reducing water was oxidized to form new Mn oxides. These Mn oxides, buried simultaneously with excess sedimentary organic matter, were ultimately transformed into a giant Mn carbonate deposit via organic matter reduction. This process model is consistent with the geochemical characteristics of the Muhu deposit and provides a reasonable explanation for the formation of Mn carbonate ore [3,6,10,11,14,15,16].

6. Conclusions

By systematic geochemical study of a continuous drill-core profile through the Muhu ore-hosting interval, including its geological characteristics, lithogeochemistry, and paleoenvironmental proxies, the following conclusions are drawn:
(1)
In the Muhu deposit, the initial depositional environment of Mn was oxic, with intense Mn oxidation. Strongly influenced by open-ocean seawater, the depositional basin exhibited relatively low primary productivity and a deeper, more unstable redox interface.
(2)
Mn deposition involved the input of deep-sea hydrothermal materials. Mn mineralization represents an independent ore-forming event without a gradual transition with the wall rocks.
(3)
Dynamic fluctuation in the redox conditions of basin water dominated the geochemical behavior of Mn. Initially, enriched Mn oxides were reduced by organic matter, ultimately forming Mn carbonate ore.
(4)
The formation process of the Muhu (Markansu) Mn carbonate deposit can be divided into three stages: oxidation, reduction, and mineralization. Mn experienced a geochemical evolution process characterized by Mn2+ → Mn4+ → Mn2+.

Supplementary Materials

The following supporting information can be downloaded at https://www.mdpi.com/article/10.3390/min16070696/s1, Table S1: Analytical results of major elements and organic carbon contents (in wt.%); Table S2: Analytical results of trace elements (in ppm).

Author Contributions

Conceptualization, H.Z. and J.L. (Jianjiang Li); methodology, J.L. (Jianjiang Li), and X.W.; validation, J.L. (Jian Liu) and Y.J.; formal analysis, J.L. (Jianjiang Li), X.W. and J.L. (Jian Liu); investigation, J.L. (Jianjiang Li), S.X., M.Z., J.L. (Jian Liu), Y.J., S.W. and S.Y.; resources, H.Z. and X.W.; data curation, J.L. (Jianjiang Li) and M.Z.; writing—original draft preparation, J.L. (Jianjiang Li); writing—review and editing, H.Z., X.W. and S.Y.; visualization, J.L. (Jianjiang Li) and X.W.; supervision, H.Z. and S.Y.; project administration, H.Z.; funding acquisition, H.Z. and X.W. All authors have read and agreed to the published version of the manuscript.

Funding

This research was funded by the Key Scientific Research Project of the Chongqing Municipal Planning and Natural Resources Bureau (grant number KJ-2025003) and the Commercial Exploration Project for the Detailed Exploration of the Muhu Manganese Deposit, West Kunlun, China.

Data Availability Statement

The original geochemical data presented in this study are available in the Supplementary Materials (Tables S1 and S2). Additional information is available from the corresponding author upon reasonable request.

Conflicts of Interest

The authors declare no conflicts of interest. The funders had no role in the design of the study; in the collection, analyses, or interpretation of data; in the writing of the manuscript; or in the decision to publish the results.

References

  1. Cheng, X.; Hu, P.; Zhang, H.K.; Jiang, J.S. The main types, distribution and current development of manganese ore deposits. Geol. China 2021, 48, 102–119, (In Chinese with English abstract). [Google Scholar]
  2. Zhang, B.-L.; Jia, R.-Y.; Xue, J.-L.; Lv, Z.-C. Origin and metal source of the Carboniferous Ortokarnash manganese deposit in the Western Kunlun Orogen, Northwest China. Ore Geol. Rev. 2025, 186, 106845. [Google Scholar] [CrossRef]
  3. Zhang, B.-L.; Wang, C.-L.; Robbins, L.J.; Zhang, L.-C.; Konhauser, K.O.; Dong, Z.-G.; Li, W.-J.; Peng, Z.-D.; Zheng, M.-T. Petrography and geochemistry of the Carboniferous Ortokarnash manganese deposit in the Western Kunlun Mountains, Xinjiang Province, China: Implications for the depositional environment and the origin of mineralization. Econ. Geol. 2020, 115, 1969–1998. [Google Scholar] [CrossRef]
  4. Huang, Q.; Pi, D.-H.; Jiang, S.-Y.; Liu, D.; Yan, H.; Mänd, K.; Kirsimäe, K.; Bishop, B.; Robbins, L.J.; Yang, S.-S. The dual role of microbes in the formation of the Malkantu manganese carbonate deposit, NW China: Petrographic, geochemical, and experimental evidence. Chem. Geol. 2022, 604, 120992. [Google Scholar] [CrossRef]
  5. Chen, F.; Wang, Q.; Pufahl, P.K.; Matheson, E.J.; Xian, H.; Nan, J.; Ma, H.; Deng, J. Carbonate hosted manganese deposits and ocean anoxia. Earth Planet. Sci. Lett. 2023, 622, 118385. [Google Scholar] [CrossRef]
  6. Dong, Z.-G.; Peng, Z.-D.; Robbins, L.J.; Konhauser, K.O.; Zhang, B.-L.; Zhang, L.-C.; Li, J.; Li, W.-J.; Zhang, L.; Wang, C.-L. Episodic ventilation of euxinic bottom waters triggers the formation of black shale hosted Mn carbonate deposits. Geochim. Cosmochim. Acta 2023, 338, 132–149. [Google Scholar] [CrossRef]
  7. Liu, L.; Li, X.; Liu, J.; Chu, H.; Wang, H.; Chu, F. Marine sedimentary manganese metallogenesis through geologic time and its coupling with major geoenvironmental events. Earth Sci. Rev. 2025, 269, 105205. [Google Scholar] [CrossRef]
  8. Gao, Y.; Teng, J.; Li, W.; Chen, D.; Sui, Q.; Jing, D.; He, Y.; Bai, J. Geology, geochemistry and ore genesis of the Aoertuokanashi manganese deposit, western Kunlun, Xinjiang, Northwest China. Acta Petrol. Sin. 2018, 34, 2341–2358, (In Chinese with English abstract). [Google Scholar]
  9. Chen, D.H.; Sui, Q.L.; Zhao, X.J.; Jing, D.L.; Teng, J.X.; Gao, Y.B. Geology, Geochemical Characteristics, and Sedimentary Environment of Mn-bearing Carbonate from the Late Carboniferous Muhu Manganese Deposit in West Kunlun. Acta Sedimentol. Sin. 2019, 37, 477–490, (In Chinese with English abstract). [Google Scholar]
  10. Chen, D.; Sui, Q.; Guo, Z.; Zhao, X.; Ten, J.; Gao, Y. Sedimentary environment of Mn-bearing carbonate from the Muhu manganese deposit in Malkansu, West Kunlun: Evidences from Fusulinids and C-O-Sr isotopes. Northwest. Geol. 2022, 55, 1–13, (In Chinese with English abstract). [Google Scholar]
  11. Dong, Z.G.; Zhang, L.C.; Dong, F.Y.; Zhang, B.L.; Xie, Y.Q.; Zha, B.; Peng, Z.; Wang, C. Geological Characteristics, Ore-Controlling Factors and Metallogenic Model of Muhu Manganese Deposit in West Kunlun, China. J. Jilin Univ. (Earth Sci. Ed.) 2020, 50, 1358–1372, (In Chinese with English abstract). [Google Scholar]
  12. Zhang, B.L.; Lv, Z.C.; Yu, X.F.; Li, Y.S.; Zhen, S.M. Age Determination and Geological Significance of Manganese-Bearing Rock Series in the Markansu Metallogenic Zone, West Kunlun Mountains. J. Jilin Univ. (Earth Sci. Ed.) 2023, 53, 120–139, (In Chinese with English abstract). [Google Scholar]
  13. Zhang, B.; Xue, J.; Lyu, Z.; Yu, X.; Li, Y.; Zhen, S. Lithofacies paleogeographical characteristics of the Late Carboniferous Malkansu metallogenic zone in West Kunlun and its control on manganese carbonates mineralization. Geol. Bull. China 2022, 41, 2046–2047, (In Chinese with English abstract). [Google Scholar]
  14. Zhang, L.C.; Dong, Z.G.; Zhang, B.L.; Li, W.J.; Peng, Z.D.; Wang, C.L.; Zhu, M.T. Controlling factors and “Malkansu style” metallogenetic model of high-grade manganese ore in West Kunlun orogen. Acta Geol. Sin. 2022, 96, 3195–3210, (In Chinese with English abstract). [Google Scholar]
  15. Zhang, L.C.; Li, W.J.; Dong, Z.G.; Li, W.; Xu, Y.F.; Gao, B.Y.; Wang, C.L.; Zhu, M.T. Iron-manganese separation and formation mechanism of manganese-rich ore during ore-forming processes of sedimentary manganese deposit. Mine Depos. 2025, 44, 85–100, (In Chinese with English abstract). [Google Scholar]
  16. Zhang, L.C.; Zhang, B.L.; Dong, Z.G.; Xie, Y.Q.; Li, W.J.; Peng, Z.D.; Zhu, M.; Wang, C. Tectonic Setting and Metallogenetic Conditions of Carboniferous Malkansu Giant Manganese Belt in West Kunlun Orogen. J. Jilin Univ. (Earth Sci. Ed.) 2020, 50, 1340–1357, (In Chinese with English abstract). [Google Scholar]
  17. Li, W.Y.; Zhang, Z.W.; Gao, Y.B.; Hong, J.; Chen, B.; Zhang, Z.B. Tectonic transformation of the Kunlun Paleo-Tethyan orogenic belt and related mineralization of critical mineral resources of nickel, cobalt, manganese and lithium. Geol. China 2022, 49, 1385–1407, (In Chinese with English abstract). [Google Scholar]
  18. Li, X.-Y.; Wang, E.-J.; Wu, C.-Q.; Zhao, D.-H.; Hua, B.; Zhang, Z.-W.; Xu, J.-H.; Jin, Z.-R. The redox conditions controlled manganese carbonate mineralization in the Late Paleozoic Qiaerlong deep basin, Western Kunlun Mountains, China. Ore Geol. Rev. 2022, 147, 104993. [Google Scholar] [CrossRef]
  19. GB/T 14506.28-2010; Methods for Chemical Analysis of Silicate Rocks—Part 28: Determination of 16 Major and Minor Elements Content. China Standards Press: Beijing, China, 2010.
  20. GB/T 14506.30-2010; Methods for Chemical Analysis of Silicate Rocks—Part 30: Determination of 44 Elements. China Standards Press: Beijing, China, 2010.
  21. DZ/T 0279.25-2016; Analysis Methods for Regional Geochemical Samples—Part 25: Determination of Carbon Content by Combustion–Infrared Absorption Spectrometry (2016-08-16 Release). China Geological Publishing House: Beijing, China, 2016.
  22. DZ/T 0279.27—2016; Analysis Methods for Regional Geochemical Sample—Part 27: Determination of Organic Carbon Contents by Potassium Dichromate Volumetric Method. China Geological Publishing House: Beijing, China, 2016.
  23. McLennan, S.M. Geochemistry and Mineralogy of Rare Earth Elements; Rare Earth Elements in Sedimentary Rocks: Influence of Provenance and Sedimentary Processes; Lipin, B.R., McKay, G.A., Eds.; De Gruyter: Berlin, Germany, 1989; pp. 169–200. [Google Scholar]
  24. Bau, M.; Schmidt, K.; Koschinsky, A.; Hein, J.; Kuhn, T.; Usui, A. Discriminating between different genetic types of marine ferro manganese crusts and nodules based on rare earth elements and yttrium. Chem. Geol. 2014, 381, 9. [Google Scholar] [CrossRef]
  25. Tribovillard, N.; Algeo, T.J.; Lyons, T.; Riboulleau, A. Trace metals as paleoredox and paleoproductivity proxies: An update. Chem. Geol. 2006, 232, 12–32. [Google Scholar] [CrossRef]
  26. Wei, W.; Algeo, T.J. Elemental proxies for paleosalinity analysis of ancient shales and mudrocks. Geochim. Cosmochim. Acta 2020, 287, 341–366. [Google Scholar] [CrossRef]
  27. Keigwin, L.; Gorbarenko, S. Sea level, surface salinity of the Japan Sea, and the Younger Dryas event in the northwestern Pacific Ocean. Quat. Res. 1992, 37, 346–360. [Google Scholar] [CrossRef]
  28. Algeo, T.J.; Rowe, H. Paleoceanographic applications of trace-metal concentration data. Chem. Geol. 2012, 324–325, 6–18. [Google Scholar] [CrossRef]
  29. Algeo, T.J.; Tribovillard, N. Environmental analysis of paleoceanographic systems based on molybdenum–uranium covariation. Chem. Geol. 2009, 268, 211–225. [Google Scholar] [CrossRef]
  30. Zhou, L.; Wignall, P.B.; Su, J.; Feng, Q.; Xie, S.; Zhao, L.; Huang, J. U/Mo ratios and δ95Mo as local and global redox proxies during mass extinction events. Chem. Geol. 2012, 324–325, 99–107. [Google Scholar] [CrossRef]
  31. Corliss, J.B.; Lyle, M.; Dymond, J.; Crane, K. The chemistry of hydrothermal mounds near the Galapagos Rift. Earth Planet. Sci. Lett. 1978, 40, 12–24. [Google Scholar] [CrossRef]
  32. Bau, M. Controls on the fractionation of isovalent trace elements in magmatic and aqueous systems: Evidence from Y/Ho, Zr/Hf, and lanthanide tetrad effect. Contrib. Miner. Pet. 1996, 123, 323–333. [Google Scholar]
  33. Dong, Z.G.; Peng, Z.D.; Wang, C.L.; Zhang, B.L.; Zhang, L.C.; Li, J.; Zhang, X.; Li, W.J.; Zhang, L. Insight into the genesis of the Zhaosu Carboniferous Mn carbonate deposit (NW China): Constraints from petrography, geochemistry, and C–Mo isotopes. Miner. Depos. 2022, 57, 1269–1289. [Google Scholar] [CrossRef]
  34. Hao, J.; Li, X.; Ju, P.; Pasek, M. Active redox cycling of phosphorus on the early Earth. Nat. Commun. 2025, 16, 4569. [Google Scholar] [CrossRef]
  35. Bonatti, E.; Kraemer, T.; Rydell, H. Classification and genesis of submarine iron manganese deposits. In Ferromanganese Deposits on the Ocean Floor; National Science Foundation: Washington, DC, USA, 1972; pp. 149–166. [Google Scholar]
  36. Josso, P.; Pelleter, E.; Pourret, O.; Fouquet, Y.; Etoubleau, J.; Cheron, S.; Bollinger, C. A new discrimination scheme for oceanic ferromanganese deposits using high field strength and rare earth elements. Ore Geol. Rev. 2017, 87, 3–15. [Google Scholar] [CrossRef]
Figure 1. Regional geological sketch map of the Markansu manganese carbonate zone (modified after [3]). Insets: (a) Simplified tectonic location map (modified after [3]); (b) Late Carboniferous paleogeographic map (modified after [6]).
Minerals 16 00696 g001
Figure 2. Simplified geological map of the Muhu ore district (A) and cross-section of exploration line 29, the sampled drilling site is marked in purple (B).
Minerals 16 00696 g002
Figure 3. Sampling locations and lithological photographs. (AD) are photomicrographs under a polarized light microscope. (E) is the Mn ore bed, which is a core sample of Mn-bearing carbonaceous limestone; the red mark indicates the number of drilling rounds and core blocks.
Minerals 16 00696 g003
Figure 4. Depth profiles of major element contents and TOC/TC ratios (wt.%), the red ribbons denote the positions of the ore samples. In Mn ore samples H27, H22 and H11, the Mn content is positively correlated with P and Mg contents, and negatively correlated with the contents of other elements (Al, Ca, Fe, Si) as well as the ratios of P/Mn, Fe/Mn and TOC/TC.
Minerals 16 00696 g004
Figure 5. Box diagrams of trace element contents (A) and PAAS-normalized spider diagrams (B). PAAS data are from [23].
Minerals 16 00696 g005
Figure 6. PAAS-normalized REE-Y patterns. PAAS data are from [23]. (A) PAAS-normalized REE-Y patterns of the upper carbonaceous limestone; (B) PAAS-normalized REE-Y patterns of the middle carbonaceous argillaceous limestone; (C) PAAS-normalized REE-Y patterns of the lower carbonaceous argillaceous limestone; (D) PAAS-normalized REE-Y patterns of the bottom calcarenite, top micritic limestone and Mn ore beds.
Minerals 16 00696 g006
Figure 7. Discrimination diagrams of primary productivity (A) and paleosalinity (B). Circle size varies with Mn content.
Minerals 16 00696 g007
Figure 8. Discrimination indices for connectivity between basin waters and the open ocean. (A) Bivariate plot of Moauth vs. TOC; base map modified after [28]. (B) Crossplot of MoEF vs. UEF; base map modified after [29]. Circle size varies with Mn content; SW denotes the seawater value.
Minerals 16 00696 g008
Figure 9. Binary diagrams for SiO2 vs. Al2O3 (A) and Co vs. Ni (B). Circle size varies with Mn content.
Minerals 16 00696 g009
Figure 10. Genetic discrimination diagrams of manganese carbonate. Base map for (A) modified after [35]; base maps for (B,C) modified after [24]; base map for (D) modified after [36]. Circle size varies with Mn content.
Minerals 16 00696 g010
Disclaimer/Publisher’s Note: The statements, opinions and data contained in all publications are solely those of the individual author(s) and contributor(s) and not of MDPI and/or the editor(s). MDPI and/or the editor(s) disclaim responsibility for any injury to people or property resulting from any ideas, methods, instructions or products referred to in the content.