Article

Bridging the Theoretical–Experimental Gap: A Study on Pressure-Corrected Fe-Si Alloys Under the Earth’s Outer Core


1
Institute of High-Pressure Physics, School of Physical Science and Technology, Ningbo University, Ningbo 315211, China
2
Key Laboratory of High-Temperature and High-Pressure Study of the Earth’s Interior, Institute of Geochemistry, Chinese Academy of Sciences, Guiyang 550081, China
3
Frontiers Science Center for Critical Earth Material Cycling, School of Earth Sciences and Engineering, Nanjing University, Nanjing 210023, China
*
Author to whom correspondence should be addressed.
Minerals 2026, 16(6), 576; https://doi.org/10.3390/min16060576
Submission received: 25 April 2026 / Revised: 22 May 2026 / Accepted: 25 May 2026 / Published: 27 May 2026

Abstract

Determining the concentration of light elements in the Earth’s outer core is crucial for understanding the generation of the geomagnetic field, as well as the Earth’s internal dynamics and thermal evolution. However, as a potential dominant light element in the outer core, the precise composition of silicon (Si) is still a topic of intense debate. Due to the limited experimental data, significant controversies exist between theoretical models and experimental predictions regarding the Si content in the outer core. In this work, we have calculated pressure (P)–volume (V)–temperature (T) data of Fe-X wt.% Si, where X = 0, 2.4, 4.9, 7.5, and 10.3 at ~136–330 GPa and 4000–7000 K by first-principles molecular dynamics (FP-MD) simulations. We employed pressure correction to address the discrepancy between theoretical and experimental measurements. Based on the corrected data, we established an equation of state (EoS) for Fe-Si alloys. We calculated thermodynamic properties, including density (ρ), thermal expansivity, Grüneisen parameter, isothermal and adiabatic bulk moduli, and sound velocity (VP). To constrain the silicon content in the outer core, the ρ and VP of Fe-X wt.% Si computed along the outer core geotherm were compared with the Preliminary Reference Earth Model (PREM). Assuming Si is the only light element in the outer core and is constrained by PREM data, the maximum Si content at TICB = 5400 K is 2.4 ± 1.7 wt.%. Considering the uncertainty in TICB, the maximum Si content in the outer core ranges from 1.8 to 3.0 ± 1.7 wt.%. The fact that a homogeneous binary alloy cannot match all seismic observations provides evidence that the content of Si in the outer core may vary with depth. Besides, the work states that pressure correction helps bridge the gap between theoretical and experimental estimates of Si concentration. The pressure-corrected equation of state provides a robust benchmark for constraining multi-component core models.

1. Introduction

The composition of the Earth’s outer core is a fundamental issue in understanding the Earth’s internal dynamics, the formation of its magnetic field, and the evolutionary processes of terrestrial planets. According to geophysical, geochemical, and high-pressure experimental studies, the Earth’s outer core is predominantly composed of iron (Fe) [1]. However, compared with the density (ρ) and sound velocity (VP) values of the outer core from the Preliminary Reference Earth Model (PREM) [2], which is based on seismic observations, the density of pure iron (Fe) is approximately 10% higher, while the sound velocity (VP) is about 5% lower [3,4,5]. Therefore, it is suggested that the outer core must have a certain number of light elements that can reduce ρ and increase VP of liquid Fe alloys.
Based on geophysical and geochemical evidence [6,7], as well as experimental data from metal–silicate partitioning and isotope fractionation studies [8,9,10], silicon (Si) is considered a major light element in the Earth’s outer core. Firstly, it has been demonstrated that the environment in the outer core was characterized by reducing conditions during the early stages of Earth’s accretion [11]. Experimental metal–silicate partitioning studies have shown that the partition coefficient (D) of Si increases with decreasing oxygen fugacity and increasing temperature and pressure [12]. Under the reducing conditions expected for a deep magma ocean and at pressures of about 20–40 GPa, D(Si) becomes sufficiently large to promote the incorporation of substantial amounts of Si into the growing core. Quantitatively, in a single-stage core formation model at 40 GPa and 3200 K, the predicted Si content of the entire core is 1.0–3.5 wt.% [12], providing an upper bound on the Si concentration in the outer core. These findings confirm that under the conditions of early Earth differentiation, Si exhibits high solubility in liquid iron and was thus significantly partitioned into the outer core. Besides, the mantle is primarily composed of silicate minerals, and its elemental abundance shows certain similarities to that of meteorite chondrules. However, the molar ratio of magnesium to Si (Mg/Si) in the mantle is significantly higher, with an atomic Mg/Si ratio of about 1.27 in the upper mantle compared to 1.05 in C1 chondrites [13]. Therefore, the depletion of Si in the mantle suggests a corresponding enrichment of Si in the outer core [14].
To date, the content of Si in the outer core remains controversial, with estimates ranging from 1.5 to 16.8 wt.% based on different approaches [7,9,10,15,16,17,18,19,20]. The geophysical approach to constraining the Si content hinges on comparing the density and sound velocity of candidate liquid Fe-Si alloys with the PREM data. Through shock-wave compression experiment, Huang et al. have constructed an equation of state (EoS) of Fe-8.6 wt.% Si alloy up to 240 GPa and 4670 K, suggesting that the outer core should contain approximately 8.6 ± 2.0 wt.% Si to match the PREM density [21]. Using the same method, Zhang et al. have determined the sound velocity and melting behavior of a Fe-9 wt.% Ni-10 wt.% Si alloy up to 280 GPa, estimating that the outer core contains approximately 6 wt.% Si, 2 wt.% S, and 1–2.5 wt.% O, alloyed with liquid Fe-Ni [22]. In addition, according to X-ray diffraction experiments using laser-heated diamond anvil cells (DAC) by Fischer et al. [23,24,25], the maximum Si content needed to account for the outer core’s density deficit is approximately 11 wt.%. But the value exceeds the compositional limit of 10 wt.% for light elements in the outer core [1,26].
However, the difficulties associated with shock-wave and laser-heated DAC experiments have hindered direct probing of the density and sound velocity of Fe-Si alloys under the outer core conditions. In contrast, first-principles molecular dynamics (FP-MD) simulations enable modeling at extremely high temperatures and pressures, allowing the derivation of EoS and thermodynamic properties of liquid Fe-Si alloys under the outer core conditions. That said, the FP-MD approach tends to systematically underestimate pressure compared to experimental values [27,28]. Therefore, Umemoto et al. have corrected the calculated pressures from FP-MD to shock-wave compression data [3] and showed that approximately 9–11 wt.% Si can solely account for the ρ and VP of the Earth’s outer core as a light element [29]. The values almost exceed the composition limit of the outer core [1,26]. Recently, with the development of methods to extract information from XRD diffuse signals, the density uncertainty of liquid has been reduced to within 1.2%, enabling the density measurement of liquid Fe up to 4350 K and 116 GPa by DAC experiments [28]. Liu et al. have applied pressure calibration to the DAC data of liquid Fe, which significantly enhanced the agreement between theoretical and experimental densities [30]. Thus, pressure corrections to experimental data [28] are essential for aligning computational results of liquid Fe-Si before building an EoS and studying the thermodynamic behavior of liquid Fe-Si alloys.
In this work, we performed a series of FP-MD simulations to calculate the pressure–volume–temperature (P-V-T) relationships of liquid Fe-X wt.% Si (X = 0, 2.4, 4.9, 7.5, and 10.3) at pressures ranging from~136 to 330 GPa and temperatures from 4000 to 7000 K, covering the conditions of the outer core. The calculated pressures were calibrated against DAC experimental measurements [28] by employing a correction scheme proposed by French and Mattsson [31]. Using the corrected P-V-T, we established an EoS for Fe-Si alloys and derived key thermodynamic properties, including density (ρ), thermal expansion coefficient (α), Grüneisen parameter (γ), isothermal and adiabatic bulk moduli (KT and Ks), and sound velocity (VP) at P-T conditions of the outer core. Furthermore, we calculated the density and sound velocity of liquid Fe-Si alloys along the geotherm of the outer core and compared them with PREM to constrain Si concentration in the outer core. Finally, this study has proven that pressure calibration addresses the inconsistent constraints on the EoS of liquid Fe-Si and consequently enhances the prediction accuracy of VP and ρ for liquid Fe-Si alloys under the outer core conditions.

2. Methods

2.1. First-Principles Molecular Dynamics Simulations Details

All simulations in this work were performed by FP-MD based on density functional theory (DFT), as implemented in the Vienna Ab initio Simulation Package (VASP, version 5.4.4) [32,33]. The generalized gradient approximation function of the Perdew–Burke–Ernzerhof (PBE) type was used to describe the exchange-correlation functional [34]. The finite-temperature effects in the electronic structure and force calculations were incorporated via the Fermi–Dirac smearing approach [35]. The reciprocal Brillouin zone was sampled using the gamma point. All simulations were performed within the NVT canonical ensemble with constraints on the number of atoms (N), volume (V), and temperature (T) throughout all simulations [36]. The electronic configurations considered were fourteen valence electrons (3p63d74s1) for Fe and eight valence electrons (2p63s2) for Si. The cutoff radii were 2.2 a.u. for Fe and 1.7 a.u. for Si. Spin polarization was not included in the simulations as its influence is negligible at high pressures (>40 GPa) [21,37]. We set the cutoff energy to 300 eV after the cutoff energy test (see Figure S1 in the Supplementary Materials).
Here, we considered five distinct compositions, which are Fe108, Fe103Si5 with 2.4 wt.% Si, Fe98Si10 with 4.9 wt.% Si, Fe93Si15 with 7.5 wt.% Si, and Fe88Si20 with 10.3 wt.% Si. The initial liquid Fe structure was obtained by performing molecular dynamics simulations at 10,000 K for 20 ps with a simulation cell of 108 atoms. We also tested simulation cell sizes of 32, 108, and 256 atoms, and the results indicate that a 108-atom cell is sufficient for this study (see Figure S2 in the Supplementary Materials). The number of atoms in a simulation cell is the same as in previous simulations [30,38]. We monitored the liquid state via the radial distribution function (RDF) and mean square displacement (MSD). The RDF and MSD of liquid Fe88Si20 alloy at 165 GPa and 7000 K are shown in Figure S3 and Figure S4, respectively, in the Supplementary Materials. The initial liquid Fe-Si alloys were obtained by replacing Fe atoms with Si to a certain Si concentration. It was then quenched to the target temperatures, namely, 4000, 5000, 6000, and 7000 K. All runs were performed for 20 ps with a time step of 1 fs. Simulation-length test confirms that 20 ps is sufficient for our calculations (see Figure S5 in the Supplementary Materials). Each simulation ran for 10 ps to allow the liquid structure to reach full thermal equilibrium, followed by an additional 10 ps to obtain time-averaged pressures and temperatures.

2.2. Pressure Correction Scheme

To test the thermodynamic model, the isothermal density and sound velocity of liquid Fe are compared with previous theoretical simulations [5,29,39], experimental measurements [28], and PREM values [2]. The results are presented in Figure S6 of the Supplementary Materials. As the figure shows, the calculated densities are slightly higher than the earlier theoretical results by Vočadlo et al. [39] and lower than the values by Umemoto et al. [29], while the compression curves are parallel. However, all the theoretical densities are higher than the DAC values [28]. The density overestimation is more pronounced at lower pressures. Meanwhile, the slope of the density profile at 4000 K and 5000 K is lower than that by the DAC compression approach [28]. For sound velocity, the calculated values are slightly higher than the earlier theoretical data [5,29], with the slope of compression curves in excellent agreement. However, the calculated sound velocity values are clearly overestimated compared with those obtained from the DAC compression experiment. Since other theoretical results [5,40] also show similar deviations from experimental values [28], this phenomenon is probably intrinsic to DFT calculations with the exchange-correlation functional approximation [30].
In order to reduce the discrepancy with experimental measurements, pressure correction was applied to the calculated pressures. We employed the pressure correction formula proposed by French and Mattsson to correct the computational pressures with Δ P V = Δ P 0 V 0 c V χ + 1 exp χ + 1 χ 1 V 0 c V χ [31], as recommended by Wagle [41], Liu [30], and Satyal [42]. V is the volume of the simulation box containing 108 atoms, and ∆P0, V0c, and χ are the fitted constants, which were obtained through a least squares algorithm. We present experimentally determined pressure (Pexp), FP-MD calculated pressure (PDFT), and pressure deviation between simulation and experiment (∆P = PexpPDFT) for pure Fe under various conditions in Table S1 of the SI section. The parameters ∆P0, V0c, and χ were determined by fitting to ∆P, yielding values of 16.66 GPa, 6.62 cm3/mol, and 0.95, respectively. The fitted French–Mattsson formula as a function of density is shown in Figure S7 in the SI section. By applying the French–Mattsson formula, the pressures of liquid Fe up to 330 GPa (completely covering the outer core pressures) at 4000, 5000, and 6000 K after correction are consistent with the DAC extrapolation data [28], with a mean deviation smaller than 0.65% (see Figure S8 in the SI). This indicates that the French–Mattsson formula for compensating for DFT pressure offsets across the entire range of Earth’s outer core pressures.

2.3. Equation of State of Liquid Fe-Si

Based on the adjusted P-V-T data, a thermal EoS of liquid Fe-Si alloys covering the P-T range of the Earth’s outer core (4000–7000 K, 136–330 GPa) is constructed. It is composed of the Murnaghan [1,43] and Mie–Grüneisen–Debye (MGD) EoS [5,44] and fitted for liquid Fe-Si alloys (Fe-X wt.% Si, where X < 10.3) with the form
P V , T = P T 0 V + Δ P t h V , T
where P V , T is the total pressure, P T 0 is the pressure at the reference temperature T 0 ( T 0 = 7000 K in this study) and expressed as:
P T 0 = K T 0 K T 0 V 0 V K T 0 1
where K T 0 is the thermal bulk modulus at zero pressure, and K T 0 is the pressure derivative of K T 0 at T 0 . V 0 is the volume at zero pressure. Considering the Si content is below 10 wt.%, we applied the ideal mixing rule [44,45,46] to deal with the behavior between Fe atom and Si atom. The parameters V 0 , K T 0 , K T 0 are expressed by
V 0 = V 0 F e X F e + V 0 S i X S i
K T 0 = K T 0 F e X F e + K T 0 S i X S i
The thermal pressure Δ P th is expressed as:
Δ P th ( V , T ) = γ ( V ) V [ E t h ( V , T ) E t h ( V , T 0 ) ]
where γ ( V ) is Grüneisen parameter. γ ( V ) can be calculated by:
γ ( V ) = γ 0 V V 0 b
The internal thermal energy E t h ( V , T ) is represented by a second-order polynomial of T with a volume-dependent second-order coefficient as
E t h ( V , T ) = 3 n R T + e 0 V V 0 g T 2
where R is the gas constant ( R = 8.314   J / ( m o l · K ) ) and n is the number of atom types in a formula unit (n = 2 for liquid Fe-Si here).
The EoS requires ten parameters ( K T 0 F e , K T 0 S i , K T 0 F e , K T 0 S i , V 0 F e , V 0 S i , e 0 , g , γ 0 , and b ) to describe the P-V-T relations of liquid Fe-Si alloys. These parameters were fitted to the FP-MD P-V-T data by the least squares algorithm.

3. Results and Discussions

3.1. Isothermal Density and Sound Velocity of Liquid Fe

Utilizing the corrected P-V-T data, we established the EoS for liquid Fe-Si alloys, with the parameters provided in Table 1. The reported KT0-Fe in this work, 93.00 GPa, is comparable to 83.7 GPa obtained by Dorogokupets et al. [47]. The isothermal density and sound velocity of liquid Fe at 4000, 5000, 6000, and 7000 K are derived and compared with the previous static compression data [28] and shock-wave compression results [27].
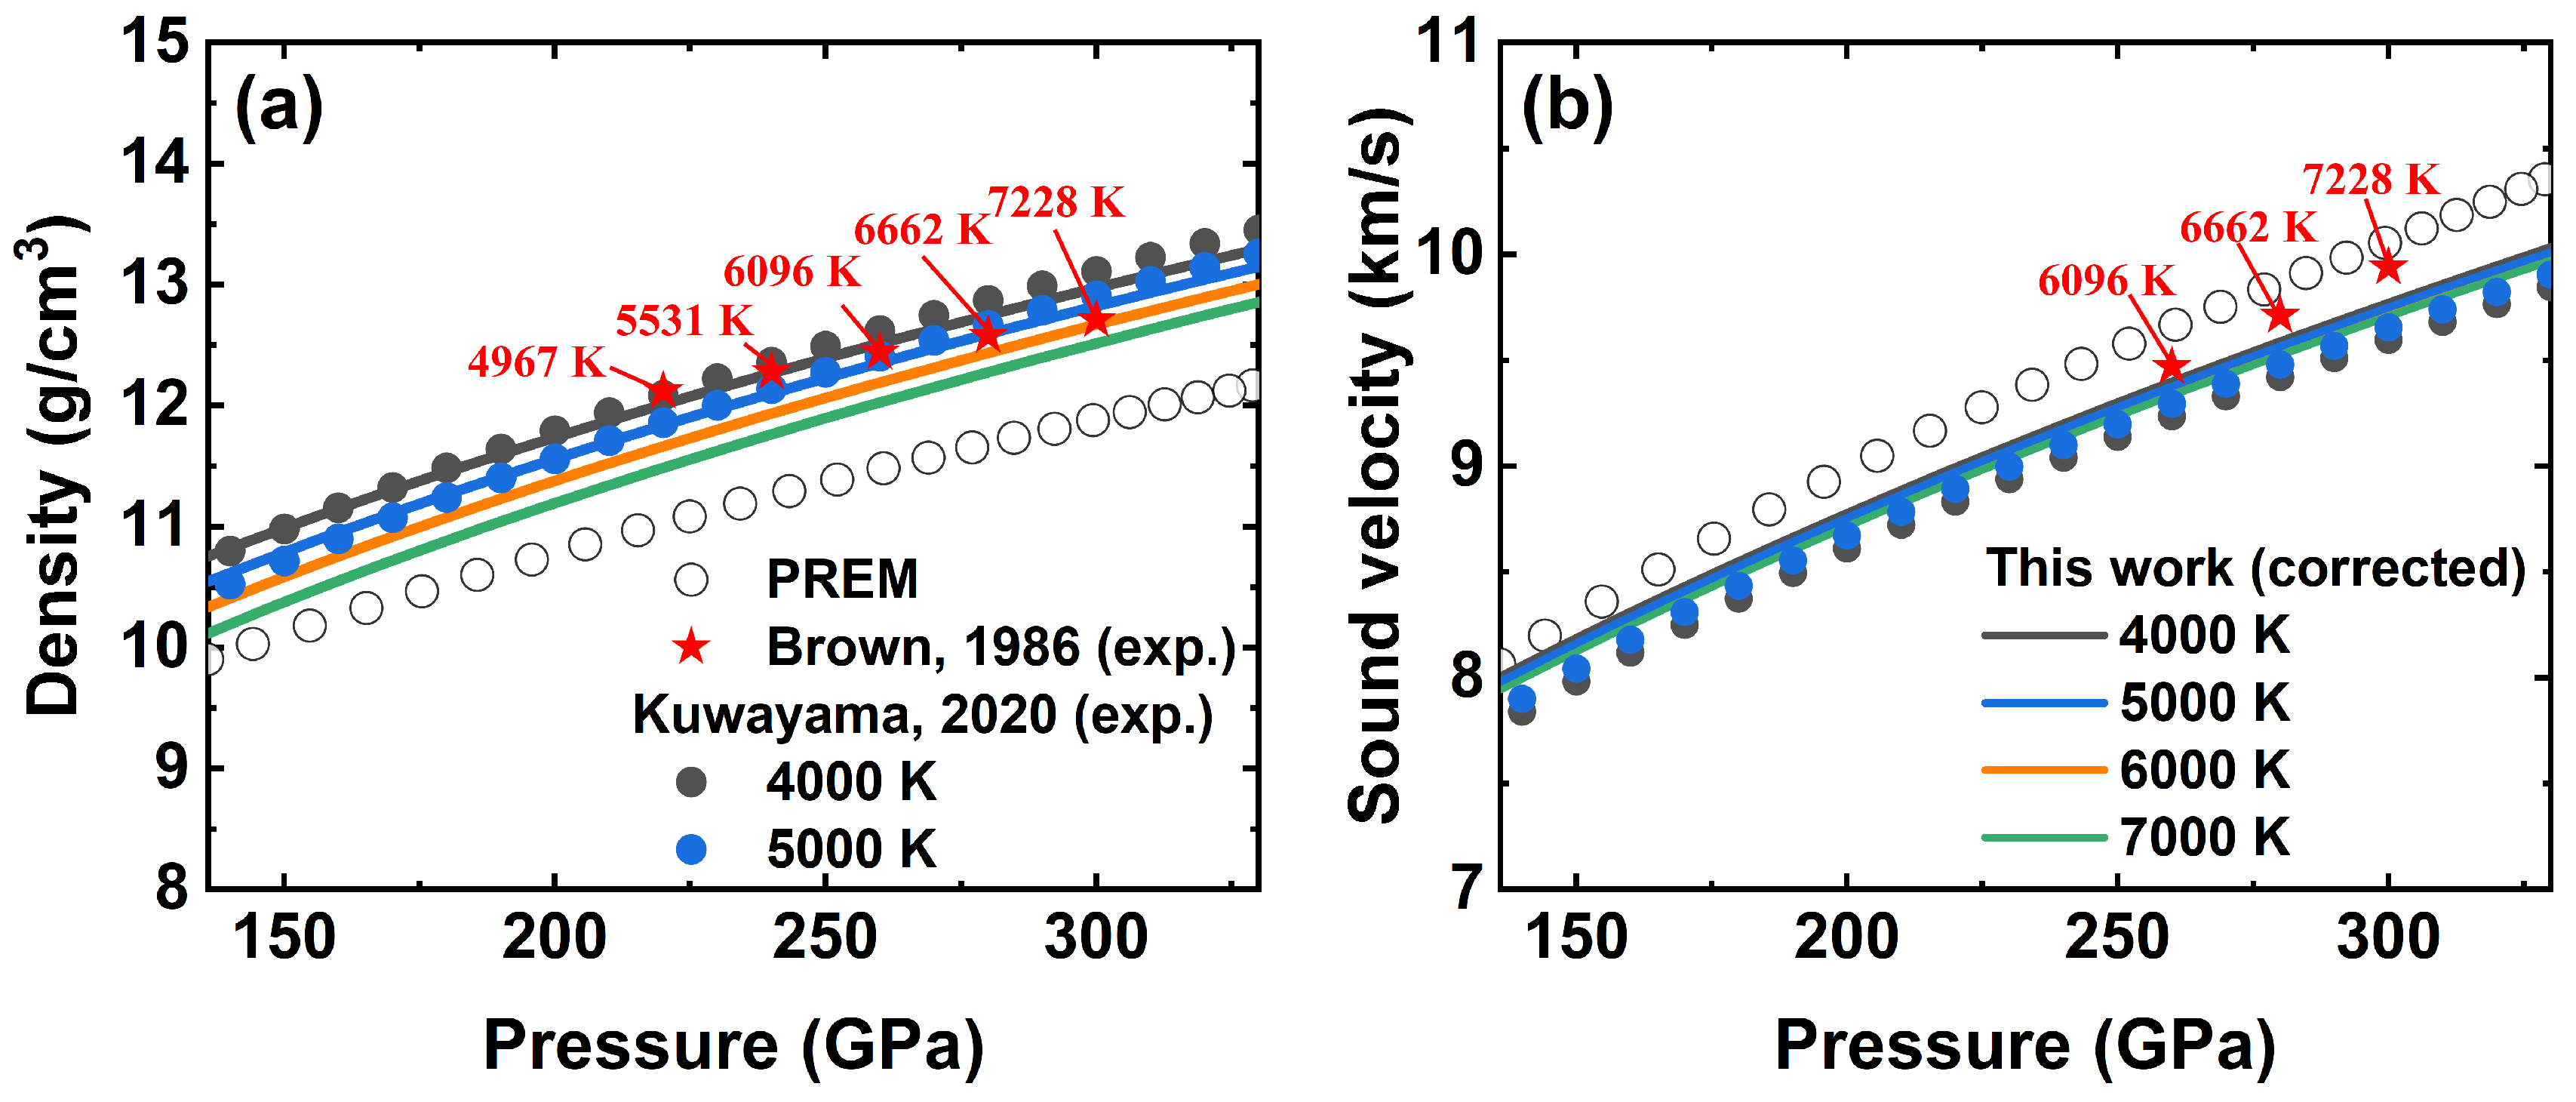
As illustrated in Figure 1a, the density of liquid Fe at 4000 K and 5000 K shows excellent agreement with the DAC measurements of Kuwayama et al. [28], albeit with a marginally gentler slope, the uncertainty is about 0.56%. Similarly, the sound velocity of liquid Fe (Figure 1b) aligns closely with the values reported by Kuwayama et al. [28], deviating by only 1.02% at 136 GPa and 1.08% at 330 GPa at 5000 K, the average uncertainty deviation is 1.05%. The comparison above shows that the pressure-corrected EoS yields densities and sound velocities of liquid Fe in close consistency with high-pressure experimental DAC measurements [28]. Granted that the pressure corrections were conducted under relatively low pressures (<116 GPa) and temperatures (<4350 K), the agreement observed in both densities and sound velocities supports the reliability of extrapolating the pressure correction to the outer core conditions. Note that because the outer core is liquid, the bulk sound velocity calculated in this study is numerically equivalent to the compressional wave velocity. Thus, it is denoted as VP and directly compared with PREM.

3.2. Thermodynamic Properties of Liquid Fe-Si Alloys

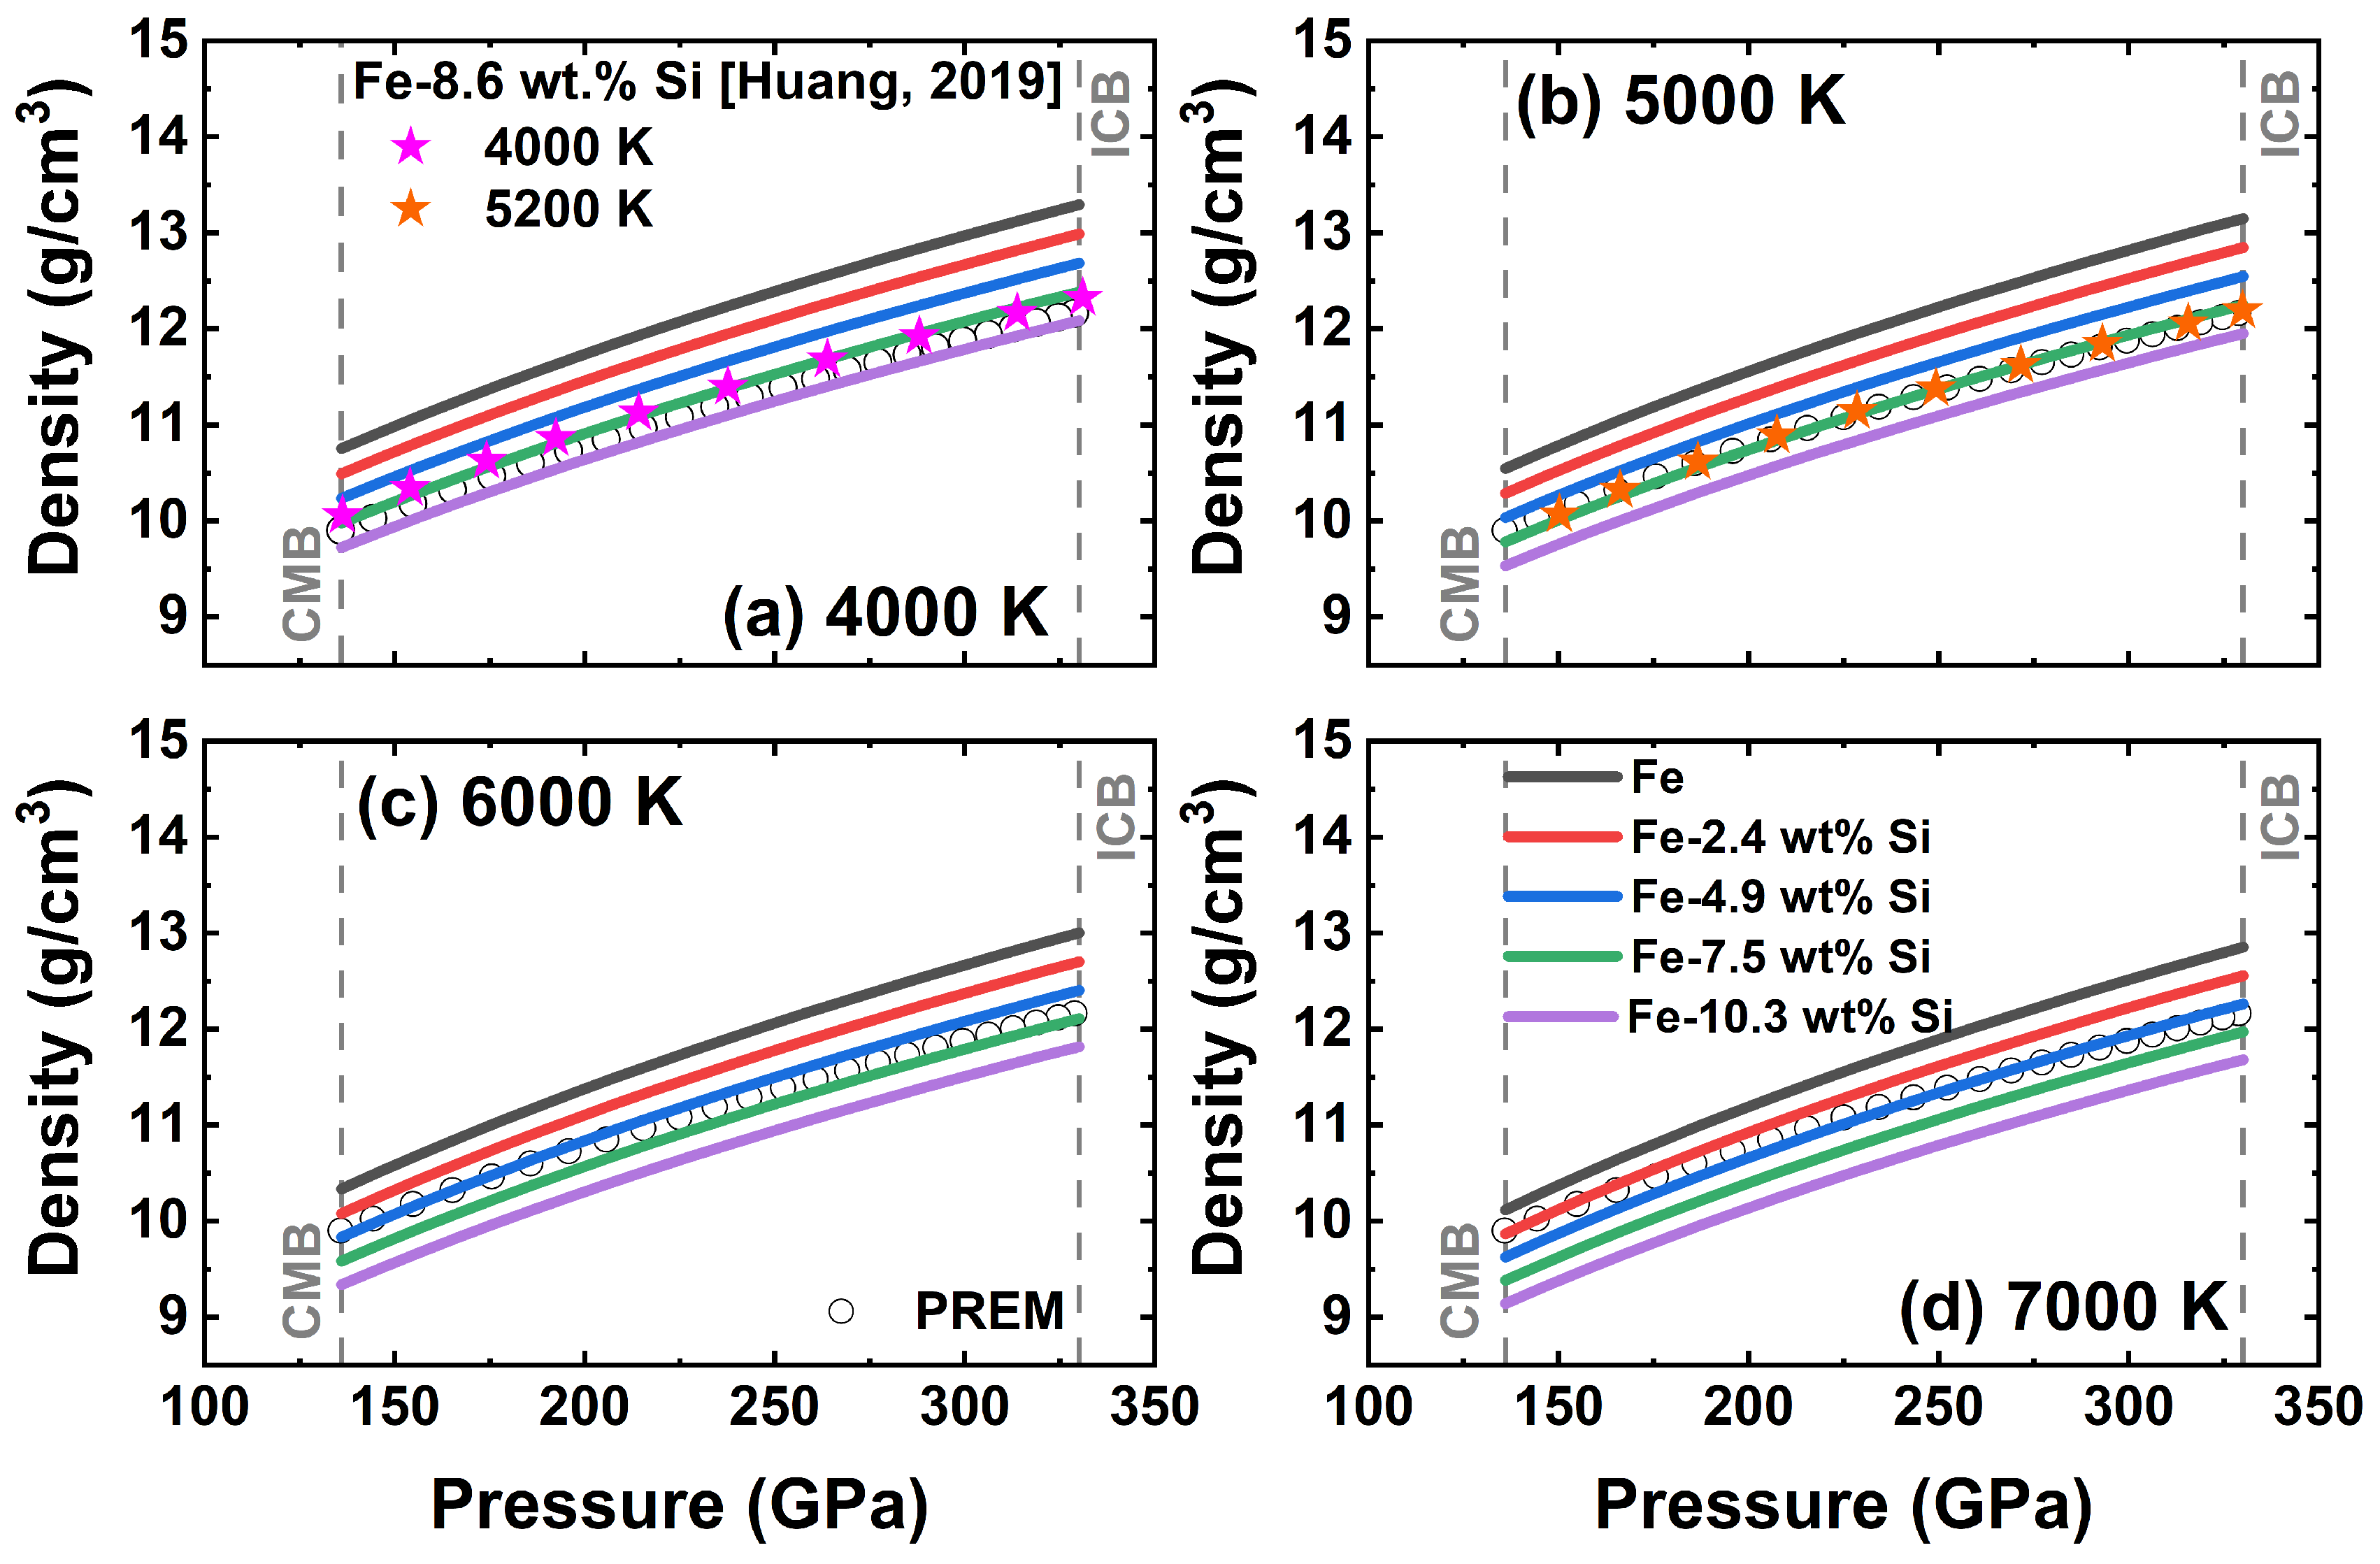
Consequently, we applied the EoS to calculate the isothermal density, thermodynamic properties, and isothermal sound velocity of liquid Fe-Si alloys, focusing on the effect of pressure, temperature, and Si content. Figure 2 shows the isothermal density of alloys with Si concentrations up to 10.3 wt.% at temperatures ranging from 4000 to 7000 K, as well as the shock-wave data of liquid Fe-8.6 wt.% Si [21]. The results indicate that the density of liquid Fe-Si alloys increases with pressure but decreases with both Si content and temperature. Notably, Si incorporation exerts a particularly pronounced effect on density reduction. It confirms that the density of liquid Fe-Si alloy is closely related to pressure, temperature, and Si concentration, which is consistent with the findings from previous studies on Fe-O [29,48], Fe-S [49,50], and Fe-C [51] alloys.
Additionally, we compared our results with the shock-wave compression data of Fe-8.6 wt.% Si at 4000 K and 5200 K [21] to verify the effect of Si content on the pressure-correction scheme with liquid Fe-Si alloys. Although the correction was derived from pure liquid Fe [28], the density for Fe-Si alloys aligns well with experimental values, showing a deviation of 0.03–0.19%. This indicates that the compositional influence of Si is implicitly accounted for within the volume-dependent terms of the pressure-correction formula.
We now investigate the effect of pressure and temperature on the density deficit of liquid Fe-Si alloys. The density deficit induced by the Si element exhibits clear pressure dependence. At 136 GPa and 4000 K, the addition of 10.3 wt.% Si lowers the density by 9.57%, whereas, at 330 GPa and 4000 K, the same silicon concentration produces a slightly smaller density reduction of 9.09% (Figure 2a), indicating that the Si-induced density deficit is more pronounced at lower pressures. By contrast, the influence of temperature is negligible. As temperatures increase from 4000 K to 7000 K, the density deficits remain essentially constant at both pressure levels. For instance, at 136 GPa, the density reduction for the composition with 10.3 wt.% Si varies only marginally from 9.57% to 9.65% across the 4000–7000 K range; similarly, at 330 GPa, the values remain stable between 9.09% and 9.13%. The results show that pressure, rather than temperature, primarily controls the magnitude of the Si-induced density deficit. When constrained by the PREM, our calculations suggest that a silicon content of 2.4–10.3 wt.% can account for the seismologically observed density deficit in the outer core with temperature from 4000 to 7000 K. The required silicon concentration falls within the permissible range of light elements (totaling ~10 wt.%) inferred for the outer core’s composition [1,26].
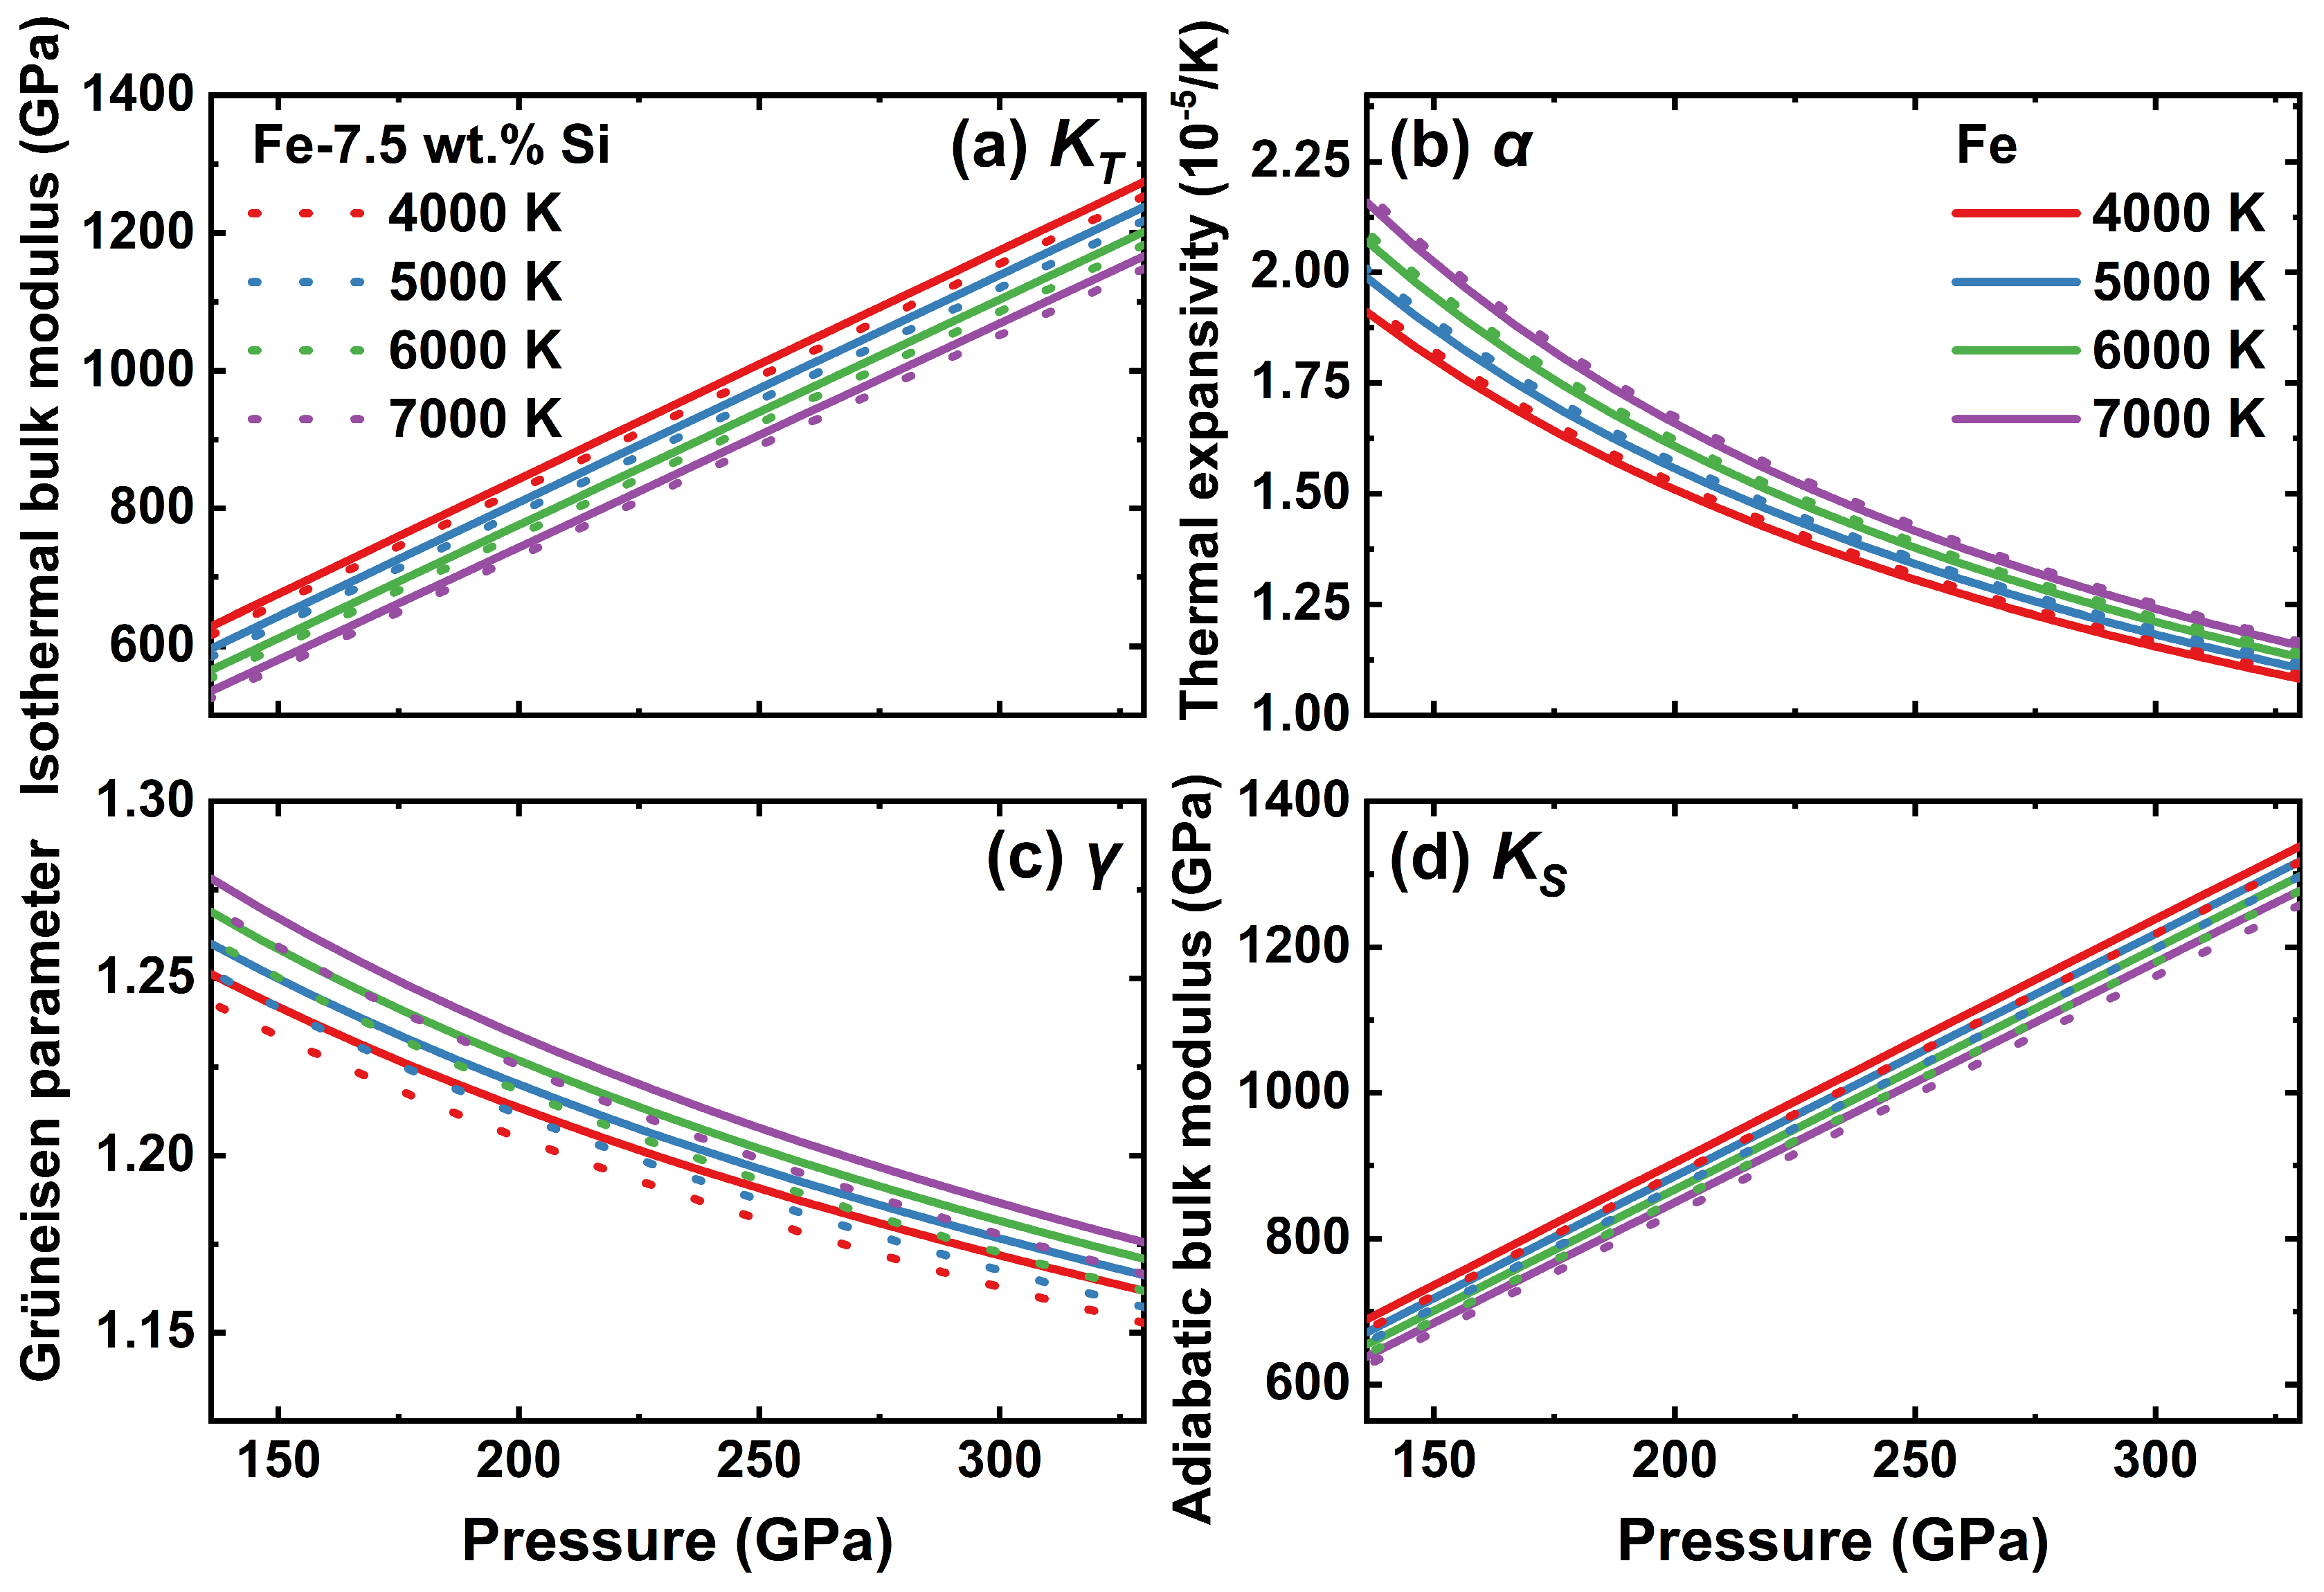
Next, we examine the influence of Si on the thermodynamic properties of liquid Fe-Si alloys under the outer core conditions, focusing on isothermal bulk modulus (KT), thermal expansion coefficient (α), Grüneisen parameter (γ), and adiabatic bulk modulus (Ks). These thermodynamic parameters are essential inputs for calculating the sound velocity of liquid Fe-Si alloys along the geotherm of the outer core. Notably, the impact of Si content on these properties has received limited attention. As an illustrative example, Figure 3 presents the thermodynamic properties of a liquid Fe-7.5 wt.% Si alloy compared with those of pure Fe across the pressure and temperature conditions of the outer core.
Isothermal bulk modulus, derived by K T = V P V T , closely relates to temperature and pressure (see Figure 3a), which has a negative correlation with temperature and a positive correlation with pressure. The addition of Si reduces the KT values compared to pure Fe at equal P and T. Distinct from KT, the addition of Si will increase the α values. Given by α = 1 K T P T V , the α of liquid Fe-7.5 wt.% Si is higher than that of liquid Fe (see Figure 3b) by 0.88% at 7000 K. As for the Grüneisen parameter γ ( V ) = γ 0 V V 0 b , the γ decreases with increasing pressure and increases with the increasing temperature. The γ values of Fe-7.5 wt.% Si are approximately 8.61 × 10⁻³ lower than those of pure Fe (see Figure 3c). Adiabatic bulk modulus derived by K S = 1 + α γ T K T , which is proportional to KT, shows a similar trend to that of KT. For instance, the KT of Fe-7.5 wt.% Si is about 1.71% lower than that of pure Fe at 7000 K, while the KS of the Fe-7.5 wt.% Si alloy shows a reduction of approximately 1.69% (see Figure 3d).
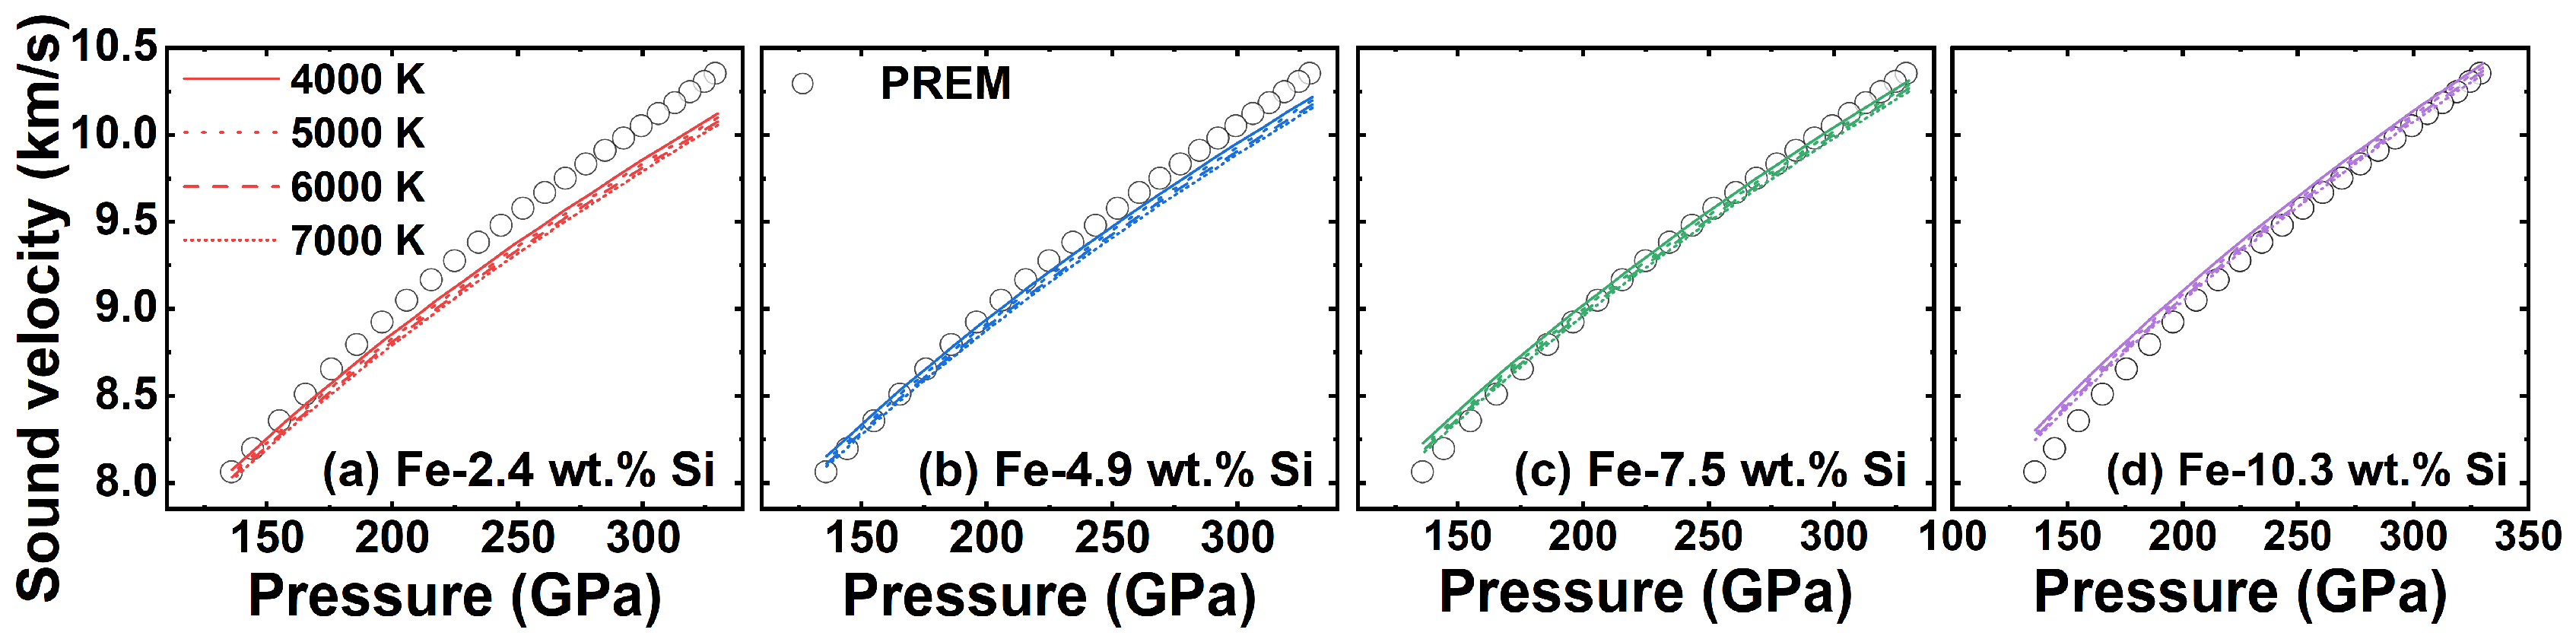
Based on the thermodynamic properties determined over a wide range of pressures and temperatures, the isothermal sound velocity of liquid Fe-Si alloys was calculated (Figure 4). The VP of liquid Fe-Si alloys shows a strong dependence on Si concentration. Under the Earth’s outer core pressures (136 GPa–330 GPa), the VP increases by approximately 3.84% as Si concentration elevates from 0 wt.% to 10.3 wt.% at 136 GPa and 7000 K. In comparison, the influence of temperature is negligible. For Fe-7.5 wt.% Si, increasing the temperature from 4000 K to 7000 K at 136 GPa results in a change of only 0.06 km/s in VP. To satisfy the sound velocity constraint of PREM, the required Si concentration ranges from approximately 2.4 wt.% to 10.3 wt.%.

3.3. Geophysical Implications

Since the relationship among pressure, density, and depth in the outer core has been well modeled by the PREM, the temperature–depth (or temperature–pressure) profile is not constrained [2]. The temperature profile along the geotherm of the outer core can be calculated by T = T ICB ( ρ ρ ICB ) γ th , where TICB and ρICB are the temperature and density at the inner core boundary (ICB). γth is the Grüneisen parameter calculated in this work. Due to the temperature at ICB (TICB) being poorly constrained, four anchor temperatures have been employed, namely, TICB = 4850 [52], 5400 [53], 6350 [54,55], and 6760 K [56]. The predicted adiabatic temperature profiles in the outer core are displayed in Figure S9 of the SI section.
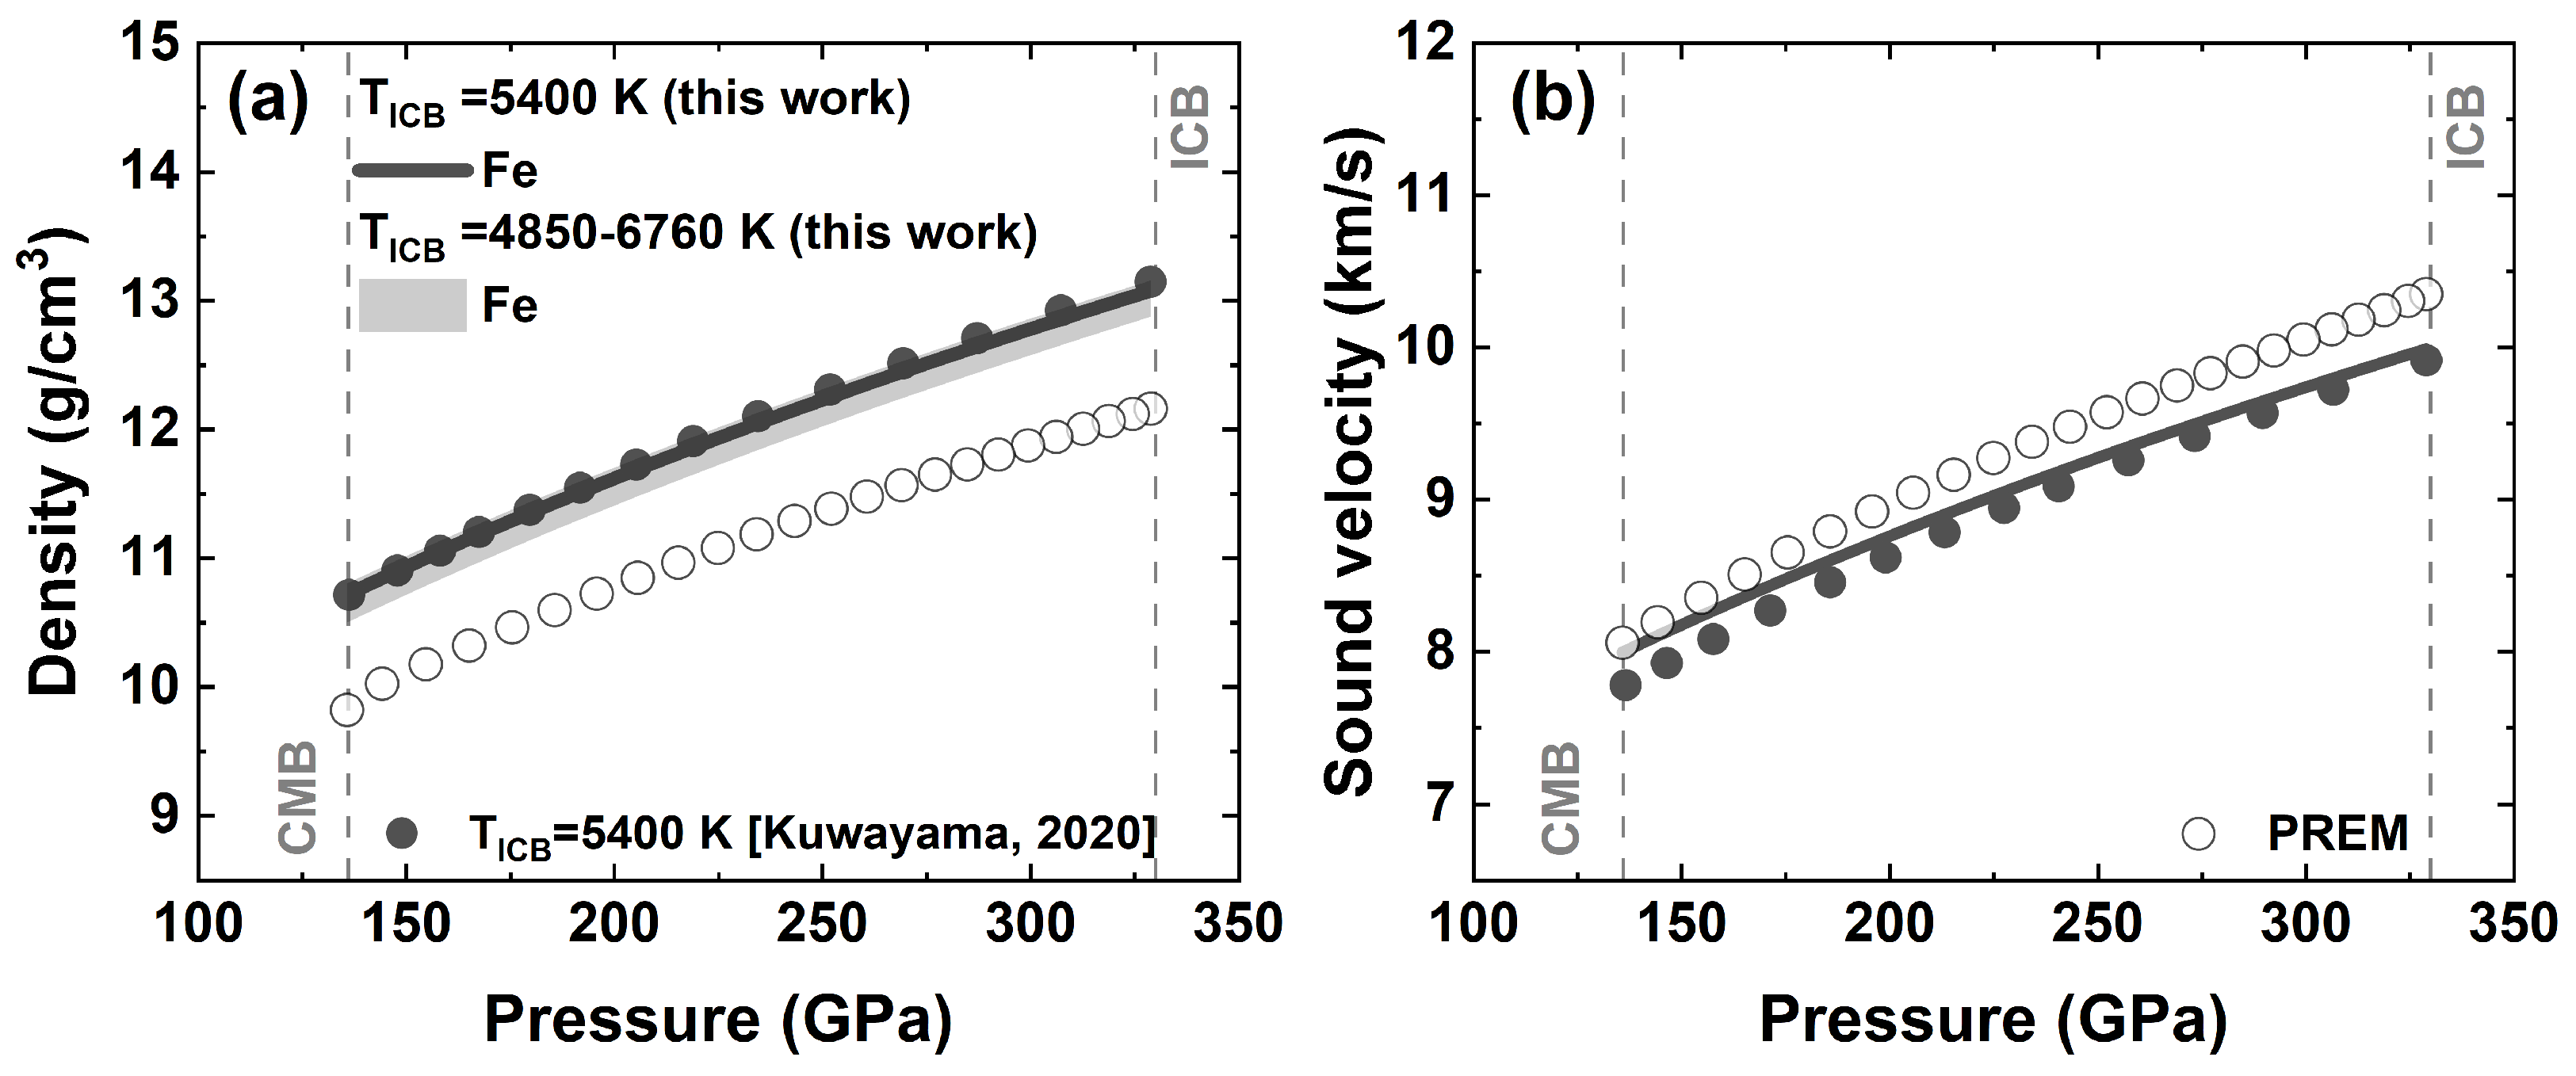
Firstly, we compared the ρ and VP of liquid Fe along the geotherm of the outer core with the PREM data, as well as the experimental results from Kuwayama et al. [28]. As shown in Figure 5a, the calculated ρ along the geotherm profile predicted with TICB = 5400 K is slightly lower than the experimental data [28] by 0.34%, and the calculated VP is approximately 1.40% higher. The calculated ρ and VP of liquid Fe along the geotherm now align excellently with the experimental results [28]. The existing deviations are probably attributed to errors introduced during extrapolation, since the pressure correction itself was calibrated against data below 116 GPa. Now, the density of liquid Fe is higher than the PREM value by about 7.76%. Meanwhile, the sound velocity of liquid Fe is approximately 2.63% lower than the PREM value. It is more reasonable than the data without pressure correction, which laid the foundation for estimating the Si content in the Earth’s outer core.
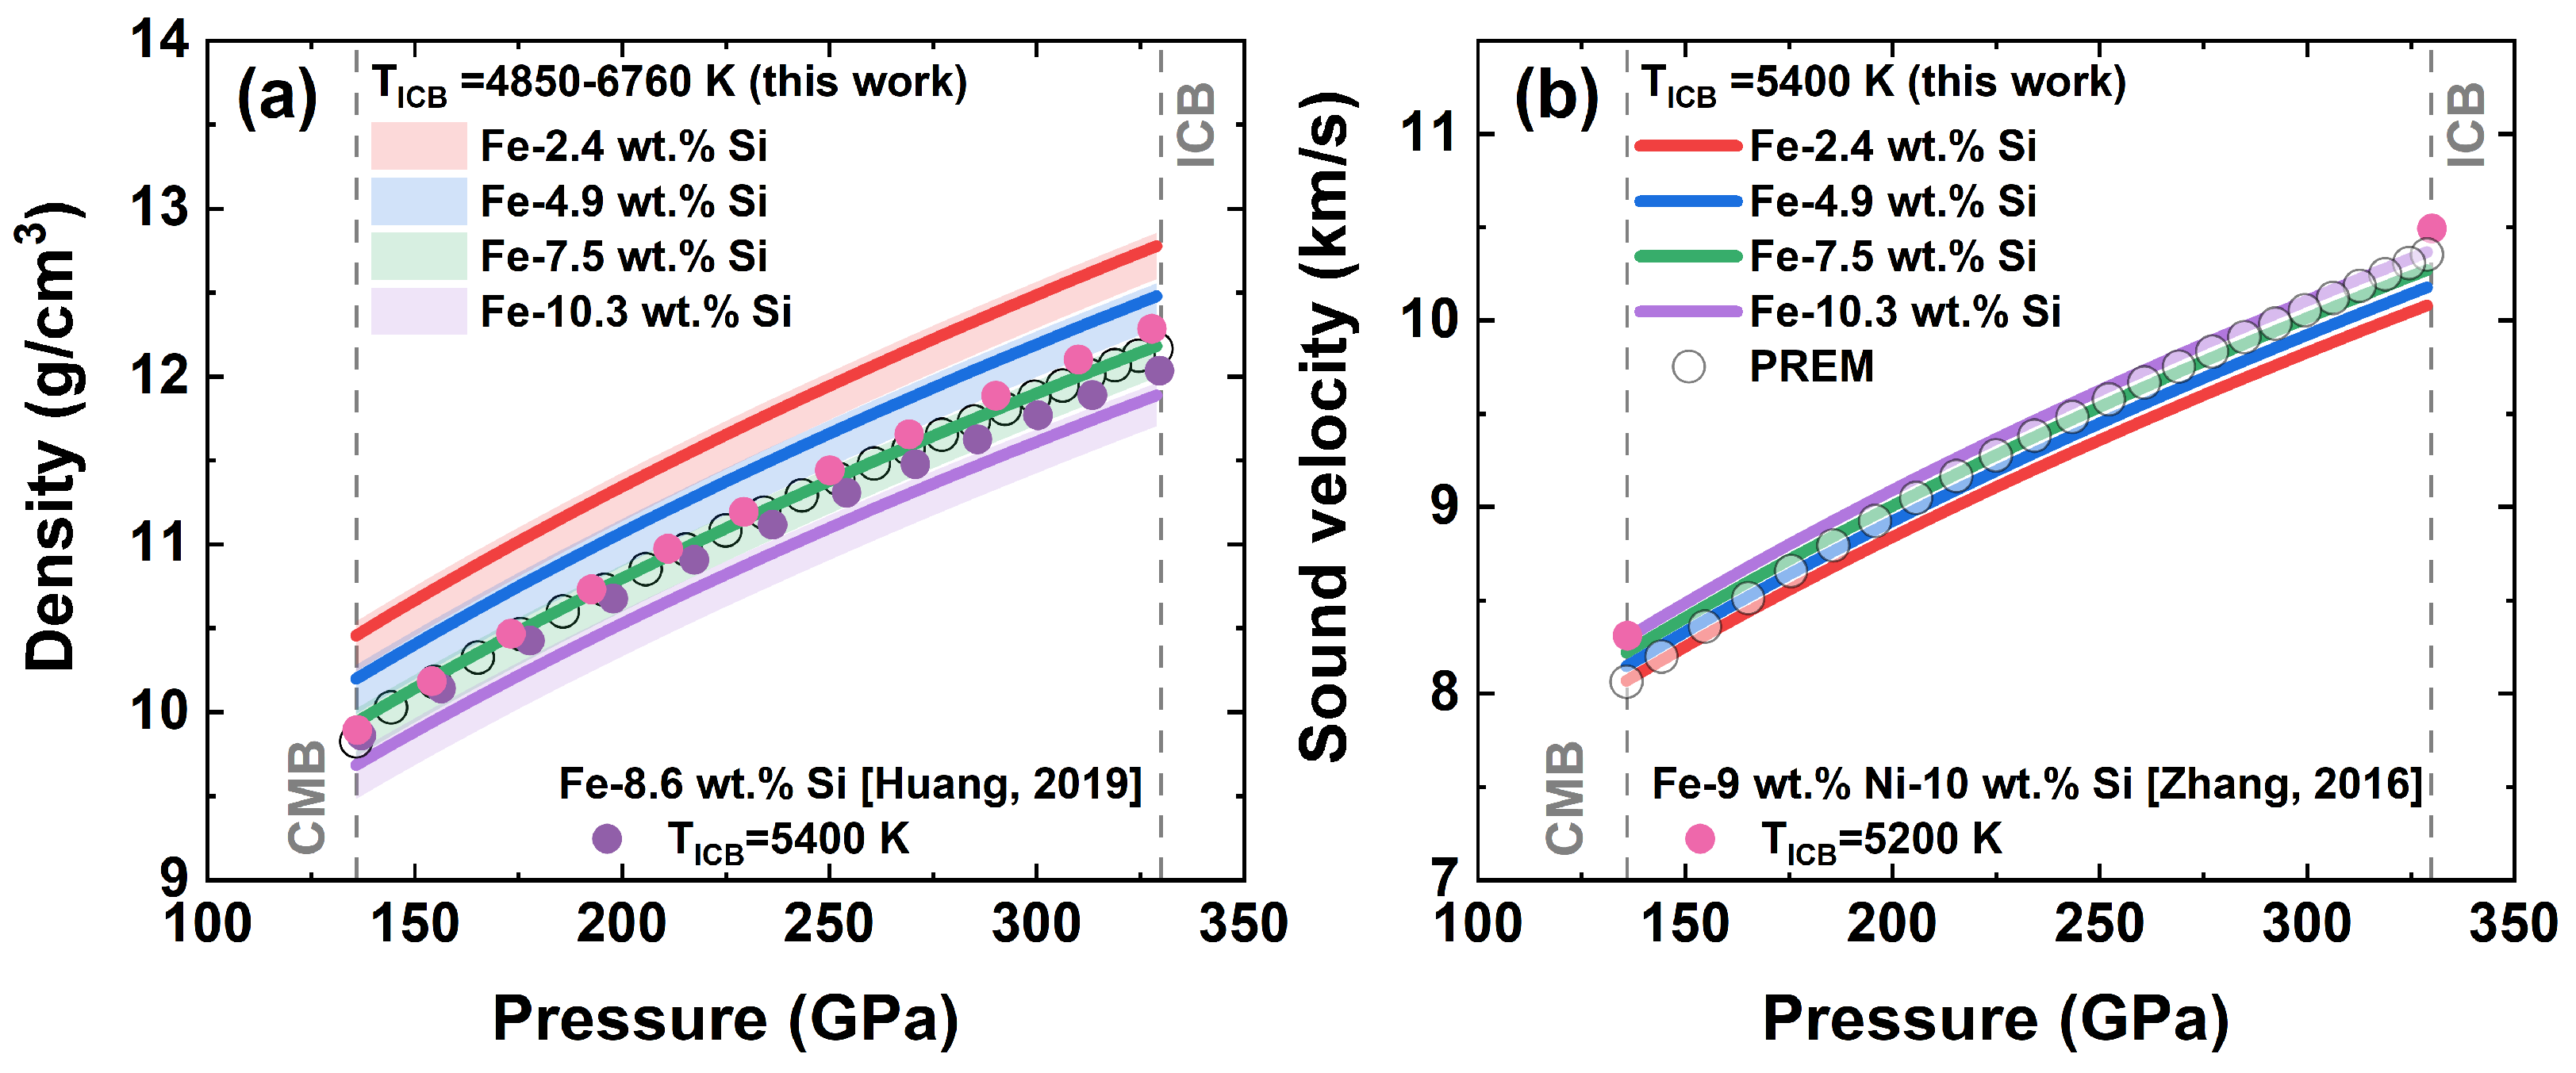
Afterwards, the density and sound velocity of liquid Fe-Si alloy along the geotherm are calculated to estimate the Si content in the outer core, as displayed in Figure 6. Our density profiles with TICB = 5400 K show an excellent agreement with shock-wave compression data [21]. The Fe-8.6 wt.% Si composition [21] lies between our predicted densities for Fe-7.5 wt.% Si and Fe-10.3 wt.% Si. Another shock-wave compression density of Fe-9 wt.% Ni-10 wt.% Si with TICB = 5200 K by Zhang et al. [22] is slightly higher than Fe-8.6 wt.% Si by Huang et al. [21], especially at high pressures. The observed inconsistency in shock-wave density may originate from experimental details, such as window equation of state parameters, impedance matching calculation methods, and the temperature anchor points used to extrapolate the shock Hugoniot data to the core geotherm. Meanwhile, the VP of Fe-10.3 wt.% Si with TICB = 5400 K is in good agreement with the experimental values of Fe-9 wt.% Ni-10 wt.% Si with TICB = 5200 K by shock-wave compression [22], given that Ni has a negligible effect on the sound velocity of liquid Fe alloys [57]. The close agreement with shock-wave compression results further validates the accuracy of our theoretical calculations of density and sound velocity for liquid Fe-Si following the pressure correction.
Furthermore, we studied the impact of Si content on the density and sound velocity of liquid Fe-Si alloys along the geotherm of the outer core. As shown in Figure 6a, the addition of Si significantly reduces the density of liquid Fe-Si alloys. With the increasing depth in the outer core, the ρ of PREM increases from 9.90 g/cm3 at the CMB to 12.17 g/cm3 at the ICB [2]. The addition of 7.5 wt.% Si (Fe-7.5 wt.% Si) with TICB = 5400 K is satisfied with regards to the density deficit, with a maximum deviation below 1.16%. If the temperature at ICB is higher than 5400 K, the required Si content will decrease, but it will not be less than 4.9 wt.%. Meanwhile, the Si content in the outer core cannot exceed 10.3 wt.% because the density of Fe-10.3 wt.% Si is lower than PREM densities. Considering density as the sole constraint, Huang et al. suggested that the maximum of 8.6 ± 2.0 wt.% Si in the liquid outer core [21] can match the PREM values, which is comparable to our predicted Si content combining density constraints (~7.5 wt.%) with TICB = 5400 K.
Regarding VP, the adiabatic temperature profiles exert only a marginal influence on the calculated VP of liquid Fe-Si alloys (see Figure 6b). But the effect of Si content on VP is apparent. The addition of Si can increase the VP considerably. PREM’s sound velocity profile is best matched by Fe-10.3 wt.% Si at ICB and by Fe-2.4 wt.% Si at CMB. Given the sound velocity constraint, the Si content required to match the PREM data is estimated to be approximately 2.4~10.3 wt.%. Assuming a homogeneously distributed outer core, the maximum Si content cannot exceed 2.4 wt.%, as it is constrained by the requirement to match the sound velocity at the CMB. Taking into account uncertainty sources from DFT calculations, pressure-correction fitting, EoS fitting, and geotherm temperature, it yields an uncertainty of ±1.7 wt.%. Recent metal–silicate partitioning of Si, O, and Mg at high pressures and temperatures reveals that the equilibrium Si concentration in silicate melts reaches 14.5 wt.%, which has exceeded the maximum number of light elements in the outer core [58].
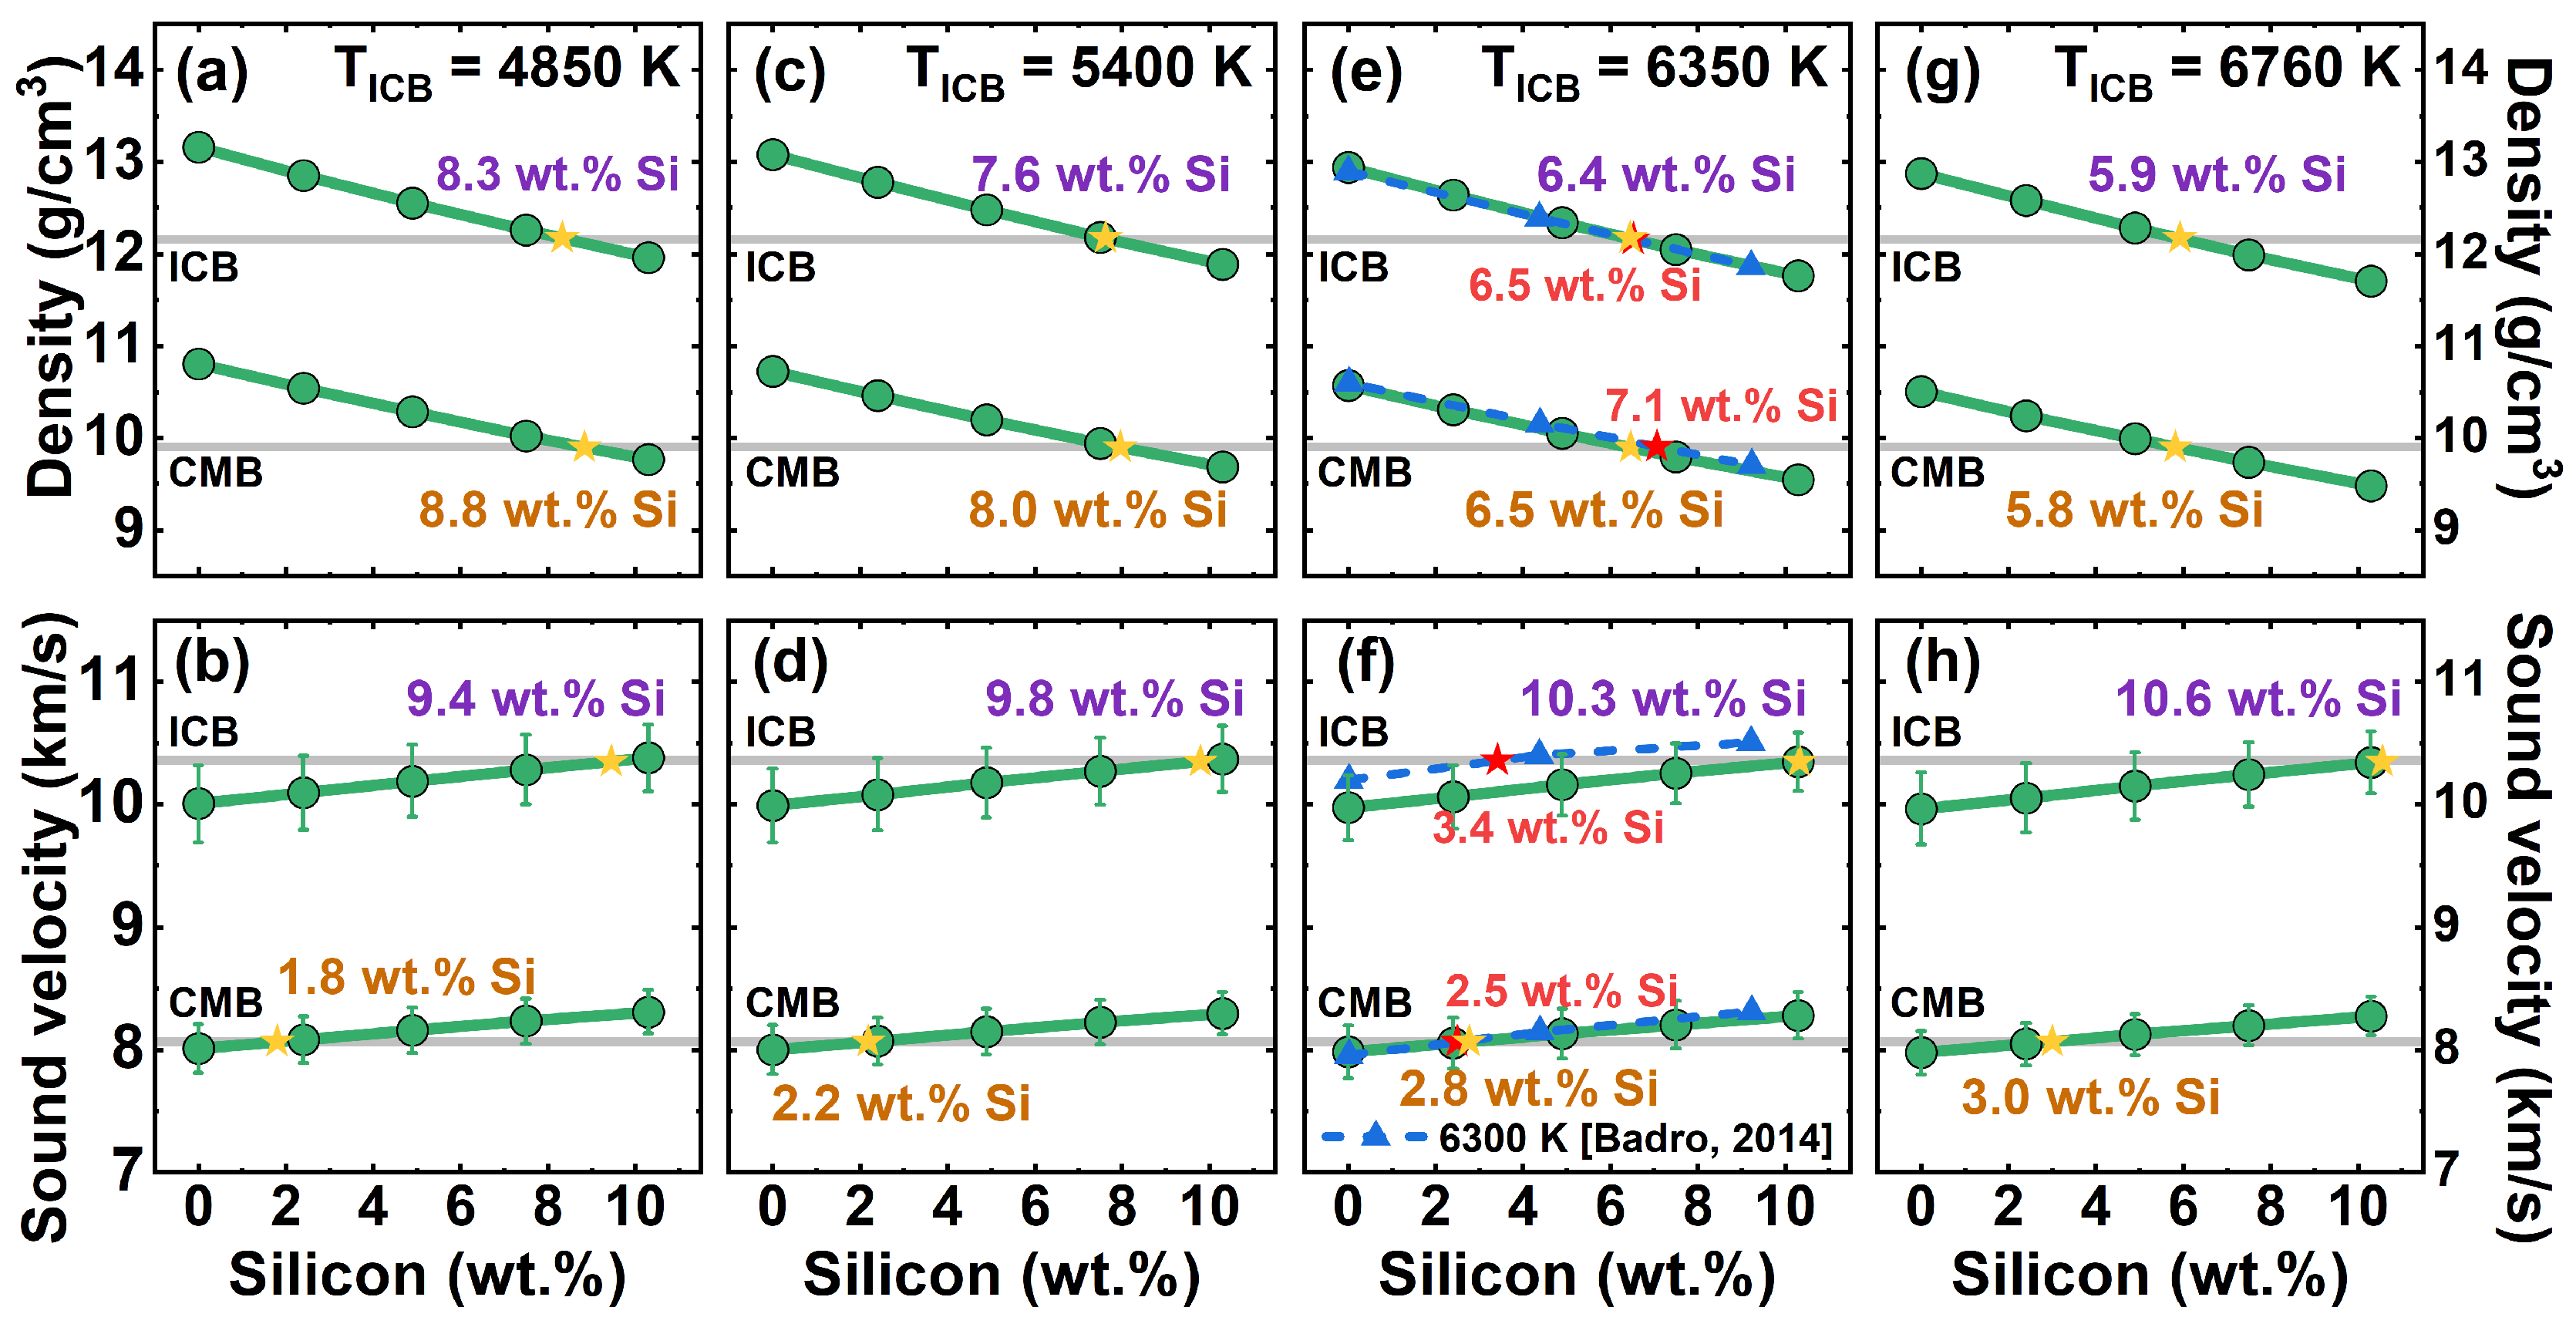
Finally, we explored the required Si content at ICB and CMB by establishing functional relationships between ρ or VP and Si concentration to match the density and sound velocity from PREM. As shown in Figure 7, ρ and VP exhibit compositional dependence. Higher silicon concentrations lead to reduced density but enhanced sound velocities, quantified by the derivatives d ρ d X S i < 0 , and d V P d X S i > 0 . As TICB increases from 4850 K to 6760 K, the Si content required to match the ICB density decreases from 8.3 to 5.9 wt.%. It should be noted that the range of Si content can largely satisfy the density requirement at the CMB (from 8.8 to 5.8 wt.%). To reconcile the sound velocity deficit, the Si content at the ICB is required to be 9.4~10.6 wt.% for TICB increases from 4850 to 5400 K. If TICB is higher than 6350 K, the Si content needs to be more than 10.3 wt.% to match the PREM sound velocity. But these values cannot satisfy the sound velocity deficit at the CMB with the required Si content of 1.8~3.0 wt.%. Remarkably, with TICB = 6350 K, the predicted Si concentrations to match PREM density are 6.4 wt.% and 6.5 wt.% at the ICB and CMB, respectively, and align with the reported values of 6.5 wt.% and 7.1 wt.% by Badro et al. [38]. But reproducing the sound velocity from PREM at the ICB requires a Si content of 10.3 wt.%, a value that is much higher than Badro’s result (3.4 wt.%), but at the CMB, the required Si content is 2.8 wt.% and is in excellent agreement with Badro’s result (2.5 wt.%).
The temperature uncertainty at the ICB causes the Si content required to match density at both the ICB and CMB to range from 5.8 to 8.3 wt.%, while the requirement for sound velocity spans 1.8 to 3.0 wt.%. Consequently, ICB temperature uncertainty introduces a variation of ~2.5 wt.% and ~1.2 wt.% in Si content estimations derived from density and sound velocity, respectively. Overview: no compositionally homogeneous Fe-Si alloy can satisfy both ρ and VP criteria at the ICB and CMB. Instead, this likely points to the presence of radial chemical stratification in the outer core. Recent studies suggest that light elements are not uniformly distributed in the outer core [59]. Thermodynamic calculations by Ganguly et al. [59] indicate a stratified structure at the top of the outer core. Further evidence comes from Zhang et al. [22], who proposed that the proportions of light elements may vary systematically with depth. Therefore, lower Si content may exist at the CMB, and higher Si content may exist at the ICB. The radial gradient provides a reasonable solution for reconciling the discrepancy between density and sound velocity constraints at different depths. Besides, multi-component models are further required to constrain the Si composition in the outer core.

4. Conclusions

In this work, we have applied pressure correction to the calculated pressures from first-principles molecular dynamics simulations to address the underestimation of pressures inherent in DFT calculations. We have established an equation of state for Fe-Si alloys up to 10.3 wt.% Si and calculated thermodynamic properties of liquid Fe-Si alloys under the Earth’s outer core conditions. The results indicate that the addition of Si can effectively decrease the density and increase the sound velocity of liquid Fe-Si alloys. To constrain the Si content in the Earth’s outer core, we indicated that the maximum Si content is about 2.4 ± 1.7 wt.% with TICB = 5400 K, assuming Si is the only light element in the Earth’s outer core. Considering the temperature uncertainty at ICB, the Si content ranges from 1.8 to 3.0 ± 1.7 wt.% with TICB from 4850 K to 6760 K. The Si content constrained by density differs significantly from that constrained by sound velocity. It potentially indicates that the distribution of Si in the outer core is heterogeneous, exhibiting some degree of radial stratification. Besides, the work also proves that pressure correction helps reduce the inconsistency between theoretical and experimental predictions of Si content in the outer core.
Meanwhile, due to the absence of experimental data on liquid Fe-Si alloys under the outer core conditions, the calculated pressures in this study have been calibrated against experimental measurements of pure liquid Fe at lower pressures and temperatures (<116 GPa and 4350 K). With future advances in experimental technology, direct pressure calibration using liquid Fe-Si data should yield more accurate results. Besides, the estimated Si content is only based on geophysical constraints. Incorporating constraints from geochemistry and meteoritics, as well as the presence of other light elements, the true silicon content in the outer core would be lower.

Supplementary Materials

The following supporting information can be downloaded at: https://www.mdpi.com/article/10.3390/min16060576/s1, Table S1. Experimental and calculated data for pressure correction. Table S2. Summary of symbols, meanings, and constant values used in the equation of state. Figure S1. Energy cutoff test in VASP setting. To determine the optimal cutoff energy for liquid Fe-Si, a coverage test was conducted. Finally, we set the cutoff value to 300 eV. Figure S2. Simulation cell test. The calculated pressures among Fe256, Fe108, and Fe32 are 273.19 GPa, 274.27 GPa, and 278.61 GPa, respectively. Figure S3. Radial distribution function of Fe-Fe, Fe-Si, and Si-Si pairs in liquid Fe88Si20 alloy at 165 GPa and 7000 K. Figure S4. Mean square displacements of Fe and Si atoms in liquid Fe88Si20 alloy at 165 GPa and 7000 K. Figure S5. Simulation time test. The simulation lengths for 10 ps, 20 ps, and 30 ps are represented by blue, red, and green curves, respectively. For a simulation time of 10 ps, the pressure average from 3 to 10 ps is 208.97 GPa; for 20 ps, the average from 10 to 20 ps is 209.38 GPa; and for 30 ps, the average from 10 to 30 ps is 209.06 GPa. The difference between the 10 ps and 20 ps averages is only 0.41 GPa, while that between 20 ps and 30 ps is merely 0.32 GPa. The results indicate that 20 ps is sufficient to reach equilibrium. Figure S6. Comparison of density (a) and sound velocity (b) of liquid Fe before pressure correction with previous calculations [5,28,29,39]. In this study, the isothermal ρ-P and VP-P relationships at 4000 K, 5000 K, 6000 K, and 7000 K are represented by solid black, blue, orange, and green lines, respectively. The solid circles are Kuwayama’s shock compression experimental data [28]. The short-dashed line represents Vočadlo’s FP-MD data [39]. The dashed line represents Umemoto’s FP-MD data [29]. The purple dot–dashed line represents Ichikawa’s FP-MD data at 6000 K [5]. Figure S7. Pressure correction of liquid Fe as a function of density with the French–Mattsson formula. The empty diamond symbols represent the pressure differences between theory and experiment, and the red dashed line represents the French–Mattsson curve fitted in this work. The pressure offset adjusted to theoretical pressures at 4000 K is shown as an example with filled squares. Figure S8. Comparison of adjusted DFT pressures and DAC extrapolation data [28] of liquid iron. Figure S9. Adiabatic temperature profiles with TICB = 4850, 5400, 6350, and 6760 K.

Author Contributions

Conceptualization, J.F.; Methodology, L.J. and J.F.; Validation, L.J.; Data curation, L.J., M.X. and J.F.; Writing – original draft, L.J.; Writing – review & editing, L.J. and J.F.; Supervision, A.B.B.; Project administration, J.F.; Funding acquisition, J.F. All authors have read and agreed to the published version of the manuscript.

Funding

This study was financially supported by the National Key Research and Development Program of China (Grant No. 2023YFA1406200), the National Natural Science Foundation of China (NSFC) (Grant No. 11804175), the Program for Science and Technology Innovation Team in Zhejiang (Grant No. 2021R01004), the Natural Science Foundation of Ningbo (Grant Nos. 2021J099, 2024J093), and the K.C. Wong Magna Foundation in Ningbo University. A.B.B. acknowledges financial support from Nanjing University.

Data Availability Statement

Pressure–volume–temperature data obtained from first-principles molecular dynamics simulations have been uploaded as a separate Supplementary File named “FP-MD data.xls”, which is accessible in the Supplementary Materials of this submission.

Acknowledgments

We are grateful for the financial support provided by the funding agencies. Technical assistance from our colleagues is sincerely appreciated. We also thank the editors and reviewers for their valuable comments that improved the manuscript.

Conflicts of Interest

The authors declare no conflict of interest.

References

  1. Birch, F. Elasticity and constitution of the Earth’s interior. J. Geophys. Res. 1952, 57, 227–286. [Google Scholar] [CrossRef]
  2. Dziewonski, A.M.; Anderson, D.L. Preliminary reference Earth model. Phys. Earth Planet. Inter. 1981, 25, 297–356. [Google Scholar] [CrossRef]
  3. Anderson, W.W.; Ahrens, T.J. An equation of state for liquid iron and implications for the Earth’s core. J. Geophys. Res. Solid Earth 1994, 99, 4273–4284. [Google Scholar] [CrossRef]
  4. Dewaele, A.; Loubeyre, P.; Occelli, F.; Mezouar, M.; Dorogokupets, P.I.; Torrent, M. Quasihydrostatic Equation of State of Iron above 2 Mbar. Phys. Rev. Lett. 2006, 97, 215504. [Google Scholar] [CrossRef]
  5. Ichikawa, H.; Tsuchiya, T.; Tange, Y. The P-V-T equation of state and thermodynamic properties of liquid iron. J. Geophys. Res. Solid Earth 2014, 119, 240–252. [Google Scholar] [CrossRef]
  6. Birch, F. Finite Elastic Strain of Cubic Crystals. Phys. Rev. 1947, 71, 809–824. [Google Scholar] [CrossRef]
  7. Fischer, R.A.; Nakajima, Y.; Campbell, A.J.; Frost, D.J.; Harries, D.; Langenhorst, F.; Miyajima, N.; Pollok, K.; Rubie, D.C. High pressure metal–silicate partitioning of Ni, Co, V, Cr, Si, and O. Geochim. Cosmochim. Acta 2015, 167, 177–194. [Google Scholar] [CrossRef]
  8. Rubie, D.C.; Frost, D.J.; Mann, U.; Asahara, Y.; Nimmo, F.; Tsuno, K.; Kegler, P.; Holzheid, A.; Palme, H. Heterogeneous accretion, composition and core–mantle differentiation of the Earth. Earth Planet. Sci. Lett. 2011, 301, 31–42. [Google Scholar] [CrossRef]
  9. Rubie, D.C.; Jacobson, S.A.; Morbidelli, A.; O’Brien, D.P.; Young, E.D.; de Vries, J.; Nimmo, F.; Palme, H.; Frost, D.J. Accretion and differentiation of the terrestrial planets with implications for the compositions of early-formed Solar System bodies and accretion of water. Icarus 2015, 248, 89–108. [Google Scholar] [CrossRef]
  10. Wood, B.J.; Wade, J.; Kilburn, M.R. Core formation and the oxidation state of the Earth: Additional constraints from Nb, V and Cr partitioning. Geochim. Cosmochim. Acta 2008, 72, 1415–1426. [Google Scholar] [CrossRef]
  11. Wade, J.; Wood, B.J. Core formation and the oxidation state of the Earth. Earth Planet. Sci. Lett. 2005, 236, 78–95. [Google Scholar] [CrossRef]
  12. Ricolleau, A.; Fei, Y.; Corgne, A.; Siebert, J.; Badro, J. Oxygen and silicon contents of Earth’s core from high pressure metal–silicate partitioning experiments. Earth Planet. Sci. Lett. 2011, 310, 409–421. [Google Scholar] [CrossRef]
  13. Ringwood, A.E. Significance of the terrestrial Mg/Si ratio. Earth Planet. Sci. Lett. 1989, 95, 1–7. [Google Scholar] [CrossRef]
  14. Ringwood, A.E. On the chemical evolution and densities of the planets. Geochim. Cosmochim. Acta 1959, 15, 257–283. [Google Scholar] [CrossRef]
  15. Allègre, C.J.; Poirier, J.-P.; Humler, E.; Hofmann, A.W. The chemical composition of the Earth. Earth Planet. Sci. Lett. 1995, 134, 515–526. [Google Scholar] [CrossRef]
  16. Armytage, R.M.G.; Georg, R.B.; Savage, P.S.; Williams, H.M.; Halliday, A.N. Silicon isotopes in meteorites and planetary core formation. Geochim. Cosmochim. Acta 2011, 75, 3662–3676. [Google Scholar] [CrossRef]
  17. Chakrabarti, R.; Jacobsen, S.B. Silicon isotopes in the inner Solar System: Implications for core formation, solar nebular processes and partial melting. Geochim. Cosmochim. Acta 2010, 74, 6921–6933. [Google Scholar] [CrossRef]
  18. McDonough, W. Compositional Model for the Earth’s Core. Treatise Geochem. 2003, 2, 547–568. [Google Scholar] [CrossRef]
  19. Shahar, A.; Ziegler, K.; Young, E.D.; Ricolleau, A.; Schauble, E.A.; Fei, Y. Experimentally determined Si isotope fractionation between silicate and Fe metal and implications for Earth’s core formation. Earth Planet. Sci. Lett. 2009, 288, 228–234. [Google Scholar] [CrossRef]
  20. Siebert, J.; Badro, J.; Antonangeli, D.; Ryerson, F.J. Terrestrial Accretion Under Oxidizing Conditions. Science 2013, 339, 1194–1197. [Google Scholar] [CrossRef]
  21. Huang, H.; Leng, C.; Wang, Q.; Young, G.; Liu, X.; Wu, Y.; Xu, F.; Fei, Y. Equation of State for Shocked Fe-8.6 wt% Si up to 240 GPa and 4,670 K. J. Geophys. Res. Solid Earth 2019, 124, 8300–8312. [Google Scholar] [CrossRef]
  22. Zhang, Y.; Sekine, T.; He, H.; Yu, Y.; Liu, F.; Zhang, M. Experimental constraints on light elements in the Earth’s outer core. Sci. Rep. 2016, 6, 22473. [Google Scholar] [CrossRef]
  23. Fischer, R.A.; Campbell, A.J.; Caracas, R.; Reaman, D.M.; Dera, P.; Prakapenka, V.B. Equation of state and phase diagram of Fe–16Si alloy as a candidate component of Earth’s core. Earth Planet. Sci. Lett. 2012, 357–358, 268–276. [Google Scholar] [CrossRef]
  24. Fischer, R.A.; Campbell, A.J.; Caracas, R.; Reaman, D.M.; Heinz, D.L.; Dera, P.; Prakapenka, V.B. Equations of state in the Fe-FeSi system at high pressures and temperatures. J. Geophys. Res. Solid Earth 2014, 119, 2810–2827. [Google Scholar] [CrossRef]
  25. Fischer, R.A.; Campbell, A.J.; Reaman, D.M.; Miller, N.A.; Heinz, D.L.; Dera, P.; Prakapenka, V.B. Phase relations in the Fe–FeSi system at high pressures and temperatures. Earth Planet. Sci. Lett. 2013, 373, 54–64. [Google Scholar] [CrossRef]
  26. Helffrich, G. How light element addition can lower core liquid wave speeds. Geophys. J. Int. 2012, 188, 1065–1070. [Google Scholar] [CrossRef][Green Version]
  27. Brown, J.M.; McQueen, R.G. Phase transitions, Grüneisen parameter, and elasticity for shocked iron between 77 GPa and 400 GPa. J. Geophys. Res. Solid Earth 1986, 91, 7485–7494. [Google Scholar] [CrossRef]
  28. Kuwayama, Y.; Morard, G.; Nakajima, Y.; Hirose, K.; Baron, A.Q.R.; Kawaguchi, S.I.; Tsuchiya, T.; Ishikawa, D.; Hirao, N.; Ohishi, Y. Equation of State of Liquid Iron under Extreme Conditions. Phys. Rev. Lett. 2020, 124, 165701. [Google Scholar] [CrossRef] [PubMed]
  29. Umemoto, K.; Hirose, K. Chemical compositions of the outer core examined by first principles calculations. Earth Planet. Sci. Lett. 2020, 531, 116009. [Google Scholar] [CrossRef]
  30. Liu, W.; Asimow, P.D. Thermodynamic Properties of Liquid Metal Using First-Principles Molecular Dynamics: Implications for the Compositional and Thermal State of the Earth’s Outer Core. J. Geophys. Res. Solid Earth 2025, 130, e2024JB030419. [Google Scholar] [CrossRef]
  31. French, M.; Mattsson, T.R. Thermodynamically constrained correction to ab initio equations of state. J. Appl. Phys. 2014, 116, 013510. [Google Scholar] [CrossRef]
  32. Kresse, G.; Furthmüller, J. Efficient iterative schemes for ab initio total-energy calculations using a plane-wave basis set. Phys. Rev. B 1996, 54, 11169–11186. [Google Scholar] [CrossRef] [PubMed]
  33. Kresse, G.; Hafner, J. Ab initio molecular dynamics for liquid metals. Phys. Rev. B 1993, 47, 558–561. [Google Scholar] [CrossRef]
  34. Perdew, J.P.; Burke, K.; Ernzerhof, M. Generalized Gradient Approximation Made Simple. Phys. Rev. Lett. 1996, 77, 3865–3868. [Google Scholar] [CrossRef]
  35. Mermin, N.D. Thermal Properties of the Inhomogeneous Electron Gas. Phys. Rev. 1965, 137, A1441–A1443. [Google Scholar] [CrossRef]
  36. Nosé, S. A unified formulation of the constant temperature molecular dynamics methods. J. Chem. Phys. 1984, 81, 511–519. [Google Scholar] [CrossRef]
  37. Edgington, A.L.; Vočadlo, L.; Stixrude, L.; Wood, I.G.; Dobson, D.P.; Holmström, E. The top-down crystallisation of Mercury’s core. Earth Planet. Sci. Lett. 2019, 528, 115838. [Google Scholar] [CrossRef]
  38. Badro, J.; Côté, A.S.; Brodholt, J.P. A seismologically consistent compositional model of Earth’s core. Proc. Natl. Acad. Sci. 2014, 111, 7542–7545. [Google Scholar] [CrossRef]
  39. Vočadlo, L.; Alfè, D.; Gillan, M.J.; Price, G.D. The properties of iron under core conditions from first principles calculations. Phys. Earth Planet. Inter. 2003, 140, 101–125. [Google Scholar] [CrossRef]
  40. Alfè, D.; Kresse, G.; Gillan, M.J. Structure and dynamics of liquid iron under Earth’s core conditions. Phys. Rev. B 2000, 61, 132–142. [Google Scholar] [CrossRef]
  41. Wagle, F.; Steinle-Neumann, G. Liquid Iron Equation of State to the Terapascal Regime From Ab Initio Simulations. J. Geophys. Res. Solid Earth 2019, 124, 3350–3364. [Google Scholar] [CrossRef]
  42. Satyal, S.; Wang, J. Structure and Non-Ideal Mixing of Fe-Ni-S Liquid at High Temperature and Pressure and Its Implication for the Earth’s Outer Core Composition. J. Geophys. Res. Solid Earth 2024, 129, e2024JB029436. [Google Scholar] [CrossRef]
  43. Murnaghan, F.D. The Compressibility of Media under Extreme Pressures. Proc. Natl. Acad. Sci. 1944, 30, 244–247. [Google Scholar] [CrossRef]
  44. Huang, D.; Badro, J.; Brodholt, J.; Li, Y. Ab Initio Molecular Dynamics Investigation of Molten Fe–Si–O in Earth’s Core. Geophys. Res. Lett. 2019, 46, 6397–6405. [Google Scholar] [CrossRef]
  45. Xie, M.; Fu, J.; Belonoshko, A.B. Equation of state and thermodynamic properties of liquid Fe-O in the Earth’s outer core. Geosci. Front. 2025, 16, 101847. [Google Scholar] [CrossRef]
  46. Komabayashi, T. Thermodynamics of the system Fe–Si–O under high pressure and temperature and its implications for Earth’s core. Phys. Chem. Miner. 2020, 47, 32. [Google Scholar] [CrossRef]
  47. Dorogokupets, P.I.; Dymshits, A.M.; Litasov, K.D.; Sokolova, T.S. Thermodynamics and Equations of State of Iron to 350 GPa and 6000 K. Sci. Rep. 2017, 7, 41863. [Google Scholar] [CrossRef]
  48. Young, G.; Fan, L.; Zhao, B.; Chen, X.; Liu, X.; Huang, H. Equation of State for Fe-9.0 wt% O up to 246 GPa: Implications for Oxygen in the Earth’s Outer Core. J. Geophys. Res. Solid Earth 2021, 126, e2020JB021056. [Google Scholar] [CrossRef]
  49. Fu, J.; Cao, L.; Duan, X.; Belonoshko, A.B. Density and sound velocity of liquid Fe-S alloys at Earth’s outer core P-T conditions. Am. Mineral. 2020, 105, 1349–1354. [Google Scholar] [CrossRef]
  50. Umemoto, K.; Hirose, K.; Imada, S.; Nakajima, Y.; Komabayashi, T.; Tsutsui, S.; Baron, A.Q.R. Liquid iron-sulfur alloys at outer core conditions by first-principles calculations. Geophys. Res. Lett. 2014, 41, 6712–6717. [Google Scholar] [CrossRef]
  51. Bajgain, S.K.; Mookherjee, M.; Dasgupta, R. Earth’s core could be the largest terrestrial carbon reservoir. Commun. Earth Environ. 2021, 2, 165. [Google Scholar] [CrossRef]
  52. Boehler, R. Temperatures in the Earth’s core from melting-point measurements of iron at high static pressures. Nature 1993, 363, 534–536. [Google Scholar] [CrossRef]
  53. Laio, A.; Bernard, S.; Chiarotti, G.L.; Scandolo, S.; Tosatti, E. Physics of Iron at Earth’s Core Conditions. Science 2000, 287, 1027–1030. [Google Scholar] [CrossRef]
  54. Alfè, D. Temperature of the inner-core boundary of the Earth: Melting of iron at high pressure from first-principles coexistence simulations. Phys. Rev. B 2009, 79, 060101. [Google Scholar] [CrossRef]
  55. Anzellini, S.; Dewaele, A.; Mezouar, M.; Loubeyre, P.; Morard, G. Melting of Iron at Earth’s Inner Core Boundary Based on Fast X-ray Diffraction. Science 2013, 340, 464–466. [Google Scholar] [CrossRef] [PubMed]
  56. González-Cataldo, F.; Militzer, B. Ab initio determination of iron melting at terapascal pressures and Super-Earths core crystallization. Phys. Rev. Res. 2023, 5, 033194. [Google Scholar] [CrossRef]
  57. Badro, J.; Fiquet, G.; Guyot, F.; Gregoryanz, E.; Occelli, F.; Antonangeli, D.; d’Astuto, M. Effect of light elements on the sound velocities in solid iron: Implications for the composition of Earth’s core. Earth Planet. Sci. Lett. 2007, 254, 233–238. [Google Scholar] [CrossRef]
  58. Pu, C.; Gao, X.; Wu, Z.; Du, Z.; Jing, Z. Metal-Silicate Partitioning of Si, O, and Mg at High Pressures and High Temperatures: Implications to the Compositional Evolution of Core-Forming Metallic Melts. Geochem. Geophys. Geosys. 2025, 26, e2024GC011940. [Google Scholar] [CrossRef]
  59. Ganguly, J. Thermodynamics of light elements stratification in the earth’s outer core and implications. Earth Planet. Sci. Lett. 2025, 659, 119333. [Google Scholar] [CrossRef]
Figure 1. The comparison of calculated density (ρ) and (VP) of liquid Fe with experimental data. In this study, the isothermal ρ-P and VP-P relationships at 4000, 5000, 6000, and 7000 K are represented by solid black, blue, orange, and green lines, respectively. (a) Black and blue circles represent the data derived from the parameterized equation of state (EoS) at 4000 K and 5000 K in static compression experiments [28], respectively. (b) The star symbol represents the shock-wave compression data [27].
Minerals 16 00576 g001
Figure 2. Isothermal density profiles of liquid Fe and Fe-Si alloys with pressures. The pink pentagram and orange pentagram represent the density curves from the shock-wave compression experiments by Huang et al. at 4000 K and 5200 K, respectively [21]. The circle symbols represent the density from PREM [2].
Minerals 16 00576 g002
Figure 3. Thermodynamic properties, including isothermal bulk modulus (KT), thermal expansion coefficient (α), Grüneisen parameter (γ), and adiabatic bulk modulus (Ks) between liquid Fe and liquid Fe-7.5 wt.% Si. The dotted lines represent Fe-7.5 wt.% Si, while the solid lines denote liquid Fe.
Minerals 16 00576 g003
Figure 4. The isothermal sound velocity of liquid Fe-Si alloy. The considered Si contents are Fe-2.4 wt.% Si (red), Fe-4.9 wt.% Si (blue), Fe-7.5 wt.% Si (green), and Fe-10.3 wt.% Si (purple). The data curves are at 4000 K (solid lines), 5000 K (dotted line), 6000 K (dashed line), and 7000 K (short dash–dot line). PREM (open circles) [2] is included for comparison.
Minerals 16 00576 g004
Figure 5. (a) The density of liquid Fe as a function of pressure along the geotherm of the outer core. (b) The sound velocity of liquid Fe as a function of pressure. The data from Kuwayama et al. are included for comparison [28].
Minerals 16 00576 g005
Figure 6. Density (ρ) and sound velocity (VP) of liquid Fe-Si alloys as a function of P along the geotherm of the Earth’s outer core. (a) ρ-P and (b) VP-P relations plotted along adiabatic P-T profiles. In this work, distinct colors represent XSi contents of 2.4 wt.% (red), 4.9 wt.% (blue), 7.5 wt.% (green), and 10.3 wt.% (purple). The solid line represents data for TICB = 5400 K. The pink circle denotes the shock-compression data for Fe-9 wt.% Ni-10 wt.% Si after application of thermal corrections to the adiabatic core geotherm anchored at TICB = 5200 K [22]. The purple circle represents the Fe-8.6 wt.% Si data obtained at TICB = 5400 K; these values were derived by extrapolating shock-compression measurements [21]. Open circles represent PREM data [2].
Minerals 16 00576 g006
Figure 7. Prediction of Si concentration at the inner core boundary (ICB) and core–mantle boundary (CMB) with different anchored temperatures at the ICB. Green solid lines represent correlations of ρ or VP with XSi. Gray horizontal lines indicate PREM reference values for ρ and VP at corresponding boundaries. Subplot panels (a,b), (c,d), (e,f) and (g,h) sequentially display these parameters relationships along geotherms anchored with TICB = 4850, 5400, 6350, and 6760 K, respectively. Blue triangular symbols in panels (e,f) represent data from Badro et al. with TICB = 6300 K [38].
Minerals 16 00576 g007
Table 1. EoS parameters of liquid Fe-Si. The pressure uncertainty of the EoS fitting is about 0.36%.
ParametersValue
K T 0 F e (GPa)93.00
K T 0 S i (GPa)57.31
K T 0 F e 3.25
K T 0 S i 2.97
V 0 F e (cm3/mol)9.45
V 0 S i (cm3/mol)10.93
e 0 (10−16/K)3.62
g −2.00
γ 0 1.54
b 0.35
Disclaimer/Publisher’s Note: The statements, opinions and data contained in all publications are solely those of the individual author(s) and contributor(s) and not of MDPI and/or the editor(s). MDPI and/or the editor(s) disclaim responsibility for any injury to people or property resulting from any ideas, methods, instructions or products referred to in the content.