Article

Age of Ore Formation in the Ailinwudui Gold Deposit, Central Jilin, NE China: Geochronological Data and Metallogenic Insights

1
Harbin Center for Integrated Natural Resources Survey, China Geological Survey, Harbin 150086, China
2
Observation and Research Station of Earth Critical Zone in Black Soil, Ministry of Natural Resources, Harbin 150086, China
3
School of Earth Sciences and Resources, China University of Geosciences (Beijing), Beijing 100083, China
*
Author to whom correspondence should be addressed.
Minerals 2026, 16(5), 469; https://doi.org/10.3390/min16050469
Submission received: 23 March 2026 / Revised: 28 April 2026 / Accepted: 28 April 2026 / Published: 30 April 2026

Abstract

The Ailinwudui gold deposit is located in central Jilin Province and represents a newly discovered typical vein-type gold deposit hosted in a Paleozoic metamorphic rock series in recent years. At present, the metallogenic epoch and regional metallogenic tectonic setting of the deposit remain poorly constrained, which seriously restricts the understanding of gold metallogenic regularities and subsequent mineral exploration deployment in central Jilin. Previous studies indicate that the Ailinwudui gold deposit is a structurally controlled vein-type gold deposit. In this study, zircon U-Pb and muscovite 40Ar/39Ar geo-chronology were employed to precisely constrain the metallogenic timing of the gold mineralization. Zircon U-Pb dating yields an emplacement age of 174.7 ± 0.85 Ma for the granodiorite and a formation age of 209.5 ± 1.40 Ma for the rhyolite porphyry. Muscovite 40Ar/39Ar dating yields a plateau age of 180.39 ± 1.83 Ma, which confines the gold mineralization to the Early–Middle Jurassic. Whole-rock geochemical results reveal that the granitoids in the study area are enriched in large-ion lithophile elements (LILEs) and light rare earth elements (LREEs) and depleted in high-field-strength elements (HFSEs), showing typical arc-related magmatic affinities. The formation of this gold deposit is related to the subduction of the Paleo-Pacific Plate during the Early–Middle Jurassic. The research results can provide important geochronological and geochemical evidence for the study of gold metallogenic mechanisms and mineral exploration in central Jilin Province.

1. Introduction

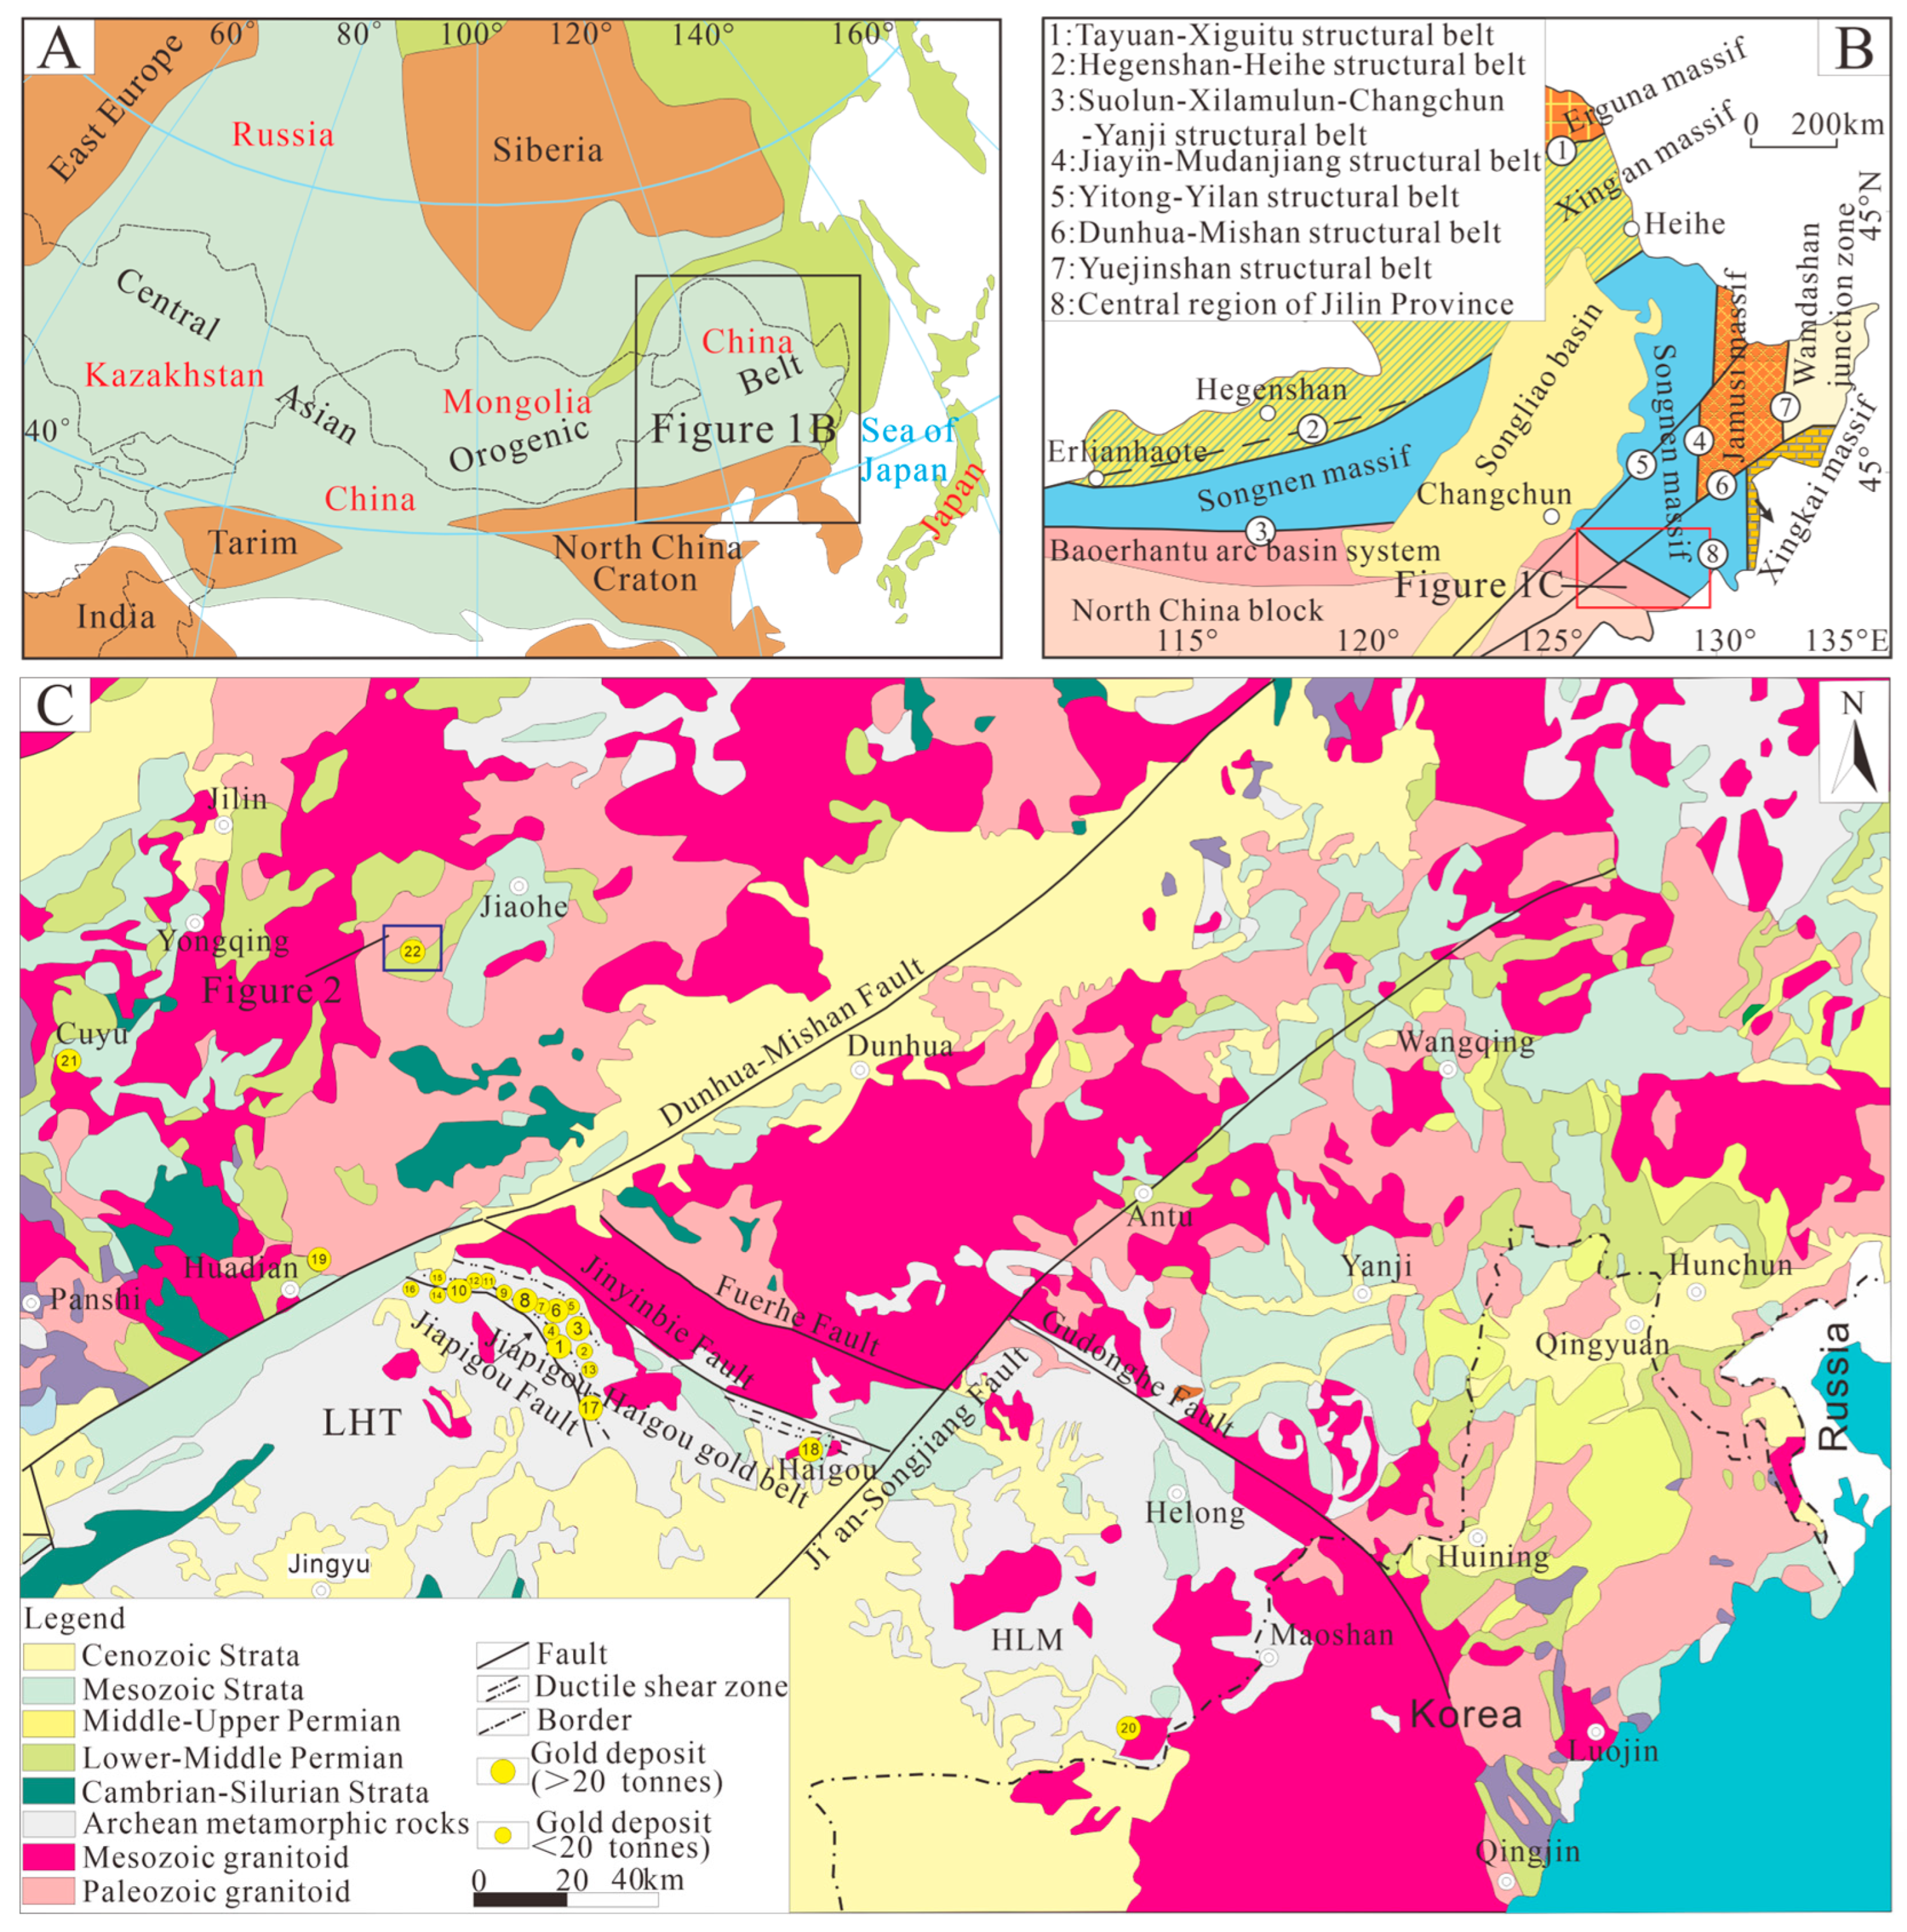
Central Jilin Province, NE China, is located within the collisional zone between the northern margin of the North China Craton (NCC) and the southern margin of the eastern segment of the Central Asian Orogenic Belt (CAOB) (Figure 1A) [1]. From the Late Paleozoic to the Early Mesozoic, this region experienced successive evolution, superposition, and transition between the Paleo-Asian Ocean and Paleo-Pacific tectonic domains, accompanied by collisions and an amalgamation of microcontinental blocks. Its unique tectonic setting, complex tectonic evolution, and multistage tectono-magmatic events collectively produced an important Au–Cu polymetallic metallogenic belt with proven gold reserves exceeding 200 t (Figure 1B; [2,3,4]).
Bounded by the Dunhua–Mishan Fault, gold deposits in the region can be broadly divided into two types. The first type occurs east of the Dunhua–Mishan Fault and consists mainly of vein-type gold deposits hosted in Archean metamorphic sequences (e.g., Haigou and Jiapigou [5,6,7]; Figure 1C). Most deposits of this type are distributed along NW-trending ductile shear zones, although a few are related to Mesozoic intrusions (e.g., Shajingou [8]). These deposits have been relatively well explored and studied. The second type occurs west of the Dunhua–Mishan Fault and includes vein-type gold deposits hosted in Paleozoic metamorphic sequences (e.g., Erdaodianzi and Ailinwudui [9,10]). These deposits represent recent exploration breakthroughs and show considerable potential for future exploration and development. However, research on their metallogenic patterns and controlling factors is still in its nascent stage. The Ailinwudui gold deposit is located at the junction between the northern margin of the North China Craton (NCC) and the southern margin of the Songnen massif. (Figure 1B,C), approximately 28 km southwest of Jiaohe City in central Jilin Province, NE China. It is a newly discovered deposit with a maximum gold grade of 19.4 g/t. Research on this deposit remains limited. Wang et al. [10] suggested that it represents a shallow intermediate- to high-temperature hydrothermal deposit controlled by fault structures and suggested that its formation may be related to granite intrusion. To date, systematic studies of ore-controlling structures, host sequences, and deposit genesis are still lacking, and detailed analytical investigations using modern techniques remain scarce. Consequently, the metallogenic model and controlling factors of this deposit remain poorly understood, which hinders the evaluation of the regional metallogenic potential and exploration prospects. As a typical vein-type gold deposit hosted in Paleozoic metamorphic rocks, fundamental issues, such as the timing of mineralization and the mechanisms by which intrusions control mineralization, remain poorly resolved. Research on these issues can directly support the optimization of regional exploration strategies.
To address these gaps, this study combines detailed field investigations, petrographic analysis, and ore microscopy. Zircon U–Pb dating of ore-related intrusions was conducted to determine emplacement ages, and 39Ar-40Ar dating of muscovite associated with greisenization in the main orebody was performed to constrain the metallogenic epoch. The objectives were to clarify the timing of mineralization in the Ailinwudui gold deposit, elucidate the geodynamic processes responsible for metallogenesis, and provide insights for the exploration of similar deposits in the region.
Figure 1. (A) Tectonic location of the Central Asian Orogenic Belt (adapted from [1]). (B) Geological map of NE China (adapted from [11]). (C) Simplified geological map showing the distribution of gold deposits in central Jilin Province (adapted from [4]). Abbreviations: 1—Erdaogou; 2—Bajiazi; 3—Jiapigou Benqu; 4—Miaoling; 5—Sidaocha; 6—Sandaocha; 7—Daxianggou; 8—Xiaobeigou; 9—Laojinchang; 10—Banmiaozi; 11—Caiqiangzi; 12—Yuanchaogou; 13—Dayangcha; 14—Hongqigou; 15—Weixiazi; 16—Damiaozi; 17—Liupiyegou; 18—Haigou; 19—Erdaodianzi; 20—Shajingou; 21—Cuyu; 22—Ailinwudui.
Minerals 16 00469 g001

2. Geological Setting and Deposit Geology

2.1. Regional Geological Setting

Central Jilin Province is geotectonically located at the junction between the northern margin of the NCC and the southern margin of the Zhangguangcai Ling magmatic arc. The region has experienced three major tectonic evolutionary stages: the Paleo-Asian Ocean stage, the Panthalassic Ocean stage, and the Paleo-Pacific Ocean stage.
The Paleo-Asian Ocean stage lasted from the Late Cambrian to the end of the Permian. During this stage, the Erguna, Xing’an, and Songnen blocks sequentially amalgamated with the NCC, completing the evolution of the Paleo-Asian Ocean tectonic domain [12]. Stratigraphic units closely related to gold and polymetallic mineralization during this stage include the Neoproterozoic Xibao’an Group and Qinglongcun Group, the Cambrian Piaohechuan Formation, the Ordovician Hulan Group, the Silurian Taoshan Formation, and the Liaoyuan Group. Variscan intermediate–acidic intrusive rocks formed during this stage are closely associated with the formation of Au, Ag, and pyrite deposits.
The Panthalassic Ocean stage lasted from the Late Carboniferous to the Late Triassic. Stratigraphic units associated with gold and polymetallic mineralization include the Carboniferous Yufutun, Lujuantun, Mopanshan, and Shizuizi formations; the Permian Fanjiatun Formation [10] and Miaoling Formation [13]; and the Triassic Kedao Formation. Indosinian intrusive rocks, dominated by acidic rocks, developed during this stage. Moderate–acidic intrusive rocks are closely related to the formation of Au, Ag, Fe, and W deposits, whereas some basic–ultrabasic intrusive rocks are genetically related to Cu–Ni mineralization [14,15].
The Paleo-Pacific tectonic regime prevailed from the Late Triassic to the Early Cretaceous. Owing to the westward subduction of the Paleo-Pacific Plate, the Jiamusi–Xingkai Block migrated westward. The Changchun–Yanji suture zone formed during the Late Triassic, marking the collision between the Xingkai Block and the NCC. Subsequently, during the Late Triassic to Early Jurassic, the Jiamusi Block amalgamated with the Songnen Block, accompanied by the closure of the Mudanjiang Ocean. Ultimately, the region was accreted to the eastern margin of the Eurasian continent during the Early Cretaceous [12]. Stratigraphic units related to gold and polymetallic mineralization during this stage include the Jurassic Nanloushan, Yuxingtun, and Tuntianying formations, as well as the Lower Cretaceous Cihuigou and Jingouling formations, which consist mainly of acidic volcanic rocks.
Under the combined effects of the collisions between the Xingkai Block and the NCC and between the Jiamusi and Songnen blocks, Yanshanian magmatism in central Jilin Province reached its peak intensity and spatial extent corresponding to the main mineralization period. Numerous large- to superlarge-scale porphyry Mo deposits and mesothermal vein-type Au deposits related to Middle Jurassic magmatism have been discovered in this region.
Early Yanshanian magmatism was characterized by volcanic eruptions that produced widespread Mesozoic volcanic rocks. This was followed by multiple episodes of intermediate–acidic magmatic intrusion, emplaced as plutonic rocks such as syenogranite, monzogranite, granodiorite, and diorite. These intrusions were accompanied by the intrusion of dikes, including diabase, diorite porphyrite, and granite porphyry [16,17].

2.2. Geological Characteristics of the Deposit

The Ailinwudui gold deposit is located approximately 28 km southwest of Jiaohe City, on the northwestern side of the Dunhua–Mishan Fault (Figure 1C). Tectonically, it lies on the southern margin of the Zhangguangcai Ling magmatic arc, north of the Changchun–Yanji suture zone, and between the Dunhua–Mishan Fault and the Yilan–Yitong Fault zone.
The strata exposed in the mining area mainly consist of the Middle Permian Fanjiatun Formation and Quaternary floodplain deposits. The Fanjiatun Formation is dominated by silty slate, carbonaceous slate, phyllite, and two-mica quartz schist that displays local mylonitization. Among these lithologies, silty slate and two-mica quartz schist constitute the principal ore-hosting rocks.
The structural features in the mining area include folds and faults. Three phases of faulting have been recognized. Phase I comprises NW-trending extensional faults, whereas Phase II includes NE- and NNE-trending concealed extensional faults. Phases I and II are interpreted as syn-mineralization structures that controlled ore formation. Phase III is characterized mainly by extensional joints that are interpreted as post-mineralization structures.
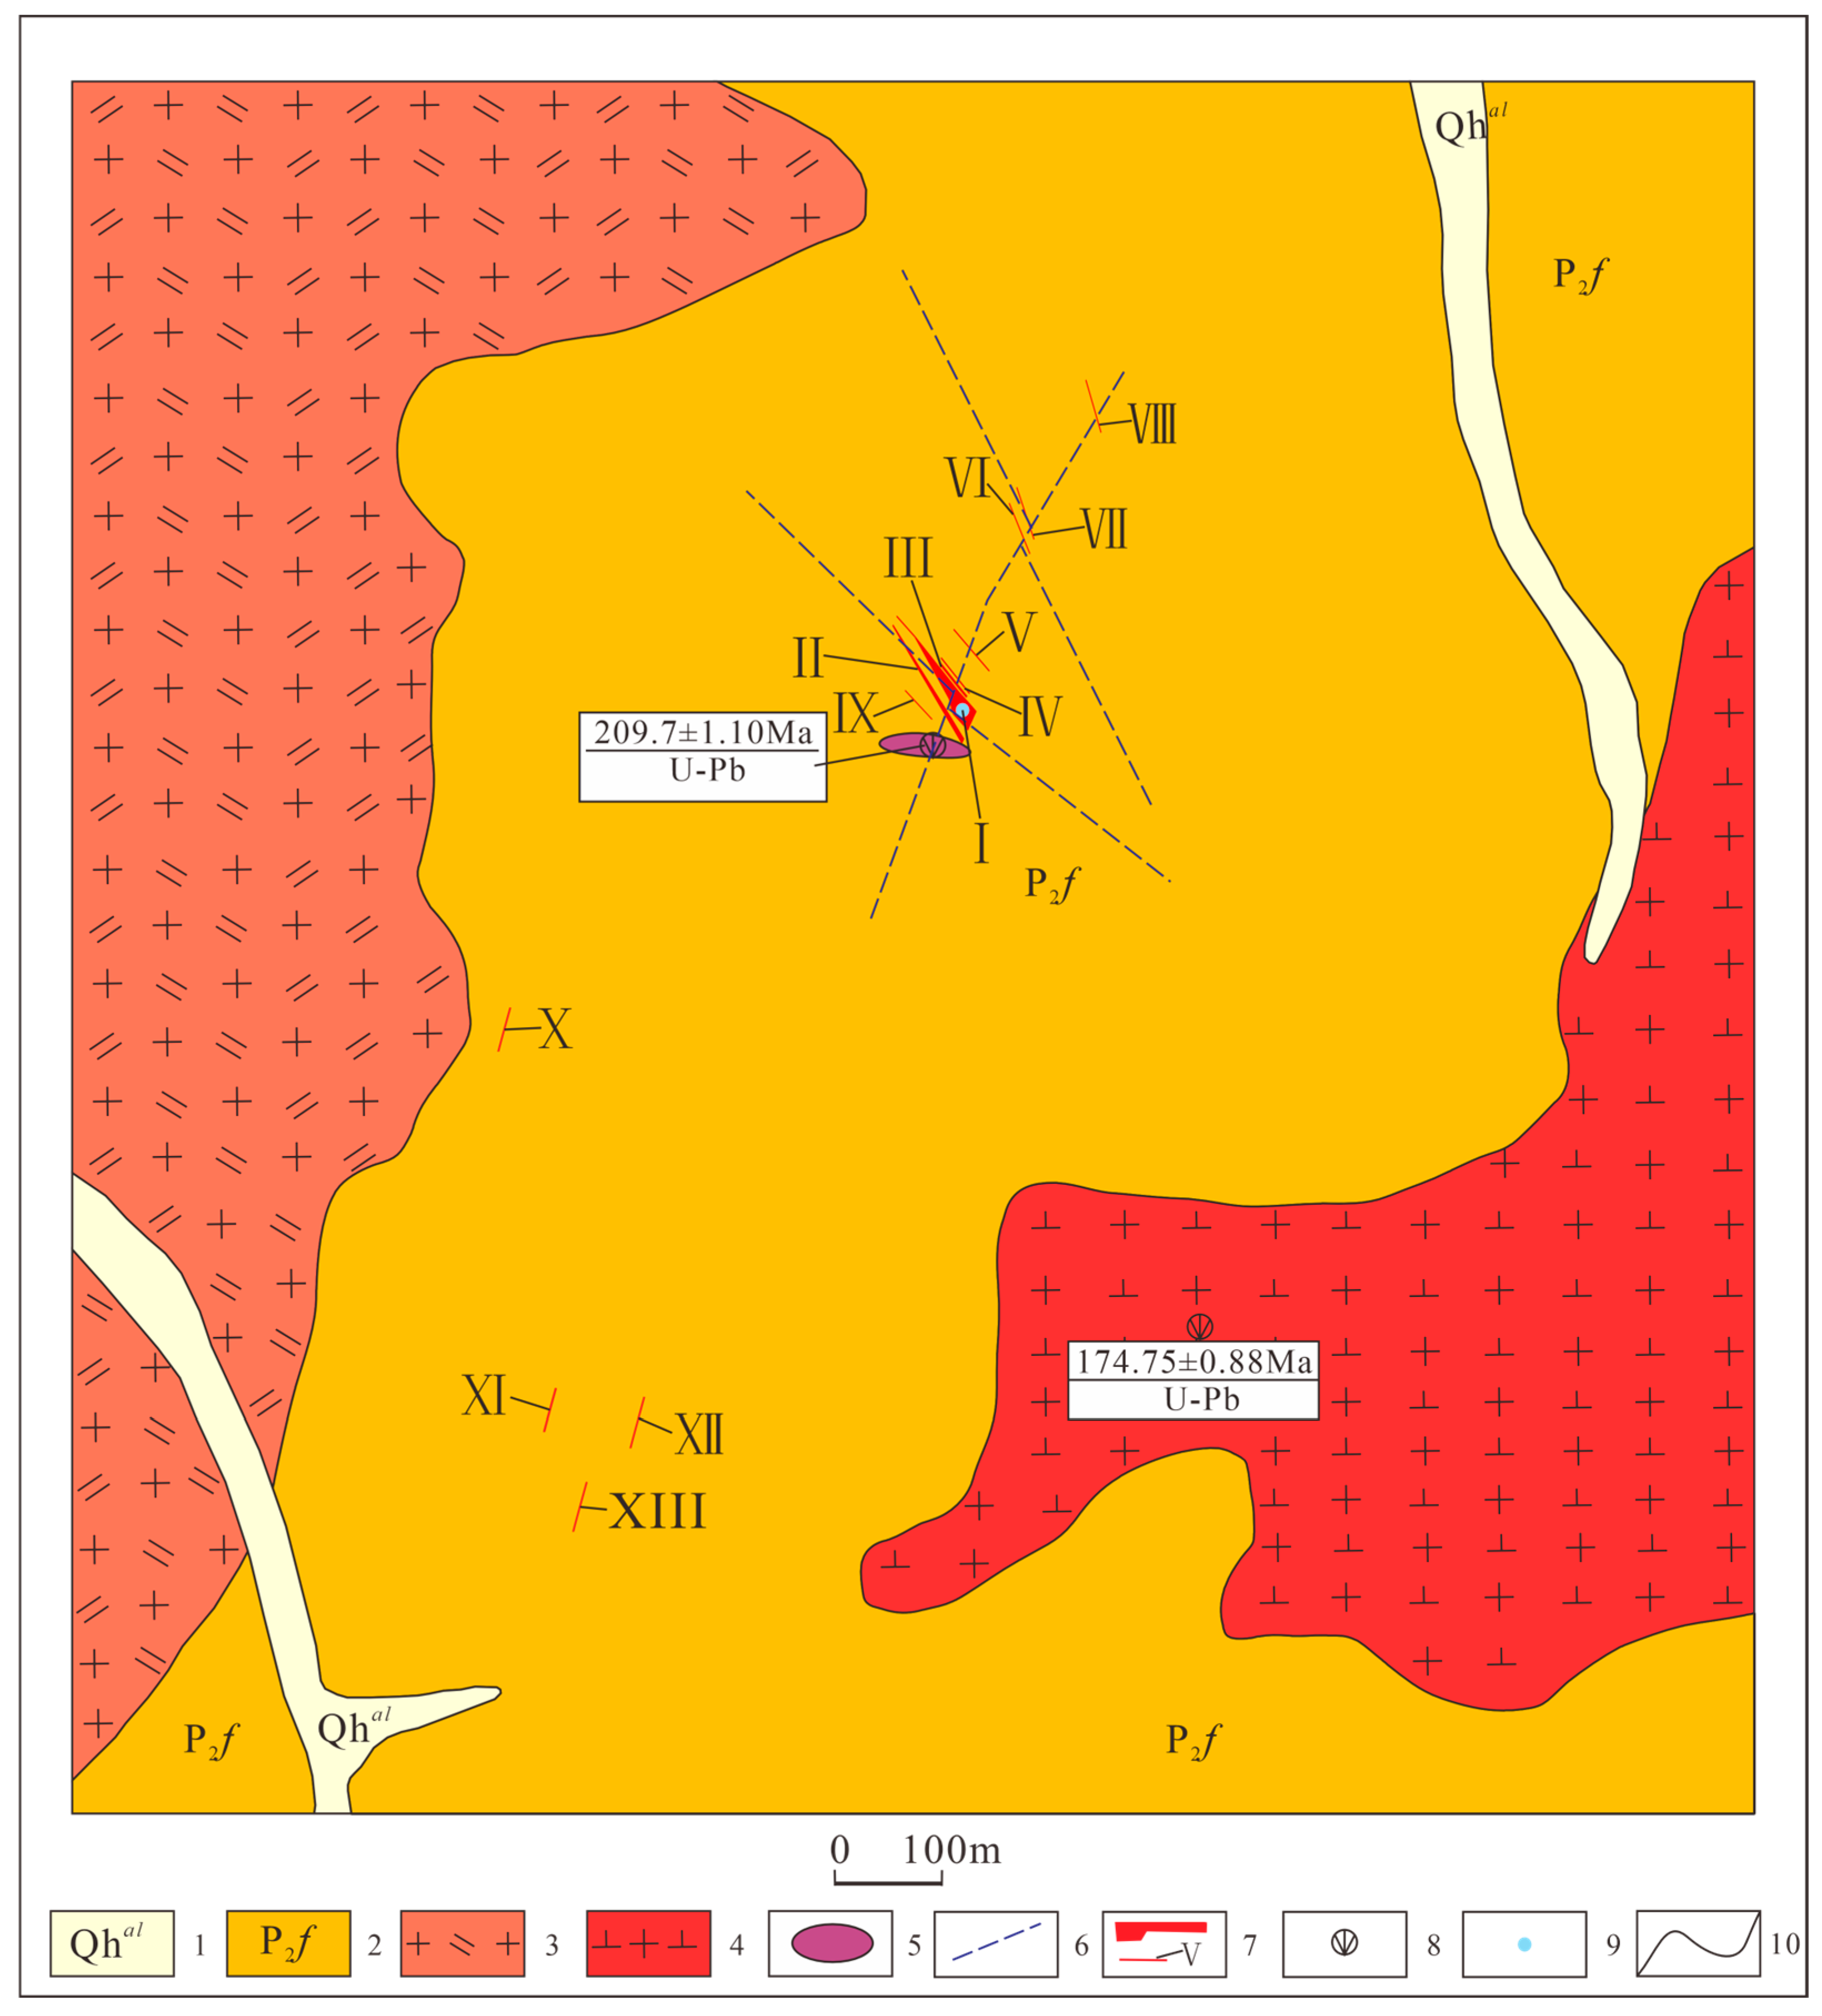
Intrusive rocks exposed in the mining area are dominated by monzogranite and granodiorite, with local mylonitization observed in the monzogranite. A small rhyolite porphyry dike occurs near Orebody No. I. Both plutonic rocks and dikes are closely associated with gold mineralization (Figure 2).
The orebodies consist of 13 gold-bearing quartz veins, which are hosted in the silty slate and two-mica quartz schist of the Middle Permian Fanjiatun Formation and are strongly controlled by NW- and NNE-trending faults. Among these, Orebody No. I is the largest. It strikes at 60°, dips at 70–80°, and has a thickness ranging from 1.0 to 14.6 m (average 7.8 m). The orebody remains open along the strike, and the gold grades range from 0.8 to 7.79 g/t (average 4.26 g/t).
Three principal ore types are quartz vein-type, altered rock-type, and micro-vein-type ores. Quartz vein-type ores display granular textures with disseminated and vein structures. Altered rock-type ores are characterized mainly by metasomatic and granular textures and exhibit vein, stockwork, and massive structures. Micro-vein-type ores occur as streaky or disseminated aggregates along micro-cleavages and fractures in slate.
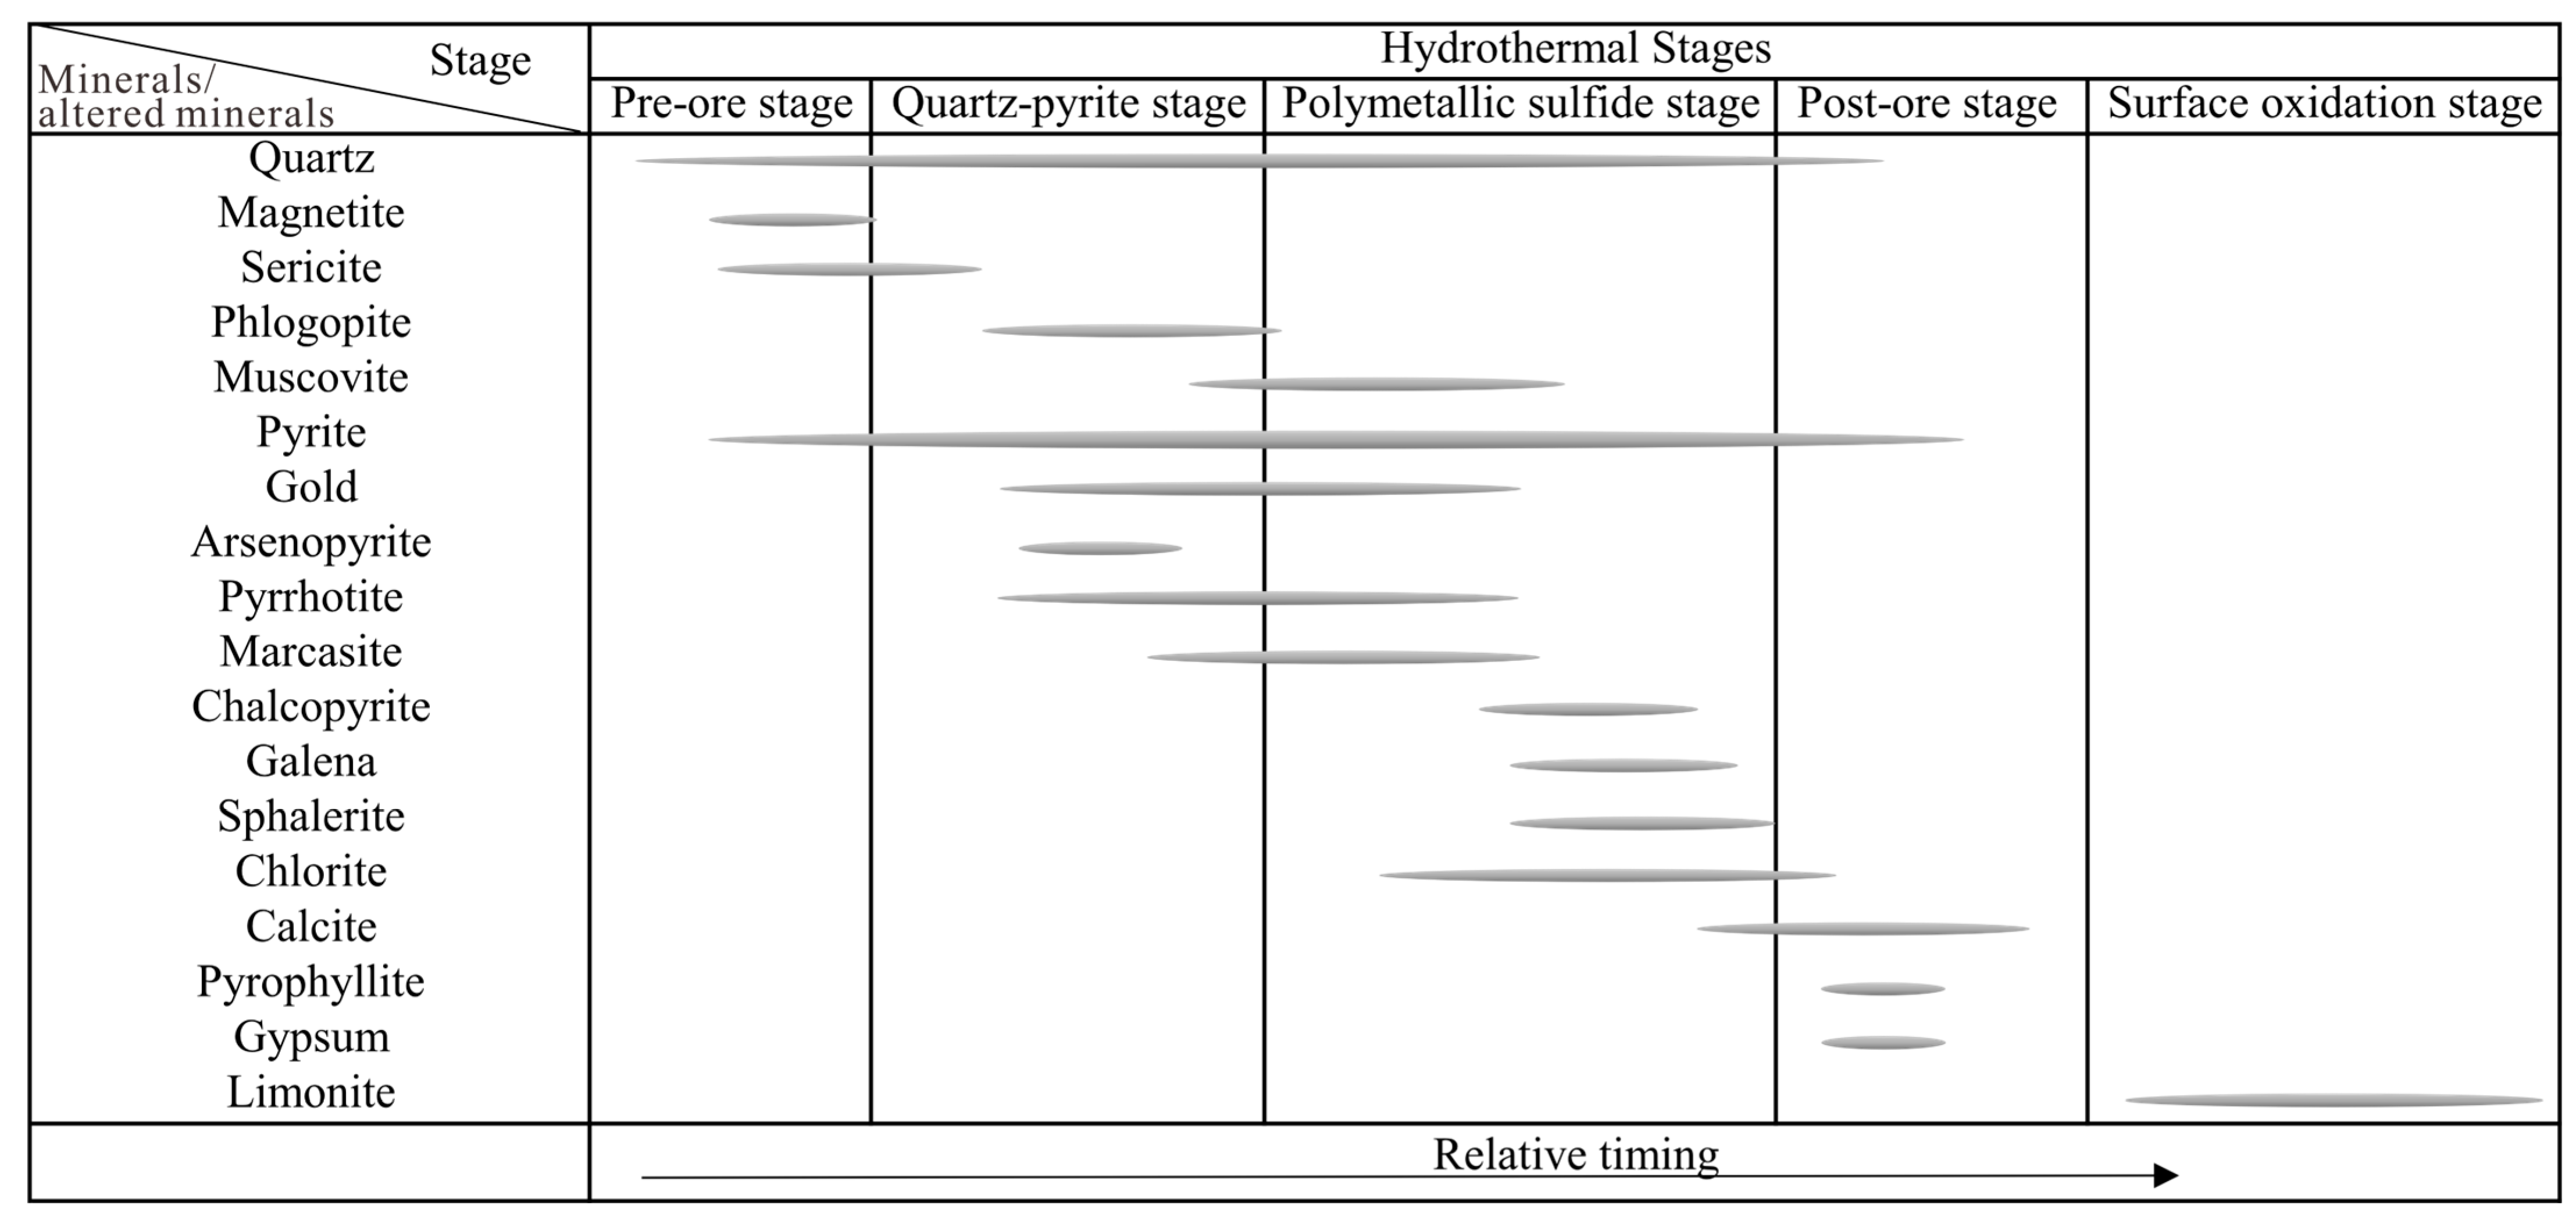
Wall-rock alteration mainly includes silicification, muscovitization, chloritization, gypsification, phlogopitization, limonitization, carbonatization, and pyrophyllitization. The mineralization process of the Ailinwudui gold deposit can be divided into five stages (Figure 3).
Pre-ore stage: Early tectonic activity
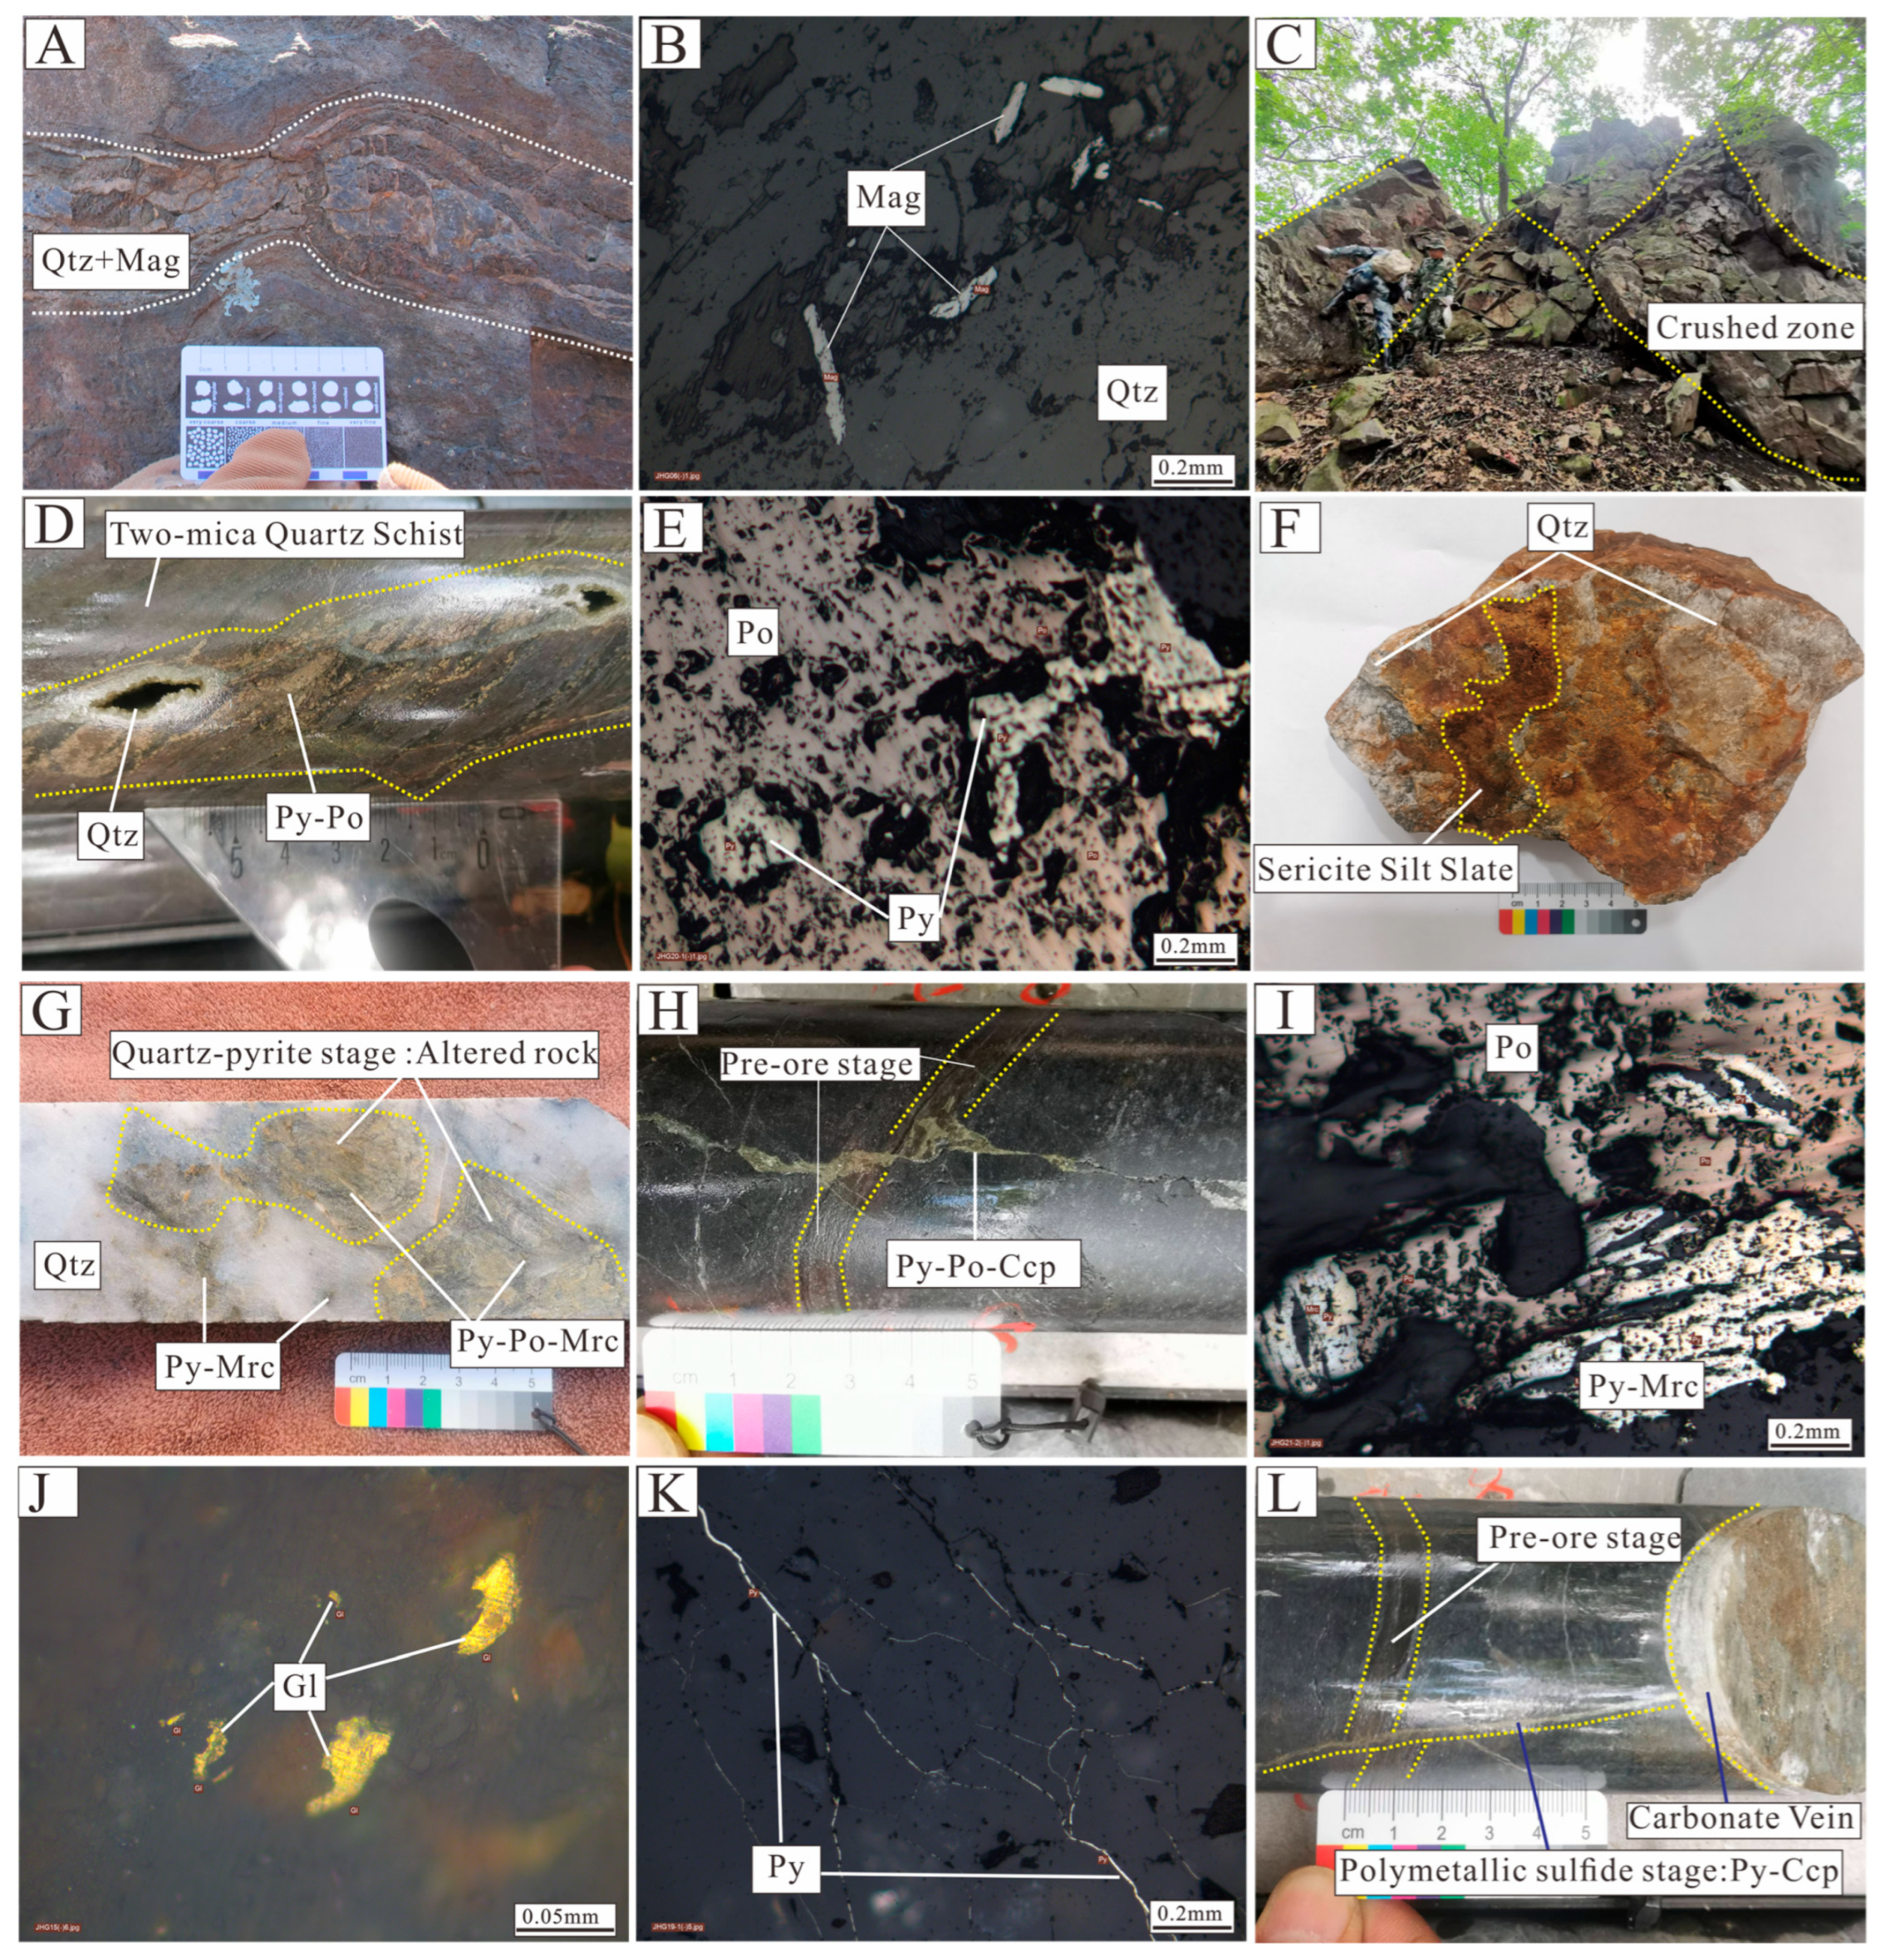
Intense folding and deformation affected the strata. Ore-forming fluids migrated along interlayer fractures within silty slate and two-mica quartz schist, forming layered quartz micro-veins (Figure 4A). Some fluids penetrated microfractures, and granular magnetite locally formed in slate and schist (Figure 4B).
Quartz–pyrite stage: Quartz–Au–arsenopyrite–pyrite–pyrrhotite stage
This stage developed mainly along structural fault zones (Figure 4C) and produced fractured altered rock-type ores (Figure 4D). Extensional fractures are filled with irregular quartz–pyrite–pyrrhotite veins (Figure 4E). Gangue minerals are dominated by quartz and muscovite, with minor phlogopite.
Polymetallic sulfide stage: Quartz–Au–polymetallic stage
This stage is characterized by vein-type (Figure 4F,G) and disseminated micro-vein-type ores (Figure 4H). Quartz veins locally contain xenoliths of early silty slate and altered ore. Ore minerals occur as aggregates and disseminations within quartz, and micro-quartz veins cut both the wall rocks and Pre-ore-stage silicified veins (Figure 4H). Ore minerals include pyrite, marcasite (intergrown with pyrite), pyrrhotite, and native gold (Figure 4I–K). Gangue minerals mainly consist of quartz and muscovite, with minor chlorite.
Post-ore stage: Carbonate stage (Late mineralization)
Calcite veins crosscut micro-vein sulfides. This stage is dominated by calcite and gypsum with minor pyrite.
Surface oxidation stage: Supergene oxidation stage
Following uplift and exposure, NE- and NW-trending extensional joints developed. Near-surface metallic minerals were oxidized to limonite, accompanied by the formation of leaching pores. Limonite is widely developed along joint surfaces in shallow drill holes.
Gold mineralization mainly occurred during the Quartz–pyrite stage and Polymetallic sulfide stage, and superimposed mineralization of these two stages commonly produced high-grade ore zones.

3. Materials and Methods

3.1. Laser Ablation Inductively Coupled Plasma Mass Spectrometry (LA-ICP-MS) Zircon U-Pb Dating

To constrain the emplacement ages of intrusive rocks associated with the Ailinwudui gold deposit, zircon U–Pb dating was performed on ore-related intrusive rocks, including granodiorite and rhyolite porphyry, collected from the mining area.
The granodiorite was light gray on fresh surfaces and displayed a fine-grained granitic texture with a massive structure. It mainly consisted of plagioclase (48%±, grayish white, subhedral tabular to tabular–granular crystals, mostly 0.5–2.0 mm and locally 2.0–3.0 mm), K-feldspar (14%±, grayish white, anhedral granular crystals, mostly 0.5–2.0 mm and locally 2.0–3.0 mm), quartz (20%±; colorless, transparent, anhedral grains mostly 0.5–2.0 mm and locally 2.0–3.0 mm), biotite (12%±; subhedral flakes randomly distributed), and minor hornblende (6%±; randomly distributed subhedral prismatic crystals 0.5–2.0 mm in size).
The rhyolite porphyry was grayish white on fresh surfaces and exhibited a porphyritic texture with a rhyolitic structure. Phenocrysts (5%±, 0.5–1.5 mm) were dominated by K-feldspar, plagioclase, and quartz. The matrix (~95%±) showed a flaky–granular crystalloblastic texture with relict rhyolitic structures and fine-grained crystals.
Zircon separation, mounting, and imaging (including reflected light, transmitted light, and cathodoluminescence [CL]) were completed at Beijing Kehui Testing Technology Co., Ltd. (Beijing, China).
LA-ICP-MS zircon U–Pb dating was conducted using an Analytik Jena PQMS Elite ICP-MS (Analytik Jena GmbH+Co. KG, Jena, Germany) coupled with a RESOlution 193 nm excimer laser ablation system. Helium was used as the carrier gas, and the remaining laser ablation parameters were as follows: beam diameter 24 μm, frequency 6 Hz, energy density ~5 J/cm2, flow rate 0.8–0.9 L/min. Single-spot ablation mode was employed for in situ analysis. Prior to analysis, the instrument was calibrated against the zircon standards GJ-1 and 91500. Data were processed using ICPMSDataCal (Version 10.8) with common lead correction, and ages were calculated using IsoplotR (Version 3.3). Detailed analytical procedures and data reduction methods followed those described in previous studies [18,19].

3.2. Muscovite 40Ar-39Ar Dating

To constrain the timing of ore formation, muscovite from greisen closely associated with gold mineralization in the main orebody (second mineralization stage) was selected for 40Ar/39Ar dating. Each cleaned sample and neutron fluence monitor was wrapped in aluminum foil and placed within an aluminum foil tube, with one monitor positioned after every third or fourth sample. The height of the samples within the aluminum tube did not exceed 3 cm. Several aluminum tubes were subsequently sealed in a quartz bottle and irradiated with fast neutrons for 1860 min in a nuclear reactor.
The monitor irradiated together with the samples was the internal standard Fangshan biotite (ZBH-25), which had a reference age of 132.7 ± 1.2 Ma [20] and a potassium content of 7.6%. After irradiation, the samples remained in the reactor for approximately three months to reduce residual radioactivity. Following irradiation, the samples and standards were loaded into a sample holder connected to a vacuum system. The system was evacuated and the furnace was heated to achieve an ultrahigh vacuum. Once the blank levels met analytical requirements, measurements were conducted. Samples were heated using a graphite furnace. The heating–extraction duration for each temperature step was 10 min. The released gases were then purified using Zr/Al getter pumps for 10 min before analysis. Purified gases were analyzed using a GV Helix MC noble gas mass spectrometer (Thermo Fisher Scientific Inc., Waltham, MA, USA). Argon isotopic analyses at each temperature step consisted of 20 cycles. Measured isotopic ratios were regressed to time zero to obtain final ratios. The measured isotopic ratios were corrected for mass discrimination, the atmospheric Ar component, blanks, and irradiation-induced interference.
Temperature rise during the vacuum stage adopts a stepwise furnace temperature program with an overall range from room temperature to 1400 °C and 450–1400 °C for muscovite; the heating process is divided into three segments: a low-temperature segment from 450 to 700 °C, with 50 °C per step for outgassing of surface and secondary phases; an intermediate-temperature plateau segment from 700 to 1140 °C following step increments of 80 °C, 60 °C, 50 °C, 50 °C, 30 °C, 20 °C, 30 °C, 50 °C, and 70 °C to release lattice-hosted argon; and a high-temperature segment from 1140 to 1400 °C, with 50–100 °C per step to release residual and structurally trapped argon, with each step held for at least 20 min until the mass spectrometric signal stabilizes.
Plateau age determination must meet multiple criteria: first, the total 39Ar released in the plateau region shall be ≥70%, and the 39Ar released in any single step shall generally not exceed 30% of the total plateau 39Ar; second, the number of consecutive and stable valid steps shall be ≥5, and the apparent ages of individual steps shall be horizontally distributed within error limits without obvious systematic increasing or decreasing trends; third, in terms of error and consistency criteria, the plateau age is calculated as the weighted mean age, the deviation of individual step ages from the plateau age is generally ≤2σ, the MSWD value is reasonable (typically MSWD < 2.5), and there is no evidence of significant excess argon, argon loss, or thermal disturbance.
Correction factors for interfering isotopes produced during irradiation were determined by analysis of irradiated pure K2SO4 and CaF2, yielding the following values: (36Ar/37Aro)Ca = 0.0002398, (40Ar/39Ar)K = 0.004782, and (39Ar/37Aro)Ca = 0.000806. All 37Ar values were corrected for radiogenic decay. The decay constant of 40K used in calculations is λ = 5.543 × 10⁻¹⁰ a−1 [21].
The atmospheric 40Ar/36Ar ratio adopted was 298.56 ± 0.31 [22]. All 40Ar/39Ar data were calculated using the software ArArCALC (Version 2.52b) [23]. Plateau ages were reported with 2σ uncertainties.

3.3. Whole-Rock Geochemical Analysis

To investigate the tectonic setting of the Ailinwudui gold deposit, granodiorite and monzogranite samples collected from the mining area, orebodies, and their contact zones were analyzed for major, rare earth, and trace elements. Sample preparation and analyses were conducted at the Analytical Laboratory of the Harbin Natural Resources Comprehensive Survey Center, China Geological Survey. Major elements were determined by X-ray fluorescence spectrometry (XRF) using the fused pellet method, with analytical accuracy and precision better than 2%–3%. Trace and rare earth elements were digested in Teflon bombs and analyzed using a Finnigan MAT double-focusing high-resolution ICP-MS, with analytical accuracy and precision better than 10%.
Detailed procedures for sample preparation, analytical principles, and procedures are described in [24].

4. Results

4.1. Petrogeochemical Characteristics

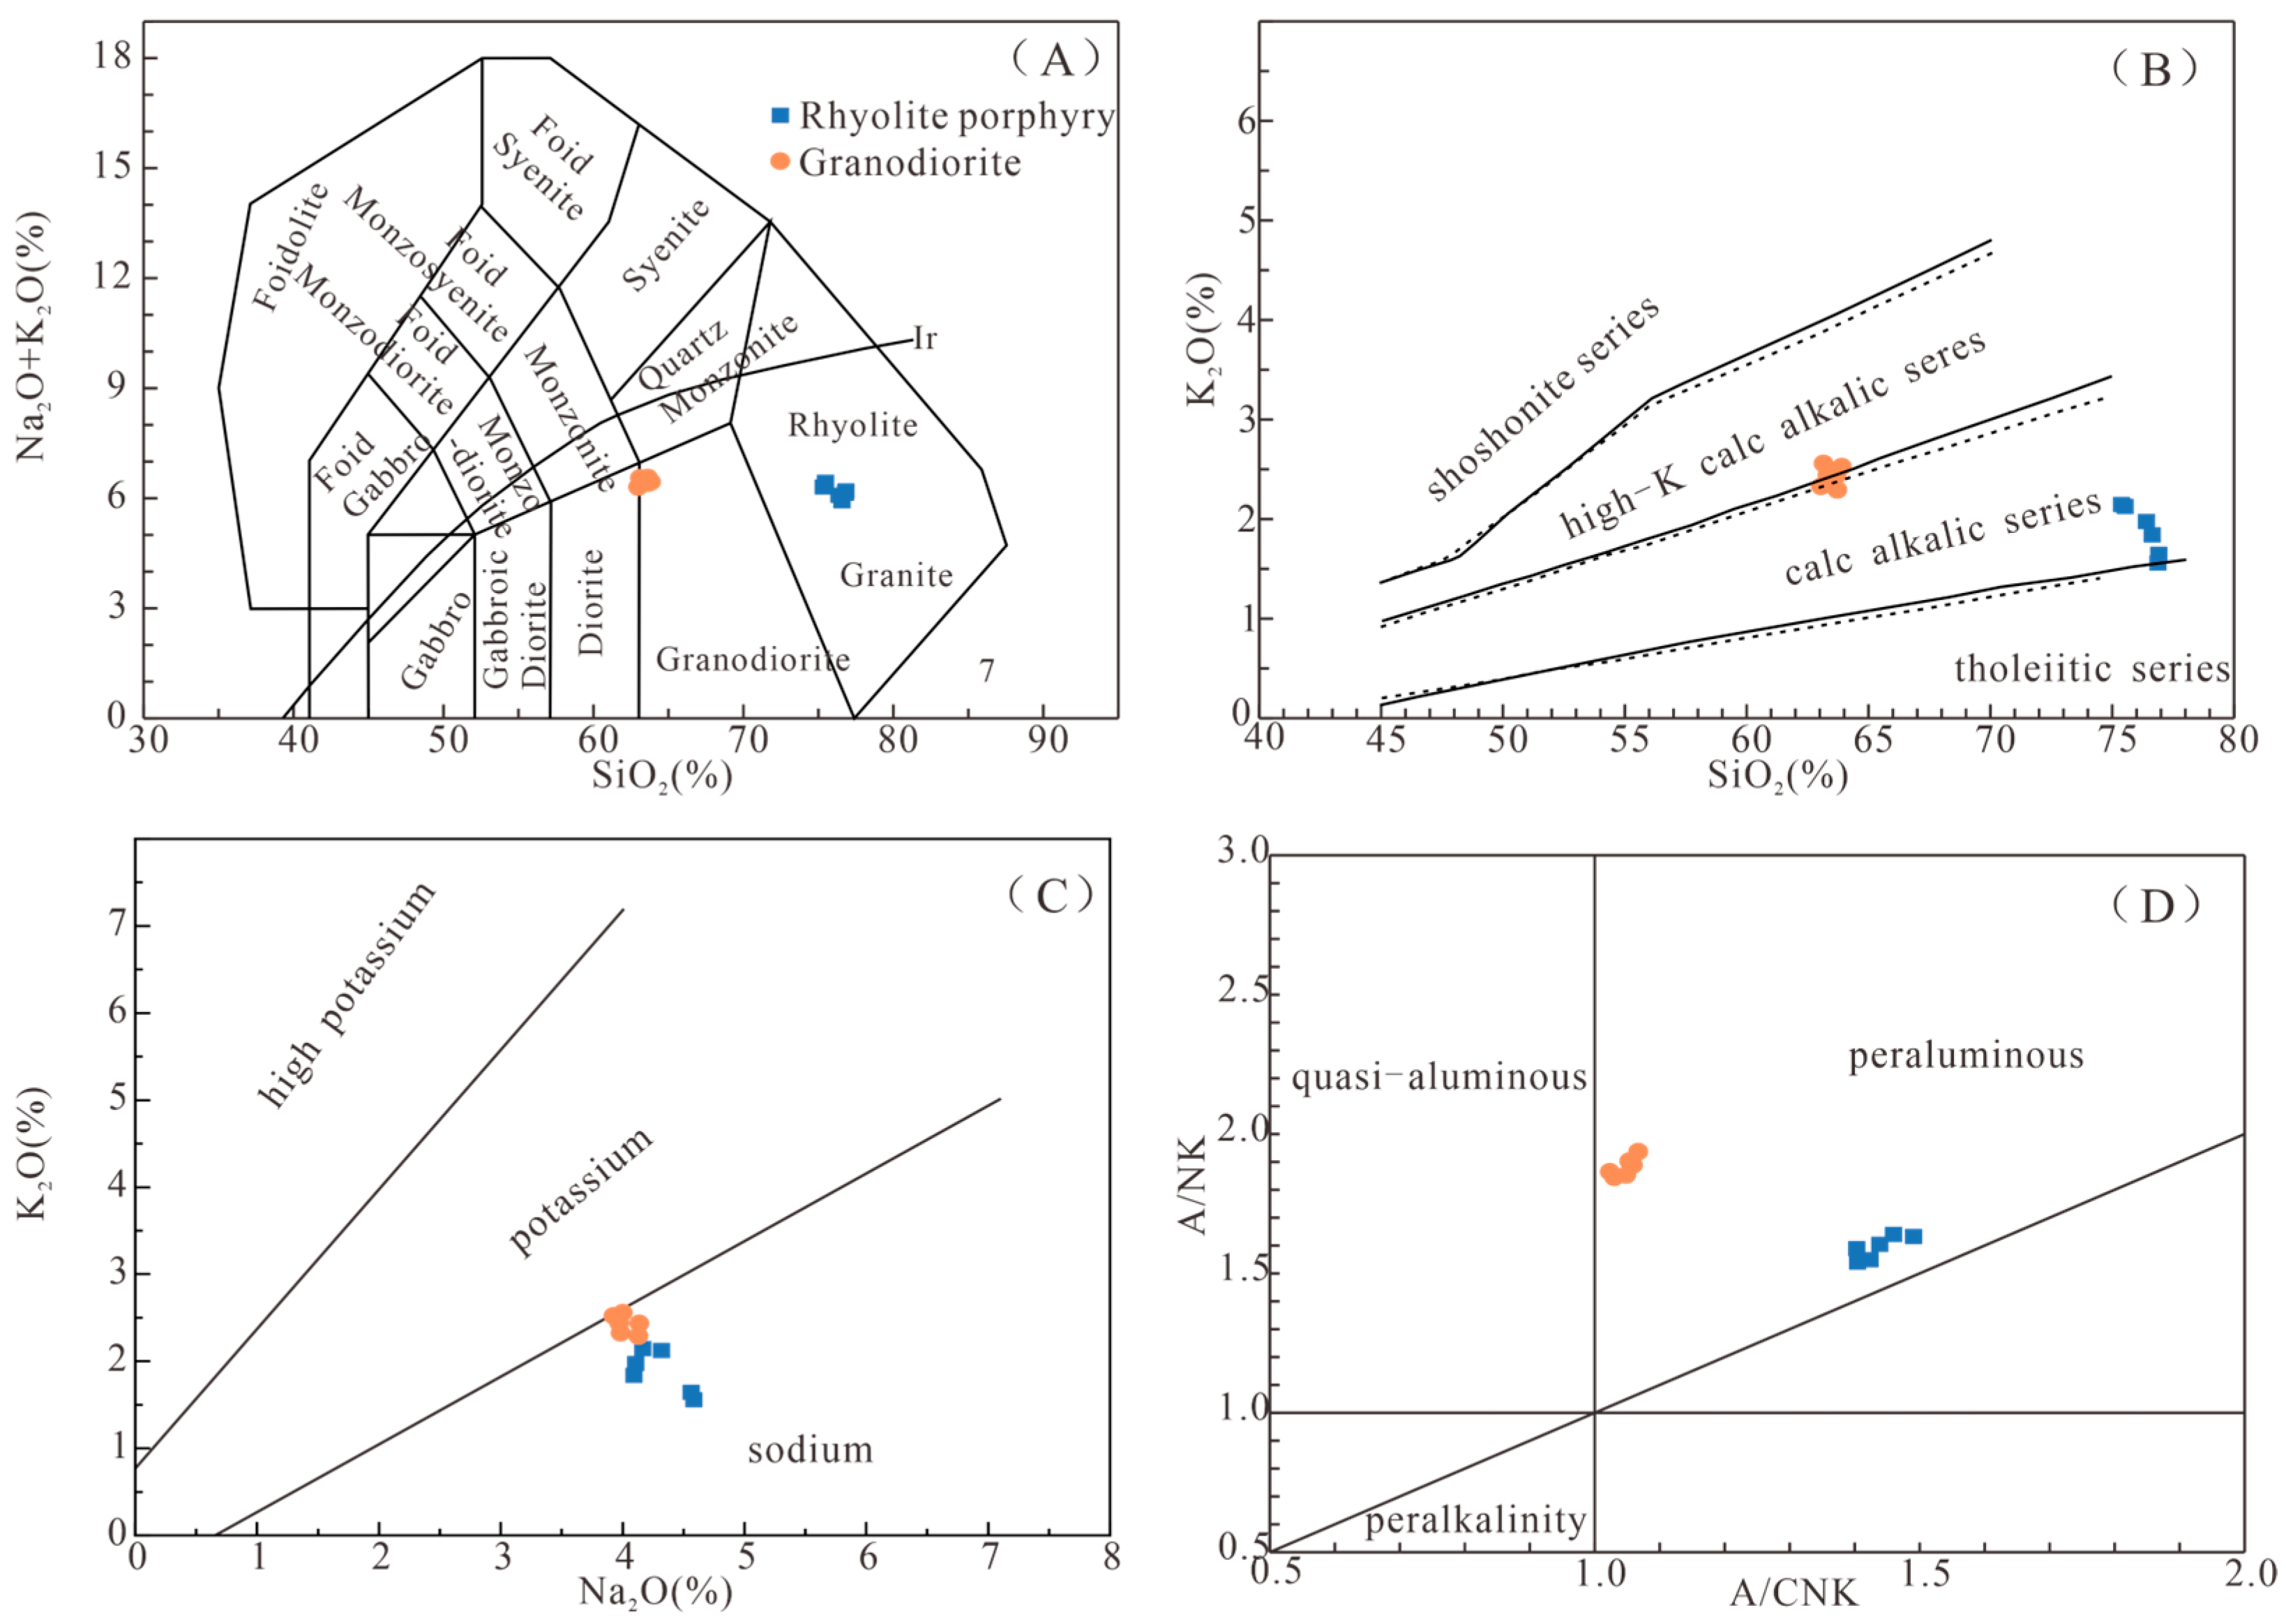
Major element compositions of the Middle Jurassic granodiorite from the Ailinwudui gold deposit are presented in Table 1. The granodiorite is characterized by SiO2 = 61.96–62.76 wt.%, Al2O3 = 16.74–17.46 wt.%, TFe2O3 = 5.17–5.54 wt.%, CaO = 3.82–4.13 wt.%, Na2O = 3.86–4.06 wt.%, and K2O = 2.25–2.51 wt.%. The total alkali content (Na2O + K2O) ranges from 6.34 to 6.45 wt.%, and the Mg# values range from 0.55 to 0.64.
On the TAS diagram (Figure 5A) and the SiO2–K2O diagram (Figure 5B), the Middle Jurassic granodiorite samples mainly fall within the high-K calc-alkaline series, with a few plotting in the calc-alkaline series. On the Na2O–K2O diagram (Figure 5C), all samples plot in the sodic series. The A/CNK ratios range from 1.02 to 1.06, and the A/NK ratios range from 1.84 to 1.94, indicating that these rocks belong to peraluminous granitoids (Figure 5D).
Major element compositions of the Late Triassic rhyolite porphyry are presented in Table 1. The rhyolite porphyry shows SiO2 = 74.49–76.16 wt.%, Al2O3 = 13.71–14.91 wt.%, TFe2O3 = 0.99–1.24 wt.%, CaO = 0.45–0.63 wt.%, Na2O = 4.05–4.54 wt.%, and K2O = 1.54–2.12 wt.%. Total alkali contents (Na2O + K2O) range from 5.87 to 6.37 wt.%, with Mg# values of 0.59–0.80. On the TAS diagram (Figure 5A) and SiO2–K2O diagram (Figure 5B), all samples plot within the calc-alkaline series. On the Na2O–K2O diagram (Figure 5C), all samples belong to the sodic series. Their A/CNK ratios range from 1.40 to 1.49, and the A/NK ratios range from 1.54 to 1.64, indicating that they also belong to peraluminous granitoids (Figure 5D).
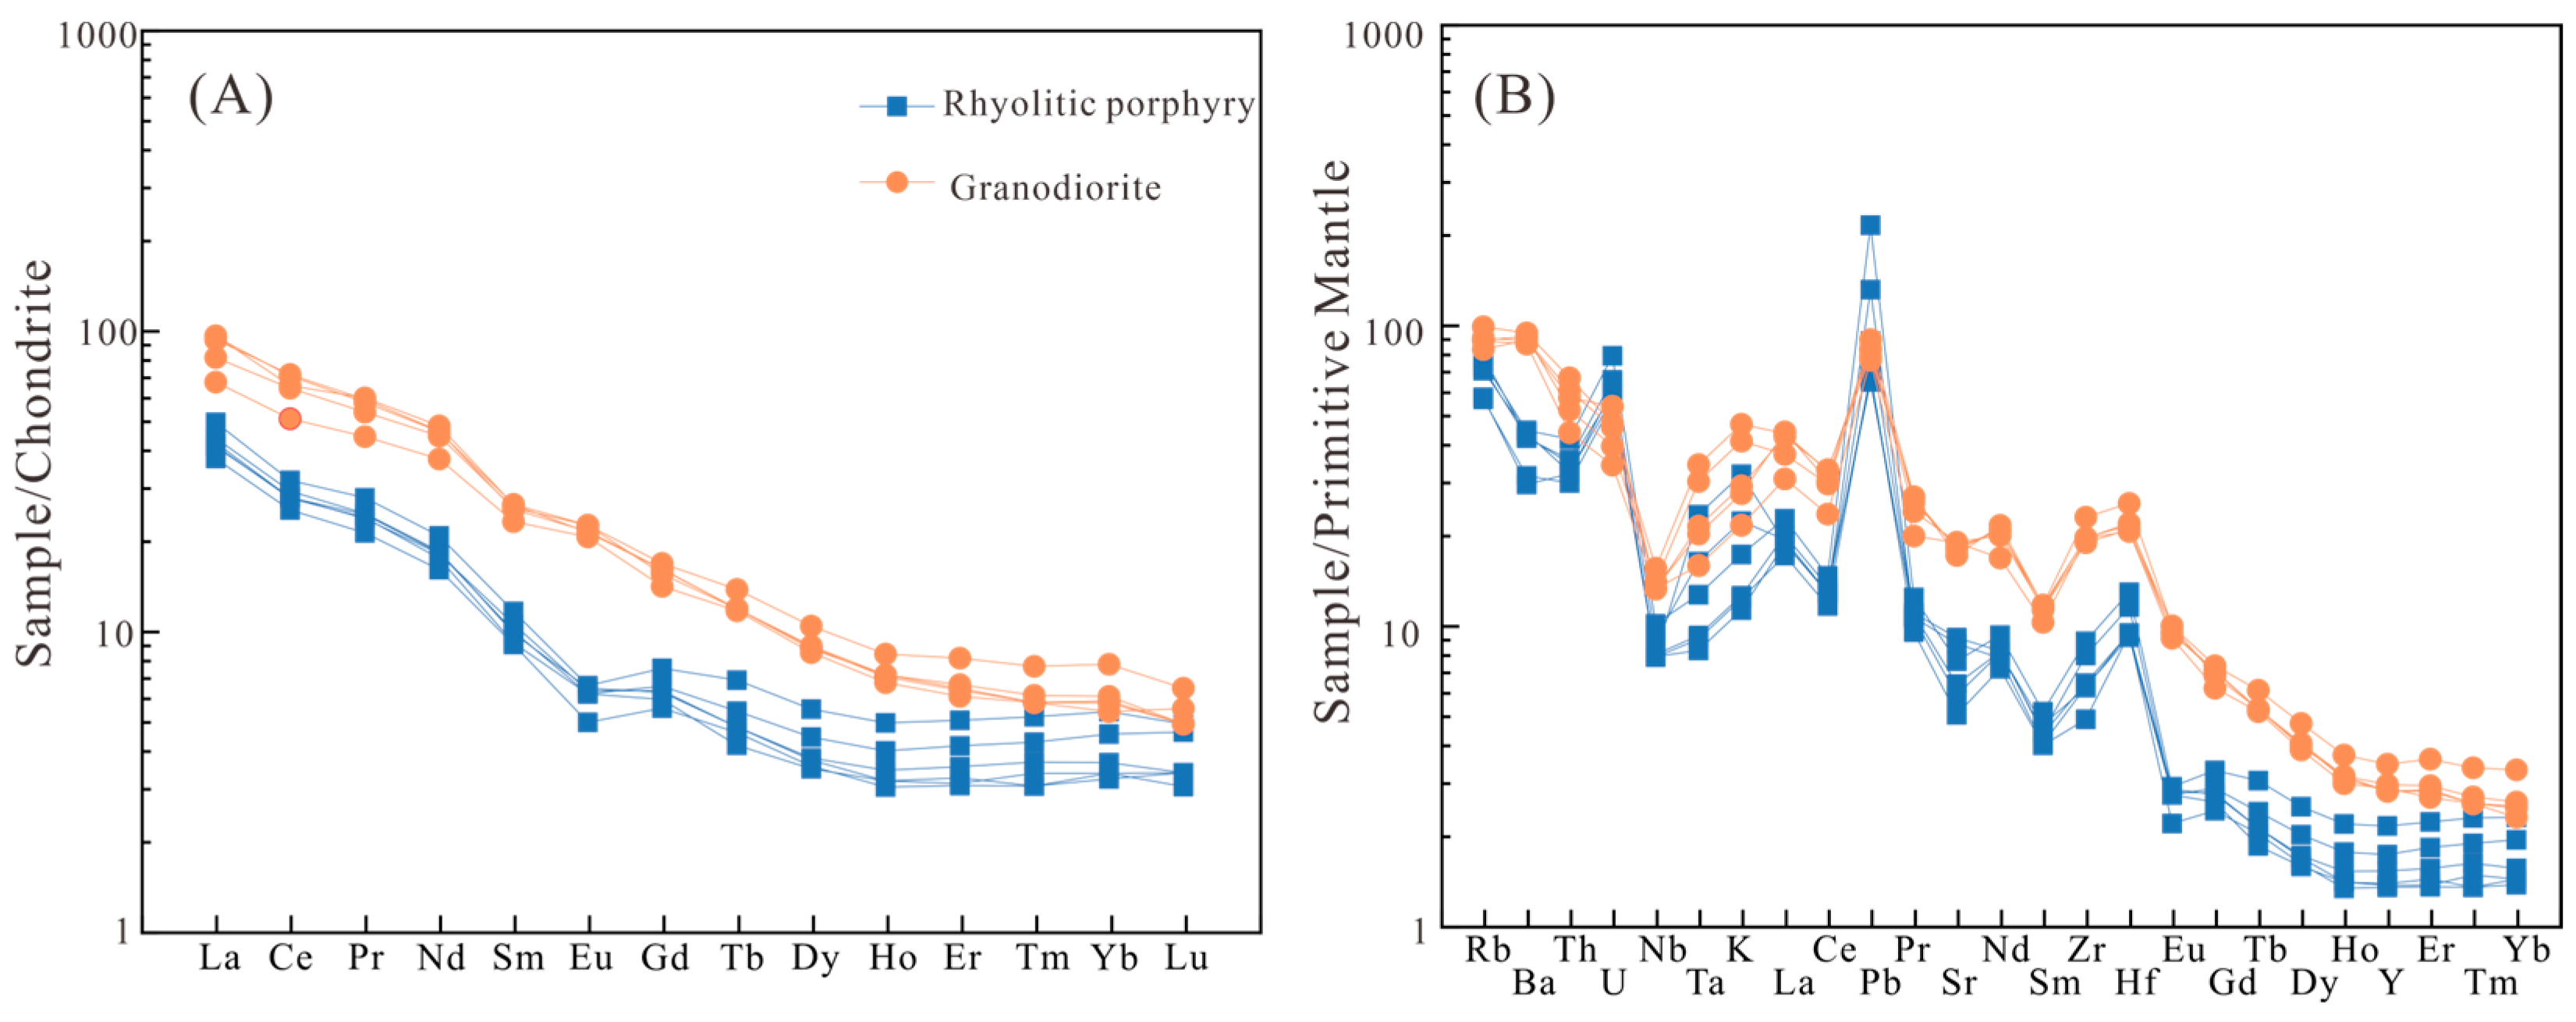
Trace and rare earth element (REE) data for the ore-related granodiorite and rhyolite porphyry are presented in Table 2. The granodiorite shows a total REE content (∑REE) ranging from (107.8 to 143.1) × 10−6 (mean 132.19 × 10⁻⁶). It is characterized by enrichment in light REEs (LREEs) and depletion in heavy REEs (HREEs), with LREE = (94.4 to 130.15) × 10−6, HREE = (10.40 to 12.99) × 10−6, and LREE/HREE ratios of 9.37–11.62. On the chondrite-normalized REE pattern diagram (Figure 6A), the granodiorite displays a right-sloping pattern, reflecting LREE enrichment and HREE depletion.
The rhyolite porphyry shows ∑REE values ranging from (51.68 to 67.48) × 10−6 (mean 58.46 × 10⁻⁶). It also exhibits LREE enrichment and HREE depletion, with LREE = (47.03–60.43) × 10−6, HREE = (4.65 to 7.05) × 10−6, and LREE/HREE ratios of 8.57–10.89. The chondrite-normalized REE pattern (Figure 6A) shows a similar right-sloping trend and displays a distinct negative Eu anomaly (δEu = 0.70–0.84; mean 0.77), which is likely related to the fractional crystallization of plagioclase.
In the primitive mantle-normalized trace element spider diagram (Figure 6B), the granodiorite shows enrichment in large-ion lithophile elements (LILEs) such as Rb, Ba, K, and Pb, as well as enrichment in Hf, while displaying depletion in Nb, Sm, and several other elements.
The rhyolite porphyry similarly shows enrichment in LILEs (Rb, U, Pb) and Hf and relative depletion in high-field-strength elements (HFSEs) such as Nb and Sr. These geochemical characteristics suggest that crustal materials participated in the magmatic processes.
The pronounced negative Sr anomaly is interpreted to result from plagioclase retention in the magma source region.

4.2. Zircon U-Pb Age

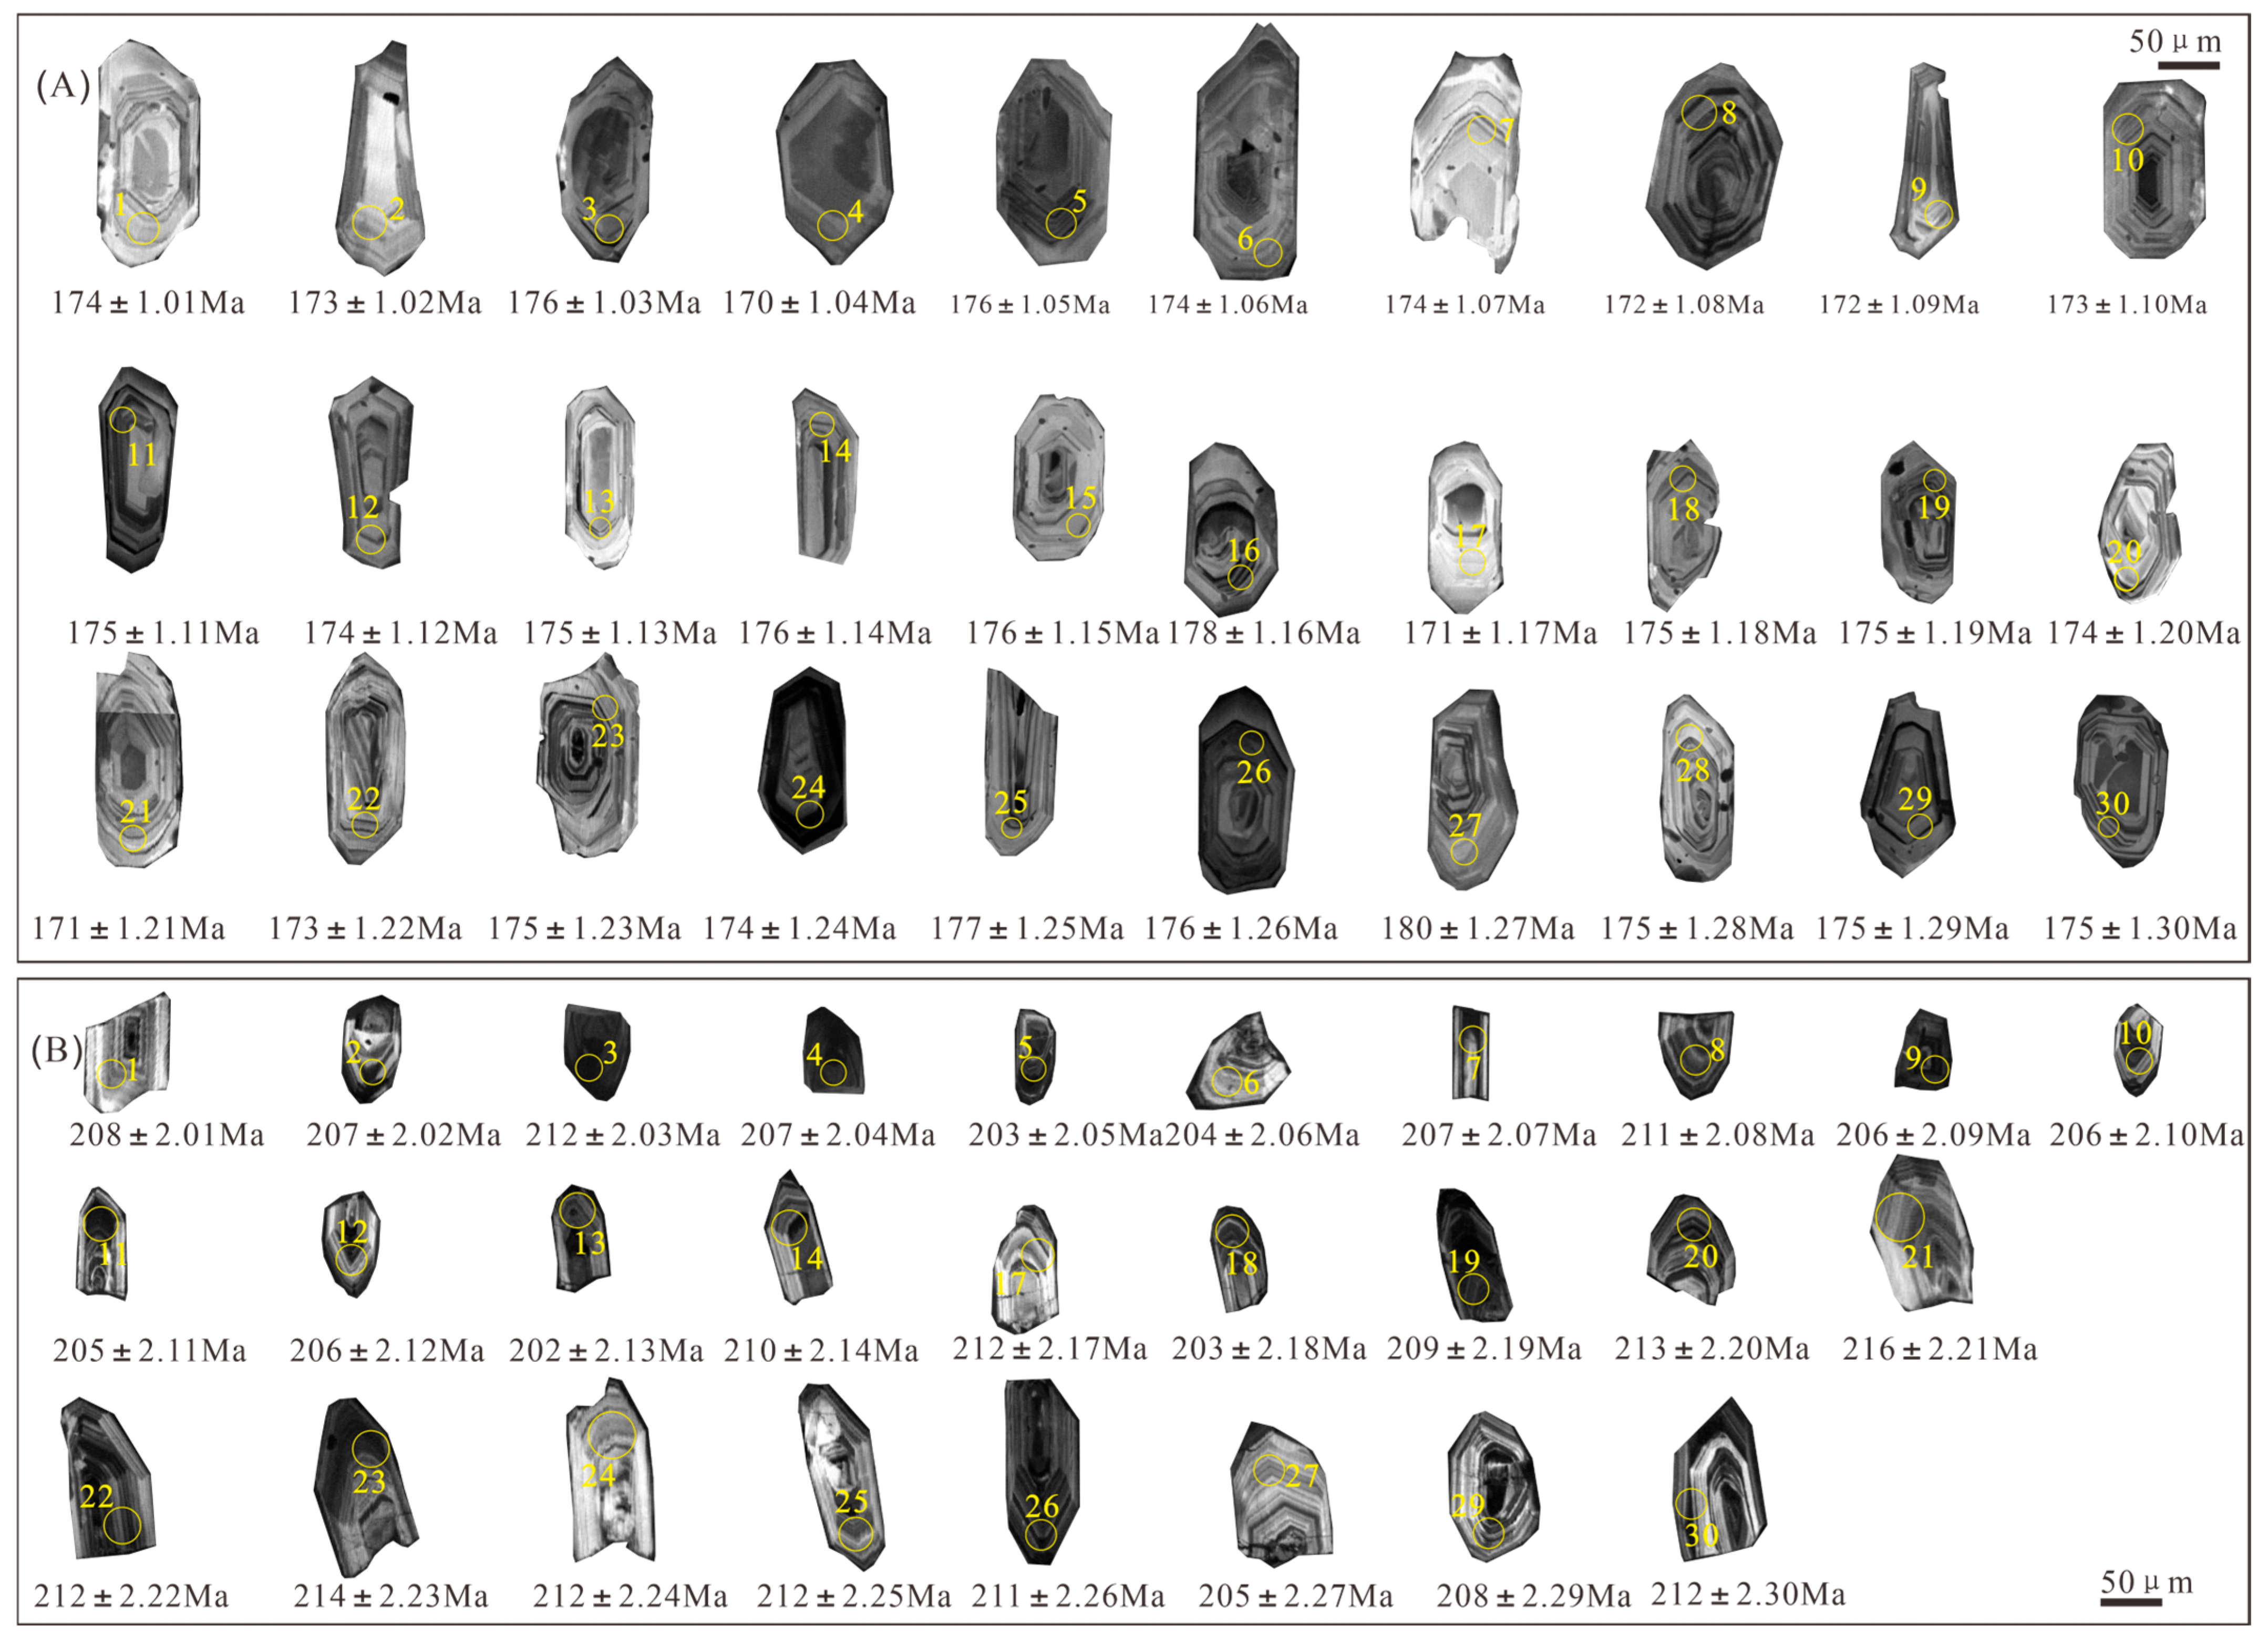
Zircons from the granodiorite (Figure 7A) and rhyolite porphyry (Figure 7B) exhibited high transparency and good crystal integrity, displaying combined polyhedral and octahedral morphologies.
Zircons from the granodiorite were 103–210 μm in size, whereas those from the rhyolite porphyry were 52–198 μm in size. Most crystals were euhedral and display well-developed oscillatory zoning.
Granodiorite zircons contained Th = 29.04–274.50 ppm, U = 72.76–1183.30 ppm, and Th/U ratios = 0.05–1.26. Except for spot 22, all analyses yielded Th/U ratios > 0.1. Spot 22 was colorless and transparent and euhedral and exhibited distinct magmatic oscillatory zoning, which indicates a magmatic origin. Consequently, all analyzed zircons from the granodiorite were interpreted as magmatic zircons [30].
Zircons from the rhyolite porphyry contained Th = 47.45–457.44 ppm, U = 114.65–703.19 ppm, and Th/U ratios = 0.20–1.13, all of which exceeded 0.1, indicating that all analyzed zircons from the rhyolite porphyry were of magmatic origin (Table 3 and Table 4).
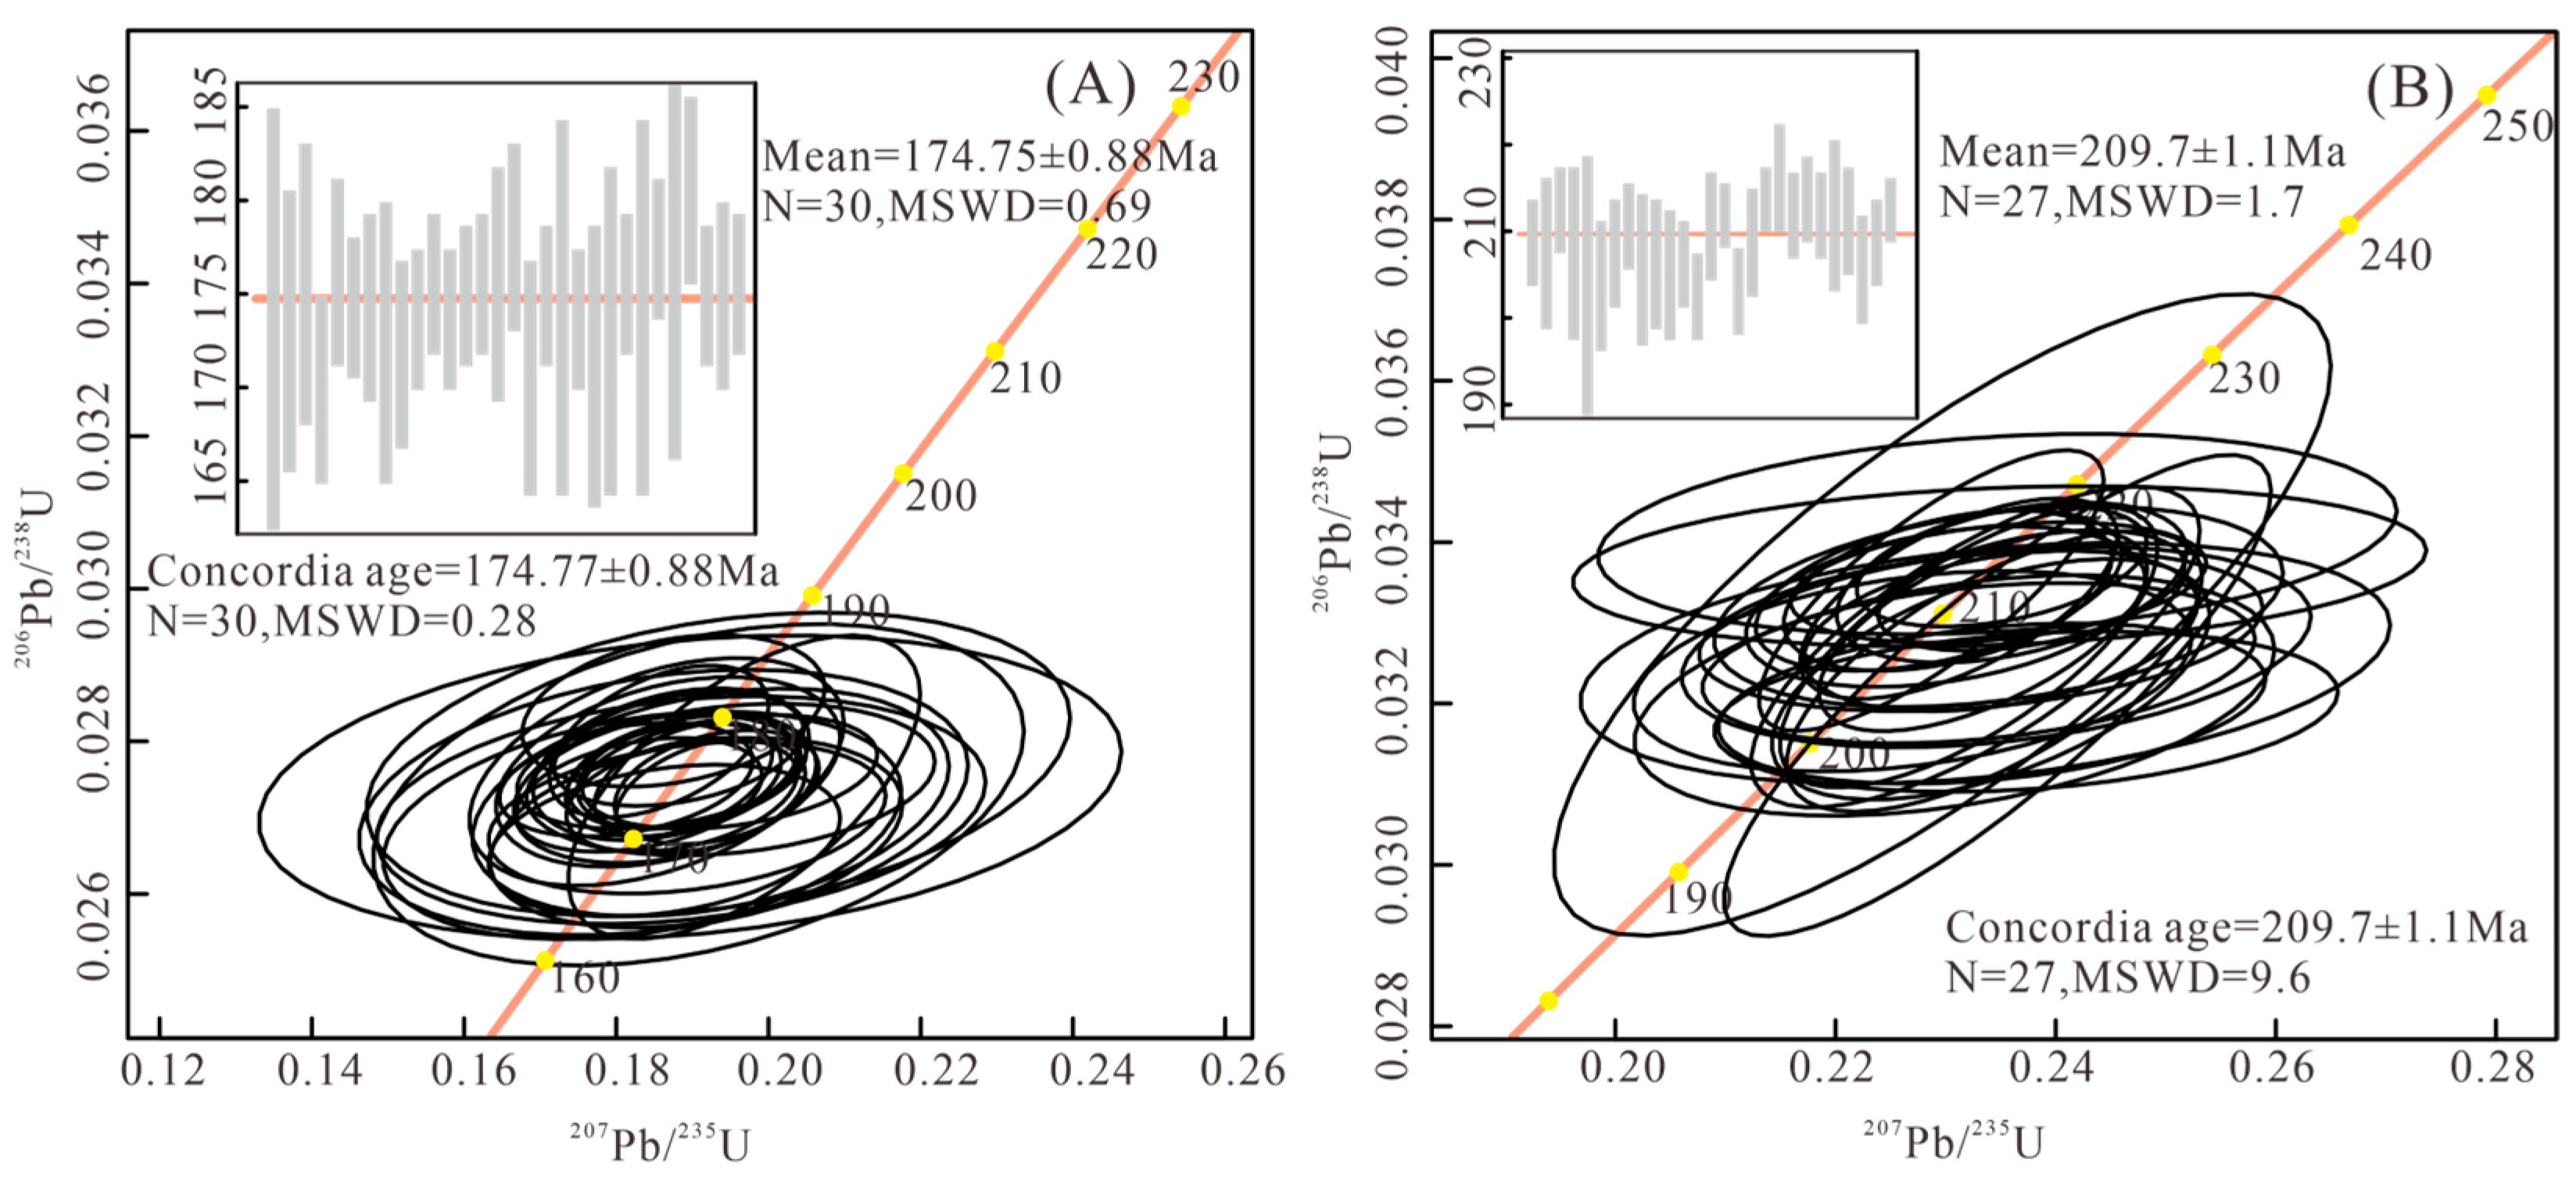
Thirty analyses were conducted on zircons from the granodiorite. The 206Pb/238U apparent ages ranged from 170 to 180 Ma, with most values clustering between 173 and 176 Ma. All data points plotted on or near the concordia line in the zircon U-Pb concordia diagram. The weighted mean age was 174.75 ± 0.88 Ma (MSWD = 0.69; n = 30), representing the crystallization age of the ore-related granodiorite in the Ailinwudui gold deposit and corresponding to the Middle Jurassic (Figure 8A).
Twenty-eight analyses were performed on zircons from the rhyolite porphyry. The 206Pb/238U apparent ages ranged from 202 to 215 Ma, mainly clustering between 205 and 211 Ma. All data points plotted on or near the concordia line. The weighted mean age was 209.7 ± 1.10 Ma (MSWD = 1.7; n = 27), representing the pre-mineralization crystallization age of the rhyolite porphyry and corresponding to the Late Triassic (Figure 8B).

4.3. Muscovite 40Ar-39Ar Age

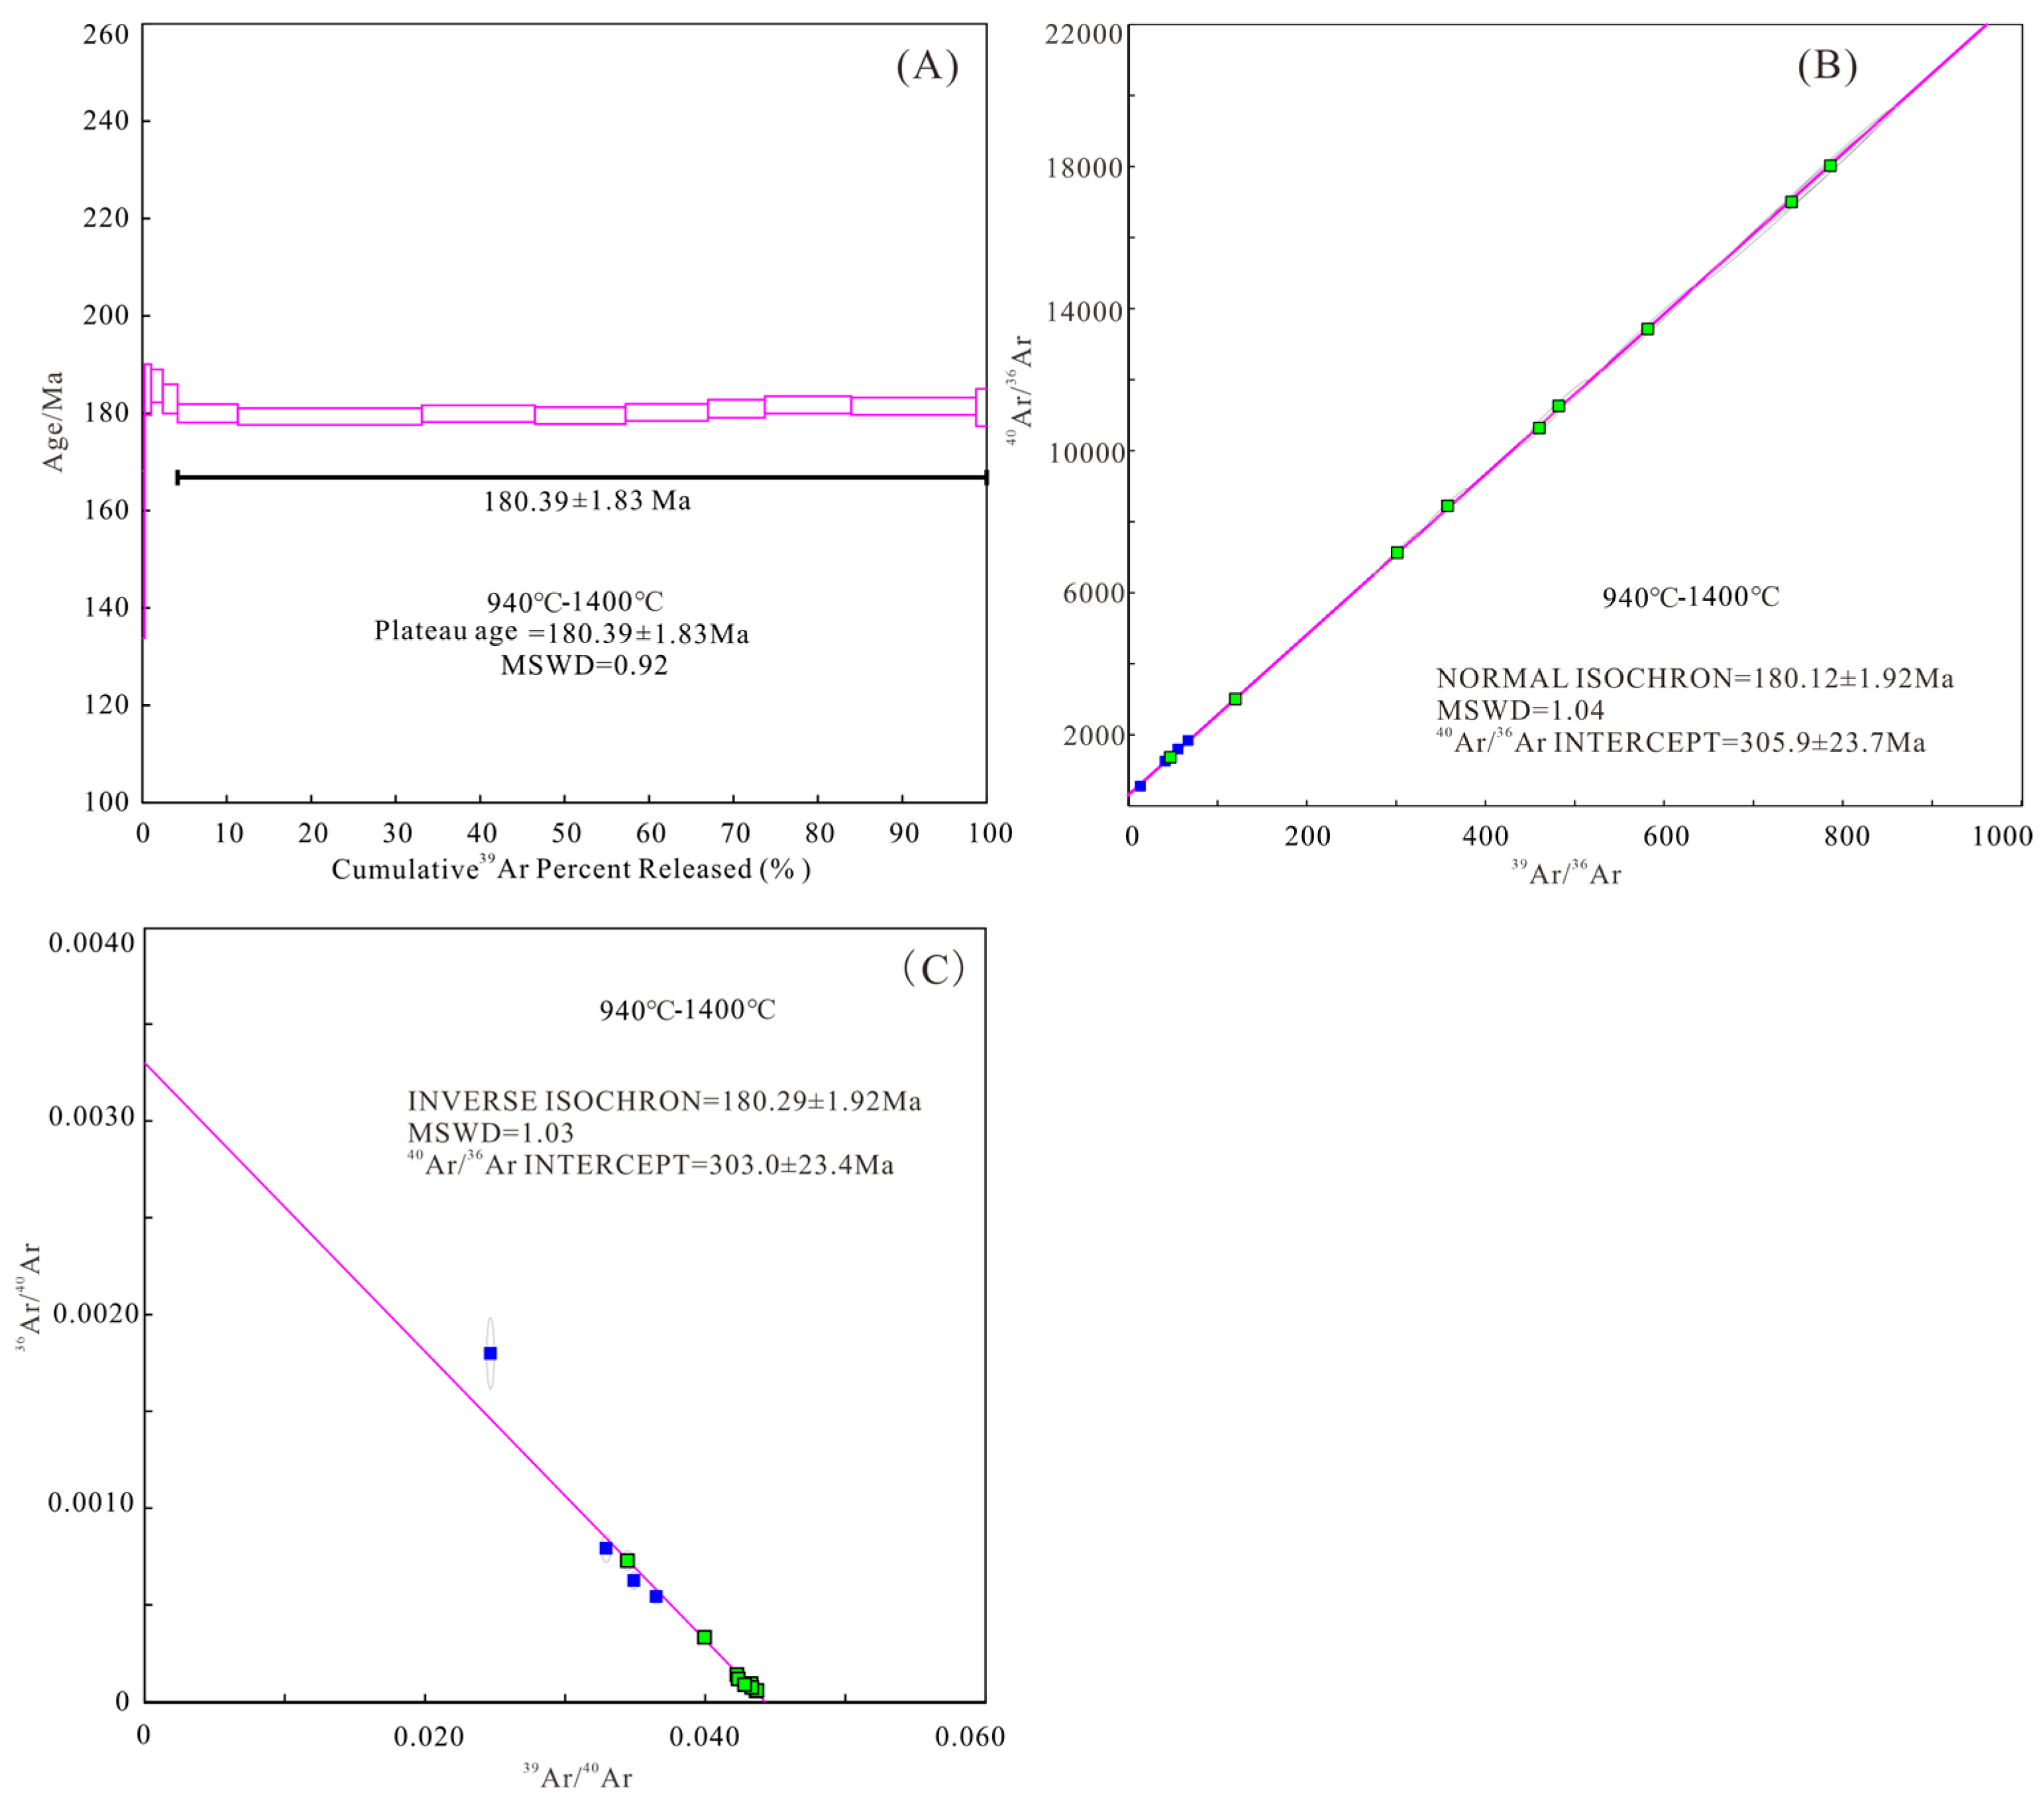
The step-heating 40Ar-39Ar analytical data for muscovite are listed in Table 5. The sample was heated in 13 temperature steps. Nine heating steps between 940 °C and 1400 °C yielded a well-defined plateau age of 180.39 ± 1.83 Ma (Figure 9A). These same steps yielded an isochron age of 180.12 ± 1.92 Ma with a mean square weighted deviation (MSWD) of 1.04 (Figure 9B) and an inverse isochron age of 180.29 ± 1.92 Ma with an MSWD of 1.03 (Figure 9C). The plateau age of 180.39 Ma is, therefore, interpreted as the crystallization age of muscovite associated with gold mineralization.

5. Discussion

5.1. Metallogenic Epochs

Based on the above research results, the granodiorite in the Ailinwudui mining area formed in the Middle Jurassic (174 Ma), corresponding to Yanshanian magmatic activity. The rhyolite porphyry was emplaced in the Late Triassic (209 Ma) and corresponds to Indosinian magmatic activity. The rhyolite porphyry exposed around the orebody is cut by quartz veins, which indicates that it is a pre-ore hypabyssal intrusive rock.
The timing of the gold mineralization can be constrained through geochronological analyses of coexisting minerals, such as muscovite 40Ar/39Ar dating and zircon U–Pb dating. In this study, muscovite from greisen closely associated with gold mineralization in the main orebody was analyzed to determine the ore-forming age of the Ailinwudui gold deposit. The muscovite 40Ar/39Ar analysis yielded a plateau age of 180.39 ± 1.83 Ma (Figure 9A). The corresponding isochron age (180.12 Ma) and inverse isochron age (180.29 Ma) are consistent with the plateau age, and MSWD values close to 1.0 further confirm the reliability of the dating results (Figure 9B,C). These results indicate that a major gold mineralization event occurred in the Ailinwudui area during the Early Jurassic. In addition, the research group led by Zhang Yongmei from the China University of Geosciences (Beijing) conducted U–Pb dating of rutile from ore-bearing quartz veins, obtaining an age of 174.1 ± 4.0 Ma (unpublished internal data). Therefore, the ore-forming age of the Ailinwudui gold deposit can be constrained to 180–174 Ma, corresponding to the Early–Middle Jurassic. Combined with the formation ages of the intrusive rocks in the ore district, the granodiorite is interpreted to be the ore-related intrusive body.
The gold mineralization events in central Jilin Province can be broadly divided into three major episodes. The first episode occurred during the Middle–Late Triassic (ca. 240–200 Ma) in an extensional tectonic setting following closure of the Paleo-Asian Ocean [31,32,33]. The second episode occurred during the Early–Middle Jurassic (ca. 178–170 Ma) under a transitional compressional–extensional regime associated with the late stage of the Paleo-Pacific Plate [9,16,34,35,36]. Representative deposits include the Haigou gold deposit, hosted in Archean metamorphic rocks and with a mineralization age of approximately 172 Ma, and the Erdaodianzi gold deposit, hosted in Paleozoic metamorphic rocks and also dated to approximately 172 Ma. The third episode occurred during the Late Jurassic (156–152 Ma) in a post-subduction extensional tectonic environment [37,38].
Considering its geological setting and mineralization age, and in comparison with representative deposits in central Jilin (Table 6), the Ailinwudui deposit is interpreted as an Early–Middle Jurassic gold deposit hosted in Paleozoic metamorphic rocks.

5.2. Geodynamic Setting of Mineralization

The ore-forming age of the Ailinwudui gold deposit corresponds to the Early–Middle Jurassic, which coincides with the evolution of the Paleo-Pacific tectonic domain, during which the regional tectonic regime was dominated by compressional processes. Following the amalgamation of the Xingkai Block and the NCC, which produced the Changchun–Yanji suture zone, the Jiamusi Block collided with the Songnen Block during 210–180 Ma, which marked the final closure of the Heilongjiang Ocean [12,43,44,45,46]. Subsequently, during the Early Cretaceous, the continuous westward subduction of the Paleo-Pacific Plate resulted in the final accretion of the eastern Eurasian continental margin in Northeast China [12,47]. The rhyolite porphyry in the Ailinwudui ore district yielded a weighted mean age of approximately 209 Ma. However, it remains uncertain whether its formation was controlled by post-collisional back-arc extension following the amalgamation of the Xingkai Block and the NCC or by tectonic processes related to the collision between the Jiamusi and Songnen blocks.
The ore-related granodiorite yields a weighted mean age of 174 Ma. It is similarly unclear whether this intrusion formed in an extensional setting following closure of the Heilongjiang Ocean or was influenced by the ongoing westward subduction of the Paleo-Pacific Plate. The period from the Late Triassic to the Middle Jurassic represents two important gold mineralization episodes in the region [9,16,31,32,33,34,35,36]. Therefore, understanding the tectonic evolution of this region during this interval is essential for constraining the tectonic setting of gold and polymetallic mineralization.
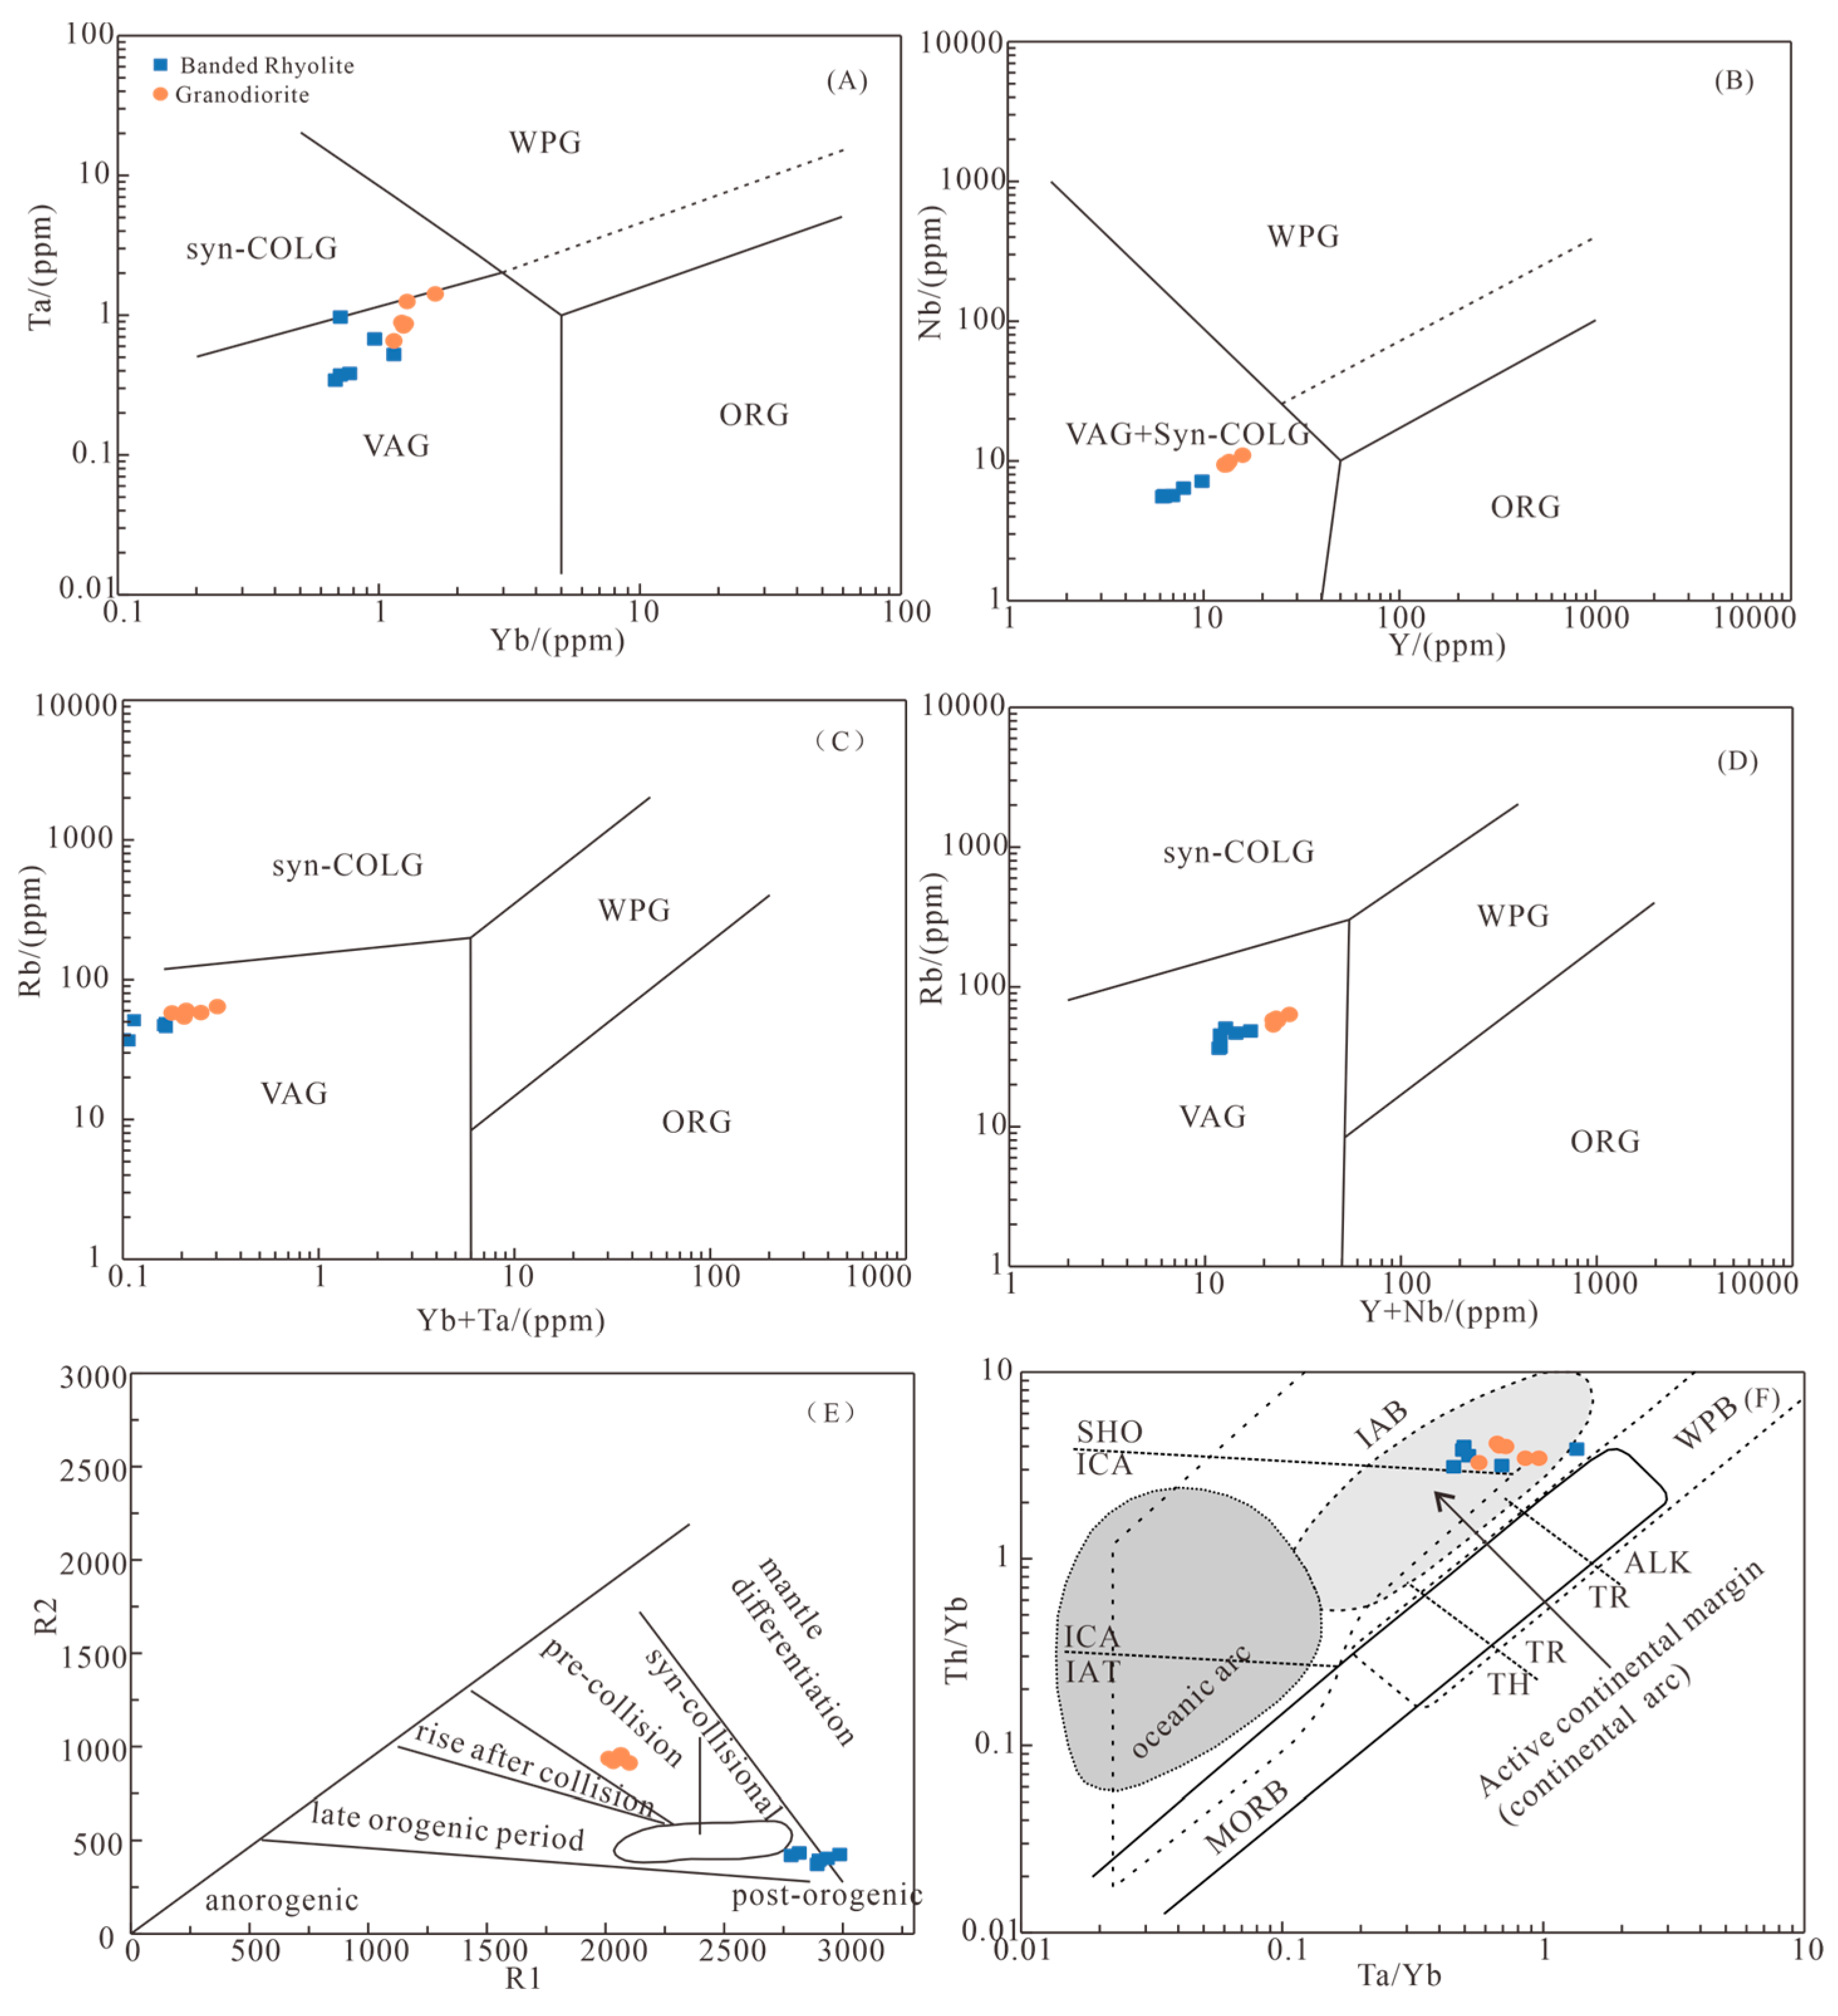
Integrated analyses of whole-rock major and trace elements indicate that both the rhyolite porphyry and granodiorite are enriched in LILEs (e.g., Rb and Pb) and depleted in Nb and other HFSEs, which is consistent with the typical geochemical characteristics of island arc magmas. On the Ta–Yb diagram (Figure 10A), all samples plot within the volcanic arc granite field. On the Nb–Y diagram (Figure 10B), the samples fall within the volcanic arc + syn-collisional granite field. On the Rb − (Yb + Ta) (Figure 10C) and Rb − (Y + Nb) (Figure 10D) diagrams, all samples also plot within the volcanic arc granite field. In addition, the R1–R2 diagram (Figure 10E) shows that the rhyolite porphyry samples plot within the post-orogenic granite field, whereas the granodiorite samples fall within the pre-collisional granite field. These results indicate a close genetic relationship between the granitoids and oceanic crust subduction processes. Considering the regional geological evolution, the rhyolite porphyry likely formed in a back-arc extensional tectonic setting following the amalgamation of the Xingkai Block and the NCC, whereas the granodiorite may have formed in response to the continuous westward subduction of the Paleo-Pacific Plate.
During the Early–Middle Jurassic, frequent regional magmatic–hydrothermal activity led to the formation of numerous hydrothermal vein-type gold deposits. Previous studies on the geodynamic setting of diagenesis and mineralization can be summarized as follows: during this period, the study area was located within the subduction regime of the Paleo-Pacific Plate, accompanied by large-scale Middle Jurassic calc-alkaline magmatic intrusions and the formation of numerous endogenic metal deposits [8,15,48,49].
The Middle Jurassic granodiorite in the Ailinwudui ore district belongs to the high-K calc-alkaline to calc-alkaline peraluminous rock series. It is enriched in LREEs and LILEs (e.g., Rb, Ba, K, Pb) and depleted in HREEs and HFSEs (e.g., Nb, Ti), displaying geochemical characteristics typical of island arc magmatic rocks [50,51,52]. On the Th/Yb–Ta/Yb diagram (Figure 10F), the granodiorite samples plot within the active continental margin field, further indicating that the granodiorite formed in association with the subduction of the Paleo-Pacific Plate. Therefore, it is concluded that the Early–Middle Jurassic diagenetic and metallogenic processes in the study area were controlled by the subduction of the Paleo-Pacific Plate.
Figure 10. Ta-Yb diagram (A), Nb-Y diagram (B), Rb − (Yb + Ta) diagram (C), Rb − (Y + Nb) diagram (D) (base maps for A, B, C, and D after [53]), R2 vs. R1 diagram (E), (base map after [54]) and (Th/Yb)/(Ta/Yb) diagram (F), (base map after [55]) for the ore-related intrusions in the study area.
Minerals 16 00469 g010

6. Conclusions

The metallogenic epoch of the Ailinwudui gold deposit is constrained to the Early–Middle Jurassic. A comparative study of the ages and geochemical characteristics of intrusive rocks in the ore district shows that the rhyolite porphyry is a pre-mineralization intrusive rock, whereas gold mineralization in the district is likely closely associated with the Middle Jurassic granodiorite.
The Ailinwudui gold deposit formed during the Early–Middle Jurassic in a tectonic setting associated with subduction of the Paleo-Pacific Plate. Comparison with the geodynamic settings of other typical gold deposits in central Jilin suggests that large-scale gold mineralization in central Jilin was triggered by Paleo-Pacific Plate subduction during the Early–Middle Jurassic.

Author Contributions

Conceptualization, C.G. and M.D.; methodology, C.G., M.D. and Y.Z.; investigation, C.G., M.D., Y.C., Z.X., Z.H., H.Z. (Hongqiang Zhao) and H.Z. (Haicheng Zhang); data curation, C.G. and Z.H.; writing—original draft preparation, C.G.; writing—review and editing, M.D. and Y.Z.; supervision and project administration, M.D. and Y.Z. All authors have read and agreed to the published version of the manuscript.

Funding

This research was funded by the China Geological Survey Project (DD20242940).

Data Availability Statement

The raw data supporting the conclusions of this article will be made available by the authors on request.

Acknowledgments

The authors thank the editor and the anonymous reviewers for their constructive comments.

Conflicts of Interest

The authors declare no conflicts of interest. The funders had no role in the design of the study; in the collection, analyses, or interpretation of data; in the writing of the manuscript; or in the decision to publish the results.

References

  1. Jahn, B.; Wu, F.Y.; Chen, B. Massive Granitoid Generation in Central Asia: Nd Isotope Evidence and Implication for Continental Growth in the Phanerozoic. Episodes 2000, 23, 82–92. [Google Scholar] [CrossRef] [PubMed]
  2. Şengör, A.M.C.; Natal’in, B.A.; Burtman, V.S. Evolution of the Altaid Tectonic Collage and Palaeozoic Crustal Growth in Eurasia. Nature 1993, 364, 299–307. [Google Scholar] [CrossRef]
  3. Xiao, W.J.; Song, D.F.; Brian, F.W.; Li, J.L.; Han, C.M.; Wan, B.; Zhang, J.E.; Ao, S.J.; Zhang, Z.Y. Research Progresses of the Accretionary Processes and Metallogenesis of the Central Asian Orogenic Belt. Sci. Sin. Terrae 2019, 49, 1512–1545. (In Chinese) [Google Scholar]
  4. Li, H.Z.; Yang, Q.; Zhang, L.G.; Ren, Y.S.; Li, M.T.; Li, C.; Wang, B.; Chen, S.T.; Peng, X.L. Ore-Forming Fluid Evolution and Ore Genesis of the Cuyu Gold Deposit in Central Jilin Province, NE China: Constraints from Geology, Fluid Inclusions, and H–O–S–Pb Isotope Studies. Minerals 2025, 15, 535. [Google Scholar] [CrossRef]
  5. Wang, S.; Sun, J.G.; Han, J.L.; Zhang, X.T.; Zhang, X.W.; Lin, Z.C. Genesis and Metallogenic Geodynamic Background of the Banmiaozi Gold Deposit in the Jiapigou Mining District, Jilin Province: Evidence from Geology, Ore-Fluid, Isotope Geochemistry and Metallogenic Chronology. Ore Geol. Rev. 2025, 187, 106940. [Google Scholar] [CrossRef]
  6. Huang, Z.X.; Yuan, W.M.; Wang, C.M.; Liu, X.W.; Xu, X.T.; Yang, L.Y. Metallogenic Epoch of the Jiapigou Gold Belt, Jilin Province, China: Constrains from Rare Earth Element, Fluid Inclusion Geochemistry and Geochronology. J. Earth Syst. Sci. 2012, 121, 1401–1420. [Google Scholar] [CrossRef]
  7. Zhang, S.; Zeng, Q.D.; Liu, J.M.; Wang, Z.C.; Wang, Y.B.; Ren, D.K.; Gao, J.H. The Characteristics and Its Geological Significance of Fluid Inclusions in Haigou Lode Gold Deposit, Jilin Province. Acta Petrol. Sin. 2011, 27, 1287–1298. (In Chinese) [Google Scholar]
  8. Yang, Q.; Ren, Y.S.; Hao, Y.J.; Wang, B.; Sun, Z.M.; Li, J.M. Ore Fluid, Geochronology and Tectonic Setting of Mesothermal Gold Metallogeny in Southeastern Jilin Province, Northeast China: A Case Study of the Shajingou Gold Deposit. Ore Geol. Rev. 2019, 109, 229–252. [Google Scholar] [CrossRef]
  9. Li, C.; Yang, Q.; Ren, Y.S.; Li, H.Z.; Chen, S.T.; Fang, Y.H.; Xu, W.T.; Wang, B.; Xu, M.F.; Shang, Q.Q. Ore Genesis of the Erdaodianzi Gold Deposit in Jilin Province, Northeast China: Constraints from Re–Os Isotopes and Geochemistry of Pyrite. Ore Geol. Rev. 2025, 186, 106830. [Google Scholar] [CrossRef]
  10. Wang, C.Z.; Chen, G.H.; Li, Q.Q.; Wang, W.B.; Chen, J.W.; Cui, X.W. Mineralization Geological Characteristics and Genesis of Ailin Gold Deposit in Jiaohe, Jilin Province. Gold Sci. Technol. 2019, 27, 328–338. (In Chinese) [Google Scholar]
  11. Wu, F.-Y.; Zhao, G.-C.; Sun, D.-Y.; Wilde, S.A.; Yang, J.-H. The Hulan Group: Its Role in the Evolution of the Central Asian Orogenic Belt of NE China. J. Asian Earth Sci. 2007, 30, 542–556. [Google Scholar] [CrossRef]
  12. Chen, Z.; Zhou, J.B.; Li, G.Y.; Wilde, S.A. The Nature and Spatial–Temporal Evolution of Suture Zones in Northeast China. Earth-Sci. Rev. 2023, 241, 104437. [Google Scholar] [CrossRef]
  13. Hou, H. Tectonic Setting and Metallogenic Significance of Late Paleozoic Volcanic Rock Series in the Yanbian Area, NE China. Ph.D. Thesis, Jilin University, Changchun, China, 2020. (In Chinese) [Google Scholar]
  14. Wu, F.Y.; Wilde, S.A.; Zhang, G.L.; Sun, D.Y. Geochronology and Petrogenesis of the Post-Orogenic Cu–Ni Sulfide-Bearing Mafic–Ultramafic Complexes in Jilin Province, NE China. J. Asian Earth Sci. 2004, 23, 781–797. [Google Scholar] [CrossRef]
  15. Zhang, Y. Study on the Geological and Geochemical Characteristics and Mineralization Mechanism of Jurassic Molybdenum Deposits in the Central and Eastern Regions of Jilin Province. Ph.D. Thesis, Jilin University, Changchun, China, 2013. (In Chinese) [Google Scholar]
  16. Yang, Q. Late Paleozoic to Early Mesozoic Gold-Copper Polymetallic Metallogeny and Metallogenic Regularity in Central Jilin Province, Northeast China. Ph.D. Thesis, Jilin University, Changchun, China, 2020. (In Chinese) [Google Scholar]
  17. Yang, X.P.; Fu, J.Y.; Wang, Y.; Liu, G.X.; Zhang, C.; Pang, X.J. Tectonic Evolution and Mineralization Constraints in Northeast China. Geol. Resour. 2024, 33, 417–446, 550. (In Chinese) [Google Scholar]
  18. Luan, Y.; He, K.; Tan, X.J. In Situ U-Pb Dating and Trace Element Determination of Standard Zircons by LA-ICP-MS. Geol. Bull. China 2019, 38, 1206–1218. (In Chinese) [Google Scholar]
  19. Liu, Y.S.; Gao, S.; Hu, Z.C.; Gao, C.G.; Zong, K.Q.; Wang, D.B. Continental and Oceanic Crust Recycling-Induced Melt-Peridotite Interactions in the Trans-North China Orogen: U-Pb Dating, Hf Isotopes and Trace Elements in Zircons from Mantle Xenoliths. J. Petrol. 2010, 51, 537–571. [Google Scholar] [CrossRef]
  20. Wang, S.S. Age Determinations of 40Ar-40K, 40Ar-39Ar and Radiogenic 40Ar Released Characteristics on K-Ar Geostandards. Chin. J. Geol. 1983, 18, 315–323. (In Chinese) [Google Scholar]
  21. Steiger, R.H.; Jäger, E. Subcommission on Geochronology: Convention on the Use of Decay Constants in Geo- and Cosmochronology. Earth Planet. Sci. Lett. 1977, 36, 359–362. [Google Scholar] [CrossRef]
  22. Lee, J.Y.; Marti, K.; Severinghaus, J.P.; Kawamura, K.; Yoo, H.S.; Lee, J.B.; Kim, J.S. A Redetermination of the Isotopic Abundances of Atmospheric Ar. Geochim. Cosmochim. Acta 2006, 70, 4507–4512. [Google Scholar] [CrossRef]
  23. Koppers, A.A.P. ArArCALC—Software for 40Ar/39Ar Age Calculations. Comput. Geosci. 2002, 28, 605–619. [Google Scholar] [CrossRef]
  24. Liang, Q.; Jing, H.; Gregoire, D.C. Determination of trace elements in granites by inductively coupled plasma mass spectrometry. Talanta 2000, 51, 507–513. [Google Scholar] [CrossRef]
  25. Bas, M.J.; Maitre, R.W.; Streckeisen, A.; Zanettin, B. A chemical classification of volcanic rocks based on the total alkali-silica diagram. J. Petrol. 1986, 27, 745–750. [Google Scholar] [CrossRef]
  26. Peccerillo, A.; Taylor, A.R. Geochemistry of Eocene calc-alkaline volcanic rocks from the Kastamonu area, Northern Turkey. Contrib. Miner. Petrol. 1976, 58, 63–81. [Google Scholar] [CrossRef]
  27. Middlemost, E.A.K. A Simple Classification of Volcanic Rocks. Bull. Volcanol. 1972, 36, 382–397. [Google Scholar] [CrossRef]
  28. Maniar, P.D.; Piccoli, P.M. Tectonic discrimination of granitoids. Geol. Soc. Am. Bull. 1989, 101, 635–643. [Google Scholar] [CrossRef]
  29. Sun, S.S.; McDonough, W.F. Chemical and Isotopic Systematics of Oceanic Basalts: Implications for Mantle Composition and Processes. Geol. Soc. Lond. Spec. Publ. 1989, 42, 313–345. [Google Scholar] [CrossRef]
  30. Wu, Y.; Zheng, Y. Genesis of zircon and its constraints on interpretation of U-Pb age. Chin. Sci. Bull. 2004, 49, 1554–1569. [Google Scholar] [CrossRef]
  31. Miao, L.C.; Qiu, Y.M.; Fan, W.M.; Zhang, F.Q.; Zhai, M.G. Geology, Geochronology, and Tectonic Setting of the Jiapigou Gold Deposits, Southern Jilin Province, China. Ore Geol. Rev. 2005, 26, 137–165. [Google Scholar] [CrossRef]
  32. Liu, J.; Li, T.G.; Duan, C. Rb-Sr Isochron Dating and Isotopic Geochemistry Characteristics of the Bajiazi Large Gold Deposit, Jilin Province, China. Acta Geol. Sin. 2018, 92, 1432–1446. (In Chinese) [Google Scholar]
  33. Zhang, X.T.; Chen, F.; Han, J.L.; Sun, J.G.; Xia, F.; Pan, J.Y.; Liu, Y.; Zhong, F.J. A Middle Triassic Gold-Forming Event of the Jiapigou Ore District, Northeast China: Evidence from Pyrite Re-Os Geochronology of the Sandaocha Deposit. Ore Geol. Rev. 2025, 186, 106827. [Google Scholar] [CrossRef]
  34. Wutiepu, W.; Yang, Y.C.; Wang, J.L.; Chen, Y.J.; Zhou, K.F.; Wang, S.S.; Han, S.J. Genesis of the Xiaobeigou Gold Deposit in the Jiapigou Gold District, Northeast China: Constraints from Fluid Inclusions, Quartz H–O Isotopes, and Pyrite in Situ Sulfur Isotope and Trace Element Compositions. Ore Geol. Rev. 2023, 159, 105545. [Google Scholar] [CrossRef]
  35. Zhang, X.T.; Sun, J.G.; Han, J.L.; Feng, Y.Y. Genesis and Ore-Forming Process of the Benqu Mesothermal Gold Deposit in the Jiapigou Ore Cluster, NE China: Constraints from Geology, Geochronology, Fluid Inclusions, and Whole-Rock and Isotope Geochemistry. Ore Geol. Rev. 2021, 130, 103956. [Google Scholar] [CrossRef]
  36. Chen, Y.L.; Li, H.; Zheng, C.Y.; Nuerganati, M.; Rehan, K. Genesis and ore prospecting model of Haigou gold deposit in Jilin Province: Evidence from LA-ICP-MS trace element and sulfur isotopic analysis of pyrite. J. Cent. South Univ. Technol. 2021, 52, 2990–3002. (In Chinese) [Google Scholar]
  37. Zhang, X.T.; Sun, J.G.; Yu, Z.T.; Song, Q.H. LA-ICP-MS Zircon U–Pb and Sericite 40Ar/39Ar Ages of the Songjianghe Gold Deposit in Southeastern Jilin Province, Northeast China, and Their Geological Significance. Can. J. Earth Sci. 2019, 56, 607–628. [Google Scholar] [CrossRef]
  38. Liu, S.F.; Wang, Q.F.; Groves, D.I.; Wang, Z.M.; Yang, L.; Wu, Z.L.; Yu, Z.Y.; Huang, P.F.; Deng, J. Adoption of a Mineral System Model in Successful Deep Exploration at Erdaogou, China’s Deepest Gold Mine, on the Northeastern Margin of the North China Craton. Ore Geol. Rev. 2021, 131, 104060. [Google Scholar] [CrossRef]
  39. Yu, J.J.; Guo, J.; Cui, P.L. Ore-Forming Geologic Settings and 40Ar/39Ar Laser Probe Dating of Fluid Inclusions in Quartzs from Haigou Gold Deposit, Yanbian City, Northeastern China. J. Jilin Univ. Earth Sci. Ed. 2010, 40, 835–844. (In Chinese) [Google Scholar]
  40. Li, L. Characteristics of Ore-Forming Fluids and Evaluation of Deep Ore-Forming Potential of Gold Deposits in the Jiapin Gully–Haigou Jincheng Mineralization Belt, Jilin Province. Ph.D. Thesis, Jilin University, Changchun, China, 2016. (In Chinese) [Google Scholar]
  41. Deng, J.; Yuan, W.M.; Carranza, E.J.M.; Yang, L.Q.; Wang, C.M.; Yang, L.Y.; Hao, N.N. Geochronology and Thermochronometry of the Jiapigou Gold Belt, Northeastern China: New Evidence for Multiple Episodes of Mineralization. J. Asian Earth Sci. 2014, 89, 10–27. [Google Scholar] [CrossRef]
  42. Wang, C.Z.; Xu, M.F.; Liu, C.J.; Zhang, C.J.; Zheng, D.H.; Li, G.J.; Jin, Z.B.; Xu, S.N.; Wang, G. Genisis and Metallogenic Background of Erdaodianzi Gold Deposit in Huadian, Jilin Province. J. Jilin Univ. Sci. Ed. 2025, 55, 139–154. (In Chinese) [Google Scholar]
  43. Zhou, J.B.; Han, J.A.; Wilde, S.A.; Guo, X.D.; Zeng, W.S.; Cao, J.L. A Primary Study of the Jilin-Heilongjiang High-Pressure Metamorphic Belt: Evidence and Tectonic Implications. Acta Petrol. Sin. 2013, 29, 386–398. (In Chinese) [Google Scholar]
  44. Zhou, J.B.; Cao, J.L.; Zeng, W.S.; Wang, B. Confirming of the Jilin-Heilongjiang High-Pressure Metamorphic Belt and Its Tectonic Implications. Chin. Sci. Bull. 2013, 58, 2266–2270. (In Chinese) [Google Scholar]
  45. Zhou, J.B.; Li, L. The Mesozoic Accretionary Complex in Northeast China: Evidence for the Accretion History of Paleo-Pacific Subduction. J. Asian Earth Sci. 2017, 145, 91–100. [Google Scholar] [CrossRef]
  46. Wu, F.Y.; Yang, J.H.; Lo, C.H.; Wilde, S.A.; Sun, D.Y.; Jahn, B.M. The Heilongjiang Group: A Jurassic Accretionary Complex in the Jiamusi Massif at the Western Pacific Margin of Northeastern China. Isl. Arc 2007, 16, 156–172. [Google Scholar] [CrossRef]
  47. Han, W.; Zhou, J.B.; Wilde, S.A.; Li, L. LA-ICPMS Zircon U–Pb Dating of the Heilongjiang Complex in the Luobei Area: New Constraints for the Late Palaeozoic-Mesozoic Tectonic Evolution of Jiamusi Block, NE China. Geol. J. 2020, 55, 1644–1669. [Google Scholar] [CrossRef]
  48. Xu, W.L.; Wang, F.; Pei, F.P.; Meng, E.; Tang, J.; Xu, M.J.; Wang, W. Mesozoic Tectonic Regimes and Regional Ore-Forming Background in NE China: Constraints from Spatial and Temporal Variations of Mesozoic Volcanic Rock Associations. Acta Petrol. Sin. 2013, 29, 339–353. (In Chinese) [Google Scholar]
  49. Wang, Z.G.; Wang, K.Y.; Wan, D.; Konare, Y.; Yang, T.N.; Liang, Y.H. Metallogenic Age and Hydrothermal Evolution of the Jidetun Mo Deposit in Central Jilin Province, Northeast China: Evidence from Fluid Inclusions, Isotope Systematics, and Geochronology. Ore Geol. Rev. 2017, 89, 731–751. [Google Scholar] [CrossRef]
  50. Burke, K. Orogenic Andesites and Plate Tectonics. Precambr. Res. 1983, 19, 317–318. [Google Scholar] [CrossRef]
  51. Deering, C.D.; Vogel, T.A.; Patino, L.C.; Alvarado, G.E. Origin of Distinct Silicic Magma Types from the Guachipelín Caldera, NW Costa Rica: Evidence for Magma Mixing and Protracted Subvolcanic Residence. J. Volcanol. Geotherm. Res. 2007, 165, 103–126. [Google Scholar] [CrossRef]
  52. Meng, Q.R. What Drove Late Mesozoic Extension of the Northern China–Mongolia Tract? Tectonophysics 2003, 369, 155–174. [Google Scholar] [CrossRef]
  53. Pearce, J.A.; Harris, N.B.W.; Tindle, A.G. Trace Element Discrimination Diagrams for the Tectonic Interpretation of Granitic Rocks. J. Petrol. 1984, 25, 956–983. [Google Scholar] [CrossRef]
  54. Batchelor, R.A.; Bowden, P. Petrogenetic Interpretation of Granitoid Rock Series Using Multicationic Parameters. Chem. Geol. 1985, 48, 43–55. [Google Scholar] [CrossRef]
  55. Di, P.F.; Wang, J.R.; Zhang, Q.; Yang, J.; Chen, W.F.; Pan, Z.J.; Du, X.L.; Jiao, S.T. The Evaluation of Basalt Tectonic Discrimination Diagrams: Constraints on the Research of Global Basalt Data. Bull. Mineral. Petrol. Geochem. 2017, 36, 891–896, 879. (In Chinese) [Google Scholar]
Figure 2. Geological map of the Ailinwudui gold deposit. 1—Quaternary low floodplain deposits; 2—Silty slate of the Upper Permian Fanjiatun Formation; 3—Early Jurassic monzogranite; 4—Middle Jurassic granodiorite; 5—Late Triassic rhyolite porphyry; 6—Inferred fault; 7—Orebody and Number; 8—Zircon U-Pb sampling site; 9—Muscovite 40Ar-39Ar sampling site; 10—Geological boundary.
Minerals 16 00469 g002
Figure 3. Metallogenic stages and mineral paragenetic sequence of the Ailinwudui gold deposit.
Minerals 16 00469 g003
Figure 4. Characteristics of mineralization and alteration zones in hand specimens and under microscope from the Ailinwudui gold deposit. (A) Layered quartz vein with minor magnetite in Pre-ore stage. (B) Euhedral–subhedral granular magnetite in Pre-ore stage quartz vein. (C) Intersection of structural fracture zones in Quartz–pyrite stage. (D) Extensional fractures filled with quartz veins, cementing slate fragments to form fractured altered ore in Quartz–pyrite stage. (E) Subhedral–anhedral granular pyrrhotite and pyrite in Quartz–pyrite stage. (F) Quartz vein containing xenoliths of silty slate in Polymetallic sulfide stage. (G) Quartz vein containing xenoliths of altered rock with disseminated pyrite and marcasite in Polymetallic sulfide stage. (H) Quartz–sulfide micro-veins cutting silty slate in Polymetallic sulfide stage. (I) Intergrowth of pyrite and marcasite replacing early pyrrhotite in Polymetallic sulfide stage. (J) Native gold occurred in Polymetallic sulfide stage. (K) Fine pyrite veins in slate in Polymetallic sulfide stage. (L) Fine pyrite veins of Polymetallic sulfide stage cutting Pre-ore-stage silicified veins and crosscut by late calcite veins of Polymetallic sulfide stage. Abbreviations: Gl = native gold; Py = pyrite; Po = pyrrhotite; Mrc = marcasite; Ccp = chalcopyrite; Mag = magnetite; Qtz = quartz.
Minerals 16 00469 g004
Figure 5. TAS diagram (A) (The data for the boundaries or classification intervals are derived from Reference [25]), K2O–SiO2 diagram. (B) (The data for the boundaries or classification intervals are derived from Reference [26]), K2O–Na2O diagram. (C) (The data for the boundaries or classification intervals are derived from Reference [27]), A/NK vs. A/CNK diagram. (D) (The data for the boundaries or classification intervals are derived from Reference [28]) for granodiorite and rhyolite porphyry from the Ailinwudui gold deposit.
Minerals 16 00469 g005
Figure 6. Chondrite-normalized rare earth element distribution patterns. (A) (Chondrite standard values data source [29]) and primitive mantle-normalized trace element spider diagrams. (B) (Primitive mantle standard values data source [29]) of granodiorite and rhyolite porphyry in the Ailinwudui ore district.
Minerals 16 00469 g006
Figure 7. Cathodoluminescence (CL) images of zircons from the granodiorite (A) and rhyolite porphyry (B) in the Ailinwudui mining area.
Minerals 16 00469 g007
Figure 8. Zircon U-Pb concordia curves and weighted mean ages of the granodiorite (A) and rhyolite porphyry (B) in the Ailinwudui mining area.
Minerals 16 00469 g008
Figure 9. (A) 40Ar-39Ar-weighted mean plateau age, (B) 40Ar-39Ar isochronal line age, and (C) 40Ar-39Ar inverse isochronal line age of muscovite samples.
Minerals 16 00469 g009
Table 1. Major element compositions of granodiorite and rhyolite porphyry from the Ailinwudui ore district (wt.%).
NumberGS01GS02GS03GS04GS05GS06GS07GS08GS09GS10GS11GS12
RockGranodioriteRhyolitic Porphyry
SiO262.7661.9662.2762.0062.5762.4774.4975.8074.6475.4676.0776.16
TiO2<0.01<0.01<0.01<0.01<0.01<0.01<0.01<0.01<0.01<0.01<0.01<0.01
Al2O316.7417.4617.0517.2816.9917.0914.8113.7114.9114.4114.0714.25
TFe2O35.485.495.175.545.445.451.051.241.151.210.991.21
FeO4.484.144.004.334.334.270.871.091.020.960.851.07
MgO3.162.763.723.392.842.681.821.721.231.131.310.87
MnO<0.01<0.01<0.01<0.01<0.01<0.01<0.01<0.01<0.01<0.01<0.01<0.01
CaO3.824.083.904.014.134.040.480.630.590.600.490.45
Na2O3.863.933.913.924.064.064.124.054.274.064.544.52
K2O2.482.512.402.292.252.392.121.822.101.951.541.63
P2O5<0.01<0.01<0.01<0.01<0.01<0.01<0.01<0.01<0.01<0.01<0.01<0.01
LOI0.660.710.550.540.640.731.061.011.061.140.930.87
TOTAL98.9698.9098.9798.9798.9298.9199.9599.9899.9599.9699.9499.96
Na2O/K2O1.561.571.631.711.801.701.942.232.032.082.952.77
A/NK1.851.901.891.941.861.841.631.591.601.641.541.55
A/CNK1.051.051.061.071.021.031.491.401.441.461.401.42
M#575764605655807468697459
σ2.002.142.031.991.992.091.231.051.281.111.111.14
R1226621712224222922322192303632202999316431263117
R2914937956956937922437427422408398375
Table 2. Rare earth and trace element compositions of granodiorite and rhyolite porphyry from the Ailinwudui ore district (10−6).
SampleGS01GS02GS03GS04GS05GS06GS07GS08GS09GS10GS11GS12
RockGranodioriteRhyolitic Porphyry
Rb52.957.562.756.856.55947.944.85046.136.636
Ba624622660642604594312306298295206221
Th5.164.885.694.443.745.083.552.762.953.042.722.54
U0.961.130.990.830.720.921.661.191.241.381.281.16
Nb9.549.4411.1109.489.797.235.715.736.455.635.61
Ta0.830.881.411.240.650.860.520.960.380.670.340.37
Be1.97 1.93 2.01 2.13 1.76 2.00 1.61.681.921.691.51.48
Co 11.10 10.10 10.40 10.90 10.70 10.30 <1.01.13<1.01<1.0<1.0
Cu 17.60 23.70 9.33 11.20 8.43 11.50 7.253.63.192.984.114.15
Ga 22.30 22.90 23.80 23.90 23.20 23.00 1817.11817.316.215.7
Li 25.90 22.60 24.70 24.70 26.10 28.60 8.068.287.57.74.835.03
Ni 24.40 4.18 4.24 5.52 6.45 6.39 <2.0<2.0<2.03.04<2.06.65
Sc 11.50 12.40 13.60 14.40 12.10 13.80 3.486.33.435.174.473.42
Sn 1.84 2.03 1.85 1.46 1.23 1.34 1.991.631.21.761.641.98
V 53.40 56.60 55.60 59.00 56.80 60.00 <5.0<5.0<5.0<5.0<5.0<5.0
Zn 84.90 84.40 87.40 90.00 80.60 83.80 9.3512.410.57.749.127.2
La30.329.33025.621.228.115.61313.813.312.911.8
Ce53.858.75852.741.849.82622.72422.822.920.7
Pb16.614.615.515.214.216.639.824.31216.412.612.7
Pr7.417.327.146.625.57.33.442.953.043.022.932.63
Sr362379386400399388161184193135124107
Nd29.328.228.127.122.828.812.610.611.211.1119.75
Sm5.25.035.225.094.575.312.31.81.941.972.081.78
Zr21921225822021922299.870.272.489.269.754.7
Hf6.776.487.916.676.386.7242.842.933.572.922.9
Eu1.591.61.681.681.531.570.490.460.480.460.470.37
Gd4.24.224.44.063.74.181.971.551.641.721.661.45
Tb0.570.570.660.570.560.590.330.20.230.260.230.22
Dy2.932.983.4932.852.981.851.171.271.491.251.19
Ho0.520.510.610.520.490.510.360.230.250.290.230.22
Y12.812.815.813.513.113.39.826.256.967.896.316.14
Er1.371.351.731.411.291.341.070.660.750.880.690.65
Tm0.190.190.250.20.190.20.170.110.120.140.10.1
Yb1.241.221.641.281.141.261.140.710.770.960.680.71
Lu0.160.160.210.160.180.170.160.0990.110.150.110.11
ΣREE138.78 141.35 143.13 129.99 107.80 132.11 67.48 56.24 59.60 58.54 57.23 51.68
LREE127.60 130.15 130.14 118.79 97.40 120.88 60.43 51.51 54.46 52.65 52.28 47.03
HREE11.18 11.20 12.99 11.20 10.40 11.23 7.05 4.73 5.14 5.89 4.95 4.65
LREE/HREE11.41 11.62 10.02 10.61 9.37 10.76 8.57 10.89 10.60 8.94 10.56 10.11
LaN/YbN17.53 17.23 13.12 14.35 13.34 16.00 9.82 13.13 12.86 9.94 13.61 11.92
δEu1.04 1.06 1.07 1.13 1.14 1.02 0.70 0.84 0.82 0.76 0.77 0.70
δCe0.88 0.98 0.97 0.99 0.95 0.85 0.87 0.90 0.91 0.88 0.91 0.91
Table 3. LA-ICP-MS zircon U-Th-Pb isotopic data of granodiorite from the Ailinwudui mining area.
NumberThUTh/UIsotope RatioAge (Ma)
(mg/kg)(mg/kg)207Pb/
206Pb
207Pb/
235U
206Pb/
238U
207Pb/
206Pb
207Pb/
235U
206Pb/
238U
159980.600.05080.00450.19080.01720.02730.0009232212177151746
237880.420.05130.00350.19240.01260.02720.0006257153179111734
3481020.470.04910.00260.18530.00990.02760.000615412117391764
455990.550.05080.00260.18630.00930.02670.000423211717381702
5421340.310.04930.00190.18720.00730.02770.00041658617461762
61072390.450.05120.00150.19320.00540.02740.00032546717951742
734890.390.05000.00220.18640.00800.02740.00041989917471742
8721720.420.04970.00390.18850.01610.02710.0006189165175141724
944790.560.05160.00290.18930.01050.02700.000426513117691723
101803330.540.05110.00130.19240.00500.02730.00032565717941732
11821950.420.04980.00150.18930.00580.02760.00031876817651752
12501630.300.05010.00160.18860.00610.02730.000319810517551742
132073070.670.05000.00130.18880.00470.02750.00031982917641752
141031890.540.04950.00160.18930.00630.02760.00031728117651762
1529890.330.04920.00240.18680.00910.02760.000516714517481763
161072220.480.04840.00160.18560.00580.02800.00041207817351783
1730730.410.05200.00310.19050.01090.02680.000528313717791713
18721920.370.04820.00180.18130.00670.02750.00031098916961752
19541460.370.05050.00610.18970.02280.02740.0008220256176191745
20511470.350.04880.00170.18300.00650.02730.00032008117161742
21511320.390.04980.00390.18340.01370.02690.0006183183171121714
226011830.050.04990.00430.18620.01610.02720.0007191193173141734
23761360.560.05190.00230.19490.00780.02760.000328010018171752
242742181.260.05210.00220.19680.00930.02740.000828710118281745
25511690.310.04950.00180.18820.00660.02790.00031728717561772
261372080.660.05040.00460.19340.01860.02770.0008213200180161765
27401060.380.04820.00200.18750.00800.02840.000410910017571802
28751850.400.04980.00150.18750.00570.02750.00031837217551752
2932870.380.05100.00310.19500.01080.02750.000424314118191752
30521110.470.04920.00210.18560.00750.02760.00031549817361752
Table 4. LA-ICP-MS zircon U-Th-Pb isotopic data of rhyolite porphyry from the Ailinwudui mining area.
NumberTh
(mg/kg)
U
(mg/kg)
Th/UIsotope RatioAge (Ma)
207Pb/
206Pb
207Pb/
235U
206Pb/
238U
207Pb/206Pb207Pb/
235U
206Pb/
238U
1882160.410.05140.00220.23320.01030.03290.00042579421392083
21654150.400.05160.00110.23210.00690.03270.00072655221262074
31053060.340.05110.00140.23600.00640.03350.00042565821552122
42344930.480.05150.00140.23270.00820.03270.00082655621272075
52426430.380.05310.00140.23470.01000.03210.00123325921482037
6802100.380.05220.00270.23080.01170.03210.0006295120211102044
71102540.430.05150.00230.23460.01150.03270.00052659721492073
8962830.340.05020.00170.23000.00730.03320.00042067621062112
91776520.270.05220.00120.23440.00760.03240.00073005221462064
10772600.290.05240.00370.23360.01480.03250.0006306129213122064
111173440.340.05220.00150.23410.00800.03230.00062956721472054
12852540.340.05160.00210.23300.01010.03250.00043339421382063
132547030.360.05370.00250.23730.01140.03190.000436710421692022
14552290.240.05110.00220.23480.01040.03320.00052569821492103
171152160.530.05170.00120.23780.00560.03340.00032725421752122
181283680.350.05330.00260.23420.01000.03200.000434311121482033
192505230.480.05120.00110.23340.00600.03290.00052564821352093
201383010.460.05070.00120.23510.00530.03370.00032285621442132
21481500.320.05060.00350.23470.01460.03410.0005233161214122163
22743630.200.04970.00130.22940.00670.03340.00041896121052123
231183220.370.05040.00340.23490.01560.03370.0004217157214132143
241022230.460.05010.00140.23020.00600.03340.00042113221052122
252746620.410.04980.00110.22870.00630.03340.00071835220952125
261434360.330.05020.00100.23120.00580.03330.00052064421152113
27471310.360.05180.00310.22700.01020.03240.000527613920882053
291242840.440.05200.00180.23500.00720.03290.00042837521462082
301592330.680.05080.00170.23480.00760.03350.00032327621462122
Table 5. 40Ar-39Ar data of muscovite from the Ailinwudui gold deposit.
T36Ar [V]37Ar [V]38Ar [V]39Ar [V]40Ar [V]40ArR%39Ar (K) (%)Age/Ma
7000.0010320.00045810.0003470.0141510.57365446.290530.28461150.990817.20351
7800.0009110.00023710.0006380.0379011.15118376.360980.762293184.85135.246958
8400.0012250.00029930.0010560.0683851.95901381.310651.375417185.6043.359324
8900.0013060.0011910.001340.0876792.40180983.755441.763467182.95512.987193
9400.0029480.00080360.0047120.3540088.86486790.0557.12016179.97591.894283
9700.0023560.0010290.013461.08294825.0361297.1730721.78133179.32151.736011
9900.0008480.00029620.0081430.66523415.2523498.3227313.37985179.91631.735664
10200.0007210.00194850.0065680.53424412.2322398.2234810.74523179.5091.766921
10700.0008360.0004060.0059930.48566611.2158797.756519.768195180.1631.766382
11400.001110.00073010.0041950.334227.91147195.79496.722153180.92531.85386
12500.0014270.00280750.0062980.50976712.0419596.4460310.25291181.7371.76879
13500.0015280.0039630.0091520.73534417.1841397.3297514.78991181.44791.757894
14000.0013210.00165450.0008560.0623731.8108978.21921.254476181.1843.851589
Table 6. Geochronological data of representative gold deposits in the Central part of Jilin Province.
Gold DepositRock/MineralAge (Ma)Isotope SystemReferences
HaigouQuartz fluid inclusion172–170Ar-Ar[39]
Sericite162 ± 1Ar-Ar[40]
Quartz fluid inclusion172–170Ar-Ar[39]
SidaochaHydrothermal K-feldspar170 ± 3Ar-Ar[41]
ErdaogouZircon156 ± 15Fission track[41]
JinlingZircon170U-Pb[41]
JiapigoubenquZircon167U-Pb[41]
Zircon167 ± 3U-Pb[40]
Sulfide176 ± 5Rb–Sr[35]
ShajingouZircon172 ± 1U-Pb[8]
Pyrite166 ± 29Re–Os [8]
ErdaodianziZircon193 ± 2U-Pb[42]
Pyrite172 ± 3Re–Os [9]
AilinwuduiZircon174 ± 0.9U-PbThis paper
Muscovite180 ± 1.8Ar-ArThis paper
Rutile174 ± 4.0U-PbUnpublished internal materials
Disclaimer/Publisher’s Note: The statements, opinions and data contained in all publications are solely those of the individual author(s) and contributor(s) and not of MDPI and/or the editor(s). MDPI and/or the editor(s) disclaim responsibility for any injury to people or property resulting from any ideas, methods, instructions or products referred to in the content.