Article

Lithofacies-Constrained Pore Networks in Lacustrine Shales: Multi-Scale Characterization of the Lower Cretaceous Shahezi Formation, NE China


1
State Key Laboratory of Continental Shale Oil, Daqing 163712, China
2
Exploration and Development Research Institute of Daqing Oilfield Co., Ltd., Daqing 163712, China
*
Author to whom correspondence should be addressed.
Minerals 2026, 16(4), 410; https://doi.org/10.3390/min16040410
Submission received: 9 February 2026 / Revised: 31 March 2026 / Accepted: 3 April 2026 / Published: 16 April 2026

Abstract

This study investigates the heterogeneity of pore structures in lacustrine shale gas reservoirs, with a specific focus on shales from the Lower Cretaceous Shahezi Formation in the Lishu Fault Sag of the Songliao Basin. By integrating multi-scale characterization techniques—including high-pressure mercury intrusion, N2/CO2 adsorption, and nuclear magnetic resonance (NMR)—we examined the pore networks across five identified lithofacies: organic-rich clayey shale, organic-rich mixed shale, organic-rich siliceous shale, organic clayey shale, and organic mixed shale. The results indicate that mesopores (2–50 nm) constitute the dominant fraction of pore volume (31.7%–56.6%), followed by micropores (<2 nm) and macropores (>10 μm). Notable lithofacies-dependent variations were observed: organic-rich clayey shale exhibits abundant organic pores, clay interlayer pores, and intragranular dissolution pores with favorable connectivity; organic-rich siliceous shale is mainly dominated by inorganic pores with limited organic porosity; mixed shales are characterized by clay mineral contraction fractures and intergranular pores. The key controlling factors are mineral composition and organic matter abundance: clay content shows a positive correlation with pore volume and surface area in organic-rich clayey shale, but a negative correlation in organic mixed shale. Brittle minerals (quartz and feldspar) generally reduce porosity through compaction. Total organic carbon (TOC) displays a weak positive correlation with mesopore volume, while thermal maturity (Ro = 1.2%–1.73%) exerts influences that vary by lithofacies. In contrast to marine shales—which are dominated by high-maturity (Ro > 2.0%) organic pores and quartz-supported frameworks—terrestrial shales primarily rely on inorganic pores derived from clay minerals (e.g., illite). This study clarifies the relationships among lithofacies, pore structure, and controlling factors, thereby providing a basis for evaluating the gas potential of terrestrial shales.

1. Introduction

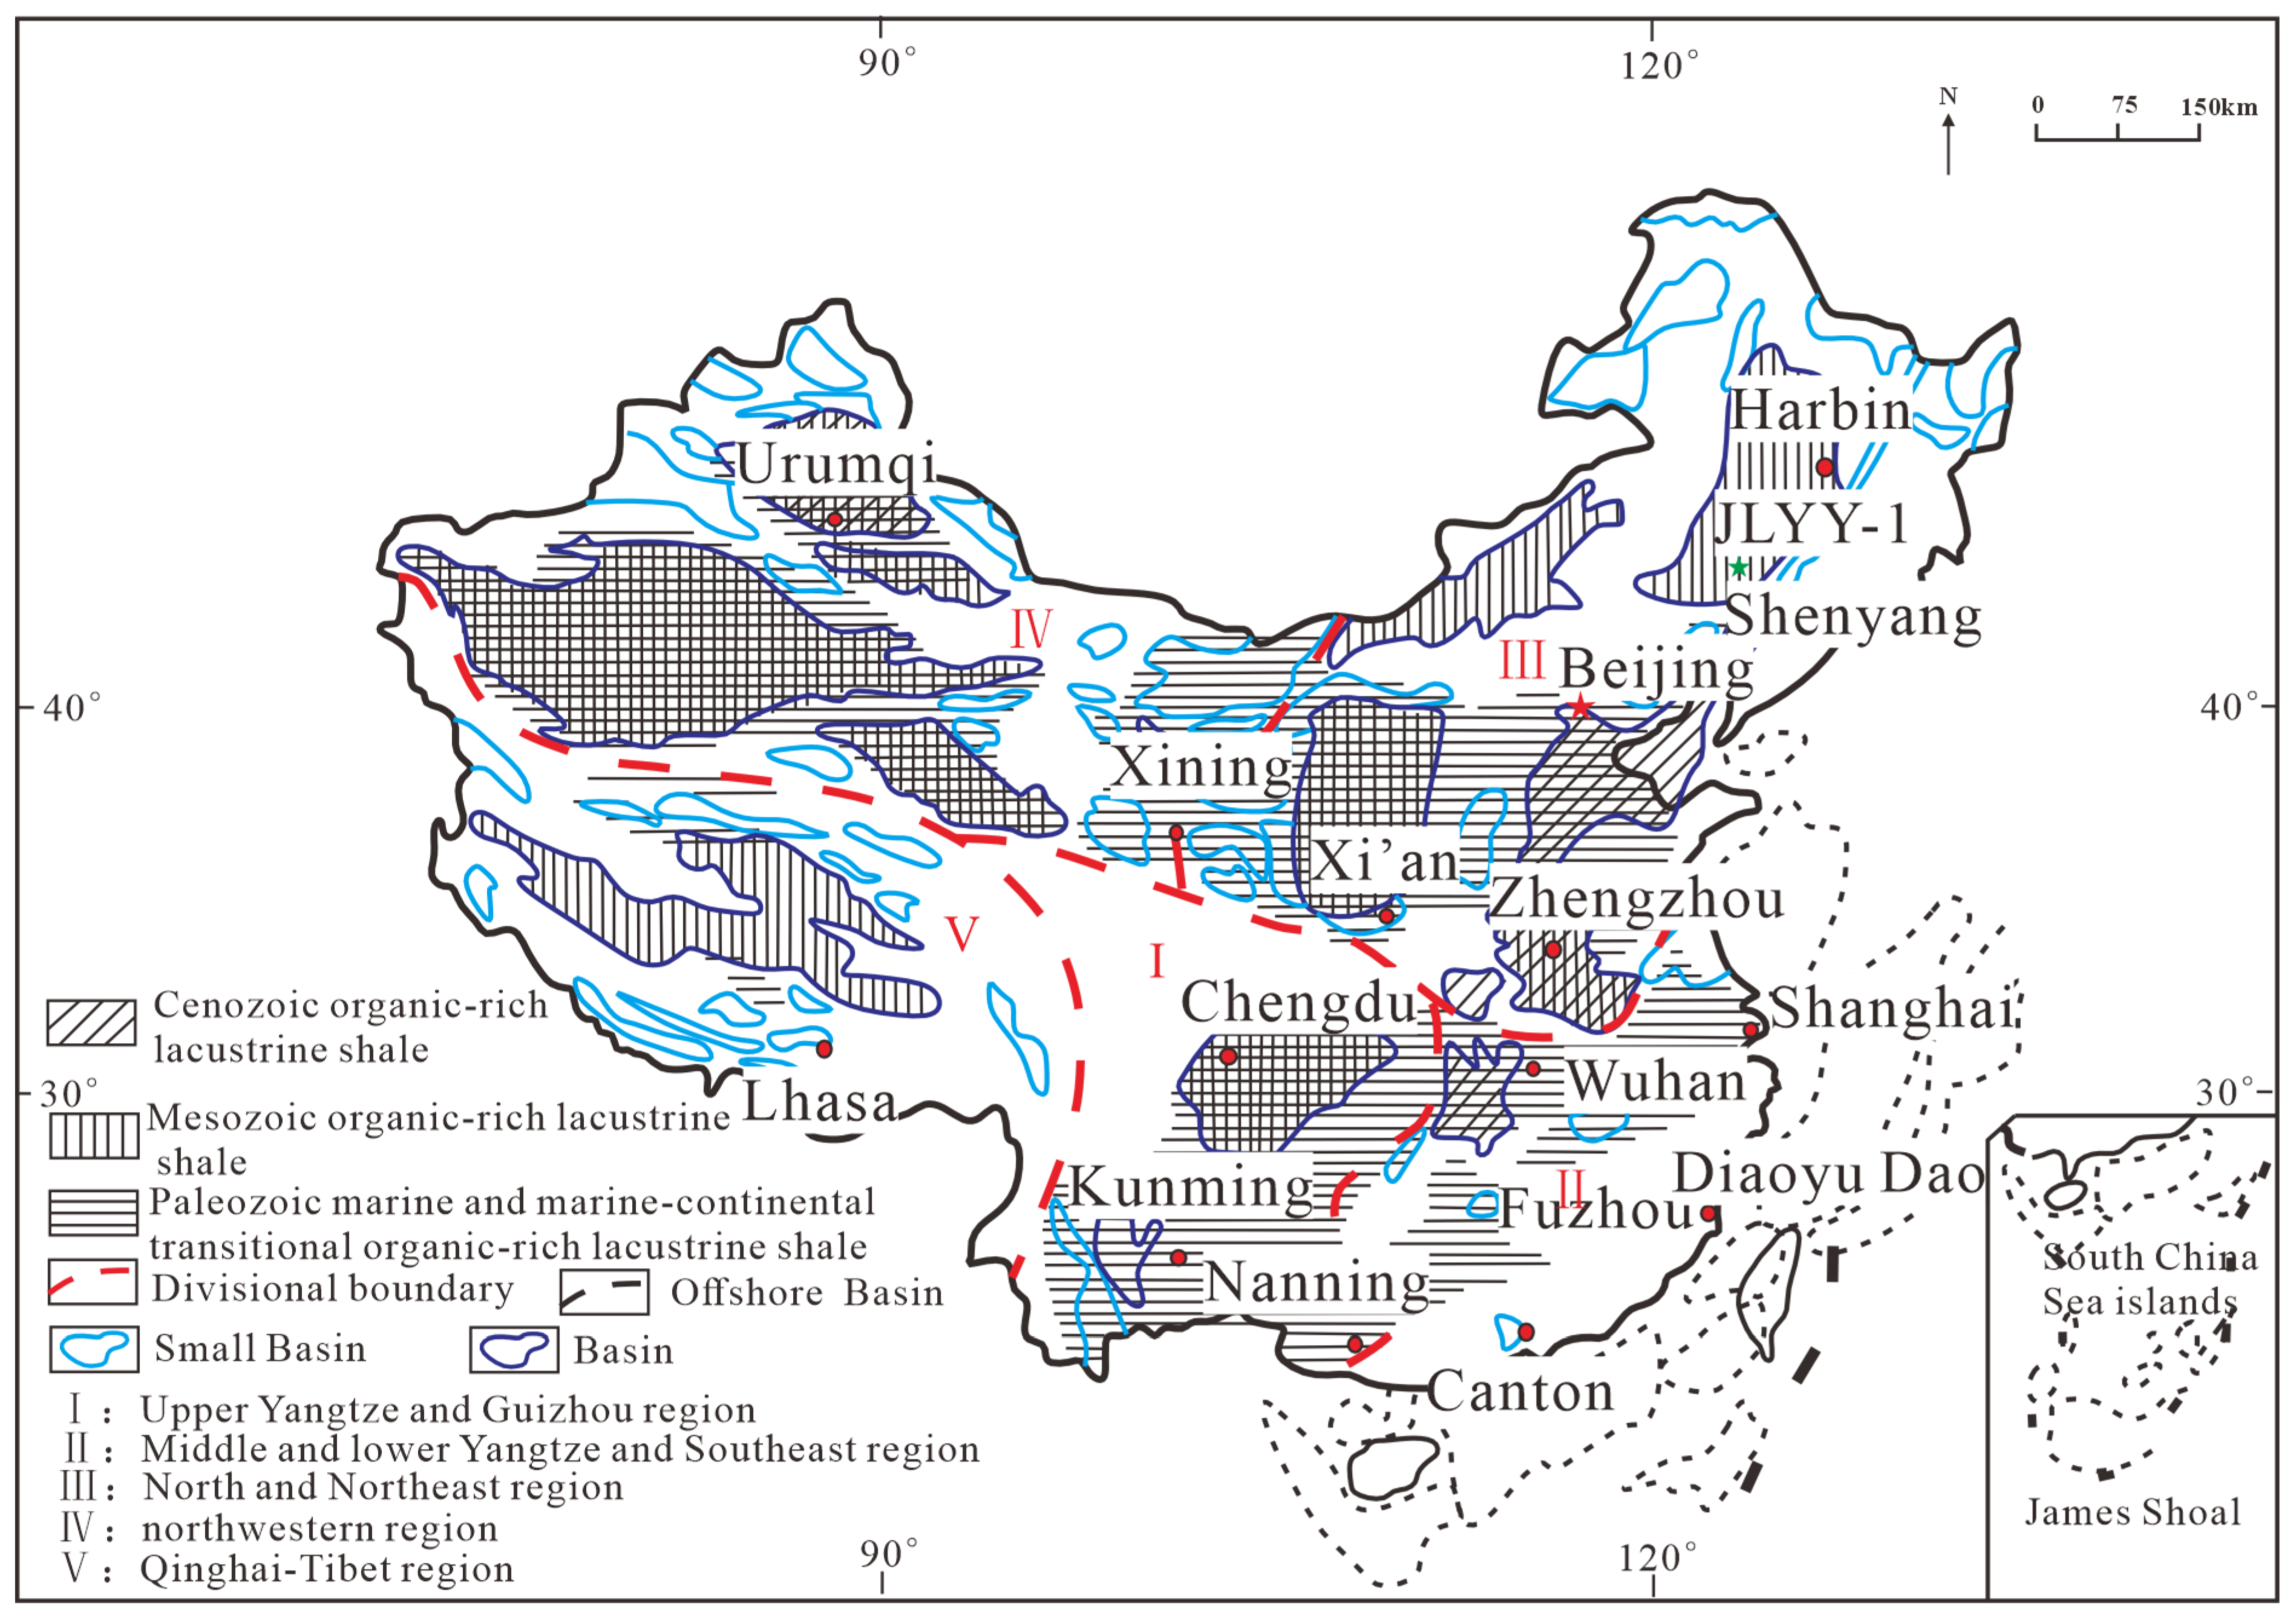
Shale gas, an important clean energy resource [1,2], refers to natural gas accumulated and preserved in the nanoscale pores of organic-rich black shale. Shale itself is a fine-grained, fissile sedimentary rock formed via the compaction and lithification of clay- and silt-sized sediments, with well-developed sedimentary lamination. Organic-rich black shale, as a high-quality hydrocarbon source rock, provides both the material basis for natural gas generation and the effective storage space for the generated hydrocarbons, which endows shale gas with its core characteristic of self-generation and self-storage [3,4]. Globally, the majority of shale gas reserves are sourced from marine shales, including the Barnett Shale in the Fort Worth Basin of the United States, the Horn River Shale in the Western Canadian Sedimentary Basin, and the Longmaxi Shale in China’s Sichuan Basin, with only a minor proportion originating from non-marine shales [5]. In China, marine shales are mainly distributed across the Sichuan Basin and the southern China. Shale formations are also developed in several other basins, including the Bohai Bay Basin, Ordos Basin, Qaidam Basin, and Tarim Basin, although they generally occur at greater depths [5]. Transitional marine–terrestrial shales are predominantly found in the Bohai Bay Basin of northern China, the Ordos Basin, the Sichuan Basin, and Shanxi Province. Terrestrial shales are largely distributed in the Ordos Basin of the northwest region, the Songliao Basin of the northeast, and the Sichuan Basin (Figure 1) [6]. Marine shale resources are abundant, with mature exploration and development technologies. They are characterized by high organic matter content (TOC > 2%), high thermal maturity (Ro > 1.0%), and high proportion of brittle minerals (quartz and carbonate rocks > 40%), rendering them suitable for large-scale hydraulic fracturing. China possesses substantial shale gas resources, and several major marine shale gas fields with reserves exceeding one trillion cubic meters have been discovered in the Upper Ordovician Wufeng Formation and Silurian Longmaxi Formation (Llandovery Series) of the Sichuan Basin, where large-scale commercial development has been achieved [7]. In contrast, widely distributed terrestrial shales—such as those in the Cretaceous formations of the Songliao Basin, the Paleogene of the Bohai Bay Basin, the Triassic in the Ordos Basin, the Permian in the Junggar Basin, and the Jurassic in the Sichuan Basin—have not yet achieved commercial breakthroughs despite their significant potential. Terrestrial shale gas reservoirs were predominantly deposited in lacustrine environments, where depositional conditions changed rapidly. Although terrestrial mudstones and shales are generally fine-grained, they commonly occur as interbeds of mudstones and siltstones. Individual dark mud-shale units are relatively thin and exhibit strong vertical heterogeneity. These deposits not only show rapid vertical lithological variations but also significant lateral heterogeneity [8]. Stable terrestrial shales typically have high a clay mineral content, with lower proportions of brittle minerals such as carbonates, quartz, and feldspar than marine shales, as well as poorer porosity and permeability. They are characterized by limited lateral continuity, strong heterogeneity, rapid facies changes horizontally, and thin, organic-rich layers with sharp vertical lithological variations. These attributes pose considerable challenges for the exploration and development of terrestrial shale gas. To date, commercial gas flows have only been obtained from terrestrial shales in the Jurassic of the Sichuan Basin and the Triassic Yanchang Formation of the Ordos Basin, with no major breakthroughs achieved in terrestrial shale gas exploration overall [5,6,7,8].
Extensive research has demonstrated that the complex pore system of shale is a key factor controlling hydrocarbon occurrence and distribution in shale reservoirs [9,10]. Compared with conventional sandstone reservoirs, shale gas reservoirs are characterized by smaller more complex pores, with pore sizes predominantly in the nanometer scale. In contrast to high-maturity marine shales, the low thermal maturity and high clay content of terrestrial shales lead to significant differences in pore types and pore structures between the terrestrial and marine shales. These differences are closely associated with the lithofacies of terrestrial shales. Siliceous shales are dominated by intergranular pores, calcareous shales feature well-developed dissolution pores, high-maturity shales are predominated by organic matter pores; and bedded shales contain highly developed fractures. Systematic studies on the pore structure characteristics of different lithofacies in terrestrial shales remain limited, as well as on the systematic comparison of such structures between terrestrial and marine shales.
Currently, a variety of experimental techniques are available to characterize the complex pore structure in shale, including microscopic observation, radiation detection, and fluid intrusion methods [11,12,13]. Microscopic observation techniques are applied to characterize pore types, spatial distribution, geometric morphology, and size, including field emission scanning electron microscopy (FE-SEM), transmission electron microscopy (TEM), computed tomography (CT) scanning, and focused ion beam scanning electron microscopy (FIB-SEM) [14,15,16,17,18,19,20]. Radiation detection techniques, represented by small-angle and ultra-small-angle neutron scattering (SANS/USANS), also serve as important approaches for pore structure characterization of shale reservoirs [10,21,22,23,24,25]. Compared to the above two methods, which are primarily qualitative in nature, fluid intrusion methods are currently the most widely used techniques for quantitative characterization of pore shape, pore size distribution (PSD), pore volume (PV), and specific surface area (SSA). These methods mainly include low-pressure gas adsorption/desorption experiments, mercury injection, and helium pycnometry [15,16,21,26,27,28,29,30,31,32,33]. Due to the intrinsic petrophysical properties of shale and the applicable conditions of each testing technique, all methods have inherent limitations. For example, mercury is a non-wetting phase fluid that struggles to penetrate the nanoscale pores of shale. Meanwhile, high-pressure mercury injection may create artificial fractures, so this technique is primarily used to analyze pores in the macropore range, making it particularly suited for calculating pore size distributions in pores ranging from 30 nm to 200 μm [9]. Low-pressure nitrogen physisorption experiments are performed at −196 °C; at this ultra-low temperature, nitrogen molecules have insufficient kinetic energy to enter smaller nanoscale pores. Therefore, the low-pressure nitrogen physical adsorption method uses the BJR model to calculate the pore size distribution of mesopores (2–50 nm), employs the BET equation to determine the specific surface area based on low-pressure nitrogen physical adsorption analysis, and utilizes the BJH model to calculate the pore volume. In comparison, carbon dioxide physical adsorption is conducted at 0 °C, which provides the necessary molecular kinetic energy for carbon dioxide molecules to enter micropores with diameters close to 0.35 nm. Therefore, carbon dioxide physical adsorption can effectively detect micropores, and the DR model can be used to calculate the pore size distribution of micropores. Thus, the combined use of multiple methods can effectively characterize the pore size distribution across the entire pore size range while significantly improving the characterization accuracy of micropore structures. The exploration of shale oil in the Qing Shan Kou Formation of the Upper Cretaceous in the Songliao Basin has achieved significant breakthroughs, enabling the commercial development of terrestrial shale oil. Multiple organic-rich shale intervals (hereafter referred to as EKS shales), represented by the Shahezi Formation, are also well developed in the Lower Cretaceous of the Songliao Basin. These shales have moderate burial depths ranging from 2800 to 4000 m, are widely distributed with significant thickness, and exhibit high organic matter content and maturity (1.3%–1.5% Ro), making them favorable accumulation zones for terrestrial shale gas. The latest terrestrial shale exploration well, JYY1, in the Lishu Fault Sag in the Songliao Basin achieved a high-yield shale gas flow of 7.6 × 10⁴ m3 per day from the Shahezi Formation shale and also produced a small amount of condensate oil, marking a major breakthrough in the investigation of terrestrial shale gas in the Shahezi Formation of the Songliao Basin. Shale of the Shahezi Formation is a fine-grained sedimentary rock with lamellar or flaky bedding and a particle size of less than 0.0625 mm, which conforms to the definition specified in the Chinese National Standard (GB/T 38718—2020) [34]. Based on a lithofacies classification of the EKS shales from the Lishu Fault Sag, Songliao Basin, this study employs a multi-technique approach—integrating low-pressure nitrogen adsorption, carbon dioxide adsorption, nuclear magnetic resonance, and high-pressure mercury injection—to characterize the pore structures of different lithofacies. Furthermore, a systematic comparison is made with marine shales. The objectives are to: (1) elucidate the geological characteristics and pore structure differences among terrestrial shale lithofacies; (2) identify the factors controlling pore structure development in terrestrial shales; and (3) clarify the key differences between terrestrial and marine shale systems.
Figure 1. Distribution map of organic-rich mudstone in China (according to [35]).
Minerals 16 00410 g001

2. Geological Setting

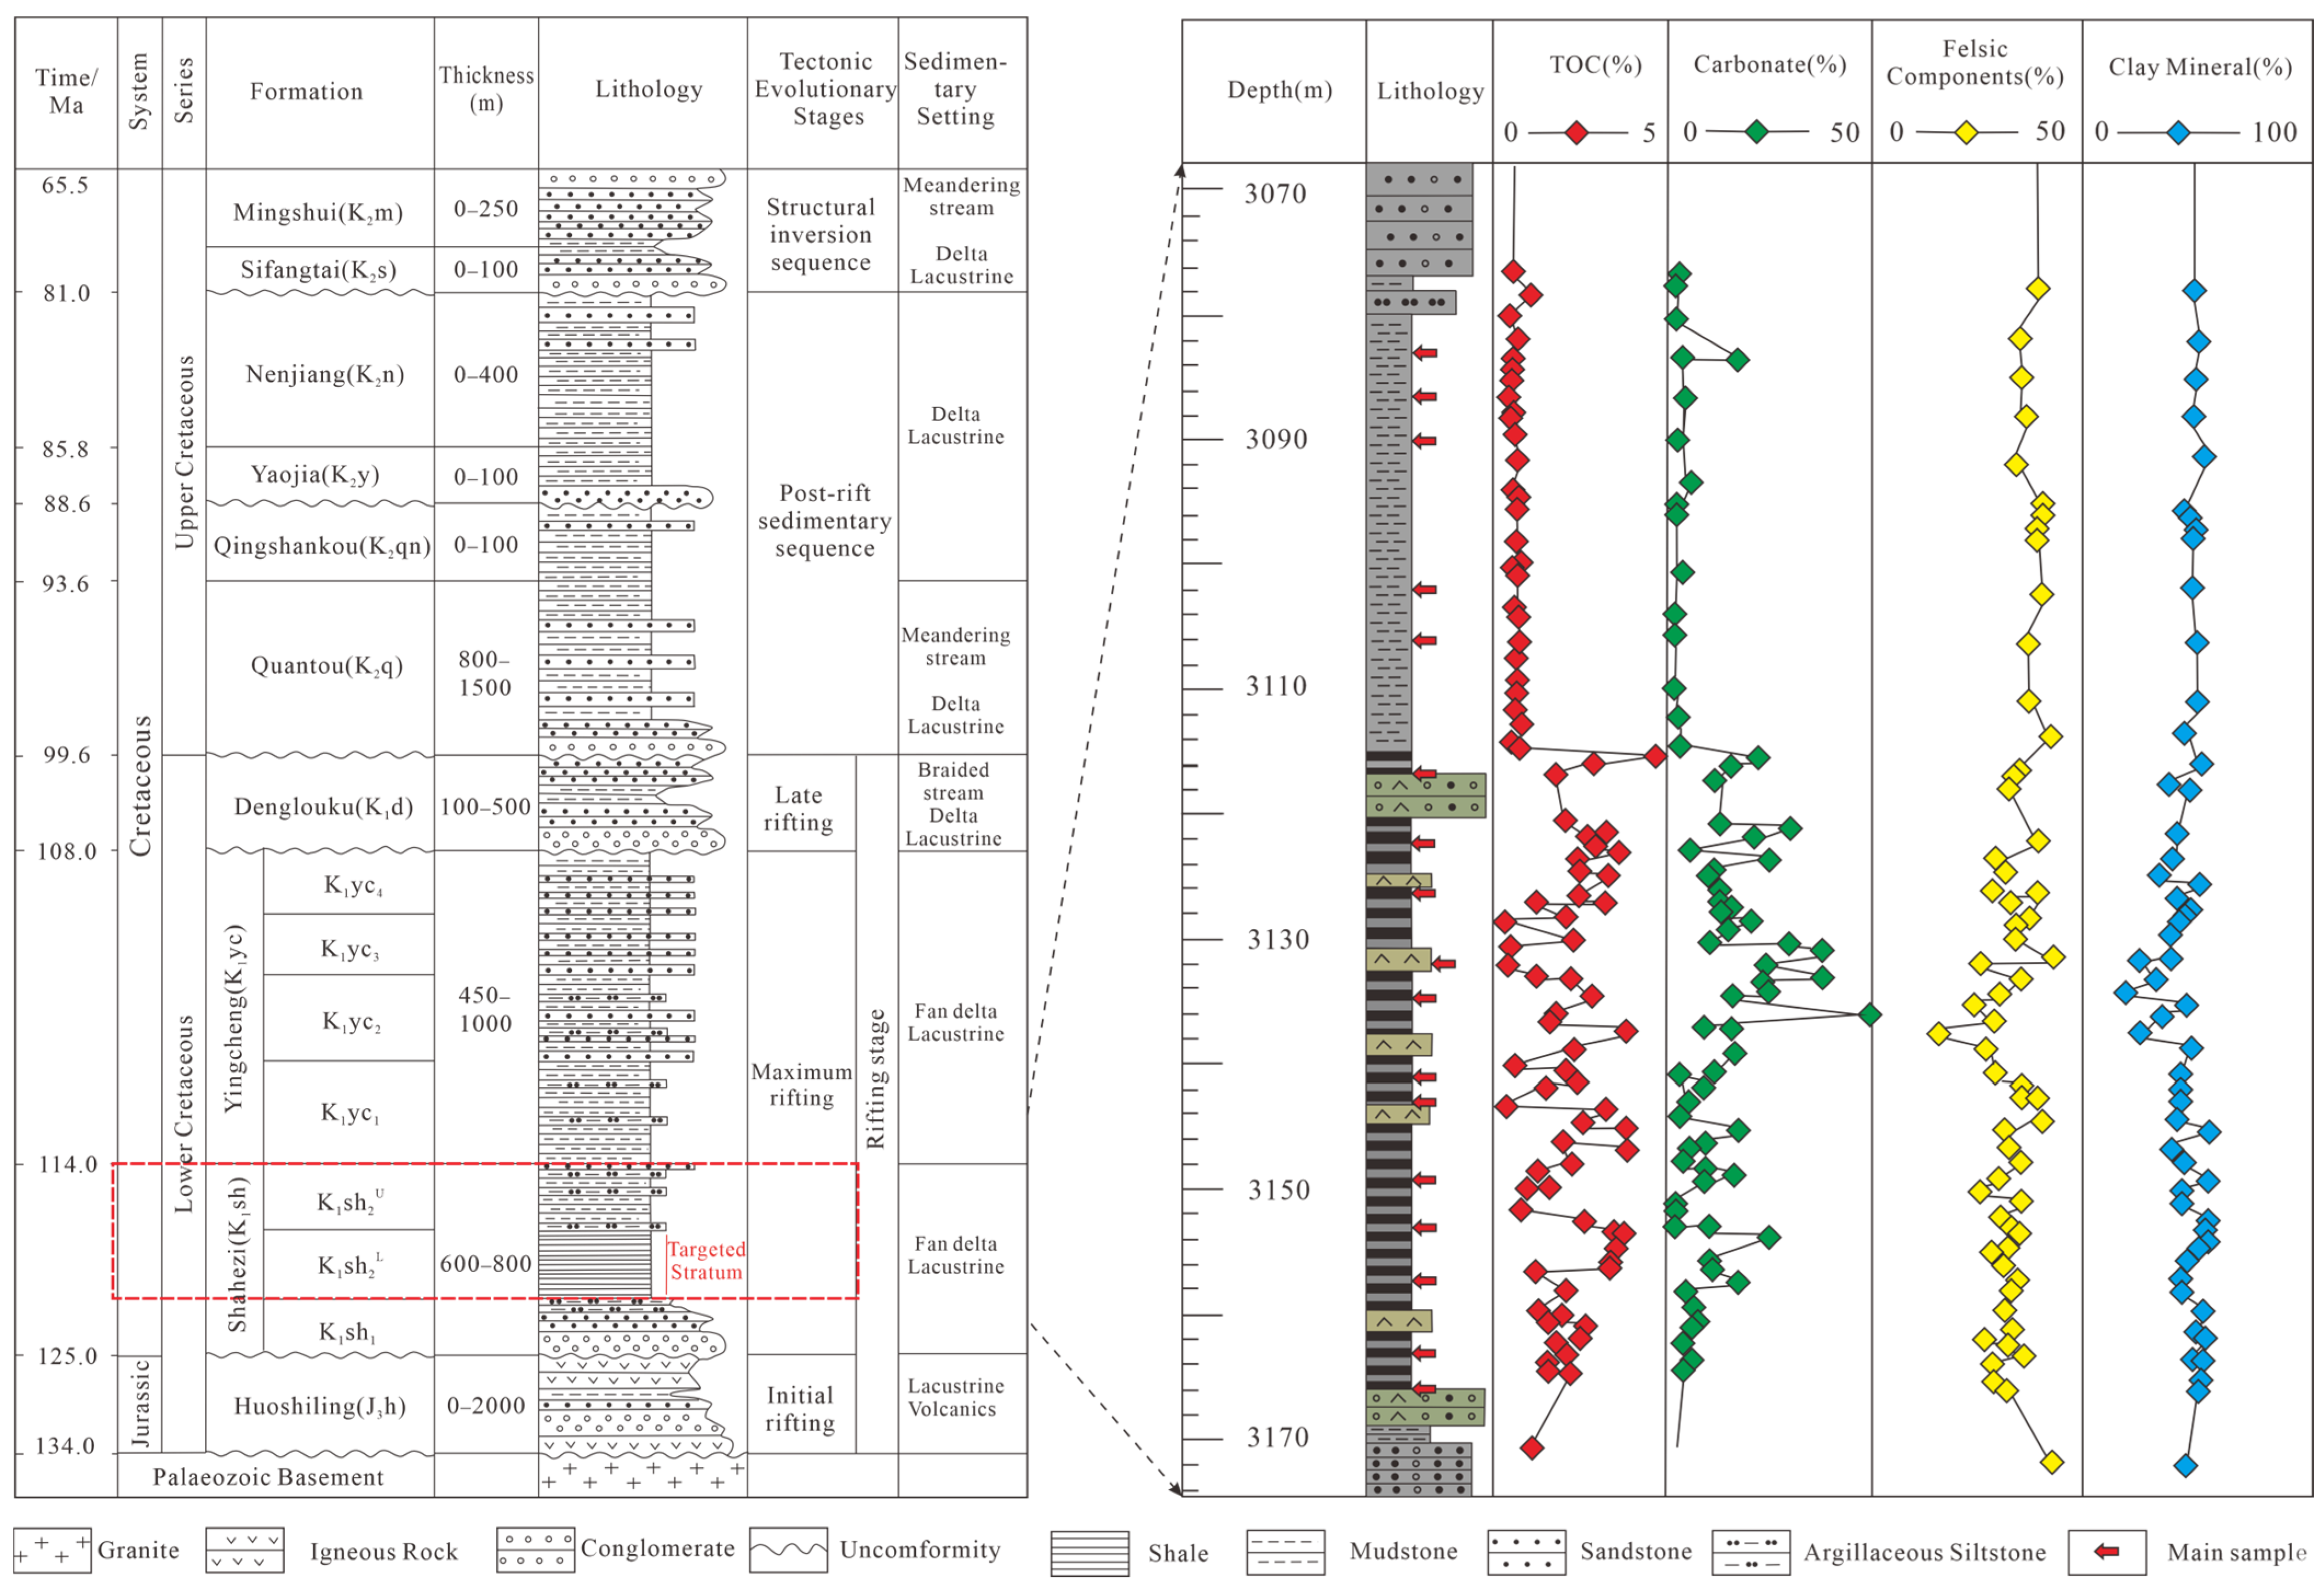
The Songliao Basin, located in northeastern China, is a large composite sedimentary basin dominated by Mesozoic–Cenozoic strata, which developed on the folded basement of the Hercynian Orogeny, which is characterized by a unique lithological association of low-grade metamorphic rocks and granitoids, as well as typical structural styles of tight folds and imbricate thrusting (Figure 1). It exhibits a dual-layer geological structure characterized by a lower fault and an upper fold. Due to the influence of the basement faults, the rift zones primarily extend in a northeast–southwest direction and can be broadly divided into three rift zones: western, central, and eastern [36,37,38,39]. The Lishu Fault Depression is a rift basin located in the southeastern uplift zone of the Songliao Basin (Figure 2). From the Late Jurassic to the Early Cretaceous, it underwent three main tectonic evolution stages: the rift-initial period (K1h), the rift-climax period (K1sh–K1yc), and the fault-Sag transition period (K1d) [40]. It is one of the fault sags in the Songliao Basin with the longest faulting duration, the most complete stratigraphic succession, and the thickest sedimentary fill. The maximum burial depth of the Lishu Fault Sag exceeds 8000 m. During the subsequent depression stage, the Huoshiling Formation (K1h), Shahezi Formation (K1sh), Yingcheng Formation (K1yc), and Denglouku Formation (K1d) were deposited. During the graben period, the Quantou Formation (K1q), Qingshankou Formation (K2qn), Yaojia Formation (K2y), and Nenjiang Formation (K2n) were successively deposited [41,42]. Among these strata, the Shahezi Formation is the most important hydrocarbon source rock during the rift period, with dark mudstone and shale thicknesses of 200–300 m, continuous and widespread distribution, and burial depths of 2500–4000 m. When the burial depth exceeds 2000 m, the Ro value is generally higher than 1.0%, indicating that the major hydrocarbon source rocks in the rift succession have entered the hydrocarbon generation window.
The Shahezi Formation is primarily composed of black and grayish-black mudstone and siltstone, interbedded with gray sandstone and conglomerate, and is dominated by lacustrine and shallow lacustrine facies. As shown in Figure 3, it is subdivided into three sedimentary units (from bottom to top): the first member (K1sh1), the lower sub-member of the second member (K1sh2L), and the upper sub-member of the second member (K1sh2U) [39]. The lithology of K1sh1 is characterized by shallow gray fine-grained sandstone and pebbly fine-grained sandstone. These units exhibit approximately equal-thickness interbedding with gray argillaceous siltstone, dark gray mudstone, and silty mudstone. The K1sh2L presents a tripartite division. The upper section is predominantly composed of thick sequences of dark gray mudstone intercalated with shallow gray siltstone. The middle section consists of thin interbeds of dark gray pebbly medium-grained sandstone. The lower section is characterized by massively thick, very dark gray to black shale. The K1sh2U displays cyclic sedimentation. The middle to upper part is defined by approximately equal to slightly unequal thickness interbeds of off-white pebbly fine-grained sandstone and gray fine-grained sandstone interbedded with dark gray mudstone and gray silty mudstone. The lower part is dominated by thick sequences of off-white pebbly fine-grained sandstone, with thin interlayers of dark gray mudstone.
The second member of the Shahezi Formation is the primary source rock sequence during the rift period and also one of the key intervals hosting terrestrial shale gas accumulation. Within the Lishu Fault Sag, the second member of the Shahezi Formation is influenced by the activity of the Sangshutai Fault, with its maximum thickness centered in the deep Sag area (approximately 1700 m). Due to uplift and erosion of the strata, the thickness gradually decreases toward the northeast (minimum thickness of 56 m). The second member of the Shahezi Formation has a relatively thick stratigraphic record and is widely distributed within the Lishu Sag and its lower part is dominated by mudstone deposits, while the middle and upper parts consist of interbedded sandstone and mudstone deposits. The lower sub-member of the K1sh2 was deposited during the maximum lake flooding period of the basin, in an overall sedimentary environment of semi-deep to deep lacustrine facies. Black shale has the widest distribution and greatest thickness. This shale unit exhibits typical characteristics of calcareous, siliceous (terrestrial), and tuffaceous conglomerate shale, with siliceous content ranging from 35% to 50% and calcareous mineral content ranging from 15% to 35%. Drilling at the JLYY1 well in the southeastern slope zone revealed that the continuous thickness of organic-rich shale in the lower sub-member of Sha II Formation reaches 51 m, with shale TOC ranging from 1.0% to 6.0% (average 2.5%). The kerogen type is primarily II1 and I, with organic matter thermal evolution degree (Ro) ranging from 1.3% to 2.0%. The shale is gas-rich, and on-site analysis indicates a total gas content of 1.0–2.5 m3/t. Overall, the Shahezi Formation shale is considered a promising shale gas reservoir system in the Songliao Basin.

3. Materials and Methods

3.1. Sampling

The 88 samples used in this study were selected from shale deposits in the 3070–3170 m depth range of the second member of the Shahezi Formation in the JLYY1 Well, located on the southeastern slope of the Lishu Sag. The total drilled depth of JLYY1 Well is 3254.66 m, with the final drilled horizon terminating in the First Member of the Shahezi Formation. The coring footage measured 155.05 m, yielding a core length of 155.05 m and a core recovery rate of 100%. The cumulative length of the gas-bearing core retrieved is 70.11 m.
The main lithofacies of the samples include clayey shale, mixed shale, and silty shale intercalated with siltstone. In this study, samples from the upper mudstone and lower shale of the second member of the Shahezi Formation were selected for mineral X-ray diffraction analysis, total organic carbon content analysis, and vitrinite reflectance analysis. Based on these results, selected samples were subjected to carbon dioxide adsorption experiments, nitrogen adsorption experiments, and nuclear magnetic resonance (NMR) testing to analyze their pore structure.

3.2. Experimental Methodology

3.2.1. Total Organic Carbon Content and Vitrinite Reflectance Testing

The LECO CS230 carbon/sulfur analyzer (LECO Corporation, St. Joseph, MI, USA) was used to determine the total organic carbon (TOC) content of the samples (%), which was manufactured by LECO Corporation (St. Joseph, MI, USA). The samples were first cleaned with distilled water and then ground into a powder with a particle size of 80–100 mesh. The instrument combusts the samples in an oxygen atmosphere at approximately 1000 °C, oxidizing the carbon into carbon dioxide. After removing moisture and dust, the carbon dioxide gas is measured using a solid-state infrared detector [43,44]. The measurement of vitrinite reflectance (Ro, %) is conducted using an MSP400 micro-fluorescence spectrometer, with the sample tested at a temperature of 23 °C and 65% humidity. The samples were irradiated with fluorescence at a wavelength of 546–20 nm and observed under 50× and 10× objectives. They were then categorized based on reflectance stages of 1.85–1.95, 1.95–2.05, and 2.05–2.15. A predetermined number of measurement points were collected from each stage for subsequent calculation.

3.2.2. XRD Mineral Composition Identification

Mineralogical research typically uses X-ray diffraction analysis (XRD), which can be categorized into single-crystal X-ray diffraction analysis and polycrystalline X-ray diffraction analysis according to sample testing requirements. Single-crystal X-ray diffraction analysis is conducted using intact single crystals, with the crystal structure as the primary research object. On the other hand, fine powders or aggregates of fine grains are required for polycrystalline X-ray diffraction analysis. This method is also referred to as powder X-ray diffraction analysis, which is used to identify, analyze, and measure the mineral composition [45,46,47]. In this study, the rock components were analyzed using polycrystalline X-ray diffraction analysis, employing the D8Advance X-ray diffractometer (Bruker AXS GmbH, Karlsruhe, Baden-Württemberg, Germany). The oil-containing samples were first subjected to solvent extraction to remove residual hydrocarbons. The resulting moist samples were then dried at temperatures below 60 °C, cooled to room temperature, and subsequently crushed using a sample crusher or a copper mortar. The crushed materials were ground until all particles passed through a 40 µm sieve. Finally, the ground powder was mounted on concave slides. Then measurement plates were prepared using the back-pressure method and the measured surface of the prepared plates should be flat. The plates were then scanned in the instrument at a scanning speed of 0.8 s per step and a scanning frequency of 0.02°. The X-ray diffraction patterns were obtained through instrument testing, and baselines were plotted. The diffraction peak intensity was calculated by integrating the signal intensity after background subtraction. Read the relevant data from the sample’s X-ray diffraction spectrum, then determine the type by comparing it with the standard X-ray diffraction data of the mineral, and perform quantitative analysis using the positive correlation between the mineral content and the characteristic peak intensity of the mineral.

3.2.3. High-Pressure Mercury Porosimetry

High-pressure mercury porosimetry is currently a commonly used method for studying shale pore throats. It offers advantages such as simple experimental procedures, short testing times, low costs, and accurate characterization of pore size distributions. The advantages of mercury porosimetry (MICP) lie in its ability to directly quantify pore volume via mercury injection, with only a small quantity of rock cuttings or core fragments required for testing. Results can be obtained relatively quickly with reasonable accuracy, and it can achieve a very high range of capillary pressure. The mercury advance–retreat curve obtained from high-pressure mercury porosimetry experiments can directly reflect the distribution characteristics of pore throats and the quality of pore connectivity.
Mercury intrusion analysis was performed on shale core samples using an Auto Pore 9520 pore size analyzer to determine the pore size distribution across a range of 3 nm to 120 μm. For this purpose, the shale samples were first cut into regular cylindrical columns. Following this preparation, they were heated in a high-temperature oven at 110 °C for 12 h to remove bound water and other volatile substances. The mercury injection pressure was gradually adjusted, and the mercury entry and exit volumes in the non-wetting phase were recorded at different mercury injection pressures to obtain the capillary pressure curve. Based on the results of the high-pressure mercury intrusion experiment, further analysis of the mercury intrusion and withdrawal curves, displacement pressure (Pc), average throat radius (r), and other parameters was conducted to obtain information on the size distribution, sorting, and connectivity of rock pores and throats. Based on the entry pressure, the pore radius can be calculated using the Washburn equation [48]:
R = 2σcosθ/Pc,
Among these, Pc is the inlet pressure, σ is the interfacial tension (dyne/cm), θ is the contact angle (degrees), and R is the throat radius. In this study, the contact angle used was 140°, and the surface tension was 0.48 N/m. Due to the potential deformation caused by high intrusion pressure, the maximum operating pressure was limited to 410 MPa, corresponding to a throat size of approximately 1.8 nm. Since the mercury intrusion method has a wide measurement range, it is highly effective for large pores (pore diameters greater than 50 nm). Since shale contains a large number of nanoscale pores, mercury has difficulty penetrating them, and high pressures during experiments can create artificial fractures that affect measurement results. Therefore, high-pressure mercury porosimetry is primarily used to analyze macropores [49]. For measuring nanoscale pores, gas adsorption methods are employed [50].

3.2.4. Gas Adsorption Experiment

The surface area and pore volume obtained by the nitrogen adsorption method are based on the BET theory [51,52]. The specific principle is as follows: under constant temperature conditions, the partial pressure of nitrogen is incrementally increased, and the equilibrium adsorption amount is measured to obtain the adsorption isotherm. Conversely, the desorption isotherm is generated by progressively decreasing the partial pressure and recording the corresponding data [53,54]. This study employed the ASAP2460 Microporous Structure Analysis and Specific Surface Area Analyzer (Micromeritics Instrument Corporation, Norcross, GA, USA) for low-temperature N2 isothermal adsorption and desorption analysis. The instrument can measure pore sizes ranging from 0.35 to 500 mm, with specific surface area (SSA) and pore volume (PV) as low as 2.702 m2/g and 0.00117 cm3/g, respectively. Under conditions of relative pressure (P/P0) ranging from 0.005 to 0.995 and temperature of −196.15 °C, N2 adsorption/desorption isotherms were obtained. Prior to the experiment, the samples were ground to a particle size of 60–80 mesh and dried in a vacuum oven at 200 °C for 2 h to remove bound water and capillary water, volatile impurities, and residual gas in the pores. Under conditions of relative pressure (P/P0) ranging from 0.005 to 0.995, the adsorption and desorption quantities of nitrogen gas at different pressures were obtained, ultimately yielding the adsorption–desorption curves. Using the N2 adsorption data, the specific surface area (SSA) was calculated by the multi-point Brunner–Emmett–Taylor (BET) method, and the pore volume (PV) was calculated by the Barrett–Joyner–Halenda (BJH) model based on the adsorption branch. Additionally, the average pore diameter of nitrogen adsorption at different P/P0 values was calculated.
Carbon dioxide adsorption testing uses the JWBK-200C specific surface area and pore size analyzer (Beijing JWGB Sci. & Tech. Co., Ltd., Beijing, China) to determine the specific surface area and pore size distribution of rocks. The instrument measures microporous sizes ranging from 0.35 to 2 nm, with partial relative pressure P/P0 accuracy to 1 × 10⁻⁶. Samples are dried overnight in a vacuum oven at 110 °C, then degassed for 2 h at 200 °C under high vacuum (<10 mmHg) in the instrument to further remove adsorbed moisture and volatile substances. The experiment was conducted by introducing carbon dioxide into the sample maintained at a constant 0 °C. The amount adsorbed at each pressure point was recorded upon reaching pressure equilibrium, which was defined by a time interval of 10 s. The carbon dioxide adsorption curve was then determined, and the specific surface area was calculated using the BET equation for P/P0 values ranging from 0.0002 to 0.03.

3.2.5. Nuclear Magnetic Resonance Testing

Nuclear magnetic resonance (NMR) technology detects information about rock pore structure and pore fluid properties by measuring the amplitude and relaxation rate of the NMR relaxation signals from hydrogen nuclei in rock pore fluids, information [55]. NMR primarily involves two steps: polarization and transverse magnetic relaxation, with corresponding time constants known as the longitudinal relaxation time (T1) and transverse relaxation time (T2). Since T1 relaxation reflects the process of the pretreated proton system transferring energy to its surroundings, transverse relaxation is always faster than longitudinal relaxation. Therefore, T1 measurements are more time-consuming than T2 measurements, so in NMR, T2 is more commonly measured in the laboratory [56,57,58].
For surface relaxation mechanisms, the relaxation time observed in nuclear magnetic resonance experiments is the average relaxation time of all nuclei within the pore. Nuclei in smaller pores are more likely to interact with the particle surface compared to those in larger pores, so shorter relaxation times reflect smaller pore characteristics. The relaxation rate is typically related to surface relaxation effects and pore surface area, and this relationship can be expressed as [59,60]:
1/T2 = ρ × S/V,
Among these, T2 is the transverse relaxation time caused by surface relaxation (in seconds), and ρ is the surface relaxation rate (in μm/s), which is related to the concentration of paramagnetic sites on the pore walls and reflects the ability of the pore walls to promote proton relaxation. S/V is the surface area-to-volume ratio (per micrometer), reflecting pore size. For rocks with simple shapes, the surface area-to-volume ratio is 3/r, where r is the radius of the sphere. For rocks with complex shapes, the shape factor Fs is used to describe the surface-to-volume ratio [61], such as:
S/V = FS/r,
Therefore, the relationship between pore size and nuclear magnetic resonance transverse relaxation time T2 can be described as follows:
r = ρ × FS × T2,
If the surface relaxation rate can be determined, the nuclear magnetic resonance T2 spectrum can be used to quantitatively describe the characteristics of pore size distribution in rocks.
In addition to reflecting pore information and providing accurate pore size distribution estimates, nuclear magnetic resonance relaxation time distributions can also be used to analyze oil content information in porous media [59,62,63]. To characterize oil saturation in oil- and water-bearing rocks, it is necessary to filter out signals generated by water. Paramagnetic ions can mask the resonance signals of water [63]. If the manganese ion concentration is sufficiently high, the T2 of water can be reduced below the dead time, causing the water signal to disappear. However, manganese is insoluble in hydrocarbons; therefore, the T2 of hydrocarbons remains unaffected, and their signals persist [64].
Nuclear magnetic resonance measurements were performed at 35 °C using the AniMR-150 magnetic resonance imaging system (Suzhou Niumag Analytical Instrument Co., Ltd., Suzhou, Jiangsu, China). The instrument includes a permanent magnet with a magnetic field strength of 0.3 ± 0.05 T, a resonance frequency of 2–30 MHz, and an accuracy of 0.1 Hz. In this study, all corresponding experiments used the CPMG sequence to obtain the distribution of T2 relaxation times. The measurement parameters were set as follows: echo interval, 0.1098 ms; number of echoes, 4096; number of scans, 64. The decaying signal was detected and analyzed using multi-exponential inversion. The signal intensity distribution of the T2 relaxation time was obtained using echo number at preset time points, and the distribution was plotted in logarithmic space from 0.01 ms to 10 s. By comparing with predefined standard samples, the signal intensity was converted into porosity. Volume porosity and oil-bearing porosity were calculated based on the intensity of the brine and oil signals, respectively. The final NMR results were presented as curves of incremental porosity and cumulative porosity versus T2 relaxation time.

4. Results

4.1. Mineral Composition and Brittleness Index Evaluation

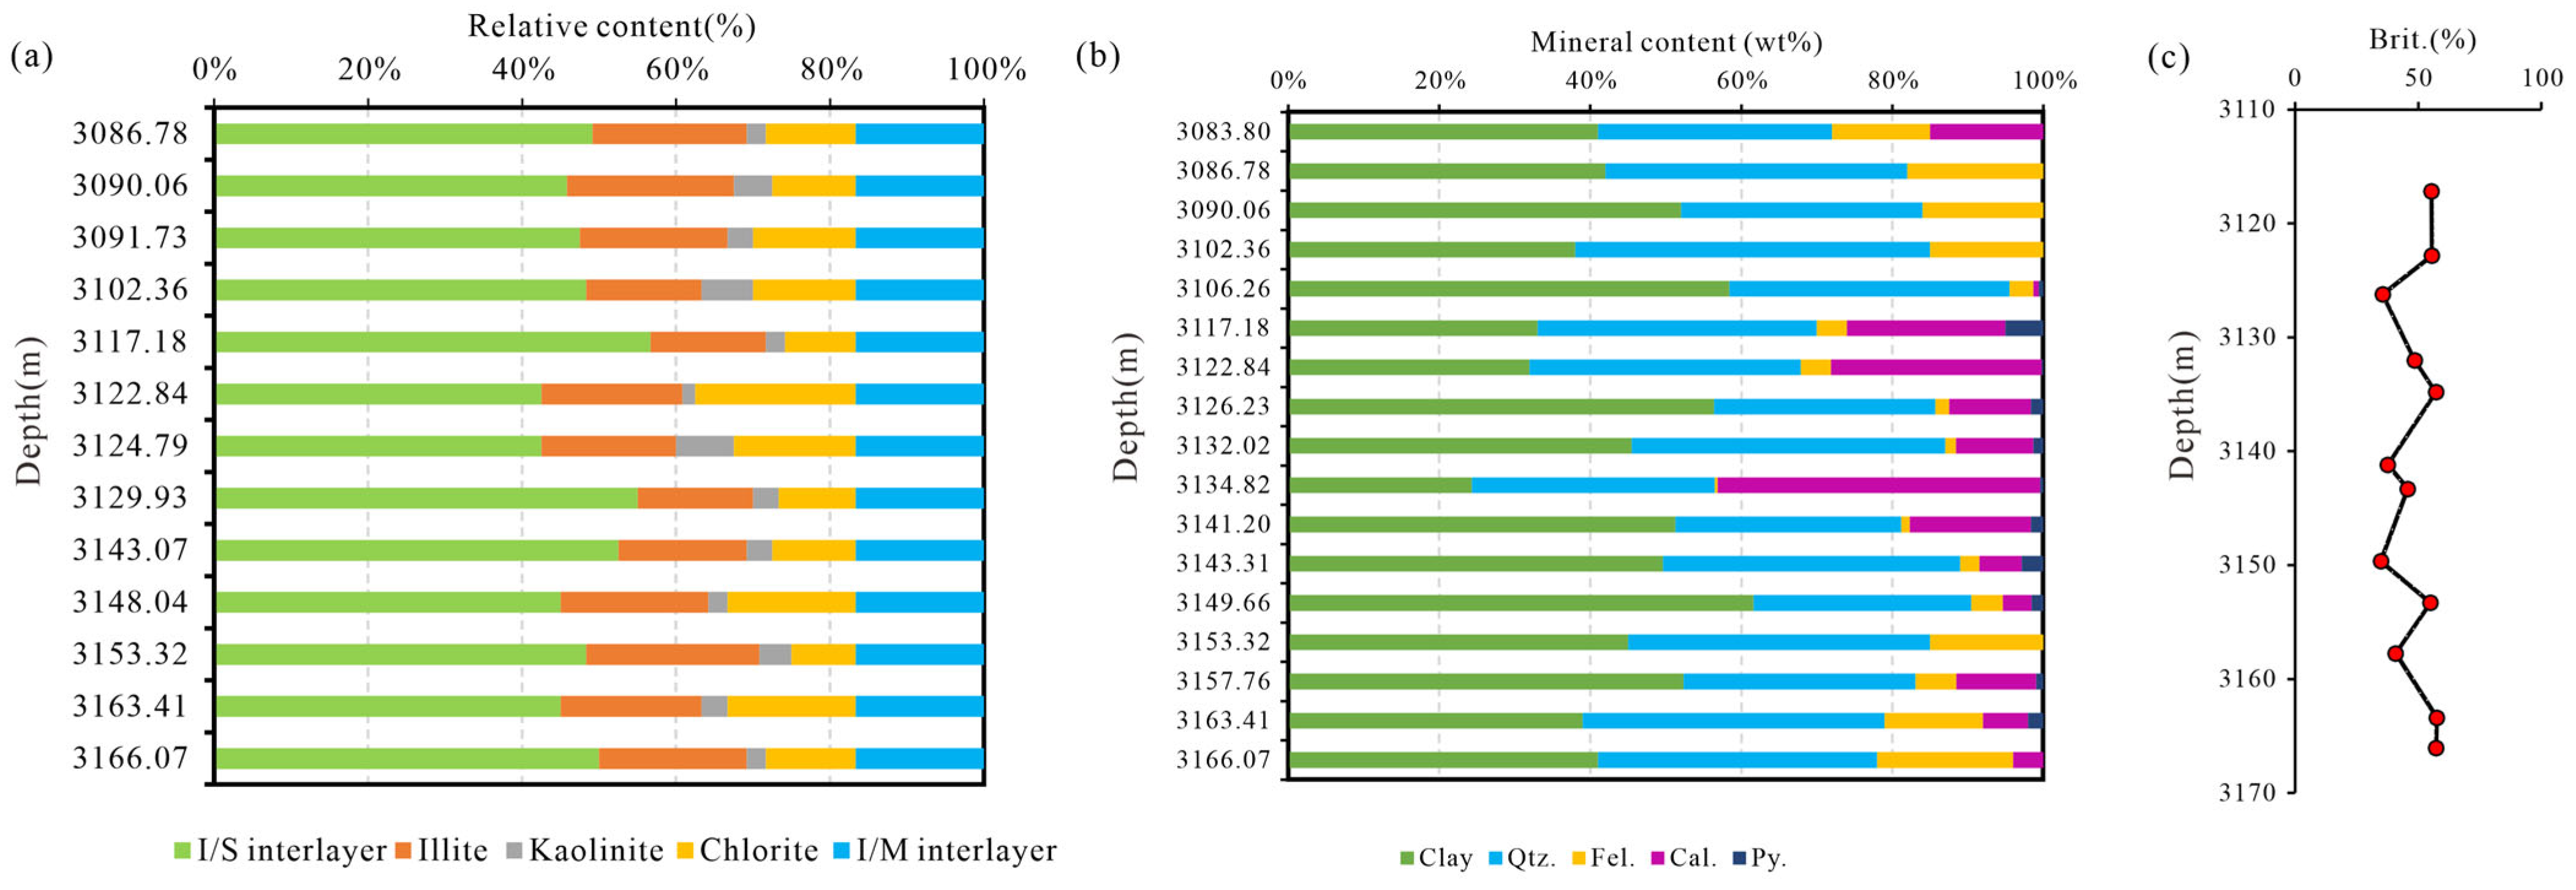
The XRD results indicate that the minerals in EKS shales are primarily clay minerals, quartz, and feldspar. The clay mineral content ranges from 40% to 60%, with an average of 51.71% and it decreases with increasing depth. The clay minerals are mainly composed of illite, chlorite, some kaolinite, and a small amount of montmorillonite that is almost negligible. The EKS shales exhibit a high but variable carbonate mineral content ranging from 0% to 42.5%, which is notably richer in the lower shale section than in the upper mudstone section. Quartz content ranges from 20% to 40%, averaging 32.12%. In contrast, feldspar content is lower, varying between 4% and 15%. Additionally, components such as pyrite were detected in the EKS shales (Figure 4); the pyrite content was highest in the sample at 3117.18 m, reaching up to 10%.
Currently, shale brittleness evaluation primarily relies on mineral composition analysis and rock mechanics, which assess reservoir compressibility from different perspectives. The mineral composition method focuses on the high plasticity of clay minerals, which can cause fractured zones to close easily; the higher the content of brittle minerals present, the better the reservoir’s compressibility. The rock mechanics method considers rock strength and elasticity, with reservoirs exhibiting lower strength and higher elasticity demonstrating the best compressibility. This study mainly uses mineral composition to evaluate the brittleness of shales. Shale reservoirs have complex mineral compositions, and mineral brittleness evaluation methods vary depending on geological conditions and fracturing sensitivity. Generally, when carbonate minerals serve as cementing agents and their content is low (typically less than 20%), the content of siliceous minerals is used as the primary indicator of rock brittleness:
BRIT = Vsiliceous minerals/(Vsiliceous minerals + Vcarbonate minerals + Vclay minerals) × 100%,
When the mineral composition is relatively complex and the carbonate mineral content is high, the silica mineral and carbonate mineral content are used as the main indicators of rock brittleness:
BRIT = (Vsiliceous minerals + Vcarbonate minerals)/Vtotal minerals × 100%,
In the formula: BRIT is the mineral brittleness index, dimensionless; Vsiliceous minerals is the volume of siliceous minerals (quartz, feldspar), %; Vcarbonate minerals is the sum of the volumes of carbonate minerals (calcite, dolomite), %; Vclay minerals is the volume of clay minerals, %; Vtotal minerals is the sum of the volumes of silica minerals (quartz, feldspar), carbonate minerals (calcite, dolomite), and clay minerals, %.
The results show that the mineral content of the EKS shales varies greatly and is complex in composition. The main mineral components are quartz, feldspar, calcite, and clay minerals, with small amounts of pyrite, siderite, and gypsum. The mineral composition is dominated by a relatively high clay content, with mass fractions ranging primarily from 40% to 60%. Quartz and feldspar also constitute a significant proportion, collectively accounting for approximately 30% to 40%. Carbonate minerals, predominantly calcite, are ubiquitously present at mass fractions of about 10% to 20%. Pyrite and halite are present in small quantities. Overall, the mass fraction of brittle minerals, primarily quartz, feldspar, and carbonate minerals, ranges from 40% to 60%, with a brittleness index distributed between 34.89% and 62%, indicating that this layer has good brittleness, which is conducive to fracture development and subsequent reservoir stimulation.

4.2. Microscopic Features

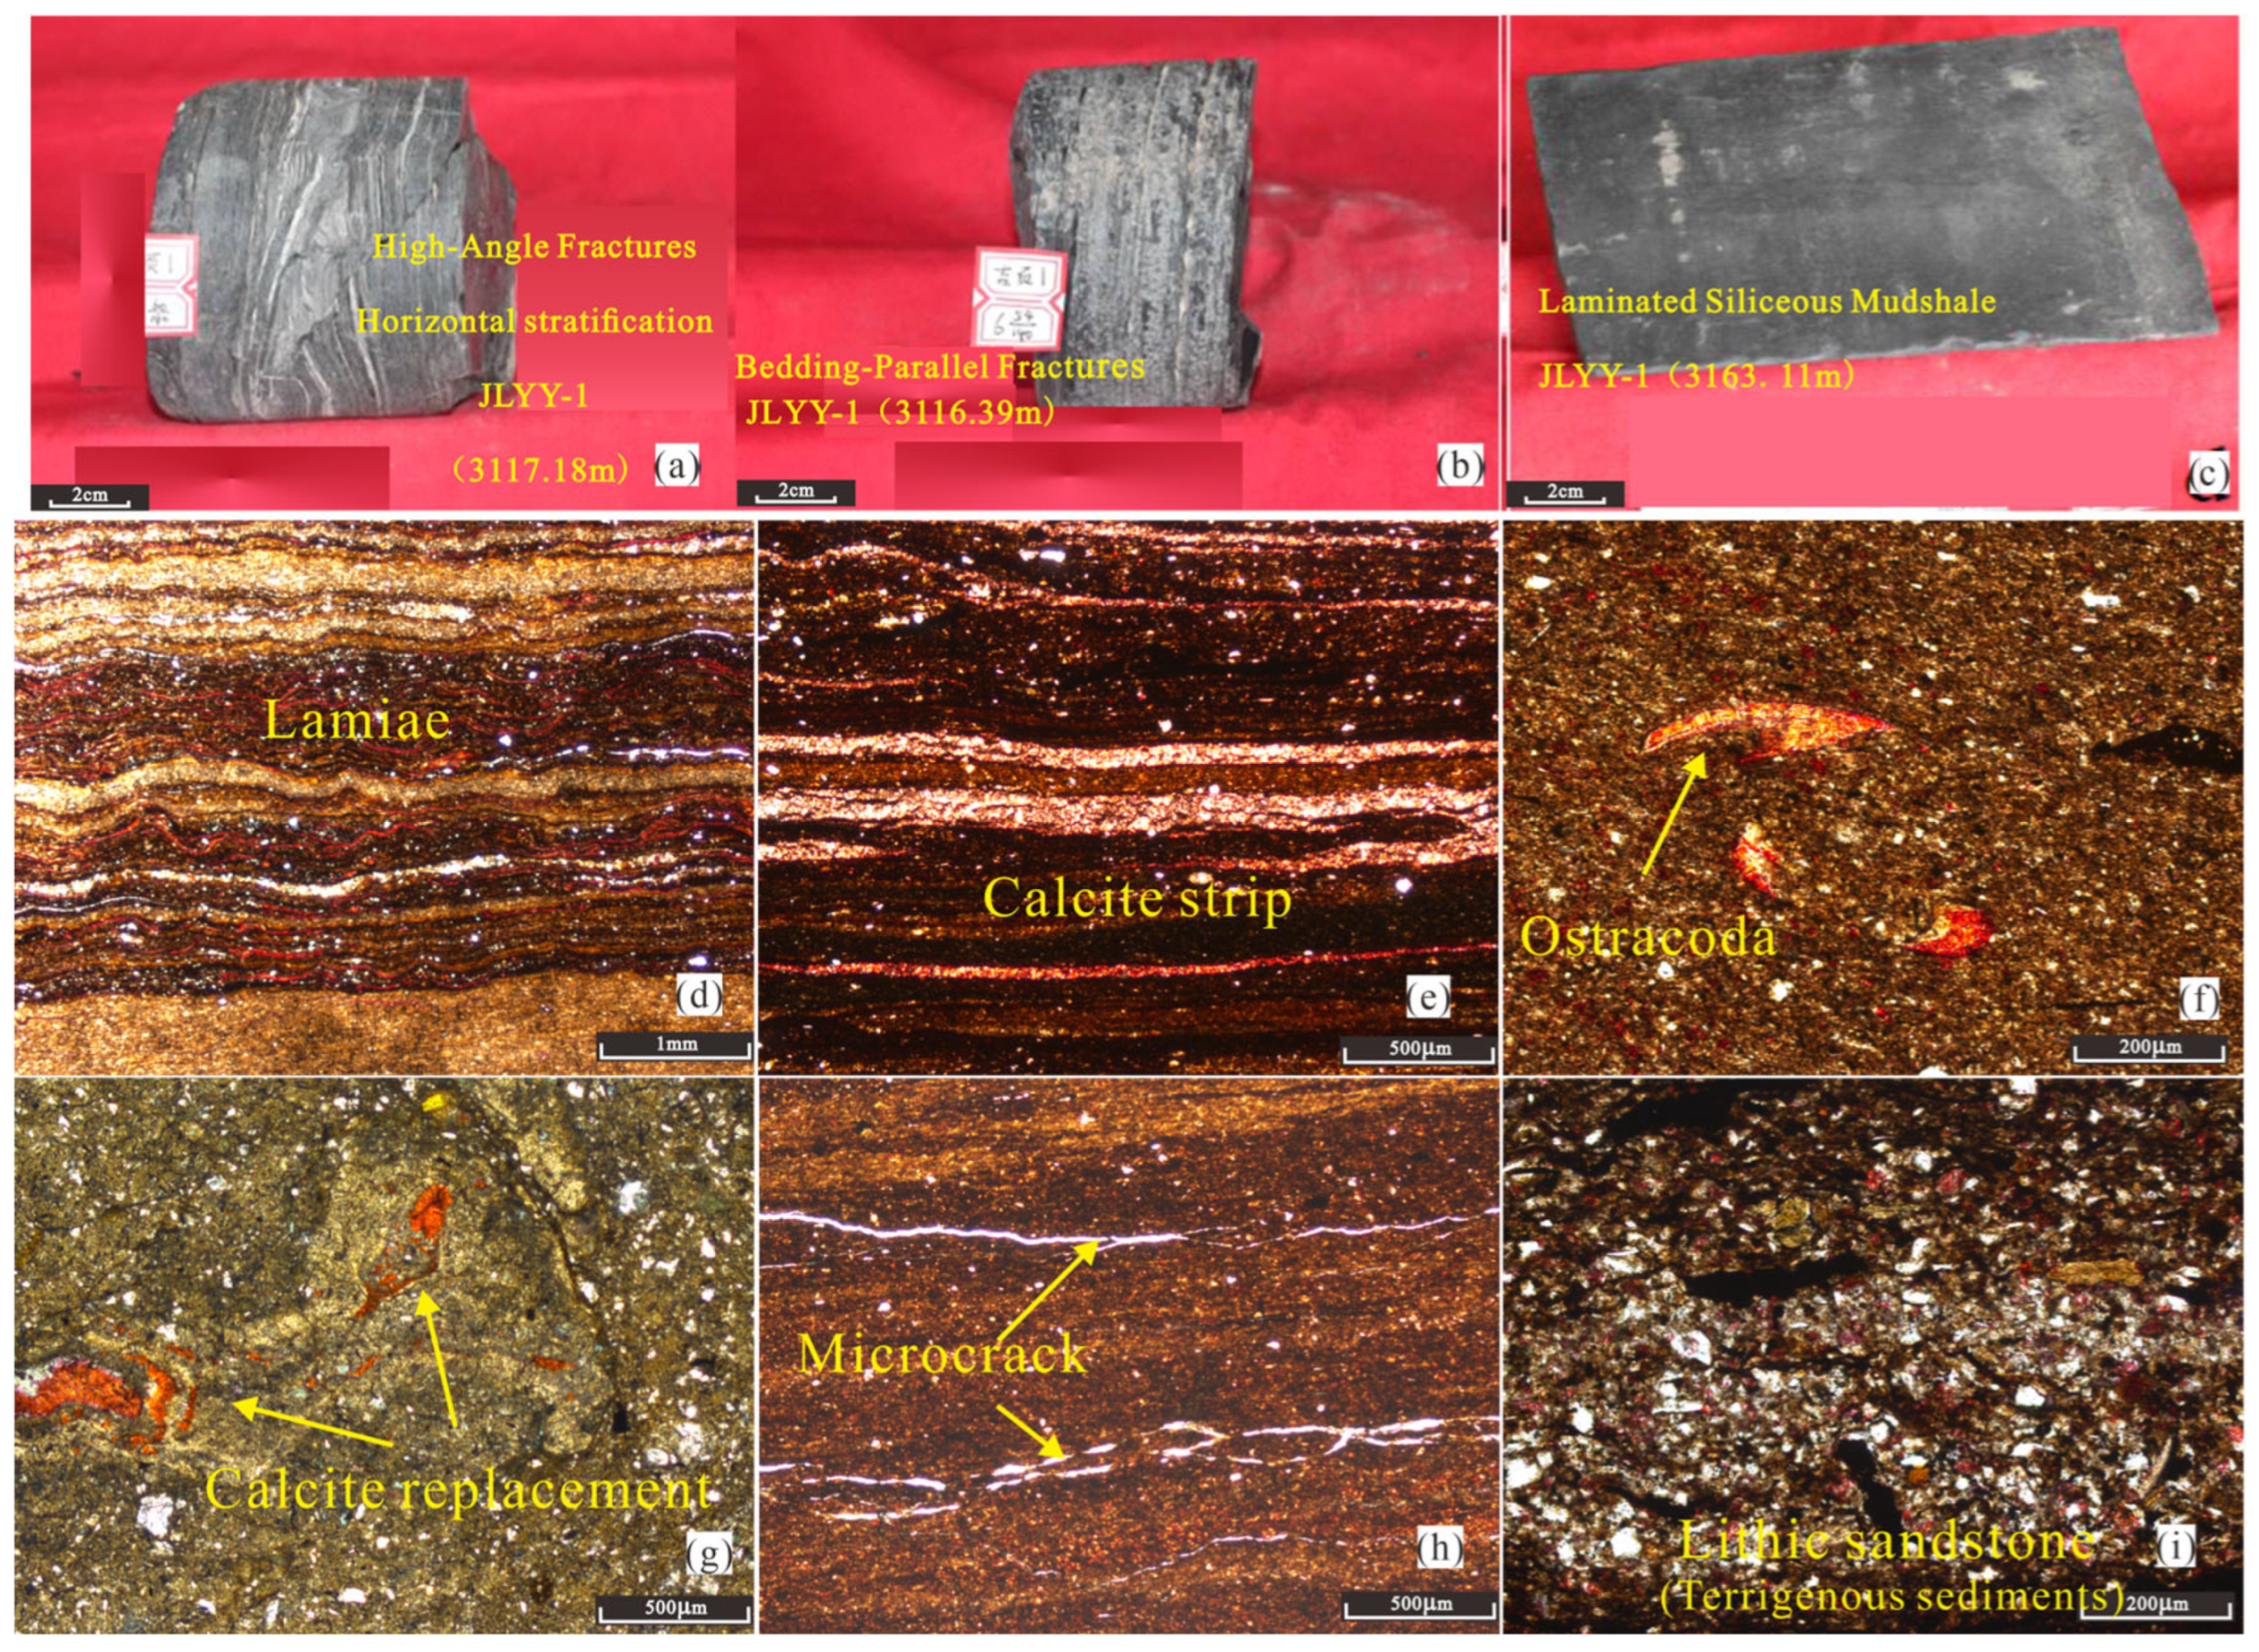
Shale composition (including minerals and organic matter) has a significant impact on pore structure [9,17,18,28,65]. The EKS shales exhibit numerous fractures, primarily horizontal bedding-parallel fractures (Figure 5), high-angle fractures and vertical fractures locally developed [55]. The formation of macrofractures such as bedding-parallel fractures, horizontal fractures, and vertical fractures observed during core examination is primarily related to factors such as rock mineral composition, stratigraphic pressure, and geological structure. Meanwhile, microporosity such as intergranular pores and clay shrinkage pores observed under electron microscopy are influenced by mineral crystallization. Even though some fractures in mudstone may be filled by other cementing materials during later diagenetic processes, they can still promote the extension of induced fractures during reservoir modification. The microscopic pores in mudstone and shale, such as organic pores, intergranular pores, and intragranular pores, provide space for the accumulation and enrichment of shale gas; while bedding-parallel fractures, horizontal fractures, and vertical fractures act as the main migration pathways for shale gas during the later development stage. Figure 5a–c show core photographs, in which EKS shales exhibit some high-angle fractures, bedding-parallel fractures, and textured beddings. The shale type is primarily siliceous shale. Figure 5d–i are photographs of rock thin sections under a polarizing microscope. The EKS shales are primarily mudstone, with a laminated structure composed of alternating layers of mudstone and mudstone rich in ostracods and organic matter (Figure 5d), or composed of mudstone and organic-rich mudstone, and muddy calcite interlayers, with some calcite forming bright calcite bands (Figure 5e). The mineral composition is primarily mudstone, with a small amount of calcite, minor terrigenous sediments, and small amounts of pyrite, which are locally aggregated in small spheroidal grains. The mudstone exhibits a scaly structure with textural layering, and some mudstone textural layers are rich in silt and organic matter. Calcite is divided into two parts: the majority consists of crinoid debris distributed along the layers, concentrated in organic-rich mudstone layers (Figure 5f); a small portion serves as a cementing agent with a fine-grained crystalline structure, sporadically distributed in mudstone siltstone bands (Figure 5g). Numerous microfractures are visible in the rock (Figure 5h). Terrigenous sediments are distributed in bedding layers, consisting of quartz, feldspar, and lithoclast, with a small number of carbonaceous debris scattered throughout the mud (Figure 5i).
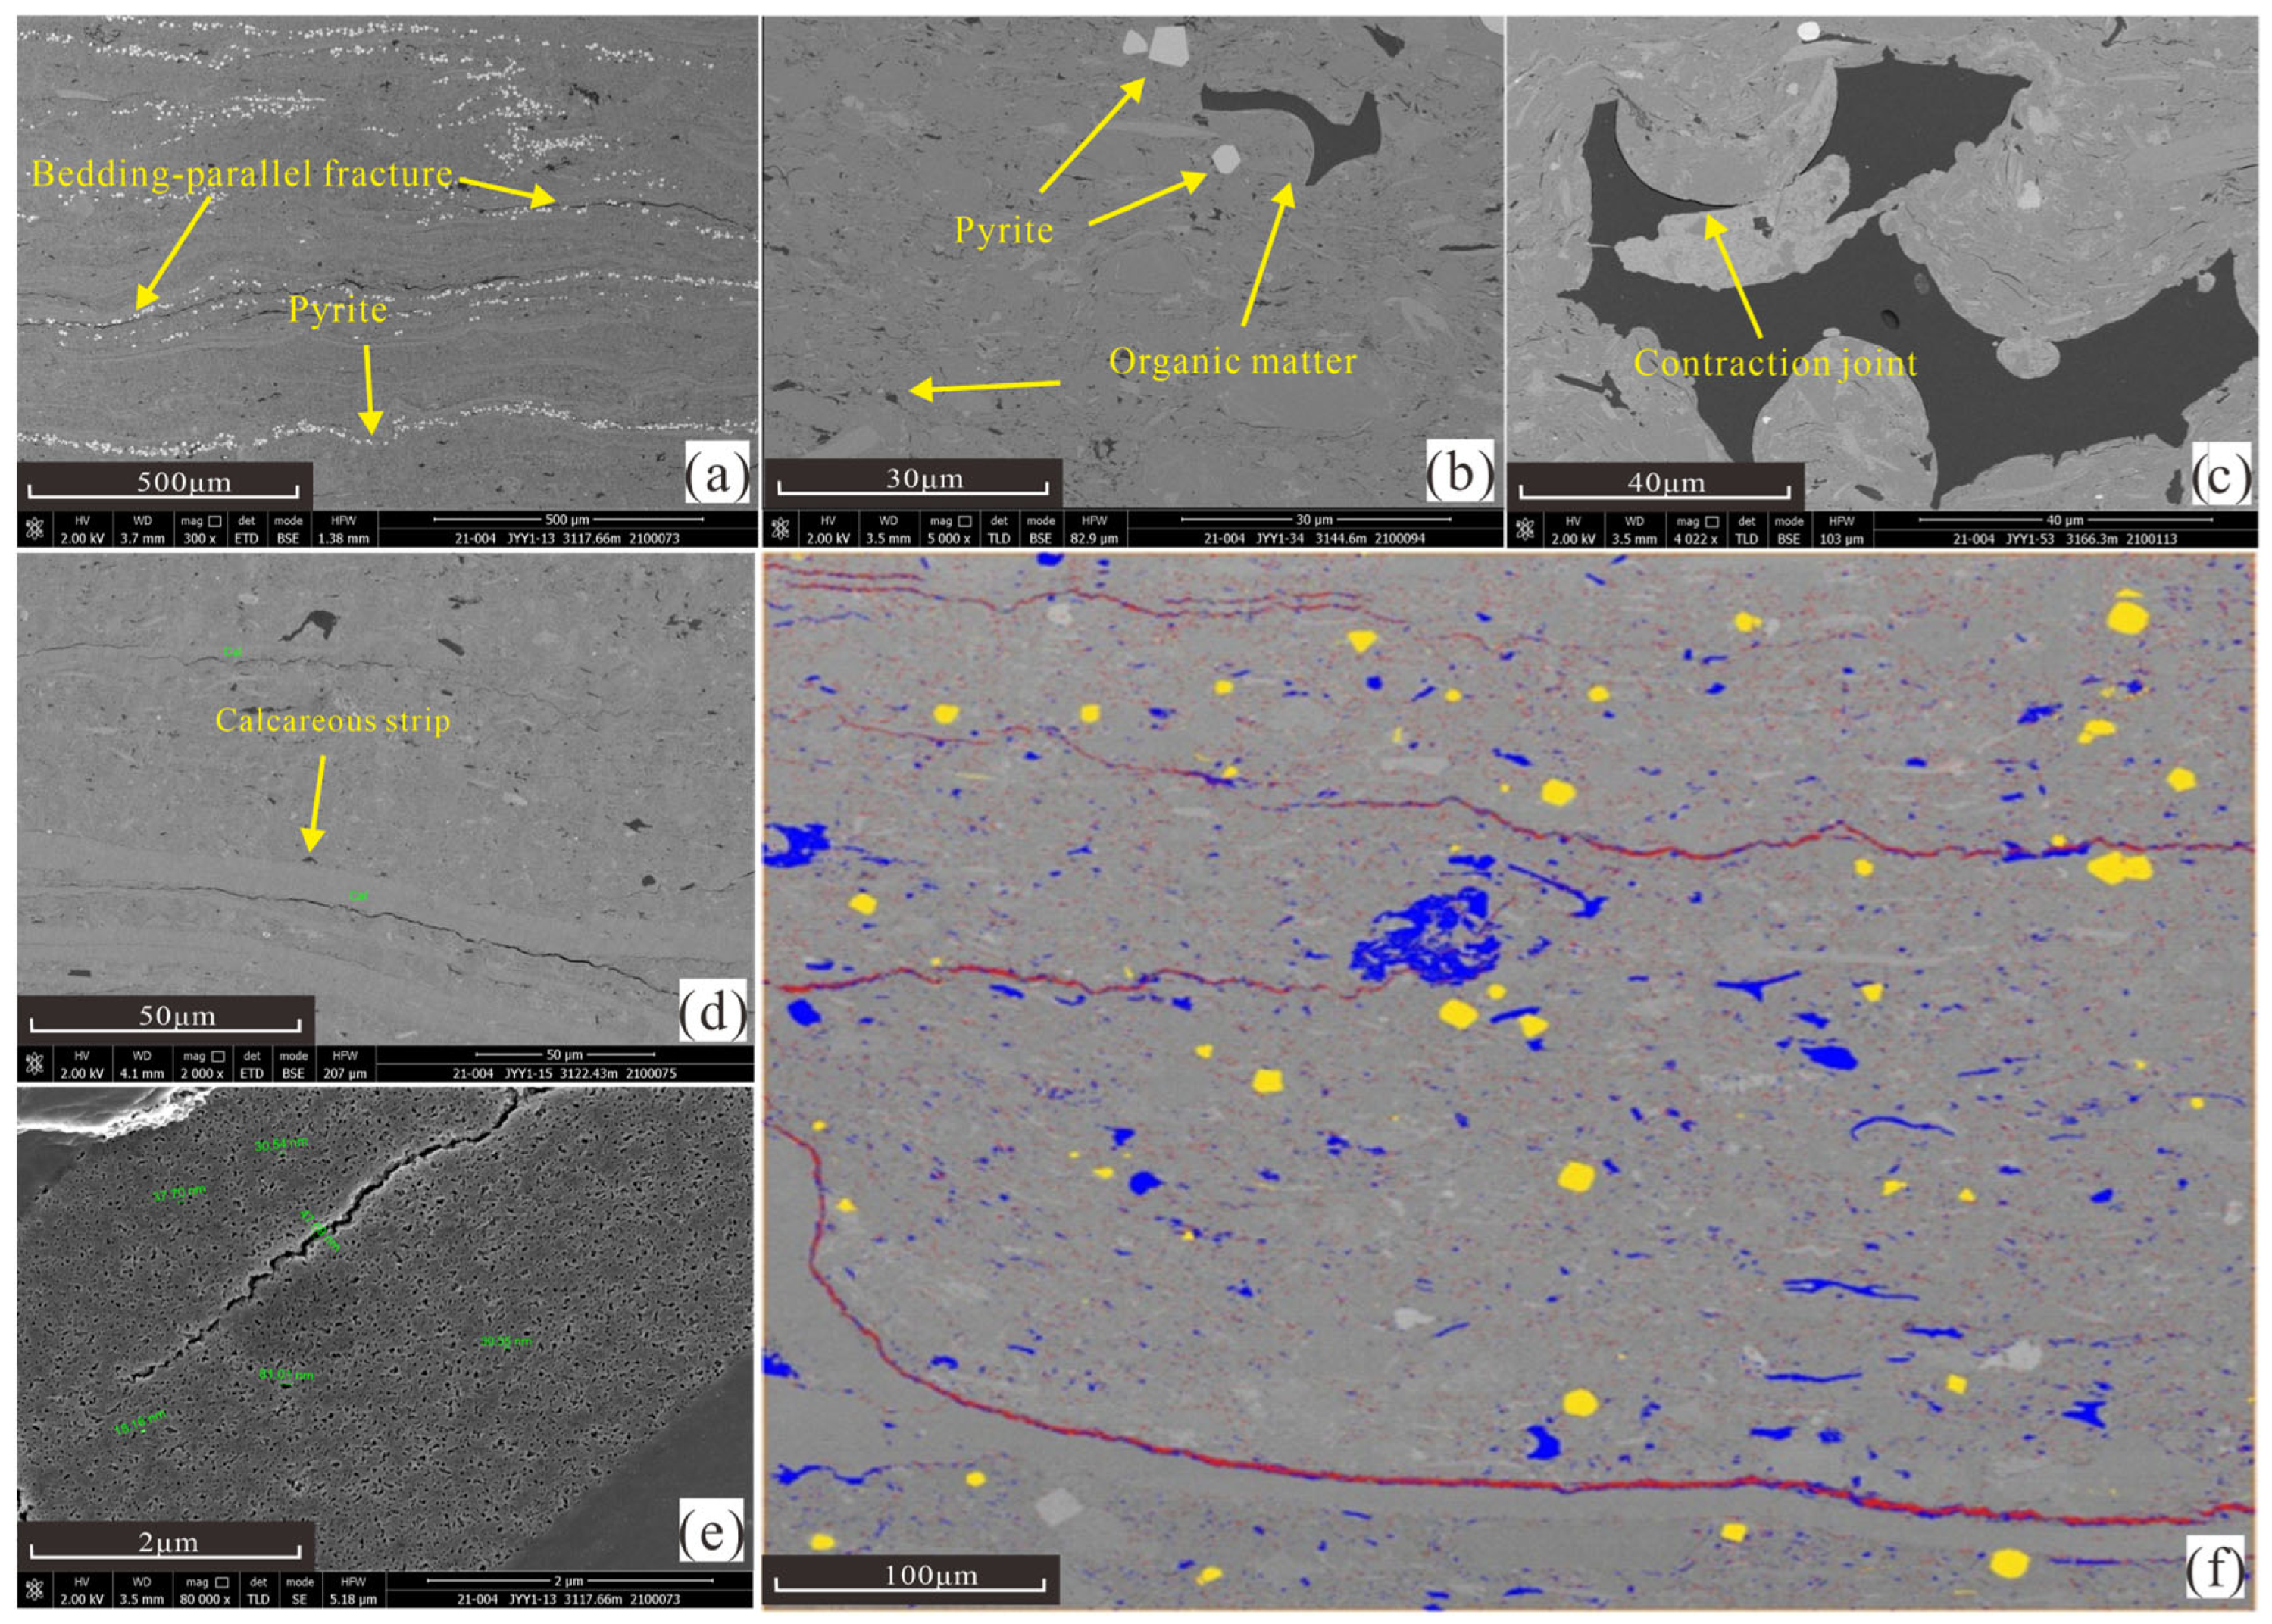
Under scanning electron microscopy, it can also be observed that EKS shales primarily develop fractures parallel to the bedding planes, with abundant pyrite distributed in banded patterns along the bedding planes (Figure 6a). Organic matter is widely distributed in clastic and interstitial forms (Figure 6b), the edges of the clastic organic matter exhibit contraction fractures (Figure 6c). Inorganic pores primarily consist of microfractures at the edges of clastic particles and contraction microfractures between clay minerals, with calcium-bearing bands that may represent biogenic debris, and microfractures at the edges of the calcium-bearing bands (Figure 6d). The fractures are often filled with organic matter, such as fine asphalt fragments. The internal pores of the organic matter are highly unevenly developed, with some organic matter exhibiting well-developed micro-pores that are honeycomb-like in distribution and have good connectivity. The pore sizes of approximately tens of nanometers (Figure 6e). The back-scattered large-area imaging photograph (Figure 6f) indicates that the pore types in the lower sub-member of the second member of Shahezi are primarily bedding fractures and inorganic pores between clay minerals, with a small amount of organic microporosity. Within the sample analysis area, fractures parallel to the bedding plane are well developed. Organic matter primarily exhibits a clastic distribution, with some filling gaps. The pores within clastic organic matter are poorly developed; gap-filling organic matter primarily fills the spaces between quartz and clay minerals, with some fine nanoscale pores developing within the organic matter. Contraction microfractures and grain-edge fractures between clay minerals are well developed.
Intergranular pores are the void spaces between the framework mineral grains/particles of sedimentary rocks. They are the interstitial gaps that remain unfilled by cements, matrix or authigenic minerals during sedimentation and diagenesis, and are the most dominant type of primary pore space in clastic reservoirs, which can also be modified into secondary pores via dissolution during burial diagenesis. EKS shales contain a significant amount of quartz and a certain amount of calcareous minerals, with intergranular pores between mineral grains that lack a fixed arrangement pattern. Intragranular pores include interlayer pores in clay minerals. Clay minerals have unstable chemical properties, and during the transformation of montmorillonite into illite or I/S mixed-layer during deposition and burial, a large number of intragranular pores are formed [20]. EKS shales have a high clay mineral content, so the intragranular pores in clay minerals are also major contributors to the storage space for shale gas in terrestrial environments. Intercrystalline pores are pores that form during crystal accumulation, commonly found between quartz and feldspar crystals and between pyrite crystals. These pores have good connectivity. Similarly, when mud shales are buried at greater depths, unstable minerals undergo dissolution, forming dissolution pores, which are primarily caused by geochemical processes under high-temperature conditions. Organic pores primarily develop between and within organic matter. The coexistence of organic matter and pyrite is also common, typically forming a relationship of encapsulation and being encapsulated, with a small number of organic pores developing between them [66]. EKS shales contain a small number of organic pores, primarily organic pores within asphalt, organic pores within plant debris, and organic intergranular pores filled between pyrite and carbonate minerals.

4.3. Lithofacies Characteristic

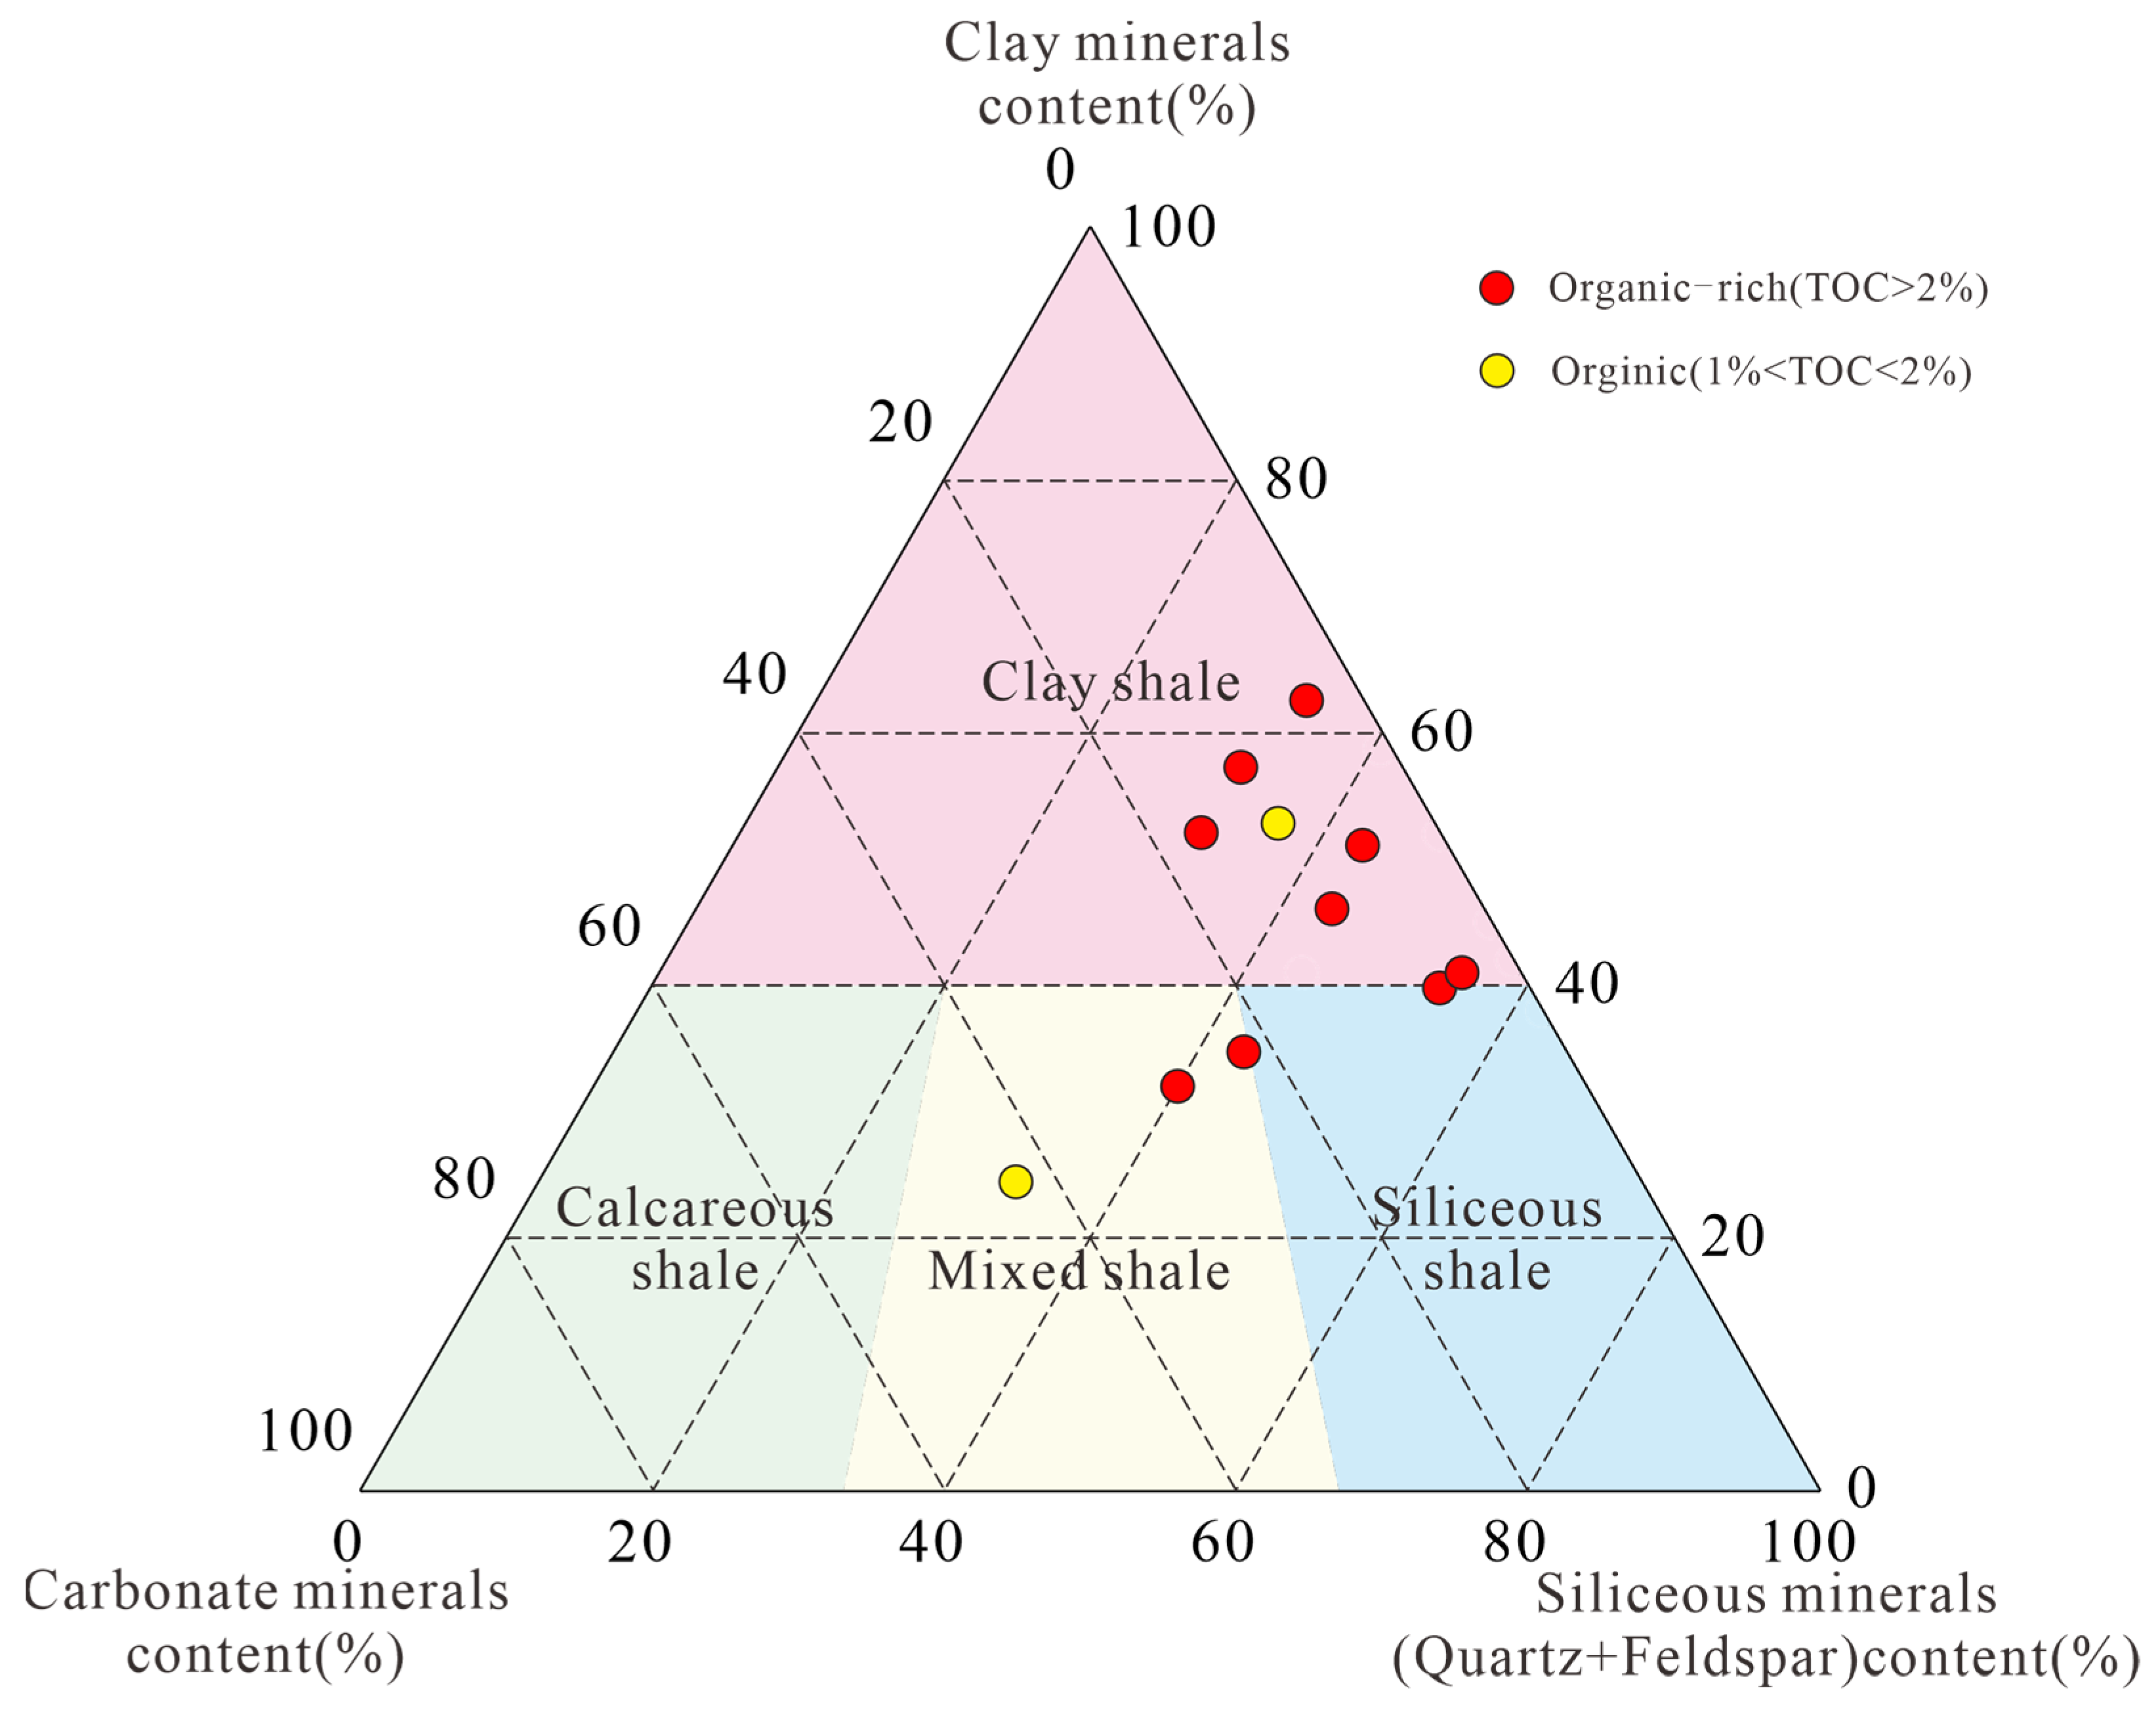
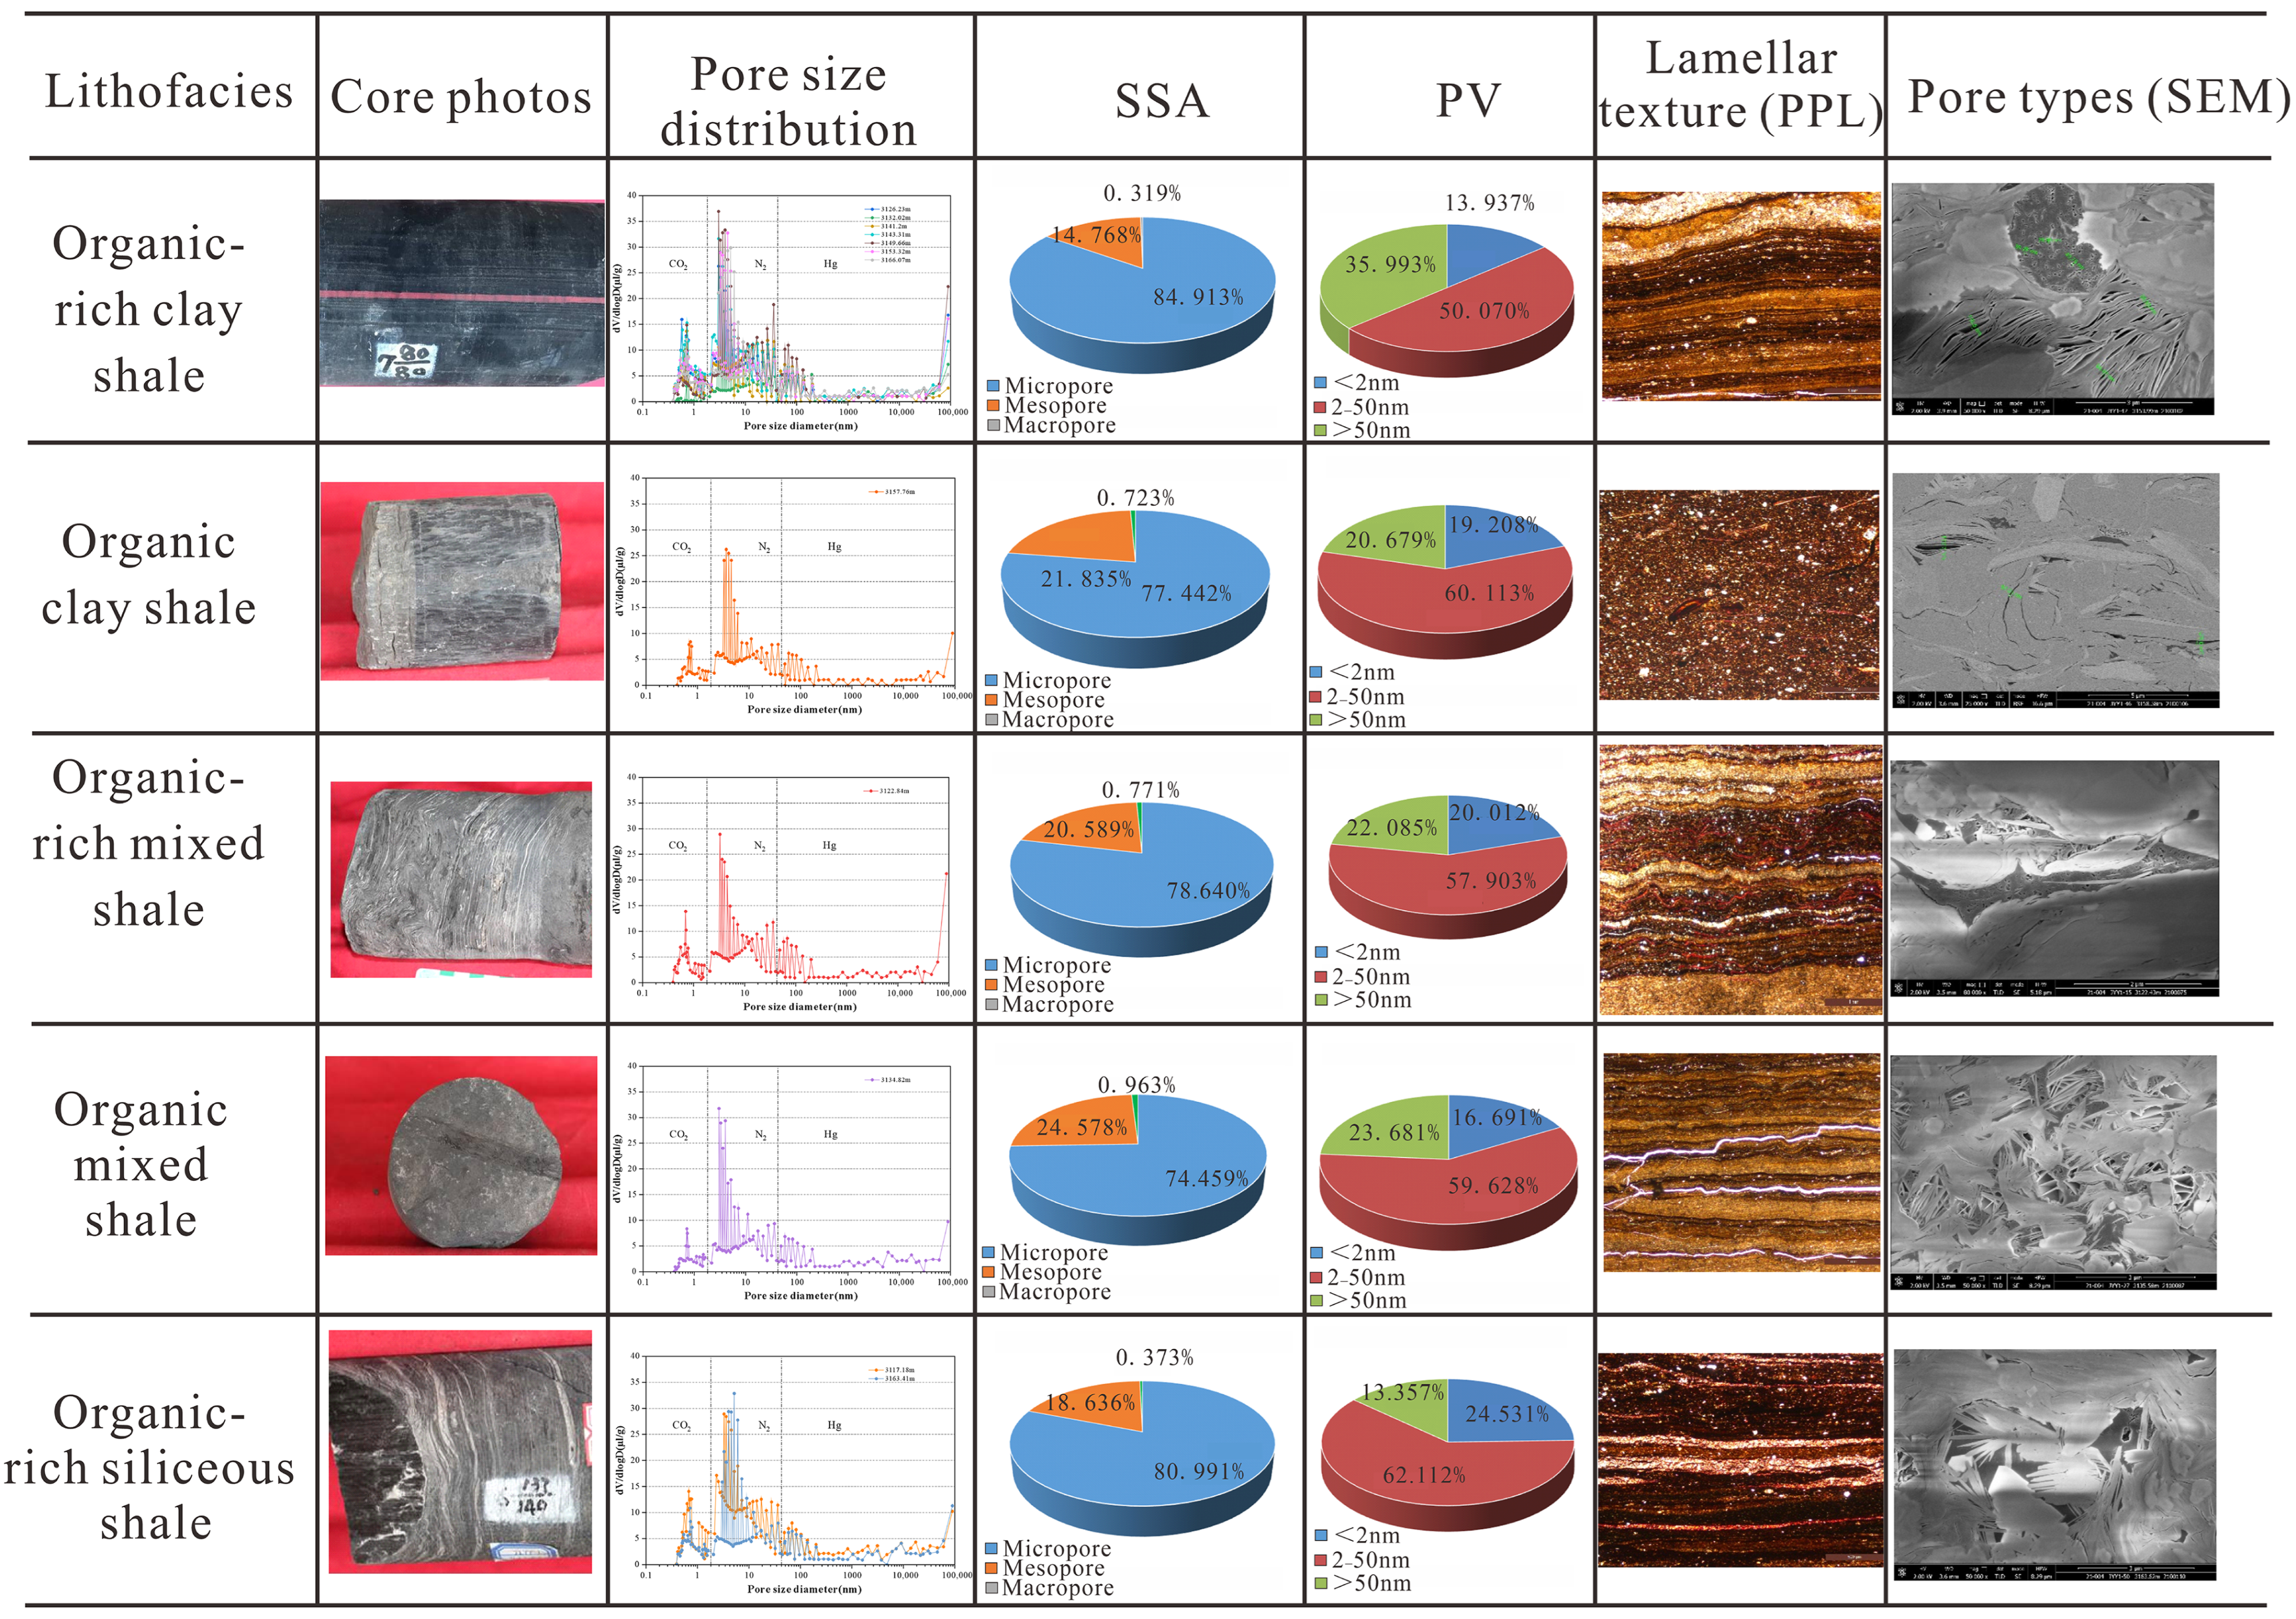
Previous studies have shown that determining mineral composition through XRD analysis is currently the most effective and widely used lithofacies classification scheme. There is a coupling relationship between mineral composition and TOC; for example, quartz, as a brittle mineral, provides support and forms pores, which is beneficial for oil storage. At the same time, the interstitial pores of quartz can be filled with organic matter; Clay provides fine-grained pores and surface adsorption sites, promoting organic carbon adsorption [67,68,69]. Combining this with the total organic carbon content (TOC) of shale as a lithofacies classification parameter can effectively reflect the basic characteristics of shale gas reservoirs. According to the lithofacies classification scheme published by Li Zhuo et al. in 2017 [70], EKS shales can be divided into four lithofacies types, specifically Clay Shale, Calcareous Shale, Siliceous Shale and Mixed Shale (Figure 7). The shale samples from the study area are primarily clay shale, followed by mixed shale, with siliceous shale being the least common. No calcareous shale was observed. Among these, organic-rich shale hosts well-developed assemblages of all three mineral types; organic shale is characterized by a dominance of clay minerals, with siliceous minerals as the subordinate constituent; no organic-poor shale was observed in the study, and organic-poor mudstone is exclusively developed within the upper sub-member of the Second Member of the Shahezi Formation.
The organic-rich clay shale facies are primarily developed in the lower part of the EKS shales, with the following compositional characteristics: clay mineral content ranging from 41.0% to 60.1%, with an average of 49.5%; quartz and feldspar content ranging from 29.0% to 41.4%, with an average of 34.8%; carbonate mineral content ranging from 0% to 10.7%, with an average of 7.14%; and total organic carbon (TOC) values ranging from 2.19% to 2.96%, with an average of 2.46%. The organic-rich siliceous shale facies are predominantly found in the upper section and locally in the lower part of the EKS shales. They are compositionally defined by clay mineral content ranging from 33% to 39%, averaging 36%; quartz and feldspar content ranging from 41% to 53%, with an average of 47%; carbonate mineral content ranging from 0% to 21%, with an average of 13.5%; and TOC values ranging from 2.1% to 2.95%, with an average of 2.53%. The organic-rich mixed shale is primarily distributed in the middle to upper parts of the EKS shales, with clay mineral content ranging from 32% to 41%, averaging 36.5%; quartz and feldspar content ranging from 30% to 41%, with an average of 36.2%; carbonate mineral content ranging from 23.2% to 28%, with an average of 25.6%; and TOC values ranging from 3.03% to 3.40%, with an average of 3.22%. The organic-bearing mixed shale facies are primarily developed in the middle section of the EKS shales, with the following compositional features: clay mineral content ranging from 31.1% to 24.2%, averaging 27.7%; quartz and feldspar content ranging from 17.9% to 32.4%, averaging 25.4%; carbonate mineral content ranging from 0% to 42.5%, averaging 33.6%; and TOC values ranging from 1.32% to 1.98%, with an average of 1.65%. Organic clay shale is primarily developed in the lower part of the EKS shale, with clay mineral content around 50%, quartz and feldspar content around 35%, carbonate mineral content around 10%, and TOC values around 1.5%.

4.4. Mercury Injection Capillary Pressure (MICP)

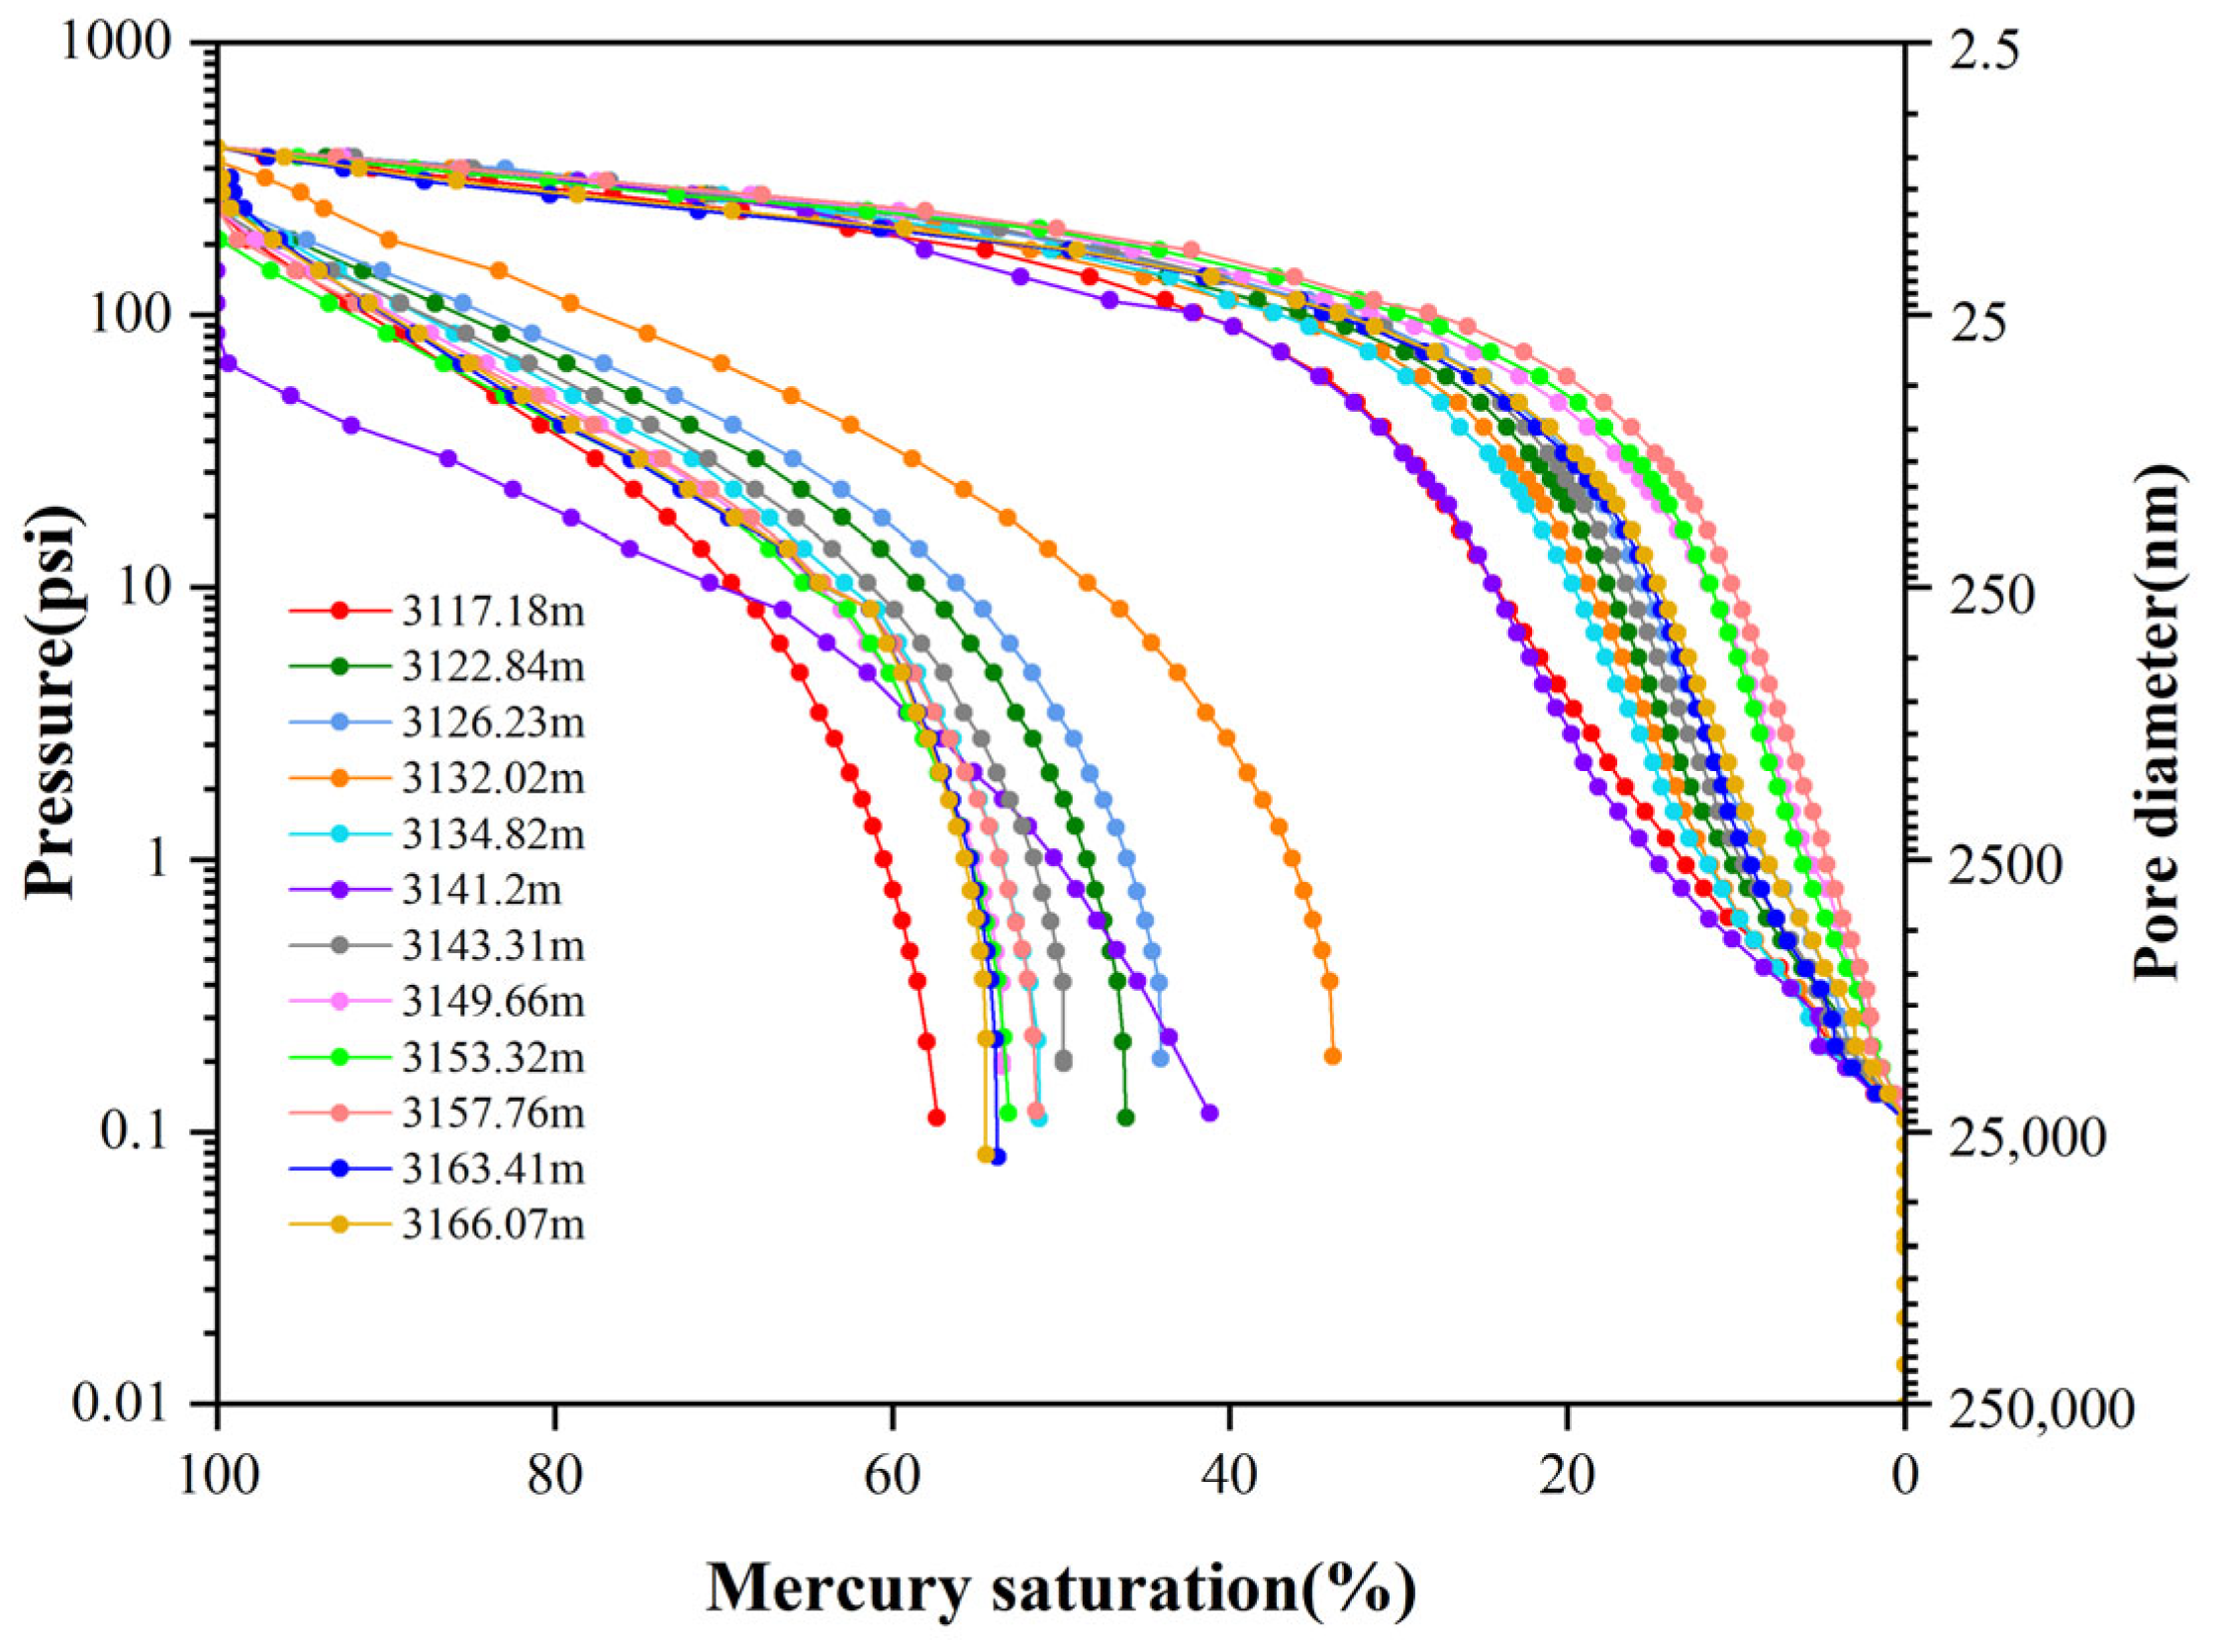
In Figure 7, the results of the high-pressure mercury injection method for EKS shales are presented. In the initial stage, as shown in Figure 8, as mercury is injected into the sample, the injection pressure continues to rise, but the mercury invasion rate remains very low. During the main mercury intrusion phase, as a large amount of mercury is injected into the sample, the curve enters a plateau phase. At this point, the displacement pressure of the EKS shales in the figure reaches approximately 100 psi, and mercury continues to enter the sample until it reaches 100% mercury saturation. Approximately 80% of the total mercury is forced into these samples, with pore sizes primarily concentrated between 10 nm and 50 nm.
Additionally, based on the shape of the mercury intrusion–extrusion curves, it can be observed that the sample’s pore throat sorting exhibits significant and skewness is coarse. The sample’s displacement pressure ranges from 29.445 to 43.055 MPa, with an average pressure of 33.446 MPa. According to the mercury withdrawal curve, the mercury removal efficiency for most samples ranges from 42.64% to 66.12%, with an average mercury removal efficiency of 50.82%. This phenomenon indicates that the non-wetting phase fluid (mercury) cannot be completely expelled from the pore system during the pressure reduction process, resulting in 40%–60% of the injected mercury remaining trapped in the pore-throat network. There are two reasons for this situation: first, the blockage of pore throats under high experimental pressure; and second, the prevalence of nano-scale pores with narrow throats in the rocks, resulting in inherently poor connectivity. Nevertheless, for shale reservoirs, the observed mercury removal efficiency of 42.64%–66.12% is relatively high. This suggests good pore connectivity and indicates promising development potential for this formation.
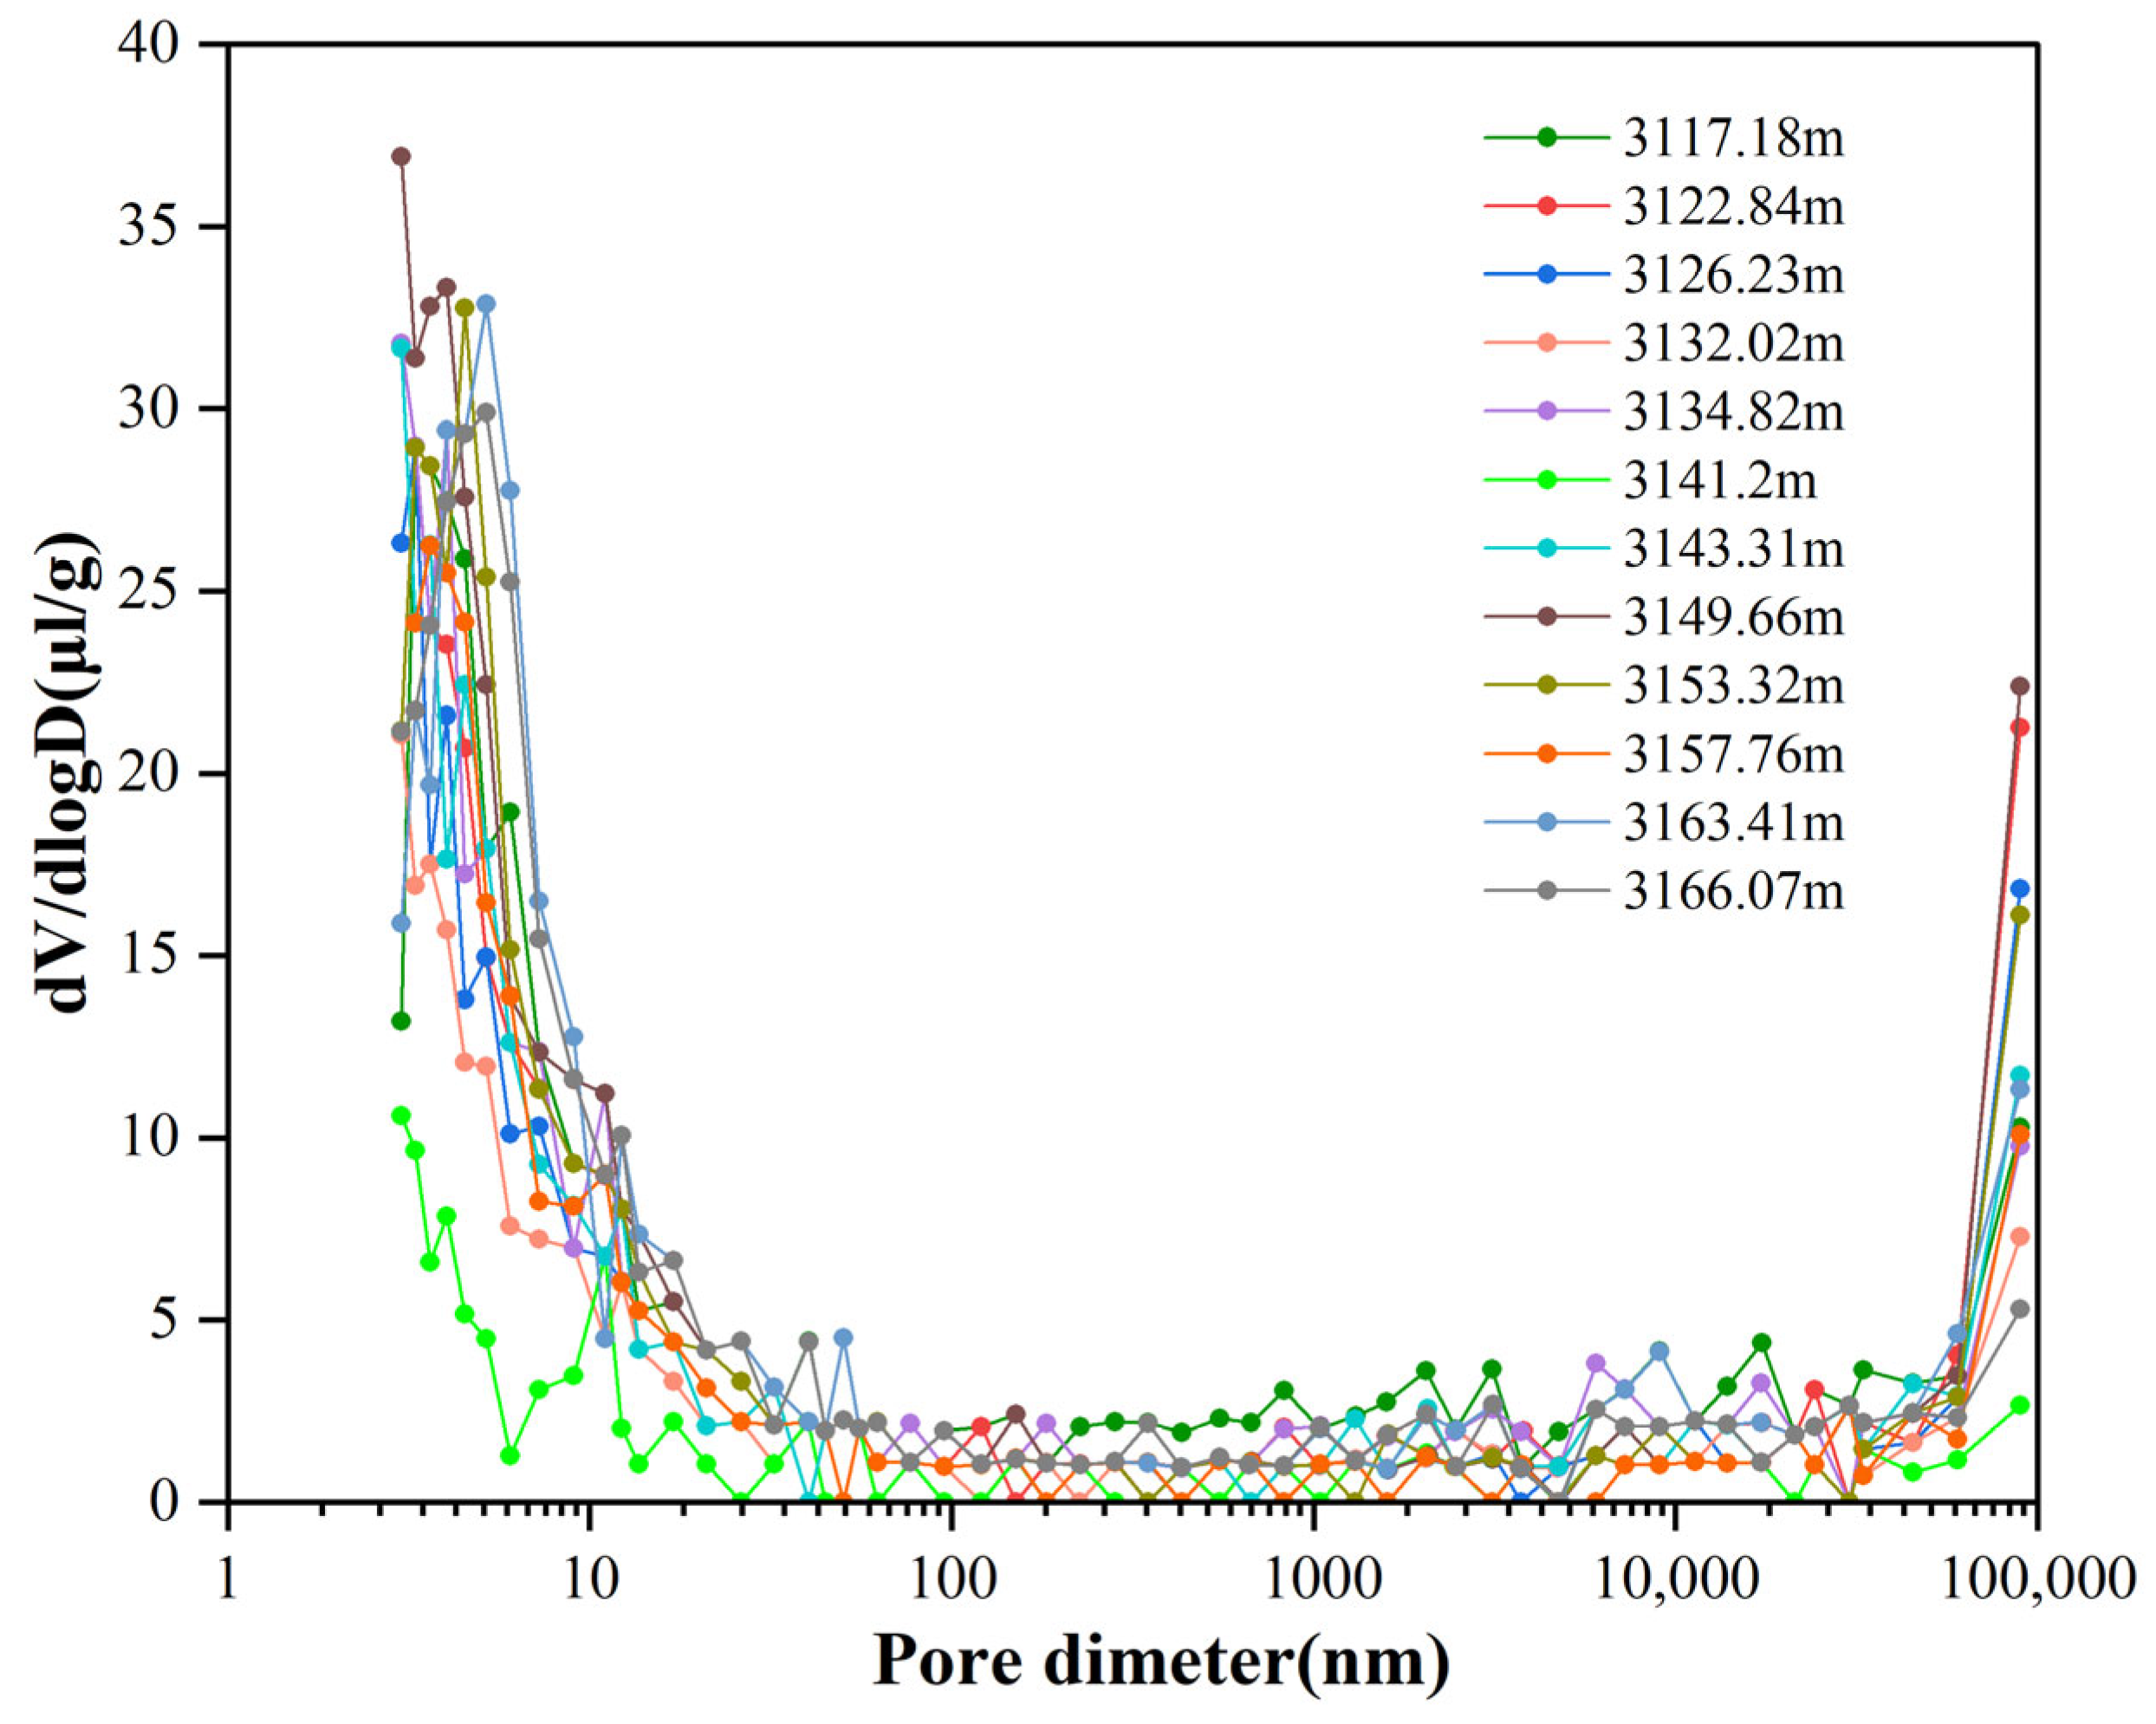
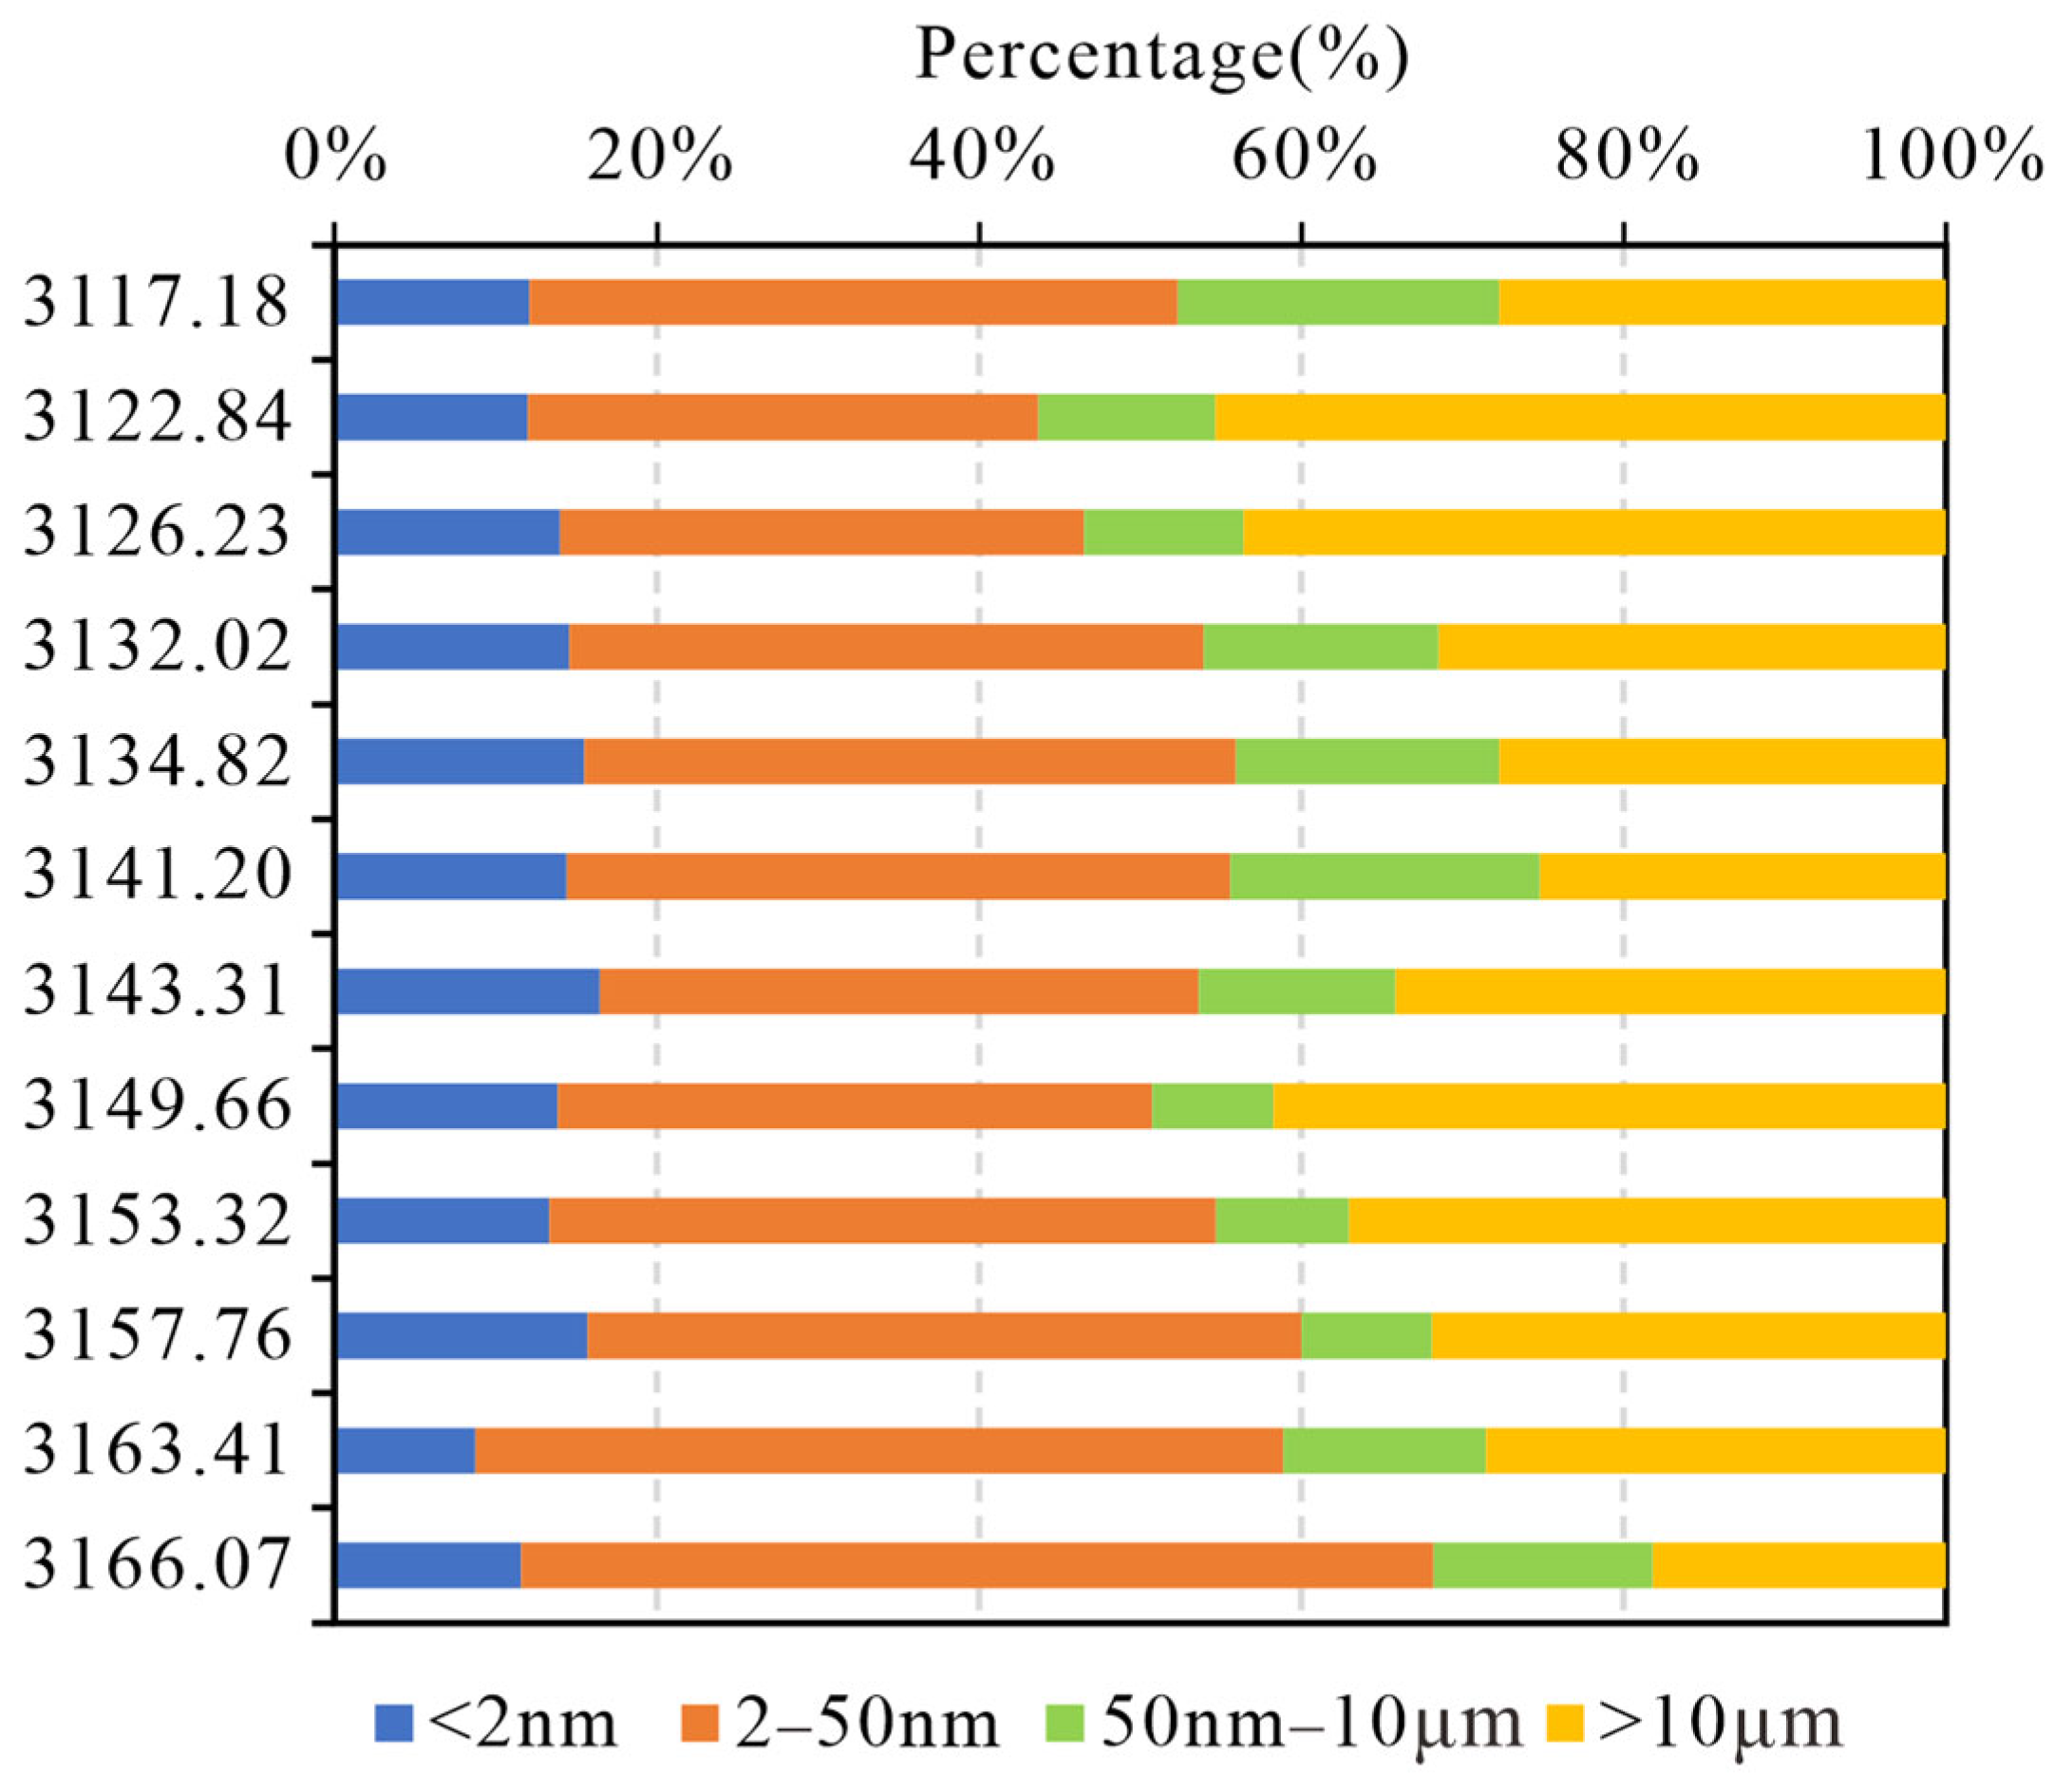
The pore size distribution of EKS shales obtained from mercury injection is shown in Figure 9, with the horizontal axis representing pore diameter and the vertical axis representing dV/dlogD. The vertical axis value dV/dlogD is calculated using the cumulative pore volume obtained from the experiment, and its relationship with pore diameter effectively reflects the distribution of pore sizes. Overall, the pore size distribution for mercury injection capillary pressure experiments primarily ranges from 3 nm to 50 nm, with a portion exceeding 10 μm. Figure 10 illustrates the percentage change in pore volume (PVs) of EKS shales obtained using the high-pressure mercury injection method. Among these, mesopores (2–50 nm) dominate, accounting for 31.7%–56.6% of the total pore volume, followed by macropores larger than 10 μm, whose pore volume percentage varies between approximately 18.2% and 45.3%. Vertically, as depth increases, the proportion of mesopores gradually increases, while the proportion of macropores gradually decreases.

4.5. Gas Physisorption

4.5.1. Adsorption–Desorption Isotherms and Pore Geometry

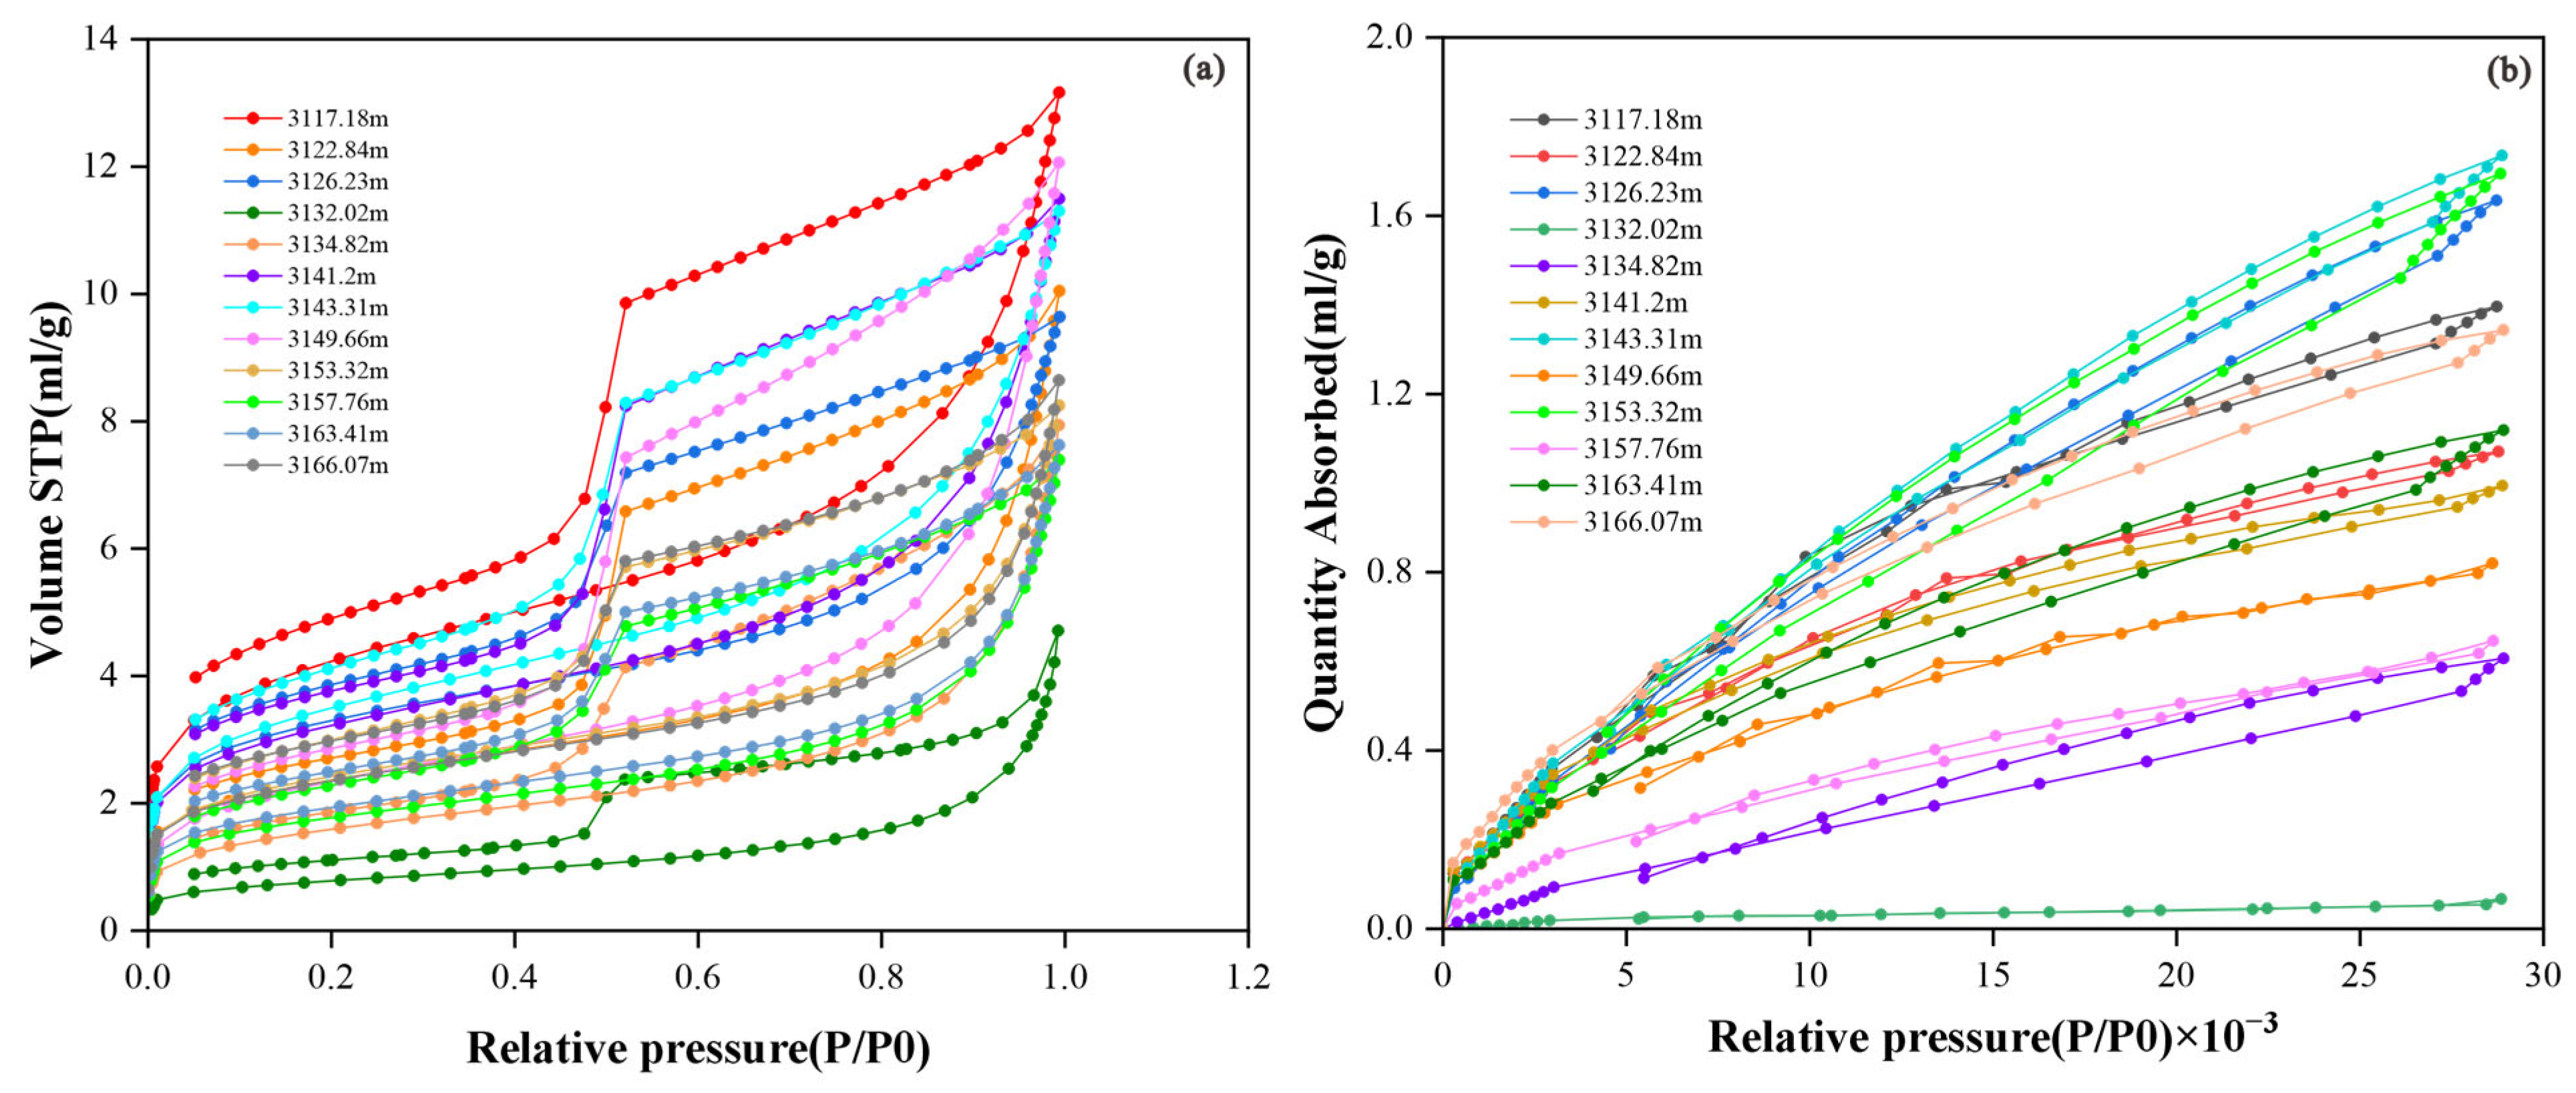
Low-temperature nitrogen adsorption experiments can reveal the pore structure of shale and quantitatively characterize information such as pore volume and specific surface area at the mesopore and micropore scales. The results show that the adsorption–desorption curves of EKS shales exhibit hysteresis loop characteristics, with similar curve shapes. The adsorption curves of all samples exhibit an inverted “S” shape (as shown in Figure 11a). According to the classification standards of the International Union of Pure and Applied Chemistry (IUPAC), the isothermal adsorption curve type is Type IV, and the hysteresis loop type is H3 and H4. This indicates that EKS shales have complex pore sizes with a broad size distribution, primarily featuring “slot-type pores” and “plate-like pores,” suggesting the presence of large plate-like particle matrices with plate-slot structures and fractures. Additionally, this hysteresis loop is associated with mesoporous solids, implying that EKS shales exhibit relatively well-developed mesopores (2–50 nm).
During the low-pressure initial stage (when the relative pressure P/P0 approaches 0.00363), the adsorption isotherm rises gradually and exhibits a convex shape. At this stage, gaseous nitrogen molecules undergo monolayer adsorption on the surface of shale particles, or fill into the micropores of the shale. This transition point marks the phase between monolayer adsorption and multilayer adsorption [71]. As the relative pressure increases, liquid nitrogen achieves multi-molecular layer adsorption on the shale pores, and the isotherm approaches linearity. When the equilibrium pressure approaches the saturated vapor pressure, a distinct saturated adsorption plateau is observed, indicating that these samples primarily develop mesopores. All samples adsorbed nitrogen at relatively low relative pressures (less than 0.1), indicating that they all contain micropores (pore sizes less than 2.00 nm). When P/P0 approaches 0.4–0.5, the desorption isotherm exhibits a noticeable change, with the adsorption branch and desorption branch separating to form a hysteresis loop. This phenomenon is consistent with capillary condensation during the multilayer adsorption in mesoporous materials, indicating that heterogeneous shale pores with a significant volume of pores smaller than 4 nm [72]. Its consistent presence across all samples further confirms the widespread existence of these sub-4 nm pores. Subsequently, the adsorption isotherm rises sharply with increasing relative pressure and continues to grow. When the relative pressure P/P0 approaches 0.8–0.9, the curve becomes concave. As the relative pressure approaches 1, the adsorption amount begins to rise rapidly, and the adsorption and desorption curves tend to overlap, with the hysteresis loop gradually closing. When the relative pressure P/P0 reaches 0.99, the curve closes.
Low-pressure adsorption (LPA) of carbon dioxide is a powerful tool for calculating the pore size distribution (PSD), specific surface area (SSA), and pore volume (PV) of pores ranging from 0.3 nm to 1.5 nm [9,11,21], while low-pressure adsorption of nitrogen aids in characterizing mesoporous and macroporous properties. However, the application of low-pressure adsorption has an upper pore size limit of 300 nm [21]. Under the experimental condition of 0 °C, the saturated vapor pressure (P0) of carbon dioxide is 3485.3 kPa. The specific surface area and pore volume of micropores were calculated using the Dubinin–Astakhov (D-A) and Dubinin–Radushkevich (D-R) models from data obtained at relative pressures (P/P0) ranging from 4 × 10⁻⁴ to 3.2 × 10⁻². The carbon dioxide adsorption isotherm for EKS shales (Figure 11b) was classified as Type I according to the Brunauer, Demin, and Teller classification [21,73], indicating a microporous solid with microporous filling phenomena. The adsorption capacity increases gradually with increasing P/P0, and the saturated adsorption value represents the filling volume.

4.5.2. Pore Size Distribution

The Barrett–Joyner–Halenda (BJH) model is the most suitable and widely used method for interpreting pore size distribution (PSD). Nitrogen adsorption–desorption isotherms are used to interpret pore size distribution, but due to the tensile strength effect (TSE) phenomenon, the pore size distribution calculated based on desorption isotherms produces a false peak at a pore size of approximately 3–4 nm [74]. However, the pore size distribution calculated based on adsorption data is more consistent with ultra-small-angle neutron scattering/small-angle neutron scattering (USANS/SANS) results for dense sandstone, and is almost unaffected by the TSE phenomenon [10,74,75]. Therefore, in this study, nitrogen and carbon dioxide adsorption branches are primarily used to calculate and analyze the pore size distribution of shale.
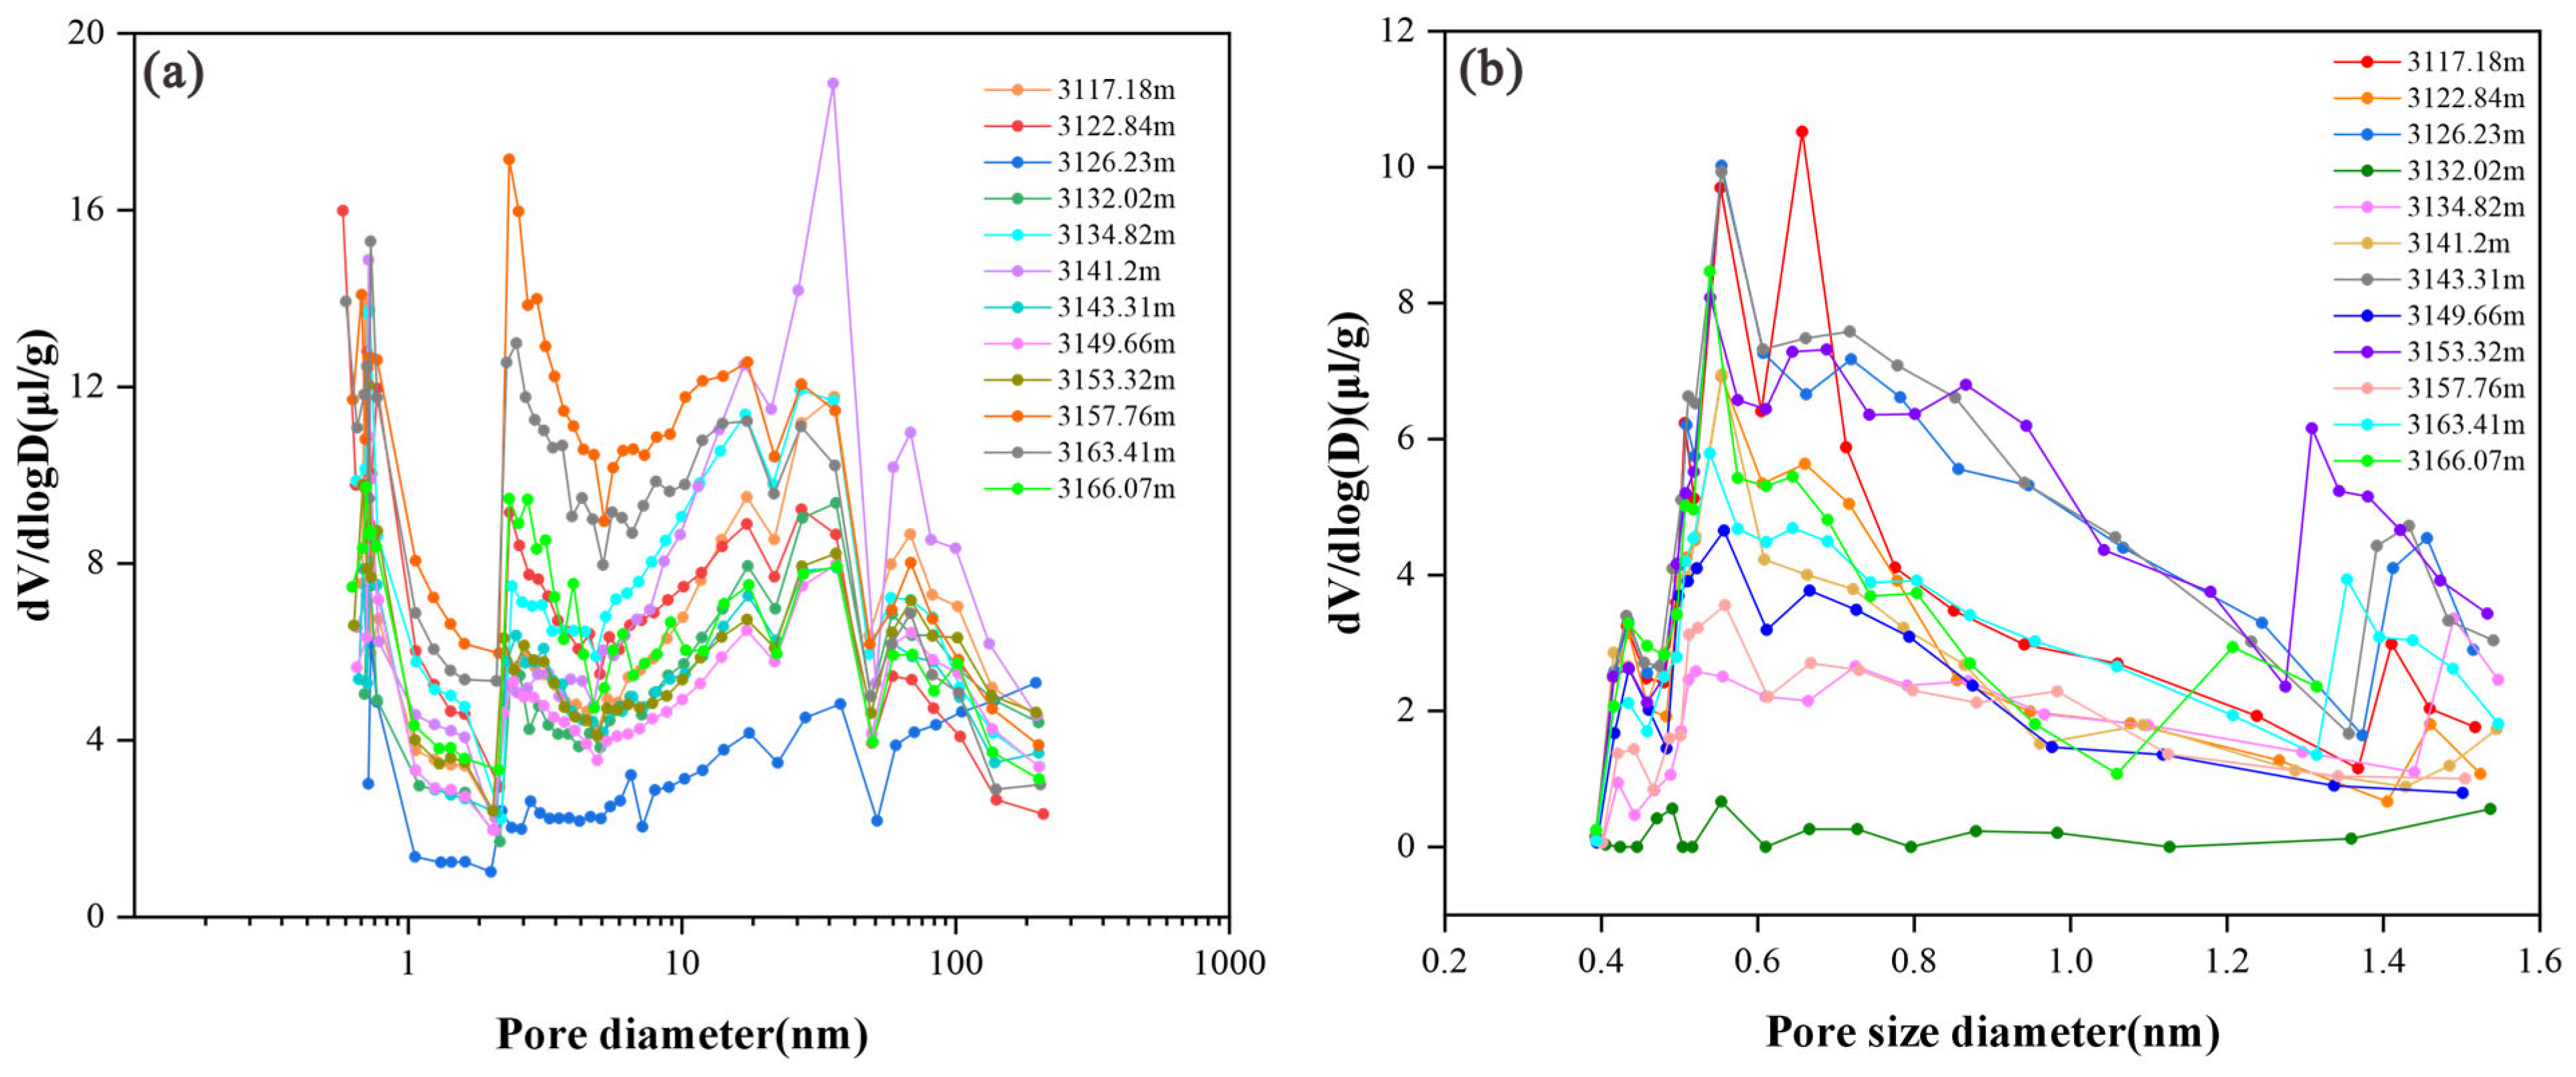
For the quantitative comparison of relative pore volumes across specified pore size ranges, the dV/dlog(D) plot offers a distinct advantage over the dV/dD versus D plot. This is because the “visible area” under the dV/dlog(D) curve directly corresponds to the actual pore volume [31]. Based on the pore size distribution diagrams, the pore size distribution diagrams of EKS shales with different lithologies (Figure 12a) show high peaks at 0.8–1 nm, 3–4 nm, and 45–50 nm; Figure 12b shows peaks at 0.5–0.8 nm and 1.1–1.5 nm. This indicates that EKS shales have the highest probability of occurrence within the 1–50 nm pore size range. Therefore, according to the classification standards of the International Union of Pure and Applied Chemistry (IUPAC), the pore systems of these shales are dominated by mesopores, with a minor proportion of micropores. However, the curves of the samples used exhibit tailing, indicating the presence of a certain number of macropores within the samples. The dV/dlogD plot for carbon dioxide (Figure 11b) indicates a multi-peak pore size distribution within the micropore range (<1 nm), with the pore size distribution range of EKS shales being 0.4–1.5 nm.

4.5.3. Pore Volume and Specific Surface Area

Specific surface area (SSA) refers to the spatial location where gas adsorbs onto the surface of solid particles, making it an indicator of shale adsorption capacity. In this study, the BET model and BJH model were employed to calculate specific surface area. The BET theory, developed in 1938 for multi-layer adsorption, has been widely used to calculate the specific surface area of porous materials. However, its assumptions have some questionable aspects, such as the assumption that the nitrogen surface is energetically uniform, that the adsorption heat for the second layer and higher layers is the same, and the liquefaction assumption [75]. In this study, nitrogen adsorption data within a relative pressure range of 0.05–0.3 were used to calculate the BET specific surface area for all samples. The specific surface area (SSA) can be calculated from pore size distribution (PSD) data using the BJH model and the formula SSA = 4 V/d. Given the model’s reliability for pores between 1 and 200 nm, we applied it to calculate the BJH SSA across this specific range. Subsequently, the pore volume (PV) of the shale samples was determined from the BJH adsorption data in the relative pressure (P/P0) range of 0.06 to 0.99 [76]. The resulting BJH pore volumes ranged from 8.37 to 25.77 μL/g, averaging 17.04 μL/g.
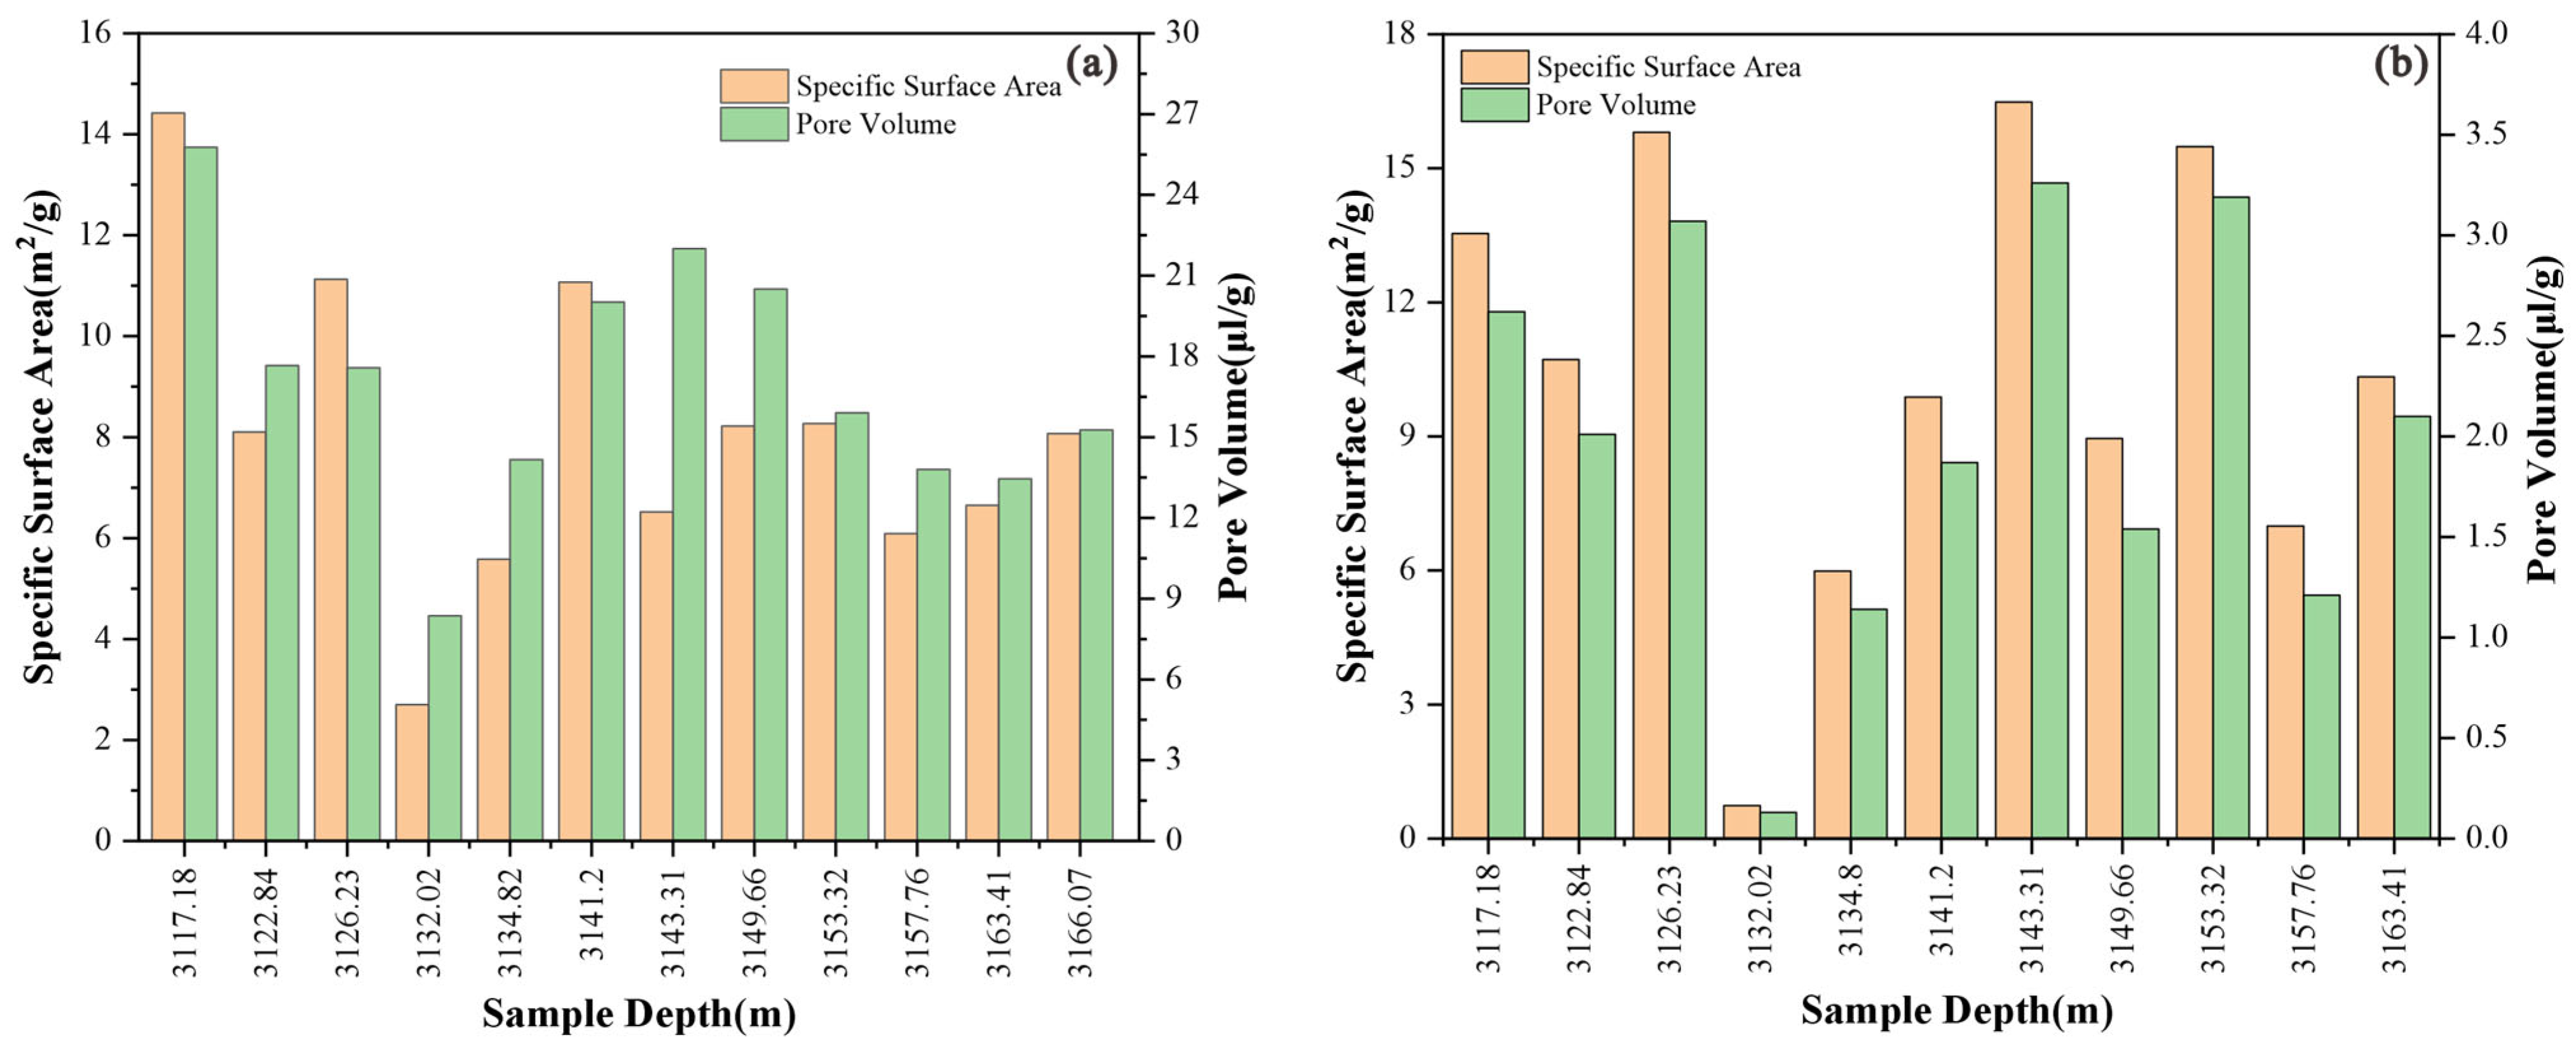
In the nitrogen adsorption experiment, the mesoporous pore volume and specific surface area of the sample at 3117.18 m were the highest, with a pore volume of 25.77 μL/g and a pore specific surface area of 14.42 m2/g; whereas the pore volume and specific surface area of the sample at 3132.02 m were the lowest, with values of 8.37 μL/g and 2.7 m2/g, respectively (Figure 13a). In the carbon dioxide adsorption experiment, the samples at 3143.31 m and 3153.32 m exhibited the highest microporous pore volume and specific surface area, with pore volumes of 1.735 mL/g and 1.649 mL/g, respectively, and pore surface areas of 12.48 m2/g and 12.37 m2/g, respectively (Figure 13b), which may be attributed to larger pore sizes. However, the samples at 3132.02 m had the lowest microporous pore volume and specific surface area, at 0.646 mL/g and 4.30 m2/g, respectively. Carbon dioxide adsorption analysis can study smaller pore sizes, which appear to reach a saturation limit at 50 A (5 nm) [21].

4.6. NMR T2 Distribution

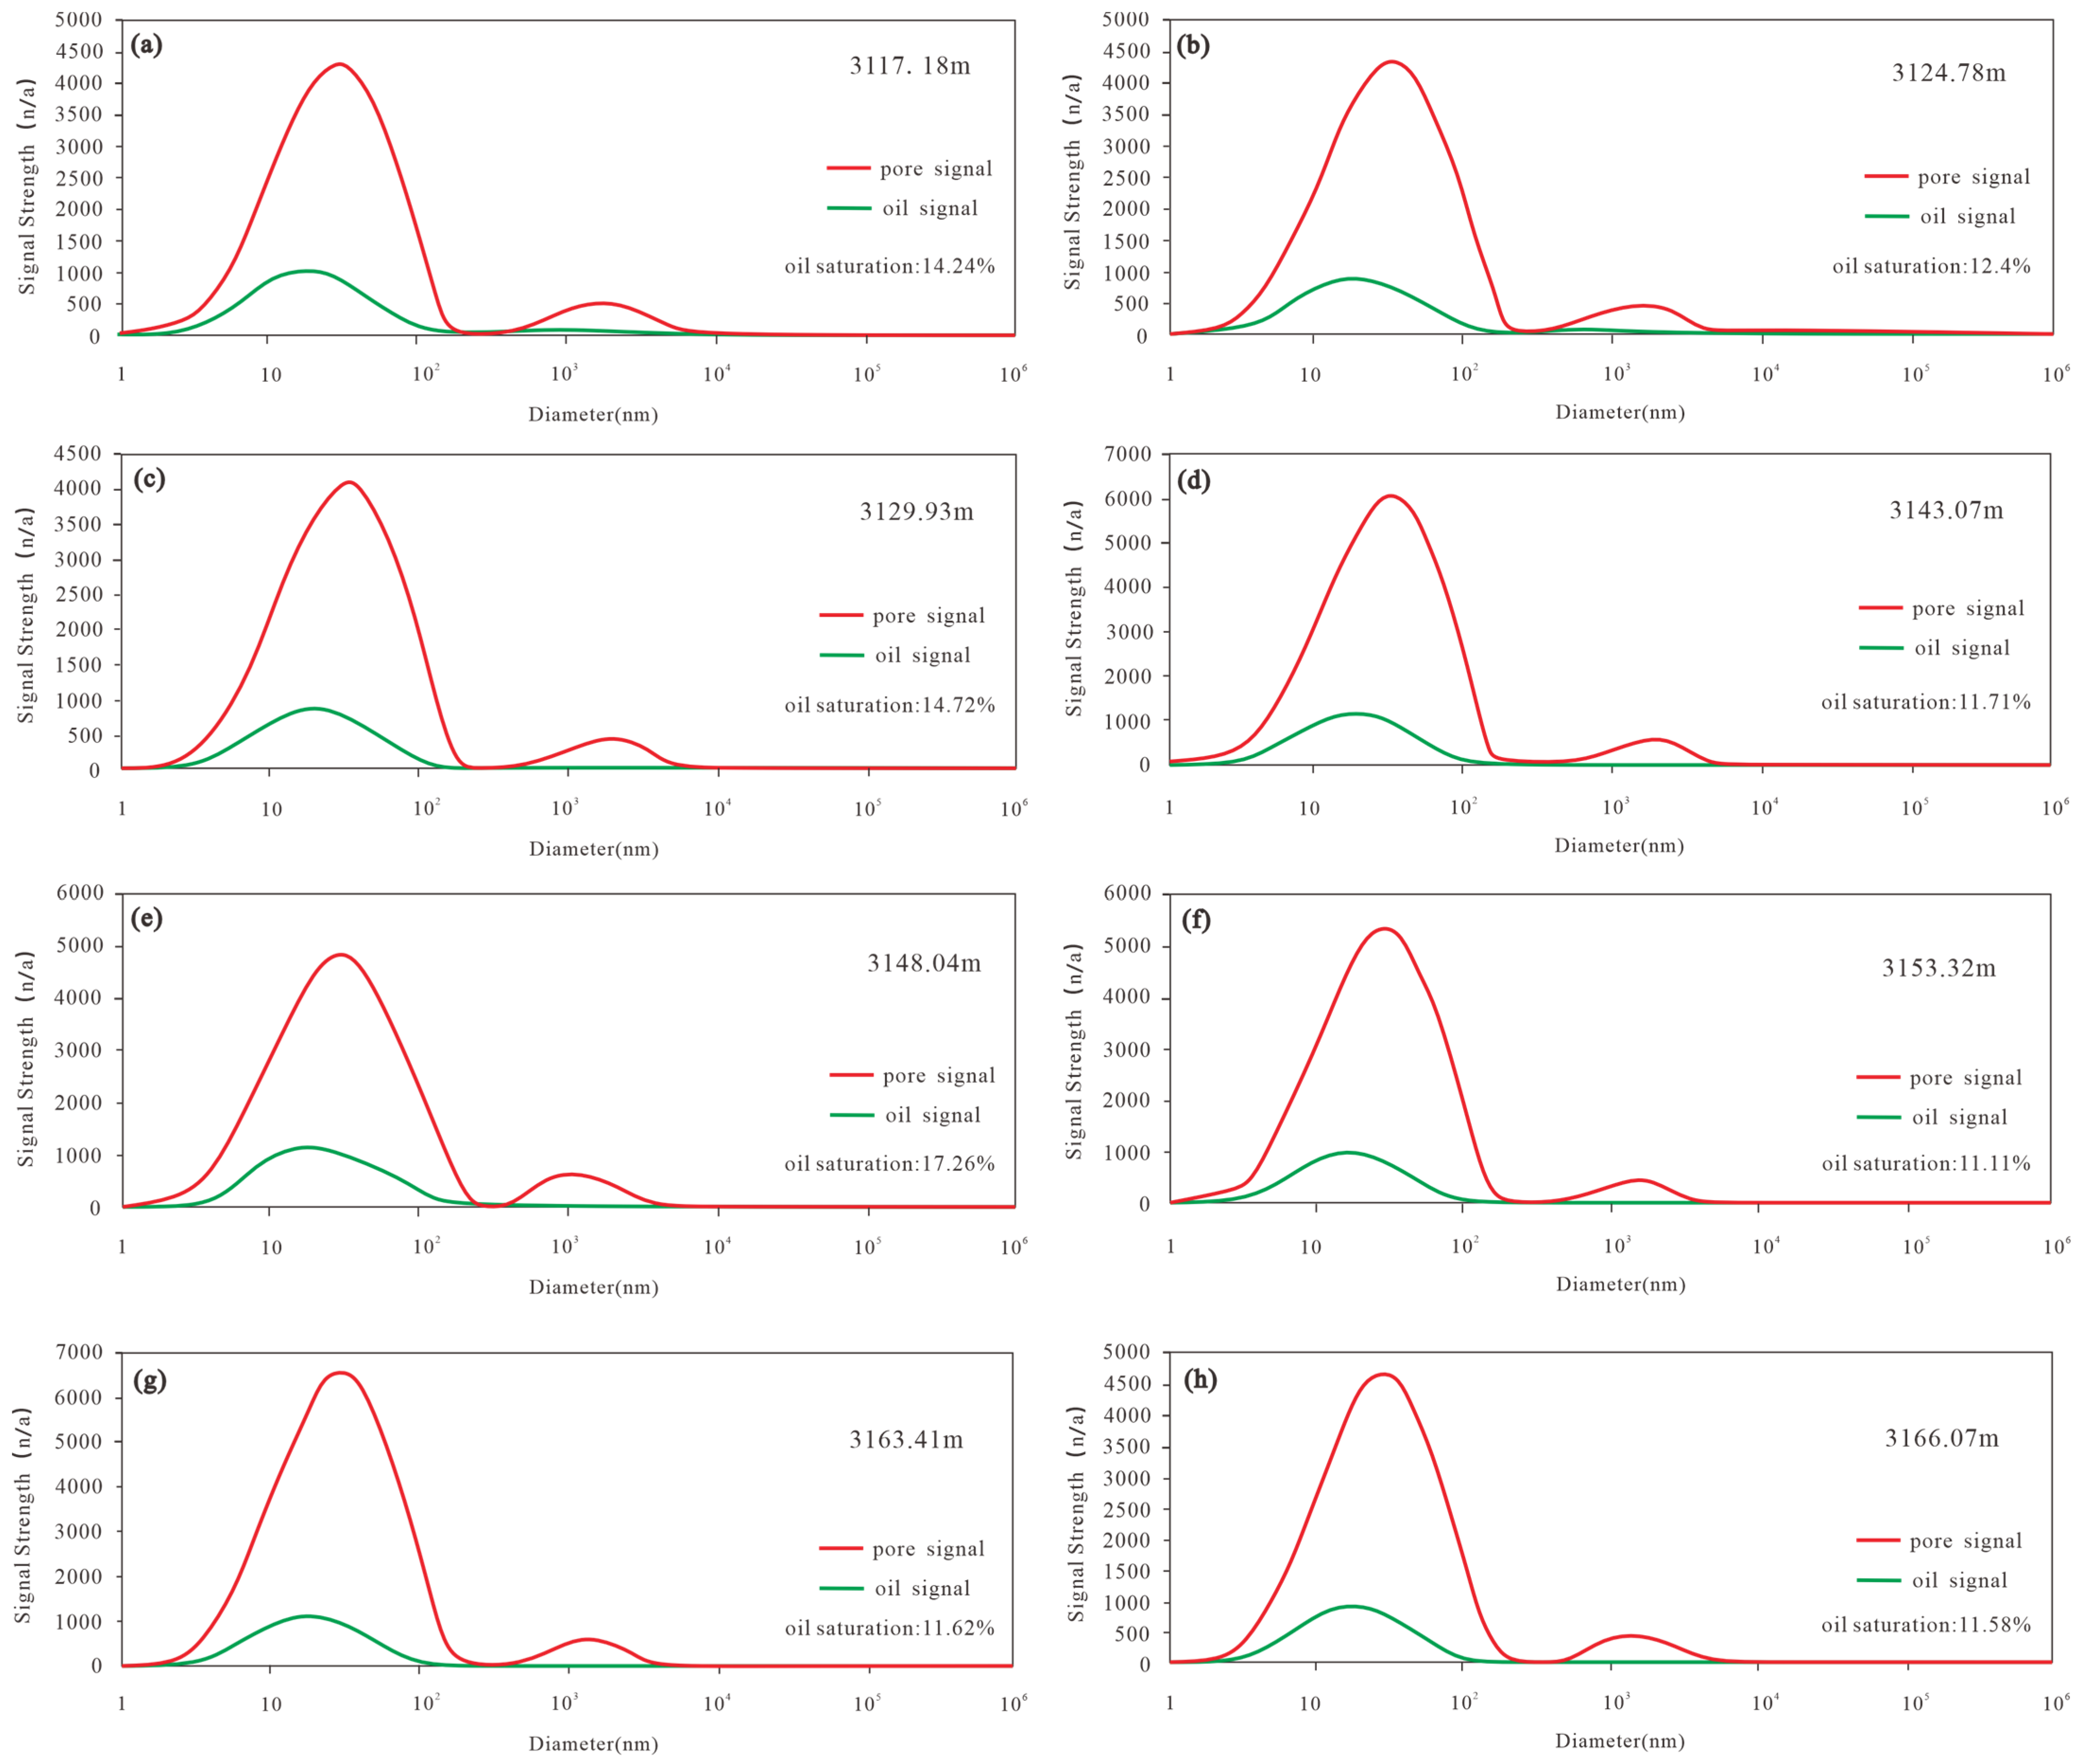
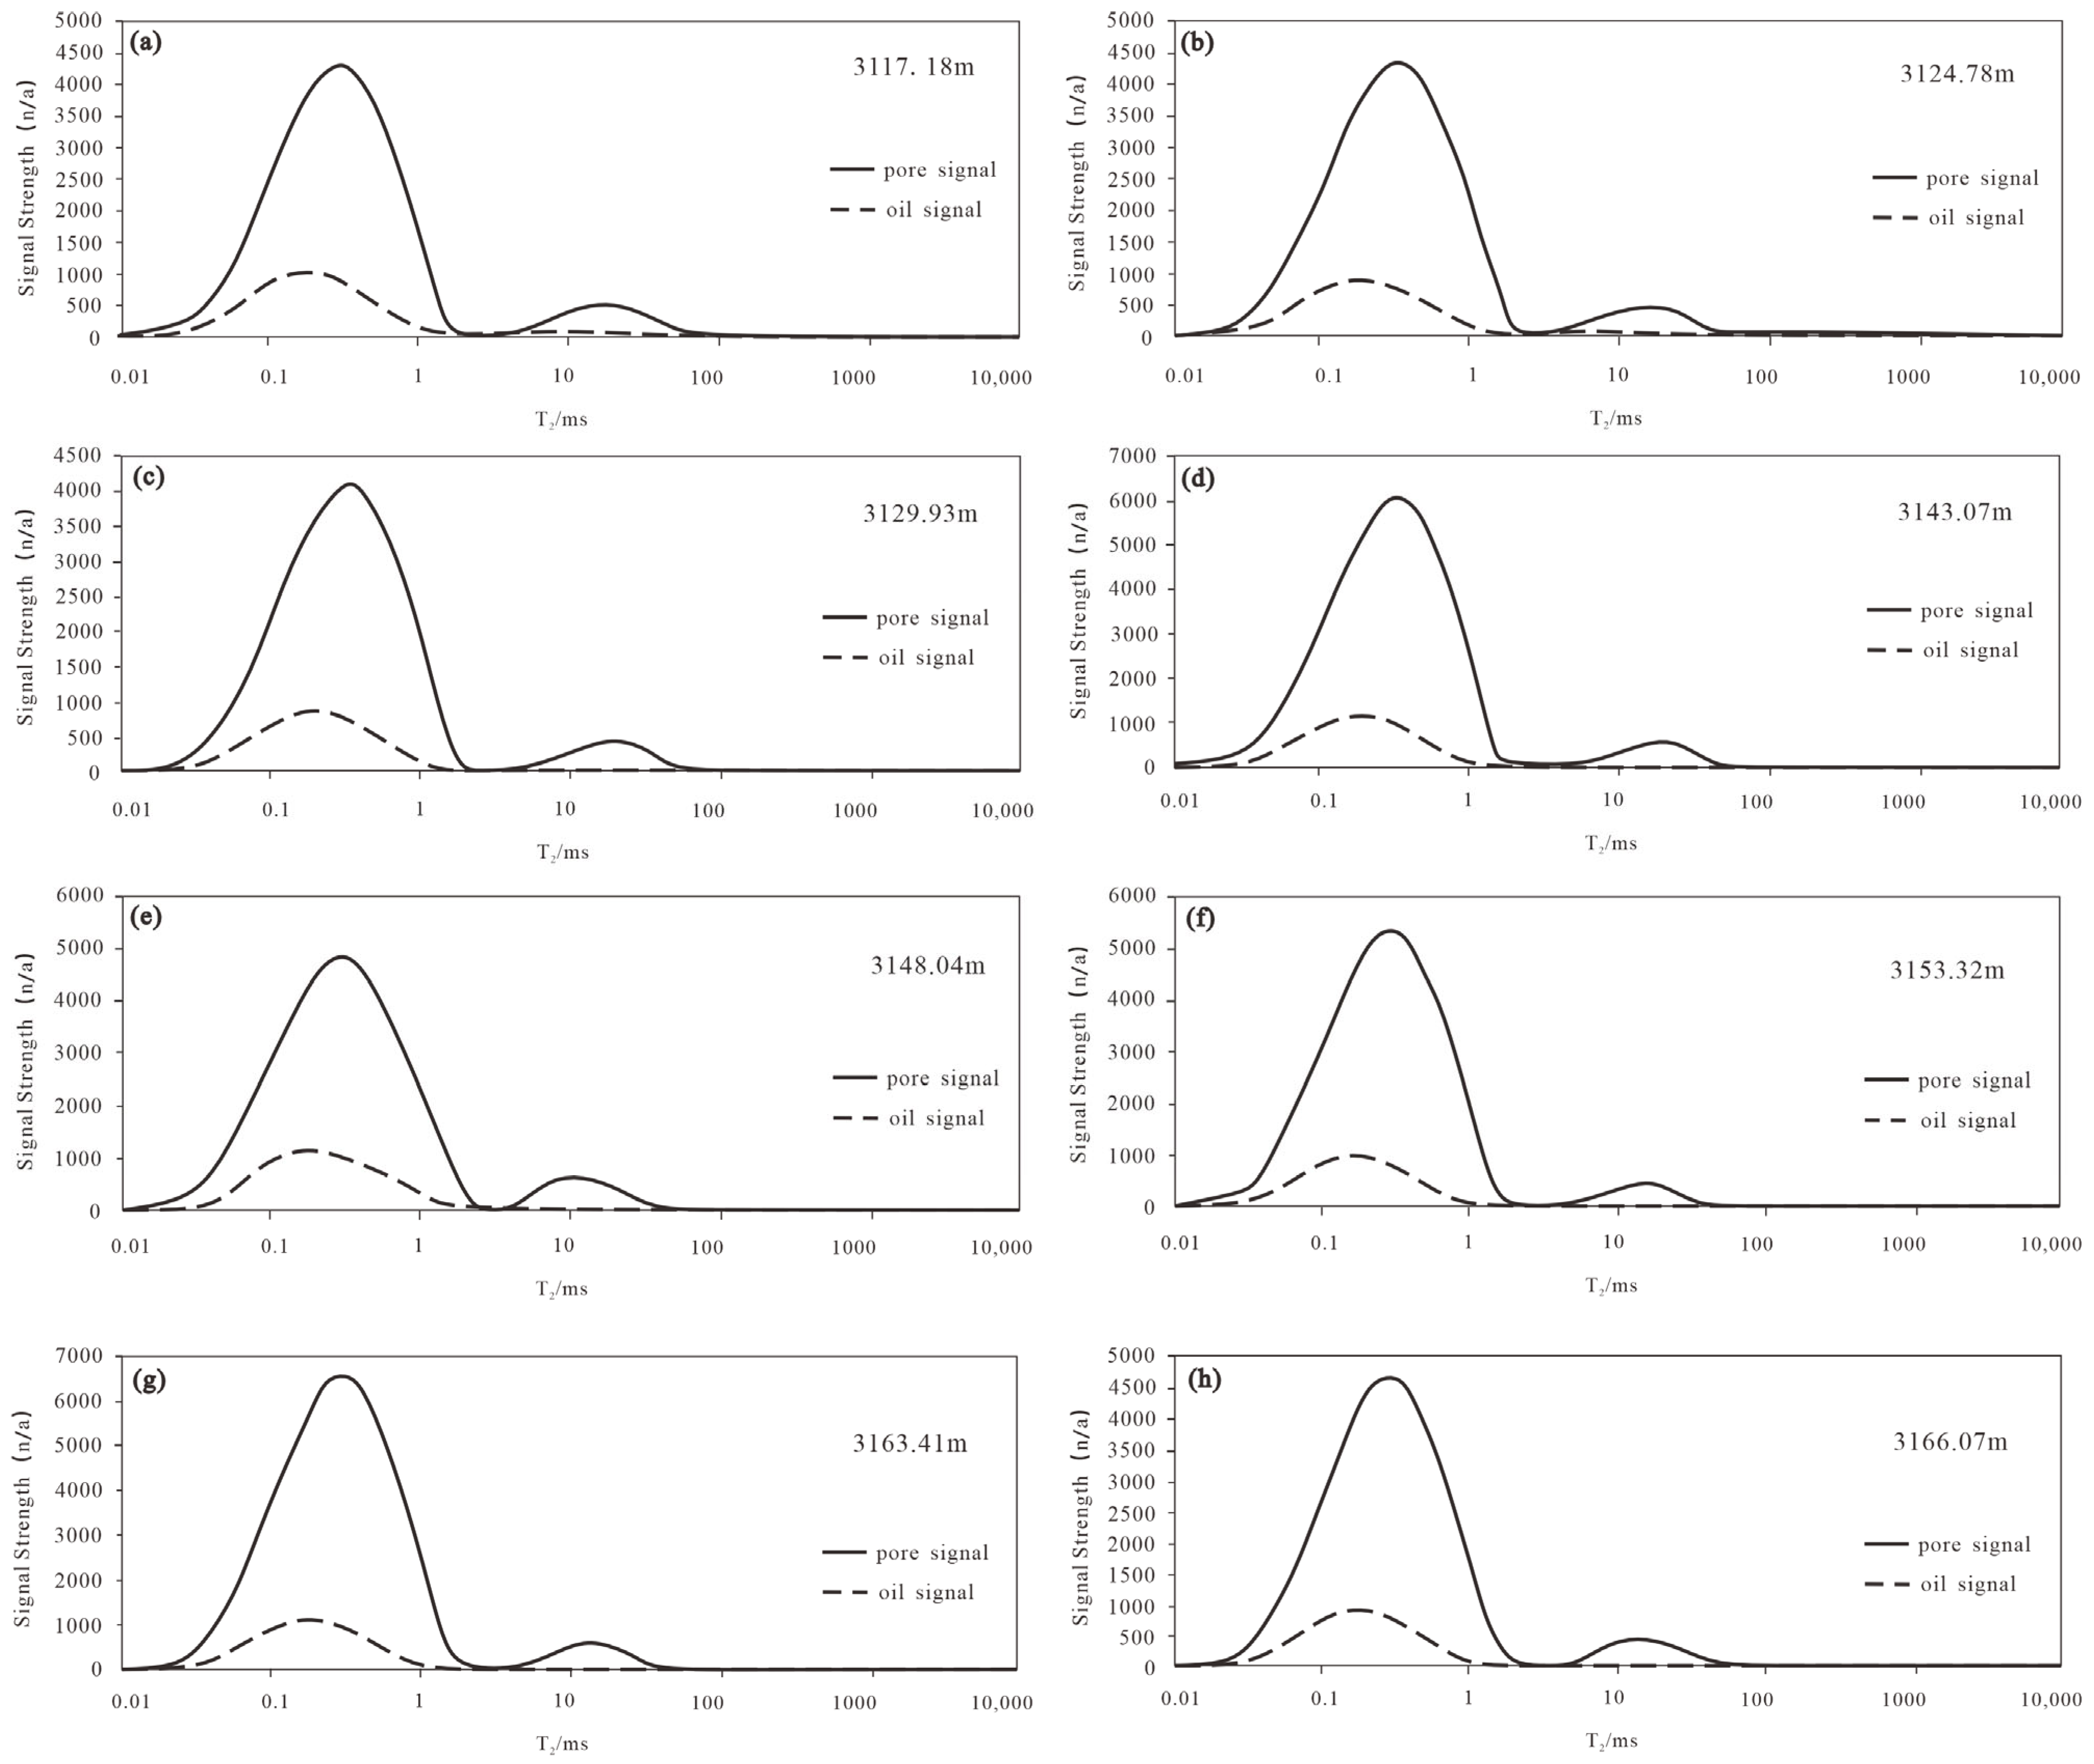
Nuclear magnetic resonance (NMR) experiments were conducted on eight selected EKS shale samples. Following preparation by centrifugation and spontaneous imbibition with saturated brine, the samples’ NMR T2 spectra (Figure 14) were acquired. These spectra display a distinct bimodal distribution, featuring a dominant left peak with a relaxation time between 0.05 and 1 ms and a subordinate right peak ranging from 15 to 70 ms. This signature indicates a pore system rich in mesopores but deficient in macropores. Generally, mobile fluids are subject to weaker forces from the solid surfaces of rock pores, resulting in longer relaxation times. Conversely, confined fluids are subject to stronger forces from the solid surfaces of rock pores, resulting in shorter relaxation times. In other words, mainly corresponds to pores filled with bound fluids., while the right peak represents pores occupied by mobile fluid. Based on the oil signal, it can be concluded that hydrocarbons primarily exist within confined pores.
While previous studies indicate that the pores in EKS shales are predominantly slit-shaped, their interconnected nature allows for the conventional assumption of a cylindrical pore model in analysis. Consequently, a shape factor (FS) of 2 is adopted [58]. According to the research by Sondergeld et al. (2010) on the surface relaxation rate of shale, ρ2 can be taken as 0.05 μm/ms [77,78]. Using Equation (3), the sample’s nuclear magnetic resonance T2 spectrum is converted into a pore size distribution diagram.
The pore signals in Figure 15 were measured after the sample was self-aspirated in saturated salt water following centrifugation. Under these conditions, the pore size distribution of the sample exhibits a discontinuous bimodal characteristic, with the main peak ranging from 1 to 120 nm and the secondary peak ranging from 150 nm to 10,000 nm. The pore size corresponding to the peak height of the main peak is approximately 50 nm, while the secondary peak height corresponds to a pore size of approximately 1200 nm. The porosity at this pore size is the highest among all pore sizes. At this point, the NMR T2 curve can be considered the full pore size distribution curve of the shale sample, indicating that the pore sizes of the shale primarily range from 1 to 120 nm, with pores in the tens of nanometers range being the most prevalent.
Oil signals are primarily obtained through nuclear magnetic resonance after saturating the original sample with a 20% manganese chloride solution. Based on the area ratio of pore signals to oil signals, the oil saturation of the sample can be determined. The total porosity of the EKS Shales ranges from 4.86% to 9.04%, with an average of 6.78%. The oil-saturated porosity ranges from 0.62% to 1.21% (average 0.86%) (as shown in Figure 15). Therefore, the oil saturation range of the EKS shales in the Lishu Fault Sag is 9.66% to 17.26%, with an average value of 12.71%.

5. Discussion

5.1. Full Scale of Pore Size Distribution

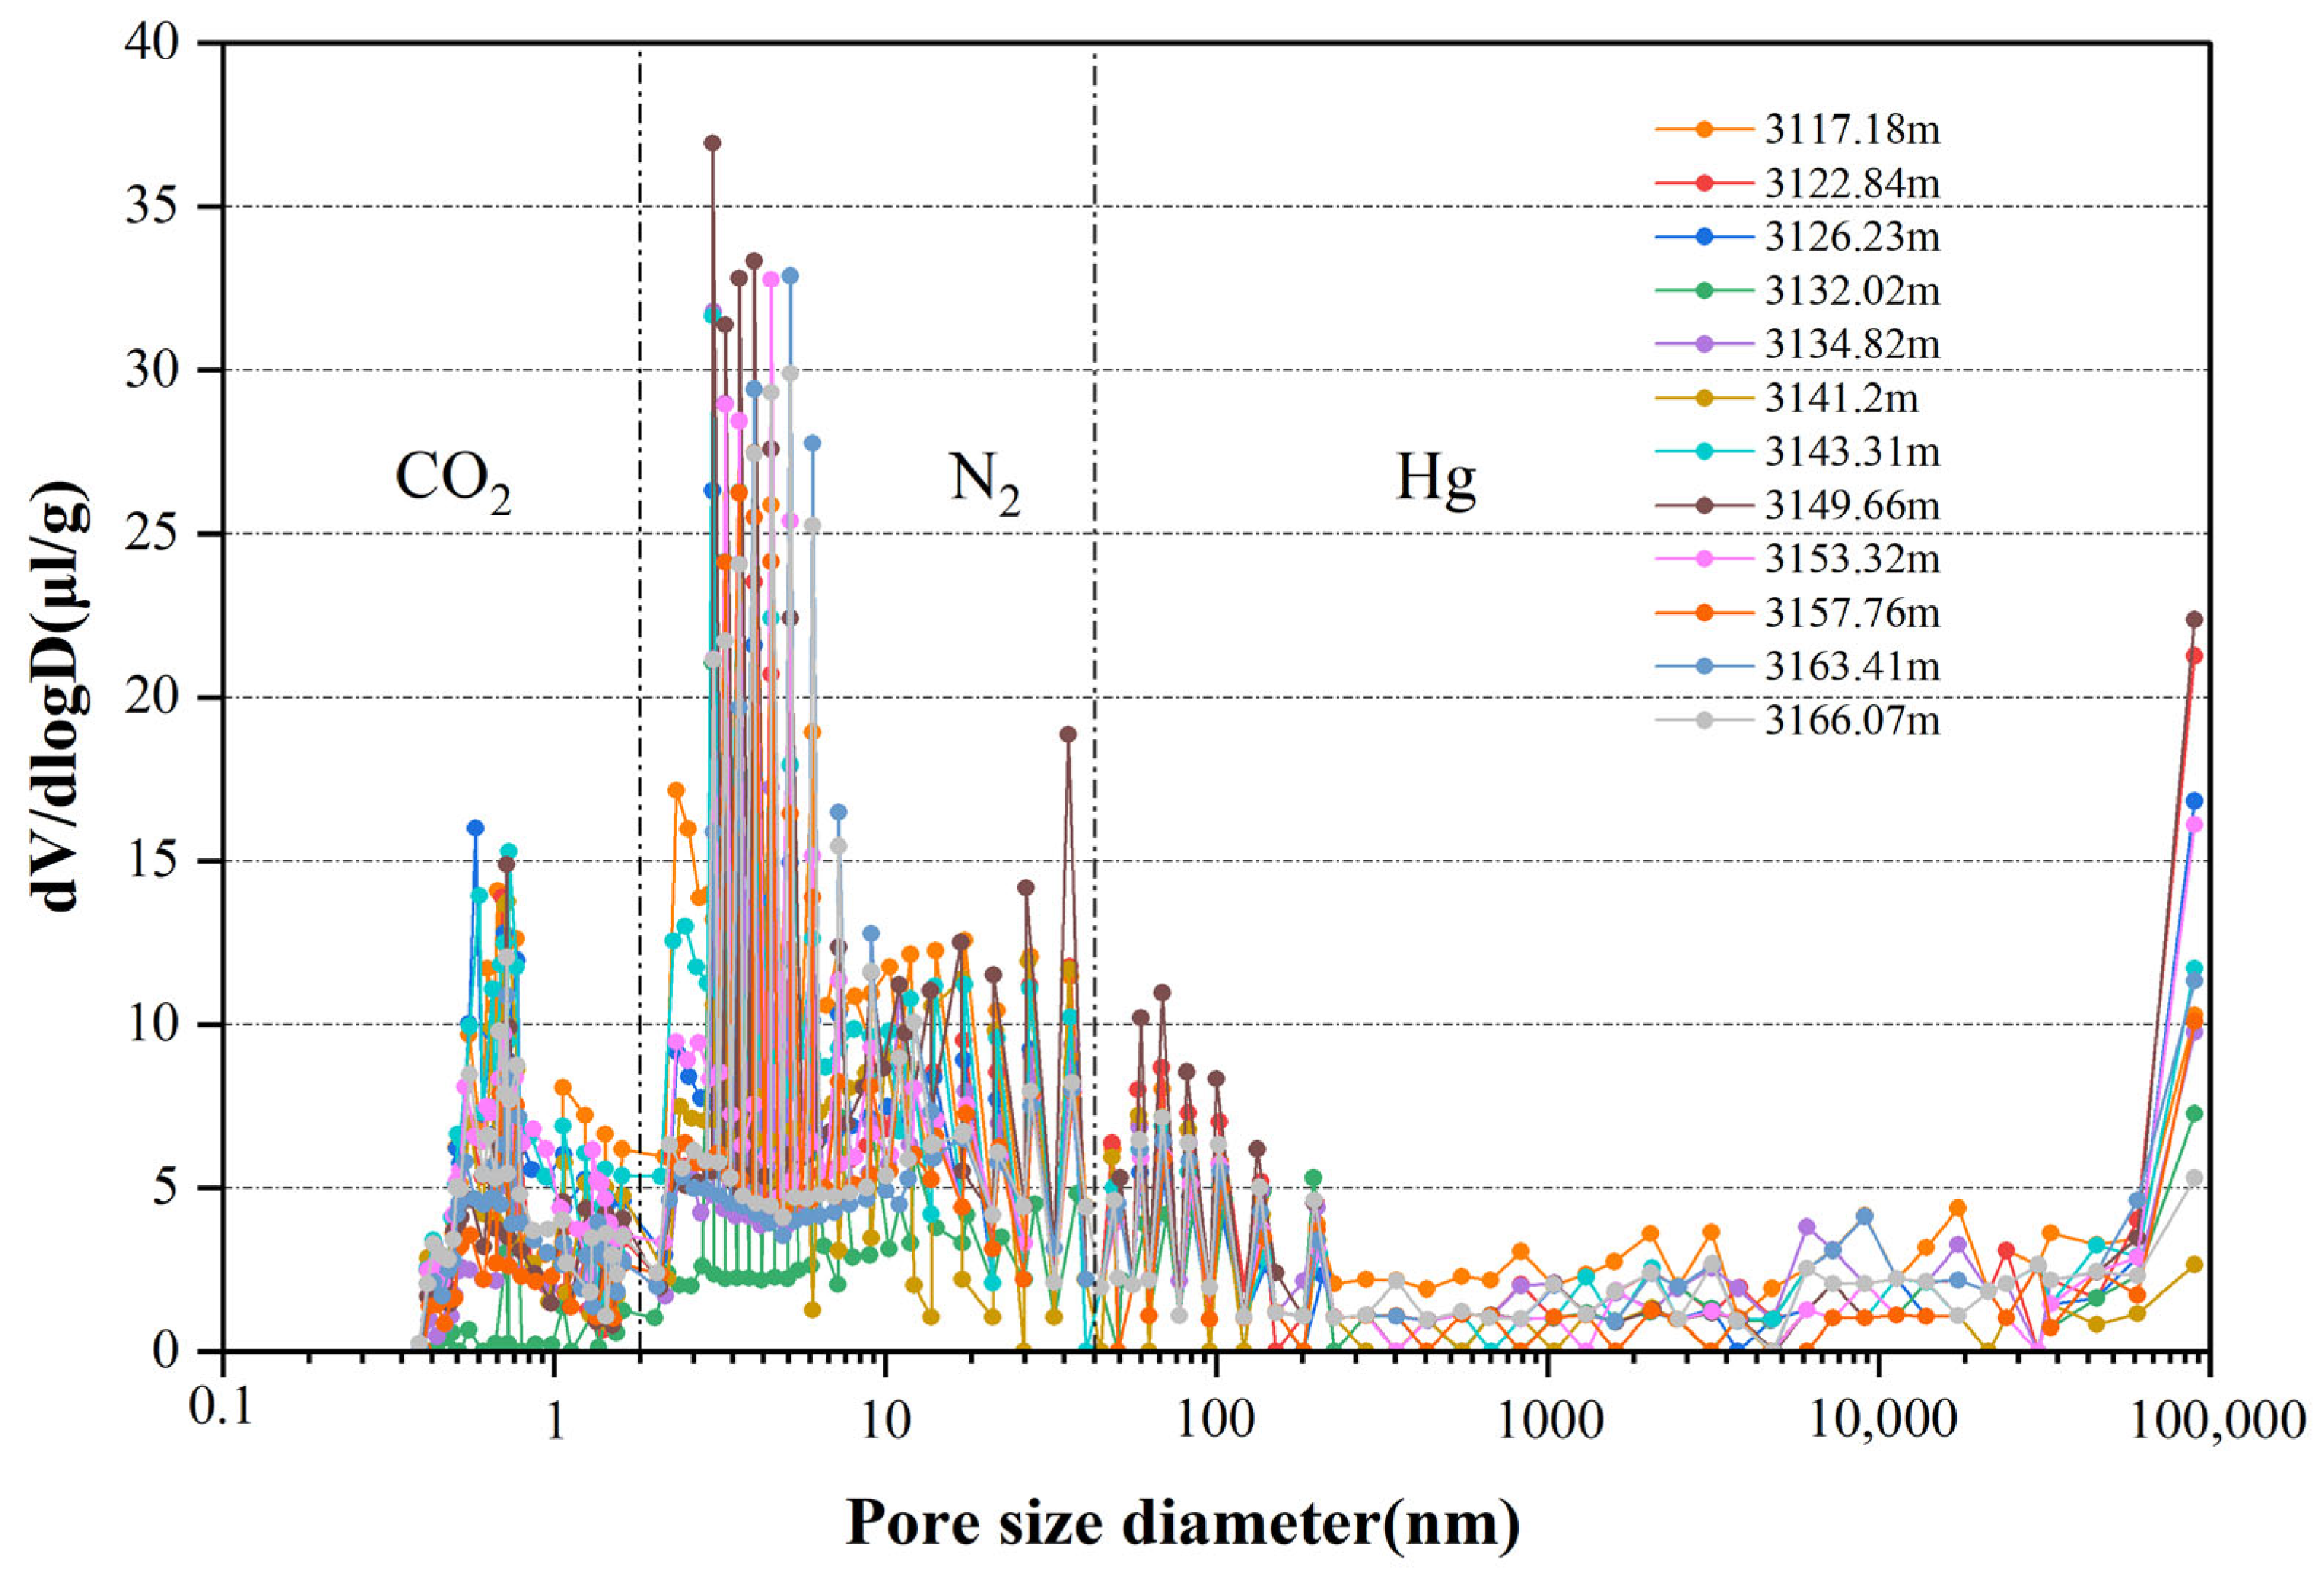
Shale gas reservoirs exhibit a broad pore size distribution, ranging from nanometers to micrometers, which cannot be fully characterized using any single experimental method. Therefore, a combination of techniques is required to accurately describe the pore structure. High-pressure mercury intrusion is limited to large pores (>50 nm), low-pressure nitrogen adsorption is reliable for mesopores (2–50 nm), and carbon dioxide adsorption is more precise for micropores (<2 nm). Integration of these three methods allows a comprehensive analysis of pore size distribution.
In this study, the three experimental methods were combined using a dV/dlogD plot. As shown in Figure 16, the pore sizes are primarily mesopores and a portion of micropores. Some peaks larger than 10 μm were observed in the sample, for the following reasons: (1) When the pressure reached 60,000 psi, the pore structure was damaged; (2) During sample preparation, microcracks formed on the sample surface; (3) During mercury porosimetry, interconnected micropores and mesopores were counted as macropores.

5.2. Differences in Pore Structure of Various Lithofacies

As shown in Figure 17, organic-rich clay shale mainly contains inorganic fractures from clay-mineral contraction and a small amount of organic mesopores, which provide the highest adsorption (14.77% of surface area, −50% of pore volume) and some macropores. Organic clay shale shows similar fracture origins, with mesopores dominating (21.84% surface area, 60.1% pore volume), exceeding the former. Organic-rich mixed shale combines inorganic contraction pores and organic internal pores, still mesopore-dominated (20.6% surface area, 57.9% pore volume). Organic mixed shale’s pores are chiefly mineral fractures and intergranular spaces, with limited organic pores; mesopores account for 24.58% of surface area and 81% of pore volume. Organic-rich siliceous shale contains few organic pores, and is characterized by mineral-associated inorganic fractures; mesopores contribute 18.64% of the total specific surface area and 62.11% of the total pore volume. Organic-rich clay shale has a mean mesopore volume of 0.023 ± 0.004 mL/g (mean ± SD), significantly higher than that of organic mixed shale (0.011 ± 0.003 mL/g) and organic-rich siliceous shale (0.009 ± 0.002 mL/g).

5.3. Influence Factors of Shale Pore Structure

5.3.1. The Relationship Between Specific Surface Area, Pore Volume, and Average Pore Size

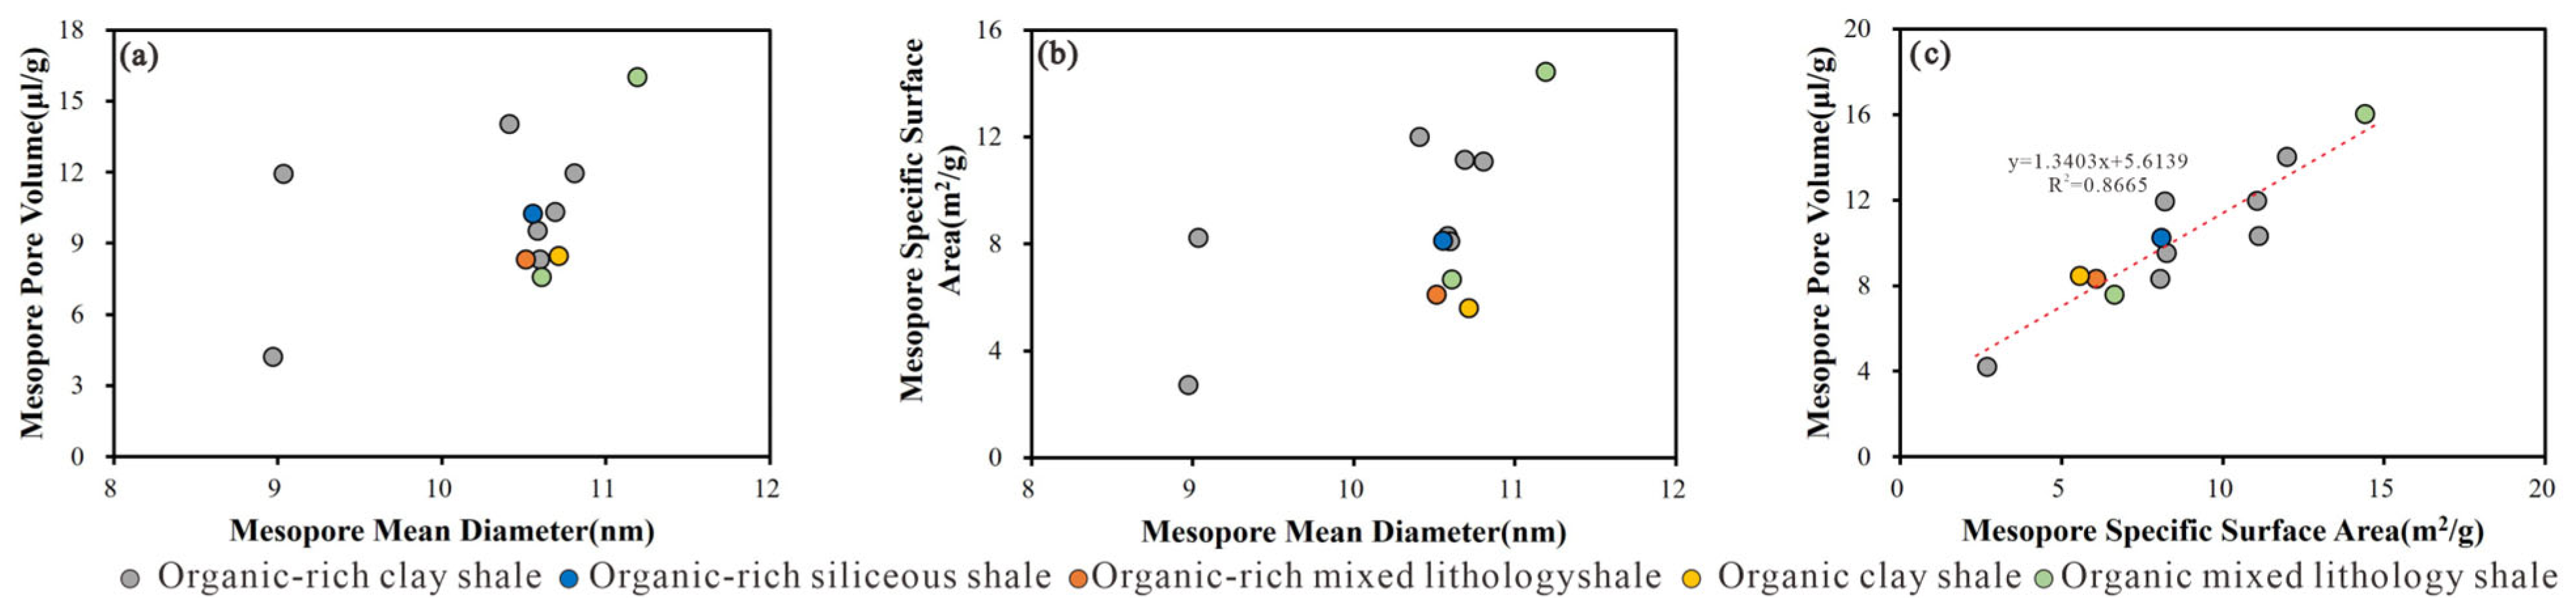
For the EKS shales, mesopores constitute the dominant pore type in terms of volumetric contribution, whereas micropores provide the primary contribution to specific surface area. This pore size partitioning reflects the fundamental control of pore geometry on gas storage mechanisms: micropores govern adsorption capacity, while mesopores control storage space and transport pathways. The strong positive correlation between mesopore specific surface area and mesopore pore volume (R2 = 0.8634, Figure 18) provides insight into the pore evolution mechanism. This relationship indicates that in continental shales, mesopore development is governed by a coupled growth process: as mesopore volume increases, pore diameters expand, consequently exposing additional surface area. This coupling suggests that pore formation is controlled by a common genetic mechanism—likely organic matter hydrocarbon generation and associated overpressure development—rather than by independent processes. The linear relationship further implies that pore geometry remains relatively consistent across different samples, with pore aspect ratios being preserved during maturation.

5.3.2. Effect of TOC

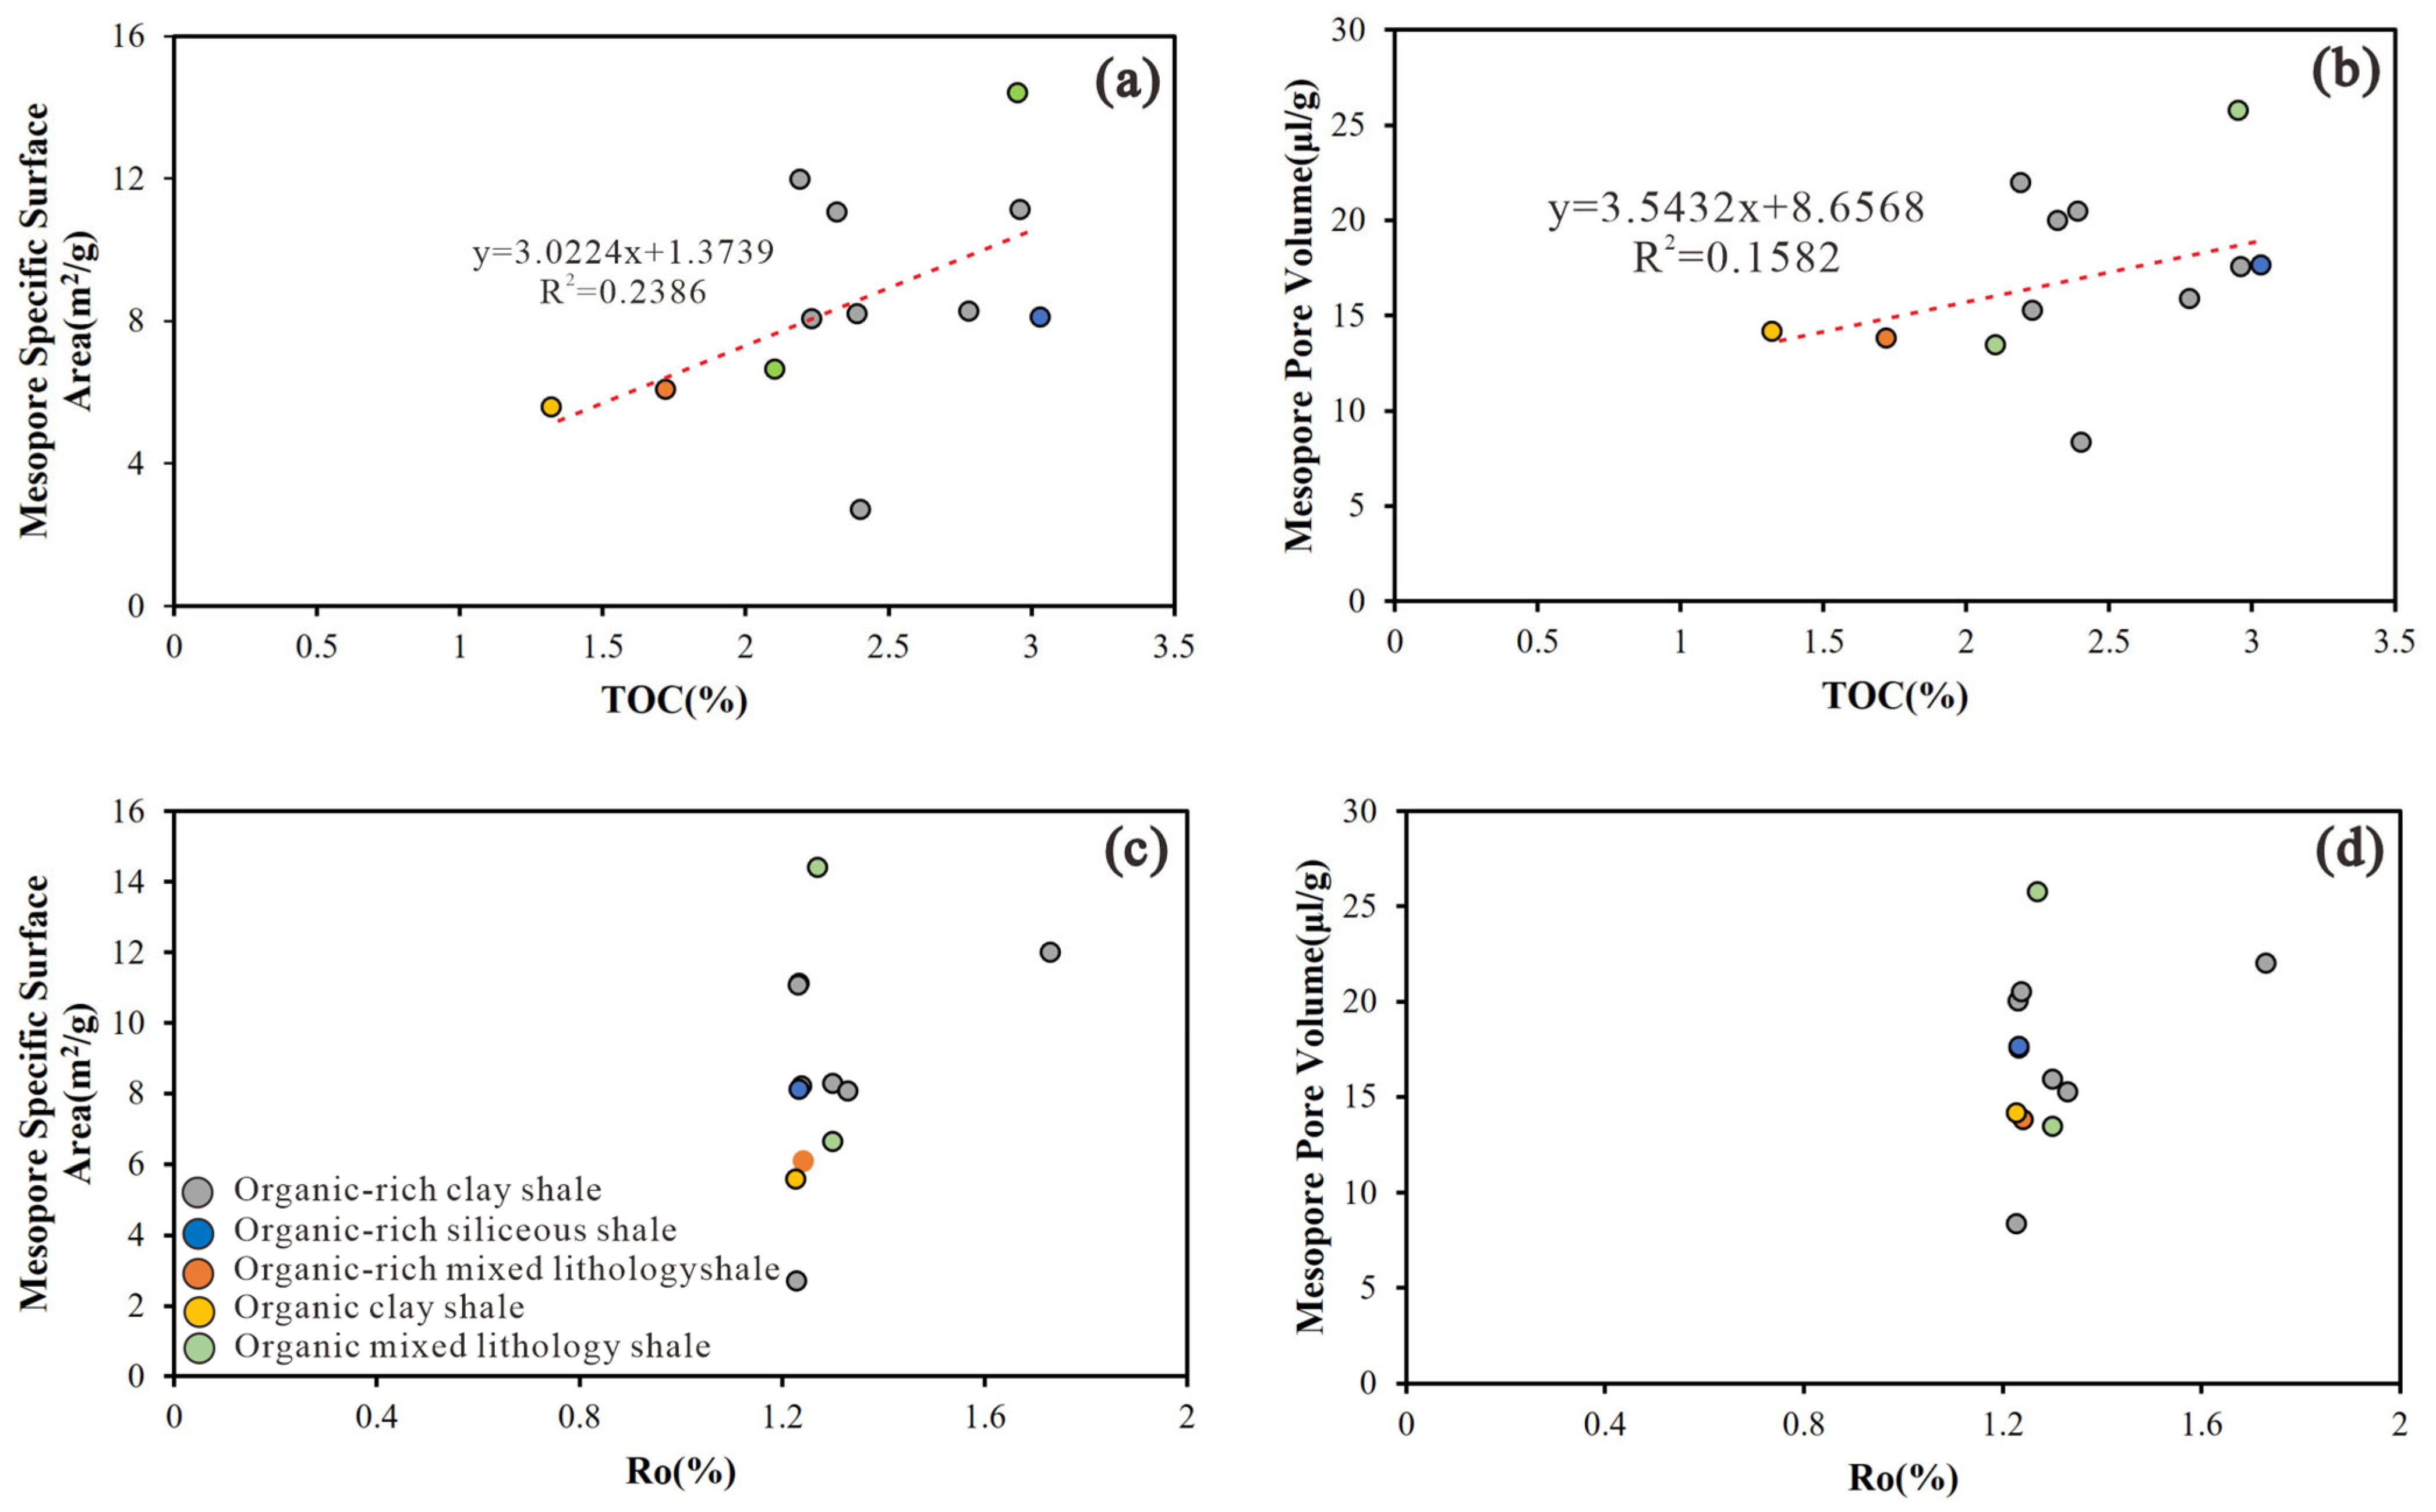
Total organic carbon (TOC) is widely recognized as a primary control on nanopore development in shale gas reservoirs, as organic matter-hosted pores constitute a major component of total porosity [79,80]. However, in the EKS shales, only a weak positive correlation exists between mesopore volume and TOC content (Figure 19a,b), suggesting that the relationship between organic matter abundance and pore development is more complex than a simple linear control.
This weak correlation can be attributed to several interacting factors that reflect the dynamic evolution of organic matter pores during diagenesis and maturation: (1) Analytical artifacts: acid treatment during TOC analysis may partially dissolve organic matter or carbonate-associated organic complexes, potentially underestimating the original organic content that contributed to pore formation; (2) Organic matter type variability: different kerogen types (Types I, II, vs. III) possess distinct hydrocarbon generation potentials and produce different pore morphologies upon maturation. Type I kerogen, common in lacustrine settings, tends to develop larger but fewer pores compared to the microporous networks characteristic of Type III kerogen; (3) Thermal maturity effects: samples at different maturity stages (as indicated by Ro values) exhibit fundamentally different pore development stages. Pore generation is not a linear function of TOC but follows a maturation-dependent trajectory: initial pore generation during the oil window, potential pore occlusion by bitumen, and subsequent pore enlargement during the gas window. (4) Mineral-associated porosity: The presence of pyrite framboids, which host intergranular pores ranging from 5 to 200 nm, introduces porosity that is independent of organic matter content. These inorganic pores can significantly contribute to mesopore volume, thereby diluting the TOC–pore volume correlation; (5) Clay mineral interactions: Clay minerals, particularly in organic-rich intervals, may compete with organic matter for pore space or, alternatively, protect organic matter from compaction. The relative abundance of clay versus organic matter controls whether pores are hosted primarily within the organic phase or at organic–mineral interfaces. (6) Mechanical compaction effects: Higher TOC content reduces the compressive strength of the rock matrix, potentially leading to greater compaction and pore collapse during burial, particularly in intervals that have experienced significant overburden pressure. This mechanical weakening may counteract the pore-generating effects of organic matter maturation.
The weak TOC–pore volume correlation thus reflects the competing processes of organic pore generation (positive contribution) versus compactional pore destruction (negative contribution), with the net result depending on the specific burial history and mechanical properties of each lithofacies.

5.3.3. Effect of Ro

Previous studies have reached divergent conclusions regarding the influence of thermal maturity on shale pore systems [81,82,83] reflecting the complex, non-linear evolution of porosity during progressive maturation. Accordingly, the evaluation of shale adsorption capacity based on maturity should consider multiple factors comprehensively, including organic matter abundance, type, and pore development. Our data reveal that the relationship between Ro and pore development is lithofacies-dependent, indicating that bulk rock composition modulates the porosity response to thermal stress.
For organic-rich clay shales, the positive correlation between mesopore specific surface area and Ro, coupled with a weak positive correlation between mesopore volume and Ro (Figure 19c,d), indicates that increasing thermal maturity within the high-maturity stage promotes pore system development. The underlying mechanism involves the progressive conversion of solid organic matter to hydrocarbons, which generates intraparticle organic pores. As maturation proceeds, organic matter becomes increasingly aromatized and rigid, enabling the preservation of porosity that would otherwise collapse under compaction. The stronger correlation with surface area compared to volume suggests that maturation preferentially generates smaller pores, which contribute disproportionately to surface area, before these pores expand or coalesce at higher maturity levels.
For organic mixed shales, the negative correlation between both pore volume and specific surface area with Ro indicates that thermal maturation in this lithofacies inhibits pore development. This divergent behavior can be explained by the differing organic–inorganic interactions in mixed lithofacies. In these samples, the lower organic content means that organic-hosted pores are less significant, and the pore system is dominated by mineral-associated pores (intergranular pores between clay platelets, dissolution pores in feldspars). Thermal maturation in mixed shales may promote clay mineral transformation (smectite to illite), which releases interlayer water and can lead to pore collapse or cement precipitation. Additionally, hydrocarbons generated from the limited organic matter may be retained as bitumen, occluding existing pore space rather than generating new pores.
These lithofacies-dependent maturity trends demonstrate that thermal maturity cannot be considered in isolation; its effect on pore systems is mediated by the availability of organic matter to host pores and the stability of mineral frameworks during burial.

5.3.4. Effect of Minerals

However, the relationship between clay content and porosity is not universally positive but depends on the diagenetic stage and lithofacies type.
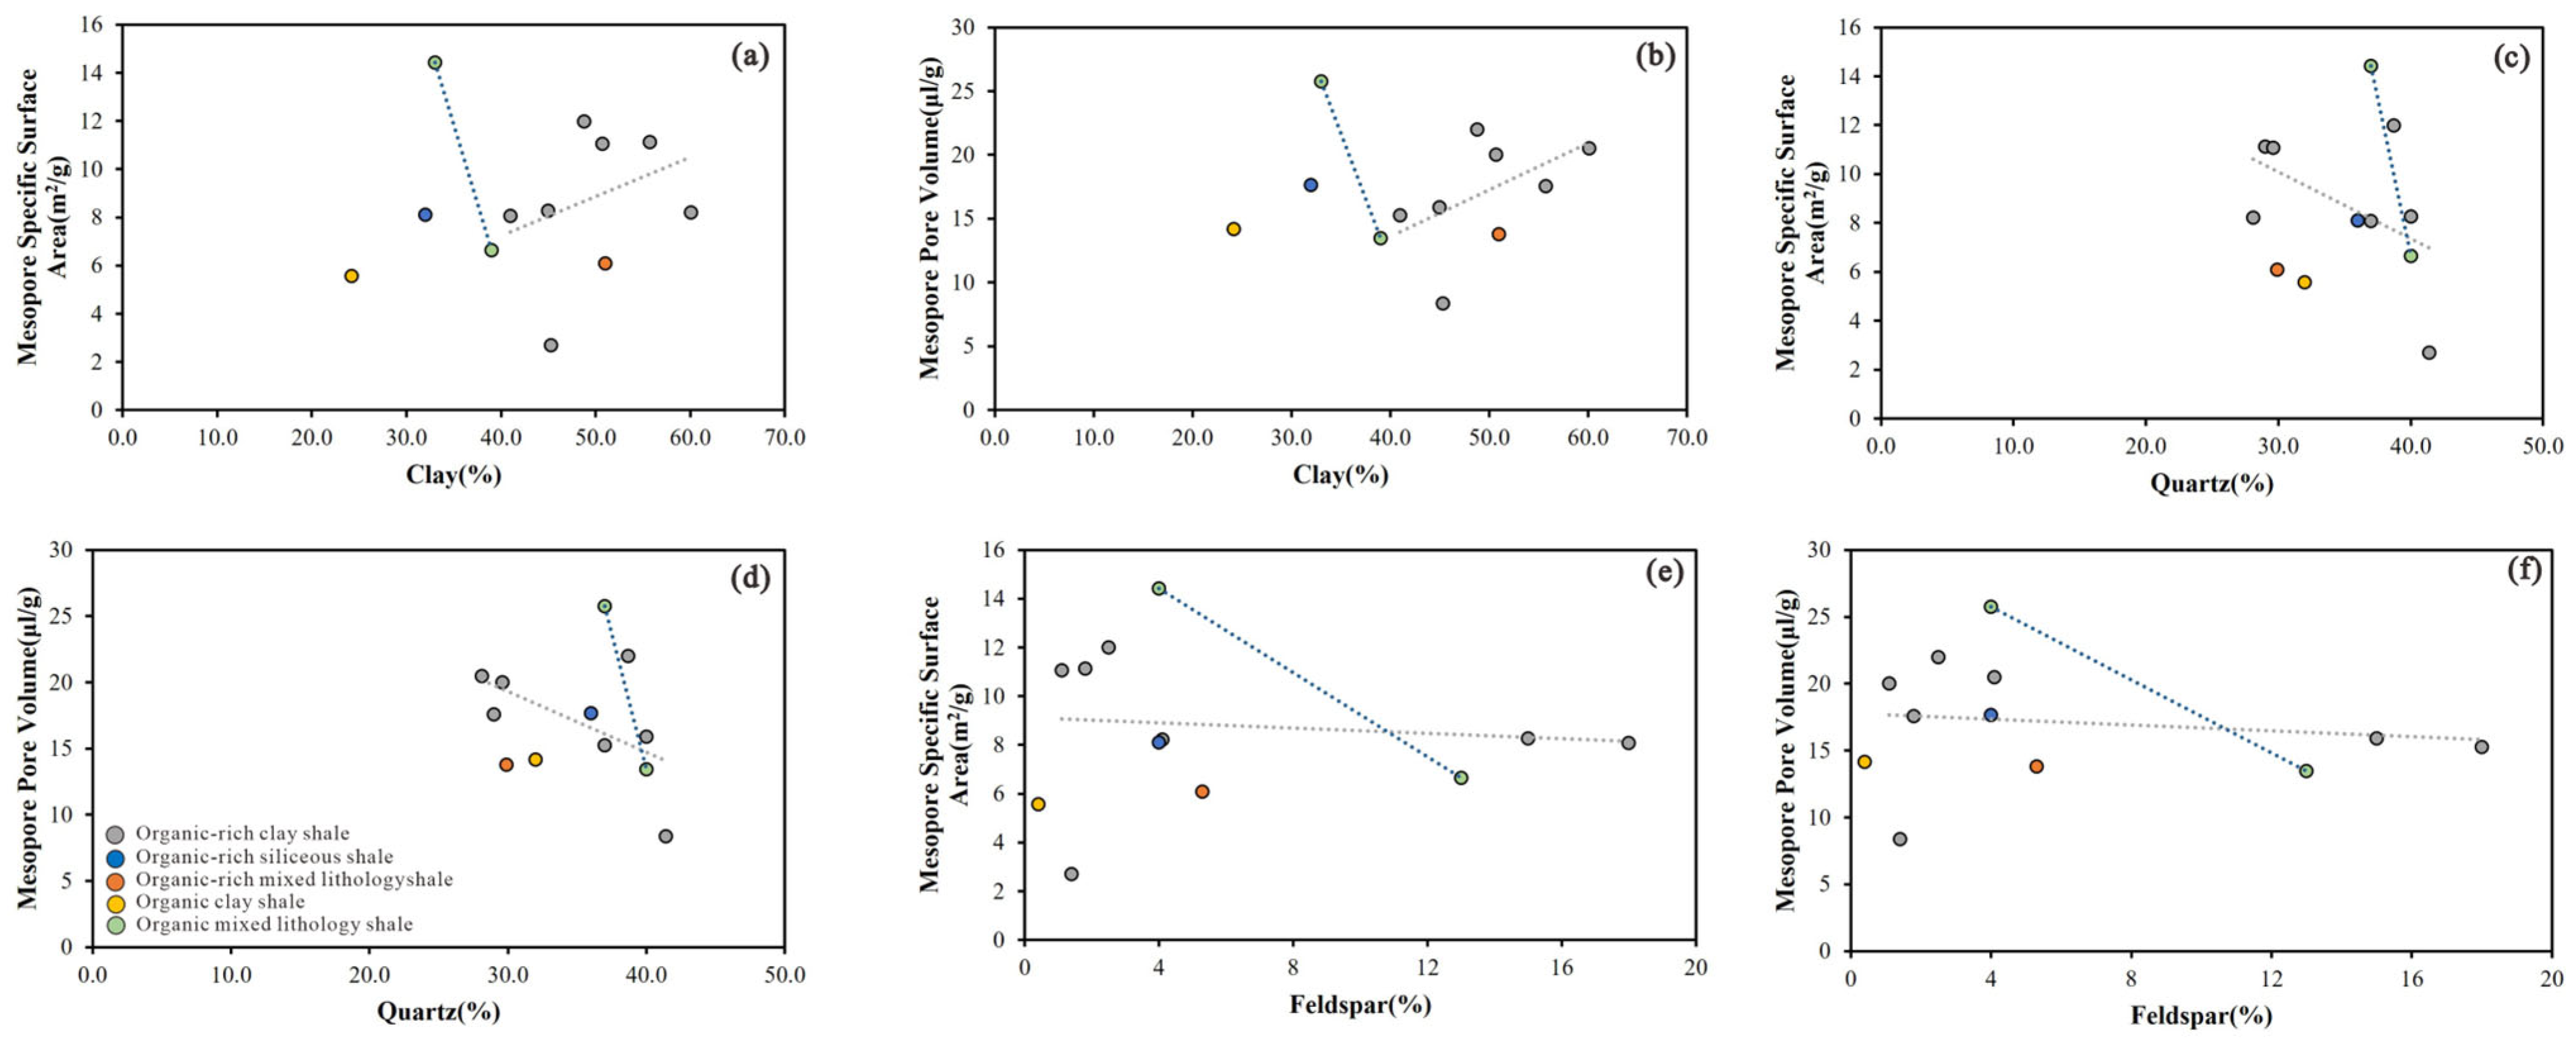
Clay minerals exert a dual control on shale pore systems, acting as both pore hosts and pore modifiers. Clay minerals, particularly illite–smectite mixed layers and illite, possess high microporosity and specific surface area due to their platy, layered, and fibrous crystal habits, which create abundant intergranular pores between crystal aggregates [28]. As shown in Figure 20, for organic-rich clay shales, the positive correlation among pore volume, specific surface area, and clay mineral content (Figure 19a,b) reflects a synergistic relationship during diagenesis. As burial depth increases, compaction drives clay mineral dehydration and transformation (smectite → illite–smectite → illite). This transformation process generates new intergranular pores as clay platelets reorganize and expel interlayer water. The rigid organic matter network within these clay-rich intervals may also provide structural support, preventing pore collapse and preserving the porosity generated during clay mineral diagenesis. These plate-like, layered, and fibrous clay minerals provide a large number of intergranular pores between clay mineral crystals, which are the primary pore types in shale [84,85]. In contrast, for organic mixed shale, pore volume, specific surface area, and clay mineral content exhibit a negative correlation. In these lithofacies, increasing clay content leads to progressive infilling of primary intergranular pores by authigenic clay minerals. Without abundant organic matter to maintain pore structure, mechanical compaction and clay mineral authigenesis occlude pore space. This dichotomy highlights the critical role of organic matter in preserving clay-associated porosity: organic matter provides a load-bearing framework that resists compaction, allowing clay-hosted pores to survive burial.
Quartz and feldspar, are the dominant brittle minerals in shale reservoirs, which primarily develop primary intergranular pores and secondary dissolution pores. As the content of quartz and feldspar increases, the overall pore volume and specific surface area of all samples decrease (Figure 20c–f). Brittle minerals (quartz, feldspar) form a rigid framework that, under high effective stress, is prone to brittle deformation and microfracturing. However, unlike ductile clay minerals that deform plastically and maintain pore connectivity, brittle minerals tend to fail catastrophically, generating fractures that may subsequently be sealed by cementation or compaction. The overall negative correlation suggests that in this study area, brittle minerals have undergone significant stress-induced pore destruction rather than fracture-enhanced porosity. Quartz and feldspar dissolution can generate secondary porosity, but this process requires specific geochemical conditions (under-saturated pore fluids, organic acid generation during maturation). The negative correlation implies that in these samples, the rate of dissolution-related pore generation is outpaced by the rate of compactional pore destruction and/or cement precipitation. Alternatively, the quartz and feldspar may be predominantly detrital and non-porous, simply diluting the clay- and organic-hosted porosity.
The contrasting roles of clay minerals (pore-forming in organic-rich lithofacies, pore-occluding in mixed lithofacies) and brittle minerals (porosity-diluting) underscore the need for lithofacies-specific reservoir evaluation. Bulk mineralogy alone is insufficient; the textural relationship between minerals and organic matter—whether minerals support or occlude pore space—determines the net porosity evolution.

5.4. Comparison of Marine and Terrestrial Shales

Marine and terrestrial shales exhibit significant differences in organic matter abundance, type, maturity, mineral brittleness, and clay mineral content, leading to different developmental characteristics in their reservoir properties (Table 1). Therefore, it is inappropriate to rely solely on a single characterization method when evaluating the reservoir potential of marine and terrestrial shales. Instead, a reasonable approach must be adopted based on the sample characteristics of the study area to qualitatively and quantitatively characterize the pore development types of shales, and to analyze the influence of pore volume, specific surface area, and clarify the reservoir conditions for shale gas accumulation.
In recent years, an increasing number of scholars have employed multi-technique integrated approaches to characterize shale pore systems [33,86,87]. This study primarily utilized experimental data from high-pressure mercury injection, nitrogen adsorption, and carbon dioxide adsorption to reconstruct the full pore size distribution. Based on mineral content, different lithofacies were classified, and the pore structure characteristics of these lithofacies were analyzed using the aforementioned experimental data and microscopic photographs. The EKS Shale exhibits relatively high organic matter content, with unevenly developed organic pores, primarily characterized by plate-like and slit-type pores.
In terms of inorganic mineral composition, previous studies have found that the quartz content of terrestrial shale is negatively correlated or not significantly correlated with pore volume and specific surface area. The quartz content in marine shale is significantly positively correlated with pore volume and specific surface area [88,89]. In this study, the pore volume and specific surface area of the Shahezi Formation terrestrial shale were mainly correlated with the clay mineral content, and negatively correlated with the quartz and feldspar content.
In terms of organic matter abundance, the development of organic pores is fundamentally controlled by total organic carbon (TOC) content. However, when TOC is less than 5.6%, porosity is positively correlated with organic matter content. When TOC exceeds 5.6%, porosity shows a slow increase or even a decrease, which may be related to the weakened resistance of shale to mechanical compaction at higher organic matter contents [90]. The Longmaxi Formation has high organic matter content and well-developed organic pores, with a good correlation between TOC and porosity. In contrast, the Shahezi Formation has lower organic matter content and unevenly developed organic pores, with a positive correlation between TOC and pore structure (Figure 18). Li Bin et al. found, through organic geochemical analysis and reservoir space type analysis, that the Longmaxi Formation marine shale has high organic matter abundance and well-developed organic matter pores, with a clear positive correlation between them [91]. Within the range of TOC content of 2%–5%, the methane adsorption capacity of terrestrial shale is generally low. However, due to the abundance of brittle minerals and more developed organic pores in marine shale, the pore surface area is larger, resulting in a stronger methane adsorption capacity of marine shale [92,93].
From the perspective of organic matter maturity, the most significant difference in porosity between the Longmaxi Formation and the Shahezi Formation shales lies in the development of organic pores. The development of organic pores is influenced by various factors. Generally, it is believed that the development of organic pores is closely related to organic matter maturity. Research by Fishman indicates that when Ro is 0.7%, the development of organic pores is minimal, while when Ro reaches 1.2%, organic pores develop extensively. At lower maturity levels, organic matter is in the oil generation window or gas condensation production stage, primarily producing liquid hydrocarbons, and has not reached the gas generation stage, making it difficult to form a significant number of organic pores. At over-mature stages, organic matter undergoes accelerated graphitization, which compromises the structural support for organic pores and leads to the collapse and compaction of organic pores [94]. The organic matter maturity of the Longmaxi Formation shale generally exceeds 2.0%, indicating a high-to-overmature stage with extensive development of organic matter pores. In contrast, the maturity of the Shahezi Formation shale ranges from 1.2% to 1.73%, indicating a high-maturity stage where organic matter pores are just beginning to develop extensively. Therefore, the development of organic pores is uneven, and their connectivity also varies significantly in Shahezi Formation.
In terms of organic matter type, the development of organic pores between adjacent organic matter particles also varies, despite these particles undergoing similar thermal evolutionary processes [95]. This suggests that organic matter type or microcomposition influences the development of organic pores, with sapropel group being more prone to organic pore development than inertinite group. Additionally, Type I kerogen has a hydrogen-rich, oxygen-poor aliphatic structure. The hydrogen-rich lipid components first form liquid hydrocarbons during the oil generation period and then crack into gaseous hydrocarbons during the high-maturity stage. During massive hydrocarbon generation and expulsion period, a significant amount of asphalt or hydrocarbons is also released, which is conducive to the development of pores in kerogen and asphalt. In contrast, Type III kerogen has a hydrogen-poor, oxygen-rich structure with polyaromatic nuclei and oxygen-containing groups, primarily producing gas, with limited solid asphalt generated during oil generation period. After hydrocarbon expulsion, the remaining organic pores are highly limited. Additionally, Type I and II organic matter contain a higher proportion of convertible organic carbon compared to Type III organic matter, further contributing to the easier development of organic pores in Type I and II organic matter [58]. For marine-type Longmaxi Formation shale, Type I is predominant; for marine-terrestrial transitional-type Taiyuan Formation shale, Types II and III are predominant; and for terrestrial-type Shahezi Formation shale, Types I and II are predominant. The differences in organic matter types are another factor contributing to the disparity in organic pore development between the marine and terrestrial shales. The pore volume of marine shale such as Longmaxi Formation reaches 0.03 mL/g, but the pore volume of terrestrial shale such as Yanchang Formation is only 0.01. The average pore surface area of marine shale reaches 26.99 m2/g, while that of terrestrial shale is only 11.5 m2/g. The TOC of marine shale ranges from 0.45% to 10.47%, with an average stable above 2%. There are also significant changes in the same layer in different regions, and the trend of change is closely related to regional tectonic zones. The TOC distribution of terrestrial shale ranges from 0.33% to 22.0%, with the main body concentrated in 1.0% to 3.0%, and high values are mostly found in sedimentary centers [96,97].
Table 1. Basic geological overview of main shale gas producing areas in China.
TypeRegionFormationArea (104 km2)ThicknessTOC (%)Kerogen TypeRo (%)Brittle Minerals (%)Clay Minerals (%)LithofaciesCite
MarineSichuan BasinWufeng-Longmaxi38.923–8470.41–
25.73/2.57
I, II1.6–3.621–4410–65Clayed, Siliceous, Mixed[71,80]
Tarim BasinSaerga10.10–1600.61–
4.65/2.86
I, III1.2–4.654–8614–45Calcareous, Siliceous[98]
TerrestrialSongliao BasinShahezi8.5100–1500.2–5.67/1.3I, II 0.99–1.9632–6024–60Clayed, Siliceous, MixedThis article
Bohai Bay BasinShahejie2.3400–12000.8–33/2.5II, III0.3–1.823–5827–58Calcareous, Siliceous, Mixed[99]
Ordos BasinYanchang4.550–1001.8–22/2.5I, II0.9–1.1618–4230–50Clayed, Siliceous, Mixed[89,100]
Sichuan BasinZiliujing15.240–1800.4–1.6/1.2I, II1.0–1.8726–4617–50Clayed, Siliceous, Mixed, Calcareous[85]
Marine–Terrestrial transitionalSichuan BasinLongtan30–5020–2000.36–64.6/13.7II, III1.51–3.55–29.955.3–88.2Clayed, Siliceous, Mixed, Calcareous[33]
Ordos BasinTaiyuan1220–603.3–23.8/1.9II, III0.5–2.621–4828–56Clayed, Siliceous, Mixed, Calcareous[20,100]
Note: brittle minerals refer to quartz and feldspar, and the area value is the distribution area of shale.

6. Conclusions

In this study, we systematically characterized the pore structure of terrestrial facies shale from the second Member of the Shahezi Formation in the Lishu Fault Sag, Songliao Basin, using an integrated approach involving high-pressure mercury intrusion, low-pressure N2 and CO2 gas adsorption, nuclear magnetic resonance (NMR) relaxometry, and comprehensive mineralogical analysis. By integrating these analytical methods, this work moves beyond a systematic characterization to provide new insights into the heterogeneity of pore networks and their controlling mechanisms in lacustrine shales. The main conclusions are summarized as follows:
(1) The EKS shale in the Lishu Fault Sag of the Songliao Basin exhibits five lithofacies types: organic-rich clay shale, organic-rich mixed shale, organic-rich siliceous shale, organic clayey shale, and organic mixed shale. Among the five identified lithofacies, the organic-rich clayey shale is identified as the most favorable lithofacies for gas storage and transport, which exhibits abundant organic matter pores, clay interlayer pores, and intragranular dissolution pores, which together form a well-connected pore system.
(2) The EKS shale in the Lishu Fault Sag of the Songliao Basin mainly develops pores with a diameter of less than 200 nm. Clay minerals and TOC are important controlling factors for the pore development of various shale facies in the Shahezi Formation of the Lishu fault depression. Critically, while clay minerals are often considered detrimental in conventional reservoirs, in the terrestrial shales they show a positive correlation with both pore volume and specific surface area, enhancing rather than inhibiting porosity.
(3) The main controlling factors for pore development in marine shale and terrestrial shale were compared. This study provides a critical update to the conventional understanding of shale gas reservoirs by revealing that the pore development mechanisms in terrestrial shales differ fundamentally from those in marine shales. The pores in marine shale mainly come from high abundance, high quality, and high maturity control, as well as brittle minerals (quartz) providing structural support for the pores. The pore development of terrestrial shale mainly relies on the pores provided by clay minerals (especially illite), and brittle minerals (quartz) often block the pores during diagenesis, resulting in negative effects.

Author Contributions

Idea conception, Y.B., J.Z., J.B. and T.L.; map compilation, J.W. and W.W.; data curation, formal analysis, and investigation, T.L., D.K., J.B. and Y.B.; writing—original draft, J.B. All authors have read and agreed to the published version of the manuscript.

Funding

This research was funded by National Science and Technology Major Project (2024ZD1404901,2025ZD1400702-03), Natural Science Foundation of China (NSFC) (U2244207, 42302177), and the China Geological Survey Foundation (DD20240200903).

Data Availability Statement

The original contributions presented in this study are included in the article. Further inquiries can be directed to the corresponding author(s).

Acknowledgments

We are grateful to Xingyou Xu, Di Chen for the assistance with the figures. We also deeply thank the anonymous reviewers and editors for their helpful comments and suggestions.

Conflicts of Interest

Yunfeng Bai, Jinyou Zhang, Yifeng Lin, Dejiang Kang, Jinwei Wang, and Wei Wu are employees by the Exploration and Development Research Institute of Daqing Oilfield Co., Ltd., Daqing 163712, China. The remaining authors declare that the research was conducted in the absence of any commercial or financial relationships that could be construed as a potential conflict of interest.

References

  1. Perry, K.; Lee, J. Unconventional Gas Reservoirs-Tight Gas, Coal Seams, and Shale. In Working Document of the NPC Global Oil and Gas Study; The University of Texas: Austin, TX, USA, 2007. [Google Scholar]
  2. Bai, B.; Elgmati, M.; Zhang, H.; Wei, W. Rock characterization of Fayetteville shale gas plays. Fuel 2013, 105, 645–652. [Google Scholar] [CrossRef]
  3. Zou, C.; Dong, D.; Wang, S.; Li, J.; Li, X.; Wang, Y. Geological characteristics, formation mechanism and resource potential of shale gas in China. Pet. Explor. Dev. 2010, 37, 641–652. [Google Scholar] [CrossRef]
  4. Lewis, J.V. Fissility of shale and its relations to petroleum. GSA Bull. 1924, 35, 557–590. [Google Scholar] [CrossRef]
  5. Guo, X.; Wang, R.; Shen, B.; Wang, G.; Wan, C.; Wang, Q. Geological Characteristics, Resource Potential, and Development Direction of Shale Gas in China. Pet. Explor. Dev. 2025, 52, 17–32. [Google Scholar] [CrossRef]
  6. Dong, D.; Wang, Y.; Huang, X.; Zhang, C.; Guan, Q.; Huang, J. Discussion about geological characteristics, resource evaluation methods and its key parameters of shale gas in China. Nat. Gas Geosci. 2016, 27, 1583–1601. [Google Scholar]
  7. Ma, Y.; Cai, X.; Zhao, P. China’s Shale Gas Exploration and Development: Understanding and Practice. Pet. Explor. Dev. 2018, 45, 589–603. [Google Scholar] [CrossRef]
  8. Zhao, W.; Zhu, R.; Zhang, J.; Yang, J. Classification, exploration and development status and development trend of continental shale oil in China. China Pet. Explor. 2023, 28, 1–13. [Google Scholar]
  9. Bustin, R.M.; Bustin, A.M.M.; Cui, X.; Ross, D.J.K.; Murthy Pathi, V.S. Impact of shale properties on pore structure and storage characteristics. In Proceedings of the Society of Petroleum Engineers Shale Gas Production Conference, Fort Worth, TX, USA, 16–18 November 2008; p. SPE 119892. [Google Scholar]
  10. Clarkson, C.R.; Wood, J.M.; Burgis, S.E.; Aquino, S.D.; Freeman, M. Nanopore structure analysis and permeability predictions for a tight gas siltstone reservoir by use of low pressure adsorption and mercury intrusion techniques. SPE Reserv. Eval. Eng. 2012, 15, 648–661. [Google Scholar] [CrossRef]
  11. Wang, G.; Ju, Y.; Yan, Z.; Li, Q. Pore structure characteristics of coal-bearing shale using fluidinvasion methods: A case study in the Huainan-Huaibei Coalfield in China. Mar. Pet. Geol. 2015, 62, 1–13. [Google Scholar] [CrossRef]
  12. Cao, Z.; Zhang, S.; Xue, Y.; Wang, Z.; Du, F.; Li, Z.; Huang, C.; Wang, S.; Yu, Y.; Wang, W.; et al. Disaster-Causing Mechanism of Spalling Rock Burst Based on Folding Catastrophe Model in Coal Mine. Rock Mech. Rock Eng. 2025, 58, 7591–7604. [Google Scholar] [CrossRef]
  13. Lin, H.; Zhang, W.; Guo, S.; Zhang, X.; Wang, L.; Zhang, J. Study on the Energy Evolution Mechanism and Fractal Characteristics of Coal Failure under Dynamic Loading. ACS Omega 2025, 10, 54710–54719. [Google Scholar] [CrossRef]
  14. Bernard, S.; Horsfield, B.; Schulz, H.M.; Wirth, R.; Schreiber, A.; Sherwood, N. Geochemical evolution of organic-rich shales with increasing maturity: A STXM and TEM study of the Posidonia Shale (Lower Toarcian, northern Germany). Mar. Pet. Geol. 2012, 31, 70–89. [Google Scholar] [CrossRef]
  15. Chalmers, G.R.L.; Bustin, R.M.; Power, I.M. Characterization of gas shale pore systems by porosimetry, pycnometry, surface area, and field emission scanning electron microscopy/transmission electron microscopy image analyses: Examples from the Barnett, Woodford, Haynesville, Marcellus, and Doig units. AAPG Bull. 2012, 96, 1099–1119. [Google Scholar] [CrossRef]
  16. Chalmers, G.R.L.; Ross, D.J.K.; Bustin, R.M. Geological controls on matrix permeability of Devonian Gas Shales in the Horn River and Liard basins, northeastern British Columbia. Canada. Int. J. Coal Geol. 2012, 103, 120–131. [Google Scholar] [CrossRef]
  17. Loucks, R.G.; Reed, R.M.; Ruppel, S.C.; Hammes, U. Spectrum of pore types and networks in mudrocks and a descriptive classification for matrix-related mudrock pores. AAPG Bull. 2012, 96, 1071–1098. [Google Scholar] [CrossRef]
  18. Loucks, R.G.; Reed, R.M.; Ruppel, S.C.; Jarvie, D.M. Morphology, genesis, and distribution of nanometer-scale pores in siliceous mudstones of the Mississippian Barnett Shale. J. Sediment. Res. 2009, 79, 848–861. [Google Scholar] [CrossRef]
  19. Wei, X.; Liu, R.; Zhang, T.; Liang, X. Micro-pores structure characteristics and development control factors of shale gas reservoir: A case of Longmaxi Formation in XX area of southern Sichuan and northern Guizhou. J. Nat. Gas Geosci. 2013, 24, 1048–1059. [Google Scholar]
  20. Yang, C.; Zhang, J.; Tang, X. Microscopic pore types and its impact on the storage and permeability of continental shale gas, Ordos Basin. J. Earth Sci. Front. 2013, 20, 240–250. [Google Scholar]
  21. Clarkson, C.R.; Solano, N.; Bustin, R.M.; Bustin, A.M.M.; Chalmers, G.R.L.; He, L.; Melnichenko, Y.B.; Radlin, A.P.; Blach, T.P. Pore structure characterization of North American shale gas reservoirs using USANS/SANS, gas adsorption, and mercury intrusion. Fuel 2013, 103, 606–616. [Google Scholar] [CrossRef]
  22. Feng, Y.; Xiao, X.; Gao, P.; Hu, D.; Liu, R.; Li, G.; Lu, C.; Zhou, Q. Water distribution in pore systems and its influences on gas-bearing property of deep shale: A case study of the Longmaxi Formation in the Luzhou area, southern Sichuan Basin. Mar. Pet. Geol. 2024, 163, 106805. [Google Scholar] [CrossRef]
  23. Feng, Y.; Xiao, X.; Gao, P.; Wang, E.; Hu, D.; Liu, R.; Li, G.; Lu, C. Restoration of sedimentary environment and geochemical features of deep marine Longmaxi shale and its significance for shale gas: A case study of the Dingshan area in the Sichuan Basin, South China. Mar. Pet. Geol. 2023, 151, 106186. [Google Scholar] [CrossRef]
  24. Feng, Y.; Xiao, X.-M.; Wang, E.-Z.; Gao, P.; Lu, C.; Li, G. Gas storage in shale pore system: A review of the mechanism, control and assessment. Pet. Sci. 2023, 20, 2605–2636. [Google Scholar] [CrossRef]
  25. Li, Q.; Xu, S. Research Status and Prospects of Marine-Continental Transitional Shale Reservoirs. Geol. Bull. 2022, 41, 1417–1429. [Google Scholar]
  26. Chalmers, G.R.L.; Bustin, R.M. The organic matter distribution and methane capacity of the Lower Cretaceous strata of Northeastern British Columbia, Canada. Int. J. Coal Geol. 2007, 70, 223–339. [Google Scholar] [CrossRef]
  27. Ross, D.J.K.; Bustin, R.M. Shale gas potential of the lower Jurassic gordondale member, northeastern British Columbia, Canada. Can. Pet. Geol. Bull. 2007, 55, 51–75. [Google Scholar] [CrossRef]
  28. Ross, D.J.K.; Bustin, R.M. The importance of shale composition and porestructure upon gas storage potential of shale gas reservoirs. Mar. Pet. Geol. 2009, 26, 916–927. [Google Scholar] [CrossRef]
  29. Clarkson, C.R.; Jensen, J.L.; Pedersen, P.K.; Freeman, M. Innovative methods for flowunit and pore-structure analyses in a tight siltstone and shale gas reservoir. AAPG Bull. 2012, 96, 355–374. [Google Scholar] [CrossRef]
  30. Saidian, M.; Kuila, U.; Rivera, S.; Godinez, L.J.; Prasad, M. Porosity and pore size distribution in mudrocks: A comparative study for Haynesville, Niobrara, Monterey and Eastern European Silurian Formations. In Proceedings of the Unconventional Resources Technology Conference, Denver, CO, USA, 25–27 August 2014; p. SPE 1922745. [Google Scholar]
  31. Tian, H.; Pan, L.; Xiao, X.; Wilkins, R.W.T.; Meng, Z.; Huang, Z.A. Preliminary study on the pore characterization of Lower Silurian black shales in the Chuandong Thrust Fold Belt, southwestern China using low pressure N2 adsorption and FE-SEM methods. Mar. Pet. Geol. 2013, 48, 8–19. [Google Scholar] [CrossRef]
  32. Yang, F.; Ning, Z.; Hu, C.; Wang, B.; Peng, K.; Liu, H. Characterization of microscopic pore structures in shale reservoirs. Acta Petrol. Sin. 2013, 34, 301–311. [Google Scholar]
  33. Yang, F.; Ning, Z.; Liu, H. Fractal characteristics of shales from a shale gas reservoir in the Sichuan Basin, China. Fuel 2014, 115, 378–384. [Google Scholar] [CrossRef]
  34. GB/T 38718—2020; Geological Evaluating Methods for Shale Oil. Standards Press of China: Beijing, China, 2020.
  35. Lin, L.; Zhang, J.; Tang, X.; Jing, T.; Zhu, L. Conditions of continental shale gas accumulation in China. Nat. Gas Ind. 2013, 33, 35–40. [Google Scholar]
  36. Zhang, J.; Xu, H.; Zhao, J.; Ren, P. Geological characteristics and exploration potential of oil and gas in the northeast area of China. Geol. China 2018, 45, 260–273. [Google Scholar]
  37. Jiao, G.; Luo, X.; Yin, C.; Song, L.; Zhao, Z.; Wang, Z. Gas pooling conditions and exploration direction in deep Songliao Basin. Nat. Gas Ind. 2009, 29, 28–31+132–133. [Google Scholar]
  38. Zhao, W.; Zou, C.; Feng, Z.; Hu, S.; Zhang, Y.; Li, M. Geological features and evaluation techniques of deep-seated volcanic gas reservoirs, Songliao Basin. Pet. Explor. Dev. 2008, 35, 129–142. [Google Scholar] [CrossRef]
  39. Xie, X.; Zhou, Z. Exploration practices and directions for deep natural gas in the Songliao Basin. Oil Gas Geol. 2008, 113–119. [Google Scholar] [CrossRef]
  40. Zhang, J.; Xu, X.; Bai, J.; Chen, S.; Liu, W.; Li, Y. Accumulation and exploration of continental shale gas resources of Cretaceous Shahezi Formation in Lishu fault depression, Songliao Basin, NE China. Pet. Explor. Dev. 2022, 49, 440–452. [Google Scholar] [CrossRef]
  41. Zhao, W.; Li, J.; Yang, T.; Wang, S.; Huang, J. Geological difference and its significance of marine shale gases in South China. Pet. Explor. Dev. 2016, 43, 547–559. [Google Scholar] [CrossRef]
  42. Wang, Z.; Li, J.; Xia, L. Distribution forecast of source rocks and gas generation potential of Shahezi Formation in deep fault depressions of Songliao Basin. World Geol. 2014, 33, 630–639. [Google Scholar]
  43. Kniesa, J.; Mannb, U. Depositional environment and source rock potential of Miocene strata from the central Fram Strait: Introduction of a new computing tool for simulating organic facies variations. Mar. Pet. Geol. 2002, 19, 811–828. [Google Scholar] [CrossRef]
  44. Farhaduzzaman, M.; Abdullah, W.H.; Islam, M.A.; Pearson, M.J. Source rock potential of organic-rich shales in the tertiary Bhuban and Boka Bil formations, Bengal Basin. J. Pet. Geol. Bangladesh 2012, 35, 357–376. [Google Scholar] [CrossRef]
  45. Cui, Y.; Gong, E.; Wang, T.; Guan, C.; Zhang, Y.; Liang, J. Palynomorph assemblages and paleoclimate records from the Zhuanchengzi Bed of the Yixian Formation, western Liaoning Province, China. Sci. China Earth Sci. 2015, 58, 1538–1552. [Google Scholar] [CrossRef]
  46. Zhao, X.; He, D. Clay Minerals and Shale Gas. Xinjiang Pet. Geol. 2012, 33, 5. [Google Scholar]
  47. Zhang, Y. Clay Minerals and Clay Mineral Analysis; China Ocean Press: Beijing, China, 1990. [Google Scholar]
  48. Washburn, E.W. The dynamics of capillary flow. Phys. Rev. 1921, 17, 273–283. [Google Scholar]
  49. Tian, H.; Zhang, S.; Liu, S.; Zhang, H. Determination of organic-rich shale pore features by mercury injection and gas adsorption methods. Acta Pet. Sin. 2012, 33, 419–427. [Google Scholar]
  50. GB/T19587-2004; Specific Surface Area Determination of Solid Materials by Gas Adsorption. Standards Press of China: Beijing, China, 2004.
  51. Scherdel, C.; Reichenauer, G.; Wiener, M. Relationship between pore volumes and surface areas derived from the evaluation of N2-sorption data by DR-, BET- and t-plot. Microporous Mesoporous Mater. 2010, 13, 572–575. [Google Scholar] [CrossRef]
  52. Labani, M.M.; Rezaee, R.; Saeedi, A.; Hinai, A. Evaluation of pore size spectrum of gas shale reservoirs using low pressure nitrogen adsorption, gas expansion and mercury porosimetry: A case study from the Perth and Canning Basins, Western Australia. J. Pet. Sci. Eng. 2013, 112, 7–16. [Google Scholar] [CrossRef]
  53. Xie, X.; Tang, H.; Wang, C.; Bai, R.; Wang, Z. Contrast of nitrogen adsorption method and mercury porosimetry method in analysis of shale’s pore size distribution. Nat. Gas Ind. 2006, 26, 100–102. [Google Scholar] [CrossRef]
  54. Chen, L.; Liu, K.Y.; Jiang, S.; Huang, H.X.; Tan, J.Q.; Zuo, L. Effect of adsorbed phase density on the correction of methane excess adsorption to absolute adsorption in shale. Chem. Eng. J. 2021, 420, 127678. [Google Scholar] [CrossRef]
  55. Lu, Z.; Liu, C.; Zang, Q.; Wu, Y.; Yang, X.; Yang, H. Application of high-pressure mercury injection and nuclear magnetic resonance in analysis of the pore structure of dense sandstone: A case study of the Heshui area, Ordos Basin. Bull. Geol. Sci. Technol. 2022, 41, 300–310. [Google Scholar]
  56. Yao, Y.; Liu, D.; Che, Y.; Tang, D.; Tang, S.; Huang, W. Petrophysical characterization of coals by low-field nuclear magnetic resonance (NMR). Fuel 2010, 89, 1371–1380. [Google Scholar] [CrossRef]
  57. Hinai, A.; Rezaee, R.; Esteban, L.; Labani, M. Comparisons of pore size distribution: A case from the Western Australian gas shale formations. J. Unconv. Oil Gas Resour. 2014, 8, 1–13. [Google Scholar] [CrossRef]
  58. Liu, Y.; Yao, Y.; Liu, D.; Zheng, S.; Sun, G.; Chang, Y. Shale pore size classification: An NMR fluid typing method. Mar. Pet. Geol. 2018, 96, 591–601. [Google Scholar] [CrossRef]
  59. Coates, G.R.; Xiao, L.; Prammer, M.G. NMR Logging: Principles and Applications; Haliburton Energy Services: Houston, TX, USA, 1999. [Google Scholar]
  60. Hodgkins, M.A.; Howard, J.J. Application of NMR Logging to Reservoir Characterization of Low-Resistivity Sands in the Gulf of Mexico. AAPG Bull. 1999, 83, 114–127. [Google Scholar] [CrossRef]
  61. Appel, M.; Freeman, J.J.; Perkins, R.B.; Hofman, J.P. Restricted diffusion and internal field gradients paper. In Proceedings of the SPWLA 40th Annual Logging Symposium Transactions, Oslo, Norway, 30 May–3 June 1999. [Google Scholar]
  62. Al-Mahrooqi, S.H.; Grattoni, C.A.; Moss, A.K.; Jing, X.D. An investigation of the effect of wettability on NMR characteristics of sandstone rock and fluid systems. J. Pet. Sci. Eng. 2003, 39, 389–398. [Google Scholar] [CrossRef]
  63. Kleinberg, R.L.; Vinegar, H.J. NMR properties of reservoir fluids. Log Anal. 1996, 37, 20–32. [Google Scholar]
  64. Li, S.; Guo, H.; Liu, W.; Sun, D.; Li, H. Study on oil saturation recovery on cores by using nuclear magnetic resonance. J. Oil Gas Technol. 2007, 29, 62–66. [Google Scholar]
  65. Tan, J.; Horsfield, B.; Fink, R.; Krooss, B.; Schulz, H.M.; Rybacki, E.; Zhang, J.; Boreham, C.J.; van Graas, G.; Tocher, B.A. Shale Gas potential of the major Marine shale formations in the upper Yangtze Platform, South China, Part III: Mineralogical, lithofacial, petrophysical, and rock mechanical properties. Energy Fuels 2014, 28, 2322–2342. [Google Scholar] [CrossRef]
  66. Chen, L.; Jiang, Z.X.; Liu, K.Y.; Wang, P.F.; Ji, W.M.; Gao, F.L.; Li, P.; Hu, T.; Zhang, B. Effect of lithofacies on gas storage capacity of marine and continental shales in the Sichuan Basin, China. J. Nat. Gas Sci. Eng. 2016, 36, 773–785. [Google Scholar] [CrossRef]
  67. Liu, B.; Bai, L.; Chi, Y.; Jia, R.; Fu, X.; Yang, L. Geochemical characterization and quantitative evaluation of shale oil reservoir by two-dimensional nuclear magnetic resonance and quantitative grain fluorescence on extract: A case study from the Qingshankou Formation in Southern Songliao Basin, northeast China. Mar. Pet. Geol. 2019, 109, 561–573. [Google Scholar] [CrossRef]
  68. Yang, J.; Wang, L.; Li, S.; Zuo, C.; Xiao, F.; Chen, Y.; Yao, Y.; Bai, L. The Influence of Reservoir Composition on the Pore Structure of Continental Shale: A Case Study from the Qingshankou Formation in the Sanzhao Sag of Northern Songliao Basin, NE China. Geofluids 2021, 2021, 5869911. [Google Scholar] [CrossRef]
  69. Cheng, P.; Xiao, X.; Fan, Q.; Gao, P. Oil Retention and Its Main Controlling Factors in Lacustrine Shales from the Dongying Sag, Bohai Bay Basin, Eastern China. Energies 2022, 15, 4270. [Google Scholar] [CrossRef]
  70. Li, Z.; Jiang, Z.; Tang, X.; Wang, P.; Huang, P.; Wang, G. Lithofacies Characteristics and Its Effect on Pore Structure of the Marine Shale in the Low Silurian Longmaxi Formation, Southeastern Chongqing. Earth Sci. 2017, 42, 1116–1123. [Google Scholar]
  71. Zhao, P.; Li, X.; Tian, X.; Su, G.; Zhang, M.; Guo, M.; Dong, M.; Sun, M.; Wang, F. Longmaxi shale gas reservoirs micropores southern Sichuan. Nat. Gas Geosci. 2017, 25, 1672–1926. [Google Scholar]
  72. Zhao, Z. Adsorption Application Theory; Chemical Industry Press: Beijing, China, 2005. [Google Scholar]
  73. Brunauer, S.; Deming, L.S.; Deming, W.S.; Teller, E. On a theory of the van der Waals adsorption of gases. J. Am. Chem. Soc. 1940, 62, 1723–1732. [Google Scholar] [CrossRef]
  74. Groen, J.C.; Peffer, L.A.A.; Pérez-Ramírez, J. Pore size determination in modified micro- and mesoporous materials. Pitfalls and limitations in gas adsorption data analysis. Microporous Mesoporous Mater. 2003, 60, 1–17. [Google Scholar] [CrossRef]
  75. Lowell, S.; Shields, J.E.; Thomas, M.A.; Thommes, M. Characterization of Porous Solids and Powders: Surface Area, Pore Size and Density; Natural gas geoscience; Springer Science Business Media: New York, NY, USA, 2004. [Google Scholar]
  76. Barret, E.P.; Joyner, L.G.; Halenda, P.P. The determination of pore volume and area distribution in porous substances. I. Computations from nitrogen isotherms. J. Am. Chem. Soc. 1951, 73, 373–380. [Google Scholar] [CrossRef]
  77. Li, A.; Ding, W.; Wang, R.; He, J.; Wang, X.; Sun, Y. Petrophysical characterization of shale reservoir based on nuclear magnetic resonance (NMR) experiment: A case study of Lower Cambrian Qiongzhusi Formation in eastern Yunnan Province, South China. J. Nat. Gas Sci. Eng. 2016, 37, 29–38. [Google Scholar] [CrossRef]
  78. Sondergeld, C.H.; Ambrose, R.J.; Rai, C.S. Microstructural studies of gas shales. In Proceedings of the SPE Unconventional Gas Conference, Pittsburgh, PA, USA, 23–25 February 2010; p. SPE-131771-MS. [Google Scholar]
  79. Ambrose, R.J.; Hartman, R.C.; Diaz-Campos, M. New pore-scale considerations for shale gas in place calculations. In Proceedings of the SPE 131772 Unconventional Gas Conference, Pittsburgh, PA, USA, 23–25 February 2010. [Google Scholar]
  80. Chen, S.; Zhu, Y.; Wang, H.; Liu, H.; Wei, W.; Fang, J. Structure characteristics and accumulation significance of nanopores in Longmaxi shale gas reservoir in the southern Sichuan Basin. J. China Coal Soc. 2012, 37, 438–444. [Google Scholar]
  81. Tang, X.L.; Jiang, Z.X.; Jiang, S.; Wang, P.; Xiang, C. Effect of Organic Matter and Maturity on Pore Size Distribution and Gas Storage Capacity in High-Mature to Post-Mature Shales. Energy Fuels 2016, 30, 8985–8996. [Google Scholar] [CrossRef]
  82. Ji, W.M.; Song, Y.; Jiang, Z.X.; Wang, X.; Bai, Y.; Xing, J. Geological controls and estimation algorithms of lacustrine shale gas adsorption capacity: A case study of the Triassic strata in the southeastern Ordos Basin, China. Coal Geol. 2014, 134, 61–73. [Google Scholar] [CrossRef]
  83. Chen, J.; Xiao, X.M. Evolution of nanoporosity in organic-rich shales during thermal maturation. Fuel 2014, 129, 173–181. [Google Scholar] [CrossRef]
  84. Li, C.; Zhou, S.; Li, J.; Yang, Y.; Fu, D.; Ma, Y. Pore Characteristics and Controlling Factors of the Yanchang Formation Mudstone and Shale in the South of Ordos Basin. Acta Sedimentol. Sin. 2017, 35, 315–329. [Google Scholar]
  85. Jiang, T.; Jin, Z.; Liu, G.; Hu, Z.; Liu, Q.; Liu, Z. Pore structure characteristics of shale reservoirs in the Ziliujing Formation in Yuanba area, Sichuan Basin. Oil Gas Geol. 2021, 42, 909–918. [Google Scholar]
  86. Li, W.; Lü, S.; Li, J.; Zhang, P.; Chen, C.; Wang, S. The coupling relationship between material composition and pore microstructure of southern China marine shale. Nat. Gas Geosci. 2019, 30, 27–38. [Google Scholar]
  87. Xiao, D.; Lu, Z.; Jiang, S. Comparison and integration of experimental methods to characterize the full-range pore features of tight gas sandstone-A case study in Songliao Basin of China. Nat. Gas Sci. Eng. 2016, 34, 1412–1421. [Google Scholar] [CrossRef]
  88. Liu, X.; Xiong, J.; Liang, L. Investigation of pore structure and fractal characteristics of organic-rich Yanchang formation shale in central China by nitrogen adsorption/desorption analysis. Nat. Gas Sci. Eng. 2015, 22, 62–72. [Google Scholar] [CrossRef]
  89. Feng, X.; Ao, W.; Tang, X. Characteristics of Pore Development and Its Main Controlling Factors of Continental Shale Gas Reservoirs: A Case Study of Chang 7 Member in Ordos Basin. J. Jilin Univ. (Earth Sci. Ed.) 2018, 48, 678–692. [Google Scholar]
  90. Milliken, K.L. Late Diagenesis and Mass Transfer in Sandstone–Shale Sequences. Treatise Geochem. 2003, 7, 159–190. [Google Scholar] [CrossRef]
  91. Li, B.; Hu, B.; Ren, X.; Luo, Q.; Dong, Z.; Liu, G. Fine description of shale gas reservoir space of Silurian Longmaxi Formation in Baojing, Hunan Province. Chin. J. Geol. (Sci. Geol. Sin.) 2024, 59, 1639–1661. [Google Scholar]
  92. Li, G.; Gao, P.; Xiao, X.; Lu, C.; Feng, Y. Lower Cambrian Organic-Rich Shales in Southern China: A Review of Gas-Bearing Property, Pore Structure, and Their Controlling Factors. Geofluids 2022, 2022, 9745313. [Google Scholar] [CrossRef]
  93. Li, L.; Huang, B.; Tan, Y.; Deng, X.; Li, Y.; Zheng, H. Geometric Heterogeneity of Continental Shale in the Yanchang Formation, Southern Ordos Basin, China. Sci. Rep. 2017, 7, 6006. [Google Scholar] [CrossRef]
  94. Fishman, N.S.; Hackley, P.C.; Lowers, H.A. The nature of porosity in organic-rich mudstones of the Upper Jurassic Kimmeridge Clay Formation, North Sea, offshore United Kingdom. Coal Geol. 2012, 103, 32–50. [Google Scholar] [CrossRef]
  95. Gao, F.; Wang, C.; Song, Y.; Jiang, Z.; Li, Z.; Liu, Q. Pore evolution of organic maceral in Shahezi Formation shale of Changling fault depression, Songliao Basin. Geol. China 2021, 48, 948–958. [Google Scholar]
  96. Huang, J.; Zou, C.; Li, J.; Dong, D.; Wang, S.; Wang, S.; Cheng, K. Formation Conditions and Resource Potential of Shale Gas in the Lower Cambrian Qiongzhusi Formation, Southern Sichuan Basin. Pet. Explor. Dev. 2012, 39, 69–75. [Google Scholar] [CrossRef]
  97. Guo, S.; Wang, Z.; Ma, X. Exploration Prospects of Permian Marine-Continental Transitional Shale Gas in Key Areas of China. Pet. Geol. Exp. 2021, 43, 377–385. [Google Scholar]
  98. Yao, Y.; He, Z.; Li, H.; Zhang, Y.; Gao, X.; Wang, K.; Jiao, C. Sedimentary geological model and distribution prediction of source rocks in the Saergan Formation (Middle-Upper Ordovician) in Awati fault depression, Tarim Basin. Oil Gas Geol. 2020, 41, 763–775. [Google Scholar]
  99. Yang, H.; Wang, F.; Hu, A.; Guan, C.; Hua, Y. Status quo, advances, and prospects of shale oil exploration in the Bohai Bay Basin. Oil Gas Geol. 2025, 46, 1123–1135. [Google Scholar]
  100. Wu, J. Pore Structure Characterization and Controlling Factors of Shanxi Shale in Daning-Jixian Block, Ordos Basin; Chengdu University of Technology: Chengdu, China, 2020. [Google Scholar]
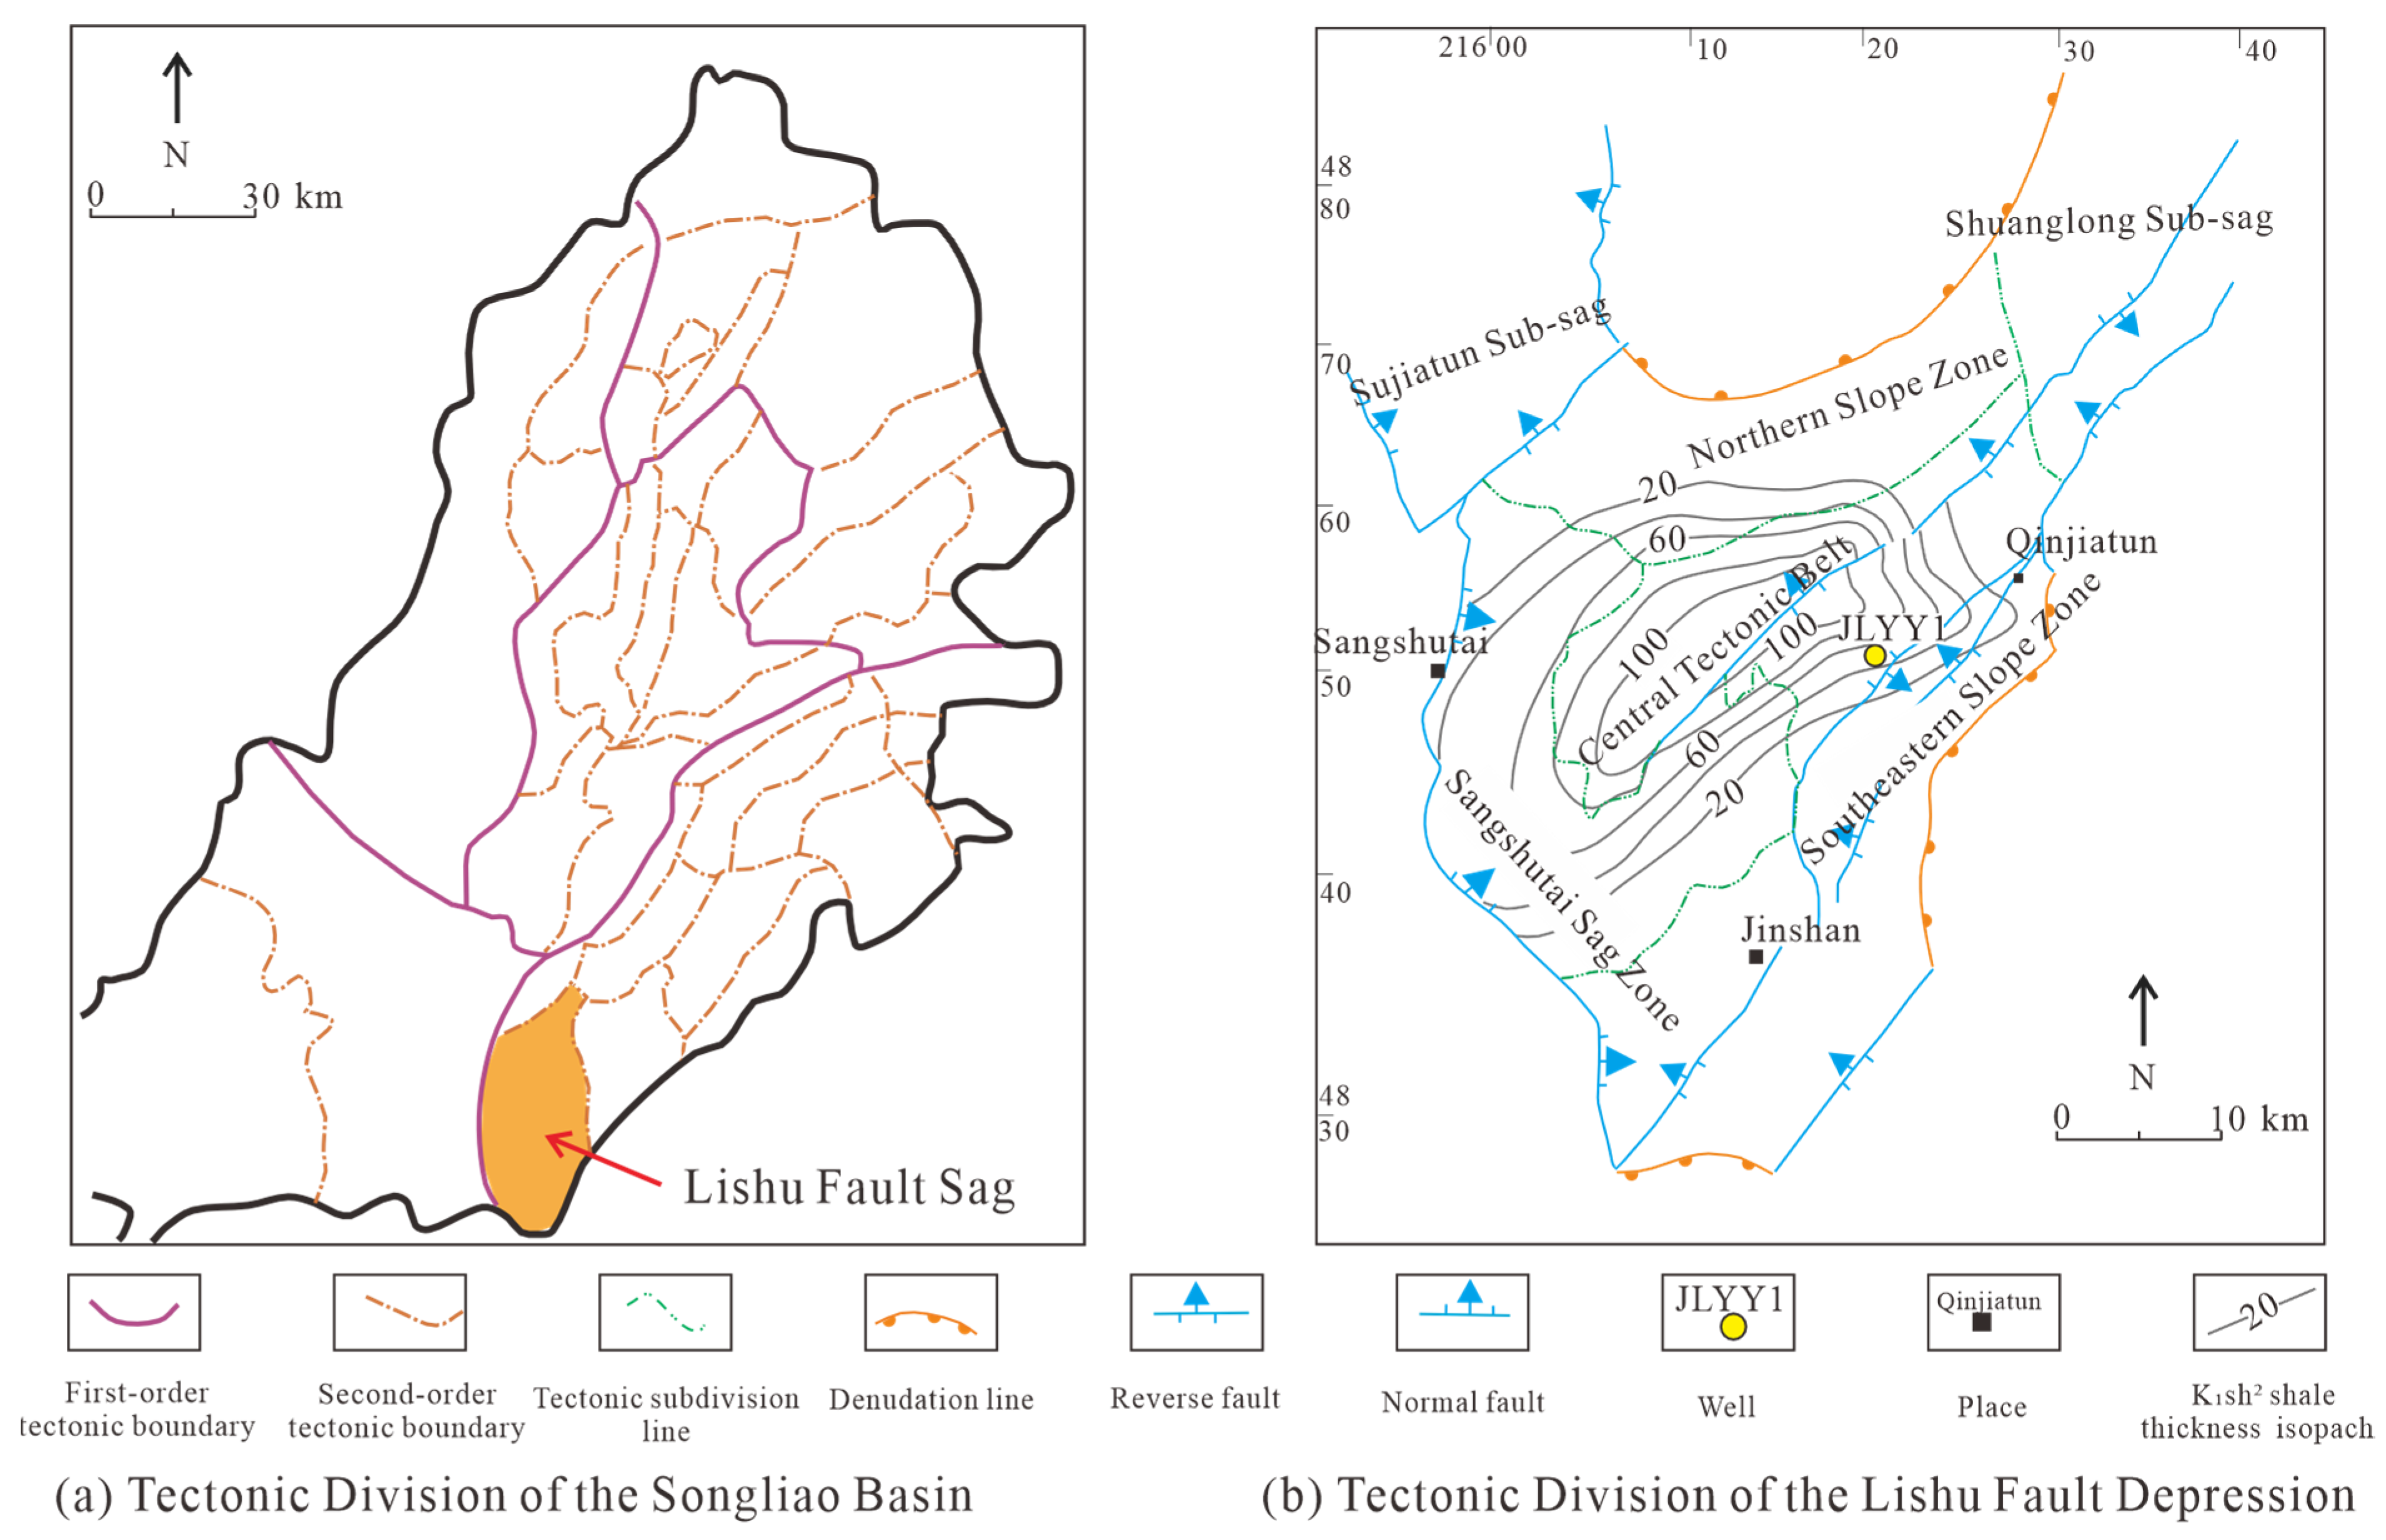
Figure 2. (a) Tectonic division of the Songliao Basin (b) Tectonic division of the Lishu Fault Depression.
Minerals 16 00410 g002
Figure 3. Stratigraphic column of the Cretaceous Period for Lishu sag.
Minerals 16 00410 g003
Figure 4. Relative content of clay mineral components (a) mineral content (b) shale samples from Member2 of the Shahezi Formation in the Lishu Fault Sag, Songliao Basin (c) Brit vs Depth Crossplot.
Minerals 16 00410 g004
Figure 5. Core photographs((a) Mixed shale; (b) Clay shale; (c) Clay shale) and polarized light microscope photographs (di) of the mudstone samples from the lower sub-member of the second member of the Shahezi Formation in the JLYY-1 Well in the Lishu Sag of the Songliao Basin.
Minerals 16 00410 g005
Figure 6. Scanning electron microscope (SEM) and backscattered electron (BSE) images of samples from the lower sub-member of the second member of the Shahezi Formation in the JLYY1 Well of the Lishu Fault Sag in the Songliao Basin. (a) Bedding parallel fracture and pyrite; (b) Organic matter and Pyrite; (c) Contraction joint; (d) Calacareous strip; (e) Organic matter internal micro-pores; (f) Back-scattered large-area.
Minerals 16 00410 g006
Figure 7. Shale lithofacies classification scheme and main lithofacies types of the lower sub-member of the second member of the Shahezi Formation of Lishu Fault Sag in the Songliao Basin.
Minerals 16 00410 g007
Figure 8. Relationship between mercury injection–withdrawal capillary pressure curves and cumulative mercury injection volume collected from terrestrial shale samples in the Songliao Basin in Northeast China.
Minerals 16 00410 g008
Figure 9. Pore size distribution calculated using mercury injection data from terrestrial shale samples from the Songliao Basin in northeastern China.
Minerals 16 00410 g009
Figure 10. The pore volume percentage of terrestrial shale samples from the Songliao Basin in Northeast China, determined using the mercury injection capillary pressure method based on the International Union of Pure and Applied Chemistry (IUPAC) classification.
Minerals 16 00410 g010
Figure 11. Nitrogen physical adsorption isotherms (a) and carbon dioxide adsorption isotherms (b) of terrestrial shale samples from the Songliao Basin.
Minerals 16 00410 g011
Figure 12. Pore size distribution diagrams of terrestrial shale samples from the Songliao Basin determined by using physical adsorption of nitrogen (a) and physical adsorption of carbon dioxide (b).
Minerals 16 00410 g012
Figure 13. Pore volume and specific surface area of terrestrial shale samples from the Songliao Basin determined by using nitrogen adsorption (a) and carbon dioxide adsorption (b) methods.
Minerals 16 00410 g013
Figure 14. Nuclear magnetic resonance T2 spectrum of EKS shales in the Lishu Fault Sag, Songliao Basin; (a) 3117.18 m; (b) 3124.78 m; (c) 3129.93 m; (d) 3143.07 m; (e) 3148.04 m; (f) 3153.32 m; (g) 3163.41 m; (h) 3166.07 m.
Minerals 16 00410 g014
Figure 15. Pore distribution characteristics of EKS shales in the Lishu Fault Sag, Songliao Basin. (a) 3117.18 m; (b) 3124.78 m; (c) 3129.93 m; (d) 3143.07 m; (e) 3148.04 m; (f) 3153.32 m; (g) 3163.41 m; (h) 3166.07 m.
Minerals 16 00410 g015
Figure 16. Full pore size distribution diagram obtained by combining the pore size distribution (PSD) characteristics of high-pressure mercury injection and low-pressure nitrogen and carbon dioxide physical adsorption.
Minerals 16 00410 g016
Figure 17. Pore analysis diagram of different rock facies.
Minerals 16 00410 g017
Figure 18. Correlation between pore volume, specific surface area, and average pore diameter of terrestrial shale in the Songliao Basin, Northeast China. (a) Crossplot of Mesopore Pore Volume vs Mesopore Mean Diameter for different shale lithofacies; (b) Crossplot of Mesopore Specific Surface Area vs Mesopore Mean Diameter for different shale lithofacies; (c) Crossplot of Mesopore Pore Volume vs Mesopore Specific Surface Area for different shale lithofacies.
Minerals 16 00410 g018
Figure 19. Correlation between pore volume, specific surface area, and total organic carbon (TOC) content of terrestrial shales in the Songliao Basin, Northeast China, and vitrinite reflectance (Ro). (a) Crossplot of Mesopore Specific Surface Area vs TOC for different shale lithofacies; (b) Crossplot of Mesopore Pore Volume vs TOC for different shale lithofacies; (c) Crossplot of Mesopore Specific Surface Area vs Ro for different shale lithofacies; (d) Crossplot of Mesopore Pore Volume vs Ro for different shale lithofacies.
Minerals 16 00410 g019
Figure 20. Correlations between pore volume, specific surface area, and clay minerals, quartz, and feldspar in terrestrial shale from the Songliao Basin in Northeast China. (a) Crossplot of Mesopore Specific Surface Area vs Clay Content for different shale lithofacies; (b) Crossplot of Mesopore Pore Volume vs Clay Content for different shale lithofacies; (c) Crossplot of Mesopore Specific Surface Area vs Quartz Content for different shale lithofacies; (d) Crossplot of Mesopore Pore Volume vs Quartz Content for different shale lithofacies; (e) Crossplot of Mesopore Specific Surface Area vs Feldspar Content for different shale lithofacies; (f) Crossplot of Mesopore Pore Volume vs Feldspar Content for different shale lithofacies.
Minerals 16 00410 g020
Disclaimer/Publisher’s Note: The statements, opinions and data contained in all publications are solely those of the individual author(s) and contributor(s) and not of MDPI and/or the editor(s). MDPI and/or the editor(s) disclaim responsibility for any injury to people or property resulting from any ideas, methods, instructions or products referred to in the content.