Article

Influence of Ti, Fe, and Ca on the Enrichment of Tantalum in Engineered Artificial Mineral (EnAM) Phases in Solidified Synthetic Silicate Melts


1
Department of Geosciences, Institute of Geotechnology and Mineral Resources, Clausthal University of Technology, Adolph-Roemer-Str. 2A, 38678 Clausthal-Zellerfeld, Germany
2
Institute of Process Metallurgy and Metal Recycling, RWTH Aachen University, Intzestr., 352056 Aachen, Germany
*
Author to whom correspondence should be addressed.
Minerals 2026, 16(4), 370; https://doi.org/10.3390/min16040370
Submission received: 18 March 2026 / Revised: 27 March 2026 / Accepted: 27 March 2026 / Published: 31 March 2026

Abstract

The recovery of oxygen-affine elements such as tantalum (Ta) using pyrometallurgical routes is difficult because this element cannot easily be enriched in a metal alloy, as is the case with battery recycling for the more noble metals Co, Ni, and Cu. A promising procedure, on the other hand, is to enrich this element in simple oxide compounds formed in a silicate melt. This enrichment in tailored mineral compounds is also known as the “Engineered Artificial Minerals” (EnAM) approach. Currently, the Technological Readiness Level (TRL) of this approach is relatively low and limited to understanding the mechanisms involved in the incorporation of target elements and the search for suitable compounds with a high enrichment factor, favorable morphology, and early crystallization during solidification in order to achieve maximum recovery yield of the selected compound (element). Due to its high ion charge (high field strength) and small ion radius for a heavy element, it is plausible that Ta behaves similarly to the abundant element titanium (Ti), whose chemistry is much better known. Ti minerals such as ulvospinel, perovskite, ilmenite, and pseudobrookite are therefore suitable candidates in the search for a suitable tantalum EnAM. A comparison of the solidification of synthetic silicate melts dominated by iron and calcium with Ti as an additive show that Ta is not incorporated into ulvospinel formed in olivine-containing Fe-rich silicate melts (base composition with 57 wt.% FeO). In contrast, the perovskites formed in silicate melts dominated by calcium-alumosilicate (max. 10 wt.% FeO addition) do incorporate Ta. Crystal size and Ta content increase with increasing iron content (up to a maximum of about 10 wt.%). The results indicate a possible solid solution with the well-known compounds CaTiO3 and FeTiO3 and the virtual compounds Ca0.8TiO3 and Fe0.8TiO3.

1. Introduction

Tantalum’s significance is underscored by the European Union’s directives aimed at promoting the sustainable management of critical raw materials (CRMs), which include initiatives to reduce dependency on primary sources. These regulations emphasize the need for efficient recovery processes for tantalum and other important critical materials from waste streams, aligning with broader goals of resource efficiency and environmental sustainability within the EU framework. This includes establishing regulatory frameworks that mandate the collection and recycling of raw materials [1,2].
Tantalum is a strategically important element, yet modern recycling processes for its recovery from waste electrical and electronic equipment (WEEE), e.g., capacitors and metal-containing residues, face significant technological and economic challenges, with current recycling rates falling below feasible levels. Additionally, the rapid growth in electronic device demand has led to a significant rise in WEEE, with global production reaching 62 million tons in 2022 ([3]). Despite regulations like the EU’s WEEE Directive [4], only 22.3% of global e-waste is recycled properly, highlighting an urgent need for innovative recycling methods to improve resource recovery and mitigate environmental impacts.
While metals like copper and gold are effectively recovered, CRMs like tantalum and rare earth elements dissolve poorly in silicate melt systems, e.g., fayalitic slags, during processing, leading to negligible recovery rates. During pyrometallurgical processing, tantalum, being oxygen-affine, migrates into the oxide slag; however, its concentration is often insufficient for economically viable recovery without enrichment in separable phases. Consequently, tantalum can be lost during disposal. The concept of engineered minerals (EnAMs) offers a promising solution by enabling targeted design of multicomponent silicate melt systems to recover valuable components in tailored phases. This approach is particularly suitable for Ta-containing waste from different origins. The Ta-concentration mechanisms in specific mineralogical phases occurring at optimization of the silicate melt composition combined with suitable additives and cooling procedures to promote phase crystallization are not yet fully understood. Such enriched Ta phases would improve liberability and separability from the matrix for further mechanical treatment.
A relatively new process for recovering important raw materials from waste products, such as solidified silicate melts (generally referred to as “slag”), is the EnAM concept, which can be broadly defined as the targeted manipulation of a (mineral) multicomponent system to recover valuable components in tailor-made phases. Furthermore, due to its flexibility for a wide variety of waste sources, pyrometallurgy is very well suited for Ta-containing waste from very different origins. Therefore, the combination of these two processes would be very well suited for recovering strategic elements from complex waste streams.
In pyrometallurgy, an EnAM can be applied in a silicate melt system whose composition, additives, atmosphere, and cooling procedures/curves are engineered to enrich a valuable element in a specific compound (e.g., perovskite).
This (mineral) compound should meet the following conditions in descending order of priority:
-
High enrichment factor;
-
Early crystallization;
-
Simple chemistry;
-
Advantageous morphology (habitus and grain form);
-
Advantageous physical properties (chargeability and magnetism);
-
Stability (e.g., chemical resistance).
Such properties lead to better liberability (grain/crystallite size and shape), separability (e.g., flotation and magnetic separation), and purity for simplified hydrometallurgy. The aim of the EnAM method is as follows:
CTE(matrix)/CTE(EnAM) = Min
(CTE(matrix): concentration of target element in the silicate melt matrix; CTE(EnAM): concentration of target element in the selected EnAM phase; Min: smallest possible value.)
The EnAM method uses a combination of engineering, mineralogy, and thermodynamic modeling to iteratively optimize the system to fulfill Equation (1).
The development of the EnAM method in pyrometallurgy is currently focused primarily on the recovery of oxygen-affine elements from silicate melts and can therefore be considered a secondary process.
Since the primary process focuses on refining nobler elements (e.g., Co, Ni, and Cu in LiB recycling), a slag converter will be required in most cases for further processing/modification of the silicate melt to gain access to valuable oxygen-affine elements.
When the EnAM approach is applied successfully, the amount of material requiring processing can be drastically reduced, which subsequently leads to an equally drastic reduction in the need for toxic and/or environmentally harmful reagents (i.e., chemicals used in hydrometallurgy). The worst-case scenario—dumping in landfills—can ultimately be avoided entirely if the harmless residues from the EnAM process can be used as mineral residues in construction.
This article presents the first step of the EnAM process, comprising the development of the silicate melt system, mineralogical investigation and routine thermodynamic modeling aimed at the recovery of Ta using a pyrometallurgical approach. In the research work presented, Ca- and Fe-dominated synthetic silicate melt mixtures doped with 1 wt.% Ta (as Ta2O5) were blended with the additive, Ti, then heated and cooled under an Ar atmosphere.

2. Background

2.1. Examples of Pyrometallurgical Recovery Routes for Tantalum-Containing Waste

The references introduced in this section are limited to the pyrometallurgical processing of Ta-containing waste, as this is the primary focus of this research. For downstream (e.g., hydrometallurgical) or other types of processes (e.g., pyrolysis), please refer to the relevant technical literature in this field. A brief overview with respect to Ta is also given in [5].
Ta-containing residues can originate from ore mining (e.g., tin slag) or electronic waste. Therefore, the source materials can vary greatly. These residues range from Ta-pentoxide or (Ta,Nb)2O5 [6,7] derived from cassiterite ore processing to Li7La3Zr2O12 in Li-ion battery separators [8], as well as metallic components such as tantalum capacitors and other electronic components that contain Nb and Ti in addition to Ta [9]. If tantalum capacitors are introduced as a whole, besides Ta, ignoble oxygen-affine elements such as Mn (electrolytes), Fe (terminal wires), and Sn (solder and cathode connections) can be expected to be present in the slag (e.g., [10]).
When considering electronic components that contain tantalum capacitors or other tantalum-containing alloys in particular, prior disassembly is advantageous to produce a tantalum component (capacitor) concentrate.
This concentrate can be treated with thermal plasma to produce a pyrolyzed mass with metallic pieces (Fe, Cu, Sn, and Ta) and a slag (SiO2, MnOx, …). The metals can then be magnetically separated in the next step [11].
Ta in Ta/W-containing cakes from leaching procedures can also be recovered by means of aluminothermic reduction at 1550–1700 °C (together with W). This results in the production of FeTaW alloys (e.g., Fe2Ta0.5W0.5) [12].
Ta-containing synthetic fayalite slags were examined by [13], where Ta was found to be present in the alumosilicate matrix rather than in the spinels (magnetite). Studies carried out by the authors of [5], on the other hand, show that Ta can also be highly enriched in magnetite-like (tantalomagnetite) or tantalite/perovskite-like oxides.
Experiments on the carbothermal reduction of Ta (alongside Ti, Nb, and W) in a complex mixture of recyclable materials containing tin slag were carried out by the authors of [14] in an electric arc furnace. The resulting material was very heterogeneous, containing metallic components (Ti, Nb, Ta, and W) and carbides and an oxidic alumosilicate structure with Ta- and Nb-containing perovskite.
Vutova et al. [15] investigated the effect of the electron beam melting process on Ta-containing residues using an ELIT-60 instrument (Leybold GmbH, Cologne, Germany; 60 kW, 24 kV). The optimal operating conditions were 3700 K for 10 min, with a purity level of 99.9991%. The behavior (vapor pressure, melting temperature, and volatility) of impurities with the elements Al, Mn, Fe, As, Nb, Mo, Ta, and W and their oxides was investigated.

2.2. Incorporation of Ta into Ulvospinel, Perovskites and Olivine/Pyroxene-like Simple Silicates

There are three approaches to understanding the behavior of an element that is rare in nature, such as Ta, during the solidification of artificial melts:
-
Examining the natural occurrence of the element in mineral compounds (natural analoga);
-
Examining the behavior of a similar but naturally abundant element;
-
Examining synthetic compounds produced in other (technical) contexts.
The first helps to understand the reactions of the element itself when it can form its own compounds through high enrichment, as with columbite/tantalite ore. The second helps to predict the behavior of the element with respect to naturally abundant structures like those that typically form in the solidification of silicate melts. In this case, the best choice would be Ti. Such a common and inexpensive element can then be used as an additive to trigger compounds that scavenge the target element. Expected compounds here would be ulvospinel, pyroxene, olivine or perovskite [16,17,18,19,20], which are also typical for the synthetic silicate melts investigated in this work. The last expands the compound list and is potentially interesting for understanding the behavior of the target element.
Examples of natural compounds formed at high Ta concentrations are common ores like tantalite (FeIITa2O6), tantite (Ta2O5), tapiolite (FeII,MnII)(Ta,Nb)2O6, rynersonite ((Ca(Ta,Nb)2O6) and pyrochlore (e.g., microlite (Na,Ca)2Ta2O6(O,OH,F), fersmite ((Ca,Ce,Na)(Nb,Ta,Ti)2(O,OH,F)6), ixiolite ((Ta,Nb,Sn,Mn2+,Fe2+)O2) and loparite ((Lanth, Na, Sr, Ca)(Ti,Nb,Ta,FeIII)O3) [21,22,23]. This suggests that in nature Ta is predominantly pentavalent and normally occurs in relatively simple oxide compounds and not in silicates. Therefore, this can also be assumed for ay silicate melt. In fact, simple oxide components such as Ta2O5 or (Ta,Nb)2O5 are found in existing slag from tin extraction. Other components such as TaC or FeTaO3 have been described but appear to be the exception rather than the rule [6,7,24,25].
Tantalum-containing silicates are rare in nature and do not contain Ta as a separate stoichiometric unit [21]. The O, Si, Ta system does not contain any crystalline compounds, although thin layers of TaSiOx can be deposited [26]. While many compounds have been documented in the CaO-Ta2O5 system, only one ternary compound, Ca10Ta2Si6O27, exists in the SiO2-CaO-Ta2O5 system [27].
It is interesting to note that Ta (together with Nb) often occurs in Ti-containing minerals and is sorted into the same stoichiometric position there, e.g., in oxides such as pyrochlore (see above) or struverite ((Ti,Ta,Fe3+)O2). Ca also plays an important role in many Ta-containing minerals (e.g., vigezzite, (Ca,Ce)(Nb,Ta,Ti)2O6). The same applies to Fe (see above, [21]).
This shows that Ta behaves similarly to Ti in terms of crystallography and often occurs in compounds together with Ca and Fe. Since Ta is rarely found in silicates that are main compounds in silicate melts, the element Ti, which behaves analogously, can be used here as well. A mineral structure that typically forms upon solidification of silicate melts is pyroxene. In pyroxene, frequently Ti is incorporated (augite, (Ca,Na)(Mg,Fe,Al,Ti)(Si,Al)2O6) [21]). As a result, pyroxene structures such as augite are potential Ta hosts.
In the technical field, for example, Ta-containing microwave ceramics with perovskite- and pyrochlore-like structures (X5Y4O15 and Ca2Ta2O7, respectively) are manufactured and investigated [28,29].
With regard to silicate melts, the following conclusions can be drawn regarding the search for Ta-containing compounds in Ti-containing silicate melt systems. In the field of oxides, Ca-Ti-Fe compounds such as perovskite (CaTiO3), ulvospinel (TiFe2O4) and ilmenite/titanomagnetite (FeTiO3/Fe(Fe2-1.3̅xTix)O4 are of interest; the latter can incorporate up to 13 wt.% Ti [30]. In the field of silicates, pyroxenitic compounds are most promising. In order to estimate which structure is most likely to scavenge Ta from the melt, both the structure and the crystallization sequence must be considered. The compound that crystallizes first (primary crystallization field/melting point) and/or has the highest affinity for Ta incorporation has the best potential to act as an EnAM.

2.2.1. Ulvospinel

This compound has the inverse spinel structure FeII[4][TiIV[6]FeII[6]]O4, which means that Ti has octahedral coordination [31]. In this spinel structure, only half of the octahedral gaps are occupied, of which Ti again accounts for only half. TiIV[6]’s ionic radius is 0.605 [32]. For TaV[6], the radius is 0.64. The incorporation of Ti instead of FeIII into the spinel structure increases the distortion compared to magnetite and thus the crystal strain [33]. TaV would probably destabilize this structure even further because of the larger ionic radius and the higher charge. This makes the incorporation of Ta less likely compared to magnetite, although there exists a solid solution [34].

2.2.2. Pyroxenes

Pyroxenes are chain silicates that include X[8]Y[6][Z2O6] with [SiO3]2− or [Si2O6]4− chains parallel to the c-axis. The X and Y cations are located on the sides of these structures [31,35]. The structure is very flexible and can combine large, low-charged cations (e.g., Na and Ca) with small, highly charged cations (e.g., Al and Ti). Ta (and the chemically similar Nb) are known to be incorporated into naturally occurring monoclinic pyroxene [36,37]. The investigations of [37] indicate that a maximum of approx. 1 wt.% Ta can be incorporated into clinopyroxene.

2.2.3. Perovskite (Here: CaTiO3)

Ideal perovskite belongs to the cubic m3m point group with CaII[12]TiIV[6]O3 but often has a slightly distorted quasicubic orthorhombic crystal structure resulting in CaII[8]TiIV[6]O3 coordination [38]. The TiIV (the potential position of TaV) is located in corner-linked slightly tilted TiO6-octahedra, which in turn surround CaII. Perovskite is known to incorporate larger amounts of Nb instead of Ti [31]. The perovskite structure is typical for the combination of large, low-charged ions with small, high-charged ions (e.g., CaII with TiIV) and has a very high degree of flexibility. Ta doping can even help to stabilize the lattice and to optimize (together with Nb) oxygen vacancy balance [39,40]. In this context, loparite (already mentioned above) is very interesting, as it is a natural perovskite mineral and an important tantalum ore. Perovskite-like structures containing Ca and a pentavalent ion with the composition Ca(Nb,Ti)O3.33 can be synthesized [35,41]. All in all, this suggests that the perovskite structure has the necessary flexibility to incorporate Ta as well.

2.2.4. Other XYOz Compounds

In silicates such as CaSiO3, Ta would have to be incorporated in place of Si. However, since Ta cannot be tetrahedrally coordinated [32], this is implausible.
The same applies in principle to olivine-like minerals (generally (Mg,Ca,FeII)SiO4). One exception could be the olivine-like phase laihunite, which contains trivalent elements (FeIII). This phase is described in [42] and an example is listed in the ICDD pdf-2 database under the number 01-085-1417 with the formula Fe1.58SiO4. The lattice parameters differ only slightly from those of comparable olivines (e.g., ICDD No. 01-087-2073, kirschsteinite). Although the crystal system is monoclinic, it can almost be considered orthorhombic with α(°):β(°):γ(°) = 91:90:90. However, no entry was found in the literature regarding the incorporation of elements other than FeIII.
In iron-containing oxides like FeTiO3, which crystalizes in the R3 space group composed of FeO6- and TiO6-octahedra that share corners and edges [43], no clear evidence was found in the literature regarding whether Ta can be incorporated. One assumption would be that the same conditions apply here as for ulvospinel. It is interesting to note that the ilmenite lattice is more stable with small cations, while the perovskite lattice is more stable with larger cations ([44] and references therein). In magmatic Ti-rich intrusions and in Ti-rich blast furnace slag, ulvospinel crystals appear as higher-temperature early crystallizates and tend to form ilmenite lamellae only through exsolution and oxidation reactions at lower temperatures [34,45]. Since such processes require diffusion and are therefore kinetically inhibited, it is to be expected that no such processes will be observed in (synthetic) silicate melts during rapid cooling. While ilmenite (and pseudobrookite) are found in iron-rich fayalitic silicate melts at high Ti concentrations (<20 wt.% Ti), at medium Ti concentrations (>20 wt.% Ti) ulvospinel is favored [46].
Key takeaways
  • The literature survey shows that pyrometallurgical approaches are actually only used in combination with hydrometallurgical processes. A purely pyrometallurgical approach for the recovery of tantalum from residual materials does not seem to have been considered so far.
  • In nature, tantalum is pentavalent and is bound in the form of various oxides. It does not occur in silicates.
  • Ta is expected to be incorporated mainly in perovskite-type oxides. Due to the high availability of Si and the usually high viscosity of silicate melts, it is to be expected that part of the Ta is found in more or less amorphous pyroxene-like silicate structures.
  • Diadochic replacement of Fe cations in spinel-like oxides is plausible because of comparable ionic radii and the natural occurrence of oxides like ixiolite.
  • Ulvospinel (typical for Ti-bearing fayalitic slag) and ilmenite (only at high Ti-concentrations) probably do not incorporate much Ta as the crystal structure is not flexible enough.
  • The perovskite structure can host combinations of large, low-charge cations and small, high-charge cations, and, unlike the ilmenite structure, it is suitable for incorporating Ta5+.
Since minerals that incorporate Ti appear to be suitable target compounds for investigating the scavenging capacity for Ta, two minerals were selected from this group: ulvospinel and perovskite. Apart from their Ti content, these minerals are very different in terms of crystal structure. The strategy chosen here was to use various synthetic silicate melts with Ti as an additive as matrices for the production of the minerals. In addition, a comparison with an industrial slag of similar composition containing Ta was investigated.

3. Materials and Methods

This research aimed to determine the influence of Ti as an additive on tantalum-containing compounds in Ca- and Fe-dominated synthetic silicate melts. Therefore, two different synthetic silicate melt systems were selected. The first was a fayalitic-based composition (SFS) with the following composition (wt.%): MgO: 1.4, Al2O3: 4.5, SiO2: 31, CaO: 6.1, FeO: 57.1. The additives were divided into two groups:
(1)
CaO:TiO2 (wt.%) = 5:5, 5:7.5, 5:10.
(2)
CaO:TiO2 (wt.%) = 25:5, 25:7.5, 25:10.
In order to investigate the existence of a special Al-bearing olivine-like phase, another sample with a medium Ca content and a high Ti content was produced with the composition CaO:TiO2 (wt.%) = 15:10. The second synthetic silicate melt was a titaniferous Ca-alumosilicate-based composition (CAS) with the following composition (wt.%): MgO: 6.67, Al2O3: 10, SiO2: 33,33, CaO: 40, TiO2: 10, to which 0, 2.5, 5 and 10 wt.% FeO was added. All these mixtures contained 1 wt.% Ta (corresponding to 1.22 wt.% Ta2O5).
In order to demonstrate the current industrial/technical status, a low-iron calcium aluminate industrial slag derived from the Syncon process was processed prior to the investigation under the same heating and cooling procedure applied to the other silicate melt samples. The composition of the original industrial slag is detailed in Table 1.

3.1. Materials

Chemicals

Both synthetic silicate melt systems, SFS and CAS, were generated from the following raw materials: Fe2O3 (99.99 wt.%), reagent-grade CaO (≥95 wt.%), MgO (≥98 wt.%) sourced from Thermo Fischer GmbH (Dreieich, Germany), electrolytic Fe (≥99 wt.%) obtained from Allied Metals GmbH, commercial-grade SiO2 (≥99.99 wt.%) obtained from Heraeus Quarzglas GmbH & Co. KG (Hanau, Germany), and Al2O3 (≥99.6 wt.%) obtained from Nabaltec AG (Schwandorf, Germany). For the experiments using FeO to achieve a weight fraction of FeO in the synthetic silicate melt, 75% of Fe2O3 was mixed with 25% g of electrolytic Fe, which facilitated the formation of fayalite—in the SFS melt—and helped stabilize iron within the silicate melt phase, as indicated by [47] and [48]. The presence of both FeII and FeIII may facilitate the formation of spinel during the solidification stage, which in turn liberates silica to interact with other elements like calcium and tantalum to form perovskite and Ti-Spinel.
TiO2 was obtained from the Wacker Chemie AG (Munich, Germany). Tantalum compound in the form of Ta2O5 (99.99 wt.%) sourced from Sigma-Aldrich Chemie GmbH (Darmstadt, Germany).
The industrial slag was provided by Taniobis Smelting GmbH & Co. Kg (Goslar, Germany).

3.2. Methods

3.2.1. Thermochemical Modeling

Thermochemical modeling calculations were conducted using the FactSageTM 8.3 phase diagram and equilib modules, both utilizing FactPS (pure substances) and FToxid databases (oxide solutions and other important components) [49].
For the SFS synthetic melt, the equilib module was employed to provide an overview of the process window concerning the first precipitation phase, aiming to identify the optimal temperature range in which perovskite and ulvospinel phases are observed during the cooling procedure at equilibrium. For these calculations, the compositions of the synthetic silicate melt experiments were used (see Section 3), observing the purities of the respective compounds (see Section Chemicals). The calculations were carried out at a fixed partial pressure of 10−10 bar and temperatures increasing up to 1300 °C. Although tantalum plays a crucial role in this study, it is important to note that due to the lack of a suitable database containing thermochemical data for this element, the focus of the simulations was on the phases formed during cooling, which, according to previous studies and available data, may be enriched with tantalum [5]. Additionally, given that Ta exists as a minor element in the silicate melt phase (~1 wt.%), it is anticipated that the modeling of the silicate melt system will remain effective in elucidating the bulk mineralogy.
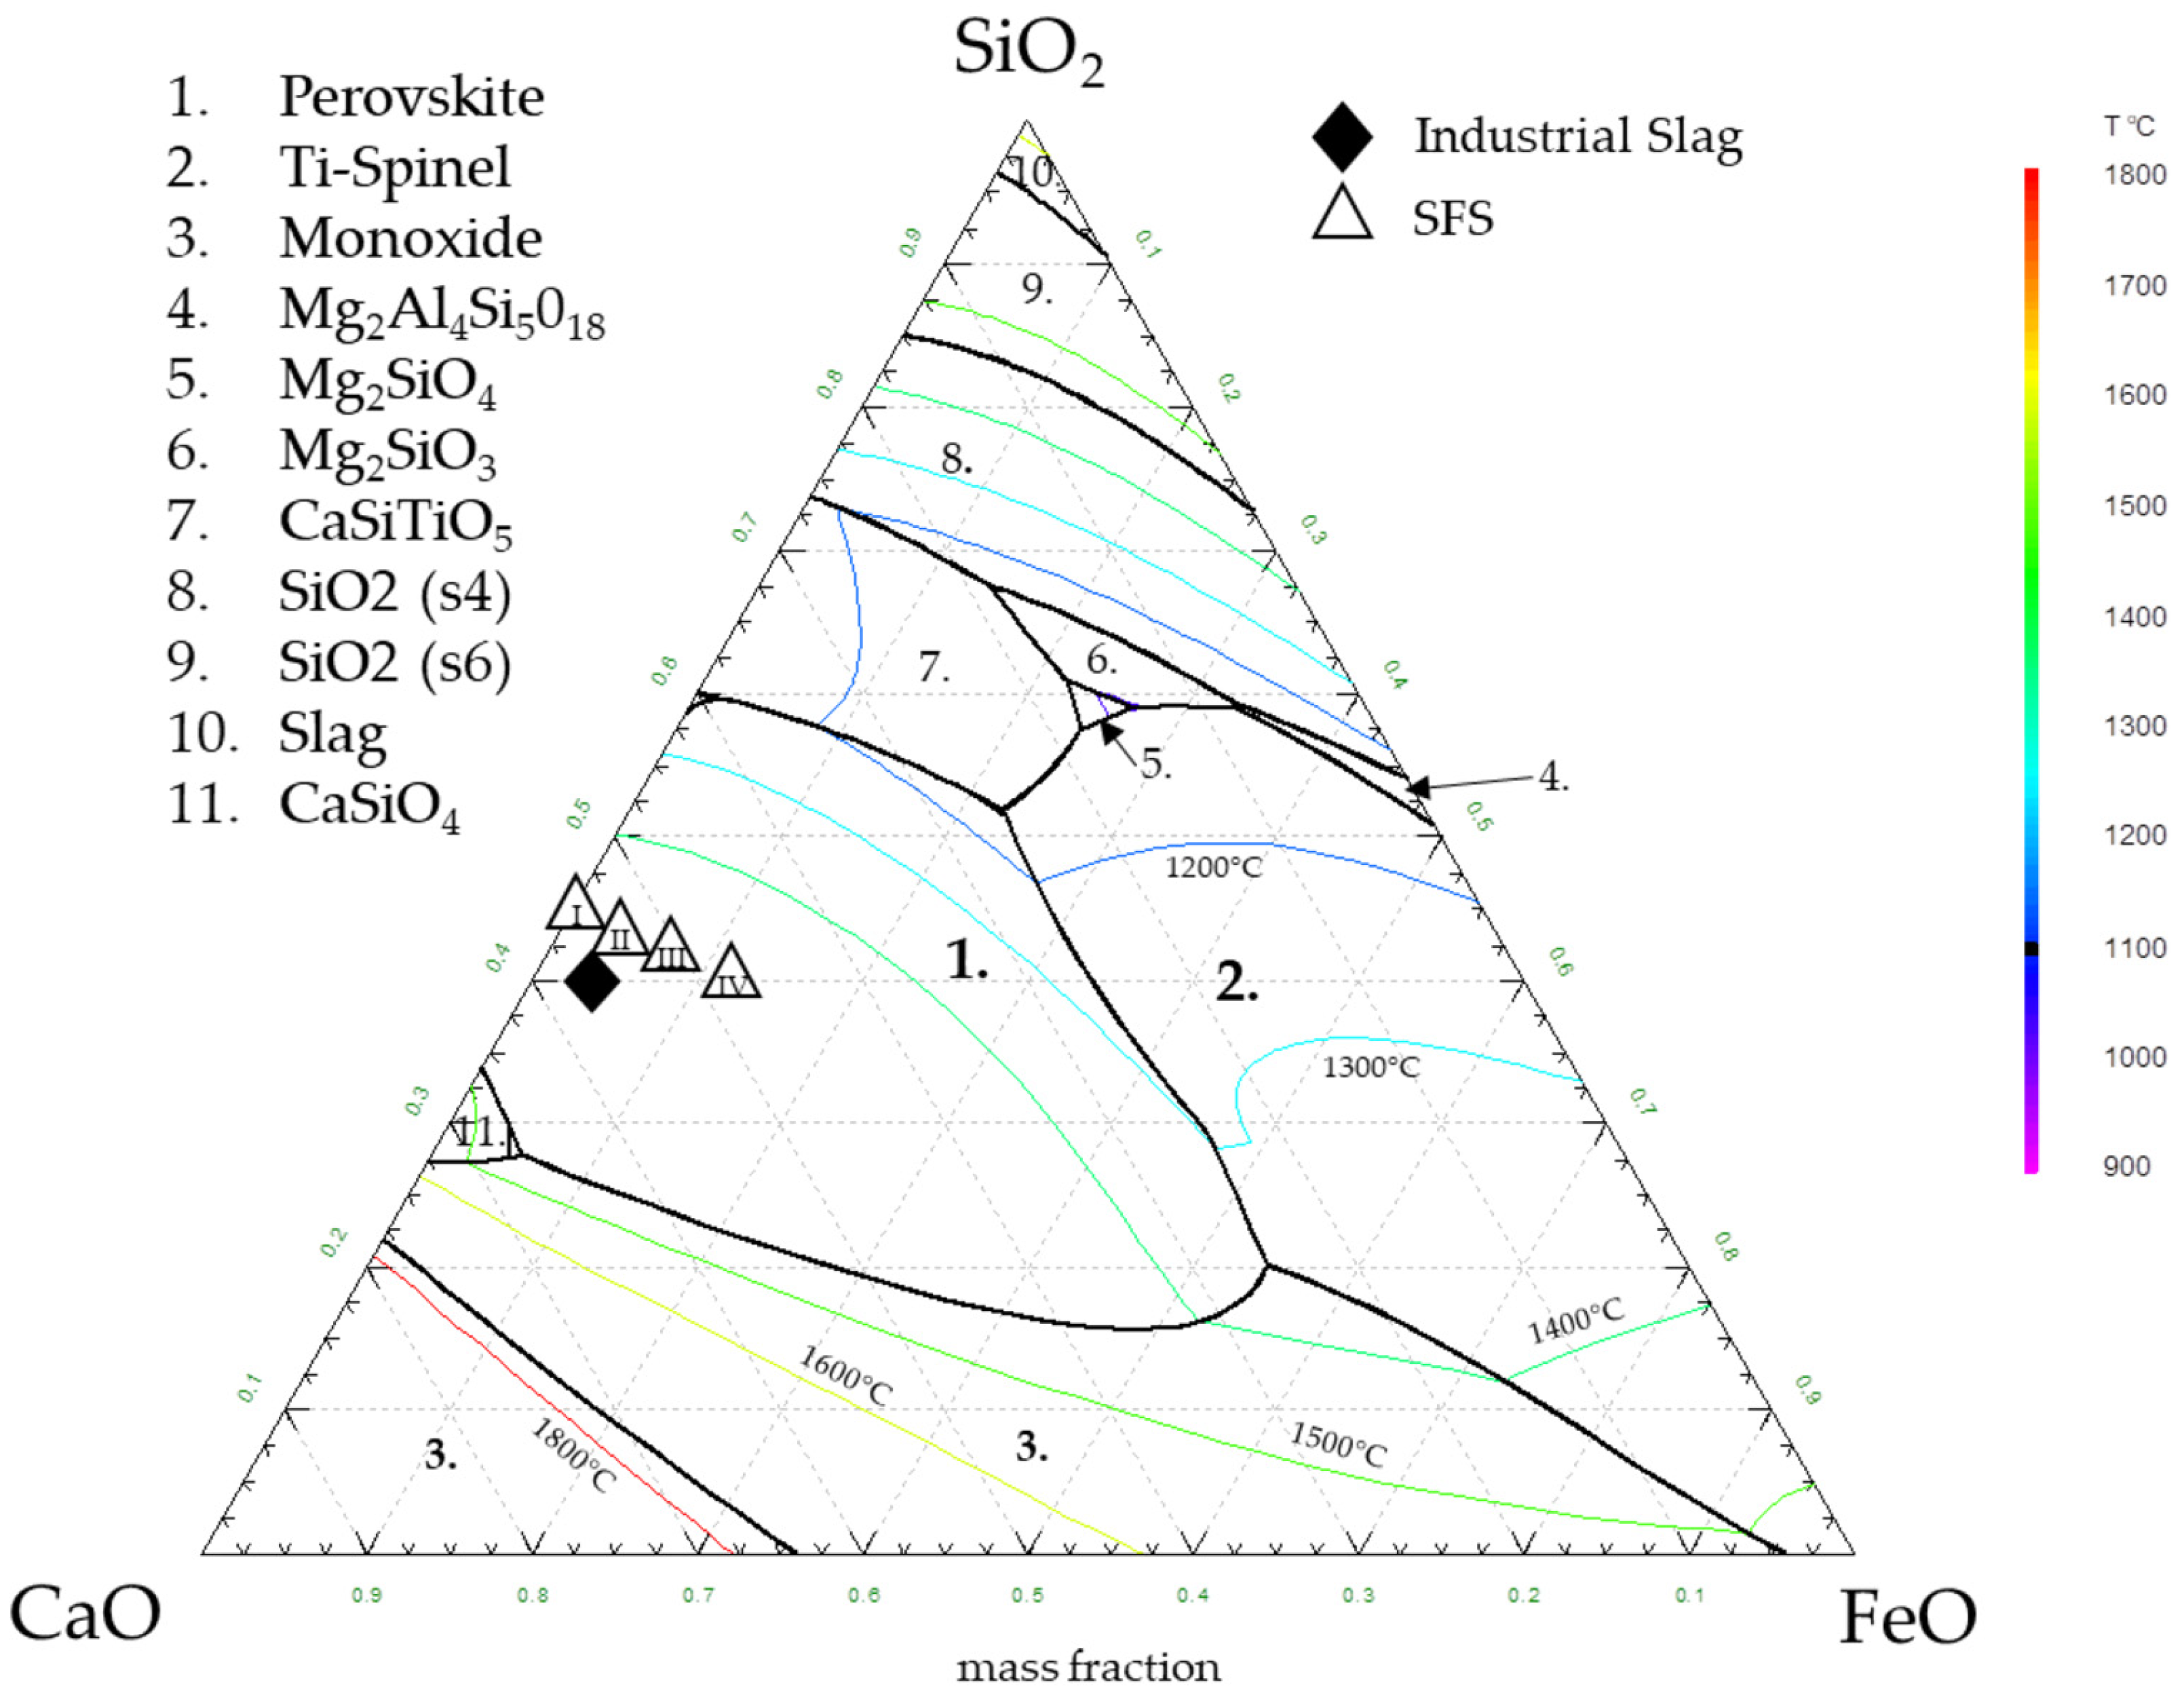
For the CAS silicate melt, a quasi-ternary phase diagram was built, in which the chemical composition of the components CaO-FeO-SiO2 is shown. The TiO2 and Al2O3 were in this case fixed at 10 wt.%, and MgO at 6.67 wt.%. The phases that form at equilibrium were placed together with isotherms increasing up to 1800 °C. This approach was utilized to identify the region where the precipitation of perovskite phase is favored, particularly in determining the boundaries concerning the raw materials and observing some important properties like melting temperature. All these observations were then considered in designing the experimental plan.

3.2.2. Experiments

The smelting trials were performed in an electric resistance heating furnace (Nabertherm HT 16/18, Liliental, Germany), which was equipped with a type S thermocouple for accurate temperature measurement. Alumina crucibles (C799) (Porzellanfabrik Hermsdorf GmbH, Hermsdorf, Germany) with an internal diameter of 5 cm were employed for the trials. All compounds were thoroughly mixed prior to being placed into the crucible.
The process consisted of three stages: heating, holding time, and controlled cooling. All of these steps were performed under an inert (argon) atmosphere. The mixture was heated at a rate of 300 °C/h under an argon atmosphere until it reached a temperature of 1450 °C for the CAS trial series and 1300 °C for the production of the SFS samples. Once the respective target process temperature was achieved, it was held for one hour to ensure a homogeneous melt. Following this holding period, a controlled cooling process was initiated at a rate of 50 °C/h down to a temperature of 1350 °C and 1050 °C for the CAS and SFS experiments, respectively. At these temperatures, an additional holding time of one hour was implemented to further promote phase stabilization and precipitation. Afterward, each sample was taken out of the furnace to cool down at room temperature. The experiment using industrial slag was performed following the same stages and cooling conditions as for the CAS silicate melt.

3.2.3. Chemical Bulk Analysis

The industrial slag was additionally analyzed using ICP-OES, as no predefined components were used here. The sample was digested with HNO3, HCl, and HF in a microwave oven (Turbowawe; MLS, Leutkirch im Allgäu, Germany). In addition, lithium tetraborate digestion (Pt crucible, 1050 °C, 20 min) was used; the material was dissolved with diluted HCl. Both solutions were analyzed using an ICP-OES 5100 Agilent instrument (Agilent Technologies Germany GmbH & Co. KG, Waldbronn, Germany).

3.2.4. Mineralogical Investigation

Bulk mineralogical composition was determined by powder diffraction (PXRD) using 12 mm diameter backloading specimens. The step size was 0.013 °2θ, the measurement time per step was 78.9 s (determined using an excelerator multiple strip detector), and the angular range was 5–100 °2θ. A PANalytical X-Pert Pro diffractometer equipped with a Co-X-Ray tube with a 40 kV/40 mA setting (Malvern Panalytical GmbH, Kassel, Germany) was used. Identification was performed using the pdf-2 ICCD XRD database [50], the open crystal database [51] (COD, version 8/26/24) and the Materials Project [52]. Rietveld refinement was carried out manually using the built-in Rietveld module of Malvern Panalytical X’Pert Highcore PlusTM (Version 5.2, 30 January 2023) using the structural information of appropriate phases of COD.
Spatially resolved point and line analysis of crystals and grains was performed using electron probe microanalysis (EPMA) on polished blocks in epoxy resin coated with carbon. Chemical characterization of individual points or line scans was performed using wavelength-dispersive or energy-dispersive X-ray fluorescence (WDX or EDX). Electron optical images were generated using backscattered electron images with atomic number contrast (BSE-Z). Measurements were performed with a Cameca SX FIVE FE Field Emission electron probe equipped with a Schottky electron emitter, SE and BSE detectors, and five wavelength-dispersive (WDX) spectrometers (CAMECA SAS; Gennevilliers Cedex, France). The points of the synthetic silicate melt samples were analyzed for the elements/lines Mg/Kα, Al/Kα, Si/Kα, Ca/Kα, Ti/Kα, Cr/Kα, Fe/Kα, and Ta/Lα using an appropriate set of analytical crystals. For the industrial slag, additionally, the elements/lines V/Kα, Nb/Lα, Sn/Lα and W/Lα were included. Reference materials from P&H Developments Ltd. (Glossop, Derbyshire, UK) and Astimex Standards Ltd. (Toronto, ON, Canada) were used for calibration. The beam size setting was 0 (zero), which allowed a diameter well below 1 µm (Schottky-type beam diameter; see, e.g., Jercinovic et al. [53]). Matrix correction was performed using the X-PHI model [54].

4. Results

Two series of synthetic silicate melt samples were examined in these investigations. The focus was on the behavior of tantalum in Fe- and Ca-dominated regimes with Ti as an additive. In the Fe-dominated sample series, the Ti content was varied in order to trigger ulvospinel formation. In the Ca-dominated sample series, the influence of lower Fe contents (<10 wt.%) on perovskite formation was investigated at a constant Ti content. All silicate melts were mixed with 1 wt.% Ta (corresponding to 1.22 wt.% Ta2O5).

4.1. Thermochemical Modeling and Chosen Silicate Melt Systems

As described in Section 3.2.1, the performed thermochemical simulations were divided into two segments: a quasi-ternary diagram performed for the CAS slags and industrial slag, and equilibrium phases in the cooling strategy for the SFS trials.

4.1.1. Simulations for SFS Experiments

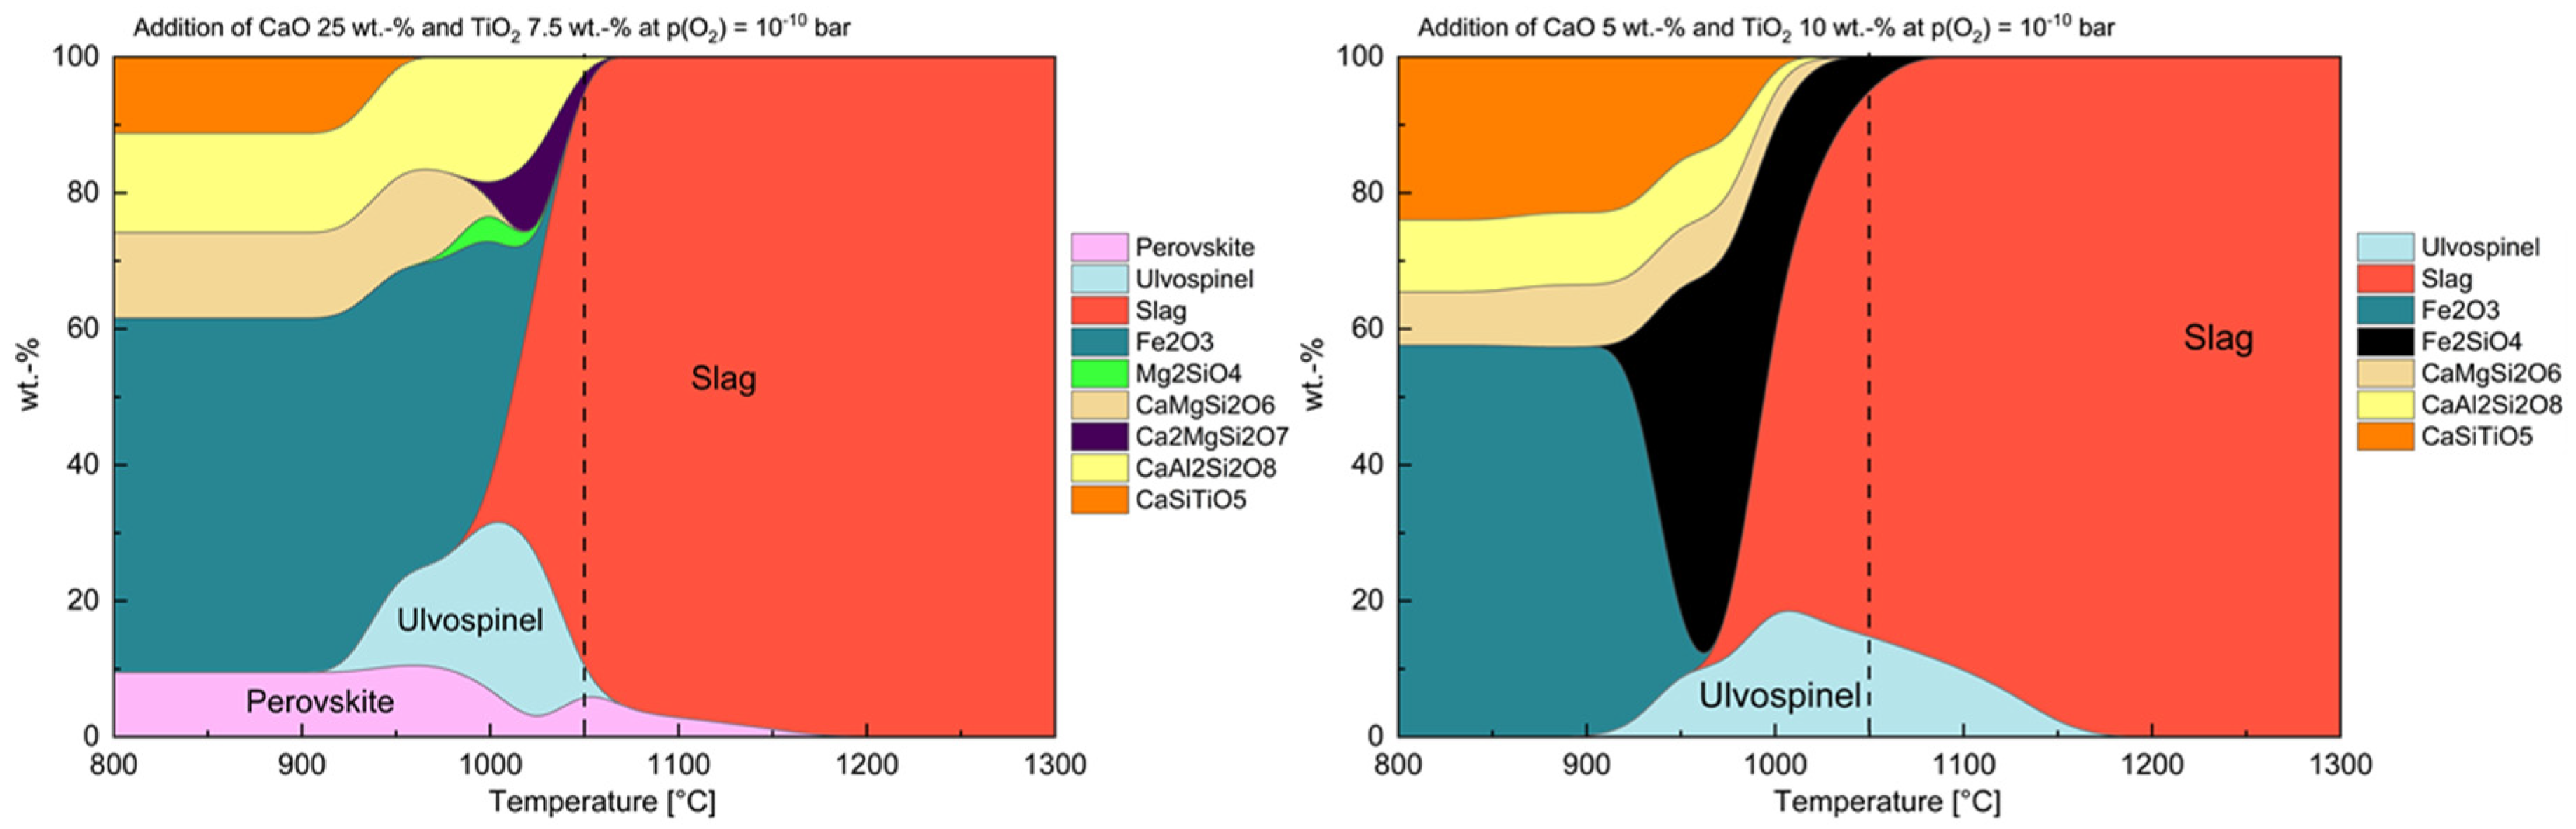
For all additions investigated for the SFS, a fully liquid state is predicted at equilibrium (1300 °C). Upon cooling, the first solid phases to precipitate are the two studied EnAMs, ulvospinel and perovskite, depending primarily on the addition content of Ca and Ti and the temperature interval. Figure 1 shows the results for two particular compositions from Section 3. The graphs correspond to the additions for which perovskite (left) and ulvospinel (right) are thermochemically favored at the selected cooling conditions. According to the simulations, perovskite forms particularly at CaO additions of 25 wt.% (Figure 1 left), while for TiO2 additions higher than those for CaO, ulvospinel precipitation is greater (Figure 1 right). For the additions of 25 wt.% CaO, both of these phases precipitate concurrently over a significant temperature interval. Given this concurrent precipitation, the temperature interval selected for studying Ta enrichment in the EnAM must represent a compromise. Since perovskite and ulvospinel constitute the primary phases of interest for targeting Ta enrichment, maintaining a limited number of precipitated phases at determined temperatures is essential. The value of 1050 °C (dashed line) offers sufficient perovskite precipitation while restricting ulvospinel formation and maintaining a partially molten silicate melt, whereas the precipitation of additional phases like hematite and Ca-bearing phases can introduce further complexity and potentially compromise the clear interpretation of tantalum behavior in the slag system.
It is important to note that the performed thermochemical simulations did not consider heating or cooling rates but were calculated under equilibrium conditions. Consequently, the cooling rate was effectively infinitely slow. The transition temperatures were those determined by the calculations performed using FactSageTM, where new phases formed during the cooling of the melt.

4.1.2. Simulations for CAS and Industrial Slag Experiments

Figure 2 shows the CaO-SiO2-FeO-Al2O3-TiO2 quasi-ternary diagram with calculated isotherms. The phases that form at equilibrium are graphically represented. The main points of interest in this study are regions 1 and 2, which correspond to perovskite and Ti-spinel, respectively. Together with the monoxide phase (CaO and FexO), these constitute the primary regions, which can be observed by adding only FeO to the silicate melt system. The different points (I, II, III and IV) shown in the diagram depict the different compositions of the samples in the Ca-dominated silicate melt system (see Section 3) with increasing FeO addition. As depicted, the different compositions of the samples lie in the area where perovskite (Figure 1 left) should precipitate below the isotherms between 1500 °C and 1400 °C, demonstrating that at equilibrium the first precipitation phase below the liquidus temperature is perovskite. The composition of the industrial slag, represented in the phase diagram by a black-colored lozenge, also lies in area 1. (Figure 2), with a liquidus temperature very close to that of the CAS. For this slag, other phases are expected to co-precipitate thermochemically and may therefore form a solid solution with perovskite, since the industrial slag contains additional components that are not considered in Figure 1 (see Table 1). In silicate melt systems featuring 15 wt.% of MgO or a total CaO + MgO content of 55 wt.%, the thermochemical calculations are predicted to estimate melting temperatures that are 105 °C to 180 °C higher than those observed in the experimental data. However, since such temperatures were not observed in the silicate melt systems examined in this study, such significant variation in the predicted liquidus temperature can be disregarded. Considering all this, the cooling procedure for both types of samples (CAS and industrial) can be set to begin at 1450 °C, slightly higher that the effective liquidus temperature of the SFS, to guarantee full melting of the precursor compounds. It is also possible to observe that while increasing FeO addition, the perovskite phase fraction may increase. While these results provide important evidence, it is still essential to elucidate, from a metallurgical standpoint, how this precipitated phase can be enhanced and thermodynamically favored, assuming that it constitutes a potential tantalum-enriched phase. Whether this can indeed lead to greater tantalum accumulation, and therefore enhance the EnAM, will be discussed in the next results.

4.2. Mineralogical Characterization of the Synthetic Silicate Melts

Visualization and evaluation of morphology were performed using backscattered electron micrographs with z-contrast (BSE-Z). The overview of the main phase composition was investigated using powder X-ray-diffraction (PXRD) patterns. Finally, detailed characterization of single crystals/grains was performed using spatially resolved analysis with wavelength-dispersive X-ray fluorescence (WDX) and electron beam excitation. With respect to the PXRD, the SFS series can be divided into two groups:
(1)
Low Ca: CaO:TiO2 (wt.%) = 5:5, 5:7.5, 5:10.
(2)
High Ca: CaO:TiO2 (wt.%) = 25:5, 25:7.5, 25:10.
With respect to the PXRD in the CAS series, a uniform change in phase composition can be observed with increasing Fe content—these compositions are therefore discussed in this order.
This grouping is used throughout the different sections on the mineralogical characterization (morphology, PXRD, and spatial analysis).
Finally, the results for industrial slag are presented.

4.2.1. Morphology

  • Fe-Dominated Synthetic Silicate Melt Series (SFS)
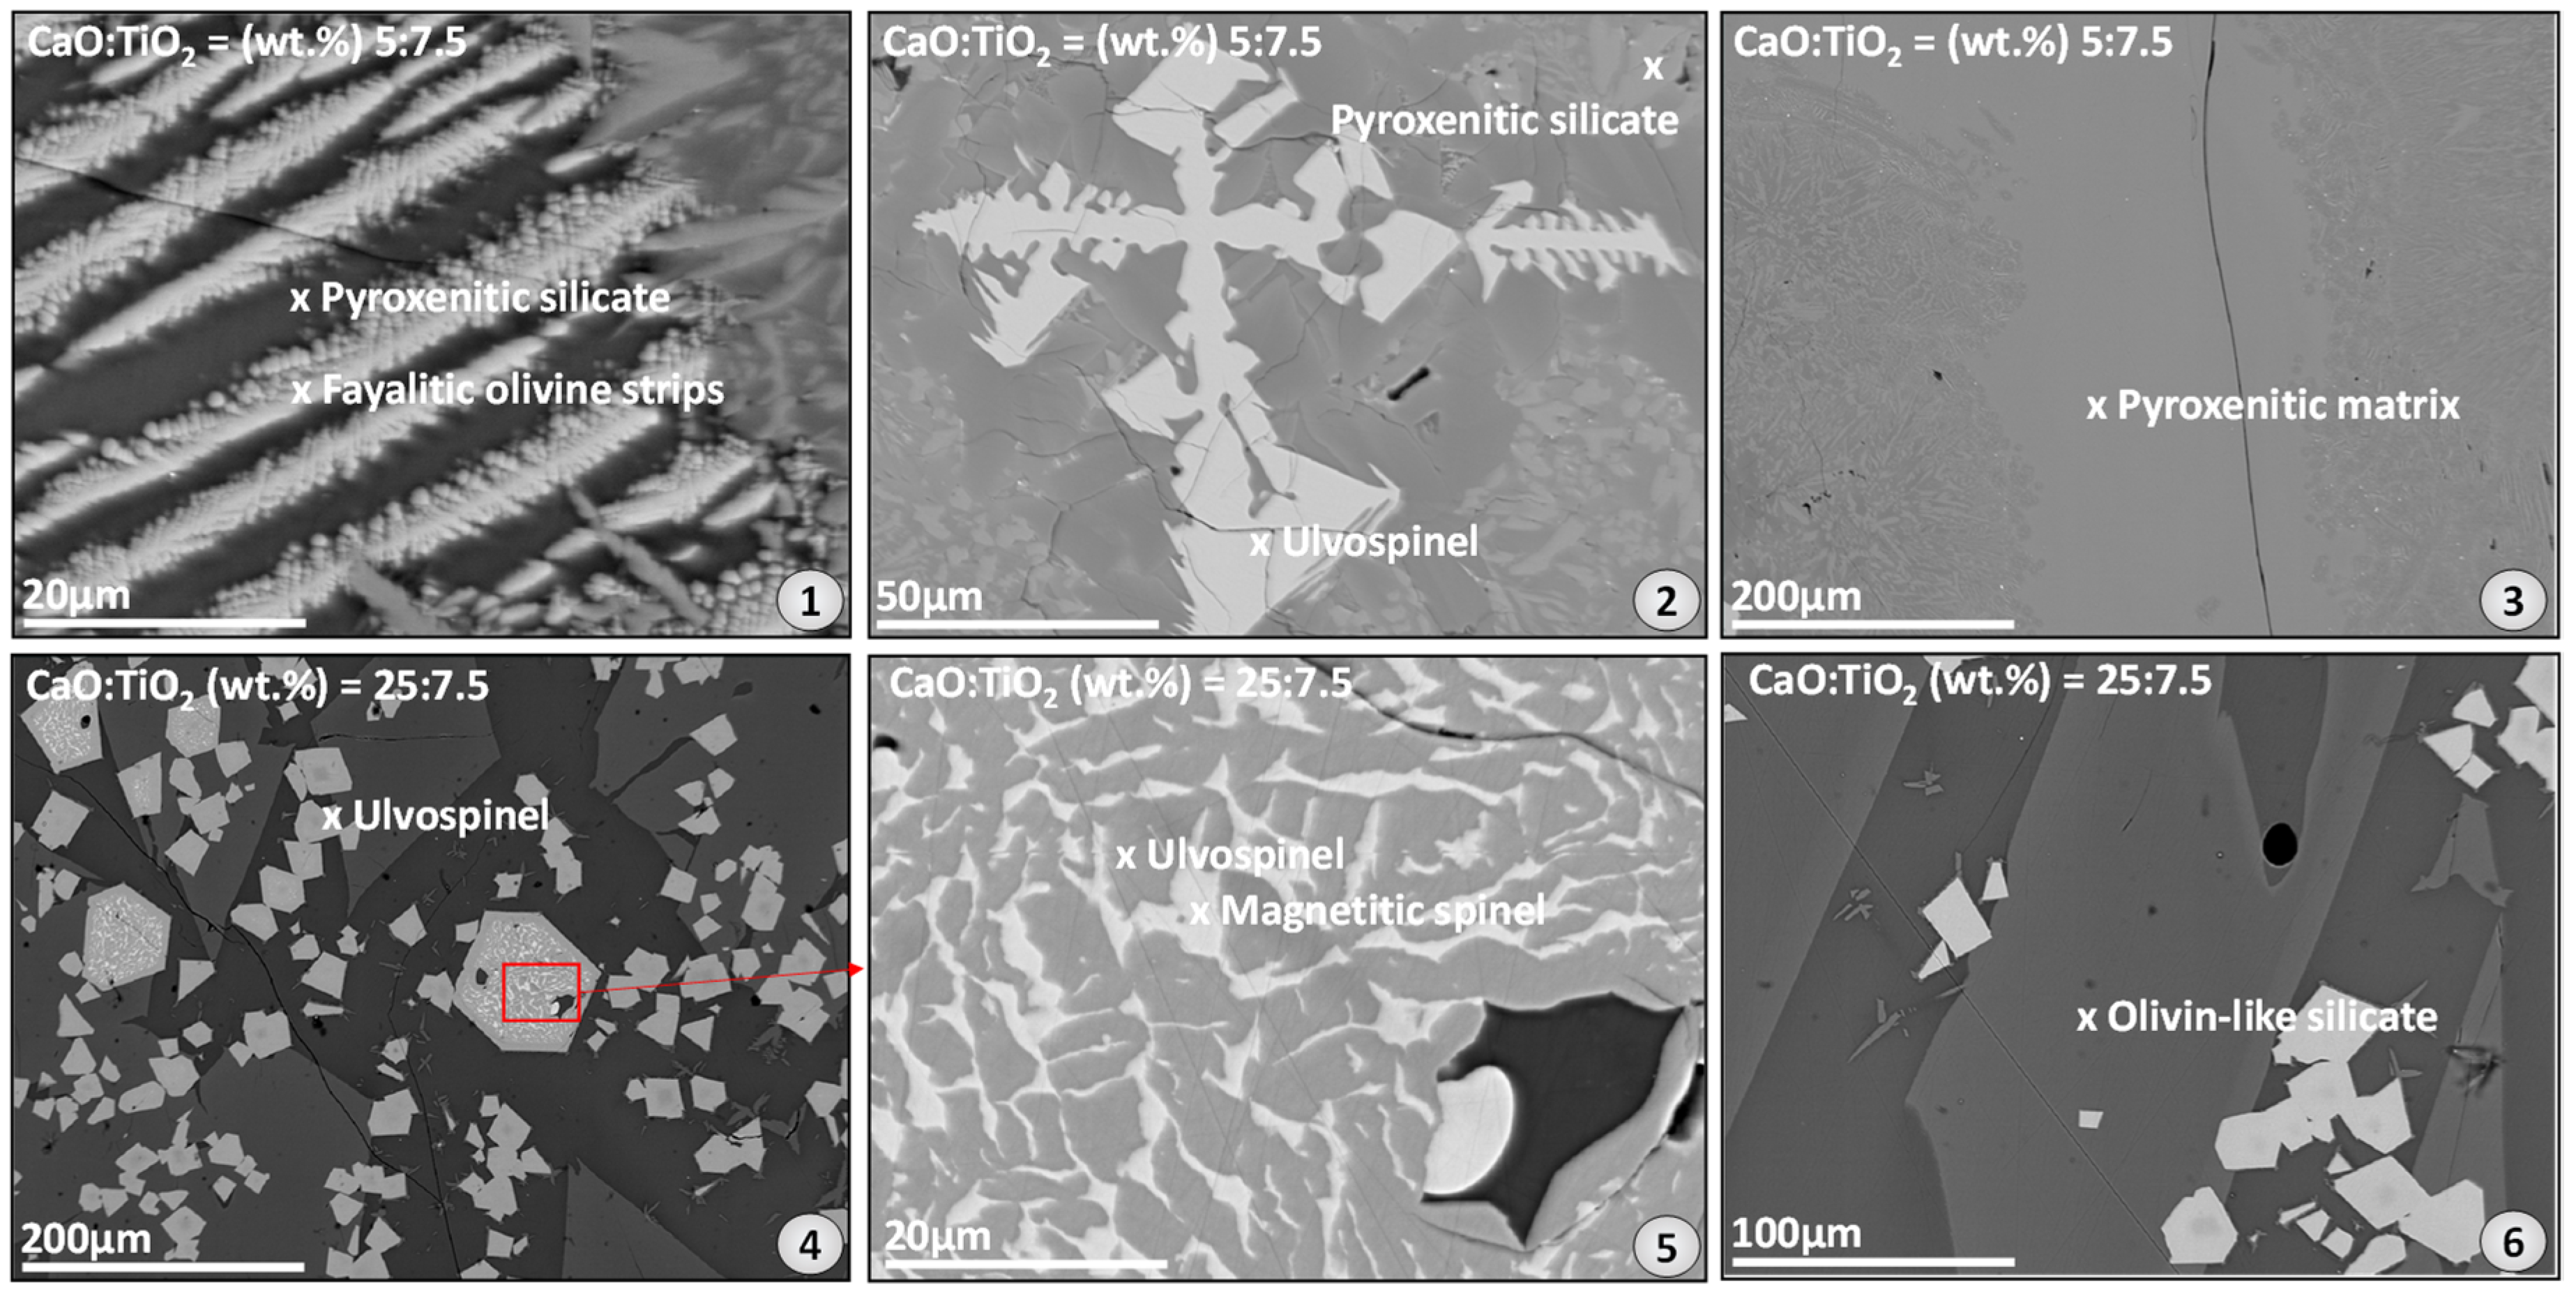
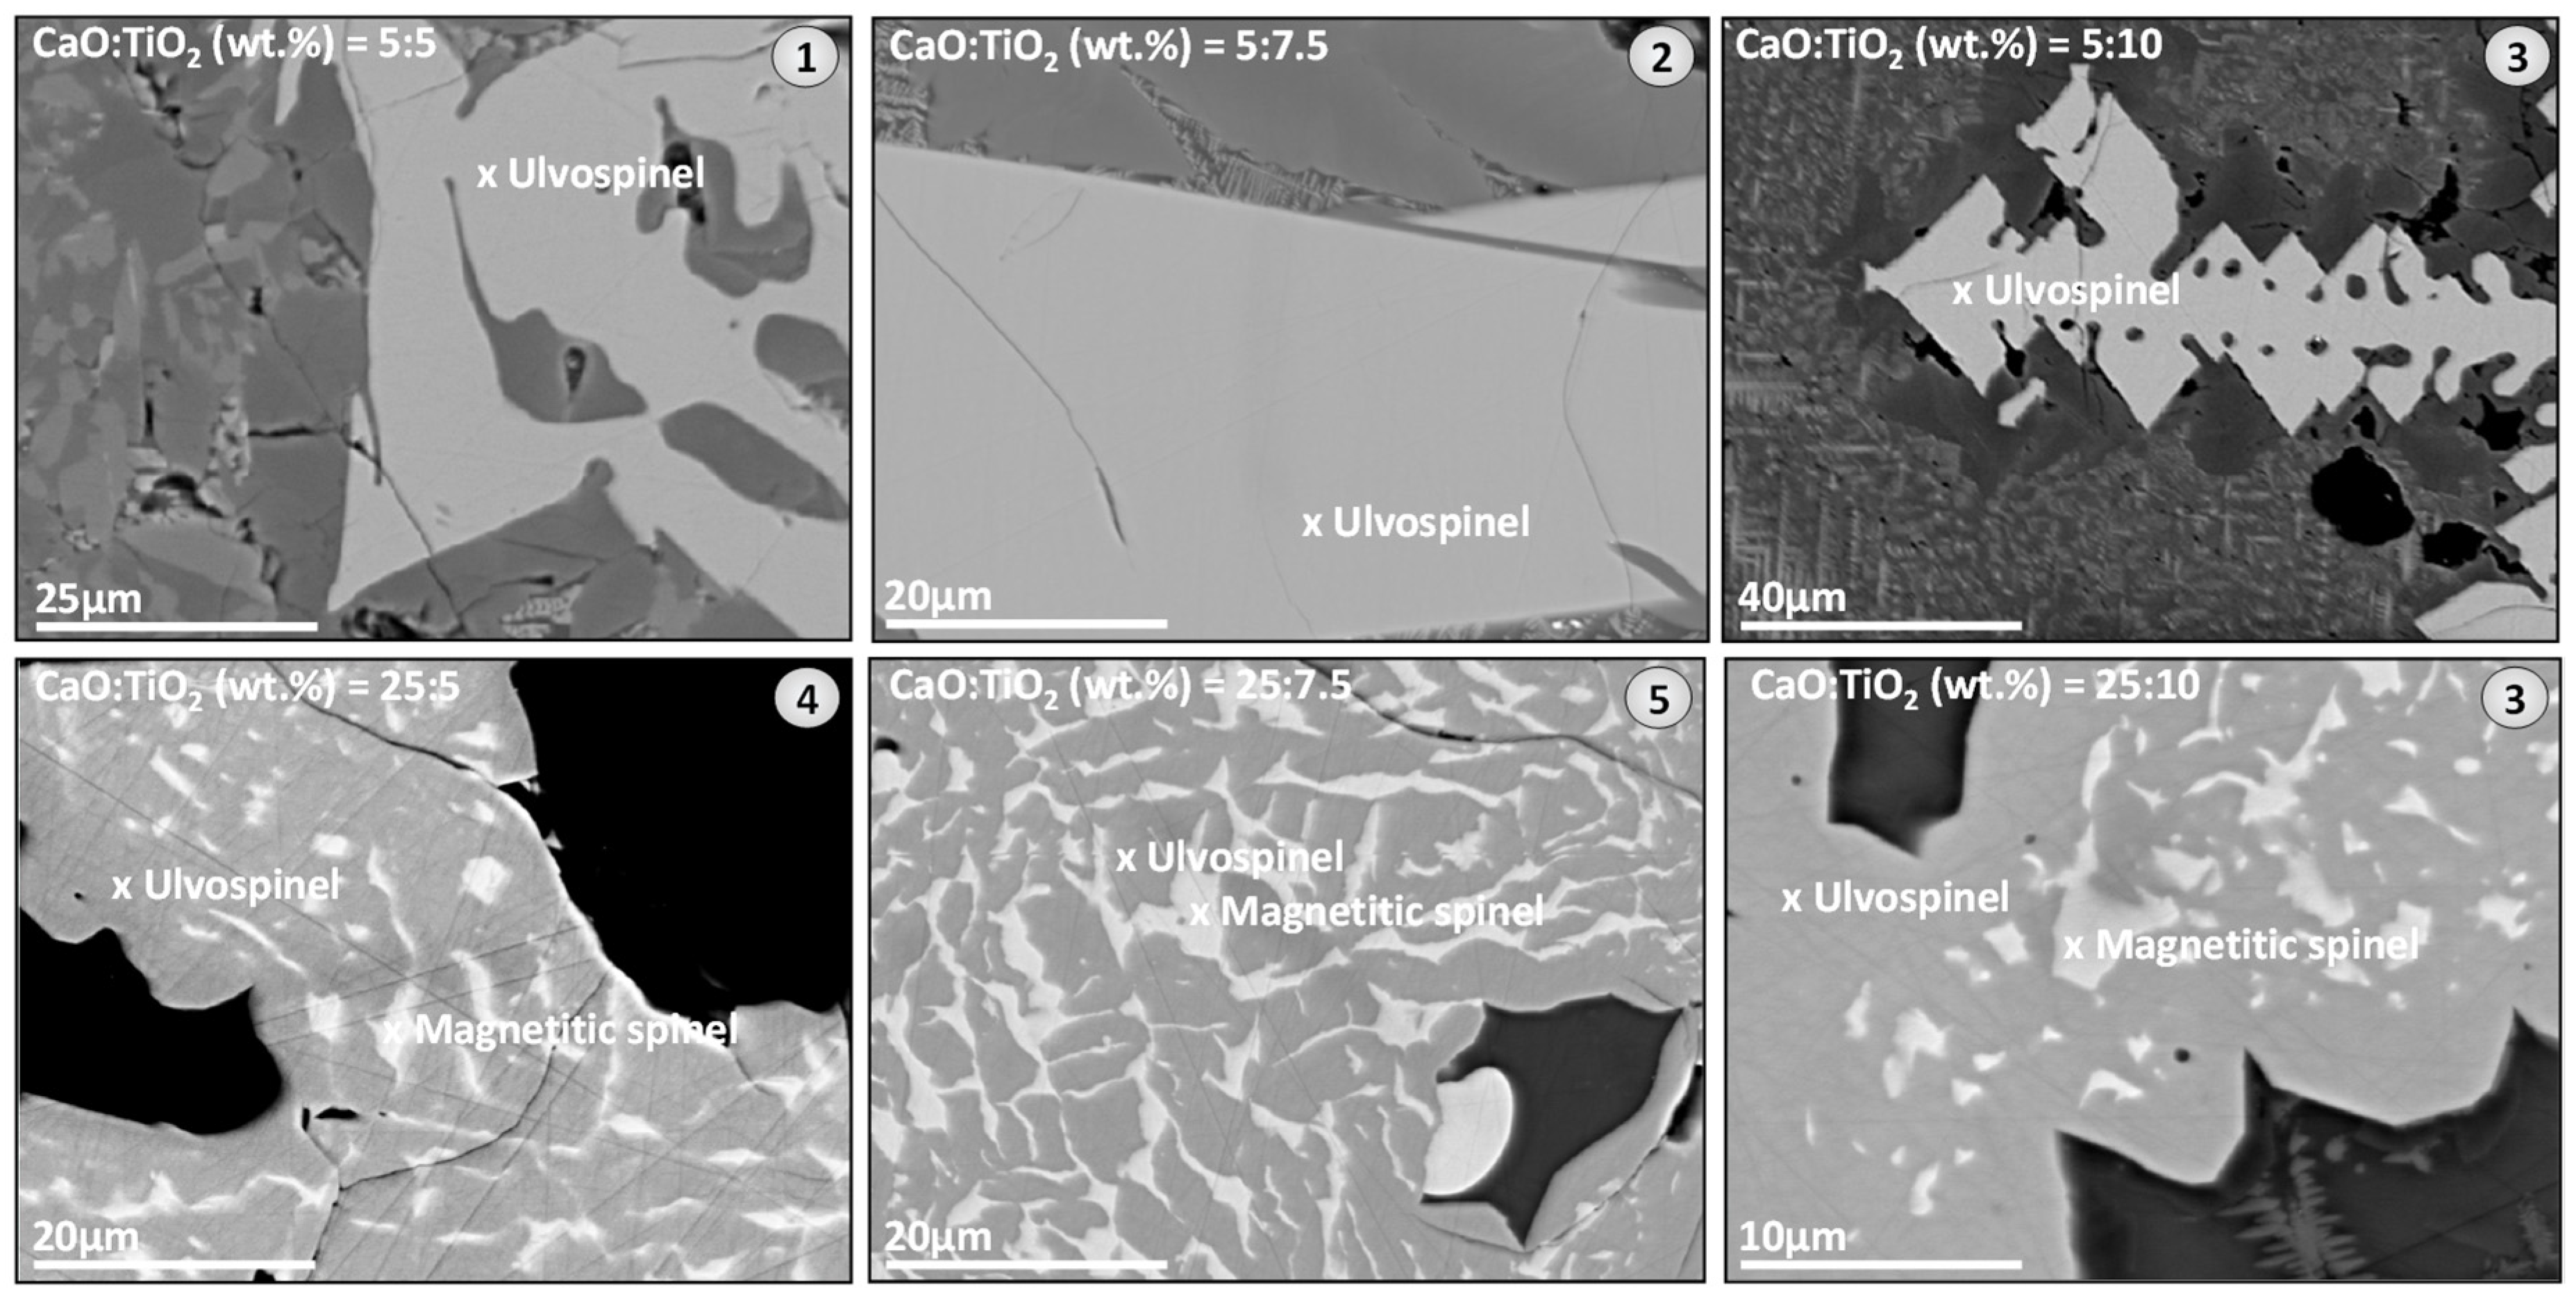
Large ulvospinel crystals are noticeable in all silicate melt variants (Figure 3(1–6)). They form primary crystallizates. In the silicate melt with the low Ca content, the spinels are partly hypidiomorphic and skeleton-like in appearance (Figure 3(1–3)). At 25 wt.% CaO addition, only idiomorphic crystals can be seen. The segregation of a lighter gray phase in the larger ulvospinel crystals of the most calcium-rich sample (e.g., CaO:TiO2 (wt.%) = 25:7.5) is striking (Figure 3(4–6)).
In the sample with a low Ca content, i.e., the highest Fe:Ca ratio, distinctive bands of fayalitic olivine are visible. In the sample with a high Ca content, another idiomorphic-to-hypidomorphic mineral compound occurs alongside spinel and matrix. This is a Ca-rich olivine-type structured compound with a roughly kirschteinite–monticellite composition.
  • Ca-Alumosilicate Melt Series (CAS)
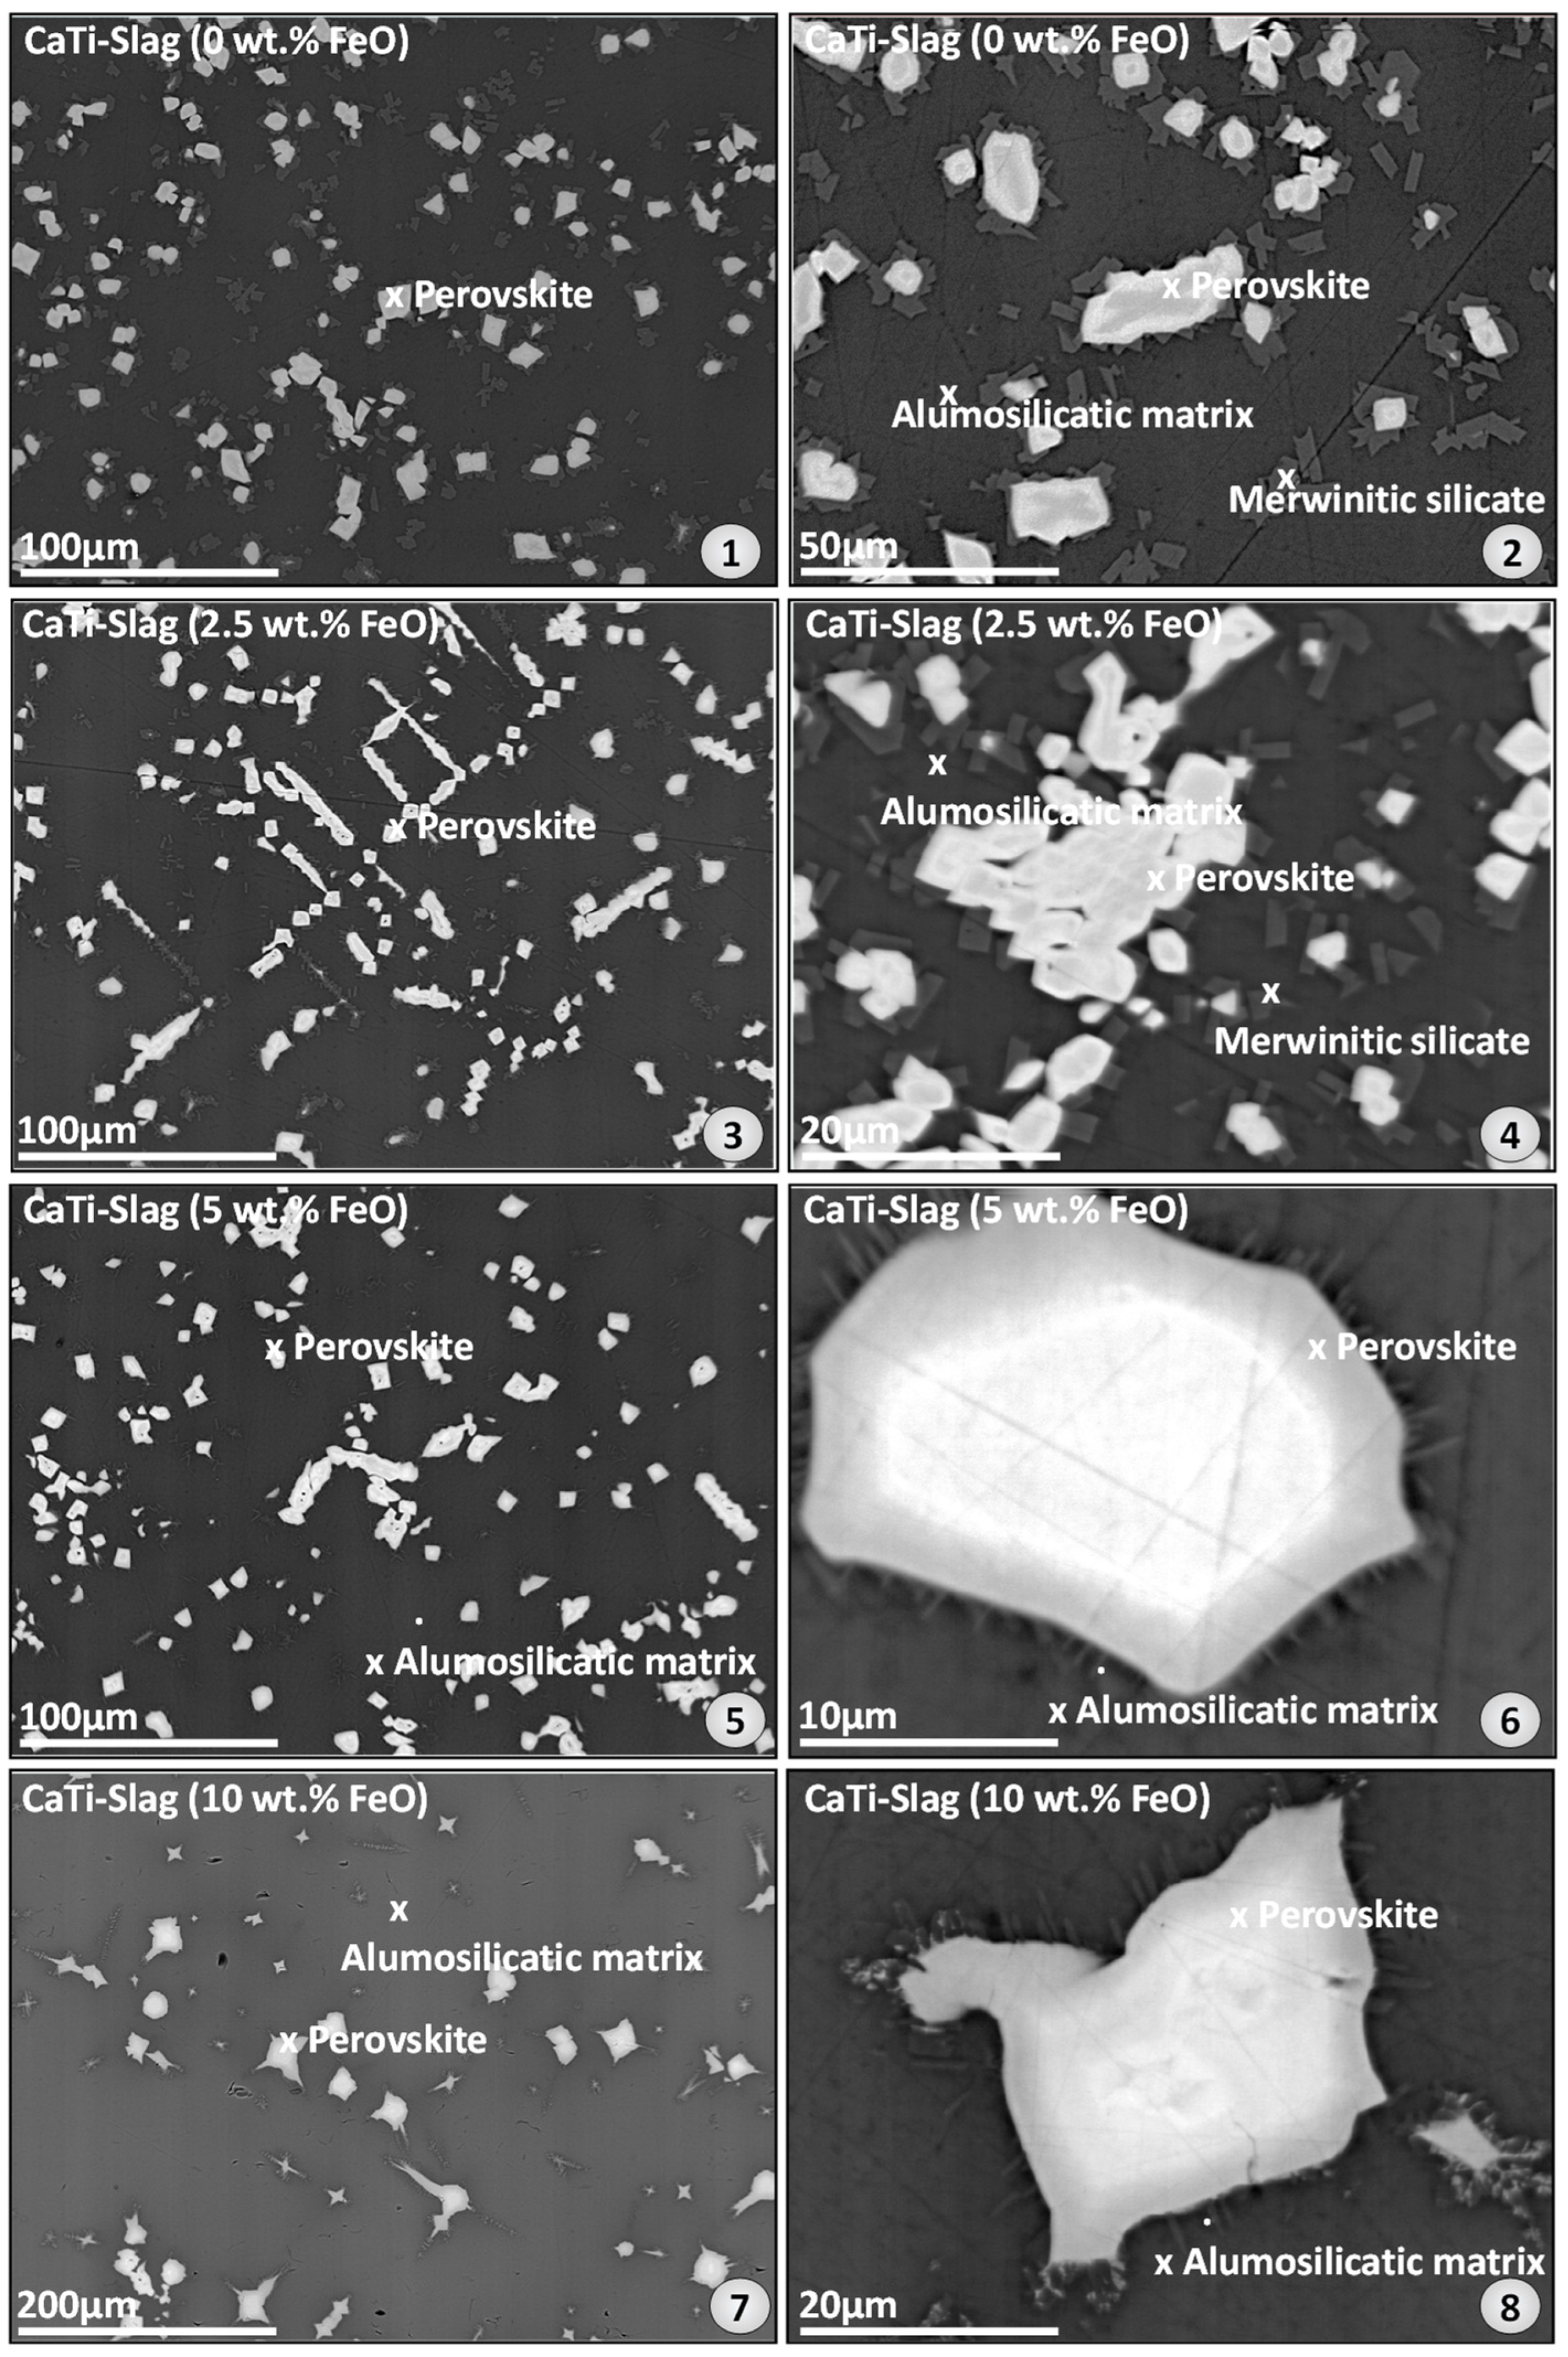
These samples contained idiomorphic-to-hypidiomorphic or partly skeletal perovskite crystals in a fine-grained-to-amorphous merwinite/Ca-alumosilicate matrix (Figure 4(1–8)). As the Fe content increases, the perovskite crystals grow larger and the merwinite crystals (Figure 4(1–4)) disappear almost completely from the matrix, leaving behind a uniform alumosilicate mass (Figure 4(5–8)). There are lighter and darker areas in the perovskite crystals, indicating an uneven distribution of elements. Darker areas are particularly noticeable at the edges of the Fe-richest sample (Figure 4(8)).
  • Industrial low-iron Ca-alumosilicate slag from the Syncon process
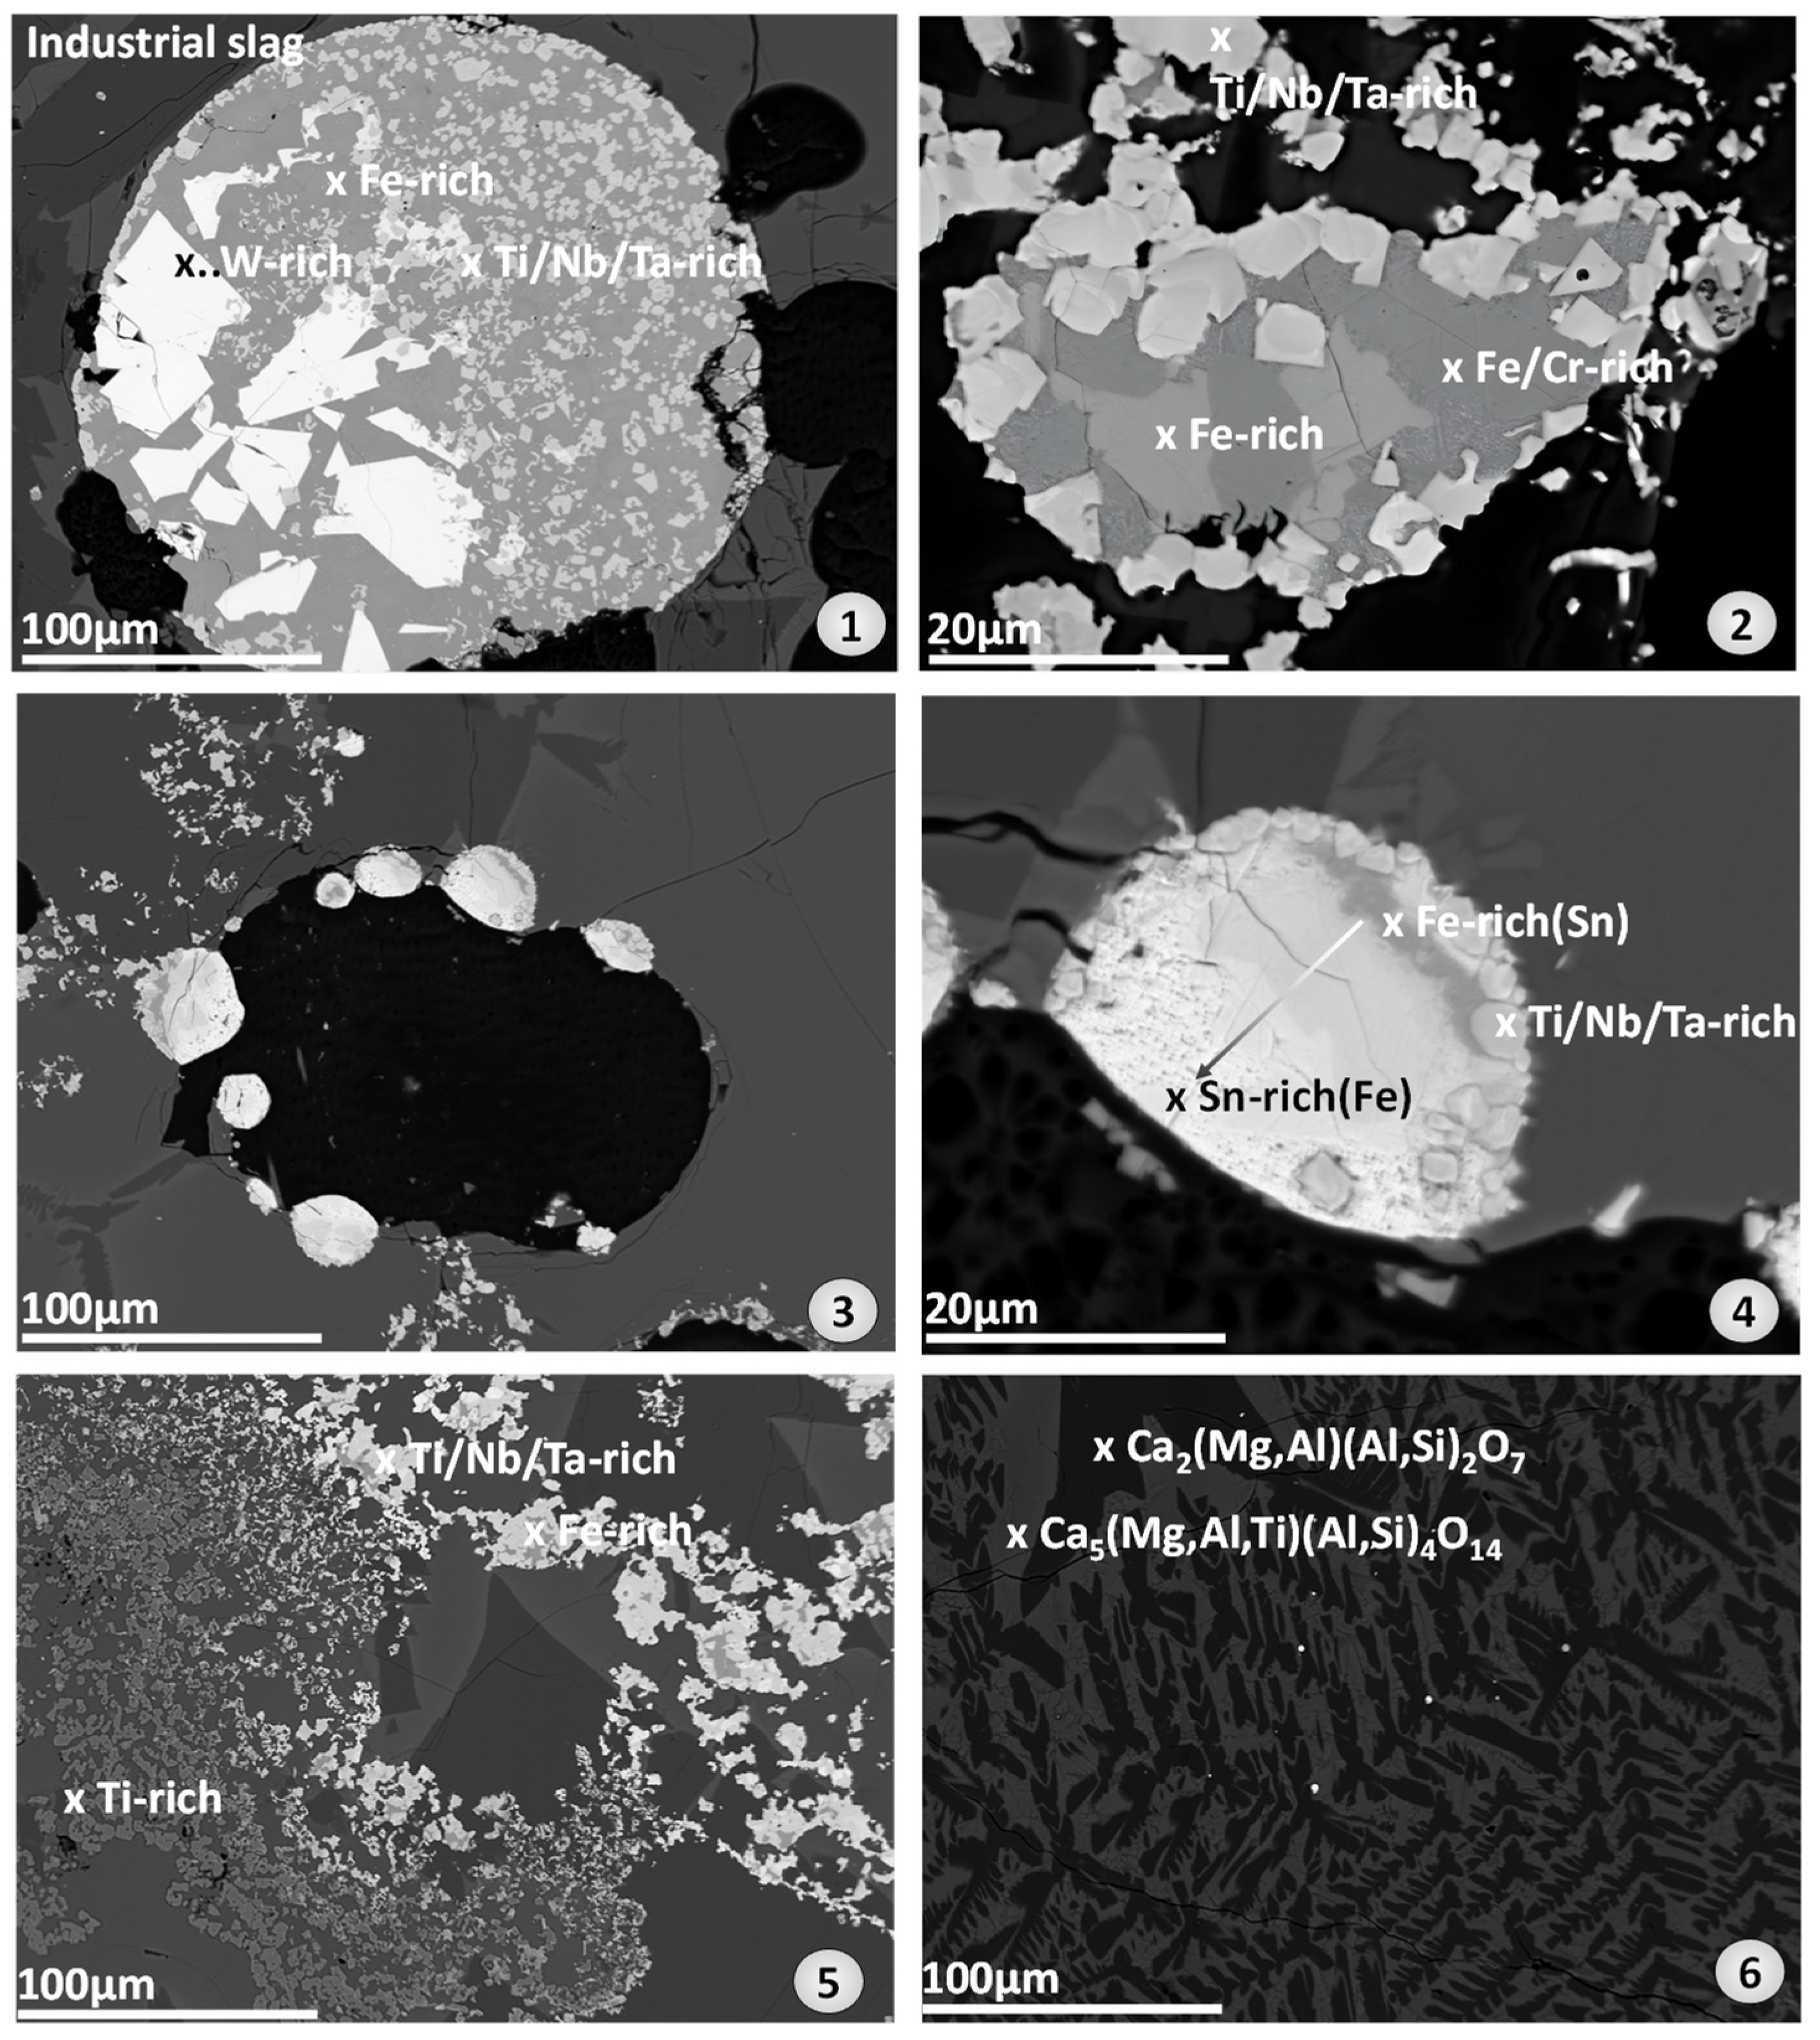
The calcium aluminate silicate matrix of this sample contained agglomerates with enrichments of heavy elements. The combinations are Cr, Fe, and W (Figure 5(1)); Ti, Nb, and Ta (Figure 5(1–5)); and Fe and Sn (Figure 5(3,4)). These agglomerates are spheroidal, drop-shaped, or flat and exhibit very complex structures. This morphology indicates that the components containing heavy elements did not dissolve very well in the slag. The matrix (Figure 5(6)) consists of Ti-free Al-akermanite (Ca2(Mg,Al)(Al,Si)2O7) and a Ti-containing akermannitic alumosilicate (Ca5(Mg,Al,Ti)(Al,Si)4O14).

4.2.2. Detailed Phase Analysis

This subsection begins with an overview of the phase composition, determined using PXRD. Based on these results, individual points were examined for their chemical composition using EPMA.
  • Qualitative Bulk Phase Composition with PXRD
SFS series
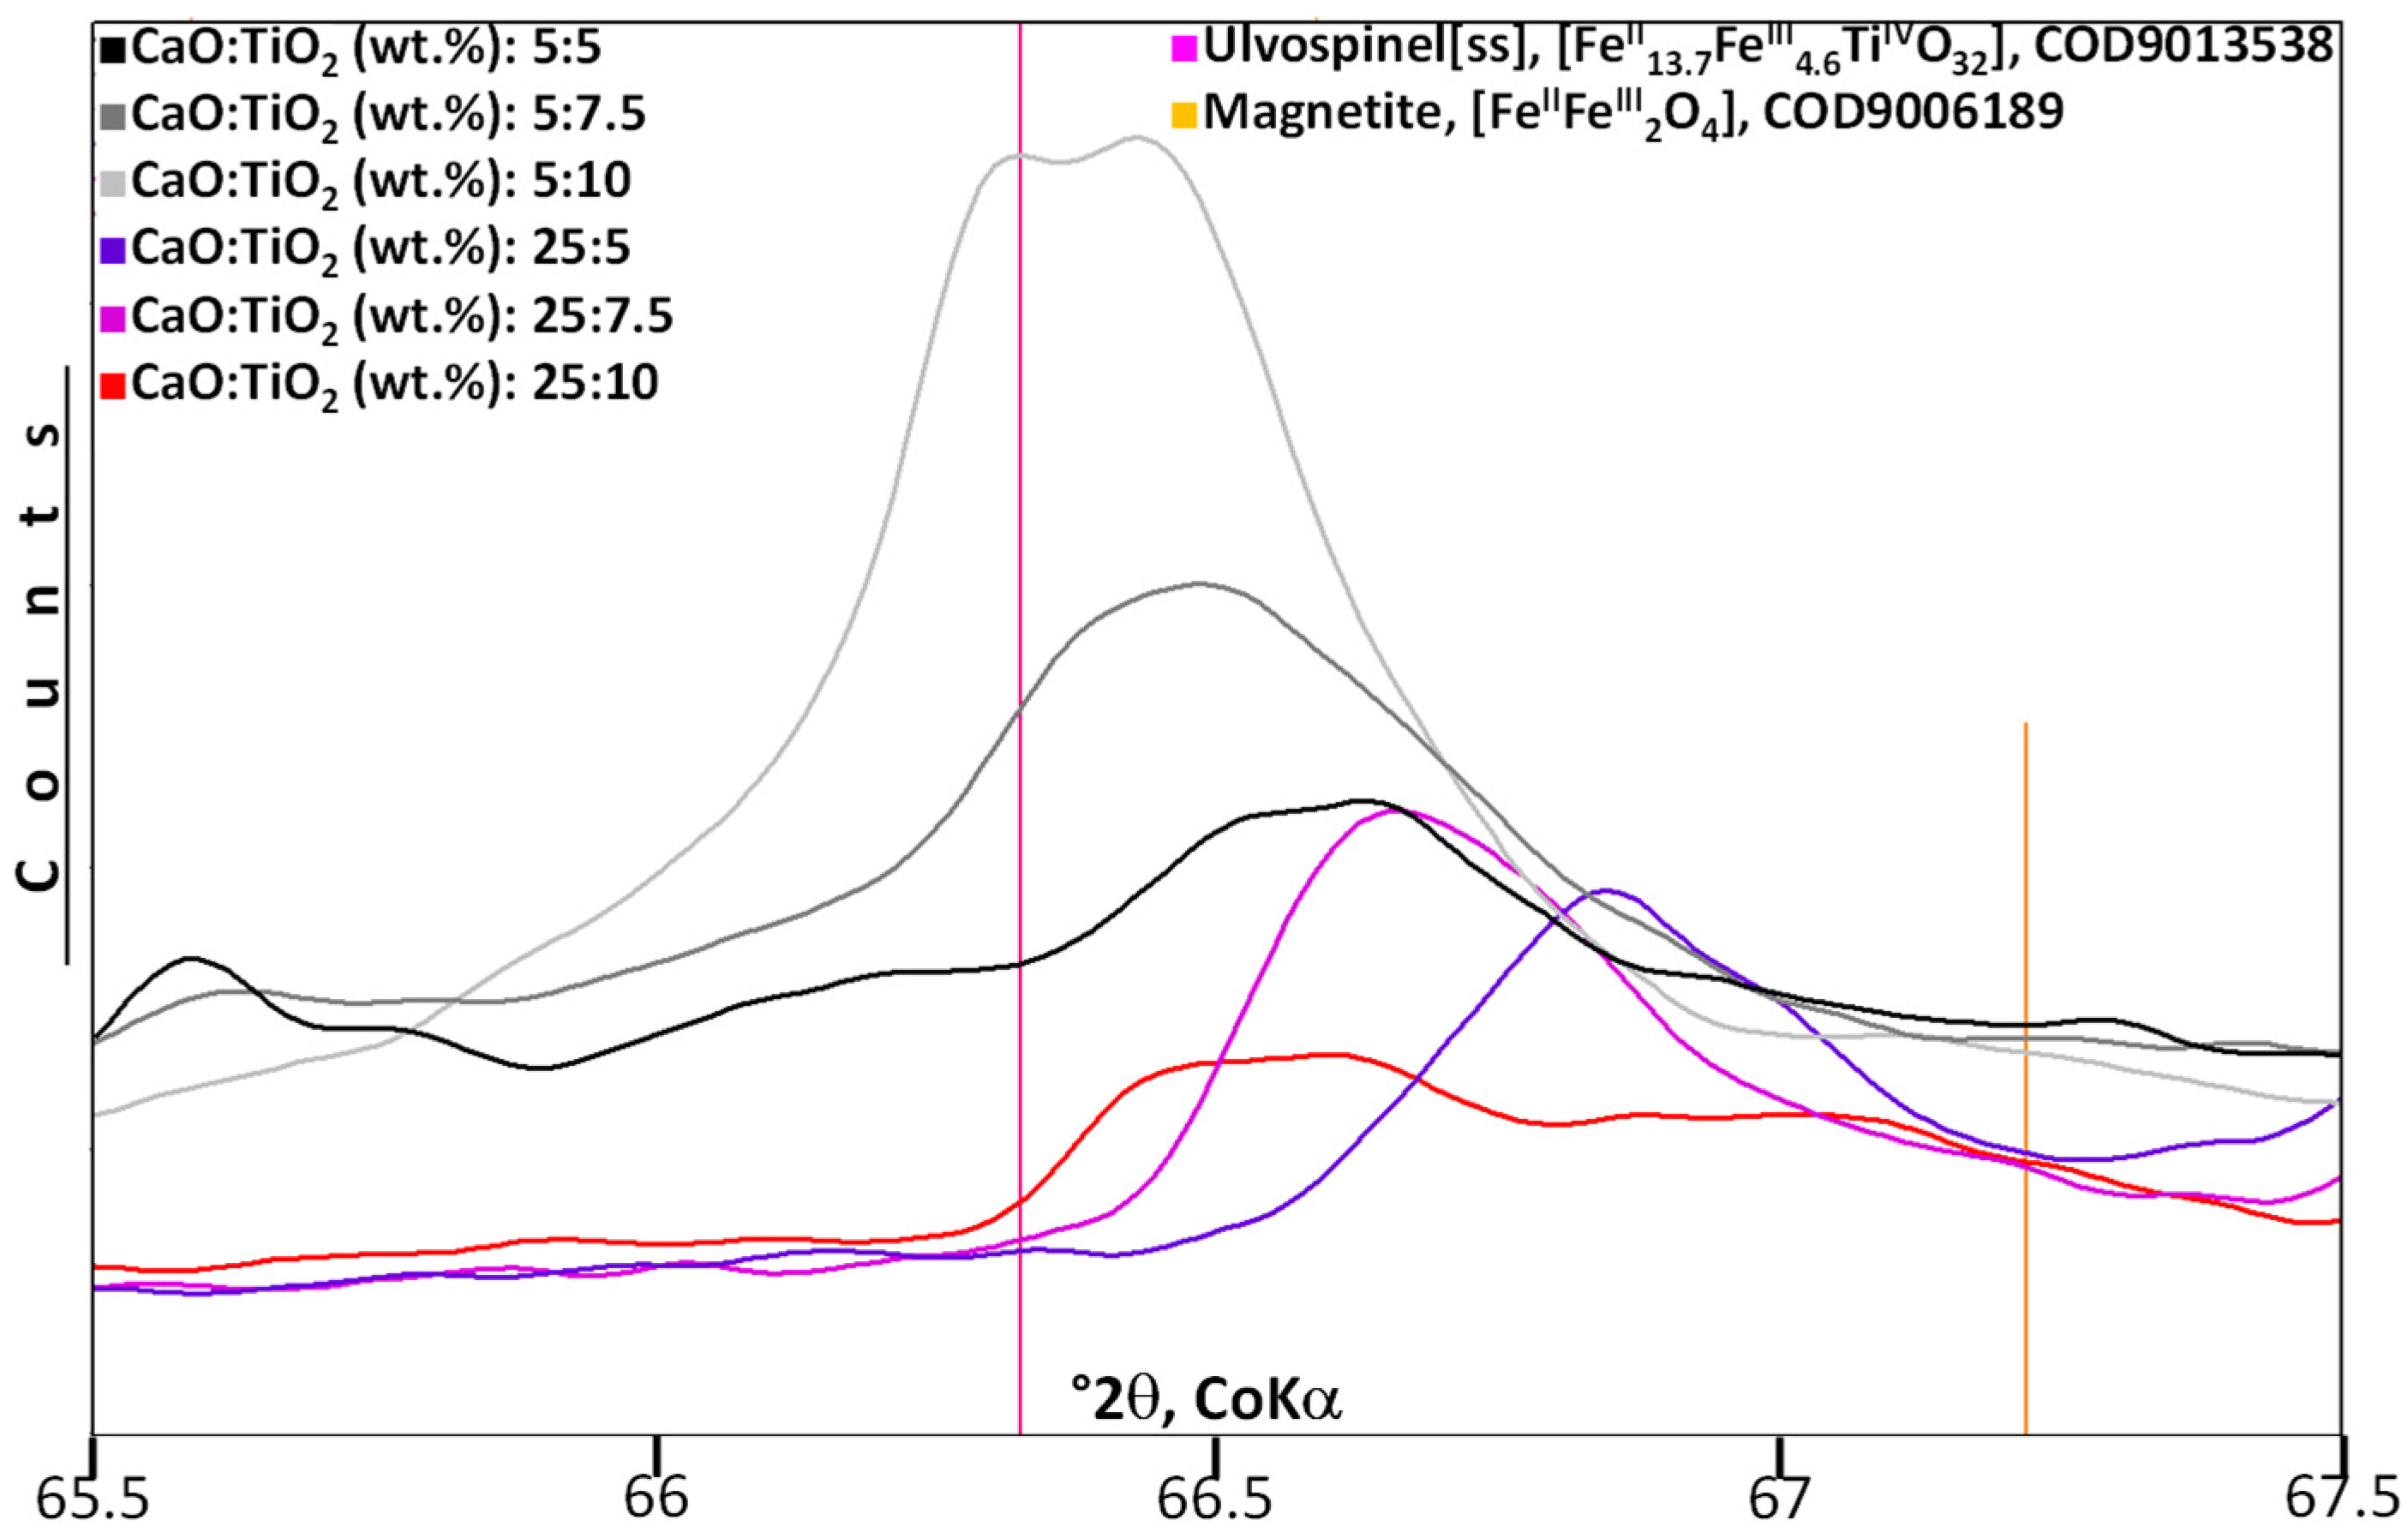
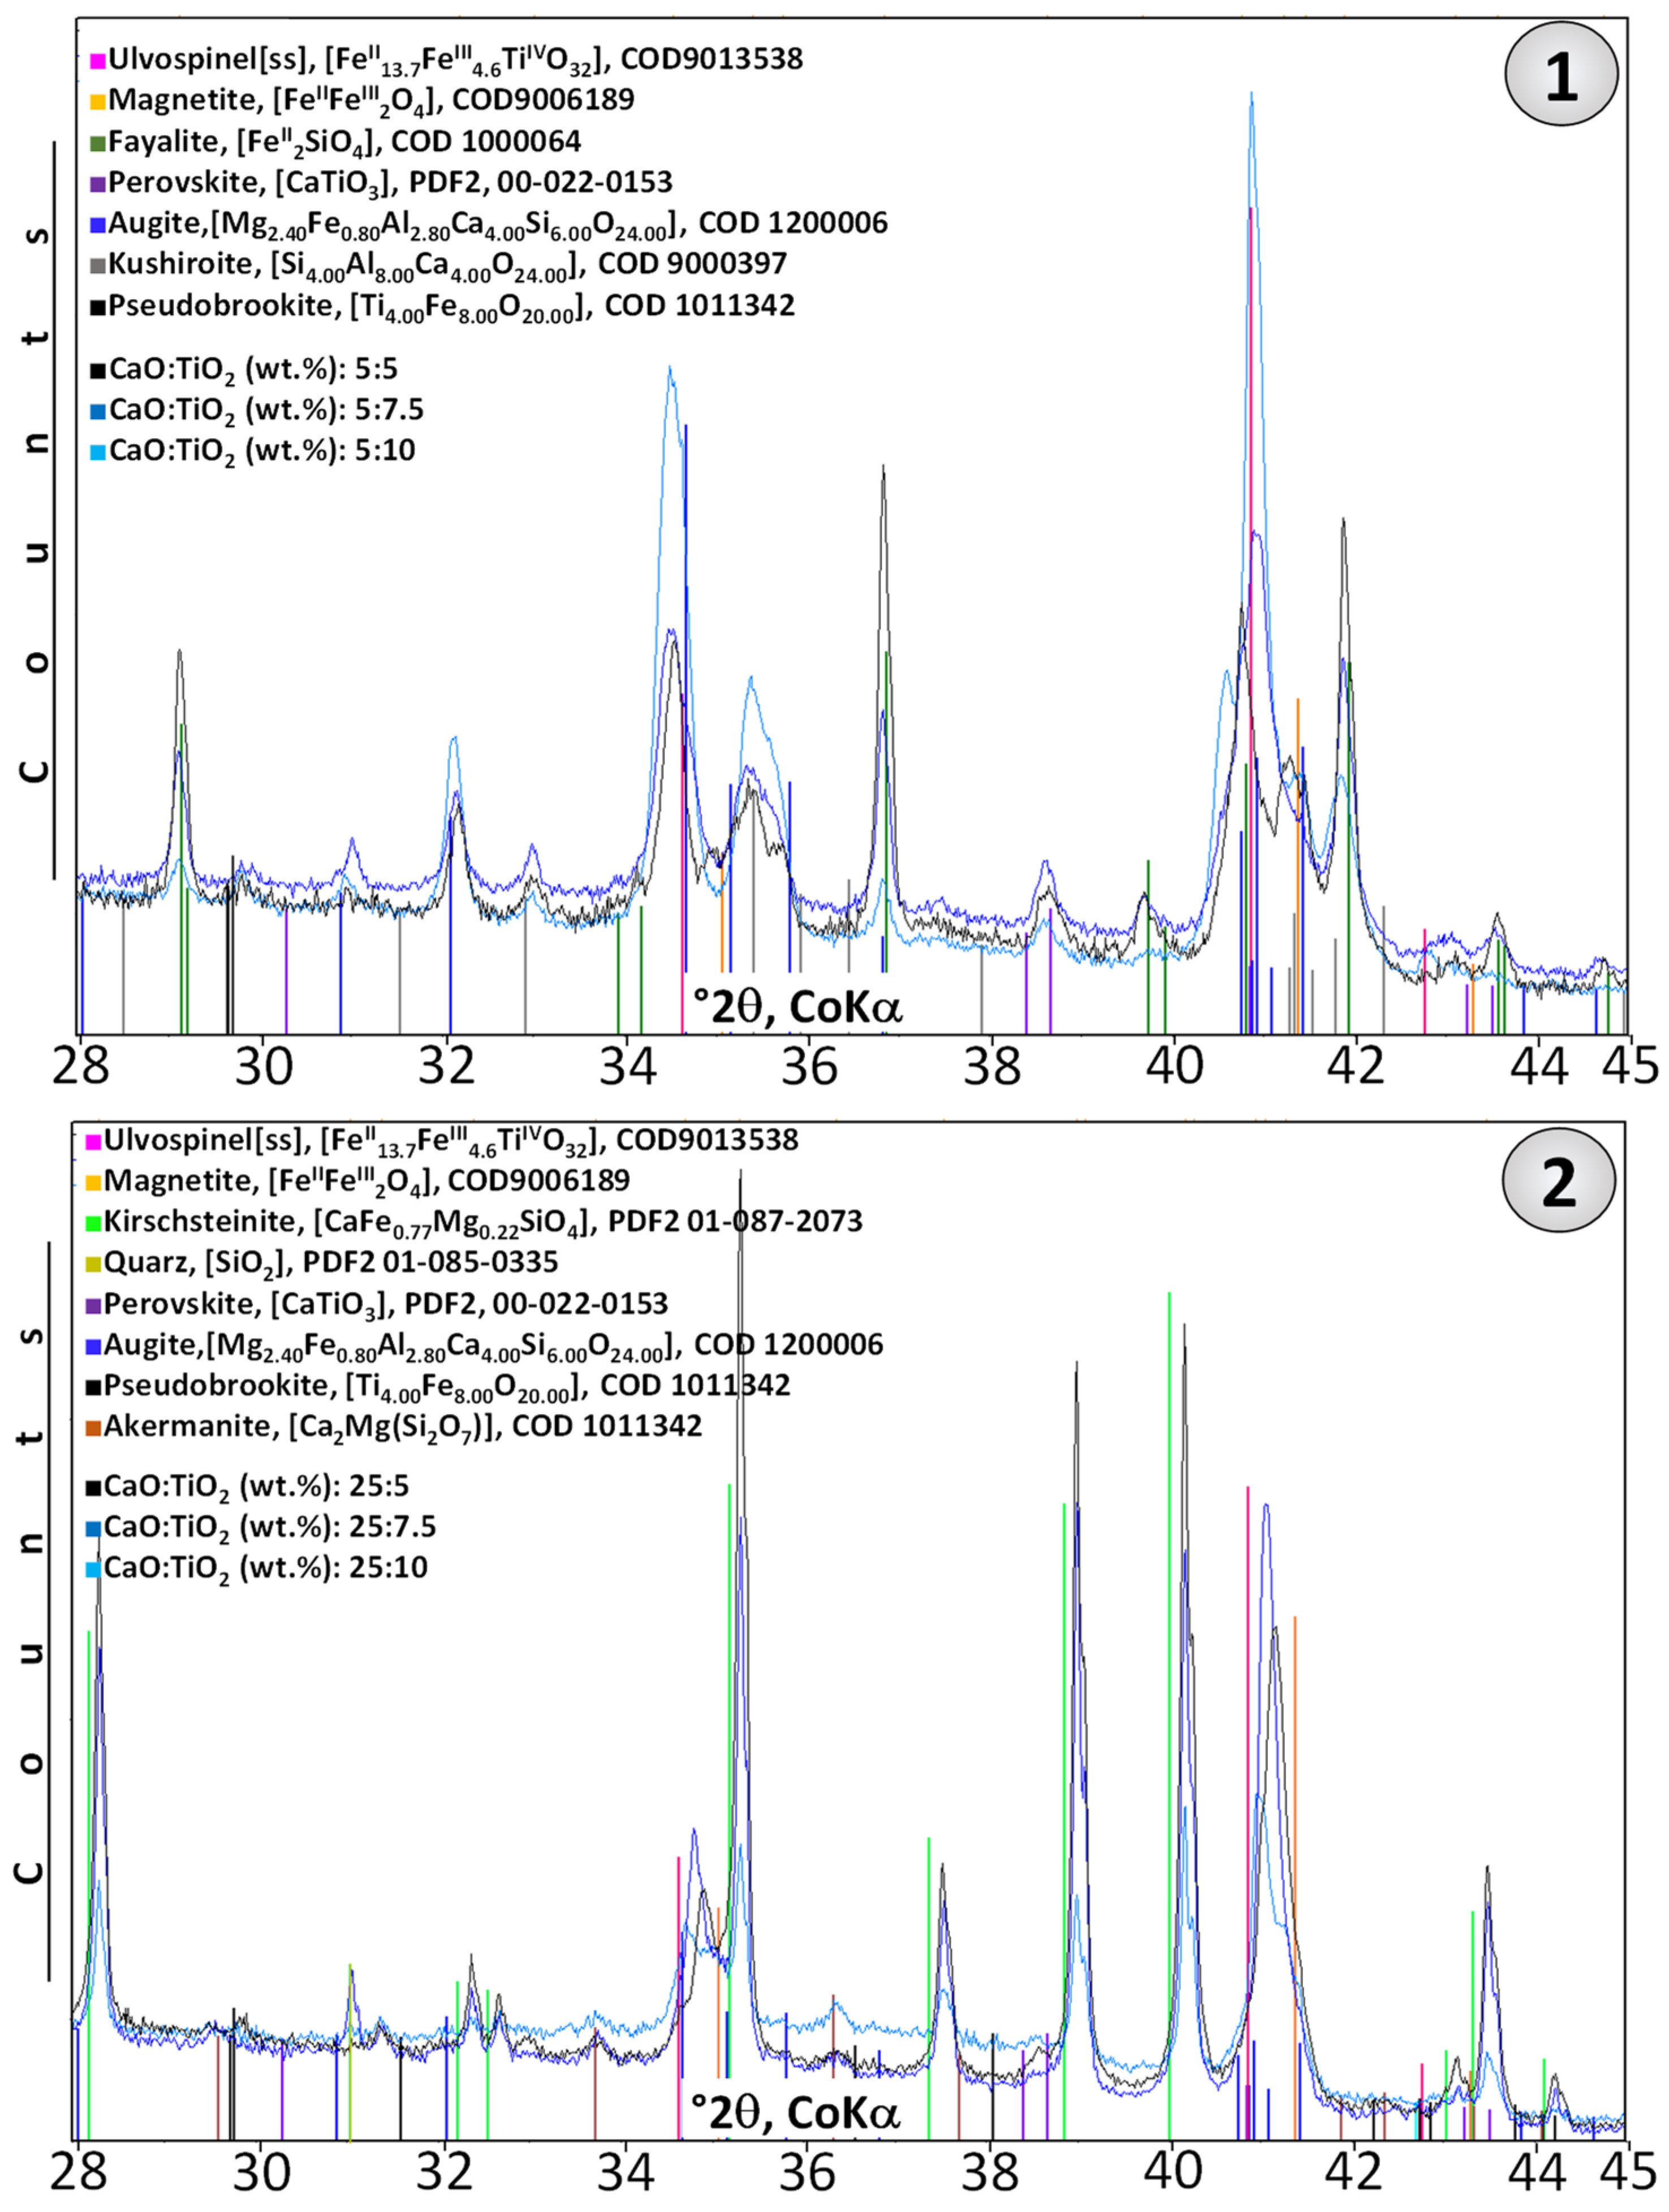
As already mentioned in Section 4.2, the Fe-dominated synthetic silicate melts can be divided into two groups: low-Ca and high-Ca melts. All silicate melts contain an ulvospinel–magnetite solid solution (Figure 6). The height of the spinel peaks increases with increasing Ti concentration, except for the Ca-rich sample 25:10, in which a higher content of amorphous compounds can be assumed (explanation below). Within a sample series, the non-overlapping spinel peaks (region 65.5–67.5 °2θ) shift toward the ulvospinel line as the Ti content increases. With the increasing Ca concentration of the two-sample series, the peaks additionally shift further to the magnetite line (Figure 6). This agrees with the observation of Fe-rich exsolution lamellae in the Ca-rich set of samples observed with BSE(Z) (Figure 3(4,5)).
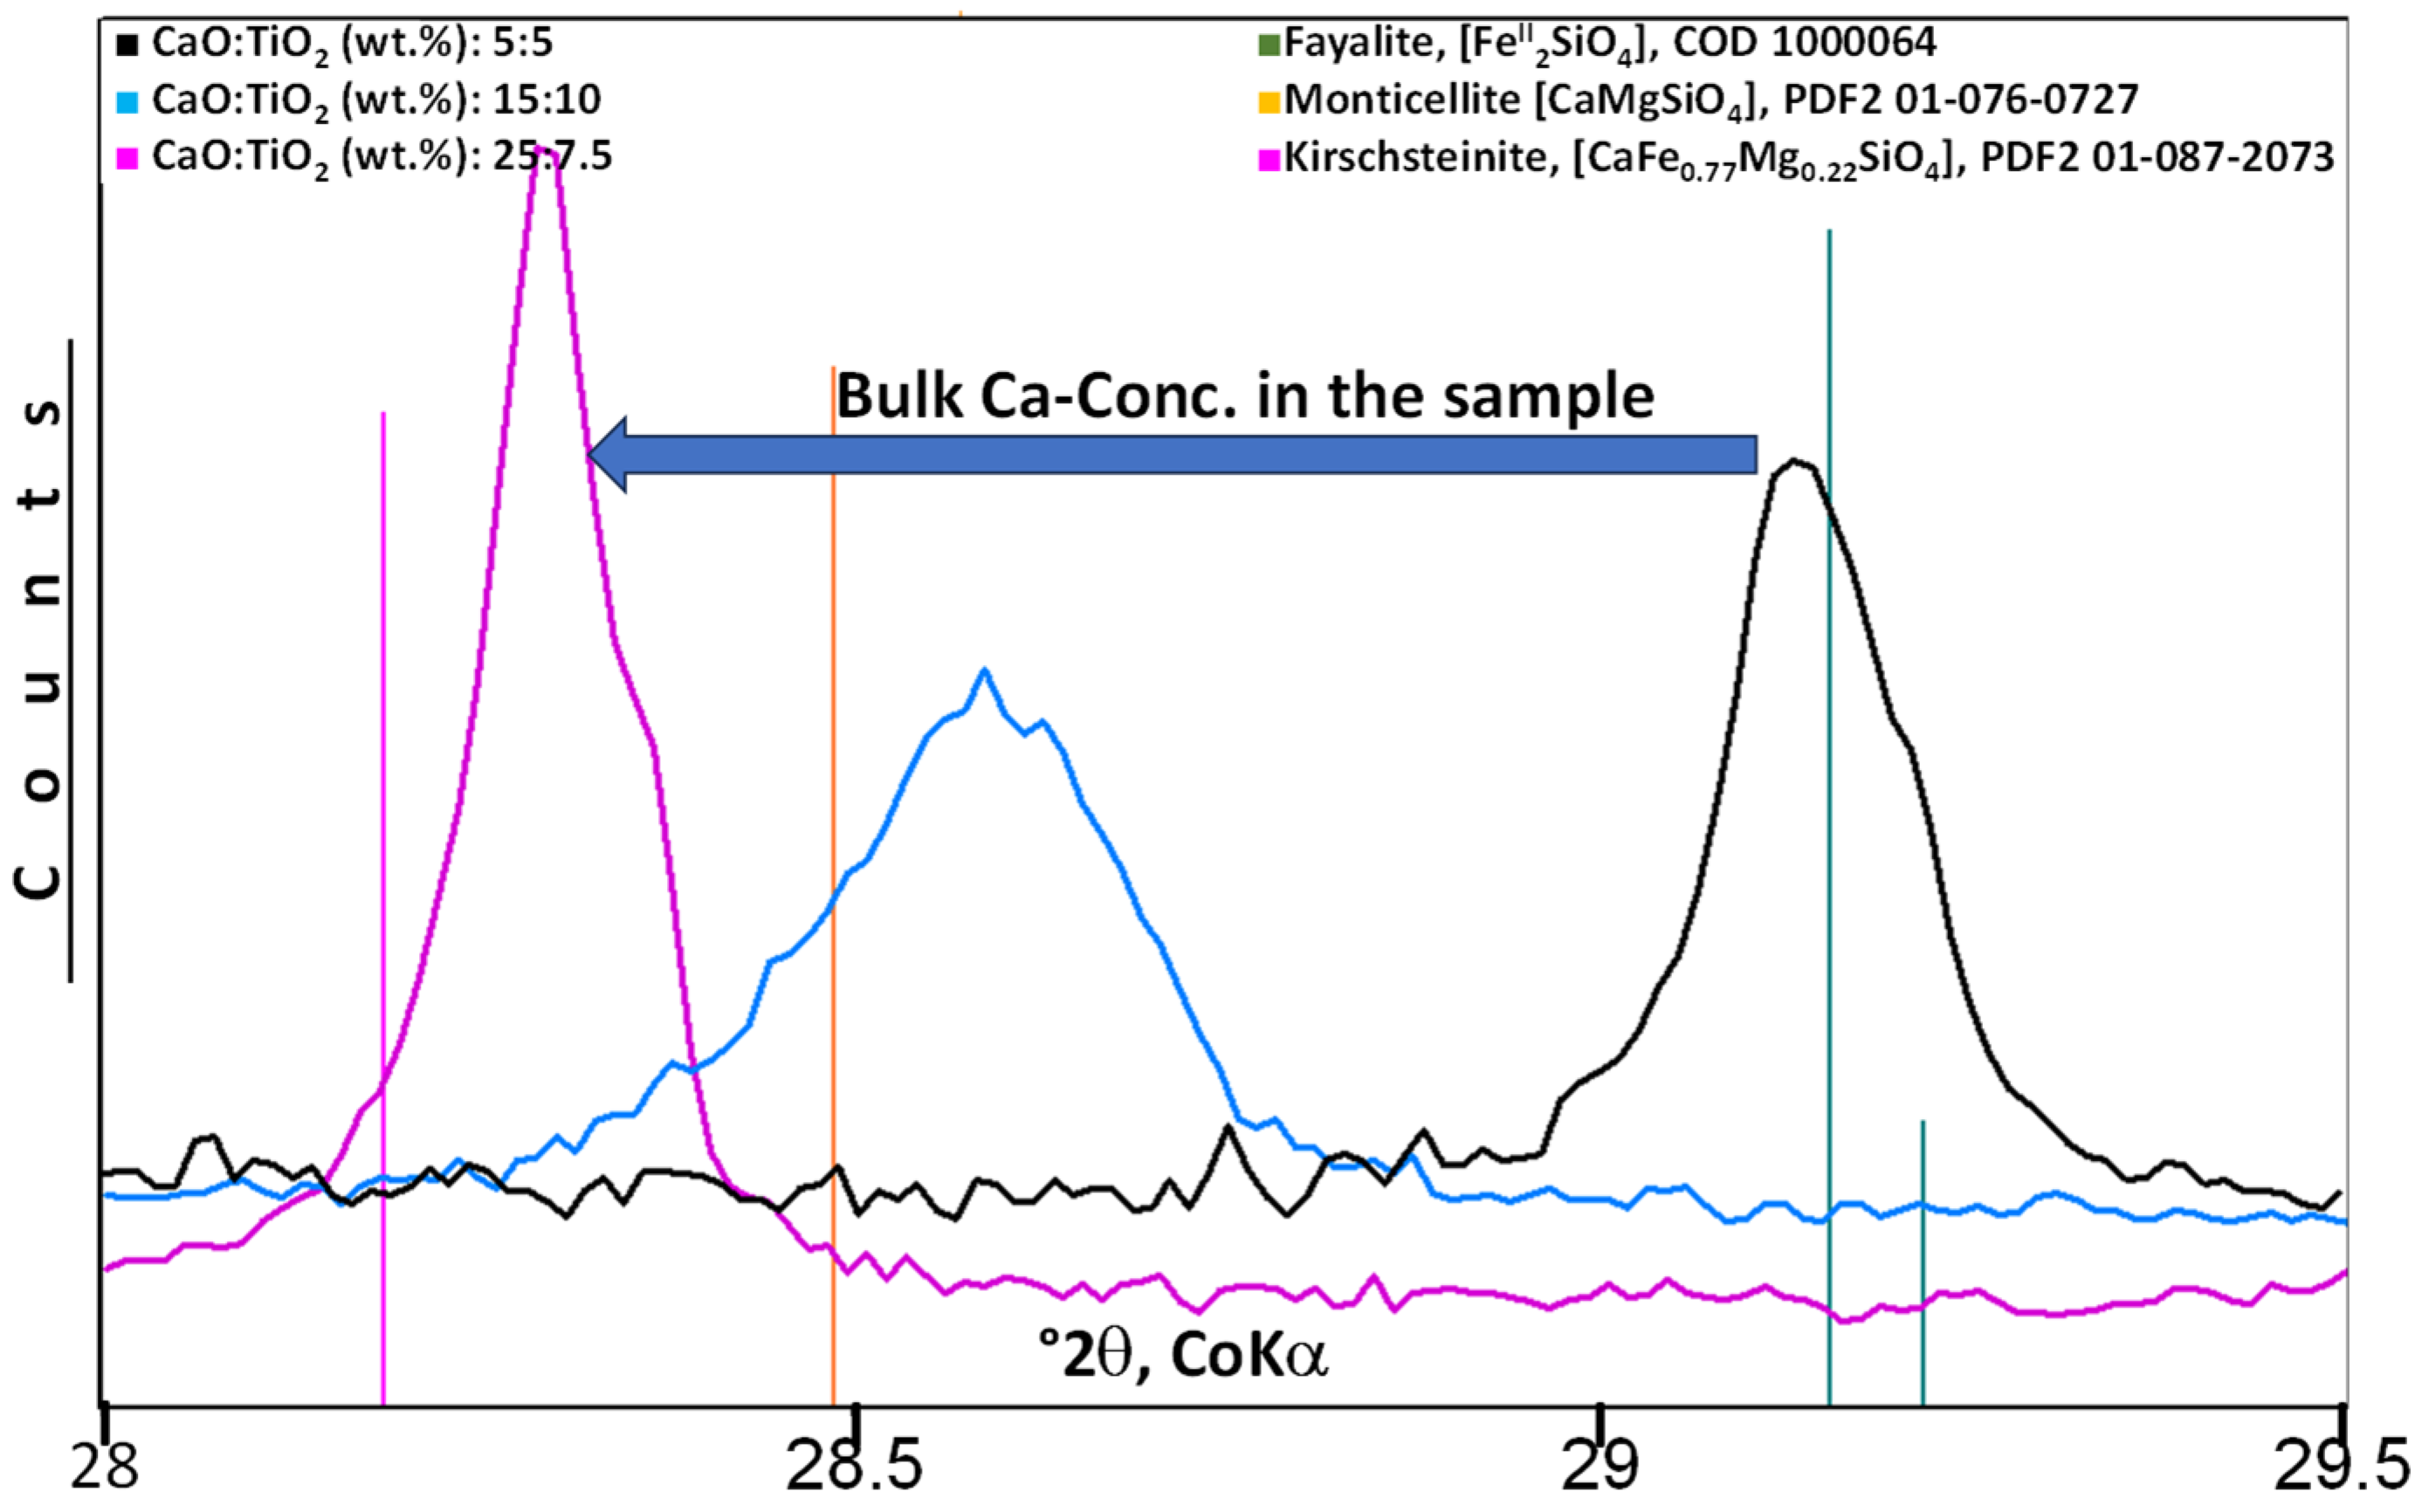
Only in the iron-rich group (low Ca: CaO:TiO2 (wt.%) = 5:5, 5:7.5, 5:10) can a fayalitic olivine be clearly assigned. In the other samples, peaks can be identified near the angular positions of monticellite and kirschteinite, which indicate silicates with an olivine-like structure (Figure 7).
The crystalline portion of the matrix consists of a mixture of Ca-containing (clino-)pyroxene- and olivine-type silicates (Figure 8, blue and green colors). Additionally, there is an indication of a minute content of akermanitic silicate. With the increasing Ca content, the peaks of the olivine-like compounds shift from fayalite toward kirschsteinite (Figure 7). In the Ca-poor sample set, there is a clear negative correlation between the peaks of the spinel solid solution and fayalite (Figure 8(1)), with the highest spinel peaks within the Ti-richest sample. In the calcium-rich sample set, this negative correlation reappears—this time between the spinel solid solution and kirschsteinite olivine. However, this only applies to the two samples that are poorer in Ti (medium blue and black peaks, Figure 8(2)). The sample richest in Ti (sample CaO:TiO2 = 25:10; Figure 8(2), light-blue peaks) appears to contain a higher proportion of amorphous compounds, as indicated by the increased background in the range between 32 and 40 °2θ. This could be the explanation of the lower overall height of the spinel peak in Figure 6 (red peaks).
CAS series
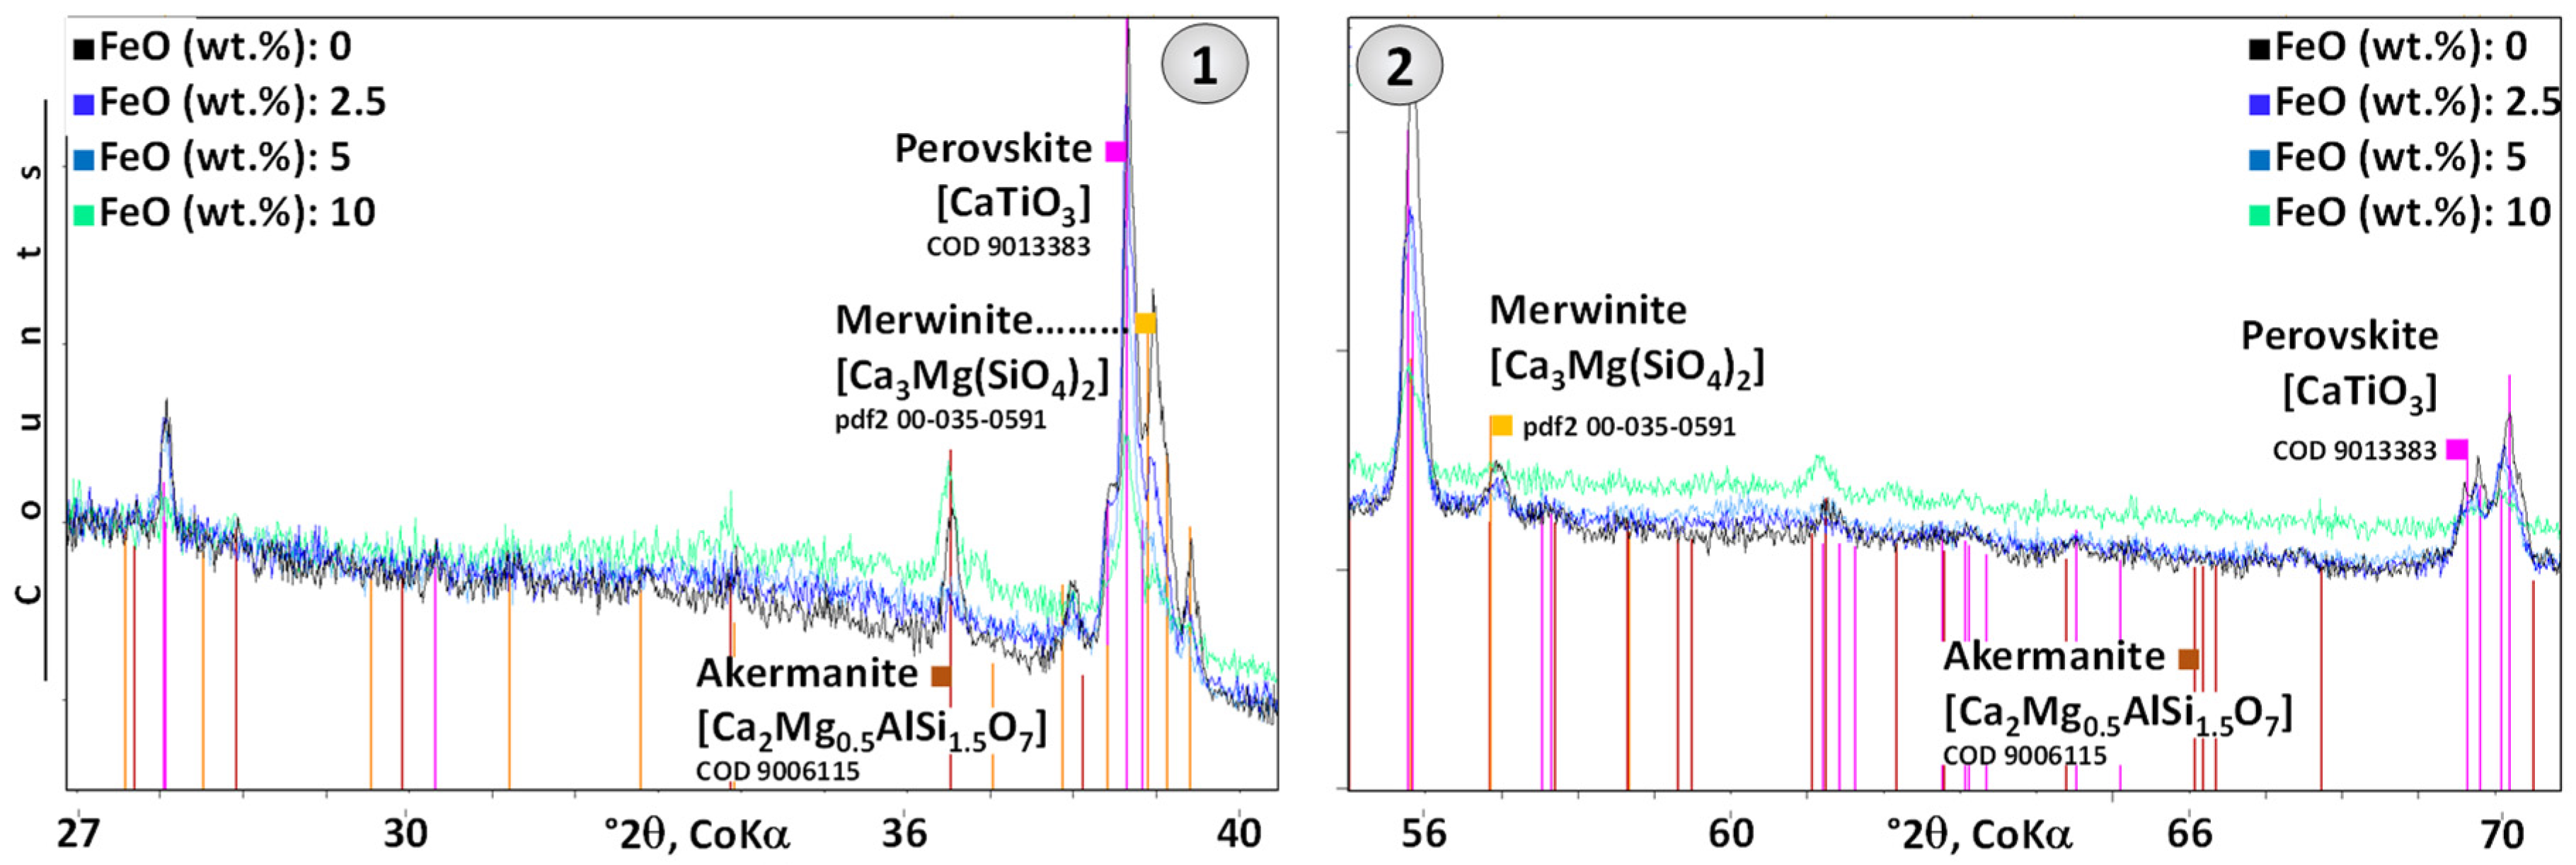
These samples are relatively simple in composition and consist mainly of perovskite in a merwinite–akermanite matrix. Merwinite occurs primarily at lower Fe contents, while akermanite becomes more prominent at higher Fe contents. An increase in the background line with elevations in the range of the diffraction lines of akermanite indicates a weakly crystalline to amorphous phase with a similar chemical composition or akermanitic structural units (Figure 9(1,2)).
The intensity of the diffraction lines of the perovskite decreases with increasing Fe content, which indicates suppression of perovskite formation due to the presence of Fe.
Industrial slag from the Syncon process
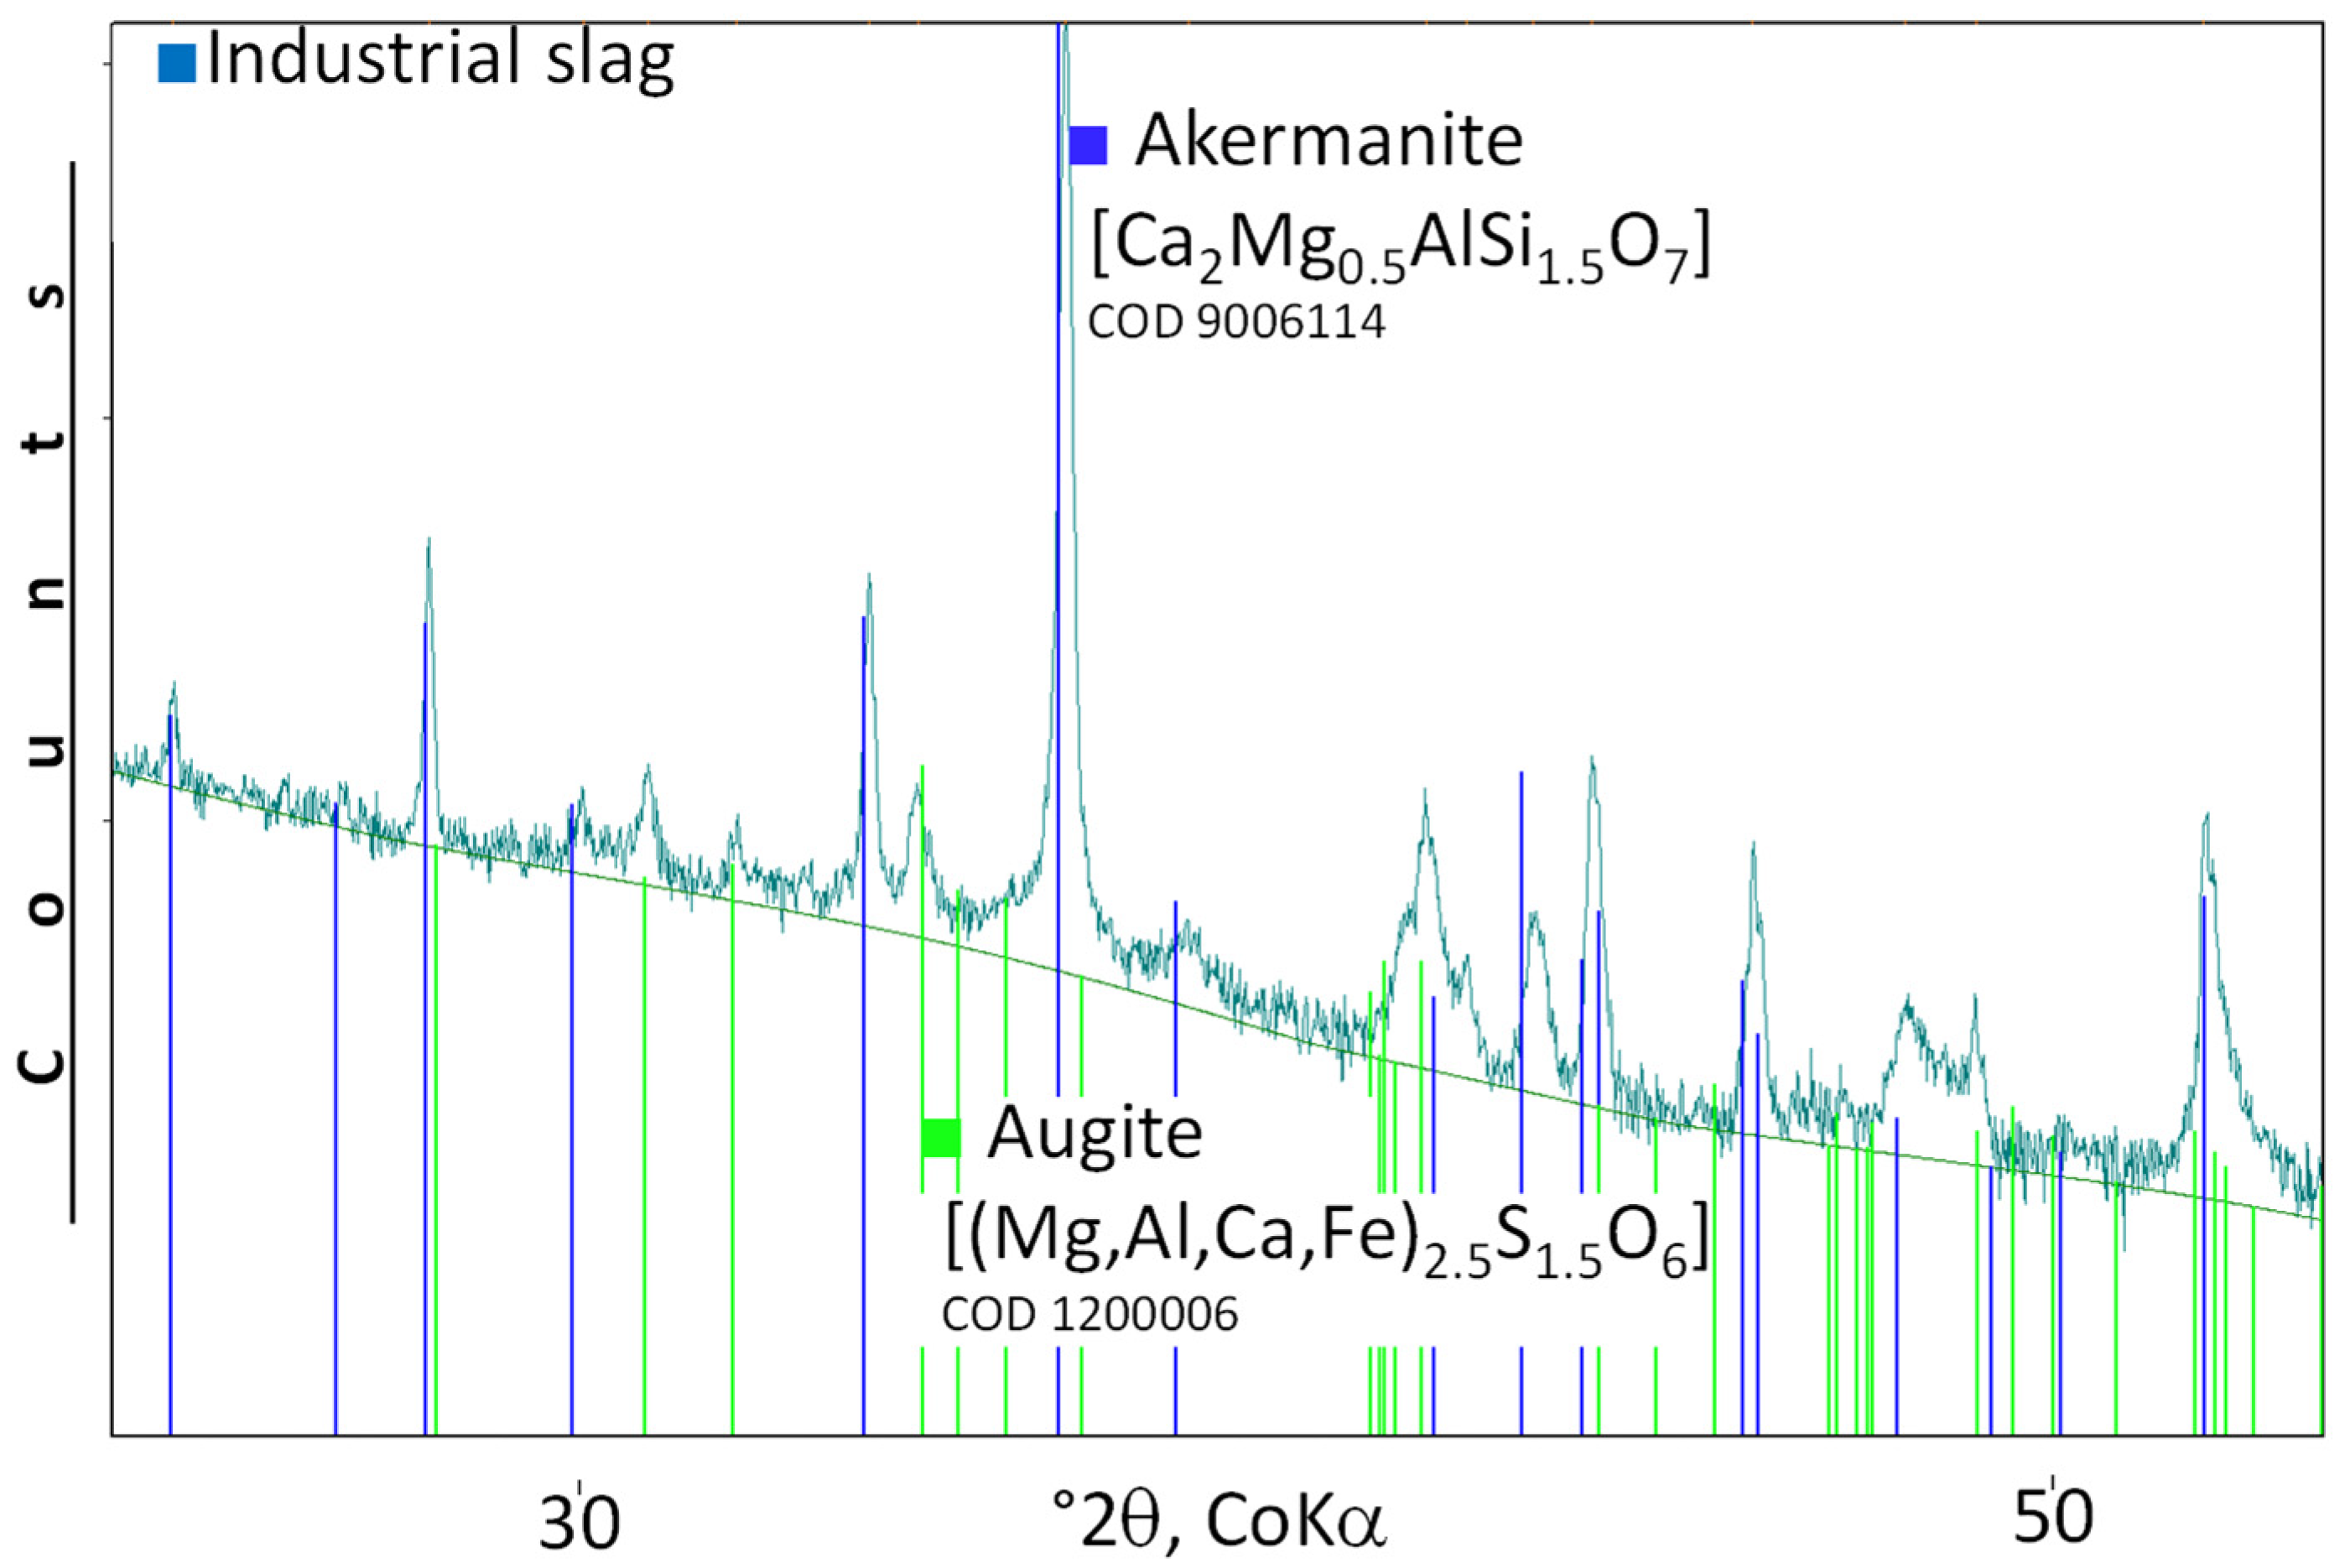
In terms of PXRD, these samples are relatively simple in structure and contain a mixture of calcium alumosilicate and pyroxene-like compounds (Figure 10). The complex drops or flakes visible in the BSE(Z) do not produce any evaluable diffraction signals.
  • Quantitative Point Analysis with EPMA
SFSSeries
The EPMA investigations confirm the observations from the BSE(Z) images and the PXRD evaluation that the titanium-containing spinel crystals are mainly a solid solution of ulvospinel (endmember: FeII[4][TiIV[6]FeII[6]]O4) and magnetite (endmember: FeII[4][FeII[6]]2O4) (Figure 11, left). Aluminum contents of up to ~6 wt.% indicate that a small proportion of a hercynite component (FeII[4][Al[6]]2O4) is also present. In addition, the spinels contain a small amount of Mg, at most ~1 wt.%, but mostly less than that, which indicates small amounts of another magnesium spinel component. There is a tendency for the spinel compositions in the calcium-rich samples to become increasingly split into magnetite-dominated and ulvospinel-dominated fractions.
This increasing split with a higher Ca:Fe ratio and higher overall Ca and Ti percentages (see also Figure 3, lower row with sample 25.7.5) indicate an exsolution reaction into Ti-enriched besides Fe-enriched spinels. The calcium-rich samples also show greater overall chemical variability with a higher hercynite fraction and, in some cases, over-stoichiometric Ti enrichment relative to ulvospinel, tending towards ilmenite and/or pseudobrookite (Figure 11, right).
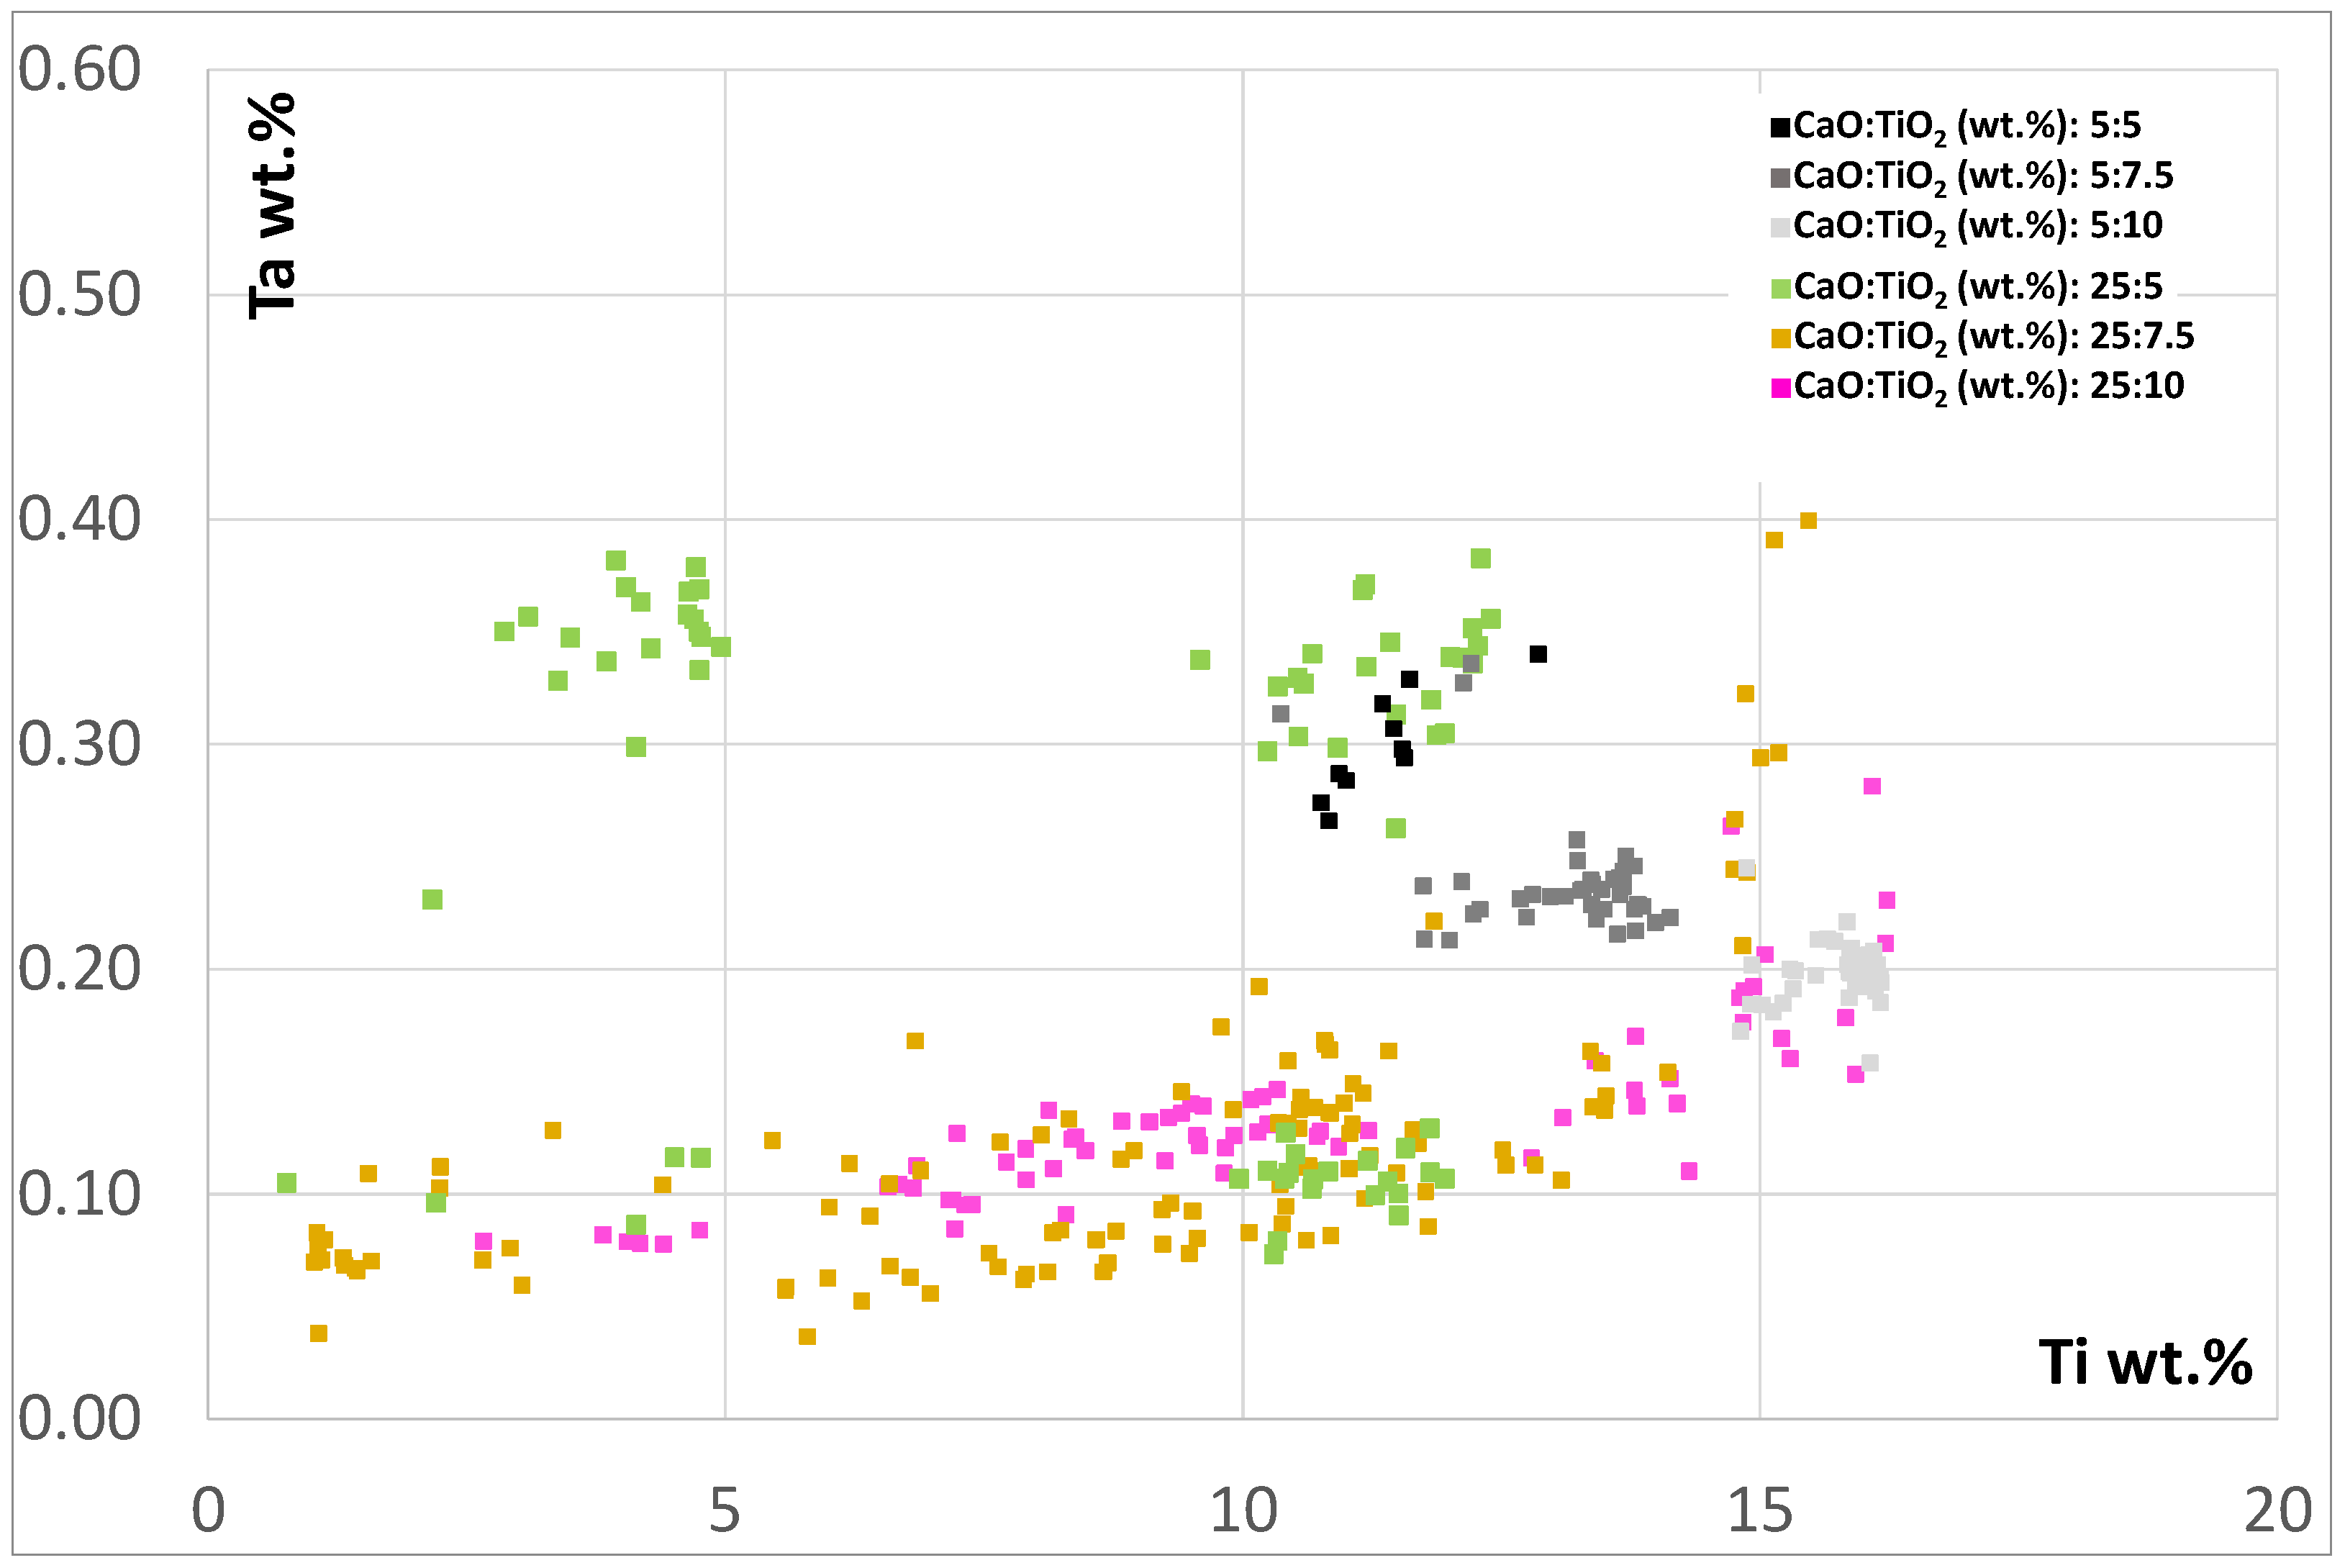
The Ta concentrations in the spinels are only slightly elevated, with a maximum of ~0.5 wt.%. There is a weak positive overall correlation with the Ti concentration in the Ca-rich samples 25:7.5 and 25:10 (brown and green dots, Figure 12).
These are also the Ca-rich samples in which, compared to the Ca-poorer samples (Figure 13, 1–3), segregation into Fe-rich and Ti-rich spinels occurs (Figure 13, 4–6).
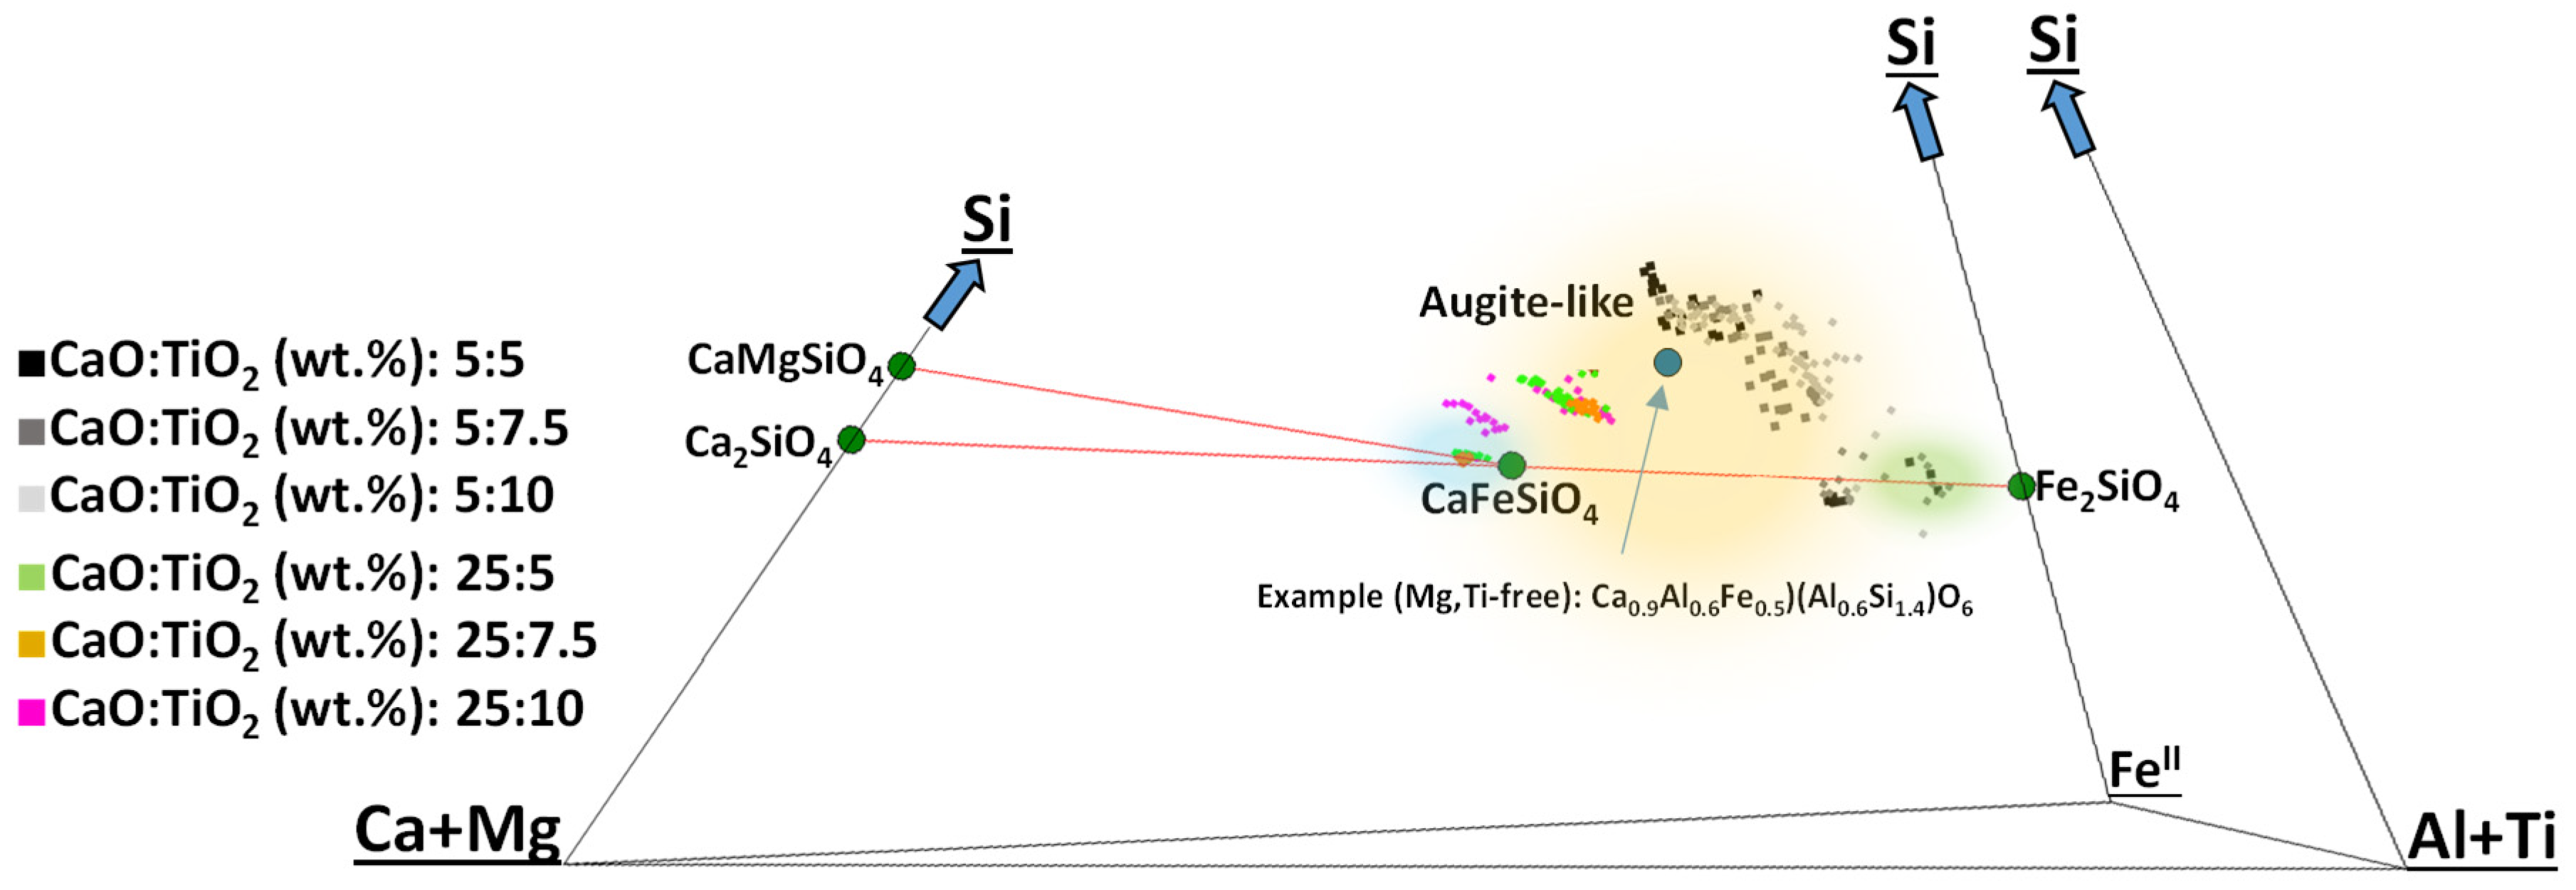
The spinel crystals are surrounded by a silicate matrix. This can be divided into two groups: more olivine-like and more pyroxenitic groups (Figure 14). The pyroxene-like (not always stoichiometric) phases show an alkaline-free augite-like composition.
It is interesting that the olivine-like phases, with the exception of those with a kirschsteinite–monticellite composition in the Ca-rich samples 25:5, 25:7.5 and 25.10, all contain considerable amounts of Al and Ti. This is atypical for true olivines, which do not contain trivalent or tetravalent elements in larger amounts. Since, based on the PXRD results, all samples contain a phase with an olivine-like structure, a candidate should also be found in all samples with EPMA.
In the Ca-rich samples 25.5, 25:7.5, and 25.10, this is clearly a kirschsteinite–monticellite solid solution, which also incorporates very little Al. The iron-rich samples 5:5 and 5:7.5 contain an olivine-like fayalite phase, which, however, already contains 2–4 wt.% Al and up to 4.5 wt.% Ti. These phases can be best calculated stoichiometrically in terms of four oxygen atoms to cope with the PXRD prediction of olivine-like structures and are hypothetical compounds of the type (Mg,Ca,FeII)x(Al,Ti,FeII,Ta)y(Al,Si)zO4 (Table 2).
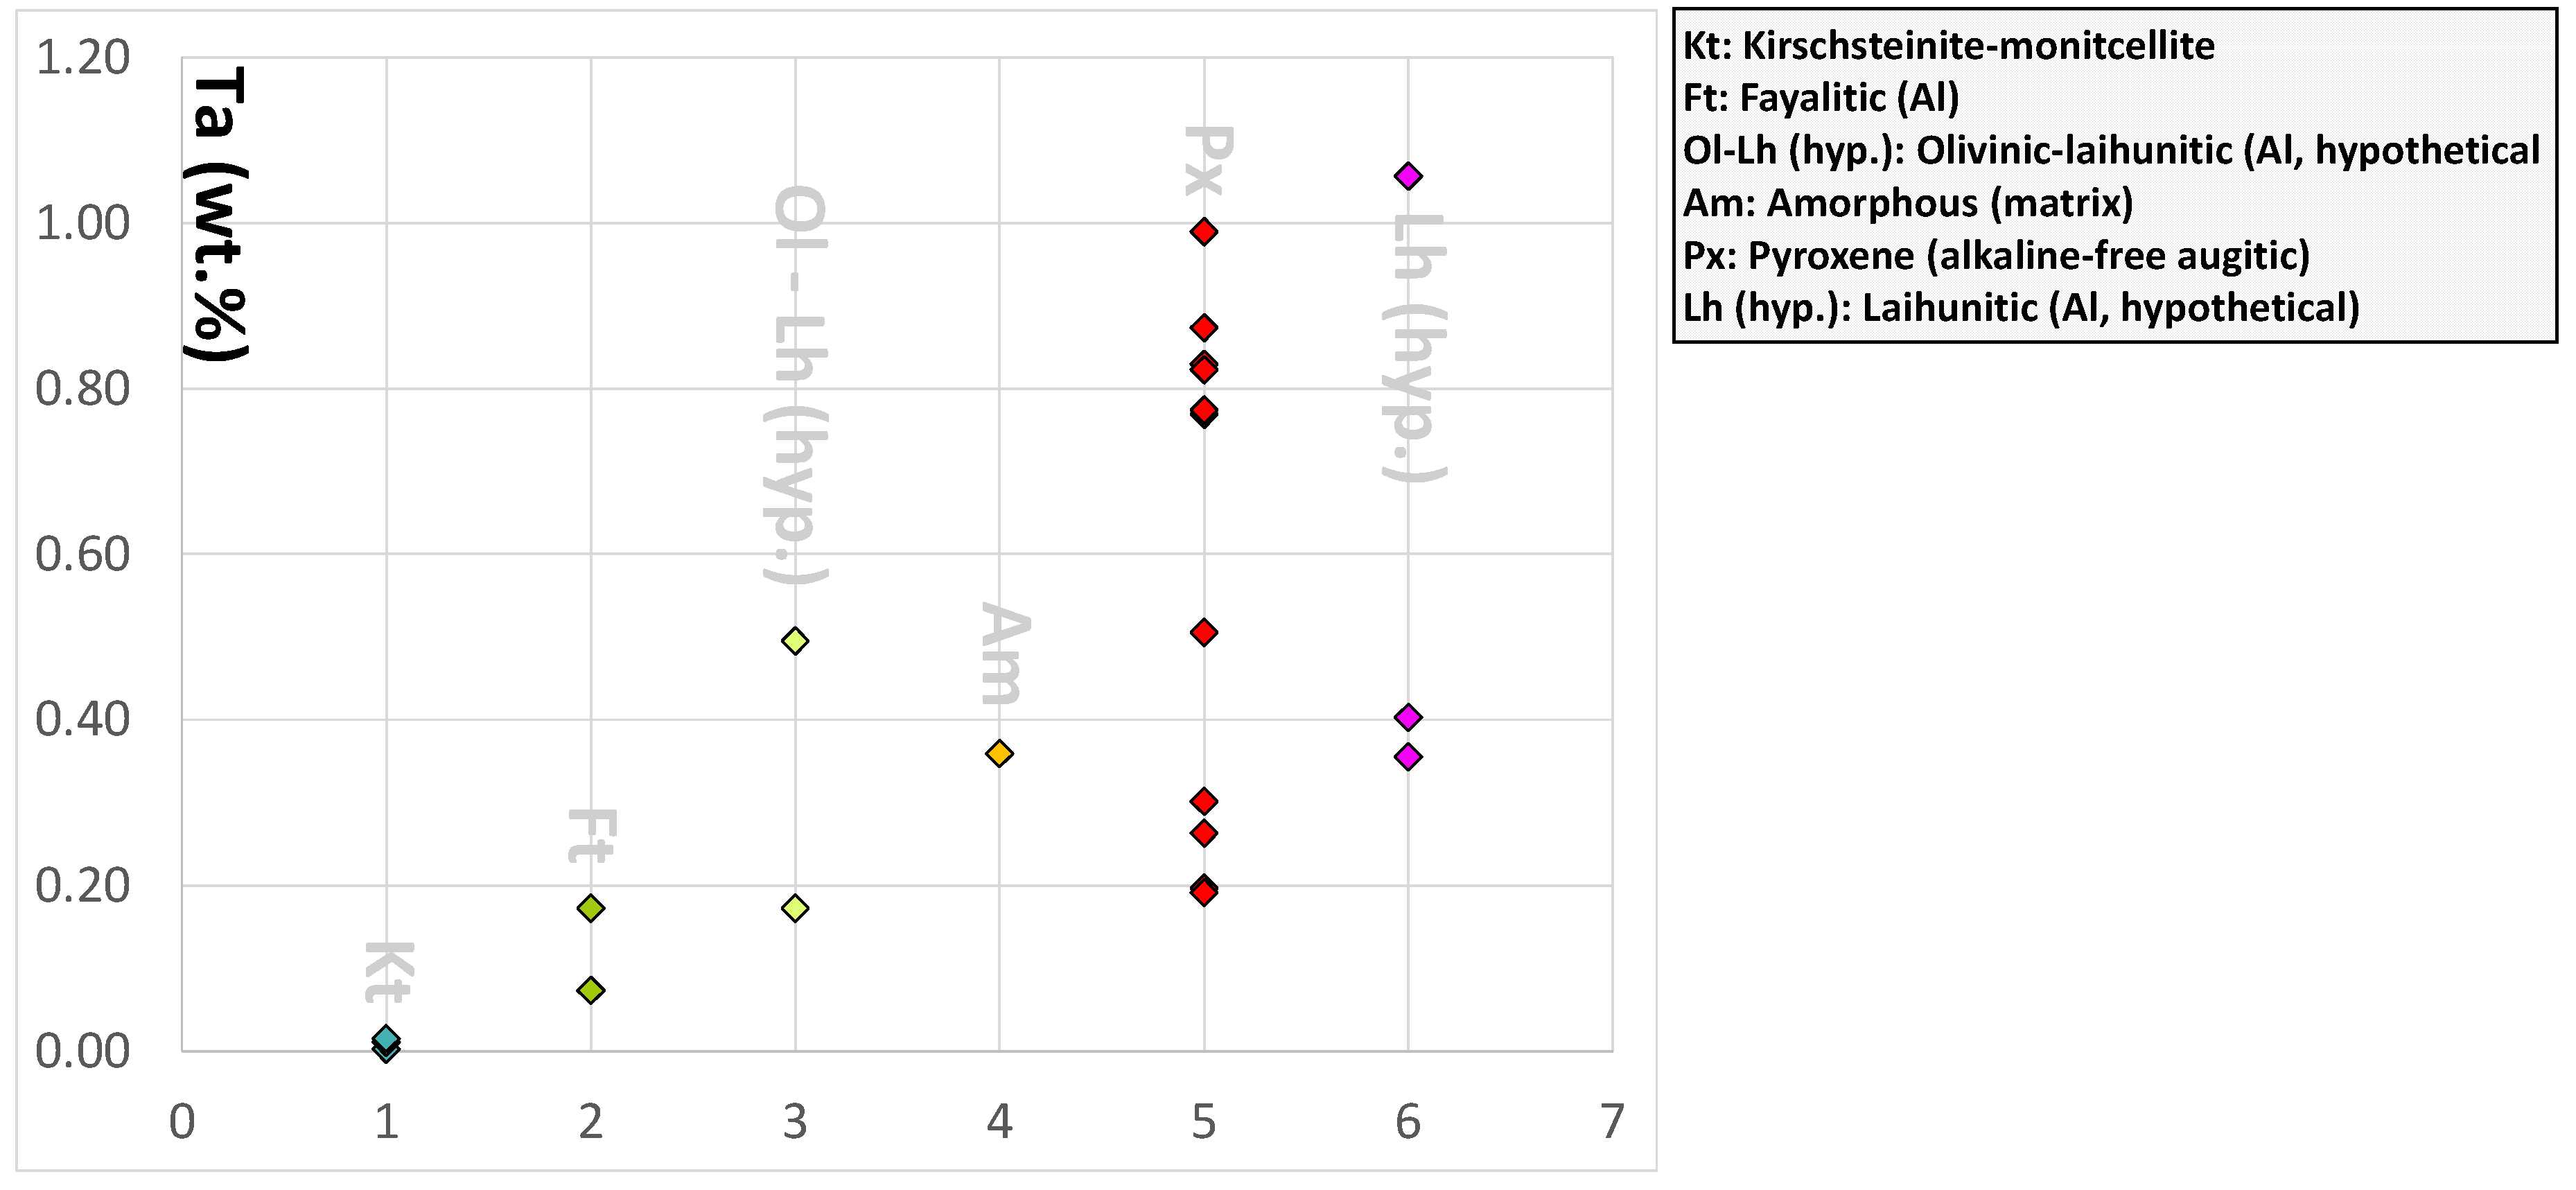
There is a weak correlation with increasing Ta content from the olivine-like to the pyroxene-like phases. The highest content is found in pyroxenic-phase chemistries and in a phase that stoichiometrically corresponds to the hypothetical compound that potentially can be linked to laihunite (Figure 15).
CAS series
The EPMA results confirm the composition determined by PXRD with merwinite, a Ca-alumosilicate matrix, and perovskite. The perovskite structure is represented by a Ca- and Ti-rich oxide with incorporation of Al, Fe and Ta and traces of Mg.
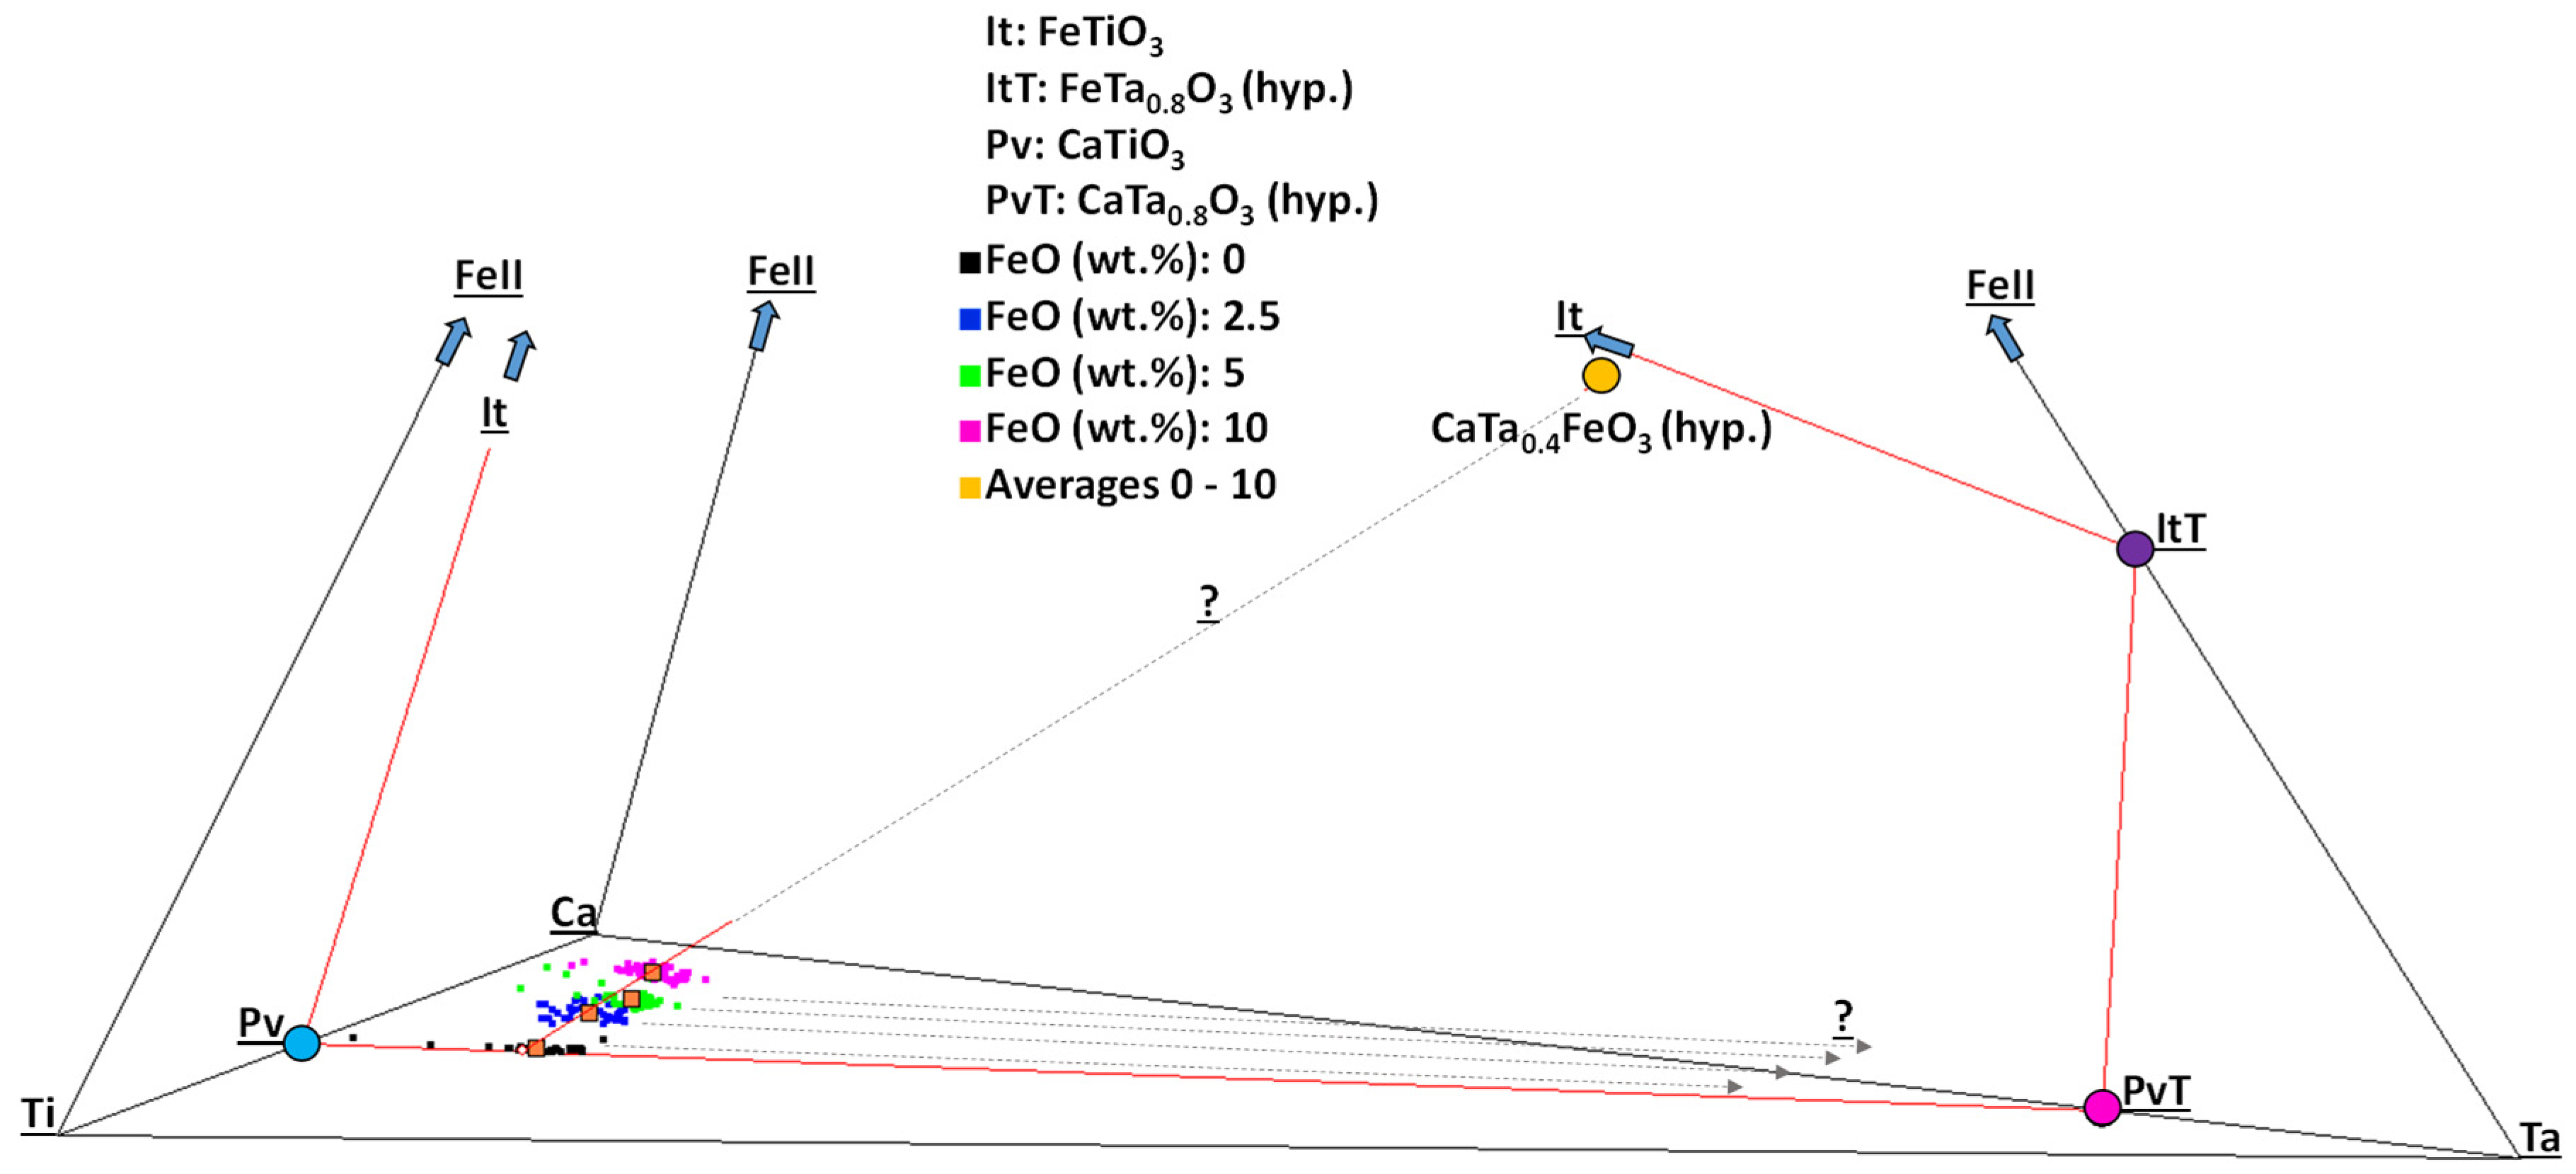
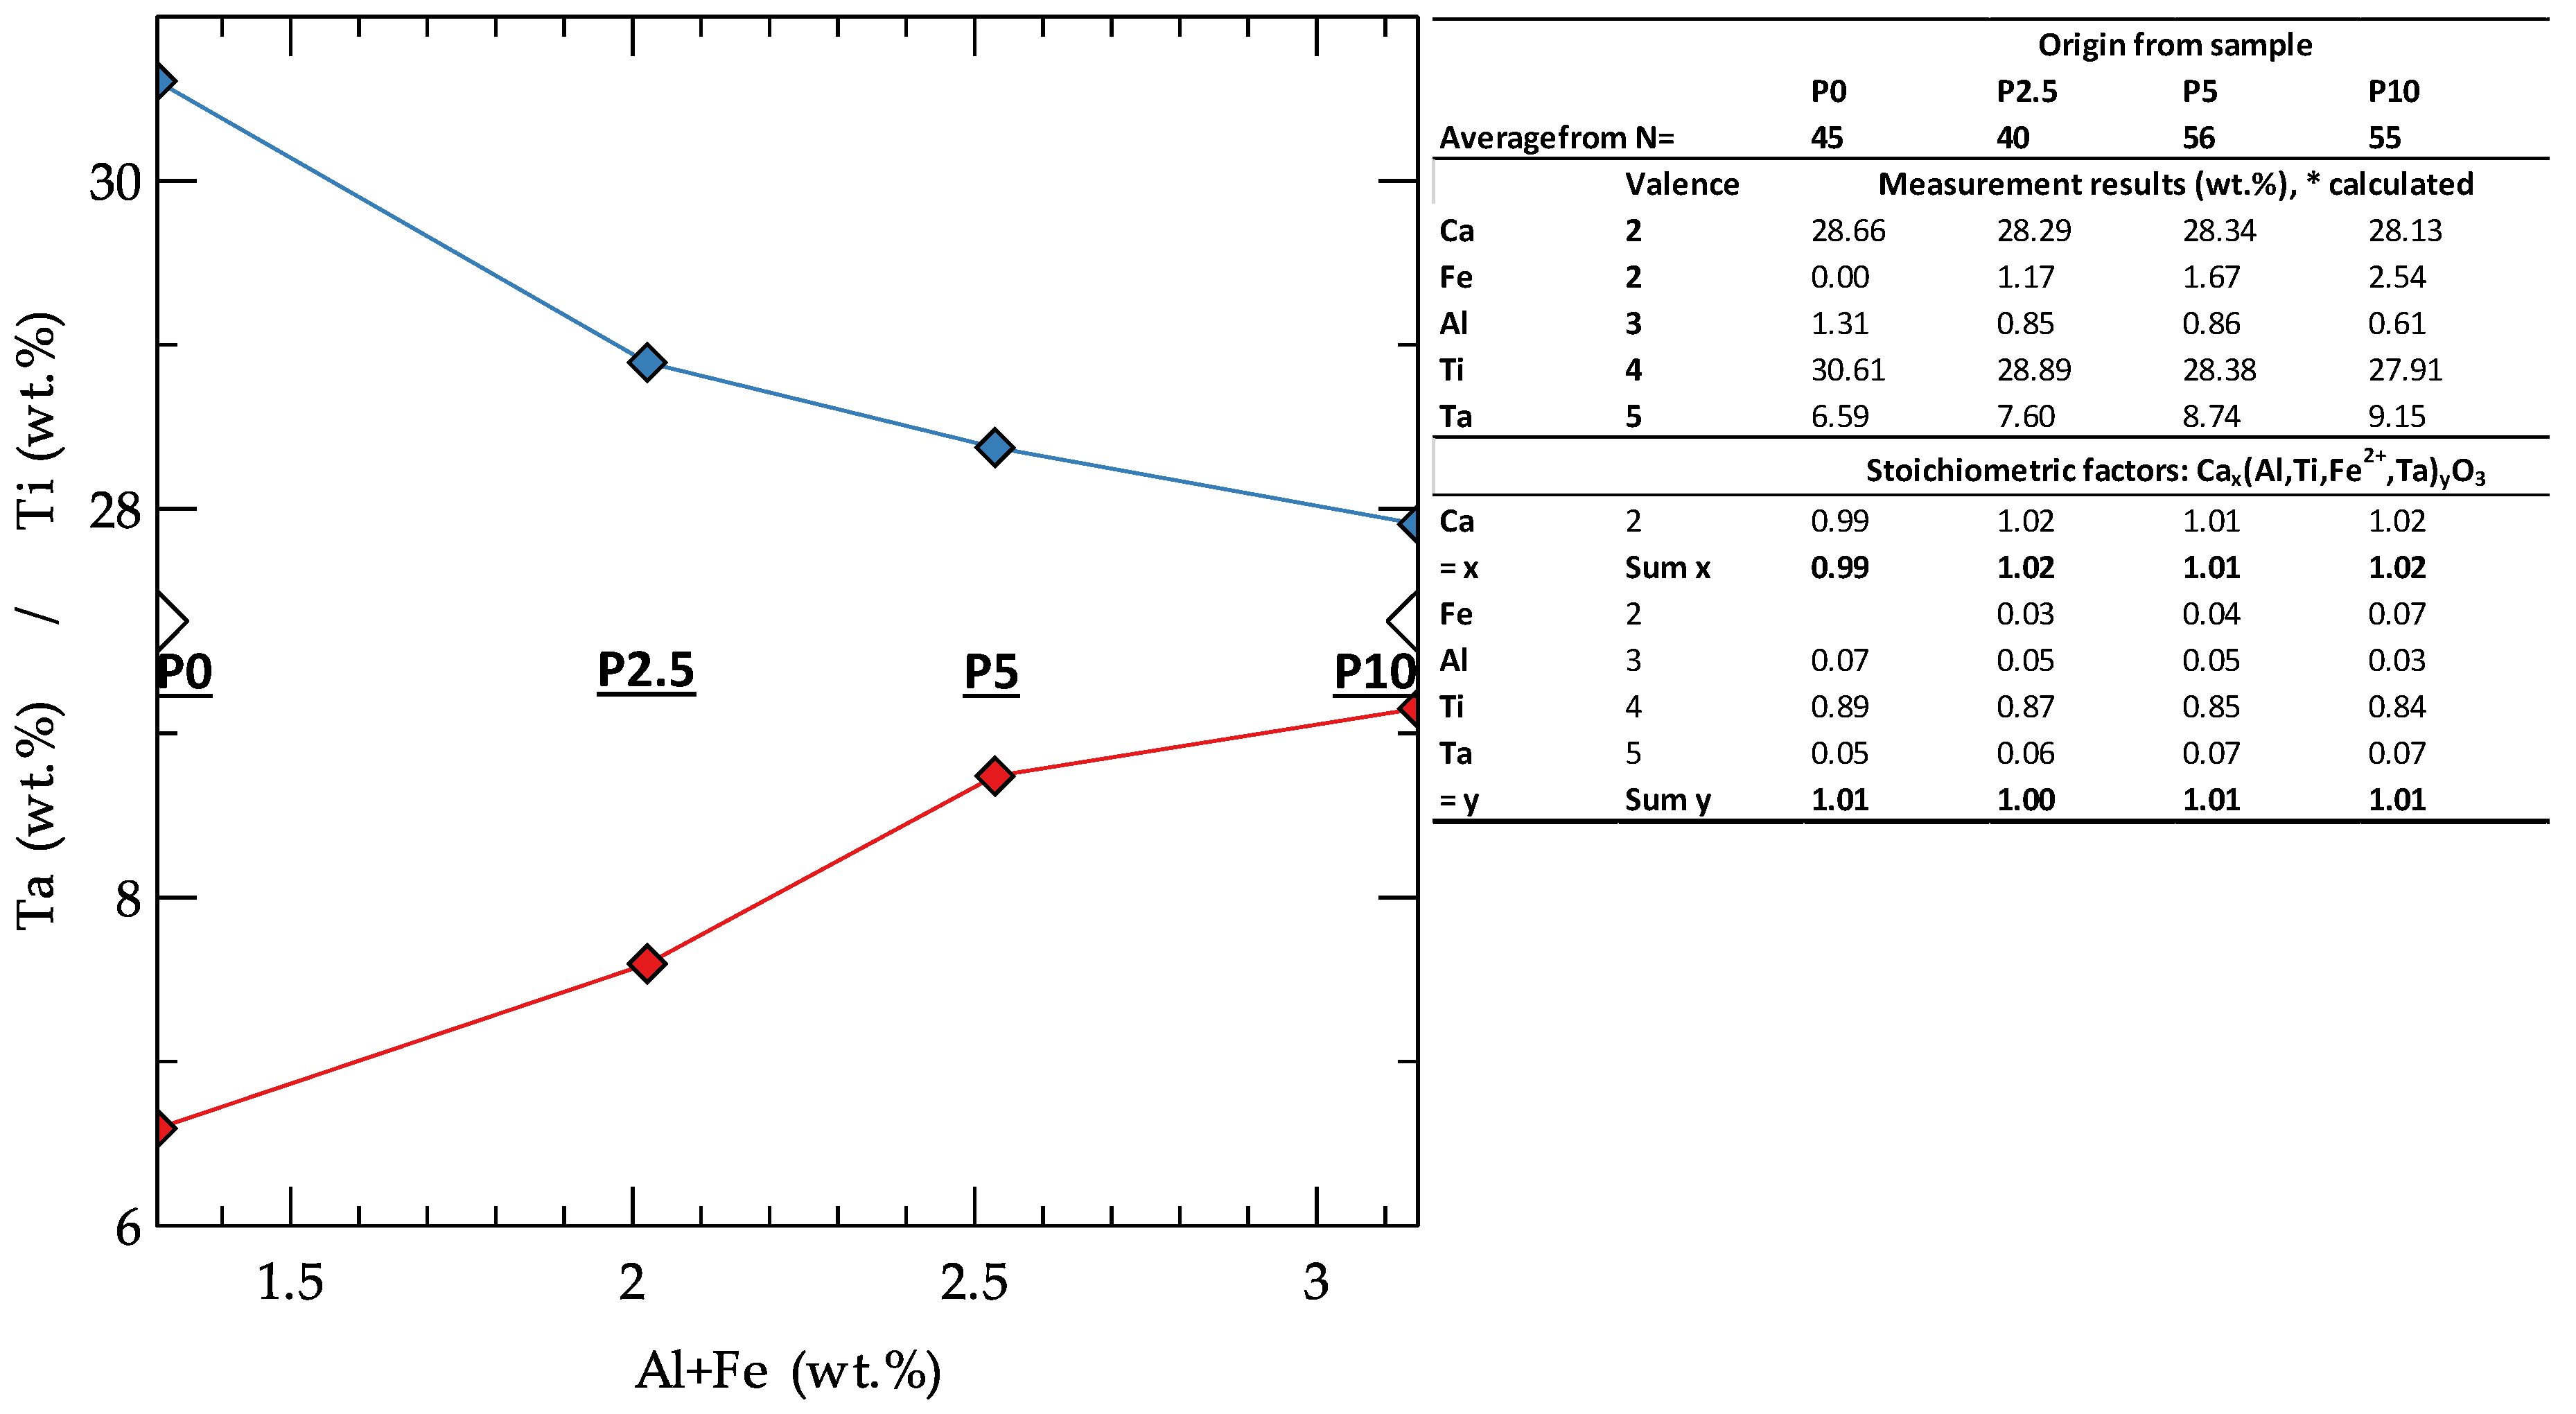
Looking at the results, a complex relationship between potential solid solutions becomes apparent, which is difficult to assess due to the relatively small range of variation in the experiments conducted to date (Figure 16). If in the system Ca2+-Ti4+-Fe2+-Ta5+ the slope of the mean values of the individual experiments is used, the elongation indicates a hypothetical compound with the formula CaTa0.4FeO3 (Al-free), which would then probably no longer have a perovskite structure. The extent to which this solid solution can develop in the direction of Fe cannot be determined from the results. If Al is included in the consideration, the formula of the hypothetical component CaTa0.4FeO3 would be transferred to CaTax(Al,Fe)yO3, for example, although it is unclear what charge compensation mechanism would occur with the three elements. If, on the other hand, the development within a sample data set is considered, the solid solution develops toward a hypothetical component with the formula CaTa0.8O3. It can be seen that these components increasingly incorporate Fe as the iron content of the melt increases. Mg—also part of the silicate melt system—is incorporated into the perovskitic oxides only to a very small extent.
The calculated stoichiometric factors for the averages of the perovskites in the four samples and the correlations between Ti/Al + Fe (negative) and Ta/Al + Fe (positive) show that no other element occurs at the Ca position and that the difference in ion charge between Ti4+ and Ta5+ is balanced by Al3+ and Fe2+ to yield the stoichiometric formula Ca(Ta,Ti,Al,Fe)O3 (Figure 17).
Since merwinite crystals become very small with increasing Fe content (see Figure 4), this phase could only be analyzed with reasonable accuracy in the iron-free silicate melt. This compound does not incorporate Ta and is therefore not discussed further.
Even though PXRD clearly indicates the presence of an akermanite-like crystalline structure the EPMA results do not allow for a robust stoichiometric calculation of a corresponding calcium alumosilicate (Table 3). The calculations yield a compound with the general formula (Ca,Mg)2(Mg, Al, Fe, Ti)1−x(Al, Si)2O7. The cause of the stoichiometric index “1−x” could lie in the incorporation of the species Al3+ and Ti4+ in exchange for Mg2+, whose charge excess is not completely compensated by the exchange of Si for Al in the unit “(Al, Si)2”.
Industrial slag from the Syncon process
The EPMA results show that the material to be recycled has not completely dissolved in the slag. The elemental composition, with the additional elements V, Cr, Nb, Sn, and W, is also significantly more complex than in the discussed synthetic silicate melts, which represent a simplified system.
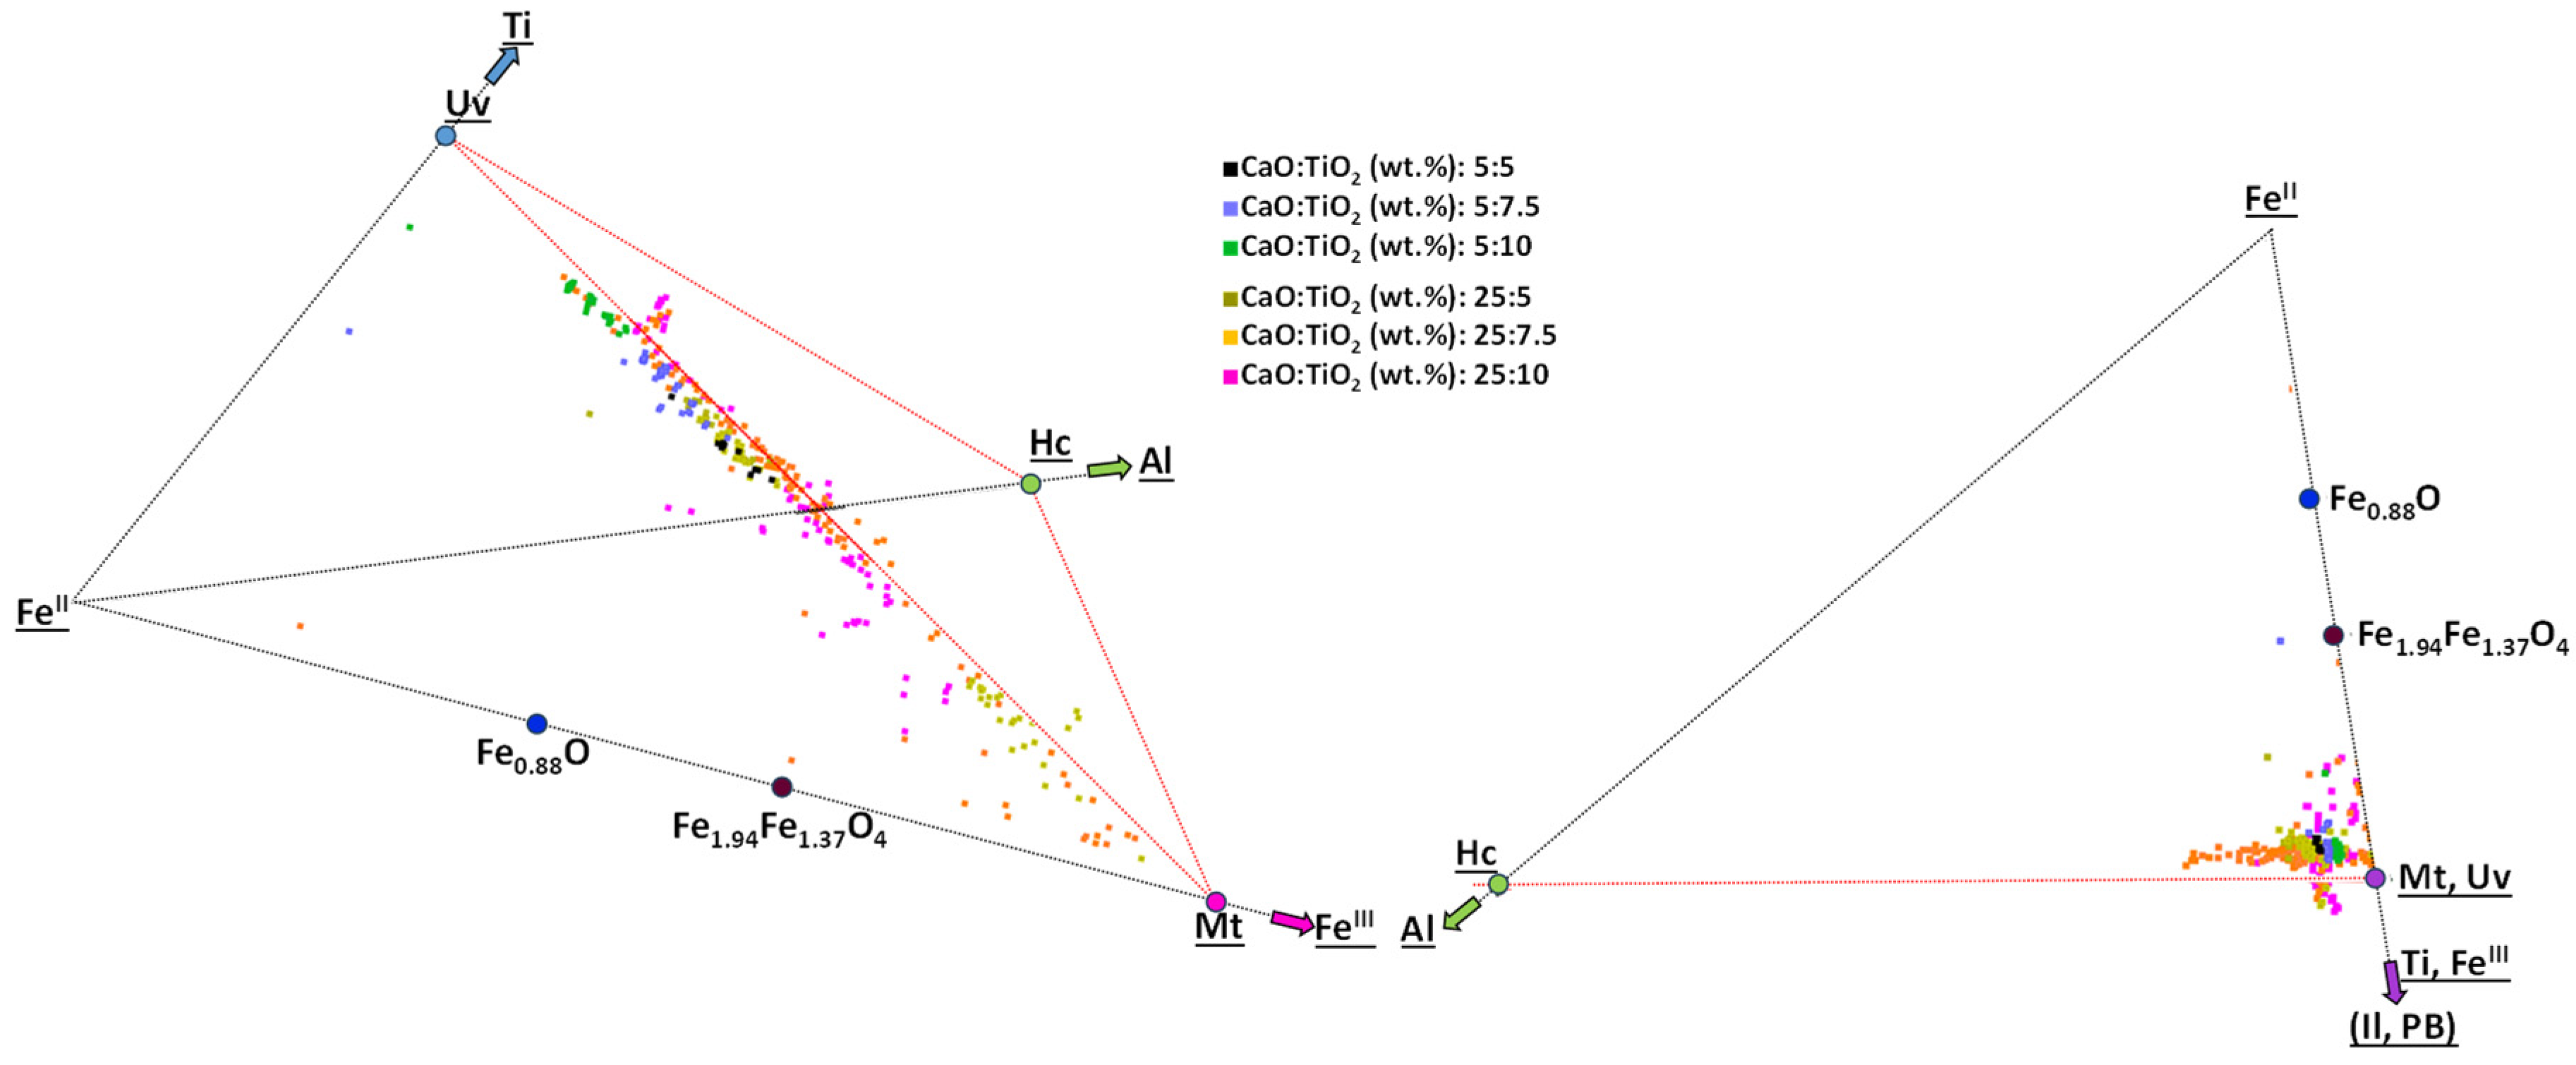
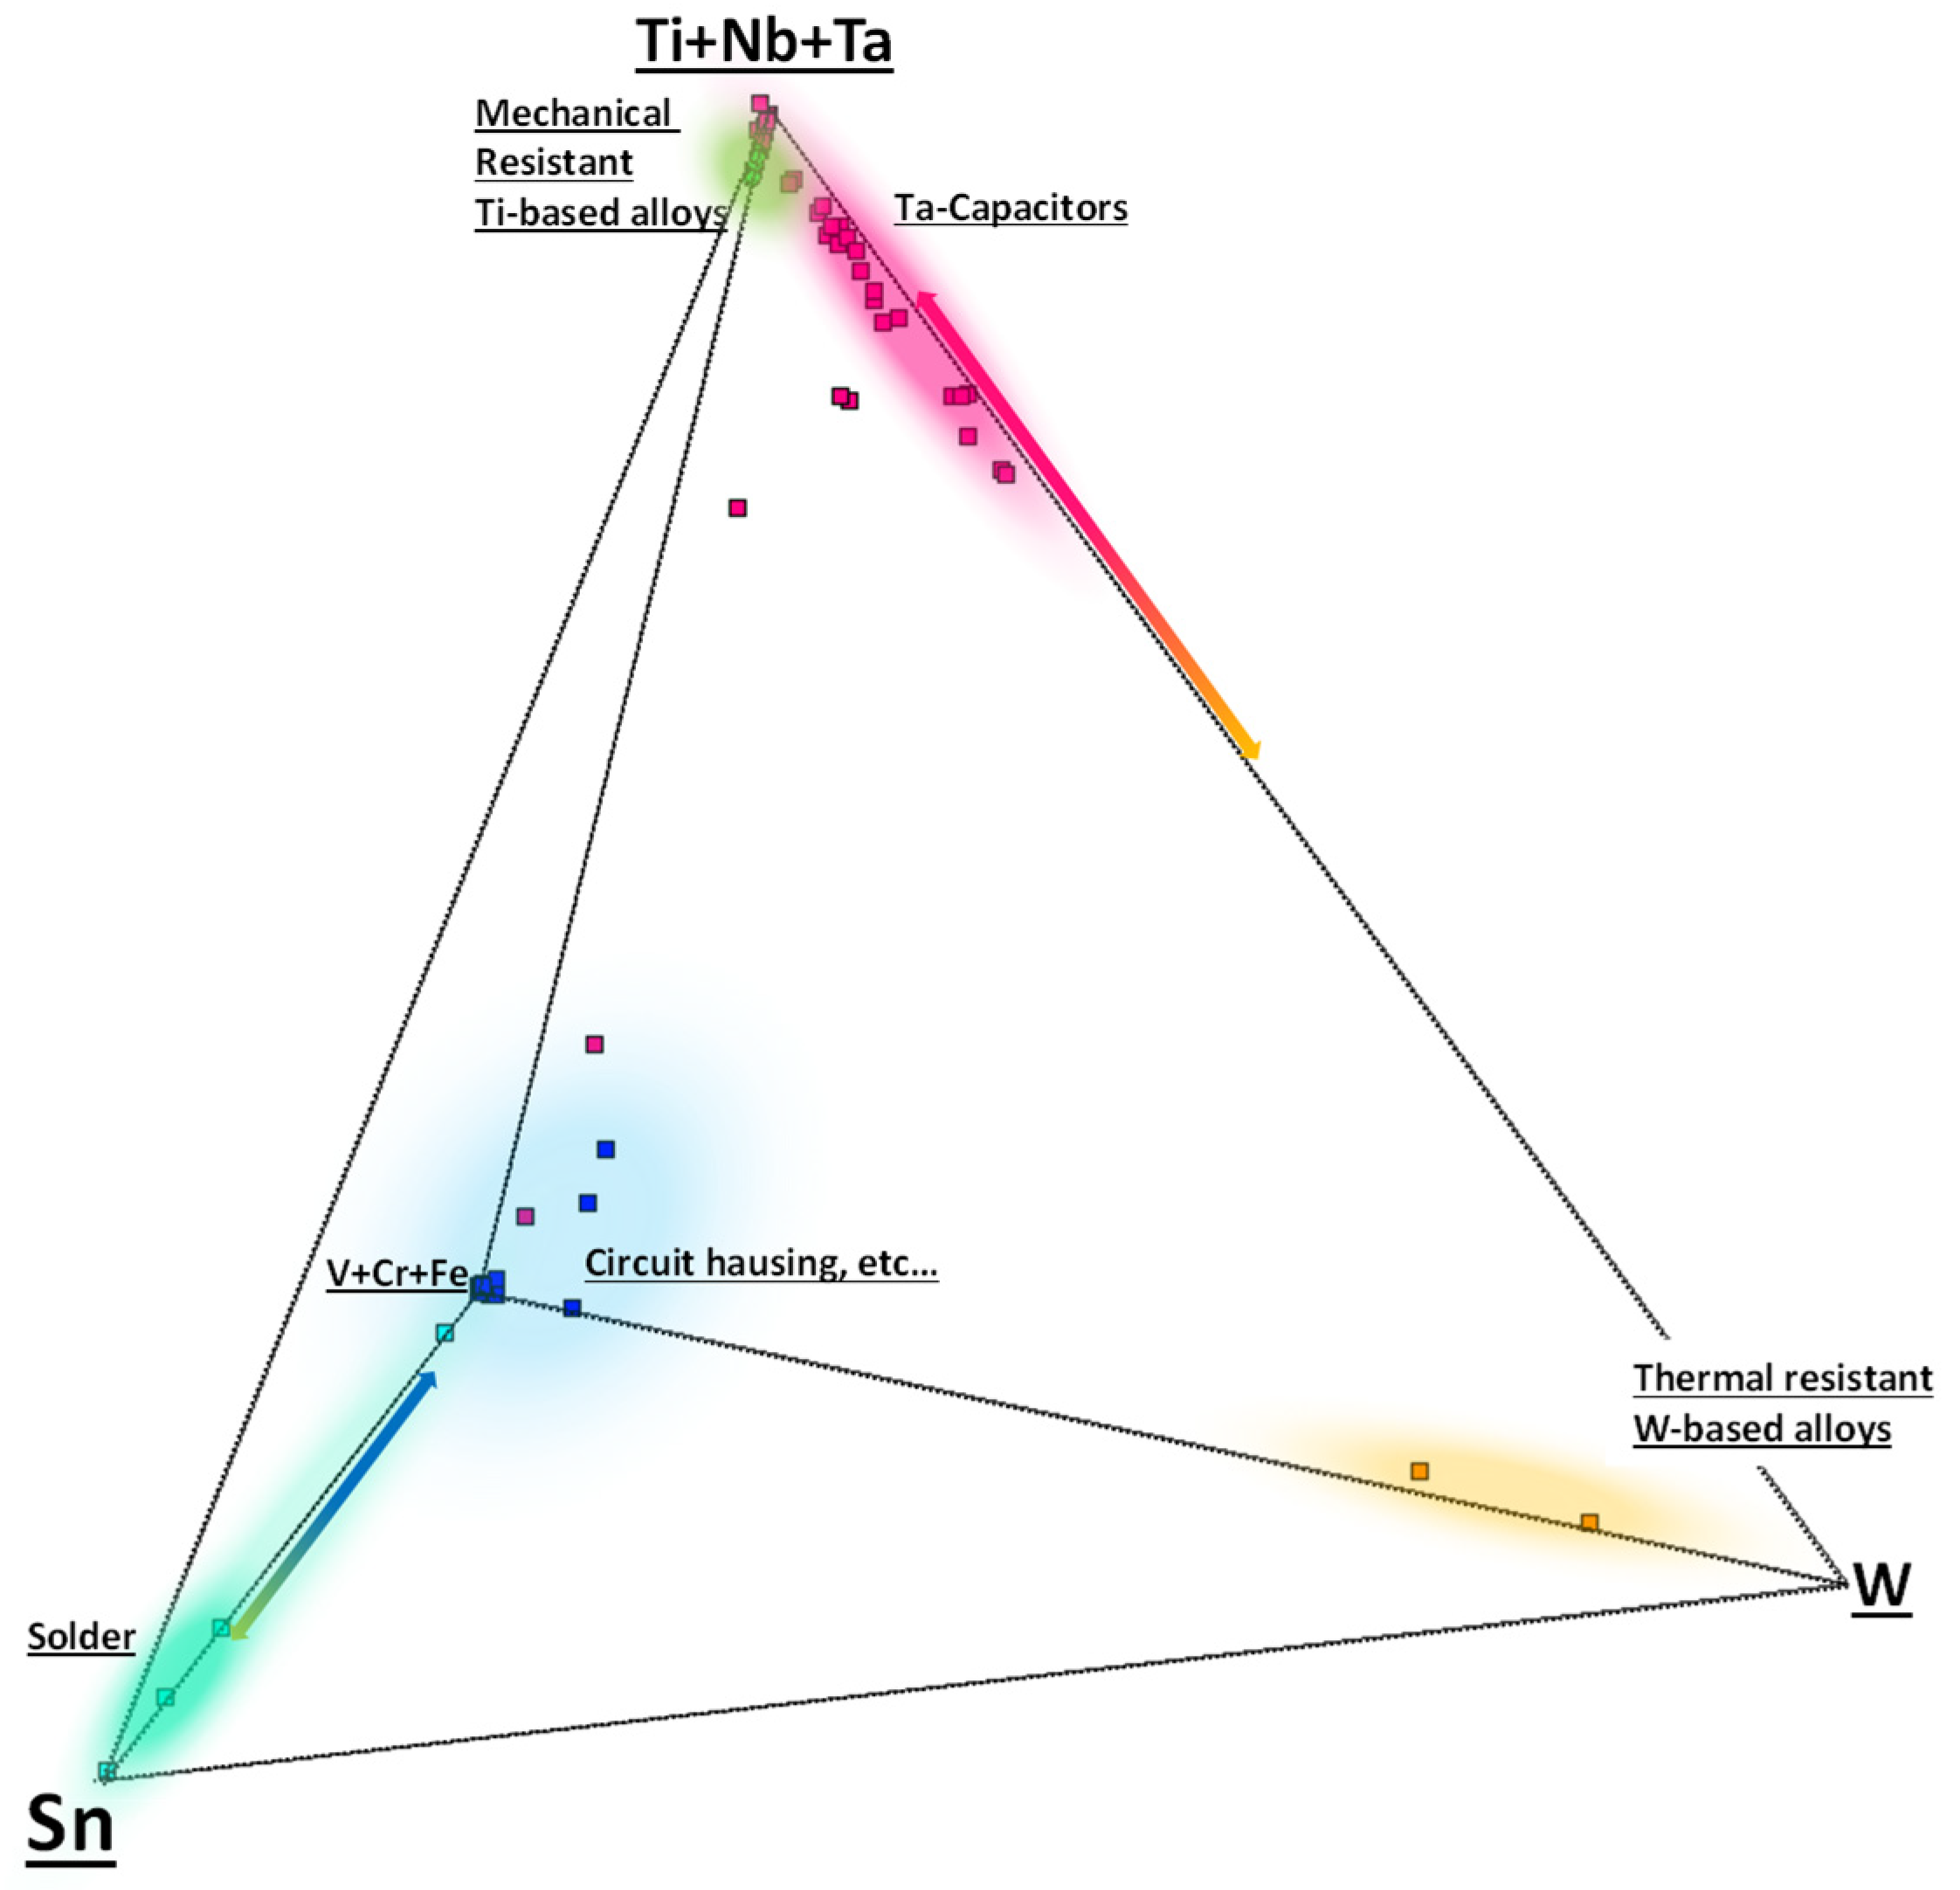
The particles partially dissolved or melted in the slag can be divided into different categories (Figure 18). Ti-, Nb-, and Ta-rich particles probably originate from Ta capacitors or mechanically highly stable Ti-based alloys (e.g., as housings). Particles with high W contents originate from high-temperature alloys. Sn-containing particles originate from solder alloys and V-Cr-Fe-rich particles from housings of electronic components such as circuit boards. Particles located on the connecting lines in the tetrahedral diagram can provide information as to which elements or alloys exhibit similar behavior. For example, there is a correlation between Ti/Nb/Ta-rich particles and W-rich particles, suggesting that these elements, which are considered particularly refractory, agglomerate into grains in the slag. On the other hand, correlations between Sn- and V/Cr/Fe-containing particles could indicate components that were soldered together. With ~7 wt.% FeO, this slag is more similar to the CAS series and also contains mainly akermanitic alumosilicates in the matrix.

4.3. Estimation of Phase Composition and Ta Balancing

In this subsection, the results of the PXRD, the detailed phase analysis, together with the theoretical overall composition calculated from the proportions of the oxides used to produce the silicate melt, are used to estimate the distribution of tantalum among the individual compounds.
  • SFS Series
No particular enrichment of Ta was detected in the target phase spinel, i.e., the iron-bearing ulvospinel–magnetite solid solution, nor in other compounds of the synthetic, iron-bearing fayalite base silicate melt, although certain correlations (e.g., with Ti; see Figure 12) were observed. Instead, the Ta tends to be distributed among the olivine and pyroxene matrix compounds. Due to the more or less uniform distribution of Ta in the samples, no distribution calculation was performed here.
  • CAS Series
In the titanium-containing silicate melts, a clear enrichment of Ta was observed in the target phase—the aforementioned perovskite-like Ca- and Ti-rich oxide.
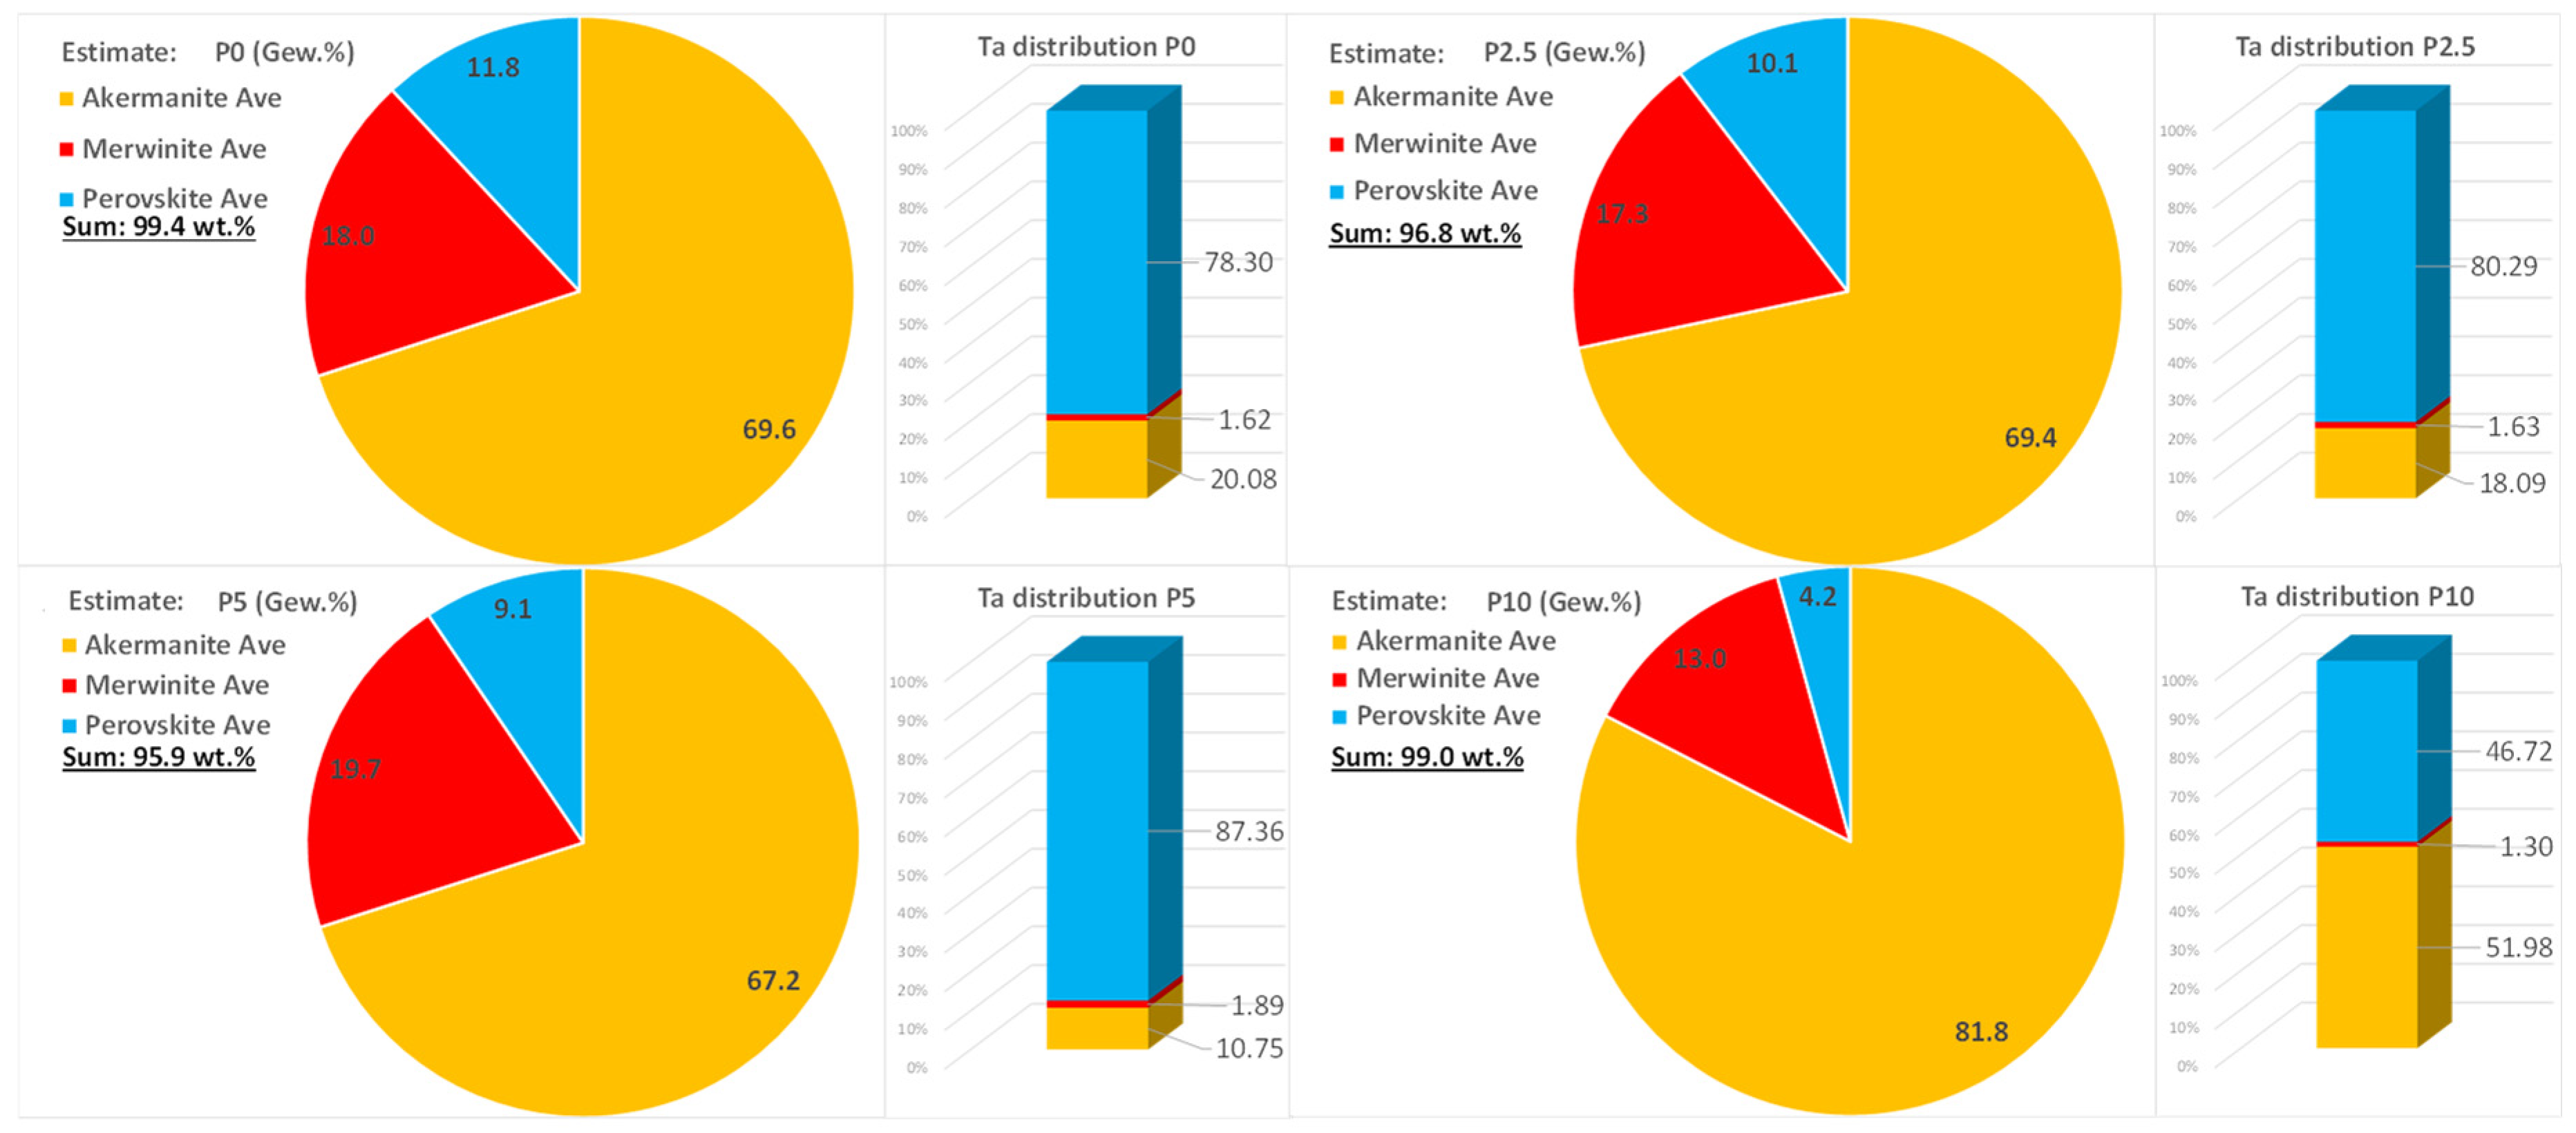
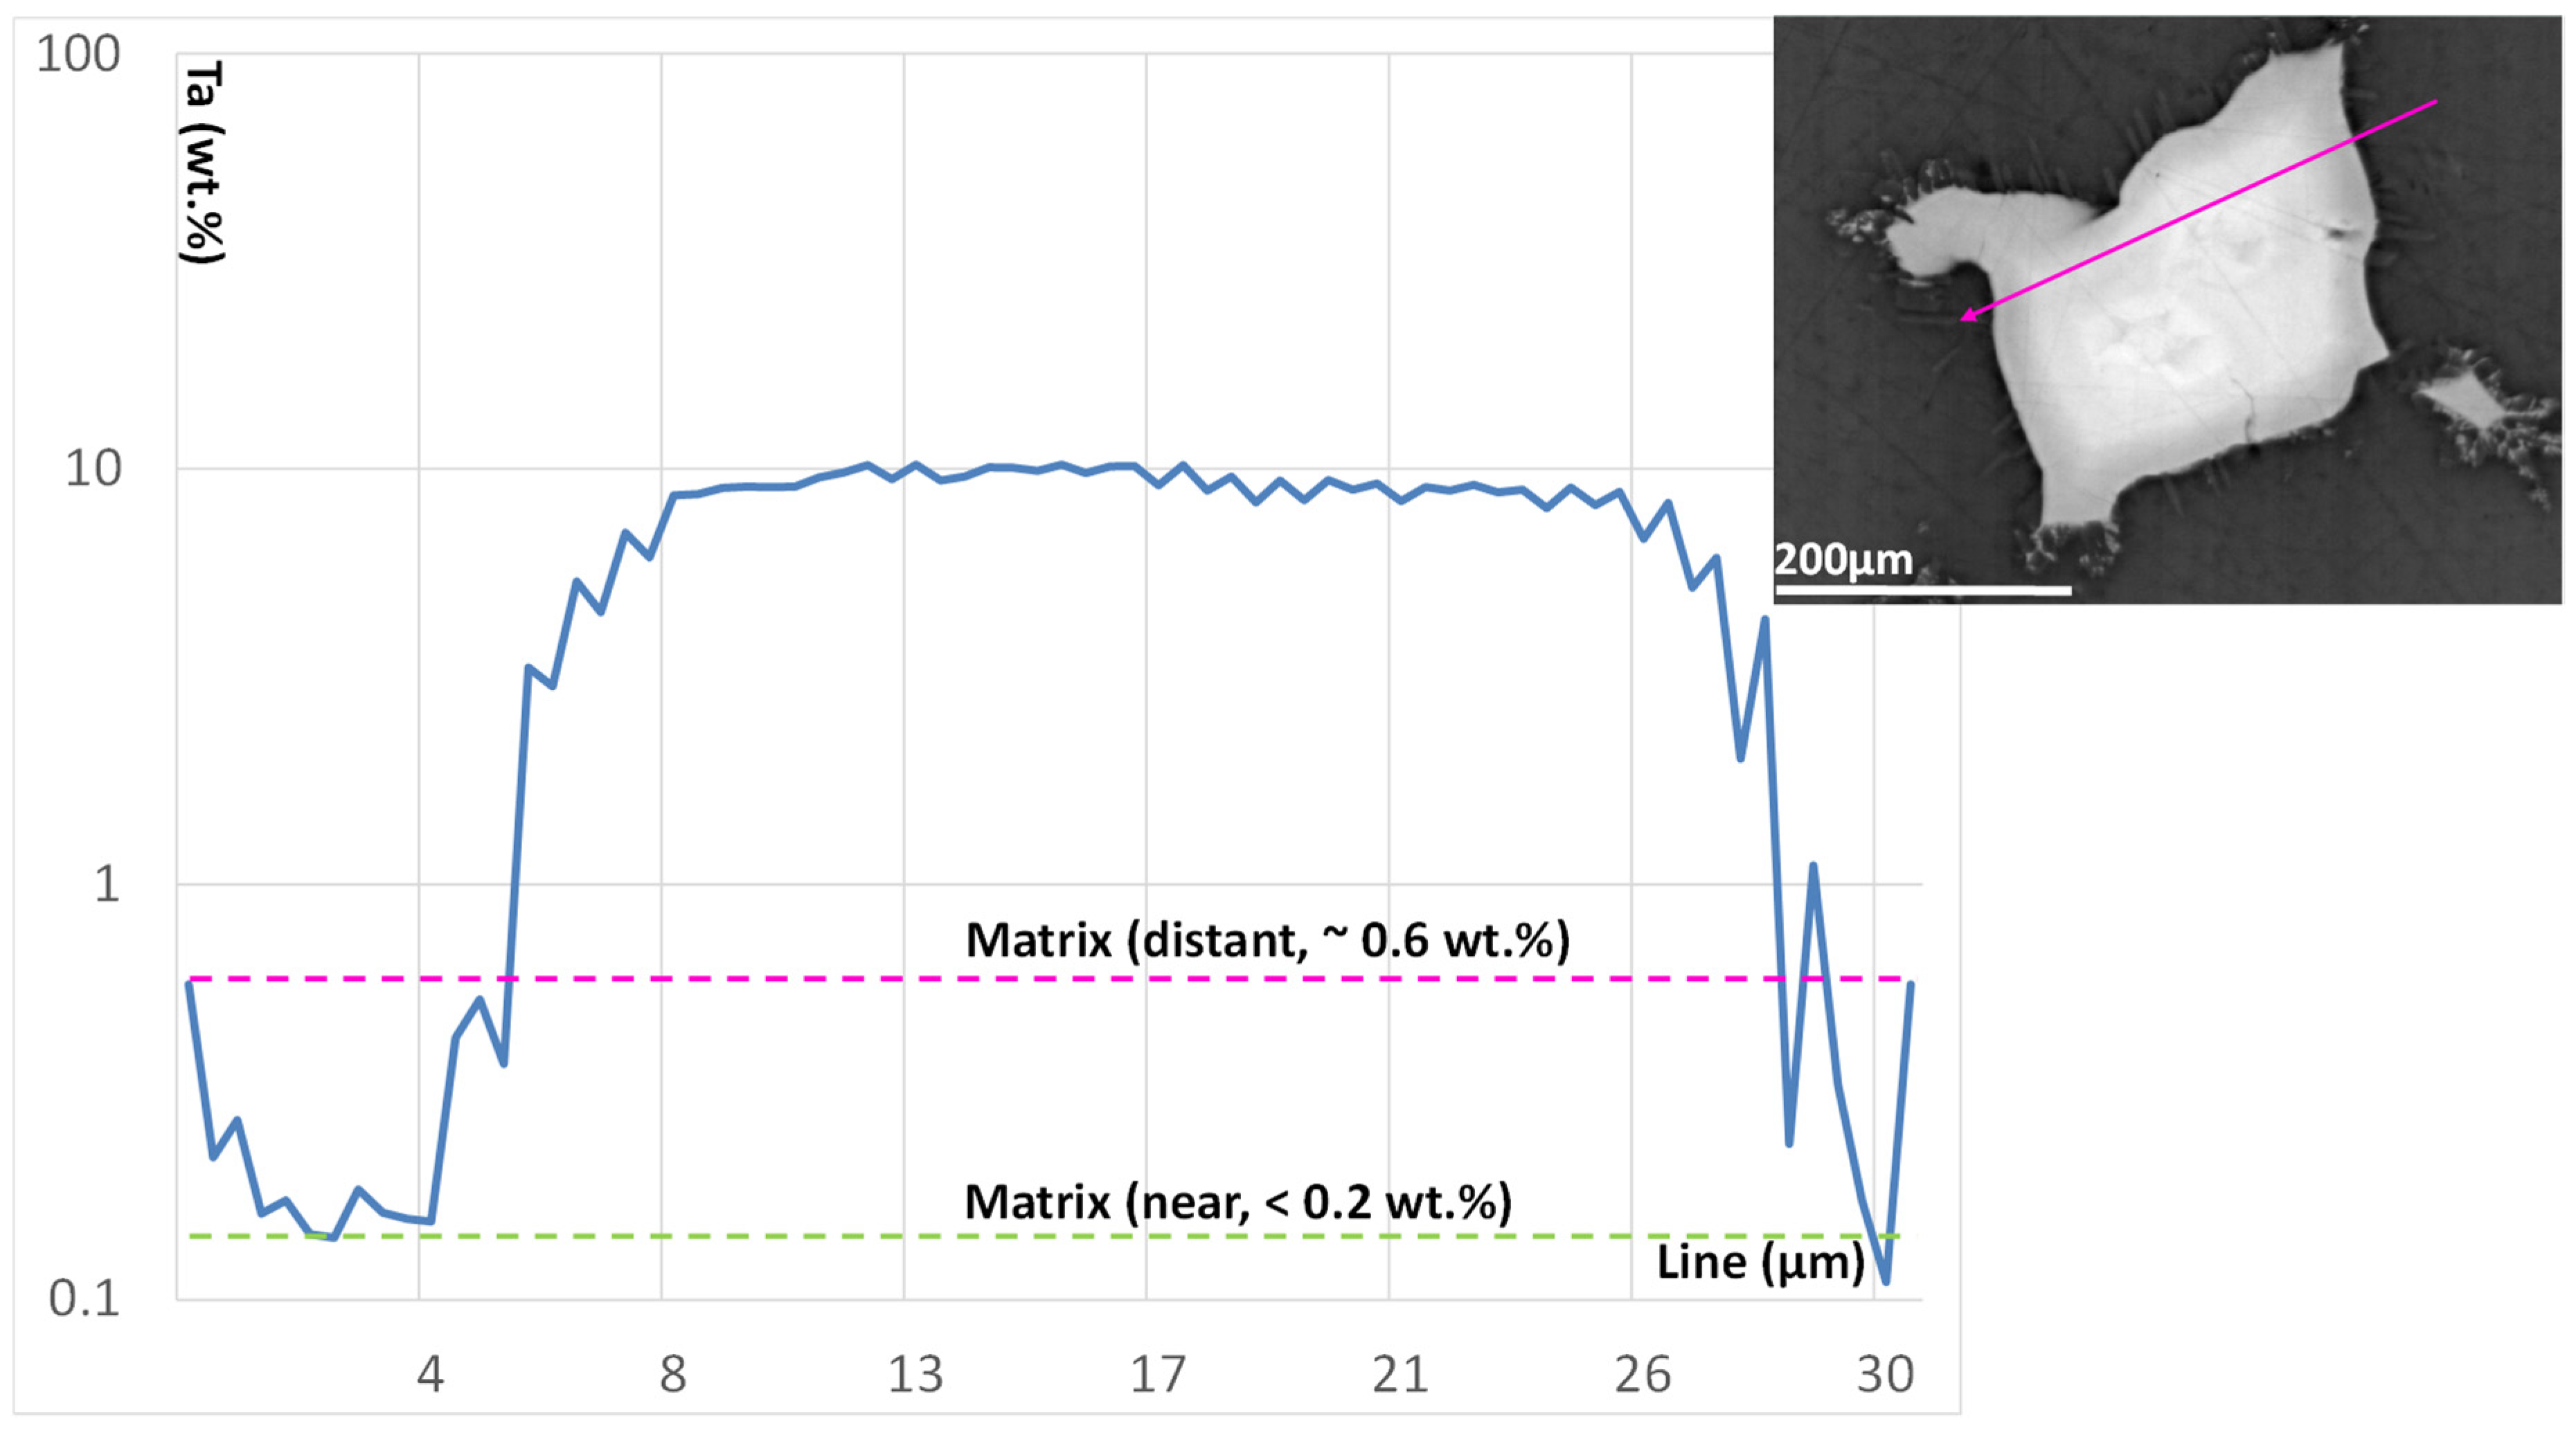
With the help of qualitative total phase analysis using PXRD and the EPMA point analysis data, the total phase composition was estimated semiquantitatively and the distribution of Ta across these phases was determined. In all samples, the aforementioned akermannite phase, merwinite, and the perovskite-like Ca-Ti oxide could be calculated (Figure 19). Merwinite could only be analyzed with sufficient accuracy using EPMA in sample P0, as the crystals in the iron-containing mixtures were too small for precise analysis (see Figure 4). Therefore, the merwinite analyses of sample P0 had to be used to estimate the phase composition of the other samples, assuming that no Fe was incorporated into the merwinite. In the best-case scenario for sample P5, more than 87% of the Ta could be enriched in the target phase. Although the enrichment of Ta in the perovskite-like oxides in sample P10 was highest (9.15 wt.%, see Figure 17), only an enrichment of just under 47% was achieved due to the low phase fraction of 4.2 wt.%. Line scans of perovskite grains in sample P10 show a reduction in Ta concentration in the matrix directly surrounding the grain. It can also be seen that Ta is more concentrated in the center of the grain (Figure 20). This is not evident to the same extent in the other samples, which all contain smaller perovskite grains.

5. Discussion

5.1. Behavior of the Selected Silicate Melt System

In this study, the EnAM concept was investigated in two different silicate melt systems, SFS and CAS. The focus was on the function of Ti as an additive for the formation of crystal structures that can incorporate Ta and the influence of the Ca/Fe ratio. Ti, a relatively common and comparatively inexpensive element, serves as a placeholder in the structure in which Ta is to be incorporated. It is already known that structures that incorporate highly charged small ions such as Ti4+ also incorporate highly charged ions of heavier elements (in this case Ta5+) (see Section 2). Two target phases were produced by the applied pyrometallurgical process (heating, holding time, and cooling) and the chemistry: Ti-Fe spinel and Ca-Ti perovskite. It turned out that in the former case, a solid solution of ulvospinel–magnetite–hercynite with additional small amounts of Mg is formed (however, hercynite is rather underrepresented). In the CAS series, with regard to stoichiometry, a compound, Ca(Ta,Ti,Al,Fe)O3, derived from CaTiO3 is formed. Unlike the spinel, this compound incorporates higher proportions of Ta, which can reach up to 10 wt.%.
The matrix phases must also be examined with regard to Ta incorporation, as even small amounts of Ta have a significant effect on the Ta balance due to the high absolute phase content (85–95 wt.%, see Figure 19). Here, too, there are differences between the two silicate melt systems. While olivine- and pyroxene-like structures occur in SFS, CAS contains akermanitic and merwinitic compounds. The most olivine-like structures (e.g., kirschsteinitic olivine, SFS) and merwinite (CAS) do not incorporate any significant amounts of Ta. In contrast, the pyroxene-type compounds (SFS) and akermanite compounds (CAS) show elevated Ta contents of 0.5–~1 wt.%.

5.2. Detailed Phase Characterization

  • SFS series
No formation of an EnAM compound suitable for Ta enrichment was observed in this silicate melt system. Instead, Ta distributed itself relatively evenly throughout the matrix. It has been shown that Ti-Fe spinel, as a target compound, incorporates only small amounts of Ta. At 0.05–0.5 wt.%, the contents are largely below those of the matrix phases, which incorporate up to ~1 wt.% Ta. In contrast to magnetite, which has a lower charge imbalance with regard to the charge of the ions involved (Fe2+/Fe3+), this imbalance increases in the presence of Ti4+, meaning that the structure of Ti-rich spinel (e.g., ulvospinel) could become too unstable for the incorporation of Ta5+. One additional possible explanation is, that when Ti4+ or Ta5+ are available for incorporation into the crystal structure of spinel, the lower-charged and smaller T4+ is thermodynamically preferred for incorporation. Furthermore, the ion activity of Ti in the silicate melt mixtures is also significantly higher, as the Ti additive is a main compound in the silicate melt mixtures. The PXRD results indicate that the spinel is a solid solution between ulvospinel and magnetite. It was observed through peak shift that the proportion of the ulvospinel component increased with rising Ti content (increasing Ti/Fe ratio). However, in this respect, the two sample series (low Ca content and high Ca content) must be considered separately. The latter observation was accompanied by an increase in the peak height, indicating a rise in spinel concentration, except for the Ti- and Ca-richest sample (25:10), in which a higher amount of amorphous compound was formed. It was also to be expected that the proportion of spinel in the calcium-rich sample set would be lower. What is unusual is that, based on the PXRD results, the spinel in the iron-rich, calcium-poor sample series contains a higher ulvospinel component.
However, the amount of the magnetite fraction in the Ti-Fe spinel solid solution depends on the Fe3+ content or the Fe3+/Fe2+ ratio in the melt. The higher the activity of Fe3+, the more magnetite can be expected in the spinel. The higher proportion of magnetite in the Ti-Fe spinel solid solution in the Ca-rich sample can therefore be explained by the high basicity or high proportion of CaO, as this compound increases the Fe3+/Fe2+ ratio and is able to support the oxidation of olivine (fayalite, [55,56] and references therein).
Another view is that the negative correlation with the fayalite peaks in the Ca-poor sample series indicates that the formation of fayalite hampers the formation of the Ti-Fe-spinel solid solution. Based on the temperatures calculated using equilibrium thermodynamic models, the crystallization of fayalite begins during spinel formation. This leads to the assumption that molecular dynamic processes in the melt surrounding the spinel could pull the Fe into the silicate melt fraction shortly before the first crystallization of fayalite, thereby enhancing the effect of Fe scavenging by fayalite and increasing the proportion of the ulvospinel component. In the Ca-rich sample series, kirschsteinite rather than fayalite is the corresponding silicate phase. The melting point of this compound is similar to that of fayalite ([57]). Therefore, a similar process could also occur here. Since kirschsteinite contains only half as much Fe as fayalite (the rest is Ca), the Fe loss due to crystallization of this compound would be significantly lower. In addition, the crystallization of spinel appears to be more efficient here, as can be seen from the significantly more idiomorphic crystal morphology. Furthermore, the crystals in the BSE-Z image show the segregation lamellae of a magnetic spinel. Therefore, it can be assumed that the spinel can incorporate or scavenge Fe more efficiently in this melt.
A more efficient crystallization with segregation in the Ca-rich sample series may slightly improve the incorporation of Ta into the titanium-rich spinel, but this does not make it truly suitable as a target phase for Ta enrichment (Figure 12).
Since Ta is not incorporated into the Ti-Fe spinel primary crystallizate, only the matrix phases remain as Ta host minerals. The matrix of the SFS series consists of possibly partially amorphous compounds with pyroxene-like and olivine-like crystallographic characteristics. The crystals in the Ca-rich samples with high Ca/Fe ratios, which can be clearly identified as kirschsteinitic olivines, incorporate virtually no Ta. This is plausible, since classic olivines incorporate only the divalent elements Mg, Fe, and Ca, in addition to Si4+. In contrast, the pyroxene-like phases, which also contain ~4–~7 wt.% Ti, show increased Ta contents of up to 1 wt.%. This is plausible, as the pyroxene structure is also flexible enough to incorporate elements with higher speciations (e.g., Ti4+). The observed flexibility for Ta5+ incorporation is slightly higher than that for Ti-Fe spinels, which is reflected in the consistently slightly higher Ta contents.
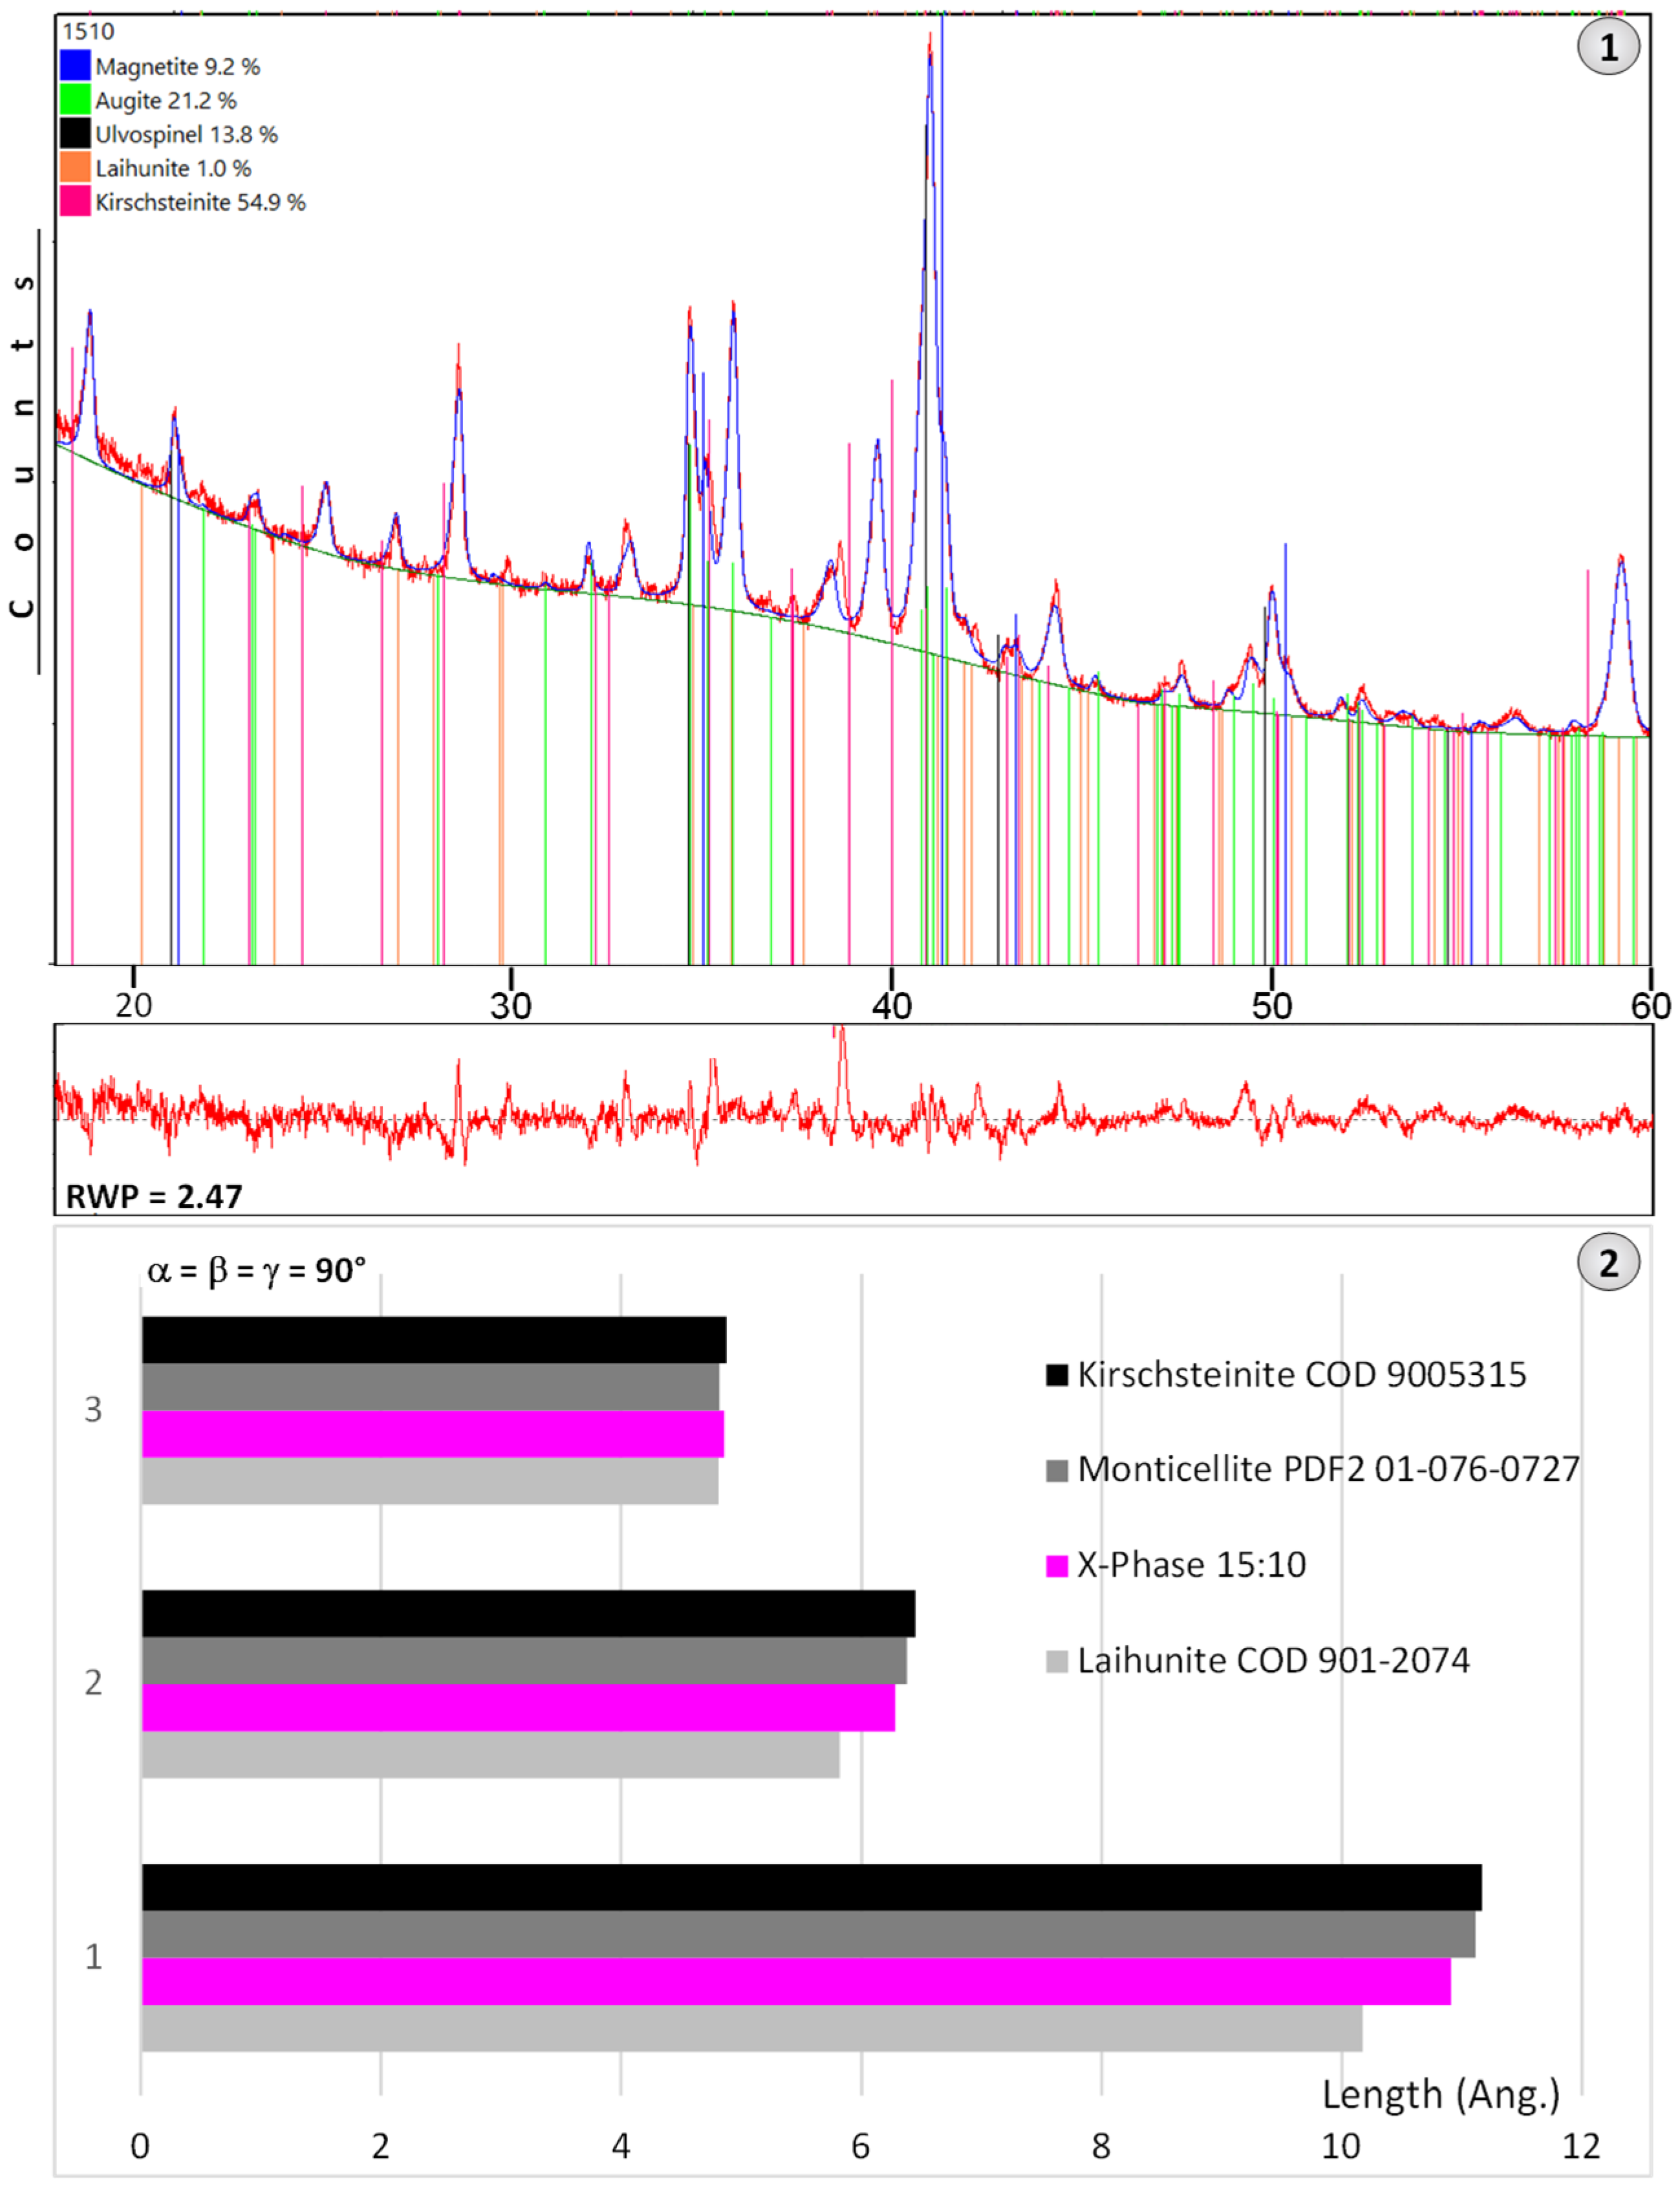
Compounds that hypothetically have an olivine structure are a special case, as PXRD provides evidence that such a structure must be present in all SFS samples. The peaks of these compounds in PXRD shift from fayalite towards kirschsteinite with increasing Ca content (Figure 7). The peaks of the additional sample with a medium Ca content (CaO:TiO2 = 15:10) lie almost exactly in the middle of the fayalite and kirschsteinite peaks. The stoichiometric calculations of the single-point analysis averages from EPMA also reveal, in addition to the pyroxene-like compounds, other phases that show the best results when calculated based on four oxygen atoms (Table 2) but which contain Al and Ti. The explanation for this result could lie in the existence of the mineral laihunite. This is an olivine-like mineral which, with the incorporation of Fe3+, shows that higher-valent ions can also be incorporated into this type of crystal structure. A comparison of the crystallographic parameters shows that laihunite bears a strong resemblance to olivines with respect to the lattice parameters such as kirschsteinite and monitcellite (Figure 21). To investigate the lattice parameters of the olivine-like phase, the additional sample CaO:TiO2 = 15:10 with an intermediate Ca concentration was used as this sample seems to resemble an intermediate composition between fayalite and kirschsteinite.
Furthermore, an example of a Rietveld refinement done using a kirschsteinite pattern shows that the unknown or hypothetical phase (“X-phase”) in sample CaO:TiO2 = 15:10 of the SFS series is also highly comparable to these crystallographic parameters. Unlike laihunite, the “X-phase” should be able to incorporate Al, Ti, and Ta, where part of the Al must also be shifted to the Si position in order to obtain the calculated stoichiometric formula (Mg,Ca,Fe2+)x(Al,Ti,Fe2+,Ta5+)y(Al,Si)zO4. Another theory is that the “X-phase” is an amorphous compound. However, this would not explain the signals in the PXRD. Furthermore, this phase would have to have a constant stoichiometry, which is usually not the case with amorphous structures.
  • CAS series
In this silicate melt system, a perovskitic early crystalline phase was produced which, with contents of up to 10 wt.%, shows promising properties for the enrichment of Ta. This shows that this structure appears to be particularly flexible for highly charged heavy element ions such as Ta5+. Since stoichiometric calculations have shown that Ta5+ is balanced in the structure by varying contents of Fe2+ and Al3+, it is not entirely clear how Ta is incorporated into perovskite compounds in the absence of these or comparable elements. However, as the Fe content increases, the proportion of perovskite decreases, while the size of the crystals increases. At the same time, the average Ta content rises from ~6.5 to over 9 wt.%. The morphology of the crystals is hypidiomorphic to idiomorphic and partly skeletal, with no clear correlation with the composition of the melt. What is clear is the significant increase in grain size in the sample with the highest Fe content. The BSE(Z) electron micrograph shows differences in brightness within the grains, indicating an uneven distribution of Ta. This is confirmed by EPMA. EPMA also confirms depletion of Ta in the matrix in the vicinity of the perovskite crystals (Figure 20).
The results do not clearly indicate the type of solid solution(s) present (Figure 16). If CaTa0.4FeO3, as indicated by the extension of the correlation of the mean values, exists, there is probably a miscibility gap, as this (hypothetical) compound is unlikely to have a perovskite structure. Stoichiometric calculations follow a similar trend when continued in the direction of increasing Ta and decreasing Ti contents. The fact that the measurement points of the individual sample data sets run in the direction of the (hypothetical) component, CaTa0.8O3, again indicates a potential solid solution, CaTiO3-CaTa0.8O3. This solid solution could then be complete, as it is to be expected that CaTa0.8O3 also has a perovskitic crystal structure. This development could be realized in the pure CaO-TiO2-Ta2O5 system.
  • Industrial Slag
No specific Ta phase was detected in this silicate melt, as the Ta scrap did not dissolve in the melt. Consequently, no real new phases formed; rather, the particles fused together to form alloys.

5.3. Assessment of Potential EnAMs and Ta Balancing

A semiquantitative phase analysis can be performed to evaluate the Ta scavenging efficiency of the target phase. If the proportion of the target phase and the average Ta of all phases in the sample contents are known, the percentage of each phase can be determined using the bulk Ta content of the sample. The accuracy of these results depends on how homogeneous the composition of the phases is. It should be noted that most compounds that form with the solidification of the silicate melts are solid solutions with a concentration range corresponding to all the elements they contain. The following formulas are used to determine the phase composition:
REl(wt.%) = CEl(init)(wt.%) − ∑CEl(Phase)(wt.%) ×CPhase(wt.%) ×F = min
[100(wt.%) − ∑Phases(wt.%)](abs) = Δ(abs) = min
where REl = the rest of the element concentration after subtraction of all partial concentration portions of phases, CEl(init) = the measured bulk concentration, CEl(Phase) = the concentration of the element in the phases of interest, CPhase = the element concentration in the phase, and F = the optional factor if the element has to be assigned to more than one phase.
  • SFS Series
Since no real Ta enrichment in a certain phase was detected in the SFS series, no balancing was performed. The assessment here is that no target phase for Ta enrichment is formed in this system.
  • CAS Series
In this series, Ta enriched itself in a perovskite-like compound. This being the case, it makes sense to calculate the percentage of Ta enrichment. The semiquantitative calculations of the matrix composition show that the akermanitic matrix accounts for approximately 70–80% and the merwinitic matrix for 13–20% by weight. In the iron-free and both low-iron samples, approximately 10 wt.% perovskite formed. In the most iron-rich sample, however, only ~4 wt.% of this phase was detected. Although the perovskite in this sample contained noticeably more Ta (Figure 17), this was not enough to compensate for the much lower percentage of this phase. The enrichment efficiency therefore appears to reach a maximum of close to 90% Ta scavenging efficiency in the range of 5 wt.% FeO addition (Figure 19). A selected profile of the matrix and one of the perovskite grains shows that the matrix around the grain is depleted in Ta (Figure 20). In this case, the formation of fewer large crystals may also be disadvantageous, as the free path length between the grains is then too large for efficient scavenging of Ta because of the limited diffusion rate, which is influenced by, among other factors, the viscosity of the melt.
IndustrialSlag from the SynconProcess
The phase composition of this slag is too heterogeneous, with some metals/alloys exhibiting varying degrees of oxidation and heavily fluctuating element contents, making it impossible to determine a target phase. Unlike synthetic melts, this metallurgical material, besides Ta, contains additional elements such as V, Cr, Nb, Sn, and W, which are concentrated in primary particles that are unable to dissolve and homogenize in the melt during the melting process at the specified time and temperature. Therefore, it is not possible to determine in which compounds or mineralogical phases these elements would accumulate after complete dissolution and homogenization in the melt. Nevertheless, distinct elemental correlations provide insight into their origin and affinities. Ti, Nb, and Ta are closely related and likely originate from capacitors (Nb and Ta), hard alloys (Ti and Nb), or high-temperature alloys (together with W). However, since Ti, Nb, and Ta in particular often occur together in the particles, an affinity between these elements (and possibly W as well) can be assumed. This suggests that Nb can also be enriched in perovskite-like compounds together with Ta when Ti is added as an additive.

6. Conclusions and Outlook

The subject of the investigation was the establishment of a new EnAM for the recovery of Ta. The prerequisite is complete dissolution of the Ta in the silicate melt and the associated more or less uniform distribution of Ta in the melt.
According to the thermodynamic simulation, at equilibrium, ulvospinel and perovskite are each formed in different silicate melt systems, SFS and CAS. It was demonstrated by varying the minor components, Ca and Ti, that both studied phases are concurrently formed, though in low fractions. This assessment allowed the investigation of Ta enrichment in experimental practice. Moreover, simulations determined the transition temperatures at which the predicted phases form at equilibrium but did not consider eventual experimental practice limitations like heating loss and possibly undesired precipitations during the cooling by removing the samples at 1050 °C.
The investigations show that Ti, as an additive, is capable of forming a target phase that incorporates a high percentage of Ta. The phase reactions during solidification of a fayalitic (SFS) and a Ca-alumosilicate (CAS) sample series were compared. It was found that, in the former case, the addition of Ti produces an ulvospinel–magnetite spinel solid solution as an early crystallite, but its crystal structure is not suitable for the incorporation of Ta. In low-iron alumosilicate silicate melt systems—at least below 10 wt.% FeO—a perovskitic compound forms as a primary crystallizate, which incorporates up to ~9 wt.% Ta at the Ta concentrations used (~1 wt.%) and enables a scavenging efficiency of almost 90% in the optimal case. A small amount of Fe (here 5 wt.% FeO) appears to be advantageous in this process.
In the perovskite compound, the excess charge resulting from the exchange of Ti4+ for Ta5+ is balanced by Fe2+ and Al3+. In the iron-free system, Al3+ completely takes over the charge compensation. Mg2+ plays no role in this process—on the one hand, due to its negligible content in the phase itself, and on the other hand because, if anything, it would be expected to be found in place of Ca2+ in the structure. Whether a perovskite compound also forms in a simpler SiO2-CaO-TiO2-Ta2O5 system will be investigated in further studies with the aim of understanding the perovskite reaction. It would be necessary to investigate whether sub-stoichiometric compounds of a hypothetical solid solution, CaTiO3-CaTa0.8O3, exist.
The characterization of remelted industrial slag shows that existing processes currently in use do not necessarily result in the complete dissolution of metal scrap. This makes it difficult to compare them with the EnAM approach, which is based on complete dissolution and homogenization with the formation of a completely new target phase. In the industrial slag examined, the elements were still very strongly distributed in their original context. However, it is possible to identify which other elements could be of interest for investigating the EnAM approach. In addition to Ti and Ta, these include the heavy elements Nb, W, and Sn, as well as V and Cr. The presented investigation could provide interesting insights, particularly for the recovery of Nb. Therefore, the behavior of Nb or mixtures of Nb and Ta should also be investigated in the next series of samples. The EnAM approach could be particularly valuable if Nb and Ta are to be explicitly enriched in a target compound in order to separate them from other potentially undesirable heavy elements such as Sn or W (and possibly also Zr or rare earths), which can then be enriched in other compounds (e.g., REE in apatitic structures or Zr in pyrochlore-type compounds; see [58]).

Author Contributions

Conceptualization, T.S.; Funding acquisition, B.F.; Investigation, T.S., J.W., F.M., D.M., H.L. and B.F.; Methodology, T.S., J.W., F.M., D.M., H.L. and B.F.; Project administration, B.F.; Supervision, T.S.; Visualization, T.S., J.W., F.M., D.M. and H.L.; Writing—original draft, T.S., J.W., F.M., D.M. and H.L.; Writing—review and editing, T.S., J.W., F.M., D.M., H.L. and B.F. All authors have read and agreed to the published version of the manuscript.

Funding

This research was funded by the German Research Foundation (DFG) within the scope of the priority program “Engineered Artificial Minerals (EnAM)—a geo-metallurgical tool to recycle critical elements from waste streams” (SPP2315).

Data Availability Statement

Part of the research data used to generate the diagrams are openly available at https://doi.org/10.21268/20260316-0. Further data and visualizations supporting the conclusions of this article will be made available by the authors on request.

Acknowledgments

The authors acknowledge the financial support of the German Research Foundation within the priority program “Engineered Artificial Minerals (EnAM)—a geo-metallurgical tool to recycle critical elements from waste streams” (Ref. SPP 2315). We additionally acknowledge the support of the Open Access Publishing Fund of the Clausthal University of Technology. We would like to thank Dietlind Nordhausen, Silke Schlenczek, Petra Sommer, Heike Grosse, and Maike Gamenik from the Institute of Geotechnology and Mineral Resources (IGMR) for their assistance in carrying out the analytical work.

Conflicts of Interest

The authors declare no conflicts of interest. The funders had no role in the design of the study; in the collection, analyses, or interpretation of data; in the writing of the manuscript; or in the decision to publish the results.

Abbreviations

The following abbreviations are used in this manuscript:
BSE-ZBackscattered Electrons with Z Contrast
CASCa-Alumosilicate Melt
CODCrystal Open Database
CRMCritical Raw Material
DFGDeutsche Forschungsgemeinschaft
DOIDigital Object Identifier
EDXEnergy-Dispersive X-Ray Fluorescence
EnAMEngineered Artificial Mineral
EPMAElectron Probe Microanalysis
FEField Emission
ICDDInternational Center of Diffraction Data
pdf-2Powder Diffraction File 2
PXRDPowder X-Ray Diffraction
SFSSynthetic Fayalite Silicate Melt
TRLTechnological Readiness Level
WDXWavelength-Dispersive X-Ray Fluorescence
WEEEWaste Electrical and Electronic Equipment
X-PHIφ(χ) (Phi-Chi) X-Ray Absorption/Emission Model
XRDX-Ray Diffraction

References

  1. Damm, S. Rohstoffrisikobewertung—Tantal; German Mineral Resources Agency (DERA): Berlin, Germany; p. 82.
  2. Köck, W.; Paschen, P. Tantalum—Processing, Properties and Applications. JOM 1989, 41, 33–39. [Google Scholar] [CrossRef]
  3. Cornelis, P.B.; Kuehr, R.; Yamamoto, T.; McDonald, R.; D’Angelo, E.; Althaf, S.; Bel, G.; Deubzer, O.; Fernandez-Cubillo, E.; Forti, V.; et al. The Global E-Waste Monitor 2024. 2024. Available online: https://ewastemonitor.info/the-global-e-waste-monitor-2024/ (accessed on 23 July 2025).
  4. Directive 2012/19/EU of the European Parliament and of the Council of 4 July 2012 on Waste Electrical and Electronic Equipment (WEEE) (Recast) Text with EEA Relevance. Available online: https://eur-lex.europa.eu/legal-content/DE/TXT/?uri=CELEX:32012L0019 (accessed on 25 March 2026).
  5. Schirmer, T.; Hiller, J.; Weiss, J.; Munchen, D.; Lucas, H.; Fittschen, U.E.A.; Friedrich, B. Behavior of Tantalum in a Fe-Dominated Synthetic Fayalitic Slag System—Phase Analysis and Incorporation. Minerals 2024, 14, 262. [Google Scholar] [CrossRef]
  6. de Oliveira, J.M.; Anes, I.A.; Coleti, J.L.; Espinosa, D.C.R.; de Carvalho, M.S.; Tenório, J.A.S. Niobium and Tantalum Recovery from the Primary Source and from Tin Slag, an Industrial Challenge: A Review. Can. J. Chem. Eng. 2023, 101, 1743–1761. [Google Scholar] [CrossRef]
  7. Allain, E.; Kanari, N.; Diot, F.; Yvon, J. Development of a Process for the Concentration of the Strategic Tantalum and Niobium Oxides from Tin Slags. Miner. Eng. 2019, 134, 97–103. [Google Scholar] [CrossRef]
  8. Schwich, L.; Küpers, M.; Finsterbusch, M.; Schreiber, A.; Fattakhova-Rohlfing, D.; Guillon, O.; Friedrich, B. Recycling Strategies for Ceramic All-Solid-State Batteries—Part I: Study on Possible Treatments in Contrast to Li-Ion Battery Recycling. Metals 2020, 10, 1523. [Google Scholar] [CrossRef]
  9. Niobium-Titanium Alloys in High-Performance Capacitors, Optical Coatings, and Conductive Components. Available online: https://www.samaterials.com/blog/niobium-titanium-alloys-in-high-performance-capacitors-optical-coatings-and-conductive-components.html (accessed on 9 September 2025).
  10. Utmel. What Is Tantalum Capacitor: Structure, Failure and Application Guide. Available online: https://www.utmel.com/blog/categories/capacitors/what-is-tantalum-capacitor-structure-failure-and-application-guide (accessed on 9 September 2025).
  11. Cramer, J.; Gaudin, M.; Morvan, D.; Semetey, V.; Rousseau, F. Extraction and Recovery of Tantalum from Capacitors Using Conventional Separation Methods Assisted by Thermal Plasma. ACS Sustain. Resour. Manage 2024, 1, 1076–1086. [Google Scholar] [CrossRef]
  12. Gulyaeva, R.I.; Tyushnyakov, S.N.; Udoeva, L.Y.; Petrova, S.A.; Sel’menskikh, N.I.; Russkikh, A.S.; Marshuk, L.A. Structural-Phase States of Iron-Based Alloys Produced by Aluminothermic Reduction Smelting of Ta–W Waste. J. Sustain. Metall. 2025, 11, 1104–1120. [Google Scholar] [CrossRef]
  13. Weiss, J.; Munchen, D.; Richter, S.; Friedrich, B. Crystallization Study of a Synthetic Fayalitic Slag System with Ta Based on Thermochemical Modeling. In Proceedings of the 63rd Conference of Metallurgists, COM 2024; Metallurgy and Materials Society of CIM, Ed.; Springer Nature: Cham, Switzerland, 2025; pp. 1361–1368. [Google Scholar]
  14. Briese, D.; Herden, A.; Esper, A. Mineralische Nebenprodukte und Abfälle: Aschen, Schlacken, Stäube und Baurestmassen 6; Thiel, S., Thomé-Kozmiensky, E., Senk, D., Wotruba, H., Pretz, T., Eds.; TK Verlag: Neuruppin, Germany, 2019. [Google Scholar]
  15. Vutova, K.; Stefanova, V.; Iliev, P. Application of Electron Beam Melting Method for Recycling of Tantalum Scrap. Mater. Res. Express 2024, 11, 106505. [Google Scholar] [CrossRef]
  16. Puziewicz, J.; Zainoun, K.; Bril, H. Primary Phases in Pyrometallurgical Slags from A Zinc-Smelting Waste Dump, Swietochlowice, Upper Silesia, Poland. Can. Mineral. 2007, 45, 1189–1200. [Google Scholar] [CrossRef]
  17. Tian, B.; Wei, Y.; Zhou, S.; Li, B. Effect of Alumina on Copper Smelting of Fayalite-Based Slag System. Metall. Mater. Trans. B 2024, 55, 962–972. [Google Scholar] [CrossRef]
  18. Wang, Y.; Huang, S.; Blanpain, B.; Guo, M. Solidification Behavior of the FeOt-SiO2-CaO-Al2O3-(ZnO) Slag System. Ceram. Int. 2024, 50, 25792–25800. [Google Scholar] [CrossRef]
  19. Peys, A.; Pires Martins, N.; Prado Araujo, F.; Komnitsas, K.; Nielsen, P. High-Temperature Slag Engineering in Pursuit of Effective Mineral Carbonation of Pyroxene-Rich Ferronickel Slag. J. CO2 Util. 2025, 95, 103077. [Google Scholar] [CrossRef]
  20. Gammons, C.H.; Kaplan, J. Mineralogy and Environmental Geochemistry of Copper Slag from Butte, Montana. J. Geochem. Explor. 2024, 267, 107599. [Google Scholar] [CrossRef]
  21. Bartelmy, D. Webmineral Mineralogy Database. 2010. Available online: https://www.webmineral.com/ (accessed on 25 March 2026).
  22. Mackay, D.A.R.; Simandl, G.J. Geology, Market and Supply Chain of Niobium and Tantalum—A Review. Miner. Depos. 2014, 49, 1025–1047. [Google Scholar] [CrossRef]
  23. Feng, D.; Navrotsky, A. Thermochemistry of Rare Earth Perovskites. MRS Adv. 2016, 1, 2695–2700. [Google Scholar] [CrossRef]
  24. Gaballah, I.; Allain, E.; Djona, M. Extraction of Tantalum and Niobium from Tin Slags by Chlorination and Carbochlorination. Metall. Mater. Trans. B 1997, 28, 359–369. [Google Scholar] [CrossRef]
  25. Xie, K.; Wei, X.; Ye, L.; Wan, M.; Li, S.; Wu, J. Recovery and Preparation of Potassium Fluorotantalate from High-Tantalum-Bearing Waste Slag by Pressure Alkaline Decomposition. Metals 2022, 12, 648. [Google Scholar] [CrossRef]
  26. Adelmann, C.; Delabie, A.; Schepers, B.; Rodriguez, L.N.J.; Franquet, A.; Conard, T.; Opsomer, K.; Vaesen, I.; Moussa, A.; Pourtois, G.; et al. Atomic Layer Deposition of Tantalum Oxide and Tantalum Silicate from Chloride Precursors. Chem. Vap. Depos. 2012, 18, 225–238. [Google Scholar] [CrossRef]
  27. Reeve, D.A.; Bright, N.F.H. Phase Relations in the System CaO-Ta2O5-SiO2. J. Am. Ceram. Soc. 1969, 52, 405–409. [Google Scholar] [CrossRef]
  28. Kamba, S.; Petzelt, J.; Buixaderas, E.; Haubrich, D.; Vaněk, P.; Kužel, P.; Jawahar, I.N.; Sebastian, M.T.; Mohanan, P. High Frequency Dielectric Properties of A5B4O15 Microwave Ceramics. J. Appl. Phys. 2001, 89, 3900–3906. [Google Scholar] [CrossRef]
  29. Ubic, R.; Merry, J.C.; Leach, A.C. Electron Microscopy of Lead and Calcium Pyrochlores. J. Eur. Ceram. Soc. 2004, 24, 1725–1728. [Google Scholar] [CrossRef]
  30. Chen, J. Advances in High-Pressure Technology for Geophysical Applications, 1st ed.; Elsevier: Amsterdam, The Netherlands, 2005. [Google Scholar]
  31. Okrusch, M.; Matthes, S. Mineralogie: Eine Einführung in Die Spezielle Mineralogie, Petrologie und Lagerstättenkunde; Lehrbuch; 9. Aufl.; Springer Spektrum: Berlin, Germany, 2014. [Google Scholar]
  32. Shannon, R.D. Revised Effective Ionic Radii and Systematic Studies of Interatomic Distances in Halides and Chalcogenides. Acta Crystallogr. Sect. A 1976, 32, 751–767. [Google Scholar] [CrossRef]
  33. Bosi, F.; Halenius, U.; Skogby, H. Crystal Chemistry of the Magnetite-Ulvospinel Series. Am. Mineral. 2009, 94, 181–189. [Google Scholar] [CrossRef]
  34. Tan, W.; Liu, P.; He, H.; Wang, C.Y.; Liang, X. Mineralogy and Origin of Exsolution In Ti-Rich Magnetite From Different Magmatic Fe-Ti Oxide-Bearing Intrusions. Can. Mineral. 2016, 54, 539–553. [Google Scholar] [CrossRef]
  35. Johnsson, M.; Lemmens, P. Crystallography and Chemistry of Perovskites. In Handbook of Magnetism and Advanced Magnetic Materials; Kronmüller, H., Parkin, S., Eds.; Wiley: Hoboken, NJ, USA, 2007. [Google Scholar]
  36. Parker, L.R.; Fleischer, M. Geochemistry of Niobium and Tantalum; Geological Survey Professional Paper; Superintendent of Documents; U.S. Government Printing Office: Washington, DC, USA, 1968.
  37. Baier, J.; Audétat, A.; Keppler, H. The Origin of the Negative Niobium Tantalum Anomaly in Subduction Zone Magmas. Earth Planet. Sci. Lett. 2008, 267, 290–300. [Google Scholar] [CrossRef]
  38. Knight, K.S. Parameterization of The Crystal Structures of Centrosymmetric Zone-Boundary-Tilted Perovskites: An Analysis in Terms of Symmetry-Adapted Basis-Vectors of The Cubic Aristotype Phase. Can. Mineral. 2009, 47, 381–400. [Google Scholar] [CrossRef][Green Version]
  39. Li, J.; Fu, Z.; Wei, B.; Su, C.; Yue, X.; Lü, Z. Tailoring Tantalum Doping into a Perovskite Ferrite to Obtain a Highly Active and Stable Anode for Solid Oxide Fuel Cells. J. Mater. Chem. A 2020, 8, 18778–18791. [Google Scholar] [CrossRef]
  40. Li, M.; Zhao, M.; Li, F.; Zhou, W.; Peterson, V.K.; Xu, X.; Shao, Z.; Gentle, I.; Zhu, Z. A Niobium and Tantalum Co-Doped Perovskite Cathode for Solid Oxide Fuel Cells Operating below 500 °C. Nat. Commun. 2017, 8, 13990. [Google Scholar] [CrossRef]
  41. Guevarra, J.; van Smaalen, S.; Daniels, P.; Rotiroti, N.; Lichtenberg, F. Perovskite-Related Ca(Nb,Ti)O 3.33. Z. Krist. Cryst. Mater. 2005, 220, 19–24. [Google Scholar] [CrossRef]
  42. Tamada, O.; Buming, S.; Morimoto, N. The Crystal Structure of Laihunite (0.40Fe0.802+Fe0.803+SiO4)—Nonstoichiometric Olivine-Type Mineral—. Mineral. J. 1983, 11, 382–391. [Google Scholar] [CrossRef]
  43. mp-19417: TiFeO3 (Trigonal, R-3, 148), Materials Project. Available online: https://next-gen.materialsproject.org/materials/mp-19417 (accessed on 25 March 2026).
  44. Gupta, S. Introduction to Ferroelectrics and Related Materials. In Ferroelectric Materials for Energy Harvesting and Storage; Elsevier: Amsterdam, The Netherlands, 2021; pp. 1–41. [Google Scholar]
  45. Li, Y.; Yan, B. Nucleation and Growth Model of Ulvöspinel in Ti-Bearing Blast Furnace Slag with Fe2O3 Powder Additive. 2023; in press.
  46. Itaya, H.; Watanabe, T.; Hayashi, M.; Nagata, K. Phase Diagram of FeO-TiO2-SiO2-5%Al2O3 Slag (Phase Diagram of Smelting Slag of Titanium Oxide Bearing Iron Sand). ISIJ Int. 2014, 54, 1067–1073. [Google Scholar] [CrossRef][Green Version]
  47. Davenport, W.G.; Biswas, A.K. Extractive Metallurgy of Copper, 4th ed.; Pergamon: Oxford, UK, 2002. [Google Scholar]
  48. Habashi, F. (Ed.) Handbook of Extractive Metallurgy; Wiley-VCH: Weinheim, Germany, 1997; 2624 p, ISBN 978-3527287925. [Google Scholar]
  49. Bale, C.W.; Bélisle, E.; Chartrand, P.; Decterov, S.A.; Eriksson, G.; Gheribi, A.E.; Hack, K.; Jung, I.-H.; Kang, Y.-B.; Melançon, J.; et al. FactSage Thermochemical Software and Databases, 2010–2016. Calphad 2016, 54, 35–53. [Google Scholar] [CrossRef]
  50. Smith, D.K.; Jenkins, R. The Powder Diffraction File: Past, Present, and Future. J. Res. Natl. Inst. Stand. Technol. 1996, 101, 259. [Google Scholar] [CrossRef]
  51. Vaitkus, A.; Merkys, A.; Gražulis, S. Validation of the Crystallography Open Database Using the Crystallographic Information Framework. J. Appl. Crystallogr. 2021, 54, 661–672. [Google Scholar] [CrossRef] [PubMed]
  52. Jain, A.; Ong, S.P.; Hautier, G.; Chen, W.; Richards, W.D.; Dacek, S.; Cholia, S.; Gunter, D.; Skinner, D.; Ceder, G.; et al. Commentary: The Materials Project: A Materials Genome Approach to Accelerating Materials Innovation. APL Mater. 2013, 1, 011002. [Google Scholar] [CrossRef]
  53. Jercinovic, M.J.; Williams, M.L.; Allaz, J.; Donovan, J.J. Trace Analysis in EPMA. IOP Conf. Ser. Mater. Sci. Eng. 2012, 32, 012012. [Google Scholar] [CrossRef]
  54. Merlet, C. Quantitative Electron Probe Microanalysis: New Accurate Φ (Ρz) Description. In Electron Microbeam Analysis; Boekestein, A., Pavićević, M.K., Eds.; Springer: Vienna, Austria, 1992; Volume 12, pp. 107–115. [Google Scholar]
  55. Heo, J.H.; Park, S.-S.; Park, J.H. Effect of Slag Composition on the Distribution Behavior of Pb between FetO-SiO2 (-CaO, Al2O3) Slag and Molten Copper. Metall. Mater. Trans. B 2012, 43, 1098–1105. [Google Scholar] [CrossRef]
  56. Ma, Y.; Du, X. Effects of CaO Addition on the Iron Recycling from Nickel Slags by Oxidation-Magnetic Separation. Metals 2018, 8, 956. [Google Scholar] [CrossRef]
  57. Xie, S.; Zhao, B. Phase Equilibrium Studies of Nonferrous Smelting Slags: A Review. Metals 2024, 14, 278. [Google Scholar] [CrossRef]
  58. Schirmer, T.; Qiu, H.; Goldmann, D.; Stallmeister, C.; Friedrich, B. Influence of P and Ti on Phase Formation at Solidification of Synthetic Slag Containing Li, Zr, La, and Ta. Minerals 2022, 12, 310. [Google Scholar] [CrossRef]
Figure 1. Cooling process and phase calculations for additions of 25 wt.% CaO and 7.5 wt.% TiO2 (left) and 5 wt.% CaO and 10 wt.% TiO2 (right) at a fixed oxygen partial pressure of 10−10 bar.
Minerals 16 00370 g001
Figure 2. Projection of CaO-SiO2-FeO-0.1∙Al2O3-0.1∙TiO2-0.067∙MgO quasi-ternary phase diagram at 1 atm. Samples I, II, III and IV represent the composition of the studied SFS in the diagram.
Minerals 16 00370 g002
Figure 3. Electron micrographs from selected samples of the SFS series (BSE(Z)). The comparison shows that with increasing Ca content, the idiomorphism of the ulvospinel crystals increases. Further explanations are given in the text.
Minerals 16 00370 g003
Figure 4. Electron micrographs from selected samples of the CAS series. The samples contain idiomorphic-to-hypidiomorphic skeletal perovskite crystals in a fine-grained-to-amorphous matrix. Further explanations are given in the text.
Minerals 16 00370 g004
Figure 5. Electron micrographs of selected parts of the industrial slag with complex structures containing heavy elements showing that part of the components did not dissolve very well. Further explanations are given in the text. Image (4) is an enlargement of one grain visible in image (3).
Minerals 16 00370 g005
Figure 6. Section of the diffractograms of the three groups within the SFS sample series showing peaks of the ulvospinel–magnetite solid solution. The signals were smoothed for better comparability.
Minerals 16 00370 g006
Figure 7. Sections from diffractograms of samples with different CaO concentrations showing the development of the olivine-like phases. For clarification, the additional sample with medium CaO (15:10) was added.
Minerals 16 00370 g007
Figure 8. Section of the diffractograms of the three groups within the SFS sample series. Counts adjusted to the range 3000–20,000. The ulvospinel forms a solid solution with magnetite. Further explanation given in the text.
Minerals 16 00370 g008
Figure 9. Sections from the diffractograms of the four CAS samples (above) and crystal size, calculated using the Scherrer equation (below, average of 6 free perovskite peaks each). The peak heights of perovskite decrease with increasing Fe content. A higher background in the region of akermanite peaks indicates an amorphous phase with comparable structure/chemistry.
Minerals 16 00370 g009
Figure 10. Section from the diffractogram of the industrial slag. The composition is a relatively simple mixture of Ca-alumosilicate and pyroxene.
Minerals 16 00370 g010
Figure 11. Overview of the point measurements of spinel crystals (n = 350). Most of the results plot along the connection of ulvospinel (Uv) and magnetite (Mt) (left diagram). In particular, the spinels of the sample 25:7.5 show a higher portion of hercynite (Hc) (right diagram). Some of the measurement results point in the direction of ilmenite (Il) and pseudobrookite (PB). Further explanation given in the text.
Minerals 16 00370 g011
Figure 12. Correlation between Ta (wt.%) and Ti (wt.%) in 350 spinel (ss) measurements.
Minerals 16 00370 g012
Figure 13. BSE(Z) electron micrographs with spinel crystals from the 8 different samples. Only in the calcium-rich samples can a segregation into more magnetitic and ulvospinel-like spinels be observed.
Minerals 16 00370 g013
Figure 14. Composition fields of the matrix. There are two fields of olivine-like silicates: fayalitic-kirschsteinitic solid solution (Fe-rich mixtures) and kirschsteinitic-monticellitic solid solution (Ca-rich mixtures). In between there is a field with a matrix or pyroxenes of alkaline-free augite-like composition. Further explanation given in the text.
Minerals 16 00370 g014
Figure 15. Correlation of averages of the different phases analyzed in the SFS series. For hypothetical laihunitic chemistry and stoichiometry, refer to Table 2.
Minerals 16 00370 g015
Figure 16. Phase composition of the perovskitic oxides in the four CAS samples in the oxide system Ca2+-Ti4+-Fe2+-Ta5+, omitting Al. The averages (orange) point to a hypothetical ternary phase, CaTa0.4FeO3, and the single values (black, blue, green, and magenta) point additionally to a hypothetical phase, CaTa0.8O3.
Minerals 16 00370 g016
Figure 17. (Left): Correlation between Ti (wt.%, above) and Ta (wt.%, below) and the sum Al + Fe (wt.%) of all perovskite averages in the four CAS samples. (Right): Stoichiometric factors of all perovskite averages. Explanation given in the text.
Minerals 16 00370 g017
Figure 18. Classification of the various particle groups from industrial slag. Explanation given in the text.
Minerals 16 00370 g018
Figure 19. Phase composition estimate of the four titaniferous synthetic silicate melt samples and Ta balance. With increasing Fe content, the amount of calculated perovskite decreases and therefore also the amount of Ta bound into this target phase, except for sample P5, which seem to have the optimum composition.
Minerals 16 00370 g019
Figure 20. Linescan over a perovskite grain of the iron-rich sample P10 (magenta arrow in the BSE image upper right side). The Ta enrichment increases form rim to center. In the neighborhood of the grain, Ta in the matrix is depleted.
Minerals 16 00370 g020
Figure 21. (1): Rietveld refinement of the sample 15:10. (2): Crystallographic axis-length comparison of typical Mg, Ca and Fe olivines with laihunite and a Rietveld refined compound “X-phase” from sample 15:10 (SFS series) as an example. Rietveld refinement of olivinic structure was carried out with a kirschsteinite pattern (COD 9005315), which lattice parameters are best suited to refine the “X-phase”. Explanation given in the text.
Minerals 16 00370 g021
Table 1. Composition of the industrial slag.
CompoundWt.%
CaO33.44
SiO225.46
Al2O312.24
TiO28.24
FeO7.73
Ta2O53.17
Nb2O52.73
MgO2.09
ZrO21.66
SnO20.74
MnO0.63
Other0.86
Table 2. Examples for stoichiometric calculation of hypothetical laihunitic olivine-type compounds with the formula (Mg,Ca,FeII)x(Al,FeII,Ti,Ta)y(Al,Si)zO4 in the samples with a low Ca content and the additional sample CaO:TiO2 = 15:10 with a medium Ca content, *: calculated values.
Origin from Sample
5:7.55:7.55:7.55:1015:1015:10
Average from N =7916171811
ValenceMeasurement results (wt.%), * calculated
Fe244.232.130.829.130.925.3
Ca23.37.87.37.29.012.8
Mg21.40.91.01.01.30.9
Al31.84.03.43.34.23.6
Si414.013.316.517.112.115.4
Ti42.24.52.83.26.23.6
Ta50.20.40.40.40.60.5
O (calc) *−234.036.236.236.635.136.2
Sum 101.199.198.397.999.498.2
Stoichiometric factors: (Mg, Ca,FeII)x(Al, Ti, Fe2+, Ta)y(Al,Si)zO4
Mg 0.110.070.080.070.090.07
Ca 0.160.340.320.310.410.56
Fe 0.730.590.610.610.500.37
= xSum x1.001.001.001.001.001.00
Fe2 0.760.430.370.300.510.43
Al 0.070.100.220.210.070.20
Ti 0.090.160.100.120.240.13
Ta 0.0020.0040.0030.0030.0060.005
= ySum y0.910.700.700.630.820.77
Al 0.060.16 0.210.03
Si 0.940.841.041.070.790.97
= zSum z1.001.001.041.071.001.00
Table 3. Examples for stoichiometric calculation of akermannitic phases within the four CAS samples, *: calculated values.
Origin from Sample
P0P2.5P5P10
Average from N = 17223020
ValenceMeasurement results (wt.%), * calculated
Fe20.011.943.646.93
Ca225.2824.9723.4723.17
Mg24.003.943.703.37
Al37.227.708.726.37
Si418.0316.6615.6713.99
Ti42.202.512.334.48
Ta50.270.260.150.57
O (calc) *−241.2240.6840.0538.18
Sum 98.2498.6597.7397.07
Stoichiometric factors: (Ca,Mg)2(Mg, Al, Ti,Fe2+,Ta)1-x(Al, Si)2O7
Mg 0.290.290.370.31
Ca 1.711.711.641.70
= xSum x2.002.002.002.00
Mg 0.160.160.060.10
Al 0.470.420.460.15
Ti 0.120.140.140.27
Ta 0.0040.0040.0020.009
= xSum y0.760.730.660.54
Al 0.260.370.440.54
Si 1.741.631.561.46
= xSum z2.002.002.002.00
Disclaimer/Publisher’s Note: The statements, opinions and data contained in all publications are solely those of the individual author(s) and contributor(s) and not of MDPI and/or the editor(s). MDPI and/or the editor(s) disclaim responsibility for any injury to people or property resulting from any ideas, methods, instructions or products referred to in the content.